appendix - wm.com · waste management // sustainability report 2010 appendix 3 indicators inclusion...
TRANSCRIPT

WASTE MANAGEMENT // SUSTAINABILITY REPORT 2010 APPENDIX 1
Waste Management Sustainability Report 2010
APPENDIXThis appendix provides supplemental information to Waste Management, Inc.’s 2010 Sustainability Report, which is available at www.wm.com/sustainability/index.jsp.
TABLE OF CONTENTS
GRI Index ..................................................................................2
Additional Information on Providing Environmental Services ......................................................7
Recycling Innovations for Electronic Waste .......................7
Wheelabrator’s Other Power Plants ....................................7
The Altamont Landfill: From Landfill Gas to Liquefied Natural Gas ..............................................................7
Additional Information on Managing a Sustainable Enterprise ........................................................8
Strategy and Management Processes ................................8
Sustainability Oversight ..........................................................9
Governance at Waste Management ....................................9
Board of Directors Diversity ..................................................9
Risk Management ....................................................................9
How Our Code of Conduct Guides The Way We Do Business ....................................................10
Stakeholder Engagement .....................................................10
Environmental Management Processes ..........................17
Our LEED-Certified Facilities .............................................21
Our Sustainability Efforts in Procurement and Operations .............................................22
Awards and Recognitions .....................................................23
Additional Information on Ensuring Environmental Performance ..........................................25
Internal Environmental Metrics: Number and Volume of Significant Spills ..........................25
Reducing and Recycling Water at Waste Management .............................................................25
Our Wildlife Habitat Sites ....................................................26
Technologies for Operating a Clean and Efficient Fleet ......................................................26
Emissions .................................................................................27
Methodology Used to Calculate Waste Management’s Carbon Footprint ..........................28
Our Participation in Climate Change Public Policy .......29
Additional Information on Creating a Good Place to Work ...........................................................29
Our Values ................................................................................29
Additional Diversity Data ....................................................30
Workplace Safety Initiatives ...............................................30
Other Workplace-Related Issues ......................................31
Additional Information on Partnering With Communities .............................................................32
Charitable Contributions .....................................................32
Our Partnerships and Associations ...................................33
Partnerships with Communities .........................................34
Analyzing Our Facilities ........................................................35
Additional Information on Capturing the Value in Waste .....................................................................36
Additional Upstream Successes .........................................36
Investing in New Ways to Recycle .....................................36

WASTE MANAGEMENT // SUSTAINABILITY REPORT 2010 APPENDIX 2
GRI INDEX
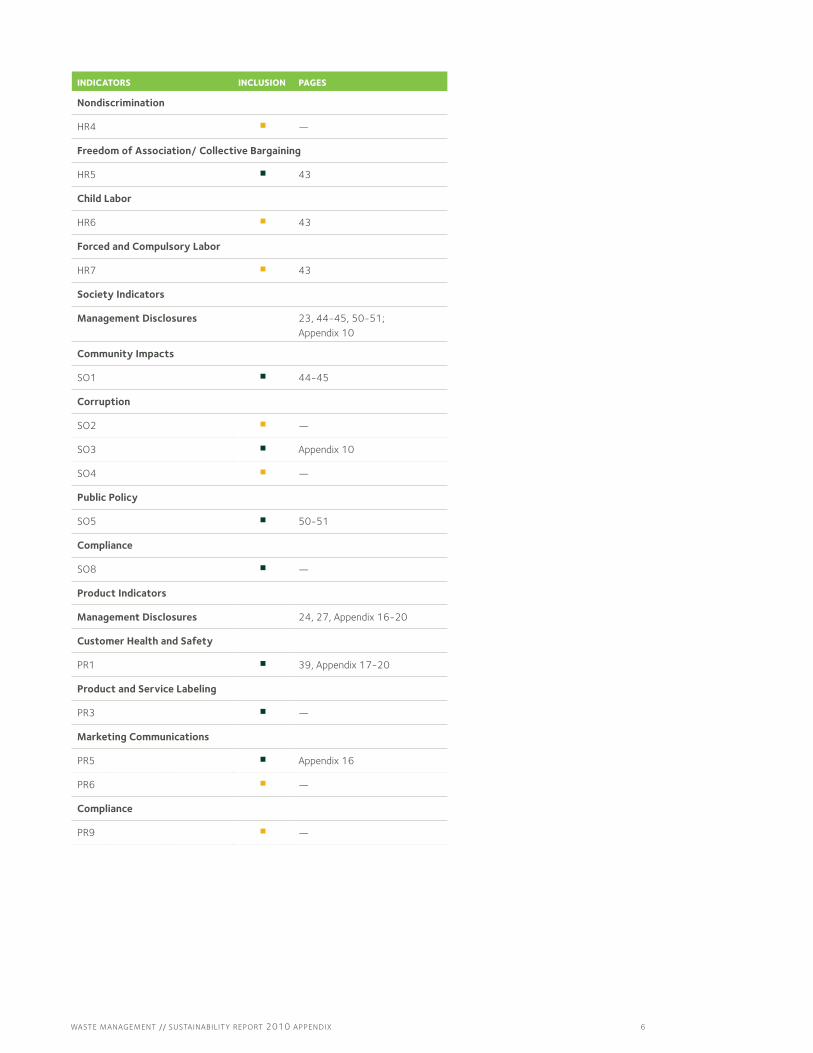
Waste Management used the 2006 G3 Sustainability Reporting Guidelines of the Global Reporting Initiative (GRI) to prepare this report at a self-declared application level B. This index covers all core indicators and those additional GRI indicators (shown in italics) on which we have fully or partially reported. Please visit www.globalreporting.org for the full text of the indicators and other information on the Guidelines.
KEY TO INCLUSION: ■ Reported ■ Partially Reported ■ Not Covered
INDICATORS INCLUSION PAGES
Strategy and Analysis
1.1 Executive statement ■ 2-3
1.2 Key impacts, risks, and opportunities ■ 2-3, 27, 35
Organizational Profile
2.1 Name of organization ■ 4
2.2 Primary brands, products, and/or services ■ 4
2.3 Operational structure ■ 55
2.4 Headquarters ■ 4
2.5 Countries with major operations ■ 6
2.6 Nature of ownership and legal form ■ 4
2.7 Markets served ■ 4, 55
2.8 Scale of reporting organization ■ 4, http://www.wm.com/about/investor-relations/financial-reporting/pdfs/2009AnnualReport.pdf, p.21
2.9 Significant changes during reporting period ■ 6, 55
2.10 Awards received in reporting period ■ 23-26; Appendix 16
Report Parameters
3.1 Reporting period ■ 6
3.2 Date of most recent previous report ■ 6
3.3 Reporting cycle ■ 6
3.4 Contact point ■ 6
Report Scope and Boundary
3.5 Process for defining report content ■ 6
3.6 Report boundary ■ 6
3.7 Limitations on scope/boundary ■ 6

WASTE MANAGEMENT // SUSTAINABILITY REPORT 2010 APPENDIX 3
INDICATORS INCLUSION PAGES
3.8 Basis for reporting on joint ventures, subsidiaries, etc. ■ 6
3.9 Data measurement techniques ■ 6, 52
3.10 Restatements ■ 6
3.11 Significant changes from previous reporting periods ■ 6
GRI Content Index
3.12 GRI Index ■ Appendix 2
Assurance
3.13 External assurance ■ 6
Governance
4.1 Governance structure ■ Appendix 9 http://www.wm.com/about/company-profile/corporate-governance/index.jsp
4.2 Board chairperson/executive officer ■ Appendix 9
4.3 Independent and/or non-executive members ■ Appendix 9
4.4 Shareholder recommendations ■ http://www.wm.com/about/investor-relations/investor-relations-contacts.jsp
4.5 Compensation and performance ■ 22, 42
4.6 Avoiding conflicts of interest ■ Proxy: http://www.wm.com/about/investor-relations/financial-reporting/pdfs/2009AnnualReport.pdf, p.11
4.7 Board of Directors qualifications ■ Proxy: http://www.wm.com/about/investor-relations/financial-reporting/pdfs/2009AnnualReport.pdf, p.11
4.8 Mission statement/code of conduct ■ 23, Appendix 10, http://www.wm.com/about/company-profile/ethics/pdfs/Code_of_Ethical_Conduct.pdf
4.9 Board of Directors performance oversight ■ 22, Appendix 9
4.10 Board of Directors performance evaluation ■ http://www.wm.com/about/company-profile/corporate-governance/pdfs/Board_Mission_and_Responsibilities.pdf, p.5
Commitments to External Initiatives
4.11 Precautionary approach ■ Appendix 9
4.12 External principles/initiatives ■ 35, 48, 51, 57
4.13 Industry memberships ■ Appendix 10
Stakeholder Engagement
4.14 List of stakeholders ■ 6, 23, Appendix 10-16
4.15 Stakeholder identification ■ 23
4.16 Stakeholder engagement ■ 6, 23, Appendix 10-16
4.17 Stakeholder concerns ■ 23, Appendix 16-17

WASTE MANAGEMENT // SUSTAINABILITY REPORT 2010 APPENDIX 4
INDICATORS INCLUSION PAGES
Economic Indicators
Management Disclosures 45, 55, 58
Economic Performance
EC1 ■ 5, 34, 45
EC2 ■ 35
EC3 ■ —
EC4 ■ —
Market Presence
EC6 ■ —
EC7 ■ —
Indirect Economic Impacts
EC8 ■ 47
Environmental Indicators
Management Disclosures 2-3, 5, 22-24, Appendix 22-23
Materials
EN1 ■ —
EN2 ■ Appendix 22
Energy
EN3 ■ 30
EN4 ■ —
EN5 ■ 30-33, Appendix 21-22
EN6 ■ 54-55, 60-61
EN7 ■ 30, Appendix 21-22
Water
EN8 ■ 28-29, Appendix 25
EN10 ■ 28-29, Appendix 25
Biodiversity
EN11 ■ —
EN12 ■ 29-30, Appendix 26
EN13 ■ 29-30, Appendix 26
EN14 ■ 29-30, Appendix 26
Emissions, Effluents and Waste
EN16 ■ 31, 34
EN17 ■ 34
EN18 ■ 34-37
EN19 ■ —

WASTE MANAGEMENT // SUSTAINABILITY REPORT 2010 APPENDIX 5
INDICATORS INCLUSION PAGES
EN20 ■ Appendix 27
EN21 ■ —
EN22 ■ —
EN23 ■ Appendix 25
Products and Services
EN26 ■ 24-25, 27-33
EN27 ■ —
Compliance
EN28 ■ —
Transportation
EN29 ■ 31-33, Appendix 26
Expenditures/Investments
EN30 ■ Appendix 21
Labor Indicators
Management Disclosures 39, 42-43
Employment
LA1 ■ 38
LA2 ■ 43
Labor/Management Relations
LA4 ■ 43
LA5 ■ —
Occupational Health and Safety
LA7 ■ 39-40
LA8 ■ —
Training and Education
LA10 ■ 41
LA12 ■ 43
Diversity and Equal Opportunity
LA13 ■ 38, Appendix 30
LA14 ■ —
Human Rights Indicators
Management Disclosures 23, 43, Appendix 10
Investment and Procurement Practices
HR1 ■ —
HR2 ■ —
HR3 ■ 38
WASTE MANAGEMENT // SUSTAINABILITY REPORT 2010 APPENDIX 6
INDICATORS INCLUSION PAGES
Nondiscrimination
HR4 ■ —
Freedom of Association/ Collective Bargaining
HR5 ■ 43
Child Labor
HR6 ■ 43
Forced and Compulsory Labor
HR7 ■ 43
Society Indicators
Management Disclosures 23, 44-45, 50-51; Appendix 10
Community Impacts
SO1 ■ 44-45
Corruption
SO2 ■ —
SO3 ■ Appendix 10
SO4 ■ —
Public Policy
SO5 ■ 50-51
Compliance
SO8 ■ —
Product Indicators
Management Disclosures 24, 27, Appendix 16-20
Customer Health and Safety
PR1 ■ 39, Appendix 17-20
Product and Service Labeling
PR3 ■ —
Marketing Communications
PR5 ■ Appendix 16
PR6 ■ —
Compliance
PR9 ■ —

WASTE MANAGEMENT // SUSTAINABILITY REPORT 2010 APPENDIX 7
ADDITIONAL INFORMATION ON PROVIDING ENVIRONMENTAL SERVICES
RECYCLING INNOVATIONS FOR ELECTRONIC WASTE (linked from p.14)
Throughout our operations, we have established high standards for managing e-waste. In 2002, we adopted our own standards for international management of e-waste consistent with the goals for safe handling set forth in the Basel Treaty, which established standards for international transport and management of hazardous materials. In 2007, we committed to be a founder of the Basel Action Network’s E-Stewards program for managing electronic waste. And in 2010, we implemented the U.S. EPA’s R2 principles for managing e-waste in both our own and our partners’ processing operations. R2 establishes practices to protect the environment and workers’ health and safety and is accredited by the ANSI-ASQ National Accreditation Board.1
Waste Management’s Minneapolis eCycling facility was the first in the industry to be certified to R2 standards, and we are in the process of certifying all of our electronics recycling facilities to both R2 and E-Stewards standards. Four of our e-waste processing facilities are ISO 14001 and 9001 certified. All electronic waste is tracked each step of the way, from pickup to delivery at our U.S.-based electronic waste disassembly facilities. By upholding high standards for e-waste recycling, we are helping to ensure that valuable materials can be recovered from consumer electronics without creating new environmental problems.
WHEELABRATOR’S OTHER POWER PLANTS (linked from p.16)
In addition to its waste-to-energy plants, Wheelabrator owns and operates five independent power plants with the capacity to produce 227 megawatts of clean energy from waste fuels, including wood, tires and coal mining waste. That is enough electricity to power 280,000 homes. Wheelabrator’s Frackville facility is a cogeneration plant providing environmentally safe disposal of anthracite coal mining waste (known as “culm”) abandoned in Schuylkill Valley, Pennsylvania. Using culm as fuel, the plant generates over 300 million kilowatt-hours of electricity and reclaims on average 16.75 acres of abandoned mine land per year. Since the plant began operating in 1988, it has reclaimed over 355 acres of previously unusable land. Two of Wheelabrator’s independent power plants are classified as renewable energy producers, converting waste wood and tires to renewable energy.
THE ALTAMONT LANDFILL: FROM LANDFILL GAS TO LIQUEFIED NATURAL GAS (linked from p.19)
The Altamont Landfill is the world’s largest landfill-gas-to-liquefied-natural-gas plant. The landfill gas collected results from the natural decomposition of organic waste in the landfill. According to the California Air Resources Board, landfill-gas-derived LNG is one of the lowest-carbon-emitting fuels currently available, reducing CO2-equivalent emissions by at least 84 percent. A heavy-duty truck using this fuel has less than 16 percent of the GHG emissions of a similar diesel truck. The Altamont project is expected to reduce CO2 emissions by nearly 30,000 tons each year. The plant is designed to produce up to 13,000 gallons of LNG a day – enough to fuel 300 of our 485 LNG collection vehicles that serve 20 California communities.
1 See www.epa.gov/osw/conserve/materials/ecycling/r2practices.htm.

WASTE MANAGEMENT // SUSTAINABILITY REPORT 2010 APPENDIX 8
ADDITIONAL INFORMATION ON MANAGING A SUSTAINABLE ENTERPRISE
STRATEGY AND MANAGEMENT PROCESSES (linked from p.22)
OUR PERFORMANCE SCORECARD PROCESS
Our performance scorecard process is used by senior leadership to ensure that our entire organization (field opera-tions and staff functions) is focused on objectives including compliance with all applicable laws and regulations and support for environmental performance and stewardship goals and values.
1. When establishing our strategic objectives, we take into account the perspectives of our customers, share-holders, employees and other stakeholders, as well as our performance against key internal metrics and our reputation as measured with key audiences.
2 and 3. We align our major financial, operational, environmental, community, people, safety and compliance, and customer objectives with those specific company-wide programs and initiatives that have been approved and funded as critical to achieving our strategic objectives. Performance expectations are cascaded down into the organization, and senior leadership assigns quarterly and annual targets for which our field operations are held accountable.
4. Targets are set as part of our annual budgeting process. The targets represent the commitments we have made to our stakeholders and include improvements and metrics for which our employees are held accountable. Illus-trative targets include:
• Financial: Traditional financial measures that our shareholders and debt holders have found to be critical to our success.
• Customer/Community: Customer engagement, improving customer interactions and service, and our community relations programs. We are seeking to improve Waste Management’s reputation by developing and maintaining strong community partnerships and measuring our reputation among key stakeholders.
• Process: Efficiency and cost per unit measures across our collection, disposal, recycling and waste-to-energy operations.
• Compliance: Our primary safety measures and overall environmental scores are our targets.
• Learning and People: Employee engagement, recruiting, development and retention, and training.
5. Our operations at all levels report progress in reaching targets. Reports at the corporate level are prepared on a monthly and quarterly basis and presented to the Board of Directors at each of their meetings. We also prepare reports for each of our six Operating Groups (Eastern, Southern, Midwest, Western, Recycling and Wheela-brator waste-to-energy). During 2009 we began preparing reports at our area operating level as well. (We have approximately 25 areas through which we operate and manage our core solid waste business.) There are Monthly Performance Review and Quarterly Performance Review meetings to continually engage layers of management on progress toward company goals. This format and target-setting process (using specific Key Performance Indi-cators) was integrated into our annual performance planning process during 2009 to ensure consistency among strategy, performance planning, and performance measurement and accountability.
SCORECARD REPORTING Key performance indicators, including Financial, Customer/Community, Process, Compliance, Learning/People development
STRATEGIC OBJECTIVES Financial, Operational, Environmental, People, Safety, Compliance, Customer
SCORECARD TARGETS Quarterly and Annual
STRATEGIC INPUTS Strategic planning, Scorecard results, Stakeholder perpectives, Reputation tracking
INITIATIVES Tied to objectives and targets
15
24
3

WASTE MANAGEMENT // SUSTAINABILITY REPORT 2010 APPENDIX 9
SUSTAINABILITY OVERSIGHT
Because they are linked so closely with company strategy, Waste Management’s services supporting our customers’ and our own sustainability goals are discussed at most Board of Directors meetings. Topics include recycling goals, market conditions and operations; generation of renewable energy and related acquisitions; and innovations in oper-ations to increase efficiency and provide environmentally superior service. Customers’ sustainability goals (e.g., waste reduction, recycling and materials reuse, expansion of renewable energy capacity) are discussed annually during Waste Management’s Senior Leadership Team strategic planning meeting. In 2010, the full Board received its first report on Waste Management’s carbon footprint. Our Board of Directors and governance guidelines are discussed in detail on our website.2
The Audit Committee of our Board is responsible for overseeing the company’s environmental, safety and health compliance. These efforts are supported by our Compliance Audit Services Department, which oversees compliance audits at all company-owned, -operated and -controlled facilities and operations.
GOVERNANCE AT WASTE MANAGEMENT
Eight members serve on the Waste Management Board of Directors, seven of whom are independent as defined by the New York Stock Exchange. Waste Management’s CEO, David Steiner, is the eighth director, and he does not hold the Board chairmanship. Board members are each elected annually. There are three standing committees: the Audit Committee, the Management Development and Compensation Committee, and the Nominating and Governance Committee.
Innovation in service offerings is managed by the Vice President of the Organic Growth Group, who is a member of the senior leadership team and reports directly to the CEO. Waste Management employs a “Phases and Gates” process structured to constantly revisit changes in the technological and competitive landscape. This is critical since our industry is constantly facing regulatory shifts, and it allows us to respond by offering new services and solutions before the changes become effective. For example, in anticipation of customer and regulator interest in new solu-tions for organic material, Waste Management began to develop innovative composting/digestion facilities in several market areas to provide an alternative to landfills and to reduce potential emissions and maximize the potential capture of renewable energy.
BOARD OF DIRECTORS DIVERSITY
The Nominating and Governance Committee seeks board candidates who bring a variety of perspectives and industry knowledge relevant to Waste Management’s business. Candidates are evaluated for personal and profes-sional integrity and sound judgment, potential conflicts of interest and potential for effectiveness in serving the long-term interests of shareholders. Before being nominated, Director candidates are interviewed by the CEO and a minimum of two members of the Nominating and Governance Committee, including the Non-Executive Chairman of the Board. Of the current directors, one is female and Hispanic and one is African-American.
RISK MANAGEMENT
Part of Waste Management’s service to customers is our ability to provide essential services in times of emergency. The Waste Management Corporate Emergency Response plan has been constructed to ensure that disruption to normal business, as a whole, is minimized in times of emergency events such as hurricanes. Moreover, our Green Squad and other tactical units deploy Waste Management’s nationwide assets to assist customers in times of need. In 2009 and continuing into 2010, Waste Management provided essential cleanup services to customers in areas hit by hurricanes and the Gulf of Mexico oil spill – while simultaneously maintaining service in other service areas.
As do many corporations with new product launches, Waste Management employs a Phases and Gates evaluation process by a multi-disciplined, due diligence acquisition committee. This process is structured to fully assess environ-mental and safety implications, human resource needs, information technology (IT) system needs, commercial viability and scale, and enterprise-wide integration. Our process allows us to resolve new product and service issues that are traditionally not visible until after a new product launch. We also take a risk management approach to supply disruptions in the recycling commodity markets, managing our rebate structure to lessen exposure to cyclical markets.
2 See www.wm.com/wm/about/governance.asp.
WASTE MANAGEMENT // SUSTAINABILITY REPORT 2010 APPENDIX 10
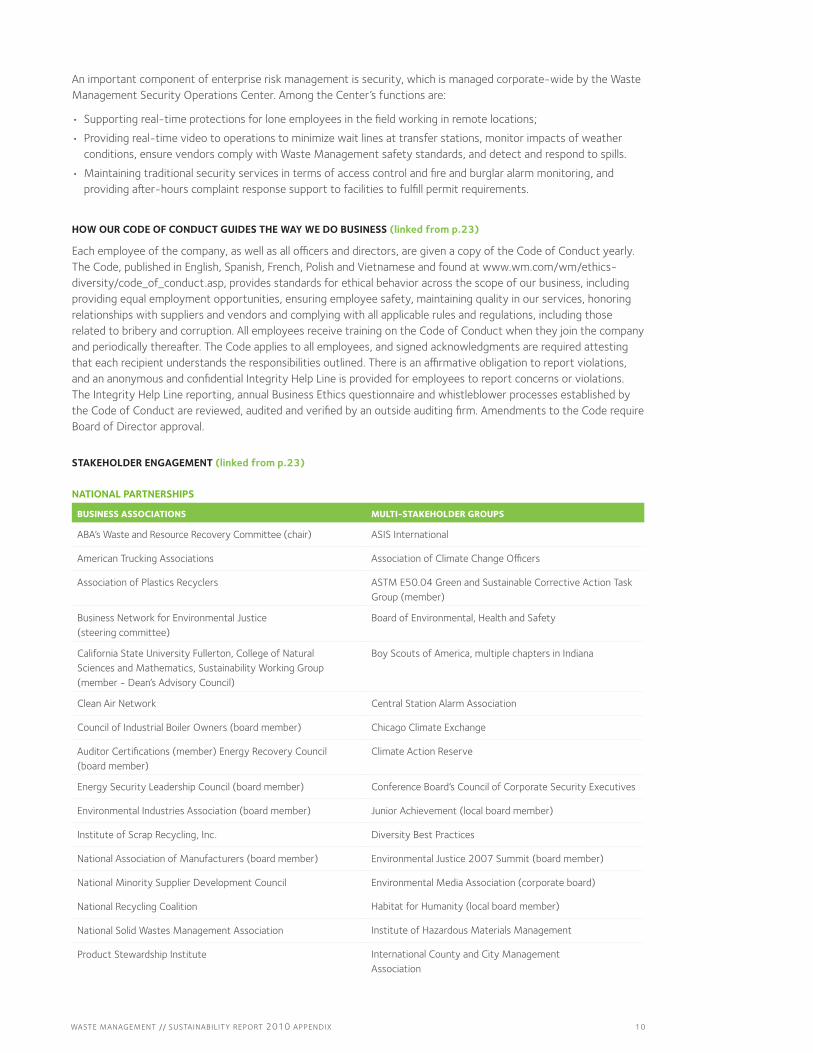
An important component of enterprise risk management is security, which is managed corporate-wide by the Waste Management Security Operations Center. Among the Center’s functions are:
• Supporting real-time protections for lone employees in the field working in remote locations;
• Providing real-time video to operations to minimize wait lines at transfer stations, monitor impacts of weather conditions, ensure vendors comply with Waste Management safety standards, and detect and respond to spills.
• Maintaining traditional security services in terms of access control and fire and burglar alarm monitoring, and providing after-hours complaint response support to facilities to fulfill permit requirements.
HOW OUR CODE OF CONDUCT GUIDES THE WAY WE DO BUSINESS (linked from p.23)
Each employee of the company, as well as all officers and directors, are given a copy of the Code of Conduct yearly. The Code, published in English, Spanish, French, Polish and Vietnamese and found at www.wm.com/wm/ethics-diversity/code_of_conduct.asp, provides standards for ethical behavior across the scope of our business, including providing equal employment opportunities, ensuring employee safety, maintaining quality in our services, honoring relationships with suppliers and vendors and complying with all applicable rules and regulations, including those related to bribery and corruption. All employees receive training on the Code of Conduct when they join the company and periodically thereafter. The Code applies to all employees, and signed acknowledgments are required attesting that each recipient understands the responsibilities outlined. There is an affirmative obligation to report violations, and an anonymous and confidential Integrity Help Line is provided for employees to report concerns or violations. The Integrity Help Line reporting, annual Business Ethics questionnaire and whistleblower processes established by the Code of Conduct are reviewed, audited and verified by an outside auditing firm. Amendments to the Code require Board of Director approval.
STAKEHOLDER ENGAGEMENT (linked from p.23)
NATIONAL PARTNERSHIPS
BUSINESS ASSOCIATIONS MULTI-STAKEHOLDER GROUPS
ABA’s Waste and Resource Recovery Committee (chair) ASIS International
American Trucking Associations Association of Climate Change Officers
Association of Plastics Recyclers ASTM E50.04 Green and Sustainable Corrective Action Task Group (member)
Business Network for Environmental Justice (steering committee)
Board of Environmental, Health and Safety
California State University Fullerton, College of Natural Sciences and Mathematics, Sustainability Working Group (member - Dean’s Advisory Council)
Boy Scouts of America, multiple chapters in Indiana
Clean Air Network Central Station Alarm Association
Council of Industrial Boiler Owners (board member) Chicago Climate Exchange
Auditor Certifications (member) Energy Recovery Council (board member)
Climate Action Reserve
Energy Security Leadership Council (board member) Conference Board’s Council of Corporate Security Executives
Environmental Industries Association (board member) Junior Achievement (local board member)
Institute of Scrap Recycling, Inc. Diversity Best Practices
National Association of Manufacturers (board member) Environmental Justice 2007 Summit (board member)
National Minority Supplier Development Council Environmental Media Association (corporate board)
National Recycling Coalition Habitat for Humanity (local board member)
National Solid Wastes Management Association Institute of Hazardous Materials Management
Product Stewardship Institute International County and City Management Association
LOCAL PARTNERSHIPS
BUSINESS ASSOCIATIONS MULTI-STAKEHOLDER GROUPS
Battle Creek Chamber of Commerce (board member) Air and Waste Management Association - Alamo Chapter
Canton Road Business Association (board member) American Cancer Society’s Metro Golf Classic (board member)
Detroit Regional Chamber of Commerce American Leadership Forum
Eastpointe/Roseville Chamber of Commerce American Public Works Association, Monroe County
Ferris Main Streets Board ARISE Detroit - Neighborhood's Day - supporter
Greater DFW Recycling Alliance (Secretary) Bayou Preservation Association (board member)
Junior League of St. Paul Belleville Area Council for the Arts
Kalamazoo County - Council of Government (COG) (member) Big Brothers/Big Sisters (board member)
Local Chambers of Commerce (NH, IL, & IN) (board members) Big Brothers/Big Sisters of Broward County
Montgomery County Ohio KAB Chapter Boys & Girls Clubs (MN)
North Texas Corporate Recycling Alliance Bremen, IN Food Pantry
Orion Area Chamber of Commerce Bucks County Park and Recreation Board (chairman)
Richmond Chamber of Commerce Buffalo Bayou Partnership (board member)
Rio Rancho Chamber Cannon River Watershed Partnership
Rochester Area Builders Association Chippewa Conservation District
Simi Valley Chamber of Commerce (Board of Director) City and County of Honolulu Solid Waste Advisory Committee
Simi Valley Kiwanis City of Baltimore Cleaner Greener Fund
Sterling Heights Regional Chamber of Commerce & Industry City of Elgin, Illinois Sustainablity Task Force
Southern California Sustainability Support Group City of Peoria, IL Mayor's Litter Committee
Texas Society for Ecological Restoration (secretary) City of Peoria, IL Sustainablity Commission
The Greater Houston Partnership; The Houston Bar Association City of Simi Valley Sustainability Committee
Clare County Solid Waste & Recycling Committee (2 board members)
CLEAN (Committing to Litter Enforcement and Adopting Neighborhoods) (Peekskill, NY)
Clinton River Watershed Council - supporter
Cobb County Neighborhood Safety Commission (board member)
County of Manitowoc Clean Sweep Program
Crime Stoppers (board members)
DaCamara (board member)
De Kalb County, IL Economic Development Corporation
Detroit Keep It Moving - KAB Organization
Detroit Motor City Makeover - supporter
Drexel University's Office of Research Biosafety Committee (board member)
EASE (Emergency Assistance Service Effort) Foundation (Davie, FL) (board member)
End Hunger Network
Fairmont Medical Center
Ferris Main Streets Board
Friends of the Rouge - current supporter (former board member)
Greater Houston Partnership (board member)
Green Houston (board member)
Heart of the City Marathon
Hermann Park Conservancy (board member)
Houston Wilderness (board member)
Junior League of Houston
Keep Saginaw Beautiful
Lake Orion Education Foundation - supporter
Lake St. Clair Channel Keepers - supporter
Leadership Broward (Broward County, FL)
Leadership Houston (board member)
Leelanau County Solid Waste & Recycling Board (2 board members)
Lifetime - Torchlight Run
Local Government Chapters, Keep America Beautiful (board members and officers)
Macomb Conservation District - supporter
Marquette Area Blues Society
Massachusetts Audubon Society
Merrimack Valley Economic Development Council Inc. (Lawrence, MA)
Minooka, IL High School Athletic Boosters Golf Outing Fundraiser Committee
Nature Conservancy of Houston (board member)
New Ulm Area Sports Fisherman
New York City Center for the Urban Environment
Orion Art Center - supporter
Orion Boys and Girls Club - supporter
Orion Solid Waste Committee - (committee member)
Orion Township "Look for the Good" campaign
Orion Township Recycling Committee
Partners in Education (Broward County, FL)
Relay for Life
Richmond Regional Youth Facility - supporter
Roundy's Found. - Milwaukee Public Library
Saugus Business Education Collaborative (Saugus, MA) (board member)
Simi Valley Boys & Girls Club (Board of Director)
Simi Valley Cultural Arts Association (Board of Director)
Simi Valley Education Foundation (Board of Director)
Simi Valley Family YMCA (board member)
Simi Valley Police Foundation (board member)
Simi Valley Police Officer's Association (Board of Director)
Six Rivers Land Conservancy - supporter
St. James Farm Forest Perserve (volunteer)
SOS Children's Villages - Florida (Broward County, FL) (board member)
South Baltimore Learning Center (board member)
Sun Valley Beautiful
Swim Teal Lake - Diabetes
Taylorville, IL Memorial Hospital (Board of Directors)
The Nat Moore Foundation
The Park People (board member)
Three Rivers Festival Committee (Channahon, IL)
USC "SEER" Project
U.S. Green Building Council - Inland Empire Chapter
UW Arboretum
Village of Lake Orion DDA - sponsor
Washington DC Metropolitan Scholars (board members)
Waterfowl U.S.A. - supporter
Will County, IL Center for Economic Development
WI DNR Lakeshore State Park
Women's Center (board member)
Women in Distress, Inc.
YMCA of Broward County
YMCA of Miami-Dade County
WASTE MANAGEMENT // SUSTAINABILITY REPORT 2010 APPENDIX 11
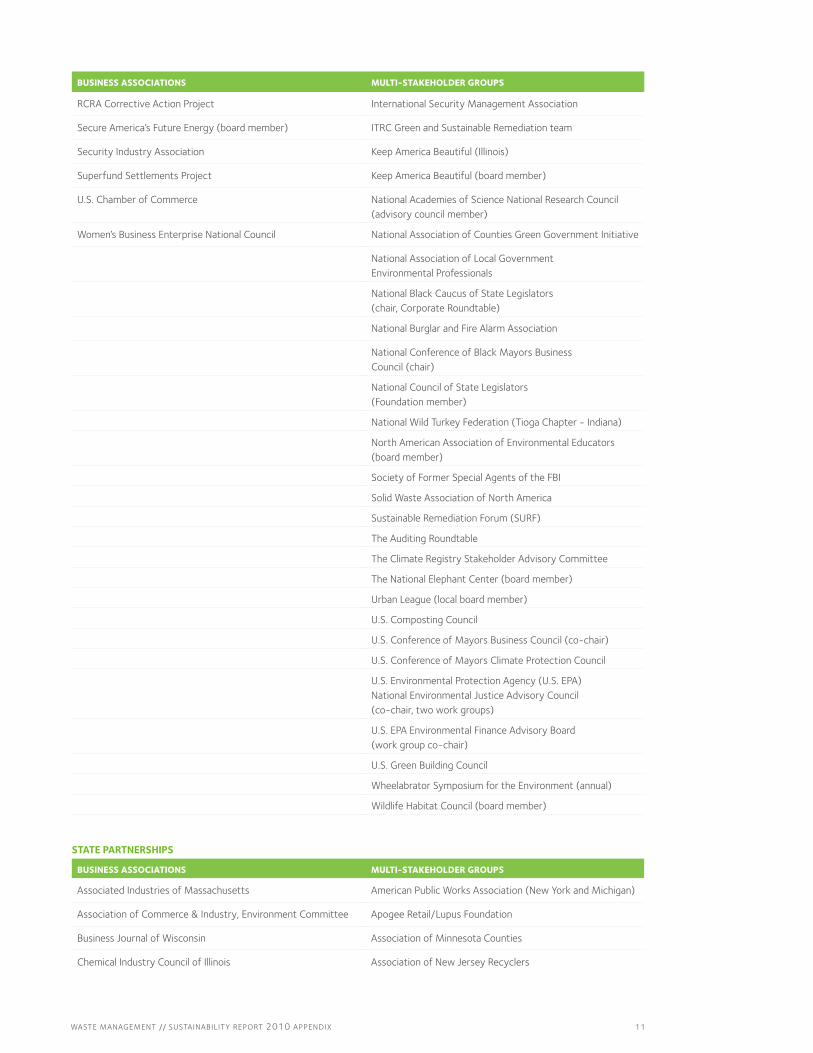
BUSINESS ASSOCIATIONS MULTI-STAKEHOLDER GROUPS
RCRA Corrective Action Project International Security Management Association
Secure America’s Future Energy (board member) ITRC Green and Sustainable Remediation team
Security Industry Association Keep America Beautiful (Illinois)
Superfund Settlements Project Keep America Beautiful (board member)
U.S. Chamber of Commerce National Academies of Science National Research Council (advisory council member)
Women’s Business Enterprise National Council National Association of Counties Green Government Initiative
National Association of Local Government Environmental Professionals
National Black Caucus of State Legislators (chair, Corporate Roundtable)
National Burglar and Fire Alarm Association
National Conference of Black Mayors Business Council (chair)
National Council of State Legislators (Foundation member)
National Wild Turkey Federation (Tioga Chapter - Indiana)
North American Association of Environmental Educators (board member)
Society of Former Special Agents of the FBI
Solid Waste Association of North America
Sustainable Remediation Forum (SURF)
The Auditing Roundtable
The Climate Registry Stakeholder Advisory Committee
The National Elephant Center (board member)
Urban League (local board member)
U.S. Composting Council
U.S. Conference of Mayors Business Council (co-chair)
U.S. Conference of Mayors Climate Protection Council
U.S. Environmental Protection Agency (U.S. EPA) National Environmental Justice Advisory Council (co-chair, two work groups)
U.S. EPA Environmental Finance Advisory Board (work group co-chair)
U.S. Green Building Council
Wheelabrator Symposium for the Environment (annual)
Wildlife Habitat Council (board member)
STATE PARTNERSHIPS
BUSINESS ASSOCIATIONS MULTI-STAKEHOLDER GROUPS
Associated Industries of Massachusetts American Public Works Association (New York and Michigan)
Association of Commerce & Industry, Environment Committee Apogee Retail/Lupus Foundation
Business Journal of Wisconsin Association of Minnesota Counties
Chemical Industry Council of Illinois Association of New Jersey Recyclers

WASTE MANAGEMENT // SUSTAINABILITY REPORT 2010 APPENDIX 12
BUSINESS ASSOCIATIONS MULTI-STAKEHOLDER GROUPS
Illinois Chamber of Commerce Boys & Girls Clubs (Minnesota)
Indiana Manufacturers Association California Cumulative Risk Advisory Committee
Iowa Recycling Association Children's Hospital of Wisconsin Foundation
Michigan Chamber of Commerce Environment Virginia
Michigan Manufacturers Association Epilepsy Foundation
Michigan Municipal League Goodwill
Michigan Township Association Illinois CCX Subcommittee on Methane Avoidance
Michigan Waste Industries Association Indiana Hunter Education
Minnesota Chamber of Commerce International Association of Business Communicators (Yankee/Boston Chapter) (board member)
Minnesota Chamber of Commerce, Recycling Committee Iowa Governor’s Anti-Litter Task Force
Minnesota Chamber of Commerce, Environment and Natural Resources Committee (member, vice chair)
Iowa League of Cities
Minnesota Chamber of Commerce, Waste Subcommittee (committee chair)
Ivey Tech College - Sustainable Energy Advisory Board (Indiana)
Minnesota Clerks and Finance Officers Association Junior Achievement of Southeast Texas (board member)
New Hampshire Business & Industry Association Kansas Governor's Energy and Environment Plan (KEEP)
North Dakota Solid Waste & Recycling Association League of Minnesota Cities
Ohio Chamber of Commerce (board member) Maryland Recycling Network
Ohio Chapter, Solid Waste Association of North America (board member)
Michigan Association of Environmental Professionals (board member)
Ohio Manufacturers’ Association Michigan Department of Natural Resources and Environment, Solid Waste Advisory Committee
Ohio National Solid Wastes Management Assocation (chapter chair)
Minnesota Energy Smart (board member)
Pennsylvania Chamber of Business and Industry, Environmental Executive Committee (board member)
Minnesota Environmental Initiative (board member)
Professional Recyclers of Pennsylvania (board member, president)
Minnesota Governor’s Climate Change Advisory Task Force
Recycling Alliance of Texas (board member and officer) Minnesota Multi Housing Association
Recycling Association of Minnesota Minnesota Pollution Control Agency, Solid Waste Stakeholder Group
Rethink Recycling Minnesota Pollution Control Agency, Product Stewardship and Construction and Demolition Task Forces
Ronald McDonald House Minnesota Waste Wise (board member)
State Chapters, National Solid Wastes Management Association Muscular Dystrophy Association
The Texas State Bar National Audubon Society - Ohio Chapter
Virginia Waste Industries Association (chair) Natural Resources Foundation of Wisconsin
Waste Cap Resource Solutions New Hampshire Businesses for Social Responsibilty
Wisconsin Manufacturers & Commerce New Hampshire Women's Policy Institute (board member)
New Mexico Environment Department, Working Groups on Environmental Justice and Recycling
New Mexico Governors Task Force on Greenhouse Gases
New Mexico Recycling Coalition (board member)
North Dakota League of Cities

WASTE MANAGEMENT // SUSTAINABILITY REPORT 2010 APPENDIX 13
BUSINESS ASSOCIATIONS MULTI-STAKEHOLDER GROUPS
Ohio Solid Waste Advisory Council (Governor Appointment)
Pennsylvania Department of Environmental Protection Water Resource Advisory Committee's "Total Dissolved Solids" Stakeholder Group (board members)
Pennsylvania Environmental Justice Advisory Committee (board member)
Pheasants Forever
Recycle Florida Today (board member)
Regional Greenhouse Gas Initiative
Salvation Army
Solid Waste Districts Citizen Advisory Boards (multiple - Indiana)
Southern Governors' Association (corporate affiliate)
State Chapters, Keep America Beautiful (board members and officers)
State Chapters, Solid Waste Association of North America (board members and officers)
State of Texas Alliance for Recycling
Susan Komen 3 Day
Texas Society for Ecological Restoration
The California Climate Action Registry
The Climate Registry
Virginia Attorney General's Government & Regulatory Reform Task Force
University of Wisconsin Arboretum
Western Climate Initiative
LOCAL PARTNERSHIPS
BUSINESS ASSOCIATIONS MULTI-STAKEHOLDER GROUPS
Battle Creek Chamber of Commerce (board member) Air and Waste Management Association - Alamo Chapter
Canton Road Business Association (board member) American Cancer Society’s Metro Golf Classic (board member)
Detroit Regional Chamber of Commerce American Leadership Forum
Eastpointe/Roseville Chamber of Commerce American Public Works Association, Monroe County
Ferris Main Streets Board ARISE Detroit - Neighborhoods Day
Greater DFW Recycling Alliance (secretary) Bayou Preservation Association (board member)
Junior League of St. Paul Belleville Area Council for the Arts
Kalamazoo County Council of Government Big Brothers/Big Sisters (board member)
Local Chambers of Commerce (New Hampshire, Illinois and Indiana) (board members)
Big Brothers/Big Sisters of Broward County
North Texas Corporate Recycling Alliance Boys & Girls Clubs (Minnesota)
Orion Area Chamber of Commerce Bremen, Indiana, Food Pantry
Richmond Chamber of Commerce Bucks County Park and Recreation Board (chair)

WASTE MANAGEMENT // SUSTAINABILITY REPORT 2010 APPENDIX 14
BUSINESS ASSOCIATIONS MULTI-STAKEHOLDER GROUPS
Rio Rancho Chamber of Commerce Buffalo Bayou Partnership (board member)
Rochester Area Builders Association Cannon River Watershed Partnership
Simi Valley Chamber of Commerce (board member) Chippewa Conservation District
Simi Valley Kiwanis City and County of Honolulu Solid Waste Advisory Committee
Sterling Heights Regional Chamber of Commerce & Industry City of Baltimore Cleaner Greener Fund
Southern California Sustainability Support Group City of Elgin, Illinois, Sustainablity Task Force
Texas Society for Ecological Restoration (secretary) City of Peoria, Illinois, Mayor's Litter Committee
The Greater Houston Partnership The Houston Bar Association
City of Peoria, Illinois, Sustainablity Commission
City of Simi Valley Sustainability Committee
Clare County Solid Waste & Recycling Committee (2 board members)
CLEAN (Committing to Litter Enforcement and Adopting Neighborhoods) (Peekskill, New York)
Clinton River Watershed Council
Cobb County Neighborhood Safety Commission (board member)
County of Manitowoc Clean Sweep Program
Crime Stoppers (board members)
DaCamara (board member)
De Kalb County, Illinois, Economic Development Corporation
Detroit Keep It Moving - Keep America Beautiful Organization
Detroit Motor City Makeover
Drexel University's Office of Research Biosafety Committee (board member)
EASE (Emergency Assistance Service Effort) Foundation (Davie, Florida) (board member)
End Hunger Network
Fairmont Medical Center
Friends of the Rouge (current supporter, former board member)
Greater Houston Partnership (board member)
Green Houston (board member)
Heart of the City Marathon
Hermann Park Conservancy (board member)
Houston Wilderness (board member)
Junior League of Houston
Keep Saginaw Beautiful
Lake Orion Education Foundation
Lake St. Clair Channel Keepers
Leadership Broward (Broward County, Florida)
Leadership Houston (board member)
Leelanau County Solid Waste & Recycling Board (2 board members)

WASTE MANAGEMENT // SUSTAINABILITY REPORT 2010 APPENDIX 15
BUSINESS ASSOCIATIONS MULTI-STAKEHOLDER GROUPS
Lifetime - Torchlight Run
Local Government Chapters, Keep America Beautiful (board members and officers)
Macomb Conservation District - supporter
Marquette Area Blues Society
Massachusetts Audubon Society
Merrimack Valley Economic Development Council Inc. (Lawrence, Massachusetts)
Minooka, Illinois, High School Athletic Boosters Golf Outing Fundraiser Committee
Montgomery County, Ohio, Keep America Beautiful Chapter
Nature Conservancy of Houston (board member)
New Ulm Area Sports Fisherman
New York City Center for the Urban Environment
Orion Art Center
Orion Boys and Girls Club
Orion Solid Waste Committee (committee member)
Orion Township "Look for the Good" campaign
Orion Township Recycling Committee
Partners in Education (Broward County, Florida)
Relay for Life
Richmond Regional Youth Facility
Roundy's Foundation/Milwaukee Public Library
Saugus Business Education Collaborative (Saugus, Massachusetts) (board member)
Simi Valley Boys & Girls Club (board member)
Simi Valley Cultural Arts Association (board member)
Simi Valley Education Foundation (board member)
Simi Valley Family YMCA (board member)
Simi Valley Police Foundation (board member)
Simi Valley Police Officers Association (board member)
Six Rivers Land Conservancy
St. James Farm Forest Preserve (volunteer)
SOS Children's Villages - Florida (Broward County, Florida) (board member)
South Baltimore Learning Center (board member)
Sun Valley Beautiful
Swim Teal Lake - Diabetes
Taylorville, Illinois, Memorial Hospital (Board of Directors)
The Nat Moore Foundation
The Park People (board member)
Three Rivers Festival Committee (Channahon, Illinois)
University of Southern California "SEER" Project
U.S. Green Building Council - Inland Empire Chapter

WASTE MANAGEMENT // SUSTAINABILITY REPORT 2010 APPENDIX 16
BUSINESS ASSOCIATIONS MULTI-STAKEHOLDER GROUPS
Village of Lake Orion Downtown Development Authority
Washington DC Metropolitan Scholars (board members)
Waterfowl U.S.A. - supporter
Will County, Illinois, Center for Economic Development
Wisconsin Department of Natural Resources Lakeshore State Park
Women's Center (board member)
Women in Distress, Inc.
YMCA of Broward County
YMCA of Miami-Dade County
Engagement with Customers
Customer feedback is welcomed 24/7 through wm.com and actively solicited through ongoing surveys conducted by J.D. Power and Associates. In 2009, Waste Management conducted an additional diagnostic study with J.D. Power to identify how to enhance customer engagement. As a result, each month customers now receive surveys that feed information directly to market area leaders within Waste Management. Action steps are then created directly from customer feedback to enhance customers’ experience. For example, if a customer reports a late pickup, we deter-mine whether changes need to be made to match service needs. Responses to our customer surveys have grown nearly fivefold since 2006.
In our 2008 sustainability report, we stated that we planned to establish a sustainability council of advisors and to seek input on our reporting. As the economic downturn took hold in 2008, our focus shifted from what would be a relatively expensive formal council to other ways to engage with stakeholders about our progress. We talked with individual stakeholders and solicited ideas about how to improve our sustainability reporting. We contacted key federal, state and local government stakeholders and members of national environmental organizations. We also sought out the sustainable investor community to identify ways we could better communicate the benefits of our services in a sustainable economy. This feedback gave us guidance on topics included in this 2010 report and provided the incentive to adopt GRI reporting. We plan to continue the dialogue with stakeholders based on the 2010 report, and will continue to evaluate the concept of a more formal advisory board in the future.
J.D. Power and Associates We are committed to continuous improvement in customer service. We are transforming our call centers and creating dedicated customer queues to fulfill our “one call does it all” objective. We have begun holding “customer summits” to solicit feedback, and continue benchmarking exercises with key customers.
To measure the effectiveness of our customer service and identify opportunities for improvement, Waste Manage-ment has engaged J.D. Power and Associates for the last three years to conduct detailed surveys of our customers in all market areas. While we are pleased to report improved scores each year, our goal is to reach and maintain a level of service that creates engaged customers who are loyal and would recommend Waste Management to others. A customer’s recommendation is the best compliment we can receive.
Waste Management Earns Torch AwardWaste Management’s commitment to customers and ethical behavior was recognized by the Better Business Bureau of Upstate New York, which gave Waste Management of New York its 2009 Torch Award for large business for demonstrating “exceedingly high standards of behavior toward customers, employees, suppliers, shareholders and communities; adherence to truthful and honorable advertising and sales practices; and [a] reputation for noteworthy contributions to their industries and the communities in which they do business.”
Waste Management Sensitive Information Protection and Compliance ProgramOur business and service operations rely heavily on business information and information technology systems to support our customers, employees, business partners, suppliers and shareholders. Some of the information we use is sensitive and requires protection from accidental or unauthorized disclosure. Waste Management is committed to protecting this sensitive information and has an established formal information security program.

WASTE MANAGEMENT // SUSTAINABILITY REPORT 2010 APPENDIX 17
Our security program includes information protection policies and procedures; hardware, software and procedural security implementations; and monitoring and periodic vulnerability scanning of our systems and networks. The program also focuses on maintaining our compliance with federal, state and international privacy and data-protection laws, as well as with industry standards such as the Payment Card Industry (PCI) data security standard.
As part of our security commitment, Waste Management annually conducts a formal, independent PCI audit. All Waste Management personnel who access our information systems receive new user and annual refresher training in security awareness. In addition, those personnel who handle customer account payment information must complete annual reviews and acknowledge, in writing, their responsibility for proper handling and protection of payment data.
We also established and operate an American Society of Crime Lab Directors (ASCLD) certified digital forensics labora-tory to assist with data preservation, recovery and analysis of electronic information, and internal investigation support. Our lab facility was only the sixth nongovernmental digital forensics laboratory to attain the ASCLD certification.
Over the years, we have also partnered with a number of public, industry and professional organizations – such as InfraGard, the Information Systems Security Association and the Corporate eDiscovery Forum – to improve protection guidelines and standards for sensitive information and IT infrastructures.
ENVIRONMENTAL MANAGEMENT PROCESSES (linked from p.24)
We have a long track record of supporting high regulatory standards – and then trying to go beyond them. For example:
• Waste Management was a prime mover in urging the U.S. EPA in 1991 to revise regulations implementing the Resource Conservation and Recovery Act Subtitle D and to establish strong and prescriptive federal standards for managing MSW. We supported specific, rigorous, governmentally sanctioned and publicly reviewed standards to ensure environmental protection at all MSW landfills.
• We constantly innovate to go beyond compliance. As part of Waste Management’s formal performance review process, employee salaries are impacted by regulatory compliance, and repeat violations are tracked, reviewed by senior managers and result in disciplinary consequences for those responsible. Our success has been apparent in our continually improving compliance and environmental performance indicators from 2007 to 2009.
• We are developing a tracking system for complaints, such as noise and odors, that are not regulatory violations but are public concerns that we must address. Our management tool ensures that public complaints are taken very seriously. Complaints are tracked and responses are implemented and reviewed by senior management, who evaluate how each division and region are performing.
• We test our internal systems to ensure their thoroughness and accuracy. We conducted a gap analysis of our Corporate Environmental Management System (EMS) against the International Organization for Standardization (ISO) 14001 standards to ensure the sufficiency of our systems for landfills, transfer stations, hauling operations, waste-to-energy plants, hazardous waste treatment and disposal facilities, and recycling facilities. These systems continue to be evaluated and supplemented through our monthly training series for all environmental personnel.
• All of our Upstream divisions (including over 100 customer operator locations), our Canadian Green Squad, our e-waste operations and three individual landfills have received certification to the globally recognized ISO 14001 standard for environmental management.
• The rest of our operations are audited by an independent environmental audit team employing nationally recom-mended compliance audit practices approved by the American Standards for Testing and Materials and the Board of Environmental Health and Safety Certifications standards for professional auditors. Nearly all of Waste Manage-ment revenues come from operations subject to environmental management systems that are audited.
• We continually test to be sure that our facilities are protective. Simply meeting the standards is not enough. We often provide monitoring data to outside experts to evaluate how our systems are performing. Our environmental experts hold a number of patents on innovative monitoring and analysis technologies. We work with all stake-holders to assure ourselves that our operations are sound and protective of human health and the environment. (See p.10 of this appendix for a list of stakeholder groups.)

WASTE MANAGEMENT // SUSTAINABILITY REPORT 2010 APPENDIX 18
Overview of Waste Management’s Environmental Management ApproachThe text below the figure elaborates on the elements within it.
1. Six departments at Waste Management supply the expertise, guidance and capacity needed to ensure that our operations protect the environment.
Environmental Protection Provides environmental policies, procedures and guidance designed to ensure 100 percent compliance; provides standardized operational practices3, compli-ance tools, training, metrics and strategic advice to our groups and market areas
Groundwater Protection Provides expertise and direction on groundwater protection programs; ensures that environmental monitoring networks are installed and operating to specifi-cations
Environmental Engineering Manages the planning, design and operation of our disposal facilities
Air/Landfill Gas Management Sets policies and standards; responsible for the planning and development of air quality and landfill gas management tools
Laboratory Services Program Ensures accuracy and quality control in the analytical testing of environmental monitoring samples
Environmental Information Services
Deploys systems for training, self-assessment, compliance assurance, correc-tive measure tracking and environmental metrics
2. Our environmental management system is tailored to support full environmental compliance at our facilities through prevention, training, self-identification of issues, rapid correction of such issues and tracking of resolu-tion. The goal is to correct conditions that could lead to a violation before the violation happens. Corporate goals and objectives for this system are developed based on a systematic review of ongoing operational performance and an evaluation of conditions that could result in potential environmental exposure if not proactively managed. As part of the company’s culture of continuous improvement, the tools, training and strategies that comprise the EMS are reviewed and updated annually.
1. EXPERTISE, GUIDANCE AND CAPACITY
2. ENVIRONMENTAL MANAGEMENT SYSTEM
6. PERFORMANCE TRACKING/EVALUATION
Departments specializing in environmental protection
Environmental Information
Services
Environmental Protection
Groundwater Protection
Air/Landfill Gas Management
Environmental Engineering
Laboratory Services Program
3. Compliance Management & Assurance
4. Environmental Self-Assessment Program
5. Environmental Training
Environmental Dashboard 7. Independent Compliance Audit
3 Listed at www.wm.com/wm/environmental/protection.asp.

WASTE MANAGEMENT // SUSTAINABILITY REPORT 2010 APPENDIX 19
A number of our operations are certified to the ISO 14001 standard – the globally recognized benchmark for environmental management systems. For example:
• Our Upstream division is one of the very few non-facility-based service organizations with an EMS conforming to the ISO standard.
• Our nationwide e-cycling division is the first national electronics recycler to achieve ISO 14001 certification as well as ISO 9001 certification (for quality), with a total of four locations certified by the end of 2009. The Minneapolis, Minnesota, facility is also certified to the Responsible Recycling standard.
• Three individual Waste Management landfills have received ISO certification.
3. Compliance Management and Assurance systems are implemented by our corporate Environmental Protection department, which monitors compliance, including proactively preventing, tracking and correcting condi-tions before they can become regulatory violations. The goals of the department are 100 percent compliance and enhancement of the environment. Compliance management tools include the Environmental Dashboard (discussed below) as well as the following:
a. A central permit and regulation-focused database, Waste Management’s primary tool for ensuring compliance with our regulations, permits and requirements. Waste Management facilities use this to:
• Track and schedule recurring regulatory requirements, inspections and training, and best management practices, and
• Report and track corrective actions and preventative measures for environmental incidents.
b. An online auditing database that centrally queries our management to identify environmental issues before they become regulatory issues
c. An online data tracker that centrally manages and tracks all self-identified environmental issues
d. An incident alert system that gives immediate notification of significant environmental events directly to the corporate office for tracking and resolution
e.Latent cause analysis, a process for identifying the underlying root causes of noncompliance or other failures to prevent recurrence
f. WMVisor (Waste Management’s intranet) and WM Monday (Waste Management’s weekly newspaper), which provide updates to employees on environmental and operations best practices
g. Groundwater and surface water sampling point databases
h. Toxic Release Inventory data tracking
i. The Landfill Gas Management System database and corrective action assurance program
j. Applied Landfill Information Analysis System tracking data on leachate, groundwater and surface water chemistry
k. The Climate Care database tracking our greenhouse gas emissions
4. Our Environmental Self-Assessment Program equips district and site managers to routinely evaluate their environmental compliance status and manage potential compliance issues. Managers at more than 1,200 collec-tion, transfer, landfill, recycling, waste-based-energy and closed sites complete a module each month on key topics using the online auditing database. Each module consists of a series of questions identifying key issues and tasks to be done to ensure that environmental concerns are identified and resolved before they rise to the level of noncompliance. Each question can result in an identified issue or potential issue, which is loaded into online correc-tive action tracking software with an appropriate schedule for completion. Identified issues are tracked until they are corrected and prevented from recurring. Modules are task-specific, audited and centrally accessible online.
5. Environmental training provides employees with the knowledge and skills they need to conduct operations in an environmentally responsible way. Our training programs, which target a range of operational and functional levels within the company, are summarized below. Additional local training is provided through group in-house

WASTE MANAGEMENT // SUSTAINABILITY REPORT 2010 APPENDIX 20
classroom training, on-the-job training and online training. Not counting the ethics training required for all new employees, 36,200 training sessions were conducted in 2009, which represent over 137,182 participant events when multiple attendees are taken into consideration.
We also believe we have the opportunity to reach out to employees and the public at large to raise awareness of environmental issues. We do this through our websites at www.wm.com; www.thinkgreen.com and www.greenopolis.com.
AUDIENCE TRAINING DESCRIPTION
Employees with environmental leadership responsibility
Online modules, in-person training sessions conducted by our field Environmental Protection professionals during site visits to facility management and technical staff on environmental and compliance subjects
Site management The Environmental Protection Learning Series, a monthly online program featuring a different environmental topic each month
Front-line employees The Environmental Compliance Awareness Program, conducted live and covering a different environmental topic each month, and harmonized with the Environmental Self-Assessment program to ensure that each subject reaches a wide cross-section of the company
6. We regularly track and evaluate our environmental performance. One key tool for this is our Environmental Dashboard, which tracks environmental metrics for all our facilities. The Dashboard goes beyond tracking regulatory compliance to monitor conditions that, if uncorrected, could lead to a regulatory violation. Dashboard results are communicated monthly to site managers and the Senior Leadership Team and are linked to manage-ment compensation. Components of the Dashboard include:
• Compliance assurance task-based tracking software
• Environmental self-assessment issue correction and prevention
• Agency-identified violations
• Compliance audit findings correction
In addition, the Dashboard includes environmental impact response and correction. This impact tracking system is fully automated to include:
• Regulatory impacts such as agency-identified or self-reported violations.
• Community impacts, including noise, dust, odors, mud tracking and anything else that may concern the public, our neighbors and our communities. Impacts are identified and tracked via an automated public comment and response process now being piloted to become applicable to every facility owned by the company.
• Indicators of potential environmental concern related to groundwater, surface water, land and air quality.
7. Waste Management’s Compliance Audit Services department conducts environmental, health and safety compliance audits to help the company’s field staff and managers to ensure compliance with legal and regula-tory requirements and to identify compliance trends. The compliance audits are systematic and objective reviews conducted by professional auditors who are independent from the facilities they audit. The department reports to the Vice President and Assistant General Counsel, and audit practices are modeled on the nationally recommended compliance audit practices approved by the American Standards for Testing and Materials and the Board of Environmental Health and Safety Certifications standards for professional auditors.
With the assistance of a web-based program, auditors monitor a site’s progress following audits until correc-tive actions are completed and the facility provides documentation to verify compliance. Biweekly progress reports are presented to local managers, and the department delivers monthly progress reports to our senior management. Compliance audit statistics are reported quarterly to the Board of Directors. In addition to audit progress reports, our Compliance Audit Services department routinely issues audit alerts to communicate compliance recommendations throughout the company.

WASTE MANAGEMENT // SUSTAINABILITY REPORT 2010 APPENDIX 21
Environmental ExpendituresBecause we are an environmental service infrastructure provider, our “environmental expenditures” are necessarily interrelated with our operations. They properly include compliance, environmental protection, control and research costs and also the capital and operating costs for our waste handling options – from waste reduction and reuse consultation to recycling, waste-to-energy and disposal facility construction and operation. Our environmental expenditures over the past four years are shown below.
TOTAL ENVIRONMENTAL EXPENDITURES
YEAR ENVIRONMENTAL COSTS4 (IN MILLIONS)
TOTAL ANNUAL EXPENSES (IN MILLIONS)
PERCENTAGE OF ENVIRONMENTAL COSTS TO TOTAL EXPENSES
2006 $4,468.3 $11,333.2 39.4%
2007 $4,279.7 $11,056.2 38.7%
2008 $4,192.3 $11,153.5 37.6%
2009 $3,795.4 $9,904.7 38.3%
OUR LEED-CERTIFIED FACILITIES (linked from p.24)
In 2008, our Bluff City Transfer Facility in Illinois received a LEED rating, becoming the first Waste Management operational facility to achieve this recognition. Between 2008 and 2009, three other Waste Management facilities in the Western Region were certified LEED. Nine additional projects are undergoing design and construction and are expected to be LEED certified in 2011 and 2012.
In 2010, our DADS Landfill was recognized as a Gold Leader in the Colorado Environmental Leadership Program, making it the first and only MSW landfill in Colorado with this distinction. A comprehensive Corporate Sustainable Facilities initiative is planned to manage internal real estate assets to better track progress toward the company’s corporate sustainability goals.
Waste Management is an active national corporate member of the USGCB. Most Green Squad staff are LEED Accredited Professionals, Green Globe Professionals and active USGCB local chapter members, often serving in lead-ership positions.
Spokane, WALEED GoldHillsboro, OR
LEED Gold
Rincon, AZLEED Gold
Blu� City, ILLeed Gold
4 Includes costs associated with the environmentally responsible management of waste and the creation of renewable fuel. Excluded are costs associated with sales, general collection operational and administrative costs, merger costs and unusual items.

WASTE MANAGEMENT // SUSTAINABILITY REPORT 2010 APPENDIX 22
LEED FACTS
WM BLUFF CITY, IL WM HILLSBORO, OR WM SPOKANE, WA WM RINCON, AZ
Certification Awarded August 2008 December 2009 August 2009 July 2009
LEED-GOLD 42 points 39 points 44 points 45 points
Sustainable Sites 7/14 7/14 10/14 9/14
Water Efficiency 5/5 2/5 3/5 3/5
Energy and Atmosphere
12/17 12/17 10/17 10/17
Materials and Resources
7/13 6/13 7/13 7/13
Indoor Environmental Quality
7/15 8/15 9/15 11/15
Innovation and Design
4/5 4/5 5/5 5/5
Project Highlights 43% reduction in water consumption
65% more energy efficient than similar buildings
98% of C&D waste diverted from landfill
44% of the building materials were from recycled content
First WHC certification of a transfer station
3-acre wildlife refuge
Green roof
43% energy cost savings
90% of stormwater managed
40% reduction in potable water use
WHC-certified transfer station
100-acre habitat
75% of C&D waste diverted from landfill
27% of total building materials from recycled contents
140% more open space maximized compared to minimum code required
71% of energy used is renewable
82% recycled construction waste
43.5% building mate-rials used from local sources
46.3% indoor air quality improvement
OUR SUSTAINABILITY EFFORTS IN PROCUREMENT AND OPERATIONS (linked from p.25)
We work with our suppliers to close the loop on resource maximization by buying recycled products and supplying them with waste materials that can be recycled into new products. For example:
• We buy paper with a minimum of 30 percent recycled content.
• We recycle our equipment by using steel from scrapped containers to make new containers, repurposing used tires into cutting edges for scrapers and dozers, grinding up plastic garbage cans to make new plastic containers and using discarded oil as heating fuel.
• We are using new products like longer-lived motor oil, plastic containers that can be recycled more easily and new materials to reduce the weight of fleet trucks.
• Our Real Estate department oversees the deployment of recycled materials and energy efficiency in its Capital Projects and Construction Management Program, identifying vendors for controlled lighting and HVAC, occupancy sensors, recycled content carpet and furniture, and low-emitting paints and adhesives.
In pursuit of our sustainability goals for recycling and renewable energy, we look up the supply chain not only to our own suppliers, but to those who supply the materials that eventually come to us as waste. We help suppliers understand how to increase the lifecycle sustainability of their products. For example, we are working with the suppliers of compact fluorescent bulbs to not only recycle the bulbs and recover the mercury and other materials for reuse, but to give them insights into how the plastics used in CFLs could become recyclable.
Reaching our target of increasing fuel efficiency and reducing our fleet emissions will depend upon our success in working with truck manufacturers and equipment suppliers. Waste Management is active in helping to test new hybrid technologies in our trucking fleet, including equipment configurations that reduce weight and use natural

WASTE MANAGEMENT // SUSTAINABILITY REPORT 2010 APPENDIX 23
gas as fuel. Our work with Securing America’s Future Energy has been important to these efforts, and our CEO, our Senior Vice President of Public Affairs and Communications, and our driver Anthony Dunkley from Waste Management North Virginia were pleased to join the President of the United States when he signed a Presidential Memorandum regarding prospective legislation to establish emissions standards for heavy-duty vehicles.
AWARDS AND RECOGNITIONS (linked from p.26)
2008 – 2010 NATIONAL AWARDS AND RECOGNITIONS
2008
Ethisphere Institute, World’s Most Ethical Companies
Ethisphere Institute, Attorneys Who Matter (for Waste Management’s General Counsel)
World Business Council for Sustainable Development, “Sustainability Leader” for the Waste and Disposal Services Sector
Dow Jones Sustainability Index North America
Institutional Investor Survey, Top Shareholder-Friendly Companies (ranked 2nd)
Waste-to-Energy Research and Technology Council, Outstanding Contribution Award
Wildlife Habitat Council, William W. Howard C.E.O. Award
National Sheriffs’ Association, Award of Excellence in Neighborhood Watch
Corporate Responsibility Magazine, 100 Best Corporate Citizen (ranked 75th)
Environmental Industry Associations, Driver of the Year
Wildlife Habitat Council, Corporate Lands for Learning Project of the Year (Alliance Landfill)
American Society of Civil Engineers, Outstanding Civil Engineering Award (Waste Management Turnkey Landfill/University of New Hampshire EcoLine Gas Pipeline)
InformationWeek, 250 Top Innovators (ranked 63rd)
Human Rights Campaign, Corporate Equality Index (100% rating)
2009
FBI Honorary Certificate (for a Waste Management truck driver)
American Legion Honor (Flag Day)
Fleet Owner Magazine, Top 500 Fleets (ranked 6th)
SAM Sustainability Yearbook, Sector Leader, Waste and Industrial Services Sector
U.S. Conference of Mayors, Mayors Business Council, Outstanding Award for Public/Private Partnerships
Institutional Investor, America’s Best CEOs (ranked 2nd in Environmental Category)
Newsweek, Greenest Big Companies in America (ranked 109th out of 500)
Dow Jones Sustainability Index, North America
Human Rights Campaign, Corporate Equality Index (85% rating out of 100)
Vigeo, Waste & Water Utilities North America (all “+” ratings)
Ethisphere Institute, World’s Most Ethical Companies
U.S. Environmental Protection Agency (U.S. EPA) Landfill Methane Outreach Program Projects of the Year: Waste Management Turnkey Landfill/University of New Hampshire EcoLine Project, and Altamont Landfill Resource and Recovery Facility
2010
Mashable.com’s 2nd Annual Open Web Awards, Blogger’s Choice award (environmental category)
GovernanceMetrics International Accountability Ratings, ranked 10 (highest available)
Forbes, Inc., Top 20 Most Responsible Companies
Ethisphere Institute, World’s Most Ethical Companies
Ethisphere Institute, Attorneys Who Matter (for Waste Management’s General Counsel)
Corporate University Best-In-Class, Best New Corporate University (runner-up)
American Hospital Association, endorsement of Waste Management Healthcare Solutions

WASTE MANAGEMENT // SUSTAINABILITY REPORT 2010 APPENDIX 24
PR News, Best Annual CSR Award (honorable mention)
G.I. Jobs Magazine, Top 100 Most Military-Friendly Companies
U.S. Occupational Safety and Health Administration, Star Certification (1st transfer station)
Profiles in Diversity Journal, Diversity Leader
InformationWeek 500 “most innovative IT organizations” (ranked 36th of 500)
U.S. EPA SmartWay Transport Partner
Climate Change Business Journal, Business Achievement Award, Technology Merit: Transportation
2008 – 2010 STATE AND LOCAL GOVERNMENT AWARDS AND RECOGNITIONS
2008
Industrial Environmental Association of San Diego, Environmental Responsibility Award
California Climate Action Leader
San Diego EarthWorks, EARTH Award
Virginia Environmental Excellence Program, Exemplary Environmental Enterprise Award
New Jersey Department of Environmental Protection and New Jersey Clean Communities Council, Business Partnership Award
Austin Chamber of Commerce, Business Award Nomination – Environment
Wildlife Habitat Council, International Habitat Conservation Award
Houston Port Region Economic Alliance, Visionary Award
U.S. Occupational Safety and Health Administration, Merit Status, Grayslake Recycling Plant
Sacramento Municipal Utility District, Top Supplier
California Mothers Against Drunk Driving, Corporate Leadership Award
Keep Mississippi Beautiful, Louise Godwin Award for Excellence
Canon Technology Solutions, Inaugural Leadership Award, Waste Management Safety
2009
Pennsylvania Department of Community and Economic Development, “Best 50” Award
Greater Taylorville (Illinois) Chamber of Commerce, Member of the Quarter
New York League of Conservation Voters, 2009 Corporate Environmental Pioneer
Abington (Pennsylvania) Area Joint Recreation Board, Environmental Partnership Award
Better Business Bureau of New York, Torch Award
Broward County (Florida) Partners in Education, 2009 Community Involvement Award
Sustainable Florida Collins Center, 2009 Best Practice Award
National Solid Wastes Management Association – Minnesota Chapter, Special Governor’s Award
Schuylkill (Pennsylvania) Conservation District, Forest Stewardship Award
Northfield News (Minnesota), Business of the Year
Northfield Chamber of Commerce (Minnesota), Business of the Year
California Integrated Waste Management Board, Waste Reduction Awards Program Honoree
San Diego American Lung Association, Clean Air Circle Honoree
Industrial Environmental Association (California), Environmental Responsibility Award
Orange County Register (California), Top Workplaces
2010
California Mothers Against Drunk Driving, Corporate Citizen of the Year
West Virginia Department of Environmental Protection, Environmental Excellence Award, Municipal Landfill

WASTE MANAGEMENT // SUSTAINABILITY REPORT 2010 APPENDIX 25
ADDITIONAL INFORMATION ON ENSURING ENVIRONMENTAL PERFORMANCE
INTERNAL ENVIRONMENTAL METRICS: NUMBER AND VOLUME OF SIGNIFICANT SPILLS (linked from p.27)
Waste Management is committed to reducing the number and amount of leaks and spills that occur at our opera-tions. We track fluids usage by our trucks and train drivers to report any leaks or spills they observe; we also require that all significant spills be reported to the corporate office via the Environmental Incident Notification System. The table below summarizes all “reportable quantity” spills (i.e., those of a size required to be reported to the appropriate agency) for the period covered across our more than 1,200 operating locations.
YEAR # OF REPORTABLE QUANTITY SPILLS REPORTED
2009 4
2008 5
2007 6
2006 10
REDUCING AND RECYCLING WATER AT WASTE MANAGEMENT (linked from p.28)
Examples of innovative operational practices our facilities use to reduce and recycle potable water include:
• The use of rainwater or water not suitable for drinking to wash trucks or control dust
• The creation of wetlands to purify contaminated water, which also provides usable green space and wildlife habitat
• Onsite water treatment (such as reverse osmosis or onsite spray irrigation) within a confined unit for biologic treatment before returning water to the environment at drinking water quality
• Use of floating cover over leachate ponds and temporary cover over landfills to avoid contact with precipitation and minimize the volume of water for which treatment is required
• Reuse of landfill leachate through landfill-gas-fueled evaporation, closed-loop recirculation and pond evaporation. In some cases, leachate is used for dust control on lined areas of a landfill.
• Conservation and reuse of reclaimed wastewater in boilers for steam turbines at select renewable energy projects
• At our 10 next-generation technology (bioreactor) landfills in operation (with six more in the permitting process), receipt of commercial and industrial wastewaters for biotreatment within the landfill, converting the organics in these materials into gas collected for beneficial use in renewable energy projects
• Avoidance of water contact with industrial processes and processing water for reuse in our operations to avoid release to the environment
• At all sites where environmentally appropriate and permitted under state regulation, use of wastewater rather than potable water in constructing landfill units and recirculation of landfill leachate for conversion into renewable energy in our landfill gas projects
• LEED certification for nine Waste Management facilities, with required water conservation and achievement of specific water-use reduction goals
We are continuing to evaluate our water use. One large commercial customer requested an estimate of the water used at Waste Management facilities in its supply chain. Our Green Squad evaluated the metered potable water consumption for 65 facilities at 81,501 hundred cubic feet per year. The Green Squad, as part of the company’s Corporate Sustainable Facilities initiative, is evaluating ways to expand water consumption monitoring in order to enhance future reporting on the results of conservation initiatives.

WASTE MANAGEMENT // SUSTAINABILITY REPORT 2010 APPENDIX 26
OUR WILDLIFE HABITAT SITES (linked from p.29)
We have 100 sites certified by the Wildlife Habitat Council. See www.wm.com/about/community/wildlife-habitat.jsp for a map showing where these sites are located. In addition to these formal, certified WHC sites, we conserve land for active recreation, parkland and athletic uses. Our closed landfills are reviewed for poten-tial beneficial use. Two facilities that we operated now have golf courses, 13 Waste Management-owned sites have wildlife habitats (with eight more planned), one has a learning center (with two more planned), five have passive recreation areas, three have constructed wetlands (with two more planned), three host model airplane clubs (with two more planned), and three have been transferred back to the community or a local conservancy. In addition, 10 sites have various forms of commercial redevelopment, two are used to support local law enforcement training, and 19 generate renewable power (with three additional systems planned).
TECHNOLOGIES FOR OPERATING A CLEAN AND EFFICIENT FLEET (linked from p.32)
Efficient Routing: We use fleet management and route optimization systems to improve efficiency and reduce driver time. Throughout our residential and commercial collection operations, we use state-of-the-art collec-tion fleet routing software known as WasteRoute and a subsequent Efficiency Management and Planning (EMAP) system. These tools were developed to simplify, standardize and improve the efficiencies of the company’s routing process. They provide our users with an automated way to optimize routes based on travel time, disposal options, vehicle capacities and waste streams, resulting in an overall reduction in miles driven. This leads to a direct reduction in fuel consumption and the attendant greenhouse gas emissions. WasteRoute and EMAP reinforce a companywide emphasis on daily route management. In addition, about 4 percent of our fleet uses an in-cab routing system that helps to optimize routes. These measures have reduced driver time by 2 million hours.
Cleaner Engines: We continue to replace our vehicles’ older engines with new engines equipped with diesel particu-late filter and selective catalytic reduction technology. These new-technology engines emit significantly reduced particulate matter and nitrogen oxides, making our fleet more environmentally friendly. In 2009, 23 percent of our collection vehicles and 33 percent of our diesel Class 8 vehicles used particulate filters or the equivalent installed by the manufacturer. In addition, we have retrofitted approximately 1,600 additional engines to reduce diesel particu-late emissions to “best-available control technology.” While these devices reduce particulate matter and nitrogen oxides emissions, they also increase the weight of each vehicle by about 1,000 pounds, which has moderated our potential emissions intensity improvements. We continue to research advanced technologies and equipment to meet this challenge.
Reducing Vehicle Weight: One equipment change that we are evaluating to offset the increased weight of the new-technology engines is the replacement of drum brakes with lighter-weight disc brakes. This one change will reduce the weight of our vehicles by 720 pounds per vehicle and improve vehicle performance, including stop-ping distance and brake effectiveness in wet conditions.
Alternative Fuels and Hybrids: Waste Management has the world’s largest fleet of heavy-duty natural gas refuse and recycling trucks. In 2009, we purchased 125 natural gas vehicles, raising our natural-gas-fueled fleet size to 853. Our natural gas fleet includes 351 compressed natural gas and 491 liquefied natural gas vehicles. This represents about 3.5 percent of our collection vehicles. We also have over 2,200 vehicles that run on various blends of biodiesel. By the end of 2010, we plan to have purchased an additional 150 CNG-powered vehicles. Using natural gas as a fuel reduces emissions, including particu-late matter, nitrogen oxides and greenhouse gases, and also reduces our dependence on imported fuels.

WASTE MANAGEMENT // SUSTAINABILITY REPORT 2010 APPENDIX 27
EMISSIONS (linked from p.33)
Actual Releases at Waste Management Hazardous Waste FacilitiesTRI-reportable releases must be within emission levels authorized by permit or regulation, but the TRI was initiated to go beyond the permitting process to provide communities with information about chemicals from all of the facili-ties in their vicinity. Disclosure of the total releases emitted in each community was intended as an indirect means of encouraging pollution prevention, and has served that purpose. The following information reflects a small rise in actual releases from Waste Management facilities from 2001 (the date TRI became applicable to hazardous waste facilities) to 2009 (the year of the U.S. EPA’s most recent data compilation). The increase is solely attributable to the inclusion in 2007 of adjacent nonhazardous waste management units in the hazardous waste facility release calculation. Note that these releases result from permitted waste treatment or placement activities and are within the terms of permit limits.
TRI CHEMICAL RELEASES AT WASTE MANAGEMENT HAZARDOUS WASTE FACILITIES (IN POUNDS)
2009 2008 2007 2006 2005 2004 2003 2002 2001 CHANGE 2001 - 2009
Air5 19,047 35,002 22,539 8,435 9,984 9,258 10,163 15,113 32,606 -41%
Water 30 26 60 5 28 170 114 186 195 -85%
Containment of Customers’ Wastes at Waste Management’s Hazardous Waste FacilitiesContainment of a TRI chemical in a permitted RCRA hazardous waste facility is the opposite of release – contain-ment means isolation of waste in an engineered structure continually monitored for leaks to assure zero impacts to surrounding soil or groundwater. The purpose and design of the federally mandated RCRA program is to ensure that materials placed in a RCRA containment facility will never migrate into the environment. As a consequence, in the U.S. EPA’s view, increased quantities of TRI materials in containment can represent “a generally positive environmental trend because these facilities are in the business of managing hazardous waste and do so under strict controls.”6 The U.S. EPA reports the containment at the seven Waste Management hazardous waste facilities as follows:
TRI CONTAINMENT AT WASTE MANAGEMENT HAZARDOUS WASTE FACILITIES (IN POUNDS)
2009 2008 2007 2006 2005 2004 2003 2002 2001
Containment in RCRA Subtitle C unit
34,040,988 33,855,809 36,895,969 26,859,210 29,356,115 49,988,090 61,365,982 33,829,570 52,827,514
Contained Underground Injection
5,025,091 12,311,678 13,260,957 10,668,797 7,934,792 12,008,034 12,554,221 16,021,979 16,268,251
Transfer Off-Site to Treatment/Containment
71,948 85,477 54,025 75,697 583,512 577,754 596,280 530,510 458,952
The rises and declines in containment at Waste Management facilities reflect relative activity in customer remedia-tion projects and brownfield cleanup, as well as fluctuations in activity in some heavy industrial sectors. Declines also reflect positive initiatives to avoid generating hazardous waste in the first place – initiatives for which Waste Management Upstream is a leading service provider. The offsite transfers for containment vary, reflecting changes in the customer base from year to year, one-time events like plant closures or large remedial projects, changes to onsite treatment capacity and changes in treatment or disposal regulations.
5 A change in Clean Air Act monitoring in 2007 and 2008 added air emissions to the reports for Kettleman Hills, Arlington and CID to account for municipal waste landfills located on property adjacent to these hazardous waste facilities. Note that these three municipal waste landfills appear to be the only such facilities included in the TRI database (simply because of their location next to a TRI reporting facility). This anomaly in the TRI reporting regulations makes it difficult to evaluate trends over time at these facilities.
6 U.S. EPA Toxic Release Inventory 2006 Public Data Release Key Findings, p.10, www.epa.gov/tri/tridata/tri06/pdr/key_findings_v12a.pdf. See also www.epa.gov/tri/tridata/tri08/national_analysis/pdr/TRI_key_findings_2008.pdf.

WASTE MANAGEMENT // SUSTAINABILITY REPORT 2010 APPENDIX 28
METHODOLOGY USED TO CALCULATE WASTE MANAGEMENT’S CARBON FOOTPRINT (linked from p.34)
Waste Management’s carbon footprint comprises all anthropogenic7 Scope 1(direct) emissions and Scope 2 (indi-rect) emissions from facilities and activities under Waste Management’s operational control in the United States, the U.S. Territories and Canada. These emissions include direct emissions from vehicle and facility fossil fuel use, landfill operations, waste-to-energy and power plants, management of medical wastes, and refrigerant use, as well as indi-rect emissions from electricity use. The carbon footprint relies on company operating data collected from auditable corporate business, legal and accounting records, as well as invoices, that have undergone internal quality-assurance checks.
Our inventory reflects the most accurate means available to calculate GHG emissions within our industry sector. We worked with leaders in government, industry and academia in developing our inventory processes and protocols, including staff of the California Climate Action Registry, the multi-state Climate Registry and the U.S. EPA. Our GHG inventory employs the protocols embodied in the U.S. EPA’s final Mandatory Greenhouse Gas Reporting Rule (74 Fed. Reg. 56260, October 30, 2009) and the Climate Registry’s General Reporting Protocol (May 2008) for the majority of our GHG emission sources.
Because a broadly accepted protocol for estimating the carbon mass balance of landfills does not yet exist, Waste Management, along with other public and private owner/operators of landfills, funded development of the Solid Waste Industry for Climate Solutions (SWICS) protocol by SCS Engineers.8 The protocol represents a first step in refining existing U.S. EPA models and protocols using peer-reviewed, published research to improve landfill GHG emission esti-mation. We employed the SWICS protocol in estimating the emissions associated with the landfill operations reported in our companywide carbon footprint and the voluntary GHG reporting protocols in which we participate.
To determine more accurately the amount of methane emitted from landfills, we have undertaken multi-year studies using state-of-the-art measurement techniques at landfills with different operational, topographical and climatic features. Our California landfills are part of a three-year landfill methane study sponsored by the California Energy Commission. The findings from that study have been published as a new method for evaluating methane flux through landfill cover. We have also worked closely with the U.S. EPA’s Office of Research and Development, under a 10-year Cooperative Research and Development Agreement, to identify and test new techniques for measuring landfill surface methane emissions. A new instrument called a “cavity ring-down laser” offers real promise, and the U.S. EPA and Waste Management began testing it at eight locations in 2010; we anticipate the publication of results in 2011. We have signed a five-year extension of our research agreement with the U.S. EPA to continue this important research.
Our calculation of the potential GHG reductions or “avoided emissions” that our operations enable includes:
• The production of renewable waste-based energy that replaces electricity generated from fossil fuels.
• The potential avoided GHG emissions from one year’s production of renewable fuel from landfill gas at our Altamont, California, landfill.
• Facilitation of the reuse and recycling of materials.
• Permanent carbon storage in landfills. (This paragraph is also linked from p.37.) Carbon storage in landfills can significantly offset GHG emissions from landfills. The decision to include these factors and how they are utilized in a statewide inventory will depend on the accounting protocol employed. A number of international and domestic protocols – including those of the United Nations Intergovernmental Panel on Climate Change, the U.S. EPA, the Oregon Climate Trust and the California Air Resources Board – recognize carbon storage in landfilled material as a “sink” in calculating carbon emissions inventories.9 These protocols recognize that when wastes of a biogenic origin are deposited in landfills and do not completely decompose, the carbon that remains is effectively removed from the global carbon cycle, or sequestered. For example, the U.S. EPA has published reports that evaluate carbon flows through landfills to estimate their net GHG emissions. The methodology the U.S. EPA employed recognizes carbon storage in landfills. In these studies of MSW landfilling, the U.S. EPA summed the GHG emissions from methane generation and transportation-related carbon dioxide emissions, and then subtracted carbon sequestra-tion (i.e., treated it as negative emissions).10
7 Anthropogenic GHG emissions occur due to human activity and are the focus of existing and proposed international and national regulation by GHG reduction programs.
8 SCS Engineers, Inc., Current MSW Industry Position and State-of-the Practice on LFG Collection Efficiency, Methane Oxidation, and Carbon Sequestration in Landfills for SWICS (Long Beach, CA: SCS Engineers, January 2009).
9 Ibid.
10 U.S. EPA, Solid Waste Management and Greenhouse Gases: A Life-Cycle Assessment of Emissions and Sinks, 3rd Edition (Washington, DC: U.S. EPA, September 2006).

WASTE MANAGEMENT // SUSTAINABILITY REPORT 2010 APPENDIX 29
• We have used the SWICS protocol to calculate the amount of carbon permanently stored in landfills from the annual disposal of biogenic waste that will not decompose in the landfill to produce methane. This carbon storage, or sequestration, is important because it removes carbon from the natural carbon cycle indefinitely, reducing net emissions of GHG. Both the UN Intergovernmental Panel on Climate Change and U.S. EPA National GHG Emissions Inventory account for carbon sequestration of undecomposed wood products, yard trimmings and food wastes disposed of in landfills. Both entities consider carbon sequestration to be an integral component of the landfill carbon mass balance calculations.
OUR PARTICIPATION IN CLIMATE CHANGE PUBLIC POLICY (linked from p.35)
Waste Management is actively working with stakeholders from all perspectives to assess how GHG emissions can be accurately inventoried and disclosed, and how that information can be used in climate change initiatives that improve the environment and are consistent with a healthy economy. We participate with the Carbon Disclosure Project, the Dow Jones Sustainability Index and Newsweek Green Rankings Research, and we have made our voluntary reports to these organizations publicly available. We have also commented on federal, regional and state frameworks for addressing climate change. Extensive comments and recommended strategies have been discussed with:
• U.S. House of Representatives, Committee on Energy and Commerce
• U.S. House of Representatives, Committee on Science and Technology
• U.S. Senate Energy and Natural Resources Committee
• U.S. Environmental Protection Agency
• California Air Resources Board
• Western Climate Initiative
• Regional Greenhouse Gas Initiative
• Climate Registry
• Climate Action Reserve
All comments are a matter of public record.
ADDITIONAL INFORMATION ON CREATING A GOOD PLACE TO WORK
OUR VALUES (linked from p.38)
Our values provide the foundation for our company’s practices and standards. Our values remain constant – even though our world is changing.
Honesty: We are truthful and use the highest levels of integrity and fairness in dealing with our customers and each other.
Accountability: We are trained, knowledgeable and empowered. We take full responsibility for our actions, conduct and decisions.
Safety: We take care of ourselves, our coworkers and our neighbors. We follow the rules and practices, and we don’t do it unless it can be done safely.
Professionalism: We are the best at what we do. We trust one another and follow through on our commitments.
Respect: We appreciate the worth of others and treat everyone with dignity and consideration.
Inclusion: We listen to and interact with others with an open mind.
Diversity: We appreciate the unique talents we all bring to the Waste Management team.
Employee Empowerment: We are valued employees, protecting the environment and the well-being of the communities where we live and work.

WASTE MANAGEMENT // SUSTAINABILITY REPORT 2010 APPENDIX 30
ADDITIONAL DIVERSITY DATA (linked from p.38)
WASTE MANAGEMENT WORKFORCE BY ETHNIC GROUP
ETHNIC GROUP PERCENTAGE IN WASTE MANAGEMENT’S U.S. WORKFORCE
PERCENTAGE IN THE U.S. POPULATION11
American Indian 0.61% 1.0%
Asian 1.24% 4.6%
African-American 15.26% 12.9%
Hispanic 20.57% 15.8%
Caucasian 60.90% 65.1%
Multi-Race 1.42% 1.7%
WASTE MANAGEMENT WORKFORCE BY AGE
AGE GROUP PERCENTAGE OF WASTE MANAGEMENT’S WORKFORCE IN THE UNITED STATES AND CANADA
Veterans (Born 1922-1943) 1.09%
Baby Boomers (Born 1944-1960) 28.81%
GenXers (Born 1961-1980) 60.72%
Millennials (Born 1981-2000) 9.38%
WORKPLACE SAFETY INITIATIVES (linked from p.39)
Avoiding Worker InjuriesWhen an injury occurs, we have clear rules about reporting and investigating the incident. Employees and managers are trained to follow these rules; failure to do so is grounds for disciplinary action, including dismissal. We investigate every injury to determine whether a claim is related to work or not.
We assist injured employees throughout the healing and recovery process. Our Transition to Recovery program works with the employee’s doctors to accommodate restrictions and return the employee back to work as soon as possible. We pay for a full-time, independent occupational health counselor to advocate for an employee’s health and well-being as part of the transition process. Our goal is to return all injured or ill employees to work, incorpo-rating meaningful and appropriate work opportunities during the recovery period.
The Danger of “Sharps” A particular concern for sanitation workers is injury from “sharps” – needles and syringes used by people who self-inject medications in their homes. Each year, more than 7.5 billion doses of medicine are administered by syringes, with the used sharps potentially discarded in trash or recycling containers.
Waste Management has reduced the number of reported sharps incidents by more than 55 percent since 2001, thanks to several initiatives. We have been working to educate the public about the safe disposal of sharps through our website, work with the Association of Diabetes Educators and other media.12 We have actively supported legislation that reduces our employees’ risk of exposure to blood-borne pathogens. And we have worked with 3M to develop new glove technology specifically designed for our employees to reduce the risk of exposure. These gloves are in use at our materials recovery facilities to ensure worker protection.
In 2009, we developed a new proprietary line of mail return systems for customers generating small volumes of sharps and medical waste. Our MedWaste Tracker System contains the supplies an individual needs to safely contain small quantities of medical waste. Customers simply arrange a pickup with the U.S. Postal Service.
11 Source for U.S. population data: U.S. Census Quickfacts 2009 estimate
12 See www.thinkgreenfromhome.com/SyringesAndLancets.cfm.

WASTE MANAGEMENT // SUSTAINABILITY REPORT 2010 APPENDIX 31
OTHER WORKPLACE-RELATED ISSUES (linked from p.43)
Employee BenefitsWe offer our employees competitive wages and benefits, including health and dental coverage, prescription drug coverage, short- and long-term disability insurance, life insurance, education savings accounts and paid time off to participate in our Community Partners Volunteer Program (see p.46). About 96 percent of employees participate in our health insurance plans or receive compensation for opting out. Employees choosing to opt out of participation, whether requesting compensation or simply waiving coverage, must demonstrate that they have alternative insur-ance coverage.
We are particularly proud of our wellness programs. We have a team of “Get Well Guides” – a group of nurses and coaches who help employees and their families get access to the help they may need for a variety of life challenges. Employees can dial a toll-free phone number for support and confidential assistance from reliable, compassionate professionals who are trained as nurses, coaches, dieticians, clinicians and financial counselors. They are available for assistance with:
• Health questions
• Tobacco cessation
• Weight loss
• Financial advice and assistance
• Discounts on gym memberships and other wellness programs
Our wellness programs also include onsite flu clinics and health fairs, where we provide blood pressure tests, blood lipid tests and other screenings that aid in the early detection of health risks. A health coach also meets individually with every participant to review their results and suggest action items to improve their health.
Talent AcquisitionMost of our new hires are for positions that are ranked among Manpower Inc.’s 2010 10-hardest-jobs-to-fill list. In 2008, we made concerted efforts to improve our hiring practices in order to reach and employ the best talent available.
WMIDEA XCHANGE
We encourage employee input through the WMIdea Xchange program. We welcome employee suggestions on every-thing from ways to reduce operating costs to enhancing internal communication.
Employees whose ideas are adopted as best practices receive a $100 gift certificate. Each year, the employee or group of employees who submit the most effective idea receive a prize of $5,000.

WASTE MANAGEMENT // SUSTAINABILITY REPORT 2010 APPENDIX 32
TALENT ACQUISITION PERFORMANCE
TALENT ACQUISITION PROCESS PRE 2008 IMPROVEMENTS, 2008-2009 FURTHER IMPROVEMENTS 2010
CURRENT TARGET
Time to Fill 50+ days 28 days 28 days 20 days
Offer to Clearance/Start unknown 8.5 days / 17.6 days
New Hire Turnovers 15% 10%
No-Show Rate 30% 4% 4% 4%
HM Selection Ratio unknown about 50% 50% (2 of 4) 75% (3 of 4)
Cost Savings none $1.92 million (reduced HM time on recruiting)
$1.92 million $2.42 million
Interviewing No consistent program
2000 front-line managers trained
Employment Brand
Employee Referrals
None Consistent across the business
Recruiting Performance Metrics None Detailed
Turnover 30% 15%
ADDITIONAL INFORMATION ON PARTNERING WITH COMMUNITIES
CHARITABLE CONTRIBUTIONS (linked from p.45 )
Aiding Employees’ Families When an earthquake devastated Haiti in early 2010, our workforce in Florida felt the impacts. Waste Management has more than 500 employees of Haitian descent in Florida.
Waste Management and its employees donated more than $100,000 in emergency aid contributions to the Haiti relief effort. Moved by the ongoing crisis, Waste Management made an additional $50,000 donation to the Florida Marlins’ “Homes for Haiti” program conducted with its partner Food For The Poor. In addition, we donated water and ready-to-eat meals from our hurricane preparation supplies and set up four shipping containers at sites in South Florida to accept donations of food, clothing and medical supplies to be sent to Haiti.13
2009 HAITI RELIEF EFFORTS
WORLD VISION HABITAT FOR HUMANITY
Employee Donations $16,714 $10,034
Company Match $16,714 $10,034
North FL Market Area $25,000 $0
South FL Market Area $25,000 $0
Totals $83,428 $20,068
In 2010, we were named to G.I. Jobs magazine’s list of the “Top 100 Military Friendly Employers.” The list, drawn from an estimated 5,000 companies, is based upon the strength of company military recruiting efforts, the percentage of new hires with prior military service and company policies toward National Guard and Army Reserve service.
Our outreach efforts to those in the military benefit from partnerships with organizations such as the Department of Defense Transition Assistance Program, the U.S. Army’s Partnership for Youth Success, Hire Heroes USA and the Army Reserve Employer Partnership Initiative.
13 Source: Waste & Recycling News, 2/1/10.

WASTE MANAGEMENT // SUSTAINABILITY REPORT 2010 APPENDIX 33
We provided grief counseling and time off to employees coping with the tragedy. In addition, employees received $13,283.07 from the support fund noted above.
OUR PARTNERSHIPS AND ASSOCIATIONS (linked from p.46)
On a national level, we have partnered with several organizations that we believe are making a difference for the environment and for local communities. These include:
Keep America Beautiful (KAB): For more than 25 years, we have supported the nation’s largest volunteer-based community beautification organization. We contribute over $1 million a year to efforts to prevent litter, reduce waste, promote recycling and beautify communities. We’re a significant sponsor of the organization’s signature event, The Great American Cleanup, providing in-kind equipment, manpower and logistical support to millions of volunteers in local efforts. Our grants supported 42 projects in 2007, 51 in 2008 and 47 in 2009. Barry Caldwell, Senior Vice President for Public Affairs and Communications, sits on the KAB Board, and many Waste Management employees are on local affiliate boards. (See www.kab.org.)
Habitat for Humanity: Waste Management and Habitat for Humanity share a goal of providing construction services that are environmentally friendly. We have committed $1 million over three years to further the organiza-tion’s mission of building decent, affordable housing. We began our relationship in 2007 with the Jimmy and Rosalynn Carter Habitat for Humanity Work Project in Los Angeles. A year later, we announced a multi-year partnership, through which we provide monetary support, in-kind donations and a variety of waste disposal services to Habitat affiliates across the United States and Canada. As part of the partnership, our employees participate in building Habitat homes. We’re also providing a variety of industry-specific services at local building projects, such as waste collection and disposal, construction and demolition recycling, and loading services. Our partnership has enabled Habitat for Humanity to help families in 28 states and at least 111 different cities. (See www.habitat.org.)
Wildlife Habitat Council: The Wildlife Habitat Council’s “Wildlife at Work” program recognizes commendable wildlife habitat management and environmental education programs at work sites. We have met our goal to have at least 100 of our facilities certified by the WHC by 2020, and to have approximately 25,000 acres of land set aside for conservation and wildlife habitat. In 2006, we were recognized as the first organizational recipient of the WHC President’s Award, and in 2008 we became the first recipient of the WHC’s William W. Howard C.E.O. Award, recognizing our efforts in conservation, education and outreach. For more on our habitat preservation efforts, see p.29. (See www.wildlifehc.org.)
City Livability Awards: Sponsored by Waste Management, the Conference of Mayors’ City Livability Program honors mayors and their city governments for development programs that enhance the quality of life in urban areas. Established in 1979, the awards are given annually to 10 mayors and their cities.
Earth Day Events across North America: Waste Management supports dozens of local Earth Day activities and events through sponsorships, volunteerism and services. Nearly 50 events were held or sponsored in spring 2010, with attendance ranging from a dozen members of a school class touring one of our facilities to large sponsored events drawing thousands.
Trash Track: Waste Management funded project “Trash Track” at the Massachusetts Institute of Technology. Through this project, a five-year-old “Sensible Cities” group has attached tracking devices to thousands of pieces of garbage generated in Seattle and New York City in an effort to study where recyclables go and the degree to which recycling benefits the climate.
UNITED WAY CONTRIBUTIONS
In 2009, we kicked off a campaign for the United Way in our headquarters town of Houston, and we ultimately exceeded our goal of raising $225,000.
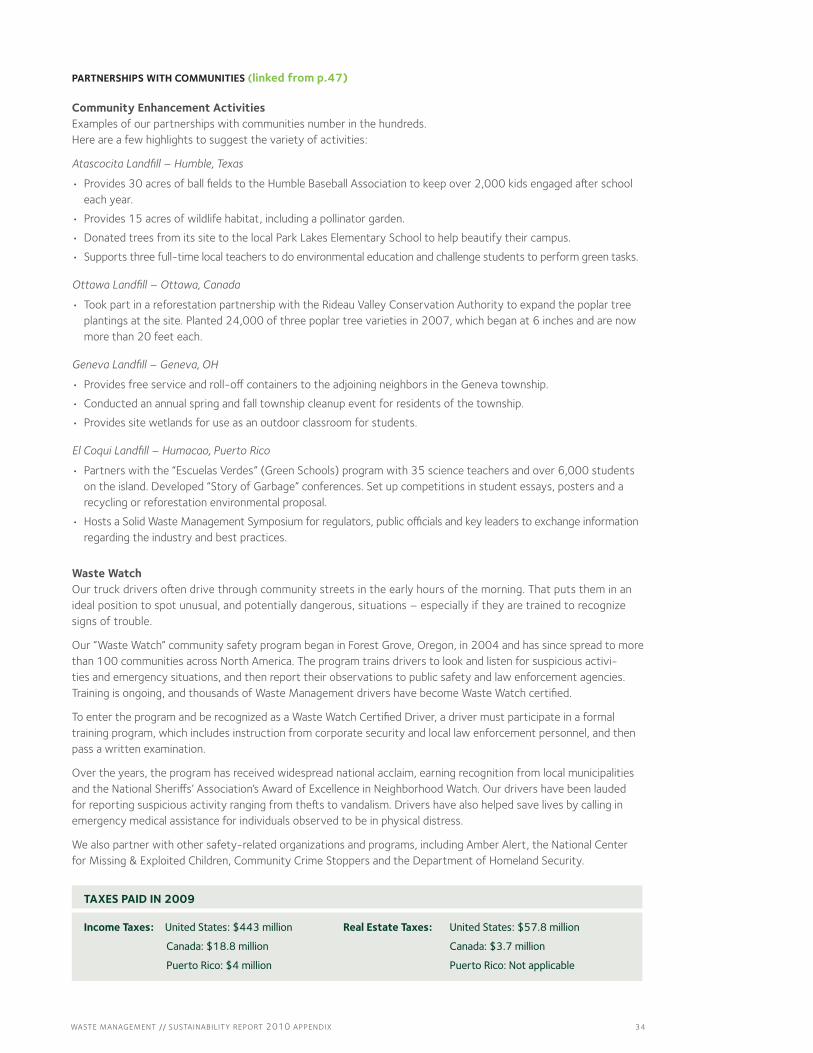
WASTE MANAGEMENT // SUSTAINABILITY REPORT 2010 APPENDIX 34
PARTNERSHIPS WITH COMMUNITIES (linked from p.47)
Community Enhancement ActivitiesExamples of our partnerships with communities number in the hundreds. Here are a few highlights to suggest the variety of activities:
Atascocita Landfill – Humble, Texas
• Provides 30 acres of ball fields to the Humble Baseball Association to keep over 2,000 kids engaged after school each year.
• Provides 15 acres of wildlife habitat, including a pollinator garden.
• Donated trees from its site to the local Park Lakes Elementary School to help beautify their campus.
• Supports three full-time local teachers to do environmental education and challenge students to perform green tasks.
Ottawa Landfill – Ottawa, Canada
• Took part in a reforestation partnership with the Rideau Valley Conservation Authority to expand the poplar tree plantings at the site. Planted 24,000 of three poplar tree varieties in 2007, which began at 6 inches and are now more than 20 feet each.
Geneva Landfill – Geneva, OH
• Provides free service and roll-off containers to the adjoining neighbors in the Geneva township.
• Conducted an annual spring and fall township cleanup event for residents of the township.
• Provides site wetlands for use as an outdoor classroom for students.
El Coqui Landfill – Humacao, Puerto Rico
• Partners with the “Escuelas Verdes” (Green Schools) program with 35 science teachers and over 6,000 students on the island. Developed “Story of Garbage” conferences. Set up competitions in student essays, posters and a recycling or reforestation environmental proposal.
• Hosts a Solid Waste Management Symposium for regulators, public officials and key leaders to exchange information regarding the industry and best practices.
Waste WatchOur truck drivers often drive through community streets in the early hours of the morning. That puts them in an ideal position to spot unusual, and potentially dangerous, situations – especially if they are trained to recognize signs of trouble.
Our “Waste Watch” community safety program began in Forest Grove, Oregon, in 2004 and has since spread to more than 100 communities across North America. The program trains drivers to look and listen for suspicious activi-ties and emergency situations, and then report their observations to public safety and law enforcement agencies. Training is ongoing, and thousands of Waste Management drivers have become Waste Watch certified.
To enter the program and be recognized as a Waste Watch Certified Driver, a driver must participate in a formal training program, which includes instruction from corporate security and local law enforcement personnel, and then pass a written examination.
Over the years, the program has received widespread national acclaim, earning recognition from local municipalities and the National Sheriffs’ Association’s Award of Excellence in Neighborhood Watch. Our drivers have been lauded for reporting suspicious activity ranging from thefts to vandalism. Drivers have also helped save lives by calling in emergency medical assistance for individuals observed to be in physical distress.
We also partner with other safety-related organizations and programs, including Amber Alert, the National Center for Missing & Exploited Children, Community Crime Stoppers and the Department of Homeland Security.
TAXES PAID IN 2009
Income Taxes: United States: $443 million Real Estate Taxes: United States: $57.8 million
Canada: $18.8 million Canada: $3.7 million
Puerto Rico: $4 million Puerto Rico: Not applicable

WASTE MANAGEMENT // SUSTAINABILITY REPORT 2010 APPENDIX 35
ANALYZING OUR FACILITIES (linked from p.49)
INCOME/RACE WITHIN 5 KM OF WASTE MANAGEMENT LANDFILLS14
Using 2000 census figures – the most recent available – we identified the racial and income demographics within 1-, 3- and 5-kilometer radii of our hazardous and solid waste landfills and waste-to-energy facilities. These distances are used in the “Toxic Wastes and Race” study that is most frequently cited for its analysis of environ-mental justice demographics.15 This demographic approach is consistent with that adopted by the U.S. EPA in its Environmental Justice Strategic Enforcement Assessment Tool. In 1987 and again in 2007, “Toxic Wastes and Race” showed that hazardous waste facilities are disproportionately located in environmental justice communities in the United States. However, this pattern is not the case for Waste Management. We used that study’s methodology to evaluate Waste Management’s hazardous and MSW landfills and waste-to-energy facilities.16 Within the 1-, 3- and 5- kilometer radii, we found:
• No Waste Management facility is located in a community that is below the federal poverty level. One facility – an MSW landfill – is located in a community that is below the federal poverty level at 1 kilometer, but income levels are higher at the 3- and 5-kilometer radii.
• Half of our facilities’ host communities fall above the median state income, and half of them fall below – the equivalent of an even, random distribution.
• Our facilities are more likely to be located in communities with above-average white representation. Only 33 percent of our facilities are located in communities exceeding the state average minority representation at the 5-kilometer radius. (The percentage of minority representation goes down as the radius grows closer to the facility – 31 percent at 3 kilometers and 28 percent at 1 kilometer.)
31 FACILITIES
63 FACILITIES
101 FACILITIES
80 FACILITIES
0.0 0.5 1.0 1.5 2.0 2.50.0 0.5 1.0 1.5 2.0 2.5
BELOW STATE AVERAGE ABOVE STATE AVERAGE
BELO
W S
TATE
AVE
RAG
E
A
BOVE
STA
TE A
VERA
GE
RAC
E (%
WH
ITE)
INCOME
Waste-to-Energy Landfill
This graphic shows that Waste Management’s landfills and waste-to-energy facilities are located most frequently in communities that are above state average income and above state average white representation (the upper right quadrant). The graphic also shows relative distribution: the higher above the state average income axis, the relatively higher the income of the community
14 Chart includes Waste Management’s U.S. hazardous and MSW landfills (and one underground injection well), as well as waste-to-energy facilities, as of August 2010 and at the 5 kilometer radius.
15 Robert D. Bullard, Paul Mohai, Robin Saha, and Beverly Wright, Toxic Wastes and Race at Twenty 1987-2007: Grassroots Struggles to Dismantle Environmental Racism in the United States (Cleveland OH: United Church of Christ Justice and Witness Ministry, 2007). We employed Mohai’s method of “areal apportionment,” which essentially draws a circle around the facility to create as precise a characterization of the area as possible. The poverty rate used by Mohai, and adopted by Waste Management, was set by the U.S. Department of Health and Human Services. The median state income levels come from the 1999 data used in the 2000 census.
16 In mid-2009, after we completed our analysis, Waste Management acquired two new facilities with hazardous waste treatment, but not disposal, capacity. Neither facility is located in a community that exceeds the poverty level or that exceeds state average minority representation.

WASTE MANAGEMENT // SUSTAINABILITY REPORT 2010 APPENDIX 36
ADDITIONAL INFORMATION ON CAPTURING THE VALUE IN WASTE
ADDITIONAL UPSTREAM SUCCESSES (linked from p.59)
• A leading retail organization needed to efficiently and properly process returns from thousands of store locations while maintaining compliance with intensifying regulatory mandates. More than ever, product returns were falling into regulated categories (such as pesticides, oils, paints and batteries) requiring careful packing, transportation and disposal. Waste Management developed and implemented a comprehensive program to provide a compliant yet cost-effective solution to this challenge.
• At two Alcoa plants in New York, Waste Management and the customer worked together to design and implement a comprehensive resource recovery plan that now reclaims 20 to 25 tons of aluminum oxide per week. In addition to helping Alcoa meet its landfill reduction goal, this solution generated $500,000 annually in discovered value.
• Simi Valley Hospital was seeking to implement recycling, improve its environmental practices and cut costs as part of a social responsibility initiative. Our Upstream team analyzed the hospital’s waste streams holistically, recommended a goal of 40 percent waste reduction overall and provided the waste management solutions to make it happen.
INVESTING IN NEW WAYS TO RECYCLE (linked from p.62)
In May 2010, Waste Management announced an investment in MicroGREEN Polymers, Inc. MicroGREEN’s patented technology reduces the amount of plastic required for the production of consumer products, thereby significantly lowering raw material costs. Unlike other expansion technologies for plastics, this technology does not involve petrochemical blowing agents nor volatile organic compounds in the manufacturing process. The technology works especially well with recycled PET (rPET) – the world’s most recycled plastic, commonly used to create beverage bottles.
In a recent lifecycle inventory and analysis study of hot beverage cups conducted by Franklin Associates, this technology as applied to a recycled PET hot beverage cup had the lowest total amount of energy required to produce a hot beverage cup and the lowest total solid waste (as measured in both volume and weight) when compared to expanded polystyrene and coated paperboard hot beverage cups, the two most commonly used in the market today.
Our plan with this investment, in coordination with the Greenopolis Recycling System, is to reduce the carbon footprint of food packaging materials through closed-loop recycling.