appendix n project cost and schedule risk analysis … cost and schedule risk analysis reports ......
TRANSCRIPT

Appendix N Project Cost and Schedule Risk Analysis Reports Fargo-Moorhead Metropolitan Area Flood Risk Management
Final Feasibility Report and Environmental Impact Statement
July 2011
Prepared by: U.S. Army Corps of Engineers St. Paul District 180 Fifth Street East, Suite 700 St. Paul, Minnesota 55101-1678
USACE-MVP-0000087977

This page intentionally left blank
USACE-MVP-0000087977

Fargo-Moorhead Metro Flood Risk Management Project,
Feasibility Study, Phase 4
National Economic Development Plan (NED) – Minnesota Option
Project Cost and Schedule Risk Analysis Report
Prepared for:
U.S. Army Corps of Engineers, St. Paul District
Prepared by:
U.S. Army Corps of Engineers Cost Engineering Directory of Expertise, Walla Walla
May 4, 2011
US Army Corps of Engineers®
USACE-MVP-0000087977

TABLE OF CONTENTS
EXECUTIVE SUMMARY ................................................................................ ES-1
MAIN REPORT ..................................................................................................... 1
1.0 PURPOSE ...................................................................................................... 1
2.0 BACKGROUND .............................................................................................. 1
3.0 REPORT SCOPE ........................................................................................... 1
4.0 METHODOLOGY / PROCESS ....................................................................... 3
4.1 Identify and Assess Risk Factors ................................................................ 4
4.2 Quantify Risk Factor Impacts ...................................................................... 4
4.3 Analyze Cost Estimate and Schedule Contingency ..................................... 5
5.0 KEY ASSUMPTIONS ...................................................................................... 6
6.0 RESULTS ....................................................................................................... 7
6.1 Risk Register ............................................................................................... 7
6.2 Cost Contingency and Sensitivity Analysis .................................................. 7
6.2.1 Sensitivity Analysis ............................................................................... 8
6.2.2 Sensitivity Analysis Results .................................................................. 8
6.3 Schedule and Contingency Risk Analysis ................................................... 9
7.0 MAJOR FINDINGS/OBSERVATIONS/RECOMMENDATIONS .................... 12
7.1 Major Findings/Observations ..................................................................... 12
7.2 Recommendations .................................................................................... 16
USACE-MVP-0000087977

LIST OF TABLES
Table ES-1. Contingency Analysis ................................................................. ES-1
Table ES-2. Cost Summary ........................................................................... ES-2
Table 1. Project Cost Contingency Summary ...................................................... 8
Table 2. Schedule Duration Contingency Summary ............................................ 9
Table 3. Project Cost Comparison Summary ..................................................... 13
LIST OF FIGURES
Figure 1. Cost Sensitivity Analysis ..................................................................... 10
Figure 2. Schedule Sensitivity Analysis ............................................................. 11
Figure 3. Project Cost Summary ........................................................................ 14
Figure 4. Project Duration Summary .................................................................. 15
LIST OF APPENDICES
Risk Register .................................................................................... APPENDIX A
USACE-MVP-0000087977

EXECUTIVE SUMMARY
Under the auspices of the US Army Corps of Engineers (USACE), St. Paul District, this report presents a recommendation for the project cost and schedule contingencies for the Fargo-Moorhead Metro Flood Risk Management Project, Feasibility Study, Phase 4 National Economic Development Plan (NED) – Minnesota Option (Fargo-Moorhead FRM NED). In compliance with Engineer Regulation (ER) 1110-2-1302 CIVIL WORKS COST ENGINEERING, dated September 15, 2008, a formal risk analysis study was conducted for the development of contingency on the project cost. The purpose of this risk analysis study was to establish project contingencies by identifying and measuring the cost and schedule impact of project uncertainties with respect to the estimated project cost.
Specific to the Fargo-Moorhead NED Project, the most likely project cost (at price level) is estimated at approximately $949 Million. Based on the results of the analysis, the Cost Engineering Directory of Expertise for Civil Works (Walla Walla District) recommends a contingency value of $245 Million, or 26%. This contingency includes $181 Million (19%) for cost growth potential due to risk analyzed in the base cost estimate and $65 Million (7%) for cost growth potential due to risk analyzed in the baseline schedule.
Walla Walla Cost Dx performed risk analysis using the Monte Carlo technique, producing the aforementioned contingencies and identifying key risk drivers.
The following table ES-1 portrays the development of contingencies (26%). The contingency is based on an 80% confidence level, as per USACE Civil Works guidance.
Table ES-1. Contingency Analysis Table
Most Likely Cost Estimate $1,387,078,819
Confidence Level Value ($$) Contingency (%) 5% $1,011,329,628
6.62%
50% $1,129,751,928
19.11%
80% $1,193,932,836
25.87%
95% $1,252,332,843
32.03%
The following table ES-2 portrays the full costs of the recommended alternative based on the anticipated contracts. The costs are intended to address the congressional request of estimates to implement the project. The contingency is based on an 80% confidence level, as per accepted USACE Civil Works guidance.
USACE-MVP-0000087977

Table ES-2. Cost Summary FARGO-MOORHEAD NED COST CNTG TOTAL
($1,000) ($1,000) ($1,000)
01 LANDS AND DAMAGES 54,782 14,173 68,956
02 RELOCATIONS 84,956 21,980 106,936
06 FISH AND WILDLIFE FACILITIES 11,560 2,991 14,551
08 ROADS, RAILROADS, AND BRIDGES 127,294 32,933 160,228
09 CHANNELS AND CANALS 469,968 121,590 591,558
11 LEVEES AND FLOODWALLS 19,635 5,080 24,715
14 RECREATION FACILITIES 19,206 4,969 24,175
30 PLANNING, ENGINEERING AND DESIGN 109,859 28,423 138,282
31 CONSTRUCTION MANAGEMENT 51,268 13,264 64,532
TOTAL PROJECT COSTS 948,530 245,403 1,193,933
Schedule Completion with Contingency 11 Jan 2018 105 months 4 Oct 2026 Notes:
1) Costs include the recommended contingency of 26%. 2) Costs exclude O&M and Life Cycle Cost estimates.
KEY FINDINGS/OBSERVATIONS RECOMMENDATIONS
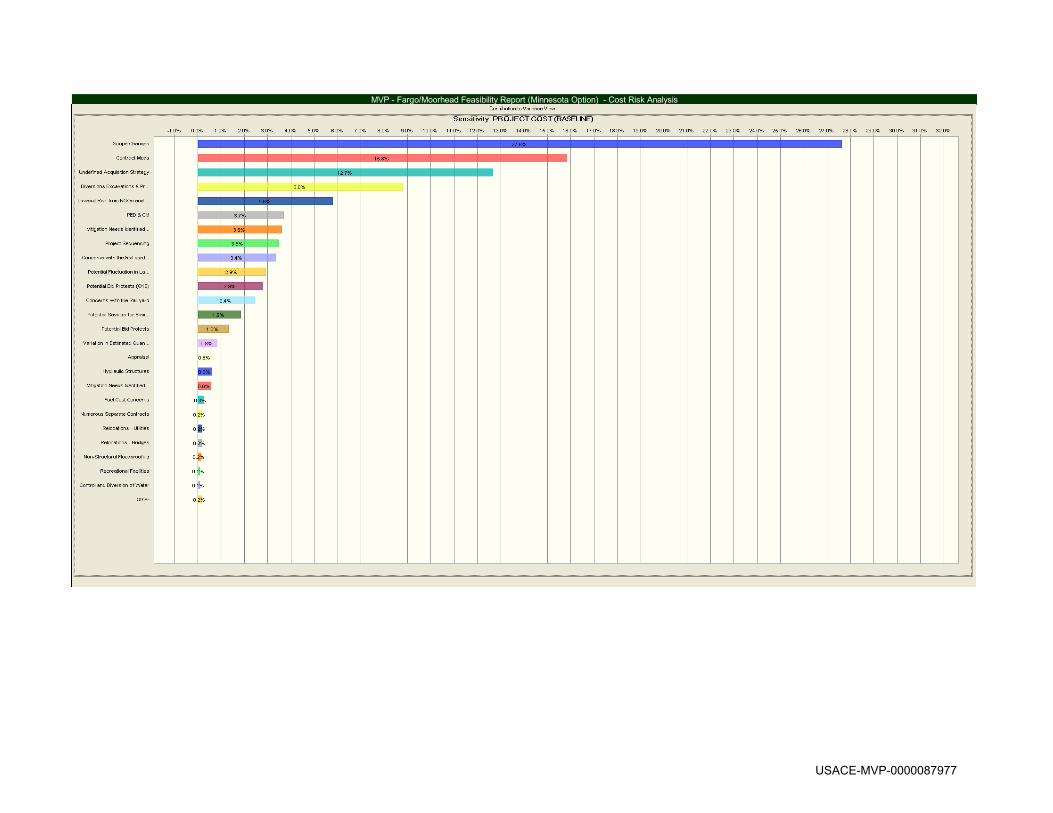
The key cost risk drivers identified through sensitivity analysis were Risks PPM-8 (Scope Changes), CON-6 (Contract Modifications), and CA-1 (Undefined Acquisition Strategy), which together contribute over 56 percent of the statistical cost variance. PPM-8 captures the risk that changes to scope, as required by stakeholders, may increase the cost of the project. CON-6 captures the risk that there may be cost growth due to post-award modifications to the contracts due to differing site conditions, engineering changes, and/or claims. CA-1 captures the risk that not having a fully developed contract acquisition strategy may result in cost growth. The key schedule risk drivers identified through sensitivity analysis were Risk PR-1 (Uncertainty with Funding Stream), and PR-5 (Political Factors Change at State, Local, or Federal level), which together contribute over 78 percent of the statistical schedule variance. PR-1 covers the risk that delay in obtaining necessary funding increments my significantly delay the project. PR-5 captures the risk that political factors could change project support and scope, delaying the overall project implementation. Recommendations, as detailed within the main report, include the implementation of cost and schedule contingencies, further iterative study of risks throughout the project life-cycle, potential mitigation throughout the PED phase, and proactive monitoring and control of risk identified in this study.
USACE-MVP-0000087977

MAIN REPORT
1.0 PURPOSE Under the auspices of the US Army Corps of Engineers (USACE), St. Paul District, this report presents a recommendation for the project cost and schedule contingencies for the Fargo-Moorhead Metro Flood Risk Management Project, Feasibility Study, Phase 4 Locally Preferred Plan (NED) – North Dakota Option (Fargo-Moorhead FRM NED). 2.0 BACKGROUND
The purpose of the Fargo-Moorhead Feasibility Study is to identify measures and develop a regional system to reduce flood risk along the Red River of the North for the entire Fargo-Moorhead metropolitan area. The study PDT collected, evaluated and screened an array of possible flood risk management plans to define the costs, benefits and impacts to the project area. The plans resulted in a diversion channel alternative as the best measures to reduce the flood risk. A diversion through Minnesota around the city of Moorhead offered the plan with the lowest cost having a B/C ratio over one. The local sponsors preferred a diversion alternative through North Dakota around the city of Fargo as a locally preferred plan. The PDT has developed plans and estimates for both the National Economic Development (NED) - Minnesota Plan and the NED – North Dakota plan. St. Paul District is preparing a Feasibility Report. As a part of this effort, St. Paul District requested that the USACE Cost Engineering Directory of Expertise for Civil Works (Cost Engineering Dx) provide an agency technical review (ATR) of the cost estimate and schedule for LRR. That tasking also included providing a risk analysis study to establish the resulting contingencies. 3.0 REPORT SCOPE
The scope of the risk analysis report is to calculate and present the cost and schedule contingencies at the 80 percent confidence level using the risk analysis processes, as mandated by U.S. Army Corps of Engineers (USACE) Engineer Regulation (ER) 1110-2-1150, Engineering and Design for Civil Works, ER 1110-2-1302, Civil Works Cost Engineering, and Engineer Technical Letter 1110-2-573, Construction Cost Estimating Guide for Civil Works. The report presents the contingency results for cost risks for all project features. The study and presentation does not include consideration for life cycle costs.
USACE-MVP-0000087977

3.1 Project Scope The formal process included extensive involvement of the PDT for risk identification and the development of the risk register. The analysis process evaluated the most likely Micro Computer Aided Cost Estimating System (MCACES) cost estimate, schedule, and funding profiles using Crystal Ball software to conduct a Monte Carlo simulation and statistical sensitivity analysis, per the guidance in Engineer Technical Letter (ETL) CONSTRUCTION COST ESTIMATING GUIDE FOR CIVIL WORKS, dated September 30, 2008.
The project technical scope, estimates and schedules were developed and presented by the St. Paul District. Consequently, these documents serve as the basis for the risk analysis.
The scope of this study addresses the identification of problems, needs, opportunities and potential solutions that are viable from an economic, environmental, and engineering viewpoint.
3.2 USACE Risk Analysis Process The risk analysis process for this study follows the USACE Headquarters requirements as well as the guidance provided by the Cost Engineering Dx. The risk analysis process reflected within this report uses probabilistic cost and schedule risk analysis methods within the framework of the Crystal Ball software. Furthermore, the scope of the report includes the identification and communication of important steps, logic, key assumptions, limitations, and decisions to help ensure that risk analysis results can be appropriately interpreted. Risk analysis results are also intended to provide project leadership with contingency information for scheduling, budgeting, and project control purposes, as well as to provide tools to support decision making and risk management as the project progresses through planning and implementation. To fully recognize its benefits, cost and schedule risk analysis should be considered as an ongoing process conducted concurrent to, and iteratively with, other important project processes such as scope and execution plan development, resource planning, procurement planning, cost estimating, budgeting and scheduling. In addition to broadly defined risk analysis standards and recommended practices, this risk analysis was performed to meet the requirements and recommendations of the following documents and sources:
• Cost and Schedule Risk Analysis Process guidance prepared by the USACE Cost Engineering Dx.
USACE-MVP-0000087977

• Engineer Regulation (ER) 1110-2-1302 CIVIL WORKS COST ENGINEERING, dated September 15, 2008.
• Engineer Technical Letter (ETL) CONSTRUCTION COST ESTIMATING GUIDE
FOR CIVIL WORKS, dated September 30, 2008.
4.0 METHODOLOGY / PROCESS
The Cost Engineering Dx assembled a team, also relying on local St. Paul District staff to further augment labor, expertise and information gathering. The Cost Engineering Dx team consisted of one senior civil cost engineer. The Cost Engineering Dx cost engineer facilitated a risk identification meeting on site with the St. Paul PDT on January 7, 2010. The initial risk identification meeting also included qualitative analysis to produce a risk register that served as the framework for the risk analysis. The cost and schedule risk models were completed and results reported on January 29, 2010. Several subsequent revisions to the estimates and risk analyses took place between January 29, 2010 and April 17, 2011. The final results were reported on April 17, 2011. The risk analysis process for this study is intended to determine the probability of various cost outcomes and quantify the required contingency needed in the cost estimate to achieve any desired level of cost confidence. In simple terms, contingency is an amount added to an estimate to allow for items, conditions or events for which the occurrence or impact is uncertain and that experience suggests will likely result in additional costs being incurred or additional time being required. The amount of contingency included in project control plans depends, at least in part, on the project leadership’s willingness to accept risk of project overruns. The less risk that project leadership is willing to accept the more contingency should be applied in the project control plans. The risk of overrun is expressed, in a probabilistic context, using confidence levels. The Cost Dx guidance for cost and schedule risk analysis generally focuses on the 80-percent level of confidence (P80) for cost contingency calculation. It should be noted that use of P80 as a decision criteria is a risk averse approach (whereas the use of P50 would be a risk neutral approach, and use of levels less than 50 percent would be risk seeking). Thus, a P80 confidence level results in greater contingency as compared to a P50 confidence level. The selection of contingency at a particular confidence level is ultimately the decision and responsibility of the project’s District and/or Division management.
USACE-MVP-0000087977

The risk analysis process uses Monte Carlo techniques to determine probabilities and contingency. The Monte Carlo techniques are facilitated computationally by a commercially available risk analysis software package (Crystal Ball) that is an add-in to Microsoft Excel. Cost estimates are packaged into an Excel format and used directly for cost risk analysis purposes. The level of detail recreated in the Excel-format schedule is sufficient for risk analysis purposes that reflect the established risk register, but generally less than that of the native format. The primary steps, in functional terms, of the risk analysis process are described in the following subsections. Risk analysis results are provided in Section 6. 4.1 Identify and Assess Risk Factors
Identifying the risk factors via the PDT is considered a qualitative process that results in establishing a risk register that serves as the document for the quantitative study using the Crystal Ball risk software. Risk factors are events and conditions that may influence or drive uncertainty in project performance. They may be inherent characteristics or conditions of the project or external influences, events, or conditions such as weather or economic conditions. Risk factors may have either favorable or unfavorable impacts on project cost and schedule.
Formal PDT meetings were held for the purposes of identifying and assessing risk factors. The formal meeting conducted on January 7, 2010 included representatives from plan formulation, project management, geotechnical and hydraulic design, cost engineering, construction, environmental compliance, real estate, and the project sponsors.
The initial formal meetings focused primarily on risk factor identification using brainstorming techniques, but also included some facilitated discussions based on risk factors common to projects of similar scope and geographic location. Subsequent meetings focused primarily on risk factor assessment and quantification.
Additionally, numerous conference calls and informal meetings were conducted throughout the risk analysis process on an as-needed basis to further facilitate risk factor identification, market analysis, and risk assessment. 4.2 Quantify Risk Factor Impacts The quantitative impacts of risk factors on project plans were analyzed using a combination of professional judgment, empirical data and analytical techniques. Risk factor impacts were quantified using probability distributions (density functions) because risk factors are entered into the Crystal Ball software in the form of probability density functions.
USACE-MVP-0000087977

Similar to the identification and assessment process, risk factor quantification involved multiple project team disciplines and functions. However, the quantification process relied more extensively on collaboration between cost engineering and risk analysis team members with lesser inputs from other functions and disciplines. This process used an iterative approach to estimate the following elements of each risk factor:
• Maximum possible value for the risk factor • Minimum possible value for the risk factor • Most likely value (the statistical mode), if applicable • Nature of the probability density function used to approximate risk factor
uncertainty • Mathematical correlations between risk factors • Affected cost estimate and schedule elements
The resulting product from the PDT discussions is captured within a risk register as presented in section 6 for both cost and schedule risk concerns. Note that the risk register records the PDT’s risk concerns, discussions related to those concerns, and potential impacts to the current cost and schedule estimates. The concerns and discussions support the team’s decisions related to event likelihood, impact, and the resulting risk levels for each risk event.
4.3 Analyze Cost Estimate and Schedule Contingency
Contingency is analyzed using the Crystal Ball software, an add-in to the Microsoft Excel format of the cost estimate and schedule. Monte Carlo simulations are performed by applying the risk factors (quantified as probability density functions) to the appropriate estimated cost and schedule elements identified by the PDT. Contingencies are calculated by applying only the moderate and high level risks identified for each option (i.e., low-level risks are typically not considered, but remain within the risk register to serve historical purposes as well as support follow-on risk studies as the project and risks evolve).
For the cost estimate, the contingency is calculated as the difference between the P80 cost forecast and the baseline cost estimate. Each option-specific contingency is then allocated on a civil works feature level based on the dollar-weighted relative risk of each feature as quantified by Monte Carlo simulation. Standard deviation is used as the feature-specific measure of risk for contingency allocation purposes. This approach results in a relatively larger portion of all the project feature cost contingency being allocated to features with relatively higher estimated cost uncertainty.
USACE-MVP-0000087977

5.0 PROJECT ASSUMPTIONS
The following data sources and assumptions were used in quantifying the costs associated with the Fargo-Moorhead NED project.
a. The St. Paul District provided MII MCACES (Micro-Computer Aided Cost Estimating Software) files via email. The file title, “MVP FCP_MN_Diversion_Phase_4 with 2009 Equip Rate.mlp” was the basis for the cost and schedule risk analyses.
b. The cost comparisons and risk analyses performed and reflected within this report are based on design scope and estimates that are at the feasibility level.
c. Schedules are analyzed for impact to the project cost in terms of both uncaptured escalation (variance from OMB factors and the local market) and unavoidable fixed contract costs and/or languishing federal administration costs incurred throughout delay.
d. Per the CWCCIS Historical State Adjustment Factors in EM 1110-2-1304, State Adjustment Factors for Minnesota and North Dakota are 1.15 and 0.92, respectively. Taking this into account along with the historical RS Means labor inflation rate and Consumer Price Index (CPI) factor for Minnesota, the average suggests that true inflation is approximately 4.55% higher for the Fargo Metro area than for the national average. This rate was used to calculate the differential between the local market and OMB inflation factors for future construction. For the P80 schedule, this is approximately 1.34% of the contingency.
e. Per the data in the estimate, the Job Office Overhead (JOOH) amount comprises approximately 5% of the Project Cost at Baseline. Thus, the assumed residual fixed cost rate for this project is 5%. For the P80 schedule, this comprises approximately 5.49% of the total contingency due to the accrual of residual fixed costs associated with delay.
f. The Cost Dx guidance generally focuses on the eighty-percent level of confidence (P80) for cost contingency calculation. For this risk analysis, the eighty-percent level of confidence (P80) was used. It should be noted that the use of P80 as a decision criteria is a moderately risk averse approach, generally resulting in higher cost contingencies. However, the P80 level of confidence also assumes a small degree of risk that the recommended contingencies may be inadequate to capture actual project costs.
g. Only high and moderate risk level impacts, as identified in the risk register, were considered for the purposes of calculating cost contingency. Low level risk impacts should be maintained in project management documentation, and reviewed at each project milestone to determine if they should be placed on the risk “watch list”.
USACE-MVP-0000087977

6.0 RESULTS
The cost and schedule risk analysis results are provided in the following sections. In addition to contingency calculation results, sensitivity analyses are presented to provide decision makers with an understanding of variability and the key contributors to the cause of this variability. 6.1 Risk Register
A risk register is a tool commonly used in project planning and risk analysis. The actual risk register is provided in Appendix A. The complete risk register includes low level risks, as well as additional information regarding the nature and impacts of each risk.
It is important to note that a risk register can be an effective tool for managing identified risks throughout the project life cycle. As such, it is generally recommended that risk registers be updated as the designs, cost estimates, and schedule are further refined, especially on large projects with extended schedules. Recommended uses of the risk register going forward include:
• Documenting risk mitigation strategies being pursued in response to the identified risks and their assessment in terms of probability and impact.
• Providing project sponsors, stakeholders, and leadership/management with a documented framework from which risk status can be reported in the context of project controls.
• Communicating risk management issues. • Providing a mechanism for eliciting feedback and project control input. • Identifying risk transfer, elimination, or mitigation actions required for
implementation of risk management plans. 6.2 Cost Contingency and Sensitivity Analysis
Table 1 provides the construction cost contingencies calculated for the P80 confidence level and rounded to the nearest thousand. The construction cost contingencies for the P50 and P100 confidence levels are also provided for illustrative purposes only.
Contingency was quantified as approximately $245 Million at the P80 confidence level (26% of the baseline cost estimate). For comparison, the cost contingency at the P50 and P100 confidence levels was quantified as 19% and 49% of the baseline cost estimate, respectively.
USACE-MVP-0000087977

Table 1. Project Cost Contingency Summary
Risk Analysis Forecast Baseline Estimate Total Contingency1,2 ($)
Total Contingency (%)
50% Confidence Level Project Cost $1,129,751,928 $181,221,713 19.11%
80% Confidence Level Project Cost $1,193,932,836 $245,402,622 25.87%
100% Confidence Level Project Cost $1,414,017,542 $465,487,327 49.07%
Notes: 1) These figures combine uncertainty in the baseline cost estimates and schedule. 2) A P100 confidence level is an abstract concept for illustration only, as the nature of risk and uncertainty (specifically the presence of “unknown unknowns”) makes 100% confidence a theoretical impossibility.
6.2.1 Sensitivity Analysis Sensitivity analysis generally ranks the relative impact of each risk/opportunity as a percentage of total cost uncertainty. The Crystal Ball software uses a statistical measure (contribution to variance) that approximates the impact of each risk/opportunity contributing to variability of cost outcomes during Monte Carlo simulation. Key cost drivers identified in the sensitivity analysis can be used to support development of a risk management plan that will facilitate control of risk factors and their potential impacts throughout the project lifecycle. Together with the risk register, sensitivity analysis results can also be used to support development of strategies to eliminate, mitigate, accept or transfer key risks. 6.2.2 Sensitivity Analysis Results The risks/opportunities considered as key or primary cost drivers are ranked in order of importance in contribution to variance bar charts. Opportunities that have a potential to reduce project cost and are shown with a negative sign; risks are shown with a positive sign to reflect the potential to increase project cost. A longer bar in the sensitivity analysis chart represents a greater potential impact to project cost. Figure 1 presents a sensitivity analysis for cost growth risk from the high level cost risks identified in the risk register. Likewise, Figure 2 presents a sensitivity analysis for schedule growth risk from the high level schedule risks identified in the risk register.
USACE-MVP-0000087977

6.3 Schedule and Contingency Risk Analysis Table 2 provides the schedule duration contingencies calculated for the P80 confidence level. The schedule duration contingencies for the P50 and P100 confidence levels are also provided for illustrative purposes. Schedule duration contingency was quantified as 96 months based on the P80 level of confidence. These contingencies were used to calculate the projected residual fixed cost impact of project delays that are included in the Table 1 presentation of total cost contingency. The schedule contingencies were calculated by applying the high level schedule risks identified in the risk register for each option to the durations of critical path and near critical path tasks. The schedule was not resource loaded and contained open-ended tasks and non-zero lags (gaps in the logic between tasks) that limit the overall utility of the schedule risk analysis. These issues should be considered as limitations in the utility of the schedule contingency data presented. Schedule contingency impacts presented in this analysis are based solely on projected residual fixed costs. Table 2. Schedule Duration Contingency Summary
Risk Analysis Forecast
Baseline Schedule Duration (months)
Contingency1 (months)
50% Confidence Level Project Duration 96 78
80% Confidence Level Project Duration 96 105
100% Confidence Level Project Duration 96 171
Notes: 1) The schedule was not resource loaded and contained open-ended tasks and non-zero lags (gaps in the logic between tasks) that limit the overall utility of the schedule risk analysis. These issues should be considered as limitations in the utility of the schedule contingency data presented in Table 2. 2) A P100 confidence level is an abstract concept for illustration only, as the nature of risk and uncertainty (specifically the presence of “unknown unknowns”) makes 100% confidence a theoretical impossibility.
USACE-MVP-0000087977

Figure 1. Cost Sensitivity Analysis
USACE-MVP-0000087977

Figure 2. Schedule Sensitivity Analysis
USACE-MVP-0000087977

7.0 MAJOR FINDINGS/OBSERVATIONS/RECOMMENDATIONS
This section provides a summary of significant risk analysis results that are identified in the preceding sections of the report. Risk analysis results are intended to provide project leadership with contingency information for scheduling, budgeting, and project control purposes, as well as to provide tools to support decision making and risk management as projects progress through planning and implementation. Because of the potential for use of risk analysis results for such diverse purposes, this section also reiterates and highlights important steps, logic, key assumptions, limitations, and decisions to help ensure that the risk analysis results are appropriately interpreted. 7.1 Major Findings/Observations Project cost comparison summaries are provided in Table 3 and Figure 3. Additional major findings and observations of the risk analysis are listed below.
1. The key cost risk drivers identified through sensitivity analysis were Risks PPM-8 (Scope Changes), CON-6 (Contract Modifications), and CA-1 (Undefined Acquisition Strategy), which together contribute over 56 percent of the statistical cost variance.
2. The key schedule risk drivers identified through sensitivity analysis were Risk
PR-1 (Uncertainty with Funding Stream), and PR-5 (Political Factors Change at State, Local, or Federal level), which together contribute over 78 percent of the statistical schedule variance.
3. Operation and maintenance activities were not included in the cost estimate or
schedules. Therefore, a full lifecycle risk analysis could not be performed. Risk analysis results or conclusions could be significantly different if the necessary operation and maintenance activities were included.
USACE-MVP-0000087977

Table 3. Project Cost Comparison Summary
Confidence Level
Project Cost ($)
Contingency (%)
P0 $887,943,310 -6.39%
P5 $1,011,329,628 6.62%
P10 $1,035,273,666 9.15%
P15 $1,051,942,210 10.90%
P20 $1,065,481,512 12.33%
P25 $1,078,099,735 13.66%
P30 $1,089,103,081 14.82%
P35 $1,099,626,512 15.93%
P40 $1,109,631,700 16.98%
P45 $1,119,542,602 18.03%
P50 $1,129,751,928 19.11%
P55 $1,139,446,444 20.13%
P60 $1,149,883,372 21.23%
P65 $1,159,801,199 22.27%
P70 $1,170,131,865 23.36%
P75 $1,181,672,791 24.58%
P80 $1,193,932,836 25.87%
P85 $1,207,714,410 27.32%
P90 $1,226,509,041 29.31%
P95 $1,252,332,843 32.03%
P100 $1,414,017,542 49.07%
USACE-MVP-0000087977

Figure 3. Project Cost Summary
USACE-MVP-0000087977

Figure 4. Project Duration Summary
USACE-MVP-0000087977

7.2 Recommendations Risk Management is an all-encompassing, iterative, and life-cycle process of project management. The Project Management Institute’s (PMI) A Guide to the Project Management Body of Knowledge (PMBOK® Guide), 4th edition, states that “project risk management includes the processes concerned with conducting risk management planning, identification, analysis, responses, and monitoring and control on a project.” Risk identification and analysis are processes within the knowledge area of risk management. Its outputs pertinent to this effort include the risk register, risk quantification (risk analysis model), contingency report, and the sensitivity analysis. The intended use of these outputs is implementation by the project leadership with respect to risk responses (such as mitigation) and risk monitoring and control. In short, the effectiveness of the project risk management effort requires that the proactive management of risks not conclude with the study completed in this report. The Cost and Schedule Risk Analysis (CSRA) produced by the PDT identifies issues that require the development of subsequent risk response and mitigation plans. This section provides a list of recommendations for continued management of the risks identified and analyzed in this study. Note that this list is not all inclusive and should not substitute a formal risk management and response plan. 1. Key Cost Risk Drivers: The key cost risk drivers identified through sensitivity analysis were Risks PPM-8 (Scope Changes), CON-6 (Contract Modifications), and CA-1 (Undefined Acquisition Strategy), which together contribute over 56 percent of the statistical cost variance.
a) Scope Changes: Project leadership should attempt to capture and finalize the scope of the project to the maximum extent possible. It is imperative to identify all features of work and probable methodologies, along with the accompanying risks associated with implementation. Iterative quantification (risk analysis) may be necessary to further develop and pinpoint sources of risk to identify needs for risk treatment in the risk response and management plan.
b) Contract Modifications: Project leadership should attempt to capture and finalize the scope of the project to the maximum extent possible. It is imperative to identify all features of work and probable methodologies, along with the accompanying risks associated with implementation. Iterative quantification (risk analysis) may be necessary to further develop and pinpoint sources of risk to identify needs for risk treatment in the risk response and management plan. Additionally, project leadership should determine acquisition strategy and make decisions early to impact the completion of contract documents as to minimize risk of engineering changes and potential claims.
USACE-MVP-0000087977

c) Undefined Acquisition Strategy: Project leadership should take proactive measures to obtain decisions regarding acquisition strategy, as well as communication to management regarding the impact of those decisions on cost performance. Project leadership should develop the acquisition strategy to maximize competition and cost control, and so that current working estimates can capture the probable costs.
2. Key Schedule Risk Drivers: The key schedule risk drivers identified through sensitivity analysis were Risk PR-1 (Uncertainty with Funding Stream), and PR-5 (Political Factors Change at State, Local, or Federal level), which together contribute over 78 percent of the statistical schedule variance.
a) Uncertainty with Funding Stream: Project leadership should project leadership proactively develop accurate funding profile projections to capture probable funding requirements. Ultimately, this is an external risk, and its impacts must be communicated to management.
b) Political Factors Change at State, Local, or Federal level: Project leadership should attempt to communicate and coordinate effectively with District management and the other involved project partners and sponsors. Ultimately, this is an external risk, and its impacts must be communicated to management, and funds should be maintained in project reserve for treatment of this risk.
3. Risk Management: Project leadership should use of the outputs created during the risk analysis effort as tools in future risk management processes. The risk register should be updated at each major project milestone. The results of the sensitivity analysis may also be used for response planning strategy and development. These tools should be used in conjunction with regular risk review meetings. 4. Risk Analysis Updates: Project leadership should review risk items identified in the original risk register and add others, as required, throughout the project life-cycle. Risks should be reviewed for status and reevaluation (using qualitative measure, at a minimum) and placed on risk management watch lists if any risk’s likelihood or impact significantly increases. Project leadership should also be mindful of the potential for secondary (new risks created specifically by the response to an original risk) and residual risks (risks that remain and have unintended impact following response).
USACE-MVP-0000087977

APPENDIX A
USACE-MVP-0000087977

Overall Project Scope
Cost Impacts
For the Fargo/Moorhead Project, any cost impact of $10 Million or higher should be considered at least "Significant."
Anything over $5 Million should be considered at least "Marginal."
Schedule Impacts
For the Fargo/Moorhead Project, any schedule impact of 12 months or greater should be considered at least "Significant."
Anything over 6 months should be considered at least "Marginal."
PDT Discussions & Conclusions Likelihood* Impact* Risk Level*Rough Order
Impact ($) Likelihood* Impact* Risk Level*Rough Order Impact (mo)
Correlation to Other(s)
PROJECT & PROGRAM MGMT
PPM-1 Project Schedule Accuracy
Due to the large project size, complexity and sequencing, actual milestones may be different than the current forecast schedule being
planned.This could cause a variance in the project schedule (positive or negative, but most likely negative). Likely Significant High Likely Marginal Moderate Uniform Project Manager Project Cost & Schedule
PPM-2Accelerated Design Schedule
An accelerated schedule can result in inadequate studies, shortcuts in plans, change in contract acquisition strategy, failure to capture full
scope, miss-steps, etc. There is the potential of moving forward with limited information.
An accelerated design schedule could impact the whole project design if there is not enough time to fully plan.
This could impact both cost and schedule. Likely Significant High Likely Significant High Triangular District Management Project Cost & Schedule
PM-3Accelerated Construction Schedule
The need for physical progress on the ground supports construction acceleration as much as practical. Acceleration comes in the form of
concurrent construction activities, added overtime costs, perdiem costs, possible contractor conflicts, congested work areas, poorly developed contracts resulting in more modifications and claims. This could impact cost and schedule Likely Marginal Moderate Likely Significant High Triangular District Management Project Cost & Schedule
PPM-4Local Agency/Regulator Issues
The acceleration of the planning schedule has forced reviews and collaboration without much time given to local agencies and
regulators.
This could impact cost and schedule. There is however about two years before construction starts to resolve
issues. Unlikely Negligible Low Unlikely Marginal Low Yes-No Project Manager Project Cost & Schedule
PPM-7 Conflicting Priorities
The District's workload and competing priorities may impede progress on this project related to staff availability and experience, related to
design, investigations, contract procurements, construction management.
Since the identity of this concern, the F-M project has been identified as a high priority regional project , and
barring a major national disater the F-M project will have all the resources it should need. Unlikely to cause cause
any variance in the cost or schedule. Unlikely Negligible Low Unlikely Negligible Low Uniform District Management Project Schedule
PPM-8 Scope Changes
The many competing interests & priorities, coupled with an accelerated schedule could result in scope changes currently
uncaptured or unanticipated. These scope changes would require additional coordination, cause further design and investigation and
potentially impact the real estate acquisitions.While minor alterations to the final alignment may occur,
there should not be any major changes. Likely Marginal Moderate Likely Significant High Yes-No Project Manager Project Cost & Schedule
MVP - Fargo/Moorhead Feasibility Report (FCP - Minnesota Option) - PDT Risk Register
Concerns
Contract Risks (Internal Risk Items are those that are generated, caused, or controlled within the PDT's sphere of influence.)
Risk No. Risk/Opportunity EventVariance
Distribution
Project Cost Project Schedule
The Fargo-Moorhead Feasibility Study purpose is to identify measures and develop a regional system to reduce flood risk along the Red River of the North for the entire F-M metroploitan area. The study PDT collected, evaluated and screened an array of possible flood risk management plans to define the costs, benefits and impacts to the project area. The plans resulted in a diversion channel alternative as the best measures to reduce the flood risk. A diversion through Minnesota around the city of Moorhead offered the plan with the lowest cost having a B/C ratio over one. The local sponsors preferred a diversion alternative through North Dakota around the city of Fargo as a locally preferred plan. The PDT has developed plans and estimates for both the MN Plan and the LPP ND plan.
Affected Project ComponentResponsibility/POC
VeryLikely Low Moderate High High High
Likely Low Moderate High High High
Unlikely Low Low Moderate Moderate High
VeryUnlikely Low Low Low Low High
Negligible Marginal Significant Critical Crisis
Impact or Consequence of Occurrence
Like
lihoo
d of
Occ
urre
nce
Risk Level
USACE-MVP-0000087977

PDT Discussions & Conclusions Likelihood* Impact* Risk Level*Rough Order
Impact ($) Likelihood* Impact* Risk Level*Rough Order Impact (mo)
Correlation to Other(s)Concerns
Risk No. Risk/Opportunity EventVariance
Distribution
Project Cost Project Schedule
Affected Project ComponentResponsibility/POC
CONTRACT ACQUISITION RISKS
CA-1Undefined Acquisition Strategy
The overall acquisition strategy for both design and construction has not been defined. Acquisition strategy could affect/impact bid
competition and bid costs. It can also move risk onto the Government, causing need for greater contingencies. Clarification should be made related to number of contracts, contract types, etc.
authority for this procurement.Acquisition stratagy needs to be defined and could
impact the cost and schedule. Likely Marginal Moderate Unlikely Marginal Low Triangular TASBContract Cost & Project
Schedule
CA-2Preference to Small Business
Most of the larger requirements are so large that they would not be suitable for small business. However, there is potential for some of
the restoration, seeding, and mitigation may be suitable for small business. There is a requirement for review by the PARC if the
requirements were less than $50 Million.
The project is so large, it is likely that even separable requirements would not be suitable for small business.
Could impact cost and schedule. Unlikely Marginal Low Unlikely Marginal Low Triangular ContractingContract Cost & Project
Schedule
CA-3Numerous Separate Contracts
There is potential to have numerous separate contracts, especially if the continuing contracts authority is not granted. Funding stream
issues could also have an impact on the number of contracts. Lack of planning or forsight could result in change of plans, scecs and reactive
acquisition.
The best case would be 6 contracts. The worst case would be in excess of 10 contracts. More contracts
could increase bidding competition. This could have a significant effect on cost and schedule (either positive or
negative). Very Likely Significant High Unlikely Marginal Low Triangular Contracting Contract Cost
CA-4 Potential Bid Protests
The larger size of the project increase contractor interests in bidding, but also increases potntial risk for protets due to hungry economy and
interest in obtaining project dollars. This could impact cost and schedule. Likely Marginal Moderate Likely Marginal Moderate Yes-No District Management Project Cost & Schedule
CA-5 Contracting Staff shortagesContracting is experiencing a lack of staffing, causing challenges in
obtaining resources on a timely basis for all procurements.
Could cause a variance in the schedule, though by the time procuremenrts are needed for construction, staffing
issues could be resovled. Unlikely Marginal Low Unlikely Marginal Low Uniform District Management Project Schedule
TECHNICAL RISKS
TL-1Uncertainty with Geotechnical Conditions
There is uncertainty with geotechnical conditions but the Phase 3 estimate uses recent borings from 2010 to help define the the soil
parameters for excavation and how that will impact the construction productivity. The material is all clay and silt.
The current working estimate is fairly conservative. However, variation in the ultimate characterization of
material could cause significant variance in productivity. Could impact cost and schedule (positive or negative). Likely Marginal Moderate Likely Marginal Moderate Triangular Geotechnical/Civil Design
Contract Cost & Project Schedule
TL-2 Survey Data IncompleteThe PDT currently has incomplete or outdated survey data (for
bathymetry for the Red River and Tributaries).
If the survey data uncovers data that differs greatly from current conceptual design, it could lead to variance in
cost (due to issues such as configuration and details for structures). Unlikely Marginal Low Unlikely Negligible Low Triangular Technical Lead
Contract Cost & Project Schedule
TL-3Hazardous Waste/HTRW Concerns
Due to the project footprint involving BNSF's rail yard, there is the possibility that HTRW or hazardous substances may be encountered.
There is the potential for contaminated and or petroleum based contamination, as well as other deleterious
substances. This would only impact schedule, as HTRW cleanup is not part of the project cost. Very Unlikely Negligible Low Likely Significant High Yes-No Geotechnical/Civil Design
Contract Cost & Project Schedule
TL-4Variation in Estimated Quantities
There is potential for variation of estimated quantities in the excavation and earthwork features. This could impact cost and schedule. Likely Significant High Likely Marginal Moderate Yes-No Hydrology/Hydraulic Design Contract Cost
TL-5 Flowrate Capacity
If during detailed design the hydraulics change, it could affect the amount of flow required for the diversion channel to handle. This
would affect channel width, bridge lengths and major hydraulic structure sizes This could impact Schedule Unlikely Marginal Low Likely Marginal Moderate Yes-No Hydrology/Hydraulic Design
Contract Cost & Project Schedule
TL-6 Relocations - Utilities Quality of design at budget levelMost costs were obtained from affected utilities for the
major lines that are impacted. Likely Marginal Moderate Unlikely Negligible Low Triangular Cost Engineering Contract Cost
TL-7 Relocations - Bridges Bridge costs will change depending on final diversion channel width Bridge costs from historical DOT costs are fairly reliable. Likely Marginal Moderate Unlikely Negligible Low Triangular Cost Engineering Contract Cost
TL-8 Mitigation fish, wetlands, forest, adaptive management issues
Resource agencies have not agreed to any particular features yet so there is the potential for additional
mitigation beyond what is proposed, though the Corps has laid out a well planned approach to mitigating the
issues Likely Significant High Likely Negligible Low Uniform Environmental Compliance Contract Cost
TL-9Diversions Excavations & Productivity
Excavations could be impacted by diversion alignment changes and/or model results
Impacts should only affect quantities of different soil layers Likely Marginal Moderate Likely Marginal Moderate Triangular Technical Lead Contract Cost
TL-10 Hydraulic Structures Hydraulic structures will need to be modeled Model results could change design concepts Likely Significant High Likely Marginal Moderate Triangular Technical LeadContract Cost & Project
Schedule
USACE-MVP-0000087977

PDT Discussions & Conclusions Likelihood* Impact* Risk Level*Rough Order
Impact ($) Likelihood* Impact* Risk Level*Rough Order Impact (mo)
Correlation to Other(s)Concerns
Risk No. Risk/Opportunity EventVariance
Distribution
Project Cost Project Schedule
Affected Project ComponentResponsibility/POC
TL-11 LeveesLevee heights and lengths could change depending on if upstream
staging is incorporatedThe FCP MN alternative is not likely to change to
incorporate upstream staging Unlikely Significant Moderate Unlikely Marginal Low Triangular Technical Lead Contract Cost
TL-12Non-Structural Floodproofing
Costs for downstream impacts could change when the effects of have been fully developed
This is dependent on the takings anaylsis which so far has indicated thaqt there is not a takings Likely Marginal Moderate Unlikely Marginal Low Triangular Technical Lead Contract Cost
TL-13 Recreational Facilities Feasibility is at conceptual designFnial designs could look different than Feasibility but
overall concepts should be similar Likely Marginal Moderate Unlikely Marginal Low Triangular Cost Engineering Contract Cost
TL-14 Fuel Cost Concerns Volatility in the price of fuel
Recent spikes in fuel could increase the cost of fule for the project. Conversely, if the world markets calm down,
fuel could return to a price lower that currently estimatesd in the project. Likely Significant High Unlikely Marginal Low Triangular Cost Engineering Contract Cost
LANDS AND DAMAGES RISKS
LD-1 Concerns with the Rail yard
The alignment currently goes through a BNSF rail yard. Due to the complication of working in an active rail yard, with the requirement of
bridge construction/relocation/or reconfiguration could present significant challenges.
The real risk is obtaining agreement from the railroad on the exact configuration of the rail yard crossing. Cost
estimate from RR at feasibility level. Could impact cost or schedule. Likely Crisis High Unlikely Critical Moderate Yes-No Project Manager Project Cost & Schedule
LD-2Mitigation Needs Identified for Downstream Impacts
The effects of the project on areas downstream may require mitigation footprint that has not been finalized. The impacts are not fully
captured, and a determination has to be made as to whether a "taking" will be required.
The PDT feels that a "taking" is unlikely. This could significantly impact costs if there is a taking, and it could
significantly impact schedule. Unlikely Significant Moderate Unlikely Significant Moderate Yes-No Real Estate Project Cost & Schedule
LD-3Potential Savings for Eliminating RR Bridge 1
Currently, the BNSF RR haslimited use of this line and indicated that abandonement is possible This could save the cost of bridge and track raise Unlikely Significant Moderate Very Unlikely Negligible Low Yes-No Project Manager Project Cost & Schedule
LD-4 Appraisal
Appraisals carry certain assumptions based on technical information. If the techncial information has the potential to change, the appraisals
could be impacted. Appraisals are using an average value Likely Significant High Likely Marginal Moderate Triangular Real Estate Project Cost
LD-5 Non-AppraisalReal Estate office is responsible for establishing contingencies. There
could be risks outside their domain that can still impact the costs. Real Estate office will be using the CSRA contingencies Likely Marginal Moderate Likely Marginal Moderate Triangular Real Estate Project Cost
LD-6 Labor to Process REThe estimated labor to manage and process the real estate needs
may not be properly estimated.Real Estate office has accounted for RE admin in the
estimate Unlikely Marginal Low Very Unlikely Negligible Low Triangular Real Estate Project Cost
REGULATORY AND ENVIRONMENTAL RISKS
RE-1Environmental Mitigation Feature Concerns
The PDT has estimated mitigation features for Phase 4 based on the expected impacts (to include construction and real estate).
This could impact the costs either positively or negatively. This item is more likely to vary on the low
side. Likely Marginal Moderate Very Unlikely Negligible Low Triangular Environmental Compliance Project Cost
RE-2Historical Cultural Resource Issues
There is potential to find cultural resources, particularly on the riverbanks. No cultural resource survey has been completed to date.
Mitigiation will probably be necessary. Could impact cost. Very Likely Marginal Moderate Unlikely Marginal Low Triangular Environmental Compliance Project Cost
RE-3 Fish Passage Issues
There will be fish passage requirement in the project, but the actual configuration has not been finalized/agreed upon by the local
agencies.
Could impact cost, however fish passage has been designed into the hydraulic structures so only minor
design refinements should be required. Unlikely Marginal Low Unlikely Negligible Low Triangular Technical Lead Project Cost
RE-4Pressure to Compress Permitting Activities
The local agencies perceive that they are being pressured through the project permitting process.
PDT has programmed this into the schedule, and the agencies are not constricted more than normal review
times. Very Unlikely Negligible Low Unlikely Negligible Low Uniform Environmental Compliance Project Cost & Schedule
RE-5 HTRW IssuesThere is some potential for discovery of HTRW in the project
alignment. Most of the alignment is through farmland.
Could impact cost and schedule. Since most of the project is through farmland there likely should not be any
major issues Unlikely Marginal Low Unlikely Negligible Low Uniform Environmental Compliance Project Cost & Schedule
USACE-MVP-0000087977

PDT Discussions & Conclusions Likelihood* Impact* Risk Level*Rough Order
Impact ($) Likelihood* Impact* Risk Level*Rough Order Impact (mo)
Correlation to Other(s)Concerns
Risk No. Risk/Opportunity EventVariance
Distribution
Project Cost Project Schedule
Affected Project ComponentResponsibility/POC
CONSTRUCTION RISKS
CON-1Unknown Residential Utility Conflicts
There is potential for the need to abandon some small residential utilities.
This could impact cost and schedule, but it would be negligible. Likely Negligible Low Unlikely Negligible Low Triangular Technical Lead
Contract Cost & Project Schedule
CON-2Control and Diversion of Water
Methodology of controlling water could be impacted by the sequencing and timing of relocation, the characterization of materials, or other
unknown impacts.
Could impact cost and schedule. This is more likely to affect cost from using larger pumping equipment or for
increased handling of water. Likely Marginal Moderate Unlikely Marginal Low Triangular Technical Lead Contract Cost
CON-3Conflicts between Contractors
There is potential for conflicts between multiple contractors working in the same footprint at the same time.
Could impact cost. However, careful planning of the construction scheduling and sequencing should be able
to avoid any major conflicts. Likely Negligible Low Unlikely Negligible Low Triangular ConstructionContract Cost & Project
Schedule
CON-4 Sufficient QA Staff to manage numerous contracts, mods and claimsED-C is well aware of QA staffing issues and is planning
accordingly Unlikely Marginal Low Unlikely Negligible Low Triangular ConstructionContract Cost & Project
Schedule
CON-5 Project Sequencingconflicts between contractors and schedule impacts (one contractor
waiting on another)Conficts may develop at reaches interface, building of
bridges or hydraulic structures Likely Significant High Likely Marginal Moderate Uniform ConstructionContract Cost & Project
Schedule
CON-6 Contract Mods
Contract mods and claims resulting from unforeseen site conditions, weather impacts, political and lawsuit impacts are a concern and can
impact both cost and schedule.Many of these concerns may be valid and impact the
project Likely Significant High Likely Negligible Low Triangular Construction Contract Cost
ESTIMATE AND SCHEDULE RISKS
EST-1Potential Fluctuation in Labor Costs
There is concern that the labor force required for this work could be a challenge, requiring off-site labor, per diem and premium pay, as well
as unique markups and multipliers for workers compensation and other factors.
Estimate currently has National Wage rates, which are higher than the local Davis-Bacon Wage Determination. The Estimate also includes $75/day for per diem. There is potential for savings, as the labor wage rate for North Dakota is cheaper than Minnesota. This could impact
costs either positively or negatively. Likely Significant High Very Unlikely Negligible Low Triangular Cost Engineering Contract Cost
EST-2WBS Elements - Estimate confidence
Certain WBS elements are better developed in scope and estimate than other scope areas. Some WBS elements may be more or less
conservative. Some elements have greater risk and resulting need for greater contingencies.
The major cost elements for the diversion excavation, hydraulic structures and bridges have been highly
developed for feasibility since they make up the bulk of the cost items. Environmental mitigation features are
less develop and more conceptual and likely will change. Real Estate may be another area of risk confidence Likely Marginal Moderate Likely Negligible Low Triangular Cost Engineering Project Cost & Schedule
EST-3 Estimate assumptions
The estimate assumptions may be flawed in certain cost areas related to scope, crews, productivity, material cost, markups, contingencies,
etc. This could result in a flawed budget development.
The estimate has been in development for enough time that scope, crews, productivety, matrerial costs and
markups are fairly well developed. Contingencies are from the CSRA Unlikely Marginal Low Likely Negligible Low Triangular Cost Engineering Project Cost & Schedule
EST-4 PED & CMThe estiamte currently uses 15% PED and 7% CM of the constrcution
cost.
With the high construction cost of this project and the amount of design required for excavation, these
percentages may be too high, based on about 16% for the $410M Grand Forks/East Grand Forks Flood project
which was more urban levees & floodwalls. Likely Significant High Unlikely Negligible Low Triangular Cost Engineering Project Cost
USACE-MVP-0000087977

PDT Discussions & Conclusions Likelihood* Impact* Risk Level*Rough Order
Impact ($) Likelihood* Impact* Risk Level*Rough Order Impact (mo)
Correlation to Other(s)Concerns
Risk No. Risk/Opportunity EventVariance
Distribution
Project Cost Project Schedule
Affected Project ComponentResponsibility/POC
PR-1Uncertainty with Funding Stream
There is a window of opportunity during the next couple years of obtaining the necessary increments on a timely basis. However, historically this has been a challenge in obtaining the increments
necessary to complete on schedule, and there have been challenges in obtaining them on a timely basis. This could impact both cost and schedule. Very Likely Significant High Very Likely Significant High Uniform Project Manager Project Cost & Schedule
PR-2 Unusually Wet SeasonIf a given construction season is unusually higher than an average
year, it could have significant impact on the productivity of the work.If this it occurs, it reduce productivity and create
substantial delays. Unlikely Marginal Low Unlikely Marginal Low Binomial N/A Project Cost & Schedule
PR-3 Flooding EventThere is a chance of a flooding event during construction that could
cause damage to constructed work features.
This could impact both cost and schedule. The contractors must prepare/construct for potential and
possible remobilizations. Very Unlikely Negligible Low Very Unlikely Negligible Low Binomial N/A Project Cost & Schedule
PR-4 Lawsuit PotentialsThe City of Dilworth has voiced objection over the route of the current project alignment, as they perceive too few benefits from the project.
PDT feels that this risk could be mitigated and managed. Could impact cost and schedule. Unlikely Marginal Low Unlikely Significant Moderate Yes-No Project Manager Project Schedule
PR-5Political factors change at state, local, or federal level
Political factors at the local or state levels may change, impacting project support. Senator Dorgan has retired. He was very influential and favorable to the project interests. Since the authorization was not obtained prior to his departure, there is concern that the project would
not be authorized or funded on a timely basis.
There is more chance of local or state political opposition on the Minnesota plan because of impacts to Dilwrorth,
MN and the downstream communities that may be impacted. Could impact cost and schedule. Unlikely Marginal Low Unlikely Crisis High Yes-No Project Manager Project Schedule
PR-7Lawsuit Risk from NGOs and Downstream Interests
There may be perceived damages from downstream concerns - this will be less on the MN side Could impact cost and schedule. Likely Marginal Moderate Likely Significant High Uniform Project Manager Project Schedule
11. Results of the risk identification process are studied and further developed by the Cost Engineer, then analyzed through the Monte Carlo Analysis Method for Cost (Contingency) and Schedule (Escalation) Growth.
4. Impact is a measure of the event's effect on project objectives with relation to scope, cost, and/or schedule -- Negligible, Marginal, Significant, Critical, or Crisis. Impacts on Project Cost may vary in severity from impacts on Project Schedule.5. Risk Level is the resultant of Likelihood and Impact Low, Moderate, or High. Refer to the matrix located at top of page.
7. The responsibility or POC is the entity responsible as the Subject Matter Expert (SME) for action, monitoring, or information on the PDT for the identified risk or opportunity.
9. Affected Project Component identifies the specific item of the project to which the risk directly or strongly correlates.
6. Variance Distribution refers to the behavior of the individual risk item with respect to its potential effects on Project Cost and Schedule. For example, an item with clearly defined parameters and a solid most likely scenario would probably follow a triangular or normal distribution. A risk item for which the PDT has little data or probability of modeling with respect to effects on cost or schedule (i.e. "anyone's guess") would probably follow a uniform or discrete uniform distribution.
8. Correlation recognizes those risk events that may be related to one another. Care should be given to ensure the risks are handled correctly without a "double counting."
10. Project Implications identifies whether or not the risk item affects project cost, project schedule, or both. The PDT is responsible for conducting studies for both Project Cost and for Project Schedule.
3. Likelihood is a measure of the probability of the event occurring -- Very Unlikely, Unlikely, Moderately Likely, Likely, Very Likely. The likelihood of the event will be the same for both Cost and Schedule, regardless of impact.
*Likelihood, Impact, and Risk Level to be verified through market research and analysis (conducted by cost engineer).1. Risk/Opportunity identified with reference to the Risk Identification Checklist and through deliberation and study of the PDT.2. Discussions and Concerns elaborates on Risk/Opportunity Events and includes any assumptions or findings (should contain information pertinent to eventual study and analysis of event's impact to project).
Programmatic Risks (External Risk Items are those that are generated, caused, or controlled exclusively outside the PDT's sphere of influence.)
USACE-MVP-0000087977

Contingency on Base Estimate 80% Confidence Project CostBaseline Estimate Cost (Most Likely) -> $948,530,215
Baseline Estimate Cost Contingency Amount -> $180,687,057Baseline Estimate Construction Cost (80% Confidence) -> $1,129,217,272
Contingency on Schedule 80% Confidence Project ScheduleProject Schedule Duration (Most Likely) -> 95.5 Months
Schedule Contingency Duration -> 104.8 MonthsProject Schedule Duration (80% Confidence) -> 200.3 Months
Project Schedule Contingency Amount (80% Confidence) -> $64,715,565
Project Contingency 80% Confidence Project CostProject Contingency Amount (80% Confidence) -> $245,402,622
Project Contingency Percentage (80% Confidence) -> 26%
Project Cost (80% Confidence) -> $1,193,932,836
Most LikelyCost Estimate
Confidence Level Project Cost Contingency Contingency %0% $887,943,310 ($60,586,904) -6.39% ########5% $1,011,329,628 $62,799,413 6.62% ########
10% $1,035,273,666 $86,743,451 9.15% ########15% $1,051,942,210 $103,411,995 10.90% ########20% $1,065,481,512 $116,951,298 12.33% ########25% $1,078,099,735 $129,569,521 13.66% ########30% $1,089,103,081 $140,572,866 14.82% ########35% $1,099,626,512 $151,096,297 15.93% ########40% $1,109,631,700 $161,101,485 16.98% ########45% $1,119,542,602 $171,012,387 18.03% ########50% $1,129,751,928 $181,221,713 19.11% ########55% $1,139,446,444 $190,916,230 20.13% ########60% $1,149,883,372 $201,353,157 21.23% ########65% $1,159,801,199 $211,270,984 22.27% ########70% $1,170,131,865 $221,601,651 23.36% ########75% $1,181,672,791 $233,142,576 24.58% ########80% $1,193,932,836 $245,402,622 25.87% ########85% $1,207,714,410 $259,184,195 27.32% ########90% $1,226,509,041 $277,978,826 29.31% ########95% $1,252,332,843 $303,802,628 32.03% ########
100% $1,414,017,542 $465,487,327 49.07% ########
MVP - Fargo/Moorhead Feasibility Report (Minnesota Option) - Cost & Schedule Risk Analysis
- PROJECT CONTINGENCY DEVELOPMENT -
Contingency Analysis$948,530,215
$600,000,000
$700,000,000
$800,000,000
$900,000,000
$1,000,000,000
$1,100,000,000
$1,200,000,000
$1,300,000,000
$1,400,000,000
$1,500,000,000 0% 10%
20%
30%
40%
50%
60%
70%
80%
90%
100%
Cos
t
Confidence Levels
Project Cost Contingency Analysis
Project Cost based at 80% Confidence Level
"Most Likely" Project Cost
Corresponding Contingency
Amount
USACE-MVP-0000087977

Most LikelyCost Estimate
Confidence Level Value Contingency0% $884,594,262 ($63,935,953) -6.74% ########5% $987,789,920 $39,259,706 4.14% ########
10% $1,007,075,412 $58,545,197 6.17% ########15% $1,020,291,286 $71,761,071 7.57% ########20% $1,030,718,995 $82,188,780 8.66% ########25% $1,040,497,920 $91,967,706 9.70% ########30% $1,049,053,519 $100,523,304 10.60% ########35% $1,057,131,010 $108,600,795 11.45% ########40% $1,064,672,740 $116,142,526 12.24% ########45% $1,072,188,740 $123,658,525 13.04% ########50% $1,079,996,514 $131,466,299 13.86% ########55% $1,087,416,074 $138,885,859 14.64% ########60% $1,095,385,159 $146,854,944 15.48% ########65% $1,102,919,106 $154,388,891 16.28% ########70% $1,110,801,734 $162,271,519 17.11% ########75% $1,119,700,924 $171,170,710 18.05% ########80% $1,129,217,272 $180,687,057 19.05% ########85% $1,140,066,664 $191,536,449 20.19% ########90% $1,155,521,288 $206,991,073 21.82% ########95% $1,176,284,791 $227,754,576 24.01% ########
100% $1,312,511,414 $363,981,200 38.37% ########
- BASE CONTINGENCY DEVELOPMENT -
Contingency Analysis$948,530,215
$600,000,000
$700,000,000
$800,000,000
$900,000,000
$1,000,000,000
$1,100,000,000
$1,200,000,000
$1,300,000,000
$1,400,000,000
0% 10%
20%
30%
40%
50%
60%
70%
80%
90%
100%
Cos
tConfidence Levels
Base Estimate Cost Contingency Analysis (Does not Include Escalation)
Project Cost based at 80% Confidence Level
"Most Likely" Project Cost
Corresponding Contingency Amount
USACE-MVP-0000087977
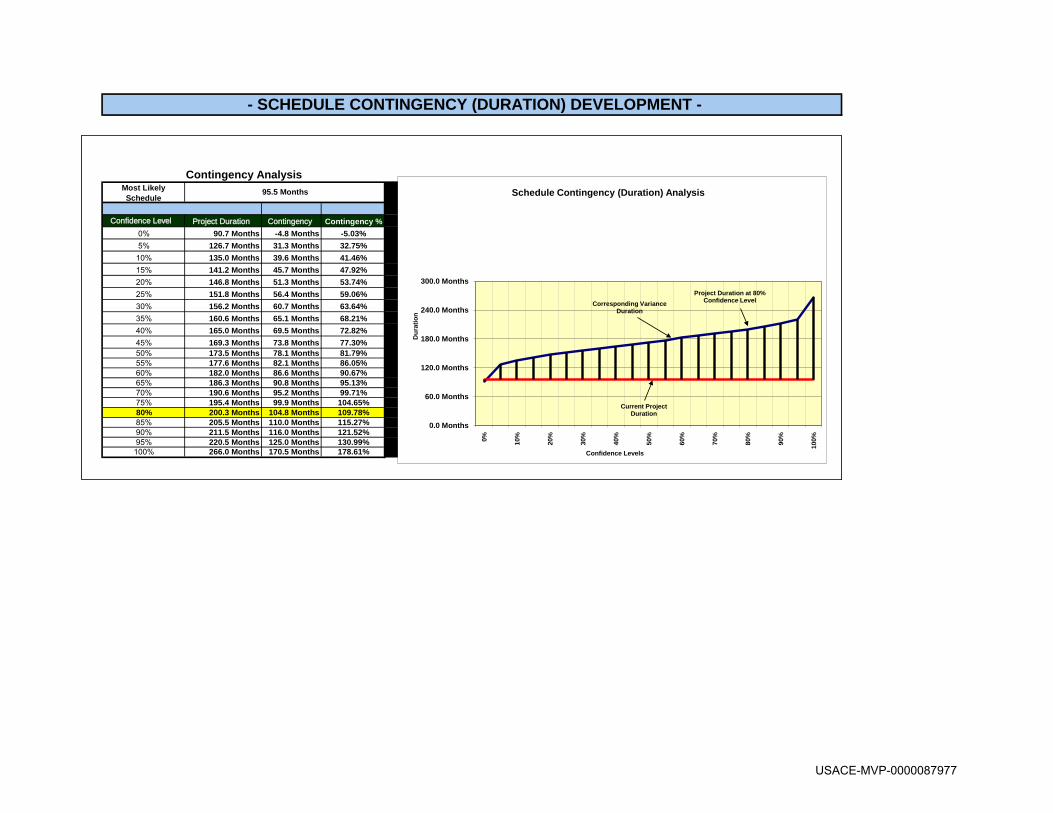
Most LikelySchedule
Confidence Level Project Duration Contingency Contingency %0% 90.7 Months -4.8 Months -5.03% 95 5% 126.7 Months 31.3 Months 32.75% 95
10% 135.0 Months 39.6 Months 41.46% 95 15% 141.2 Months 45.7 Months 47.92% 95 20% 146.8 Months 51.3 Months 53.74% 95 25% 151.8 Months 56.4 Months 59.06% 95 30% 156.2 Months 60.7 Months 63.64% 95 35% 160.6 Months 65.1 Months 68.21% 95 40% 165.0 Months 69.5 Months 72.82% 95 45% 169.3 Months 73.8 Months 77.30% 95 50% 173.5 Months 78.1 Months 81.79% 95 55% 177.6 Months 82.1 Months 86.05% 95 60% 182.0 Months 86.6 Months 90.67% 95 65% 186.3 Months 90.8 Months 95.13% 95 70% 190.6 Months 95.2 Months 99.71% 95 75% 195.4 Months 99.9 Months 104.65% 95 80% 200.3 Months 104.8 Months 109.78% 95 85% 205.5 Months 110.0 Months 115.27% 95 90% 211.5 Months 116.0 Months 121.52% 95 95% 220.5 Months 125.0 Months 130.99% 95
100% 266.0 Months 170.5 Months 178.61% 95
- SCHEDULE CONTINGENCY (DURATION) DEVELOPMENT -
Contingency Analysis95.5 Months
0.0 Months
60.0 Months
120.0 Months
180.0 Months
240.0 Months
300.0 Months
0% 10%
20%
30%
40%
50%
60%
70%
80%
90%
100%
Dur
atio
n
Confidence Levels
Schedule Contingency (Duration) Analysis
Project Duration at 80% Confidence Level
Current Project Duration
Corresponding VarianceDuration
USACE-MVP-0000087977

Most LikelyCost Estimate
Confidence Level Value Contingency0% $951,879,263 $3,349,049 0.35% ########5% $972,069,922 $23,539,708 2.48% ########
10% $976,728,469 $28,198,254 2.97% ########15% $980,181,139 $31,650,924 3.34% ########20% $983,292,732 $34,762,517 3.66% ########25% $986,132,030 $37,601,815 3.96% ########30% $988,579,776 $40,049,562 4.22% ########35% $991,025,717 $42,495,502 4.48% ########40% $993,489,174 $44,958,959 4.74% ########45% $995,884,077 $47,353,862 4.99% ########50% $998,285,629 $49,755,414 5.25% ########55% $1,000,560,585 $52,030,370 5.49% ########60% $1,003,028,428 $54,498,213 5.75% ########65% $1,005,412,308 $56,882,093 6.00% ########70% $1,007,860,346 $59,330,131 6.25% ########75% $1,010,502,081 $61,971,867 6.53% ########80% $1,013,245,780 $64,715,565 6.82% ########85% $1,016,177,961 $67,647,746 7.13% ########90% $1,019,517,967 $70,987,753 7.48% ########95% $1,024,578,266 $76,048,052 8.02% ########
100% $1,050,036,342 $101,506,127 10.70% ########
- SCHEDULE CONTINGENCY (AMOUNT) DEVELOPMENT -
Contingency Analysis$948,530,215
$850,000,000
$950,000,000
$1,050,000,000
0% 10%
20%
30%
40%
50%
60%
70%
80%
90%
100%
Cos
t
Confidence Levels
Project Schedule Contingency Analysis
Project Cost Plus Schedule Contingency based at 80%
Confidence Level
"Most Likely" Project Cost
Corresponding Schedule Contingency
Amount
USACE-MVP-0000087977
MVP - Fargo/Moorhead Feasibility Report (Minnesota Option) - Cost Risk Analysis
USACE-MVP-0000087977

Likelihood* Impact* Risk Level* Correlation to Other(s) Low Most Likely High Low Most Likely High
PPM-1 Project Schedule in Question Likely Significant High N/A N/A N/A N/A N/A
Removed From Cost Risk Study as this is captured
by the Schedule Risk Analysis N/A N/A N/A
PPM-2 Accelerated Design Schedule Likely Significant High N/A N/A N/A N/A N/A
Removed From Cost Risk Study as this is captured
in Technical Risks N/A N/A N/A
PM-3Accelerated Construction Schedule Likely Marginal Moderate N/A N/A N/A N/A N/A
Removed From Cost Risk Study as this is captured
in Technical Risks N/A N/A N/A
PPM-8 Scope Changes Likely Significant High Triangular ($47,415,140) $0 $94,830,280 $0 -5.00% 0.00% 10.00% 100%
CA-1 Undefined Acquisition Strategy Likely Marginal Moderate Triangular ($18,309,838) $0 $73,239,350 $0 -1.93% 0.00% 7.72% 100%
CA-3 Numerous Separate Contracts Very Likely Significant High Triangular $0 $0 $8,056,350 $0 0.00% 0.00% 0.85% 100%
CA-4 Potential Bid Protests Likely Marginal Moderate Yes-No/Uniform $0 $0 $36,619,675 $0 0.00% 0.00% 3.86% 65%
TL-1Uncertainty with Geotechnical Conditions Likely Marginal Moderate Triangular ($713,980) $0 $356,990 $0 -0.08% 0.00% 0.04% 100%
TL-4Variation in Estimated Quantities Likely Significant High Yes-No/Uniform ($13,720,690) $0 $13,720,690 $0 -1.45% 0.00% 1.45% 65%
TL-6 Relocations - Utilities Likely Marginal Moderate Triangular ($261,280) $0 $1,567,680 $0 -0.03% 0.00% 0.17% 100%
TL-7 Relocations - Bridges Likely Marginal Moderate Triangular ($3,986,530) $0 $7,973,060 $0 -0.42% 0.00% 0.84% 100%
TL-8 Mitigation Likely Significant High Uniform ($578,295) $0 $2,891,475 $0 -0.06% 0.00% 0.30% 100%
TL-9Diversions Excavations & Productivity Likely Marginal Moderate Triangular ($19,291,395) $0 $57,874,185 $0 -2.03% 0.00% 6.10% 100%
TL-10 Hydraulic Structures Likely Significant High Triangular ($4,155,625) $0 $16,622,500 $0 -0.44% 0.00% 1.75% 100%
TL-11 Levees Unlikely Significant Moderate Triangular ($705,710) $0 $3,528,550 $0 -0.07% 0.00% 0.37% 100%
TL-12 Non-Structural Floodproofing Likely Marginal Moderate Triangular ($549,090) $0 $2,745,450 $0 -0.06% 0.00% 0.29% 100%
TL-13 Recreational Facilities Likely Marginal Moderate Triangular ($998,470) $0 $4,992,350 $0 -0.11% 0.00% 0.53% 100%
TL-14 Fuel Cost Concerns Likely Significant High Triangular ($8,110,020) $0 $8,110,020 $0 -0.86% 0.00% 0.86% 100%
LD-1 Concerns with the Rail yard Likely Crisis High Yes-No/Uniform ($6,364,720) $0 $44,553,040 $0 -0.67% 0.00% 4.70% 65%
LD-2Mitigation Needs Identified for Downstream Impacts Unlikely Significant Moderate Yes-No/Uniform RE-1 $0 $0 $50,000,000 $0 0.00% 0.00% 5.27% 25%
LD-3Potential Savings for Eliminating RR Bridge 1 Unlikely Significant Moderate Yes-No/Custom ($18,765,552) $0 $0 $0 -1.98% 0.00% 0.00% 25%
LD-4 Appraisal Likely Significant High Triangular ($2,739,115) $0 $16,434,690 $0 -0.29% 0.00% 1.73% 100%
LD-5 Non-Appraisal Likely Marginal Moderate Triangular ($2,739,115) $0 $5,478,230 $0 -0.29% 0.00% 0.58% 100%
Variance Distribution
Expected Values ($$$)Project Cost
Internal Risks (Internal Risk Items are those that are generated, caused, or controlled within the PDT's sphere of influence.)
MVP - Fargo/Moorhead Feasibility Report (Minnesota Option) - Cost Risk Analysis ModelCrystal Ball Simulation Crystal Ball Simulation
Expected Values (%s)
Percentages are calculated as the variance from the assumption value to facilitate iteration of the model should the cost values change throughout the project phases. Uniform distribution percentages reflect variation from the total project cost.PROJECT & PROGRAM MGMT
Risk No. Risk/Opportunity Event
CONTRACT ACQUISITION RISKS
LANDS AND DAMAGES RISKS
TECHNICAL RISKS
USACE-MVP-0000087977

RE-1Environmental Mitigation Feature Concerns Likely Significant High N/A N/A N/A N/A N/A
Removed From Cost Risk Study as this is captured
by TL-8 N/A N/A N/A
RE-2Historical Cultural Resource Issues Very Likely Marginal Moderate Triangular ($500,000) $0 $1,000,000 $0 -0.05% 0.00% 0.11% 100%
CON-2 Control and Diversion of Water Likely Marginal Moderate Triangular ($4,502,900) $0 $4,502,900 $0 -0.47% 0.00% 0.47% 100%
CON-5 Project Sequencing Likely Significant High Uniform ($6,767,933) $0 $33,839,665 $0 -0.71% 0.00% 3.57% 100%
CON-6 Contract Mods Likely Significant High Triangular ($36,358,395) $0 $72,716,790 $0 -3.83% 0.00% 7.67% 100%
EST-1Potential Fluctuation in Labor Costs Likely Significant High Triangular ($16,384,590) $0 $32,769,180 $0 -1.73% 0.00% 3.45% 100%
EST-2WBS Elements - Estimate confidence Likely Marginal Moderate N/A N/A N/A N/A N/A
Removed From Cost Risk Study as this is captured
by LD-4 and TL-8 N/A N/A N/A
EST-4 PED & CM Likely Significant High Triangular ($43,504,290) $0 $0 $0 -4.59% 0.00% 0.00% 100%
PR-1Uncertainty with Funding Stream Very Likely Significant High N/A N/A N/A N/A N/A
Removed From Cost Risk Study as this is captured
by the Schedule Risk Analysis N/A N/A N/A
PR-7Lawsuit Risk from NGOs and Downstream Interest Very Likely Marginal Moderate Uniform $0 $0 $47,415,140 $0 0.00% 0.00% 5.00% 100%
$948,530,215
Not Part of Study - Placeholder for Project
Summation Purposes Only 100.0%
$0
ESTIMATE AND SCHEDULE RISKS
REGULATORY AND ENVIRONMENTAL RISKS
CONSTRUCTION RISKS
Programmatic Risks (External Risk Items are those that are generated, caused, or controlled exclusively outside the PDT's sphere of influence.)
USACE-MVP-0000087977

Percentile Contingency Amount Baseline w/ Contingency Contingency %0% ($63,935,953) $884,594,262 -6.74%5% $39,259,706 $987,789,920 4.14%
10% $58,545,197 $1,007,075,412 6.17%15% $71,761,071 $1,020,291,286 7.57%20% $82,188,780 $1,030,718,995 8.66%25% $91,967,706 $1,040,497,920 9.70%30% $100,523,304 $1,049,053,519 10.60%35% $108,600,795 $1,057,131,010 11.45%40% $116,142,526 $1,064,672,740 12.24%45% $123,658,525 $1,072,188,740 13.04%50% $131,466,299 $1,079,996,514 13.86%55% $138,885,859 $1,087,416,074 14.64%60% $146,854,944 $1,095,385,159 15.48%65% $154,388,891 $1,102,919,106 16.28%70% $162,271,519 $1,110,801,734 17.11%75% $171,170,710 $1,119,700,924 18.05%80% $180,687,057 $1,129,217,272 19.05%85% $191,536,449 $1,140,066,664 20.19%90% $206,991,073 $1,155,521,288 21.82%95% $227,754,576 $1,176,284,791 24.01%100% $363,981,200 $1,312,511,414 38.37%
39920822.847879342.36
49755944.651175947.97
52391087.8
$948,530,215 $948,530,215
PROJECT COST (BASELINE)
$948,530,215 $948,530,215 $948,530,215
$948,530,215 $948,530,215 $948,530,215
$948,530,215 $948,530,215
$948,530,215
$948,530,215 $948,530,215 $948,530,215 $948,530,215
Baseline TPC
$948,530,215 $948,530,215
$948,530,215
$948,530,215 $948,530,215
$948,530,215
USACE-MVP-0000087977

Risk Refer No. Risk Event Low Most Likely HighPPM-1 Project Schedule in Question
-$15,804,595 ########### $31,609,190
MVP - Fargo/Moorhead Feasibility Report (Minnesota Option) - Cost Risk Analysis Model
Removed From Cost Risk Study as this is captured by the Schedule Risk Analysis
USACE-MVP-0000087977

Risk Refer No. Risk Event Low Most Likely HighPPM-2 Accelerated Design Schedule $0 $0 $0
$0 $0 $0
Notes: Most Likely
Likely $947,302,800 Project Cost Total from TPCSLow
High$947,302,800
Assumes 5% less than project costs
Assumes 20% greater than Project Costs
MVP - Fargo/Moorhead Feasibility Report (Minnesota Option) - Cost Risk Analysis Model
Removed From Cost Risk Study as this is captured in Technical Risks
Likely assumes no change from the baseline estimate.
This item captures the risk that will cause a variance from the current working estimate for the project.
USACE-MVP-0000087977

Risk Refer No. Risk Event Low Most Likely HighPPM-3 Accelerated Construction Schedule $0 $0 $0
$0 $0 $0
Notes: Most Likely
Likely $84,956,200 02 RelocationsLow $11,565,900 06 Fish & Wildlife Facilities - Mitigation
$127,294,300 08 Roads & RailroadsHigh $469,768,400 09 Channels & Canals
$19,605,100 11 Levees, Floodwall & Floodproofing$19,203,600 14 Recreation Facilities
$732,393,500
MVP - Fargo/Moorhead Feasibility Report (Minnesota Option) - Cost Risk Analysis Model
Removed From Cost Risk Study as this is captured in Technical Risks
This item captures the risk that will cause a variance from the current working estimate for the project.Likely assumes no change from the baseline estimate.
Assumes that acceleration changes decrease construction cost by 5%
Assumes that acceleration changes add costs of 15% to the construction cost.
USACE-MVP-0000087977

Risk Refer No. Risk Event Low Most Likely HighPPM-8 Scope Changes ($47,415,140) $0 $94,830,280
$900,887,660 $948,302,800 $1,043,133,080
Notes: Most Likely
Likely $948,302,800 Project Cost Total from TPCSLow
High$948,302,800
Assumption: Scope ChangesPercentile Assumption values
0% ($46,596,748)10% ($20,787,930)20% ($10,611,839)30% ($2,389,324)40% $4,996,34650% $12,895,29660% $21,726,58570% $31,615,48580% $42,873,74490% $58,294,031100% $94,134,828
MVP - Fargo/Moorhead Feasibility Report (Minnesota Option) - Cost Risk Analysis Model
This item captures the risk that will cause a variance from the current working estimate for the project.Likely assumes no change from the baseline estimate.
Assumes that scope changes decrease the project cost by 5%
Assumes that scope changes add additional features or costs of 10% to the project cost.
USACE-MVP-0000087977

Risk Refer No. Risk Event Low Most Likely HighCA-1 Undefined Acquisition Strategy ($18,309,838) $0 $73,239,350
$714,083,663 $732,393,500 $805,632,850
Notes: Most Likely
Likely $84,956,200 02 RelocationsLow $11,565,900 06 Fish & Wildlife Facilities - Mitigation
$127,294,300 08 Roads & RailroadsHigh $469,768,400 09 Channels & Canals
$19,605,100 11 Levees, Floodwall & Floodproofing$19,203,600 14 Recreation Facilities
$732,393,500
Assumption: Undefined Acquisition StrategyPercentile Assumption values
0% ($17,917,576)10% ($5,223,520)20% $183,56330% $4,901,04540% $9,905,95550% $15,376,54160% $21,235,41970% $28,074,98480% $36,507,07390% $47,036,044100% $72,544,235
MVP - Fargo/Moorhead Feasibility Report (Minnesota Option) - Cost Risk Analysis Model
This item captures the risk that will cause a variance from the current working estimate for the project.Likely assumes no change from the baseline estimate.
Assumes 2.5% less of construction costs because of favorable acquisitions implementation.
Assumes 10% greater construction costs because of the undefined acquisition strategy at the feasibility level.
USACE-MVP-0000087977

Risk Refer No. Risk Event Low Most Likely HighCA-3 Numerous Separate Contracts $0 $0 $8,056,350
$161,127,000 $161,127,000 $169,183,350
Notes: Most Likely
Likely $109,859,000 PED (from TPCS)Low $51,268,000 CM (from TPCS)
High $161,127,000 Total
Assumption: Numerous Separate ContractsPercentile Assumption values
0% $21910% $426,74320% $844,14030% $1,311,08540% $1,811,23050% $2,333,90960% $2,933,63370% $3,609,86180% $4,409,74490% $5,463,622100% $8,010,934
Assumes 0% less PED and CM costs if contracting issues do not cause delays
Assumes 5% greater PED and CM costs if contracting issues cause delays by using several smaller contracts
MVP - Fargo/Moorhead Feasibility Report (Minnesota Option) - Cost Risk Analysis Model
Likely assumes no change from the baseline estimate.
This item captures the risk that will cause a variance from the current working estimate for the project.
USACE-MVP-0000087977

Risk Refer No. Risk Event Low Most Likely HighCA-4 Potential Bid Protests $0 $0 $36,619,675
$732,393,500 $732,393,500 $769,013,175
Notes: Most Likely
Likely $84,956,200 02 RelocationsLow $11,565,900 06 Fish & Wildlife Facilities - Mitigation
$127,294,300 08 Roads & RailroadsHigh $469,768,400 09 Channels & Canals
$19,605,100 11 Levees, Floodwall & Floodproofing$19,203,600 14 Recreation Facilities
$732,393,500
Assumption: Potential Bid ProtestsPercentile Assumption values
0% $9,49510% $3,600,32620% $7,202,78530% $10,881,97840% $14,379,01150% $18,120,95560% $21,806,09270% $25,289,26780% $29,073,60990% $32,824,938100% $36,616,689
MVP - Fargo/Moorhead Feasibility Report (Minnesota Option) - Cost Risk Analysis Model
This item captures the risk that will cause a variance from the current working estimate for the project.Likely assumes no change from the baseline estimate.
Assumes that without bid protests that costs would not decrease.
Assume that with bid protest that construction cost may be increase by 5%
USACE-MVP-0000087977

Risk Refer No. Risk Event Low Most Likely HighTL-1 Uncertainty with Geotechnical Conditions ($713,980) $0 $356,990
$2,855,920 $3,569,900 $3,926,890
Notes: Most Likely
Likely Low
High
$945,400 RRN Inlet Piling for Gated structure$2,624,500 RRN Inlet Piling for Walls$3,569,900 Total
Assumption: Uncertainty with Geotechnical ConditionsPercentile Assumption values
0% ($706,640)10% ($436,499)20% ($323,535)30% ($237,124)40% ($160,652)50% ($91,739)60% ($35,319)70% $17,68780% $80,41890% $165,012
100% $345,518
Assumes 10% greater costs for the piling for the hydraulic structures due to changes in the bearing capacity results for hydraulic structure pilings.
MVP - Fargo/Moorhead Feasibility Report (Minnesota Option) - Cost Risk Analysis Model
This item captures the risk that will cause a variance from the current working estimate for the project.Likely assumes no change from the baseline estimate.
Assumes 20% less costs for the piling for the hydraulic structures due to changes in the bearing capacity results for hydraulic structure pilings.
USACE-MVP-0000087977

Risk Refer No. Risk Event Low Most Likely HighTL-4 Variation in Estimated Quantities ($13,720,690) $0 $13,720,690
$260,693,110 $274,413,800 $288,134,490
Notes: Most Likely
Likely $3,881,200 Reach 1 ExcavationLow $16,421,100 Reach 2 Excavation
$66,475,800 Reach 3 ExcavationHigh $51,440,600 Reach 4 Excavation
$26,812,200 Reach 5 Excavation$89,413,500 Reach 6 Excavation
$10,095,000 (9020109) RRN Control Structure Excavation$9,874,400 (110103) Tie-back Levee Excavation
$274,413,800
Assumption: Variation in Estimated QuantitiesPercentile Assumption values
0% ($13,720,600)10% ($11,073,667)20% ($8,451,304)30% ($5,784,724)40% ($2,966,906)50% ($192,207)60% $2,505,63970% $5,273,55780% $8,081,85090% $10,868,260100% $13,718,930
Assumes 5% less costs for diversion channel excavation for Reaches 1-6 + tie-back levee cost due to changes in the quantities.
Assumes 5% greater costs for diversion channel excavation for Reaches 1-6 + tie-back levee costs due to changes in the quantitiies.
MVP - Fargo/Moorhead Feasibility Report (Minnesota Option) - Cost Risk Analysis Model
This item captures the risk that will cause a variance from the current working estimate for the project.Likely assumes no change from the baseline estimate.
USACE-MVP-0000087977

Risk Refer No. Risk Event Low Most Likely HighTL-6 Relocations - Utilitites ($261,280) $0 $1,567,680
$4,964,320 $5,225,600 $6,793,280
Notes: Most Likely
Likely $5,225,600 Utilities CostLow
High $5,225,600
Assumption: Relocations - UtilititesPercentile Assumption values
0% ($257,393)10% ($43,391)20% $48,71530% $142,06740% $248,46250% $367,81260% $497,53370% $633,64180% $799,92790% $1,027,721100% $1,554,957
MVP - Fargo/Moorhead Feasibility Report (Minnesota Option) - Cost Risk Analysis Model
This item captures the risk that will cause a variance from the current working estimate for the project.Likely assumes no change from the baseline estimate.
Assumes that cost would be 5% less than estimated
Assumes that cost would be 30% more than estimated
USACE-MVP-0000087977

Risk Refer No. Risk Event Low Most Likely HighTL-7 Relocations - Bridges ($3,986,530) $0 $7,973,060
$75,744,070 $79,730,600 $87,703,660
Notes: Most Likely
Likely $79,730,600 Cost of Relocations for bridges & highwaysLow
High $79,730,600
Assumption: Relocations - BridgesPercentile Assumption values
0% ($3,935,003)10% ($1,789,063)20% ($871,584)30% ($185,590)40% $416,83650% $1,073,15560% $1,749,66270% $2,567,31180% $3,555,90790% $4,880,091100% $7,883,256
MVP - Fargo/Moorhead Feasibility Report (Minnesota Option) - Cost Risk Analysis Model
This item captures the risk that will cause a variance from the current working estimate for the project.Likely assumes no change from the baseline estimate.
Assumes that cost would be 5% less than estimated
Assumes that cost would be 10% more than estimated
USACE-MVP-0000087977

Risk Refer No. Risk Event Low Most Likely HighTL-8 Mitigation ($578,295) $0 $2,891,475
$10,987,605 $11,565,900 $14,457,375
Notes: Most Likely
Likely $11,565,900 06 01 Environmental Mitigation CostsLow
High $11,565,900
Assumption: MitigationPercentile Assumption values
0% ($578,208)10% ($244,219)20% $99,08130% $445,64040% $799,88150% $1,155,58760% $1,504,94170% $1,842,12580% $2,193,95890% $2,543,857100% $2,891,446
MVP - Fargo/Moorhead Feasibility Report (Minnesota Option) - Cost Risk Analysis Model
This item captures the risk that will cause a variance from the current working estimate for the project.Likely assumes no change from the baseline estimate.
Assumes that cost would be 5% less than estimated
Assumes that cost would be 25% more than estimated
USACE-MVP-0000087977

Risk Refer No. Risk Event Low Most Likely HighTL-9 Diversions Excavations & Productivity ($19,291,395) $0 $57,874,185
$366,536,505 $385,827,900 $443,702,085
Notes: Most Likely
Likely $385,827,900 Diversion Channel CostsLow
High $385,827,900
Assumption: Diversions Excavations & ProductivityPercentile Assumption values
0% ($19,154,175)10% ($7,321,816)20% ($2,003,774)30% $1,807,75740% $5,815,51050% $10,543,32760% $15,564,94170% $21,345,16880% $28,077,99290% $36,402,644100% $57,408,565
MVP - Fargo/Moorhead Feasibility Report (Minnesota Option) - Cost Risk Analysis Model
This item captures the risk that will cause a variance from the current working estimate for the project.Likely assumes no change from the baseline estimate.
Assumes that cost would be 5% less than estimated
Assumes that cost would be 15% more than estimated
USACE-MVP-0000087977

Risk Refer No. Risk Event Low Most Likely HighTL-10 Hydraulic Structures ($4,155,625) $0 $16,622,500
$78,956,875 $83,112,500 $99,735,000
Notes: Most Likely
Likely $64,174,100 Hydraulic Structure - RRN InletLow $781,200 Hydraulic Structure - Small Drains
$3,170,300 Hydraulic Structure - Side Channel InletsHigh $9,060,700 Hydraulic Structure - Twin Side Channel Inlets
$1,613,900 Hydraulic Structure - RRN Outlet$4,312,300 Hydraulic Structure - Diversion Channel Drop Structure
$83,112,500
Assumption: Hydraulic StructuresPercentile Assumption values
0% ($4,107,727)10% ($1,215,979)20% $22,19730% $1,093,49940% $2,291,15850% $3,549,91960% $5,001,20670% $6,534,32480% $8,406,50190% $10,870,661100% $16,554,678
MVP - Fargo/Moorhead Feasibility Report (Minnesota Option) - Cost Risk Analysis Model
This item captures the risk that will cause a variance from the current working estimate for the project.Likely assumes no change from the baseline estimate.
Assumes that cost would be 5% less than estimated
Assumes that cost would be 20% more than estimated
USACE-MVP-0000087977

Risk Refer No. Risk Event Low Most Likely HighTL-11 Levees ($705,710) $0 $3,528,550
$13,408,490 $14,114,200 $17,642,750
Notes: Most Likely
Likely $14,114,200 Tie-back LeveesLow
High $14,114,200
Assumption: LeveesPercentile Assumption values
0% ($686,071)10% ($168,675)20% $59,66330% $282,95040% $528,68050% $801,09060% $1,078,01270% $1,390,49080% $1,778,02090% $2,279,988100% $3,508,802
MVP - Fargo/Moorhead Feasibility Report (Minnesota Option) - Cost Risk Analysis Model
This item captures the risk that will cause a variance from the current working estimate for the project.Likely assumes no change from the baseline estimate.
Assumes that cost would be 5% less than estimated due to levee design becoming lower
Assumes that cost would be 25% more than estimated due to additional levees required for the project if some upstream staging is incorporated
USACE-MVP-0000087977

Risk Refer No. Risk Event Low Most Likely HighTL-12 Non-structural ($549,090) $0 $2,745,450
$4,941,810 $5,490,900 $8,236,350
Notes: Most Likely
Likely $5,490,900 Non-structural floodproofingLow
High $5,490,900
Assumption: Non-structuralPercentile Assumption values
0% ($534,213)10% ($121,777)20% $58,57730% $231,65840% $427,48450% $626,69960% $848,35370% $1,096,88780% $1,408,74790% $1,797,571100% $2,706,609
MVP - Fargo/Moorhead Feasibility Report (Minnesota Option) - Cost Risk Analysis Model
This item captures the risk that will cause a variance from the current working estimate for the project.Likely assumes no change from the baseline estimate.
Assumes that cost would be 10% less than estimated
Assumes that cost would be 50% more than estimate due to additional measures being taken for the downstream areas above what is currently in the evaulation.
USACE-MVP-0000087977

Risk Refer No. Risk Event Low Most Likely HighTL-13 Recreation ($998,470) $0 $4,992,350
$18,970,930 $19,969,400 $24,961,750
Notes: Most Likely
Likely $19,969,400 Recreational FacilitiesLow
High $19,969,400
Assumption: RecreationPercentile Assumption values
0% ($989,468)10% ($233,738)20% $90,76330% $407,53340% $737,17350% $1,103,58660% $1,508,84670% $1,974,99980% $2,543,47990% $3,264,514100% $4,970,701
MVP - Fargo/Moorhead Feasibility Report (Minnesota Option) - Cost Risk Analysis Model
This item captures the risk that will cause a variance from the current working estimate for the project.Likely assumes no change from the baseline estimate.
Assumes that cost would be 5% less than estimated
Assumes that cost would be 25% more than estimated
USACE-MVP-0000087977

Risk Refer No. Risk Event Low Most Likely HighTL-14 Fuel Cost Concerns ($8,110,020) $0 $8,110,020
$32,440,080 $40,550,100 $48,660,120
Notes: Most Likely
Likely $40,550,100 Fuel CostsLow
High
$40,550,100
Assumption: Fuel Cost ConcernsPercentile Assumption values
0% ($7,965,304)10% ($4,548,344)20% ($2,925,038)30% ($1,827,794)40% ($822,407)50% $18,55260% $898,61770% $1,856,01480% $3,009,15090% $4,470,053100% $8,027,985
MVP - Fargo/Moorhead Feasibility Report (Minnesota Option) - Cost Risk Analysis Model
This item captures the risk that will cause a variance from the current working estimate for the project.Likely assumes no change from the baseline estimate.
Assumes that fuel cost could decrease by 20% from what is currently used in the estimate
Assume that fuel cost could increase by 20% from the costs currently used in the estimate.
USACE-MVP-0000087977
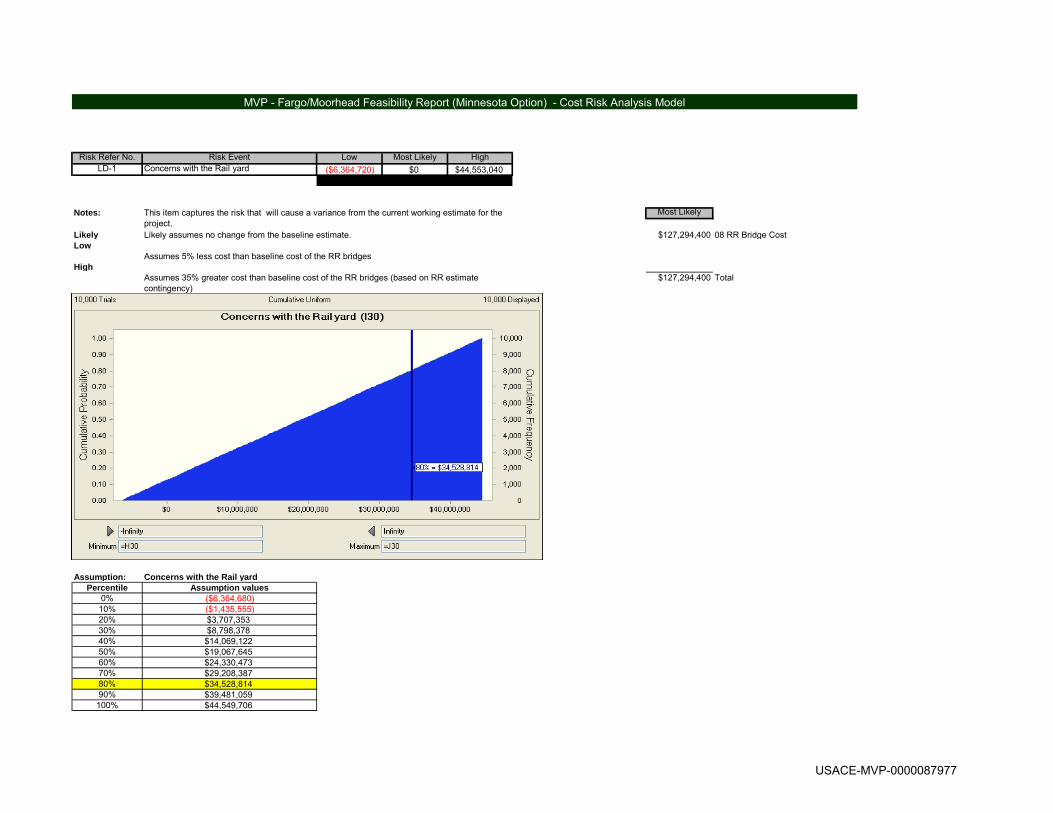
Risk Refer No. Risk Event Low Most Likely HighLD-1 Concerns with the Rail yard ($6,364,720) $0 $44,553,040
$120,929,680 $127,294,400 $171,847,440
Notes: Most Likely
Likely $127,294,400 08 RR Bridge CostLow
High$127,294,400 Total
Assumption: Concerns with the Rail yard Percentile Assumption values
0% ($6,364,680)10% ($1,435,555)20% $3,707,35330% $8,798,37840% $14,069,12250% $19,067,64560% $24,330,47370% $29,208,38780% $34,528,81490% $39,481,059100% $44,549,706
MVP - Fargo/Moorhead Feasibility Report (Minnesota Option) - Cost Risk Analysis Model
This item captures the risk that will cause a variance from the current working estimate for the project.Likely assumes no change from the baseline estimate.
Assumes 5% less cost than baseline cost of the RR bridges
Assumes 35% greater cost than baseline cost of the RR bridges (based on RR estimate contingency)
USACE-MVP-0000087977

Risk Refer No. Risk Event Low Most Likely High
LD-2Mitigation Needs Identified for Downstream Impacts $0 $0 $50,000,000
$50,000,000 $50,000,000 $100,000,000
Notes: Most Likely
Likely $50,000,000 Potential DS impactsLow
High$50,000,000 Total
Assumption: Mitigation Needs Identified for Downstream ImpactsPercentile Assumption values
0% $5,91810% $5,185,24820% $10,280,75030% $15,334,09540% $20,438,07550% $25,582,23960% $30,422,00470% $35,307,73880% $40,294,37090% $45,190,476
100% $49,994,696
Baseline has no cost currently so impacts to downstream interest could add to projects cost (200 structures @ $250,000 each)
Baseline has no cost currently so cost would not decrease from zero
MVP - Fargo/Moorhead Feasibility Report (Minnesota Option) - Cost Risk Analysis Model
Likely assumes no change from the baseline estimate.
This item captures the risk that will cause a variance from the current working estimate for the project.
USACE-MVP-0000087977
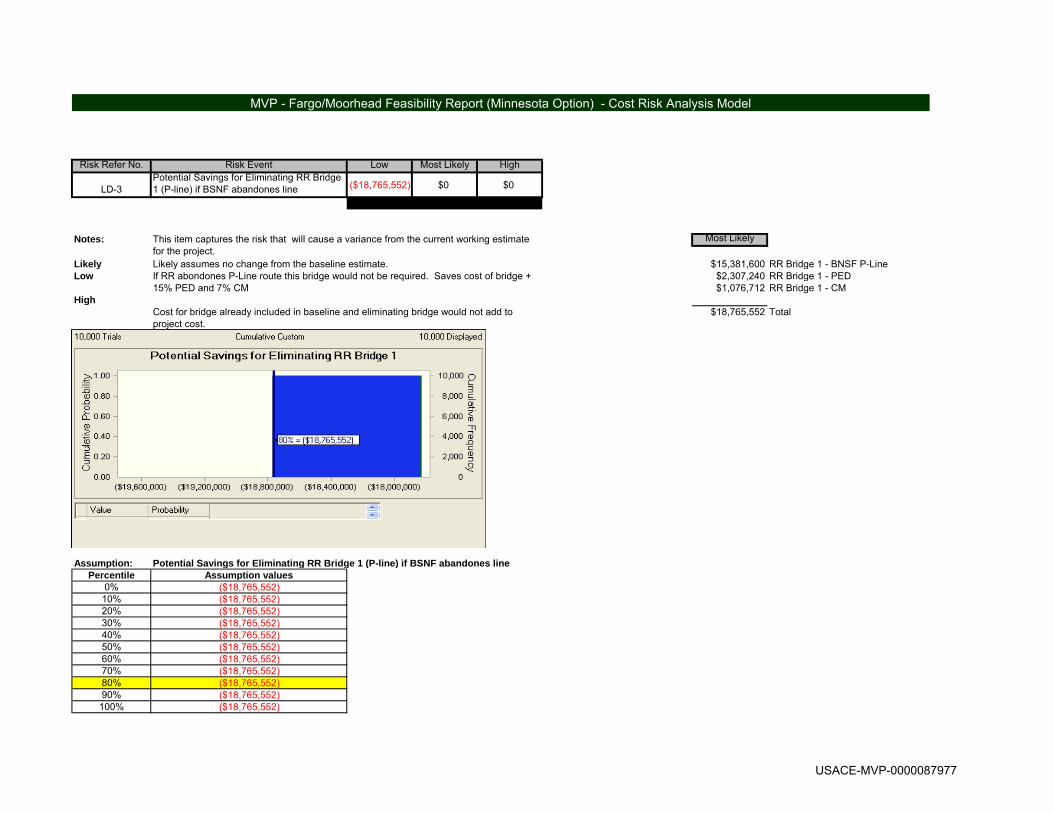
Risk Refer No. Risk Event Low Most Likely High
LD-3Potential Savings for Eliminating RR Bridge 1 (P-line) if BSNF abandones line ($18,765,552) $0 $0
$0 $18,765,552 $18,765,552
Notes: Most Likely
Likely $15,381,600 RR Bridge 1 - BNSF P-Line Low $2,307,240 RR Bridge 1 - PED
$1,076,712 RR Bridge 1 - CMHigh
$18,765,552 Total
Assumption: Potential Savings for Eliminating RR Bridge 1 (P-line) if BSNF abandones linePercentile Assumption values
0% ($18,765,552)10% ($18,765,552)20% ($18,765,552)30% ($18,765,552)40% ($18,765,552)50% ($18,765,552)60% ($18,765,552)70% ($18,765,552)80% ($18,765,552)90% ($18,765,552)
100% ($18,765,552)
If RR abondones P-Line route this bridge would not be required. Saves cost of bridge + 15% PED and 7% CM
Cost for bridge already included in baseline and eliminating bridge would not add to project cost.
MVP - Fargo/Moorhead Feasibility Report (Minnesota Option) - Cost Risk Analysis Model
This item captures the risk that will cause a variance from the current working estimate for the project.Likely assumes no change from the baseline estimate.
USACE-MVP-0000087977

Risk Refer No. Risk Event Low Most Likely HighLD-4 Appraisal ($2,739,115) $0 $16,434,690
$52,043,185 $54,782,300 $71,216,990
Notes: Most Likely
Likely $54,782,300 Real estate appraisalLow
High $54,782,300
Assumption: AppraisalPercentile Assumption values
0% ($2,709,361)10% ($443,814)20% $561,71830% $1,552,33240% $2,679,80350% $3,808,12160% $5,222,67470% $6,713,74980% $8,502,32890% $10,758,807100% $16,282,863
MVP - Fargo/Moorhead Feasibility Report (Minnesota Option) - Cost Risk Analysis Model
This item captures the risk that will cause a variance from the current working estimate for the project.Likely assumes no change from the baseline estimate.
Assumes that cost would be 5% less than estimated
Assumes that cost would be 30% more than estimated
USACE-MVP-0000087977

Risk Refer No. Risk Event Low Most Likely HighLD-5 Non-Appraisal ($2,739,115) $0 $5,478,230
$52,043,185 $54,782,300 $60,260,530
Notes: Most Likely
Likely $54,782,300 Lands & DamagesLow
High $54,782,300
Assumption: Non-AppraisalPercentile Assumption values
0% ($2,657,584)10% ($1,235,453)20% ($633,055)30% ($130,936)40% $298,00650% $757,33460% $1,270,53370% $1,820,64980% $2,492,96390% $3,373,360100% $5,445,327
MVP - Fargo/Moorhead Feasibility Report (Minnesota Option) - Cost Risk Analysis Model
This item captures the risk that will cause a variance from the current working estimate for the project.Likely assumes no change from the baseline estimate.Assumes that cost would be 5% less than estimated due to project footprint being less than currently estimated
Assumes that cost would be 10% more than estimated due to increase of project footprint
USACE-MVP-0000087977

Risk Refer No. Risk Event Low Most Likely High
RE-1 Environmental Mitigation Feature Concerns $0 $0 $0
$0 $0 $0
Notes: Most Likely
Likely $11,565,900 06 01 Environmental Mitigation CostsLow
High $11,565,900 Total
Assumes 30% greater cost than baseline
Assume 20% less costs from baseline
MVP - Fargo/Moorhead Feasibility Report (Minnesota Option) - Cost Risk Analysis Model
Removed From Cost Risk Study as this is captured by TL-8
Likely assumes no change from the baseline estimate.
This item captures the risk that will cause a variance from the current working estimate for the project.
USACE-MVP-0000087977

s
USACE-MVP-0000087977

Risk Refer No. Risk Event Low Most Likely HighRE-2 Historical Cultural Resource Issues ($500,000) $0 $1,000,000
$500,000 $1,000,000 $2,000,000
Notes: Most Likely
Likely $1,000,000 Assume for baselineLow
High
$1,000,000
Assumption: Historical Cultural Resource IssuesPercentile Assumption values
0% ($487,694)10% ($226,017)20% ($110,329)30% ($22,520)40% $54,00050% $138,84260% $234,36370% $335,52880% $461,04490% $619,834100% $984,385
Assumes 50% of baseline estimate
Assumes 200% of baseline estimate
MVP - Fargo/Moorhead Feasibility Report (Minnesota Option) - Cost Risk Analysis Model
Likely assumes no change from the baseline estimate.
This item captures the risk that will cause a variance from the current working estimate for the project.
USACE-MVP-0000087977

Risk Refer No. Risk Event Low Most Likely HighCON-2 Control and Diversion of Water ($4,502,900) $0 $4,502,900
$4,502,900 $9,005,800 $13,508,700
Notes: Most Likely
Likely $500,700 Reach 1 Dewatering & Control of WaterLow $609,100 Reach 2 Dewatering & Control of Water
$1,941,200 Reach 3 Dewatering & Control of WaterHigh $1,429,700 Reach 4 Dewatering & Control of Water
$769,600 Reach 5 Dewatering & Control of Water$2,423,800 Reach 6 Dewatering & Control of Water$1,331,700 9020110 RRN Inlet Control Structure Dewatering
$9,005,800
Assumption: Control and Diversion of WaterPercentile Assumption values
0% ($4,453,043)10% ($2,474,501)20% ($1,648,980)30% ($1,002,567)40% ($468,829)50% ($12,678)60% $448,58370% $980,16280% $1,603,41590% $2,453,108
100% $4,453,183
Assumes 50% less costs of baseline for dewatering items
Assumes 50% greater costs of baseline for dewatering items. (Baseline is estimated to be 2% of constructon cost so high = 3%)
MVP - Fargo/Moorhead Feasibility Report (Minnesota Option) - Cost Risk Analysis Model
Likely assumes no change from the baseline estimate.
This item captures the risk that will cause a variance from the current working estimate for the project.
USACE-MVP-0000087977
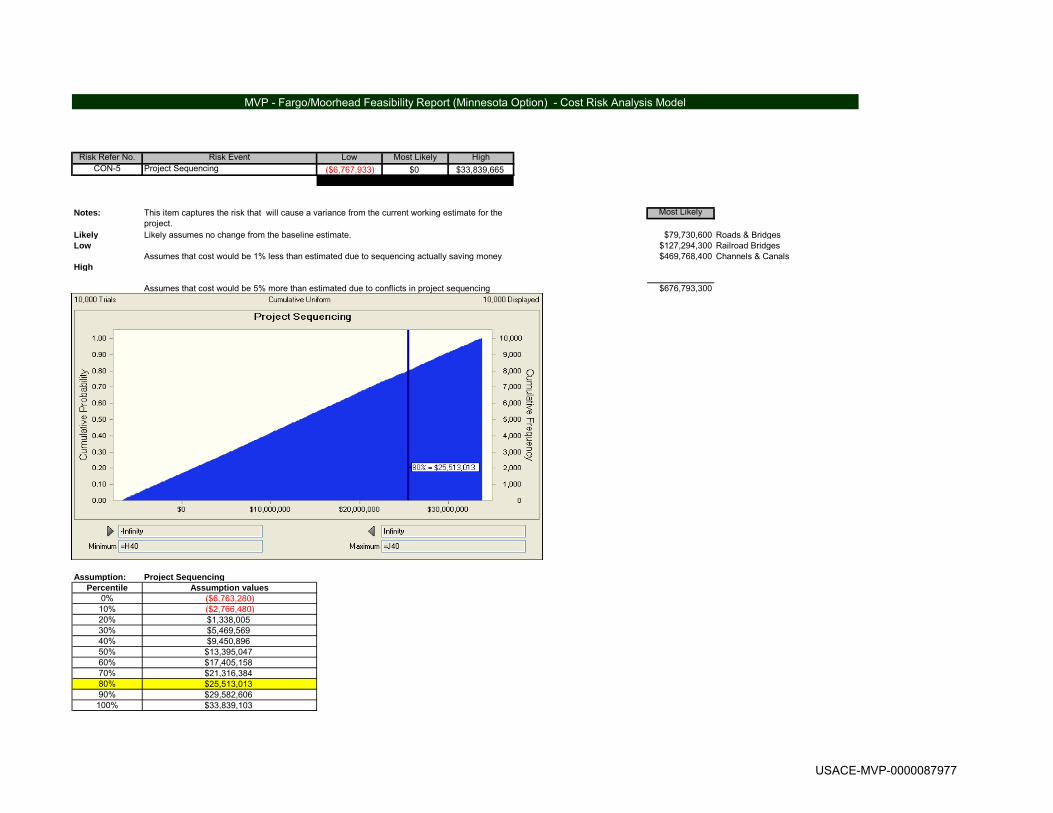
Risk Refer No. Risk Event Low Most Likely HighCON-5 Project Sequencing ($6,767,933) $0 $33,839,665
$670,025,367 $676,793,300 $710,632,965
Notes: Most Likely
Likely $79,730,600 Roads & BridgesLow $127,294,300 Railroad Bridges
$469,768,400 Channels & CanalsHigh
$676,793,300
Assumption: Project SequencingPercentile Assumption values
0% ($6,763,280)10% ($2,766,480)20% $1,338,00530% $5,469,56940% $9,450,89650% $13,395,04760% $17,405,15870% $21,316,38480% $25,513,01390% $29,582,606100% $33,839,103
MVP - Fargo/Moorhead Feasibility Report (Minnesota Option) - Cost Risk Analysis Model
This item captures the risk that will cause a variance from the current working estimate for the project.Likely assumes no change from the baseline estimate.
Assumes that cost would be 1% less than estimated due to sequencing actually saving money
Assumes that cost would be 5% more than estimated due to conflicts in project sequencing
USACE-MVP-0000087977

Risk Refer No. Risk Event Low Most Likely HighCON-6 Contract Mods ($36,358,395) $0 $72,716,790
$690,809,505 $727,167,900 $799,884,690
Notes: Most Likely
Likely $79,730,600 Roads & BridgesLow $11,565,900 Environmental mitigation
$127,294,300 Railroad BridgesHigh $469,768,400 Channels & Canals
$19,605,100 Levees & Floodproofing$19,203,600 Recreation Features
$727,167,900
Assumption: Contract ModsPercentile Assumption values
0% ($35,835,021)10% ($16,396,074)20% ($8,065,684)30% ($1,807,315)40% $3,824,01850% $10,321,34460% $16,799,32170% $24,287,53280% $33,913,61390% $45,216,783100% $71,714,760
MVP - Fargo/Moorhead Feasibility Report (Minnesota Option) - Cost Risk Analysis Model
This item captures the risk that will cause a variance from the current working estimate for the project.Likely assumes no change from the baseline estimate.Assumes that cost would be 5% less than estimated due to contract mods that save money (i.e., by contractor VE proposals)
Assumes that cost would be 10% more than estimated due to contract mods (5% already accounted for in TL-4 Variation in Estimated Quantities)
USACE-MVP-0000087977

Risk Refer No. Risk Event Low Most Likely HighEST-1 Potential Fluctuation in Labor Costs ($16,384,590) $0 $32,769,180
$147,461,310 $163,845,900 $196,615,080
Notes: Most Likely
Likely $163,845,900 Labor Costs from MIILow
High $163,845,900 Total
Assumption: Potential Fluctuation in Labor CostsPercentile Assumption values
0% ($16,101,197)10% ($7,218,021)20% ($3,588,150)30% ($699,109)40% $1,699,36250% $4,437,11160% $7,553,13770% $10,966,86480% $14,901,20990% $20,152,845100% $32,429,939
Assumes labor cost is 10% less
Assumes labor cost is 20% greater than baseline
MVP - Fargo/Moorhead Feasibility Report (Minnesota Option) - Cost Risk Analysis Model
Likely assumes no change from the baseline estimate.
This item captures the risk that will cause a variance from the current working estimate for the project.
USACE-MVP-0000087977

Risk Refer No. Risk Event Low Most Likely HighEST-2 WBS Elements - Estimate confidence $0 $0 $0
$0 $0 $0
Notes: Most Likely
Likely $54,782,300 Lands & DamagesLow $11,565,900 Environmental Mitigation
High $66,348,200
MVP - Fargo/Moorhead Feasibility Report (Minnesota Option) - Cost Risk Analysis Model
This item captures the risk that will cause a variance from the current working estimate for the project.Likely assumes no change from the baseline estimate.
Assumes that cost would be 10% less than estimated for L&D and Mitigation
Assumes that cost would be 30% more than estimated for L&D and Mitigation. These are the two WBS elements with the least confidence or lack of design.
USACE-MVP-0000087977

Risk Refer No. Risk Event Low Most Likely HighEST-4 PED & CM ($43,504,290) $0 $0
$117,622,710 $161,127,000 $161,127,000
Notes: Most Likely
Likely $109,859,000 PEDLow $51,268,000 CM
High $161,127,000
Assumption: PED & CMPercentile Assumption values
0% ($42,751,215)10% ($29,846,868)20% ($23,977,806)30% ($19,481,652)40% ($15,633,372)50% ($12,552,343)60% ($9,730,793)70% ($7,003,396)80% ($4,517,945)90% ($2,261,589)
100% ($1,510)
MVP - Fargo/Moorhead Feasibility Report (Minnesota Option) - Cost Risk Analysis Model
This item captures the risk that will cause a variance from the current working estimate for the project.Likely assumes no change from the baseline estimate.
Assumes that PED & CM cost would be the percent of the currently estimated construction cost used of 22% (15 + 7)
Assumes that PED & CM cost would be a total of 16% of the project cost rather than the currently used 22% (15 + 7). The 16% is based on the $410M Grand Forks/East Grand Forks Flood control project which was more urban levees & floodwalls. (16/22 = 0.727)
USACE-MVP-0000087977

Risk Refer No. Risk Event Low Most Likely HighPR-1 Uncertainty with Funding Stream $0 $0 $0
$0 $0 $0
Notes: Most Likely
Likely $948,302,800 Project costLow
High
$948,302,800
Assumes 5% less of construction cost if funding is excelerated from projections
Assumes 20% greater cost of construction if funding is delayed from projections
MVP - Fargo/Moorhead Feasibility Report (Minnesota Option) - Cost Risk Analysis Model
Removed From Cost Risk Study as this is captured by the Schedule Risk Analysis
Likely assumes no change from the baseline estimate.
This item captures the risk that will cause a variance from the current working estimate for the project.
USACE-MVP-0000087977

Risk Refer No. Risk Event Low Most Likely High
PR-7Lawsuit Risk from NGOs and Downstream Interests $0 $0 $47,415,140
$948,302,800 $948,302,800 $995,717,940
Notes: Most Likely
Likely $948,302,800 Project CostsLow
High
$948,302,800
Assumption: Lawsuit Risk from NGOs and Downstream InterestsPercentile Assumption values
0% $1,55210% $4,641,11020% $9,488,29330% $14,070,82340% $18,876,47950% $23,625,14560% $28,565,18970% $33,091,42980% $37,853,40890% $42,713,613
100% $47,403,774
Assumes 5% greater cost due to lawsuits from downstream interest
Assumes cost to remain at baseline if there are no lawsuits from downstream interest
MVP - Fargo/Moorhead Feasibility Report (Minnesota Option) - Cost Risk Analysis Model
Likely assumes no change from the baseline estimate.
This item captures the risk that will cause a variance from the current working estimate for the project.
USACE-MVP-0000087977

Overall Project ScopeVery LikelyLikelyUnlikelyVery UnlikelyNegligible
MarginalSignificantCriticalCrisis Cost ImpactsLow For the Fargo/Moorhead Project, any cost impact of $10 Million or higher should be considered at least "Significant."Moderate Anything over $5 Million should be considered at least "Marginal."High
Schedule ImpactsFor the Fargo/Moorhead Project, any schedule impact of 12 months or greater should be considered at least "Significant."Anything over 6 months should be considered at least "Marginal."
PDT Discussions Likelihood* Impact* Risk Level*Rough Order
Impact ($) Likelihood* Impact* Risk Level*Rough Order Impact (mo)
Correlation to Other(s)
PROJECT & PROGRAM MGMT
PPM-1Project Schedule in Question
Due to the size and magnitude of the project, as well as the complexity of the structures and sequencing, there is
inherent concern regarding the actual project schedule.This could cause a variance in the project schedule
(positive or negative, but most likely negative). Likely Significant High Likely Marginal Moderate Uniform Project Manager Project Cost & Schedule
PPM-2Accelerated Design Schedule
An accelerated schedule can result in inadequate studies, shortcuts in plans, change in contract acquisition strategy, failure to capture full scope, miss-steps, etc. There is the
potential of moving forward with limited information.
An accelerated design schedule could impact the whole project design if there is not enough time to fully plan. This
could impact both cost and schedule. Likely Significant High Likely Significant High Triangular District Management Project Cost & Schedule
PPM-3Accelerated Construction Schedule
The need for physical progress on the ground supports construction acceleration as much as practical.
Acceleration comes in the form of concurrent construction activities, added overtime costs, perdiem costs, possible
contractor conflicts, congested work areas, poorly developed contracts resulting in more modifications and
claims.Most of these subfeatures are already captured in the
design and estimate, but the configuration may change. Likely Marginal Moderate Likely Significant High Triangular District Management Project Cost & Schedule
PPM-4Local Agency/Regulator Issues
The acceleration of the planning schedule has forced reviews and collaboration without much time given to local
agencies and regulators. Although there has been communication between the Government and the local
agencies, these agencies have not responded with definitive decisions. This could present potential impacts.
This could impact cost and schedule. There is however about two years before construction starts to resolve
issues. Unlikely Negligible Low Unlikely Marginal Low Yes-No Project Manager Project Cost & Schedule
PPM-7 Conflicting Priorities
The District's workload and competing priorities may impede progress on this project related to staff availability and experience, related to design, investigations, contract
procurements, construction management. Could cause a variance in the schedule. Unlikely Marginal Low Unlikely Marginal Low Uniform District Management Project Schedule
PPM-8 Scope Changes
The many competing interests & priorities, coupled with an accelerated schedule could result in scope changes currently uncaptured or unanticipated. These scope changes would require additional coordination, cause
further design and investigation and potentially impact the real estate acquisitions.
While minor alterations to the final alignment may occur, there should not be any major changes. Likely Marginal Moderate Likely Significant High Yes-No Project Manager Project Cost & Schedule
The Fargo-Moorhead Feasibility Study purpose is to identify measures and develop a regional system to reduce flood risk along the Red River of the North for the entire F-M metroploitan area. The study PDT collected, evaluated and screened an array of possible flood risk management plans to define the costs, benefits and impacts to the project area. The plans resulted in a diversion channel alternative as the best measures to reduce the flood risk. A diversion through Minnesota around the city of Moorhead offered the plan with the lowest cost having a B/C ratio over one. The local sponsors preferred a diversion alternative through North Dakota around the city of Fargo as a locally preferred plan. The PDT has developed plans and estimates for both the MN Plan and the LPP ND plan.
MVP - Fargo/Moorhead Feasibility Report (Minnesota Option) - PDT Risk Register (Draft)
Concerns
Contract Risks (Internal Risk Items are those that are generated, caused, or controlled within the PDT's sphere of influence.)
Project Cost Project Schedule
Risk No. Risk/Opportunity EventVariance
DistributionAffected Project
ComponentResponsibility/POC
VeryLikely Low Moderate High High High
Likely Low Moderate High High High
Unlikely Low Low Moderate Moderate High
VeryUnlikely Low Low Low Low High
Negligible Marginal Significant Critical Crisis
Impact or Consequence of Occurrence
Likelih
ood o
f Occu
rrence
Risk Level
USACE-MVP-0000087977

PDT Discussions Likelihood* Impact* Risk Level*Rough Order
Impact ($) Likelihood* Impact* Risk Level*Rough Order Impact (mo)
Correlation to Other(s)Concerns
Project Cost Project Schedule
Risk No. Risk/Opportunity EventVariance
DistributionAffected Project
ComponentResponsibility/POC
CONTRACT ACQUISITION RISKS
CA-1Undefined Acquisition Strategy
The overall acquisition strategy for both design and construction has not been defined. Acquisition strategy could affect/impact bid competition and bid costs. It can also move risk onto the Government, causing need for
greater contingencies. Clarification should be made related to number of contracts, contract types, etc. authority for this
procurement.Acquisition stratagy needs to be defined and could impact
the cost and schedule. Likely Marginal Moderate Unlikely Marginal Low Triangular TASBContract Cost & Project
Schedule
CA-2Preference to Small Business
Most of the larger requirements are so large that they would not be suitable for small business. However, there is
potential for some of the restoration, seeding, and mitigation may be suitable for small business. There is a requirement for review by the PARC if the requirements were less than
$50 Million.
The project is so large, it is likely that even separable requirements would not be suitable for small business.
Could impact cost and schedule. Unlikely Marginal Low Unlikely Marginal Low Triangular ContractingContract Cost & Project
Schedule
CA-3Numerous Separate Contracts
There is potential to have numerous separate contracts, especially if the continuing contracts authority is not
granted. Funding stream issues could also have an impact on the number of contracts.
The best case would be 6 contracts. The worst case would be in excess of 10 contracts. More contracts could
increase bidding competition. This could have a significant effect on cost and schedule (either positive or negative). Very Likely Significant High Unlikely Marginal Low Triangular Contracting Contract Cost
CA-4 Potential Bid Protests
The larger size of the project increase contractor interests in bidding, but also increases potntial risk for protets due to hungry economy and interest in obtaining project dollars. This could impact cost and schedule. Likely Marginal Moderate Likely Marginal Moderate Yes-No District Management Project Cost & Schedule
CA-5 Contracting Staff shortages
Contracting is experiencing a lack of staffing, causing challenges in obtaining resources on a timely basis for all
procurements.
Could cause a variance in the schedule, though by the time procuremenrts are needed for construction, staffing issues
could be resovled. Unlikely Marginal Low Unlikely Marginal Low Uniform District Management Project Schedule
TECHNICAL RISKS
TL-1Uncertainty with Geotechnical Conditions
There is uncertainty with geotechnical conditions for excavation regarding characterization and wet material,
specifically on how that will impact the construction productivity. The material is all clay and silt.
The current working estimate is fairly conservative. However, variation in the ultimate characterization of
material could cause significant variance in productivity. Could impact cost and schedule (positive or negative). Likely Marginal Moderate Likely Marginal Moderate Triangular Geotechnical/Civil Design
Contract Cost & Project Schedule
TL-2 Survey Data IncompleteThe PDT currently has incomplete or outdated survey data
(for bathymetry for the Red River and Tributaries).
If the survey data uncovers data that differs greatly from current conceptual design, it could lead to variance in cost
(due to issues such as configuration and details for structures). Unlikely Marginal Low Unlikely Negligible Low Triangular Technical Lead
Contract Cost & Project Schedule
TL-3Hazardous Waste/HTRW Concerns
Due to the project footprint involving BNSF's rail yard, there is the possibility that HTRW or hazardous substances may
be encountered.
There is the potential for contaminated and or petroleum based contamination, as well as other deleterious
substances. This would only impact schedule, as HTRW cleanup is not part of the project cost. Very Unlikely Negligible Low Likely Significant High Yes-No Geotechnical/Civil Design
Contract Cost & Project Schedule
TL-4Variation in Estimated Quantities
There is potential for variation of estimated quantities in the excavation and earthwork features. This could impact cost and schedule. Likely Significant High Likely Marginal Moderate Yes-No Hydrology/Hydraulic Design Contract Cost
TL-5 Flowrate Capacity
If during detailed design the hydraulics change, it could affect the amount of flow required for the diversion channel to handle. This would affect channel width, bridge lengths
and major hydraulic structure sizes This could impact cost. Unlikely Marginal Low Likely Marginal Moderate Yes-No Hydrology/Hydraulic DesignContract Cost & Project
Schedule
TL-6 Relocations - Utilities Quality of design at budget levelMost costs were obtained from affected utilities for the
major lines that are impacted. Likely Marginal Moderate Unlikely Negligible Low Triangular Cost Engineering Contract Cost
TL-7 Relocations - BridgesBridge costs will change depending on final diversion
channel width Bridge costs from historical DOT costs are fairly reliable. Likely Marginal Moderate Unlikely Negligible Low Triangular Cost Engineering Contract Cost
TL-8 Mitigation fish, wetlands, firest, adaptive management
Resource agencies have not agreed to any particular features yet so there is the potential for additional mitigation
beyond what is proposed. Very Likely Significant High Likely Negligible Low Uniform Environmental Compliance Contract Cost
TL-9Diversions Excavations & Productivity
Excavations could be impacted by diversion alignment changes and/or model results Impacts should only affect quantities of different soil layers Likely Marginal Moderate Likely Marginal Moderate Triangular Technical Lead Contract Cost
TL-10 Hydraulic Structures Hydraulic structures will need to be modeled Model results could change design concepts Likely Significant High Likely Marginal Moderate Triangular Technical LeadContract Cost & Project
Schedule
TL-11 LeveesLevee heights and lengths could change depending on if
upstream staging is incorporatedThe FCP MN alternative is not likely to change to
incorporate upstream staging Unlikely Significant Moderate Unlikely Marginal Low Triangular Technical Lead Contract Cost
USACE-MVP-0000087977

PDT Discussions Likelihood* Impact* Risk Level*Rough Order
Impact ($) Likelihood* Impact* Risk Level*Rough Order Impact (mo)
Correlation to Other(s)Concerns
Project Cost Project Schedule
Risk No. Risk/Opportunity EventVariance
DistributionAffected Project
ComponentResponsibility/POC
TL-12Non-Structural Floodproofing
Costs for downstream impacts could change when the effects of have been fully developed
This is dependent on the takings anaylsis which so far has indicated thaqt there is not a takings Likely Marginal Moderate Unlikely Marginal Low Triangular Technical Lead Contract Cost
TL-13 Recreational Facilities Feasibility is at conceptual designFnial designs could look different than Feasibility but overall
concepts should be similar Likely Marginal Moderate Unlikely Marginal Low Triangular Cost Engineering Contract Cost
USACE-MVP-0000087977

PDT Discussions Likelihood* Impact* Risk Level*Rough Order
Impact ($) Likelihood* Impact* Risk Level*Rough Order Impact (mo)
Correlation to Other(s)Concerns
Project Cost Project Schedule
Risk No. Risk/Opportunity EventVariance
DistributionAffected Project
ComponentResponsibility/POC
LANDS AND DAMAGES RISKS
LD-1 Concerns with the Rail yard
The alignment currently goes through a BNSF rail yard. Due to the complication of working in an active rail yard, with the requirement of bridge construction/relocation/or
reconfiguration could present significant challenges.
The real risk is obtaining agreement from the railroad on the exact configuration of the rail yard crossing. Could impact
cost or schedule. Unlikely Crisis High Unlikely Critical Moderate Yes-No Project Manager Project Cost & Schedule
LD-2Mitigation Needs Identified for Downstream Impacts
The effects of the project on areas downstream may require mitigation footprint that has not been finalized. The impacts are not fully captured, and a determination has to be made
as to whether a "taking" will be required.
The PDT feels that a "taking" is unlikely. This could significantly impact costs if there is a taking, and it could
significantly impact schedule. Unlikely Significant Moderate Unlikely Significant Moderate Yes-No Real Estate Project Cost & Schedule
LD-3Potential Savings for Eliminating RR Bridge 1
Currently, the BNSF RR has limited use of this line and indicated that abandonement is possible This could save the cost of bridge and track raise Unlikely Significant Moderate Very Unlikely Negligible Low Yes-No Project Manager Project Cost & Schedule
LD-4 Appraisal
Appraisals carry certain assumptions based on technical information. If the techncial information has the potential to
change, the appraisals could be impacted. Appraisals are using an average value Likely Significant High Likely Marginal Moderate Triangular Real Estate Project Cost
LD-5 Non-Appraisal
Real Estate office is responsible for establishing contingencies. There could be risks outside their domain
that can still impact the costs. Real Estate office will be using the CSRA contingencies Likely Marginal Moderate Likely Marginal Moderate Triangular Real Estate Project Cost
LD-6 Labor to Process REThe estimated labor to manage and process the real estate
needs may not be properly estimated.Real Estate office has accounted for RE admin in the
estimate Unlikely Marginal Low Very Unlikely Negligible Low Triangular Real Estate Project Cost
REGULATORY AND ENVIRONMENTAL RISKS
RE-1Environmental Mitigation Feature Concerns
The PDT is going to add a lump sum for separable environmental mitigation (to include construction and real
estate). This has not been well defined or finalized.This could impact the costs either positively or negatively.
This item is more likely to vary on the low side. Likely Significant Moderate Very Unlikely Negligible Low Triangular Environmental Compliance Project Cost
RE-2Historical Cultural Resource Issues
There is potential to find cultural resources, particularly on the riverbanks. No cultural resource survey has been
completed to date. Mitigiation will probably be necessary. Could impact cost. Very Likely Marginal Moderate Unlikely Marginal Low Triangular Environmental Compliance Project Cost
RE-3 Fish Passage Issues
There will be fish passage requirement in the project, but the actual configuration has not been finalized/agreed upon
by the local agencies.
Could impact cost, however fish passage has been designed into the hydraulic structures so only minor design
refinements should be required. Unlikely Marginal Low Unlikely Negligible Low Triangular Technical Lead Project Cost
RE-4Pressure to Compress Permitting Activities
The local agencies perceive that they are being pressured through the project permitting process.
PDT has programmed this into the schedule, and the agencies are not constricted more than normal review
times. Very Unlikely Negligible Low Unlikely Negligible Low Uniform Environmental Compliance Project Cost & Schedule
RE-5 HTRW Issues
There is some potential for discovery of HTRW in the project alignment. Most of the alignment is through
farmland.
Could impact cost and schedule. Since most of the project is through farmland there likely should not be any major
issues Unlikely Marginal Low Unlikely Negligible Low Uniform Environmental Compliance Project Cost & Schedule
CONSTRUCTION RISKS
CON-1Unknown Residential Utility Conflicts
There is potential for the need to abandon some small residential utilities.
This could impact cost and schedule, but it would be negligible. Likely Negligible Low Unlikely Negligible Low Triangular Technical Lead
Contract Cost & Project Schedule
CON-2Control and Diversion of Water
Methodology of controlling water could be impacted by the sequencing and timing of relocation, the characterization of
materials, or other unknown impacts.
Could impact cost and schedule. This is more likely to affect cost from using larger pumping equipment or for
increased handling of water. Likely Marginal Moderate Unlikely Marginal Low Triangular Technical Lead Contract Cost
CON-3Conflicts between Contractors
There is potential for conflicts between multiple contractors working in the same footprint at the same time.
Could impact cost. However, careful planning of the construction scheduling and sequencing should be able to
avoid any major conflicts. Likely Negligible Low Unlikely Negligible Low Triangular ConstructionContract Cost & Project
Schedule
CON-4 Sufficient QA Staff to manage numerous contracts, mods and claimsED-C is well aware of QA staffing issues and is planning
accordingly Unlikely Marginal Low Unlikely Negligible Low Triangular ConstructionContract Cost & Project
Schedule
CON-5 Project Sequencingconflicts between contractors and schedule impacts (one
contractor waiting on another)Conficts may develop at reaches interface, building of
bridges or hydraulic structures Likely Significant High Likely Marginal Moderate Uniform ConstructionContract Cost & Project
Schedule
CON-6 Contract Mods
Contract mods and claims resulting from unforeseen site conditions, weather impacts, political and lawsuit impacts are a concern and can impact both cost and schedule.
Many of these concerns may be valid and impact the project Likely Significant High Likely Negligible Low Triangular Construction
Contract Cost & Project Schedule
USACE-MVP-0000087977

PDT Discussions Likelihood* Impact* Risk Level*Rough Order
Impact ($) Likelihood* Impact* Risk Level*Rough Order Impact (mo)
Correlation to Other(s)Concerns
Project Cost Project Schedule
Risk No. Risk/Opportunity EventVariance
DistributionAffected Project
ComponentResponsibility/POC
ESTIMATE AND SCHEDULE RISKS
EST-1Potential Fluctuation in Labor Costs
There is concern that the labor force required for this work could be a challenge, requiring off-site labor, per diem and premium pay, as well as unique markups and multipliers for
workers compensation and other factors.
Estimate currently has National Wage rates, which are higher than the local Davis-Bacon Wage Determination.
The Estimate also includes $75/day for per diem. There is potential for savings, as the labor wage rate for North
Dakota is cheaper than Minnesota. This could impact costs either positively or negatively. Likely Significant High Very Unlikely Negligible Low Triangular Cost Engineering Contract Cost
EST-2WBS Elements - Estimate confidence
Certain WBS elements are better developed in scope and estimate than other scope areas. Some WBS elements may be more or less conservative. Some elements have greater risk and resulting need for greater contingencies.
The major cost elements for the diversion excavation, hydraulic structures and bridges have been highly
developed for feasibility since they make up the bulk of the cost items. Environmental mitigation features are less
develop and more conceptual and likely will change. Real Estate may be another area of risk confidence Likely Marginal Moderate Likely Negligible Low Triangular Cost Engineering Project Cost & Schedule
EST-3 Estimate assumptions
The estimate assumptions may be flawed in certain cost areas related to scope, crews, productivity, material cost, markups, contingencies, etc. This could result in a flawed
budget development.
The estimate has been in development for enough time that scope, crews, productivety, matrerial costs and markups
are fairly well developed. Contingencies are from the CSRA Unlikely Marginal Low Unlikely Negligible Low Triangular Cost Engineering Project Cost & Schedule
EST-4 PED & CMThe estiamte currently uses 15% PED and 7% CM of the
constrcution cost.
With the high construction cost of this project and the amount of design required for excavation, these
percentages may be too high, based on about 16% for the $410M Grand Forks/East Grand Forks Flood project which
was more urban levees & floodwalls. Likely Significant High Likely Negligible Low Triangular Cost Engineering Project Cost
PR-1Uncertainty with Funding Stream
There is a window of opportunity during the next couple years of obtaining the necessary increments on a timely basis. However, historically this has been a challenge in
obtaining the increments necessary to complete on schedule, and there have been challenges in obtaining
them on a timely basis. This could impact both cost and schedule. Very Likely Significant High Very Likely Significant High Uniform Project Manager Project Cost & Schedule
PR-2 Unusually Wet Season
If a given construction season is unusually higher than an average year, it could have significant impact on the
productivity of the work.If this it occurs, it reduces productivity and could create
substantial delays. Unlikely Marginal Low Unlikely Marginal Low Binomial N/A Project Cost & Schedule
PR-3 Flooding EventThere is a chance of a flooding event during construction that could cause damage to constructed work features.
This could impact both cost and schedule. The RRN usually has several days before major flood stage is reached, thus contractor should have suffient time to
protect any work Very Unlikely Negligible Low Very Unlikely Negligible Low Binomial N/A Project Cost & Schedule
PR-4 Lawsuit Risk
The City of Dilworth has voiced objection over the route of the current project alignment, as they perceive too few
benefits from the project.PDT feels that this risk could be mitigated and managed.
Could impact cost and schedule. Unlikely Marginal Low Unlikely Significant Moderate Yes-No Project Manager Project Schedule
PR-5Political factors change at state, local, or federal level
Political factors at the local or state levels may change, impacting project support. Senator Dorgan has retired. He was very influential and favorable to the project interests.
Since the authorization was not obtained prior to his departure, there is concern that the project will not be
authorized or funded on a timely basis.
There is more chance of local or state political opposition on the Minnesota plan because of impacts to Dilwrorth, MN and the downstream communities that may be impacted.
Could impact cost and schedule. Unlikely Marginal Low Likely Critical High Yes-No Project Manager Project Schedule
PR-7Lawsuit Risk from NGOs and Downstream Interests
There may be perceived damages from downstream concerns - this may be more on the MN side Could impact cost and schedule. Likely Marginal Moderate Very Likely Significant High Uniform Project Manager Project Schedule
10. Project Implications identifies whether or not the risk item affects project cost, project schedule, or both. The PDT is responsible for conducting studies for both Project Cost and for Project Schedule.11. Results of the risk identification process are studied and further developed by the Cost Engineer, then analyzed through the Monte Carlo Analysis Method for Cost (Contingency) and Schedule (Escalation) Growth.
4. Impact is a measure of the event's effect on project objectives with relation to scope, cost, and/or schedule -- Negligible, Marginal, Significant, Critical, or Crisis. Impacts on Project Cost may vary in severity from impacts on Project Schedule.5. Risk Level is the resultant of Likelihood and Impact Low, Moderate, or High. Refer to the matrix located at top of page.
7. The responsibility or POC is the entity responsible as the Subject Matter Expert (SME) for action, monitoring, or information on the PDT for the identified risk or opportunity.
9. Affected Project Component identifies the specific item of the project to which the risk directly or strongly correlates.
6. Variance Distribution refers to the behavior of the individual risk item with respect to its potential effects on Project Cost and Schedule. For example, an item with clearly defined parameters and a solid most likely scenario would probably follow a triangular or normal distribution. A risk item for which the PDT has little data or probability of modeling with respect to effects on cost or schedule (i.e. "anyone's guess") would probably follow a uniform or discrete uniform distribution.
8. Correlation recognizes those risk events that may be related to one another. Care should be given to ensure the risks are handled correctly without a "double counting."
3. Likelihood is a measure of the probability of the event occurring -- Very Unlikely, Unlikely, Moderately Likely, Likely, Very Likely. The likelihood of the event will be the same for both Cost and Schedule, regardless of impact.
*Likelihood, Impact, and Risk Level to be verified through market research and analysis (conducted by cost engineer).1. Risk/Opportunity identified with reference to the Risk Identification Checklist and through deliberation and study of the PDT.2. Discussions and Concerns elaborates on Risk/Opportunity Events and includes any assumptions or findings (should contain information pertinent to eventual study and analysis of event's impact to project).
Programmatic Risks (External Risk Items are those that are generated, caused, or controlled exclusively outside the PDT's sphere of influence.)
USACE-MVP-0000087977

PDT Discussions Likelihood* Impact* Risk Level*Rough Order
Impact ($) Likelihood* Impact* Risk Level*Rough Order Impact (mo)
Correlation to Other(s)Concerns
Project Cost Project Schedule
Risk No. Risk/Opportunity EventVariance
DistributionAffected Project
ComponentResponsibility/POC
USACE-MVP-0000087977

0.0 Months
60.0 Months
120.0 Months
180.0 Months
240.0 Months
300.0 Months
0% 10%
20%
30%
40%
50%
60%
70%
80%
90%
100%
Dur
atio
n
Confidence Levels
Schedule Contingency (Duration) Analysis
Project Duration at 80% Confidence Level
Current Project Duration
Corresponding VarianceDuration
USACE-MVP-0000087977

MVP - Fargo/Moorhead Feasibility Report (Minnesota Option) - Schedule Risk Analysis
USACE-MVP-0000087977

Likelihood* Impact* Risk Level* Correlation to Other(s) Low Most Likely High Low Most Likely High
PPM-1 Project Schedule in Question Likely Marginal Moderate Uniform -6.0 Months 0.0 Months 12.0 Months 0 -6.29% 0.00% 12.57% 100%
PPM-2 Insufficient Time to Plan Likely Significant High
Removed from the Analysis, as this is already captured by Risk
LD-1
PPM-3Accelerated Construction Schedule Likely Significant High Triangular -6.0 Months 0.0 Months 18.0 Months 0 -6.29% 0.00% 18.86% 100%
PPM-8 Scope Changes Likely Significant High Uniform -6.0 Months 0.0 Months 12.0 Months 0 -6.29% 0.00% 12.57% 100%
CA-4 Potential Bid Protests Likely Marginal Moderate Yes-No/Uniform 0.0 Months 0.0 Months 12.0 Months 0 0.00% 0.00% 12.57% 65%
TL-1Uncertainty with Geotechnical Conditions Likely Marginal Moderate Triangular -6.0 Months 0.0 Months 12.0 Months 0 -6.29% 0.00% 12.57% 100%
TL-3Hazardous Waste/HTRW Concerns Likely Significant High Yes-No/Uniform 0.0 Months 0.0 Months 12.0 Months 0 0.00% 0.00% 12.57% 65%
TL-4Variation in Estimated Quantities Likely Marginal Moderate Uniform -6.0 Months 0.0 Months 6.0 Months 0 -6.29% 0.00% 6.29% 100%
TL-5 Flowrate Capacity Likely Marginal Moderate Yes-No/Triangular -12.0 Months 0.0 Months 12.0 Months 0 -12.57% 0.00% 12.57% 65%
TL-9Diversions Excavations & Productivity Likely Marginal Moderate Triangular -12.0 Months 0.0 Months 12.0 Months 0 -12.57% 0.00% 12.57% 100%
TL-10 Hydraulic Structures Likely Marginal Moderate Triangular 0.0 Months 0.0 Months 12.0 Months 0 0.00% 0.00% 12.57% 100%
LD-1 Concerns with the Rail yard Unlikely Critical Moderate Yes-No/Triangular 0.0 Months 0.0 Months 12.0 Months 0 0.00% 0.00% 12.57% 25%
LD-2Mitigation Needs Identified for Downstream Impacts Unlikely Significant Moderate Yes-No/Triangular 0.0 Months 0.0 Months 12.0 Months 0 0.00% 0.00% 12.57% 25%
LD-4 Appraisal Likely Marginal Moderate Triangular 0.0 Months 0.0 Months 12.0 Months 0 0.00% 0.00% 12.57% 100%
LD-5 Non-Appraisal Likely Marginal Moderate Triangular 0.0 Months 0.0 Months 12.0 Months 0 0.00% 0.00% 12.57% 100%
PR-1Uncertainty with Funding Stream Very Likely Significant High Uniform PR-5 0.0 Months 0.0 Months 84.0 Months 0 0.00% 0.00% 87.99% 100%
PR-4Lawsuit Risk from City of Dilworth Unlikely Significant Moderate Yes-No/Uniform 0.0 Months 0.0 Months 6.0 Months 0 0.00% 0.00% 6.29% 25%
PR-5Political factors change at state, local, or federal level Unlikely Crisis High Yes-No/Uniform PR-1 0.0 Months 0.0 Months 12.0 Months 0 0.00% 0.00% 12.57% 25%
PR-7Lawsuit Risk from NGOs and Downstream Interests Very Likely Significant High Uniform 0.0 Months 0.0 Months 12.0 Months 0 0.00% 0.00% 12.57% 100%
$95
Not Part of Study - Placeholder for Project
Summation Purposes Only0.0 Months
Crystal Ball Simulation
CONTRACT ACQUISITION RISKS
Variance Distribution
MVP - Fargo/Moorhead Feasibility Report (Minnesota Option) - Schedule Risk Analysis ModelCrystal Ball SimulationExpected Values (%s)Project Schedule
Risk/Opportunity Event
TECHNICAL RISKS
Expected Values (mos.)
LANDS AND DAMAGES RISKS
Programmatic Risks (External Risk Items are those that are generated, caused, or controlled exclusively outside the PDT's sphere of influence.)
Percentages are calculated as the variance from the assumption value to facilitate iteration of the model should the cost values change throughout the project phases. Uniform distribution percentages reflect variation from the total project cost.PROJECT & PROGRAM MGMT
Risk No.
Internal Risks (Internal Risk Items are those that are generated, caused, or controlled within the PDT's sphere of influence.)
USACE-MVP-0000087977

Percentile Contingency Baseline w/ Contingency Contingency %0% -4.8 Months 90.7 Months -5.03%
95.46351085 5% 31.3 Months 126.7 Months 32.75%10% 39.6 Months 135.0 Months 41.46%15% 45.7 Months 141.2 Months 47.92%20% 51.3 Months 146.8 Months 53.74%25% 56.4 Months 151.8 Months 59.06%30% 60.7 Months 156.2 Months 63.64%35% 65.1 Months 160.6 Months 68.21%40% 69.5 Months 165.0 Months 72.82%45% 73.8 Months 169.3 Months 77.30%50% 78.1 Months 173.5 Months 81.79%55% 82.1 Months 177.6 Months 86.05%60% 86.6 Months 182.0 Months 90.67%65% 90.8 Months 186.3 Months 95.13%70% 95.2 Months 190.6 Months 99.71%75% 99.9 Months 195.4 Months 104.65%80% 104.8 Months 200.3 Months 109.78%85% 110.0 Months 205.5 Months 115.27%90% 116.0 Months 211.5 Months 121.52%95% 125.0 Months 220.5 Months 130.99%100% 170.5 Months 266.0 Months 178.61%
39920822.847879342.3649755944.6
51175947.9752391087.8
53436537.9354404040.8455369007.1756296401.1763994740.8265225732.2766720886.4368882273.7377260091.28
Baseline Schedule Duration
95.5 Months
95.5 Months
95.5 Months
PROJECT SCHEDULE (BASELINE)
95.5 Months
95.5 Months95.5 Months95.5 Months95.5 Months95.5 Months
95.5 Months
95.5 Months
95.5 Months
95.5 Months95.5 Months95.5 Months
95.5 Months
95.5 Months
95.5 Months95.5 Months95.5 Months
95.5 Months
USACE-MVP-0000087977

Estimated Total Project Cost (Price Level) $948,530,215Max. Anticipated Annual Amount $119,301,192
Enter Current OMB Escalation Rate 1.80%Enter Current Project Location Escalation Rate 1.88%Enter Assumed Monthly Recurring Cost Rate 5.00%
Date Escalation Delta Amount Monthly Recurring Cost Amount Total Schedule ContingencyEnter Current Project Start 29-Jan-10
Enter Baseline Project Completion 11-Jan-18 $6,037,329.85 $6,037,329.85
Project Completion at 0% Confidence 18-Aug-17 $5,733,853.99 ($2,383,968.00) $3,349,885.99
Project Completion at 5% Confidence 18-Aug-20 $8,014,426.20 $15,531,167.52 $23,545,593.72
Project Completion at 10% Confidence 29-Apr-21 $8,540,617.64 $19,664,687.56 $28,205,305.20
Project Completion at 15% Confidence 2-Nov-21 $8,930,603.07 $22,728,235.34 $31,658,838.42
Project Completion at 20% Confidence 20-Apr-22 $9,282,063.26 $25,489,146.33 $34,771,209.59
Project Completion at 25% Confidence 22-Sep-22 $9,602,767.15 $28,008,449.86 $37,611,217.01
Project Completion at 30% Confidence 1-Feb-23 $9,879,244.66 $30,180,331.13 $40,059,575.79
Project Completion at 35% Confidence 14-Jun-23 $10,155,518.15 $32,350,609.70 $42,506,127.85
Project Completion at 40% Confidence 26-Oct-23 $10,433,770.17 $34,536,430.75 $44,970,200.92
Project Completion at 45% Confidence 4-Mar-24 $10,704,278.88 $36,661,423.82 $47,365,702.70
Project Completion at 50% Confidence 13-Jul-24 $10,975,538.62 $38,792,316.66 $49,767,855.28
Project Completion at 55% Confidence 13-Nov-24 $11,232,499.11 $40,810,881.13 $52,043,380.24
Project Completion at 60% Confidence 27-Mar-25 $11,511,246.53 $43,000,593.74 $54,511,840.26
Project Completion at 65% Confidence 4-Aug-25 $11,780,510.11 $45,115,805.72 $56,896,315.84
Project Completion at 70% Confidence 15-Dec-25 $12,057,020.58 $47,287,945.83 $59,344,966.41
Project Completion at 75% Confidence 8-May-26 $12,355,409.47 $49,631,952.91 $61,987,362.38
Project Completion at 80% Confidence 4-Oct-26 $12,665,315.24 $52,066,431.36 $64,731,746.59
Project Completion at 85% Confidence 12-Mar-27 $12,996,510.50 $54,668,150.32 $67,664,660.82
Project Completion at 90% Confidence 9-Sep-27 $13,373,770.42 $57,631,732.29 $71,005,502.71
Project Completion at 95% Confidence 10-Jun-28 $13,945,340.52 $62,121,726.40 $76,067,066.92
Project Completion at 100% Confidence 24-Mar-32 $16,820,877.15 $84,710,631.15 $101,531,508.30
Entry Required
Do Not Overwrite
Summary Data -- Do Not Overwrite
MVP - Fargo/Moorhead Feasibility Report (Minnesota Option) - Schedule Risk Analysis Model
USACE-MVP-0000087977

Risk Refer No. Risk Event Low Most Likely HighPPM-1 Project Schedule in Question -6.0 Months 0.0 Months 12.0 Months
$99 $105 $117
Notes:
Likely Low
High
Assumption: Project Schedule in QuestionPercentile Assumption values
0% '-6.0 Months10% '-4.3 Months20% '-2.4 Months30% '-0.6 Months40% 1.2 Months50% 2.9 Months60% 4.8 Months70% 6.5 Months80% 8.4 Months90% 10.2 Months
100% 12.0 Months
MVP - Fargo/Moorhead Feasibility Report (Minnesota Option) - Schedule Risk Analysis Model
Assumes project schedule is delayed due to complexity of structures and sequencing
Assumes project completion is November 2019. From March 2011 this is = 105 months
Likely assumes no change from the baseline schedule.
This item captures the risk that will cause a variance from the baseline schedule for the project.
Assumes schedule concerns are conservative and actual project schedule can be exceeded
USACE-MVP-0000087977

Risk Refer No. Risk Event Low Most Likely HighPPM-2 Accelerated Design Schedule
MVP - Fargo/Moorhead Feasibility Report (Minnesota Option) - Schedule Risk Analysis Model
Removed from the Analysis, as this is already captured by Risk LD-1
USACE-MVP-0000087977
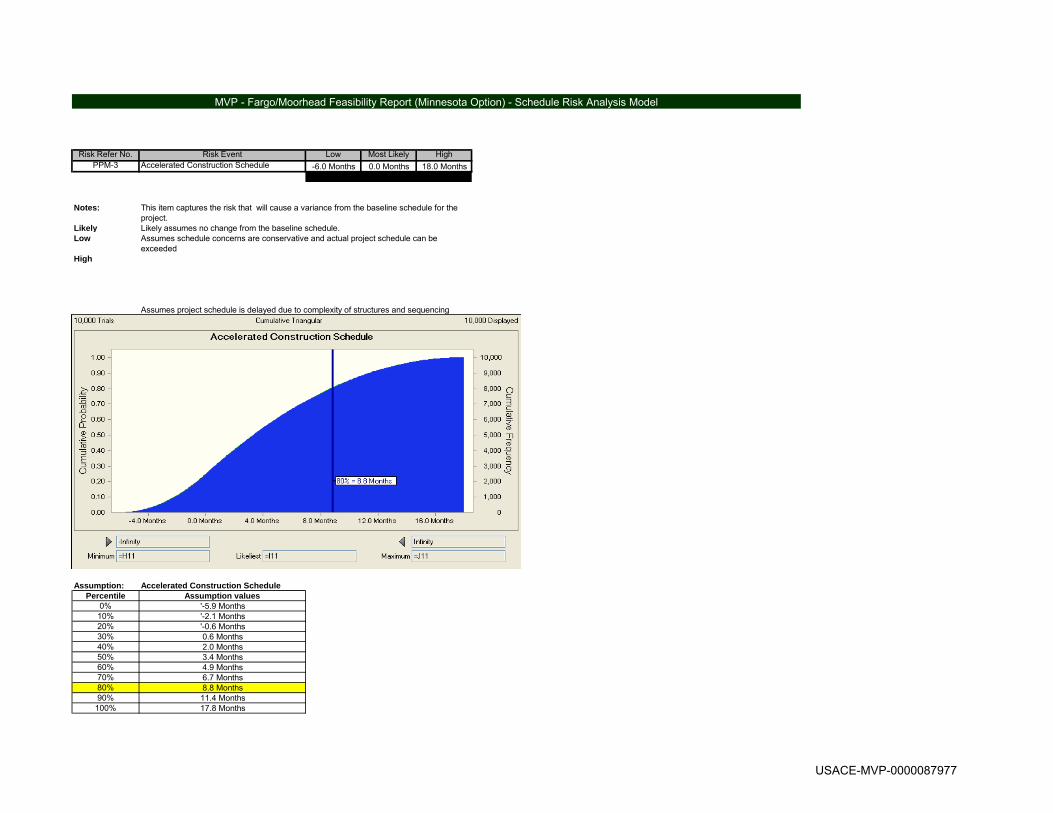
Risk Refer No. Risk Event Low Most Likely HighPPM-3 Accelerated Construction Schedule -6.0 Months 0.0 Months 18.0 Months
$99 $105 $123
Notes:
Likely Low
High
Assumption: Accelerated Construction SchedulePercentile Assumption values
0% '-5.9 Months10% '-2.1 Months20% '-0.6 Months30% 0.6 Months40% 2.0 Months50% 3.4 Months60% 4.9 Months70% 6.7 Months80% 8.8 Months90% 11.4 Months
100% 17.8 Months
MVP - Fargo/Moorhead Feasibility Report (Minnesota Option) - Schedule Risk Analysis Model
This item captures the risk that will cause a variance from the baseline schedule for the project.Likely assumes no change from the baseline schedule.Assumes schedule concerns are conservative and actual project schedule can be exceeded
Assumes project schedule is delayed due to complexity of structures and sequencing
USACE-MVP-0000087977

Risk Refer No. Risk Event Low Most Likely HighPPM-8 Scope Changes -6.0 Months 0.0 Months 12.0 Months
$99 $105 $117
Notes:
Likely Low
High
Assumption: Scope ChangesPercentile Assumption values
0% '-6.0 Months10% '-4.2 Months20% '-2.4 Months30% '-0.5 Months40% 1.2 Months50% 3.0 Months60% 4.9 Months70% 6.6 Months80% 8.4 Months90% 10.2 Months
100% 12.0 Months
MVP - Fargo/Moorhead Feasibility Report (Minnesota Option) - Schedule Risk Analysis Model
This item captures the risk that will cause a variance from the baseline schedule for the project.Likely assumes no change from the baseline schedule.Assumes scope changes decrease project features and schedule.
Assumes scope changes increase project features, footprint and schedule.
USACE-MVP-0000087977

Risk Refer No. Risk Event Low Most Likely HighCA-4 Potential Bid Protests 0.0 Months 0.0 Months 12.0 Months
$105 $105 $117
Notes:
Likely Low
High
Assumption: Potential Bid ProtestsPercentile Assumption values
0% 0.0 Months10% 1.2 Months20% 2.4 Months30% 3.5 Months40% 4.8 Months50% 6.0 Months60% 7.2 Months70% 8.3 Months80% 9.6 Months90% 10.8 Months
100% 12.0 Months
MVP - Fargo/Moorhead Feasibility Report (Minnesota Option) - Schedule Risk Analysis Model
This item captures the risk that will cause a variance from the baseline schedule for the project.Likely assumes no change from the baseline schedule.
Assumes that there are not any bid protest so no changes from baseline schedule
Assumes project schedule is delayed due to bid protests
USACE-MVP-0000087977

Risk Refer No. Risk Event Low Most Likely HighTL-1 Uncertainty with Geotechnical Conditions -6.0 Months 0.0 Months 12.0 Months
-$6 $12
Notes:
Likely
LowHigh
Assumption: Uncertainty with Geotechnical ConditionsPercentile Assumption values
0% '-5.8 Months10% '-2.6 Months20% '-1.3 Months30% '-0.3 Months40% 0.6 Months50% 1.6 Months60% 2.7 Months70% 3.9 Months80% 5.3 Months90% 7.3 Months
100% 11.8 Months
MVP - Fargo/Moorhead Feasibility Report (Minnesota Option) - Schedule Risk Analysis Model
Assumes that best case geotechnical conditions allow construction to advance by 6 months
Assumes that uncertainty with geotechnical condtions causes 12 month delay in construction
Likely assumes no change from the baseline schedule.
This item captures the risk that will cause a variance from the baseline schedule for the project.
USACE-MVP-0000087977

Risk Refer No. Risk Event Low Most Likely HighTL-3 Hazardous Waste/HTRW Concerns 0.0 Months 0.0 Months 12.0 Months
$0 $0 $12
Notes:
Likely Low
High
Assumption: Hazardous Waste/HTRW ConcernsPercentile Assumption values
0% 0.0 Months10% 1.2 Months20% 2.3 Months30% 3.5 Months40% 4.8 Months50% 6.1 Months60% 7.3 Months70% 8.5 Months80% 9.7 Months90% 10.8 Months
100% 12.0 Months
MVP - Fargo/Moorhead Feasibility Report (Minnesota Option) - Schedule Risk Analysis Model
Assumes increase in time to deal with HTRW concerns. Mainly with RR issues
Likely assumes no change from the baseline schedule.
This item captures the risk that will cause a variance from the baseline schedule for the project.
Assumes no change from the baseline since baseline assumes not finding any HTRW concerns
USACE-MVP-0000087977

Risk Refer No. Risk Event Low Most Likely HighTL-4 Variation in Estimated Quantities -6.0 Months 0.0 Months 6.0 Months
-$6 $6
Notes:
Likely LowHigh
Assumption: Variation in Estimated QuantitiesPercentile Assumption values
0% '-6.0 Months10% '-4.8 Months20% '-3.5 Months30% '-2.3 Months40% '-1.1 Months50% 0.1 Months60% 1.3 Months70% 2.4 Months80% 3.6 Months90% 4.8 Months
100% 6.0 Months
MVP - Fargo/Moorhead Feasibility Report (Minnesota Option) - Schedule Risk Analysis Model
Assumes quantities are less than baselineAssume quantities are greater than baseline
Likely assumes no change from the baseline schedule.
This item captures the risk that will cause a variance from the baseline schedule for the project.
USACE-MVP-0000087977

Risk Refer No. Risk Event Low Most Likely HighTL-5 Flowrate Capacity -12.0 Months 0.0 Months 12.0 Months
-$12 $12
Notes:
Likely Low
High
Assumption: Flowrate CapacityPercentile Assumption values
0% '-11.9 Months10% '-6.7 Months20% '-4.4 Months30% '-2.7 Months40% '-1.2 Months50% 0.0 Months60% 1.3 Months70% 2.7 Months80% 4.4 Months90% 6.6 Months
100% 11.9 Months
MVP - Fargo/Moorhead Feasibility Report (Minnesota Option) - Schedule Risk Analysis Model
This item captures the risk that will cause a variance from the baseline schedule for the project.Likely assumes no change from the baseline schedule.
Assumes required flowrates are greater which increases project footprint and quantities and leads to a longer schedule than baseline
Assumes required flowrates are less which decreases project footprint and quantities and leads to a shorter schedule than baseline
USACE-MVP-0000087977
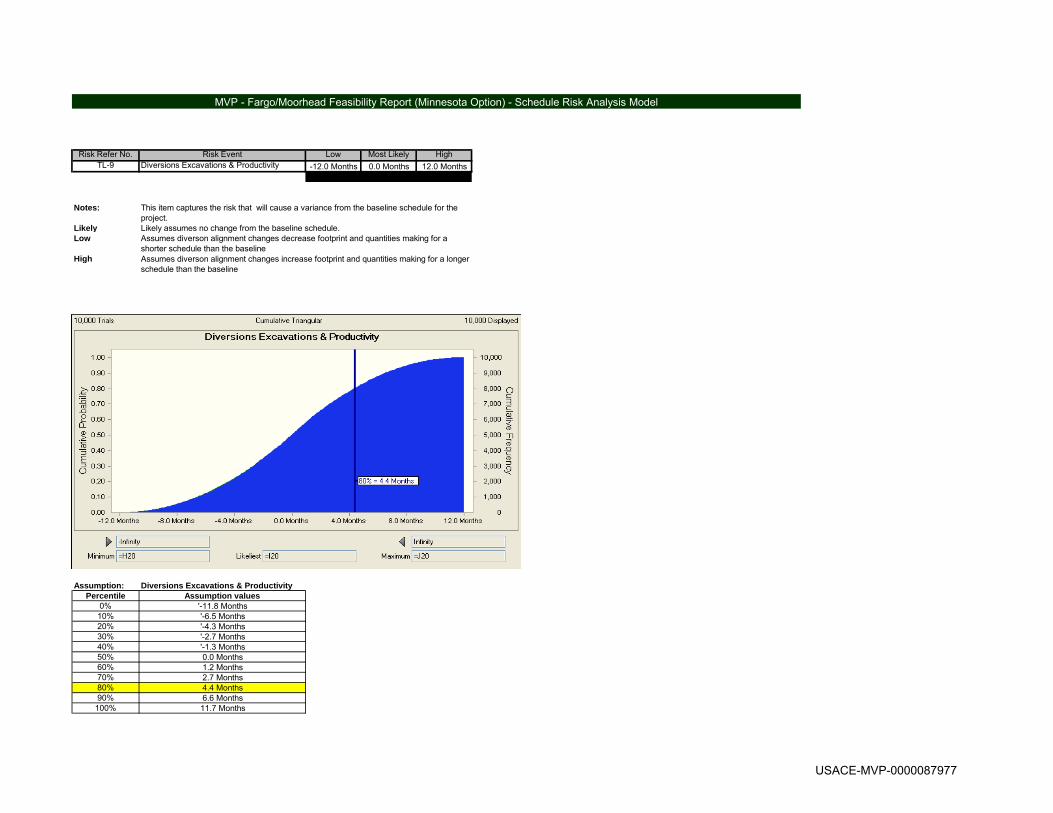
Risk Refer No. Risk Event Low Most Likely HighTL-9 Diversions Excavations & Productivity -12.0 Months 0.0 Months 12.0 Months
-$12 $12
Notes:
Likely Low
High
Assumption: Diversions Excavations & ProductivityPercentile Assumption values
0% '-11.8 Months10% '-6.5 Months20% '-4.3 Months30% '-2.7 Months40% '-1.3 Months50% 0.0 Months60% 1.2 Months70% 2.7 Months80% 4.4 Months90% 6.6 Months
100% 11.7 Months
MVP - Fargo/Moorhead Feasibility Report (Minnesota Option) - Schedule Risk Analysis Model
This item captures the risk that will cause a variance from the baseline schedule for the project.Likely assumes no change from the baseline schedule.Assumes diverson alignment changes decrease footprint and quantities making for a shorter schedule than the baselineAssumes diverson alignment changes increase footprint and quantities making for a longer schedule than the baseline
USACE-MVP-0000087977

Risk Refer No. Risk Event Low Most Likely HighTL-10 Hydraulic Structures 0.0 Months 0.0 Months 12.0 Months
$0 $12
Notes:
Likely Low
High
Assumption: Hydraulic StructuresPercentile Assumption values
0% 0.0 Months10% 0.6 Months20% 1.3 Months30% 2.0 Months40% 2.7 Months50% 3.6 Months60% 4.4 Months70% 5.4 Months80% 6.6 Months90% 8.2 Months
100% 11.9 Months
MVP - Fargo/Moorhead Feasibility Report (Minnesota Option) - Schedule Risk Analysis Model
This item captures the risk that will cause a variance from the baseline schedule for the project.Likely assumes no change from the baseline schedule.
Assumes model studies of hydraulic structures shows that cuurent design is not adequate and that structures should be larger. Additional design and construction time may result
Assumes model studies of hydraulic structures shows that cuurent design is adequate or that structures can be smaller. However smaller structures would probably not reduce the project schedule from the baseline since channel excavation would most likely be controlling
USACE-MVP-0000087977

Risk Refer No. Risk Event Low Most Likely HighLD-1 Concerns with the Rail yard 0.0 Months 0.0 Months 12.0 Months
$0 $0 $12
Notes:
Likely Low
High
Assumption: Concerns with the Rail yard Percentile Assumption values
0% 0.0 Months10% 0.6 Months20% 1.2 Months30% 1.9 Months40% 2.7 Months50% 3.5 Months60% 4.4 Months70% 5.4 Months80% 6.6 Months90% 8.2 Months
100% 12.0 Months
MVP - Fargo/Moorhead Feasibility Report (Minnesota Option) - Schedule Risk Analysis Model
Assumes agreements are not reached quickly with RR and delays the construction of features associated with the RR
Likely assumes no change from the baseline schedule.
This item captures the risk that will cause a variance from the baseline schedule for the project.
Assumes agreements can be reached successfully and quickly with RR but that this most likely would not decrease the schedule from the baseline
USACE-MVP-0000087977
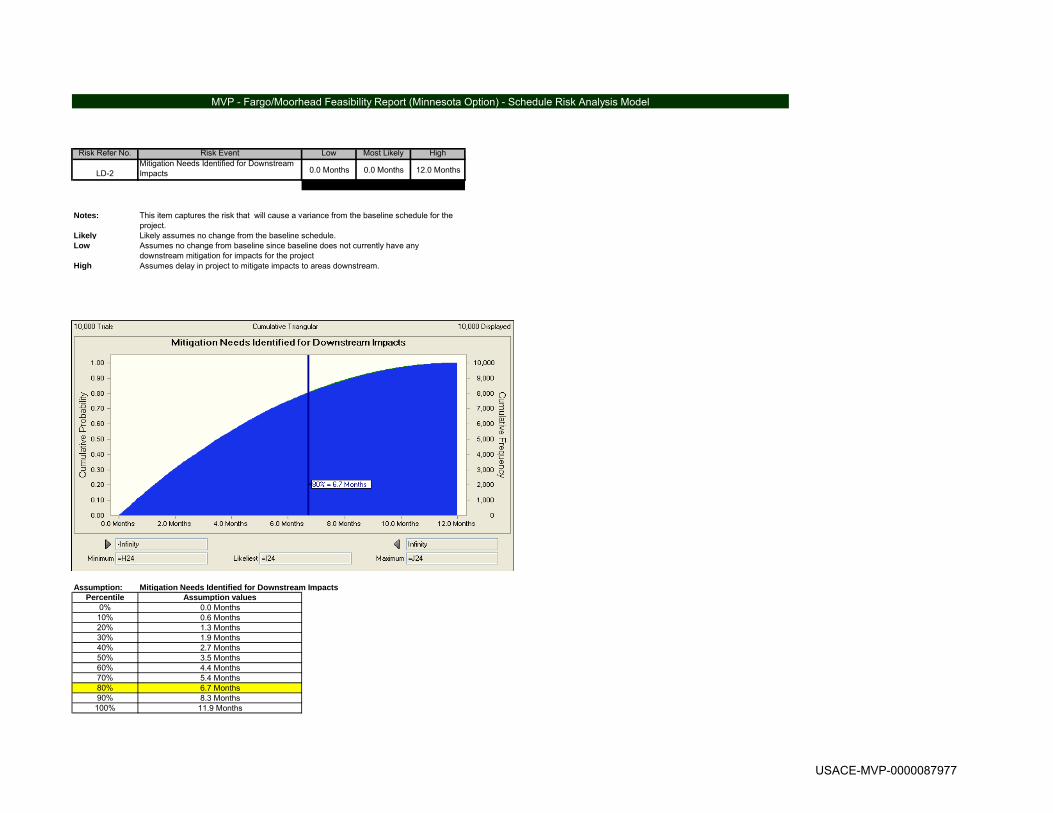
Risk Refer No. Risk Event Low Most Likely High
LD-2Mitigation Needs Identified for Downstream Impacts 0.0 Months 0.0 Months 12.0 Months
$0 $0 $12
Notes:
Likely Low
High
Assumption: Mitigation Needs Identified for Downstream ImpactsPercentile Assumption values
0% 0.0 Months10% 0.6 Months20% 1.3 Months30% 1.9 Months40% 2.7 Months50% 3.5 Months60% 4.4 Months70% 5.4 Months80% 6.7 Months90% 8.3 Months100% 11.9 Months
MVP - Fargo/Moorhead Feasibility Report (Minnesota Option) - Schedule Risk Analysis Model
Assumes delay in project to mitigate impacts to areas downstream.
Likely assumes no change from the baseline schedule.
This item captures the risk that will cause a variance from the baseline schedule for the project.
Assumes no change from baseline since baseline does not currently have any downstream mitigation for impacts for the project
USACE-MVP-0000087977

Risk Refer No. Risk Event Low Most Likely HighLD-4 Appraisal 0.0 Months 0.0 Months 12.0 Months
$0 $0 $12
Notes:
Likely Low
High
Assumption: AppraisalPercentile Assumption values
0% 0.0 Months10% 0.6 Months20% 1.3 Months30% 2.1 Months40% 2.8 Months50% 3.6 Months60% 4.5 Months70% 5.5 Months80% 6.7 Months90% 8.2 Months
100% 11.9 Months
MVP - Fargo/Moorhead Feasibility Report (Minnesota Option) - Schedule Risk Analysis Model
This item captures the risk that will cause a variance from the baseline schedule for the project.Likely assumes no change from the baseline schedule.Assumes no change from baseline since project schedule would be controled by construction schedule
Assumes delay in project schedule from appraisals that are to low and condemnation is required to acquire project lands.
USACE-MVP-0000087977

Risk Refer No. Risk Event Low Most Likely HighLD-5 Non-Appraisal 0.0 Months 0.0 Months 12.0 Months
$0 $0 $12
Notes:
Likely Low
High
Assumption: Non-AppraisalPercentile Assumption values
0% 0.0 Months10% 0.6 Months20% 1.2 Months30% 1.9 Months40% 2.7 Months50% 3.5 Months60% 4.5 Months70% 5.5 Months80% 6.7 Months90% 8.2 Months
100% 11.9 Months
MVP - Fargo/Moorhead Feasibility Report (Minnesota Option) - Schedule Risk Analysis Model
This item captures the risk that will cause a variance from the baseline schedule for the project.Likely assumes no change from the baseline schedule.Assumes no change from baseline since project schedule would be controled by construction schedule
Assumes delay in project schedule from project footprint increasing and requiring addititional real estate.
USACE-MVP-0000087977

Risk Refer No. Risk Event Low Most Likely HighPR-1 Uncertainty with Funding Stream 0.0 Months 0.0 Months 84.0 Months
$0 $0 $84
Notes:
Likely Low
High
Assumption: Uncertainty with Funding StreamPercentile Assumption values
0% 0.0 Months10% 8.2 Months20% 16.8 Months30% 25.0 Months40% 33.1 Months50% 42.0 Months60% 50.0 Months70% 58.4 Months80% 66.8 Months90% 75.2 Months
100% 84.0 Months
Assumes that funding will be at the alternate funding of schedule of $80M/year which may take an additional 7 years.
MVP - Fargo/Moorhead Feasibility Report (Minnesota Option) - Schedule Risk Analysis Model
Likely assumes no change from the baseline schedule.
This item captures the risk that will cause a variance from the baseline schedule for the project.
Assumes that funding will not be higher than the proposed project schedule
USACE-MVP-0000087977

Risk Refer No. Risk Event Low Most Likely HighPR-4 Lawsuit Risk 0.0 Months 0.0 Months 6.0 Months
$0 $0 $6
Notes:
Likely Low
High
Assumption: Lawsuit Risk Percentile Assumption values
0% 0.0 Months10% 0.6 Months20% 1.2 Months30% 1.8 Months40% 2.4 Months50% 3.0 Months60% 3.6 Months70% 4.2 Months80% 4.8 Months90% 5.4 Months
100% 6.0 Months
Assumes that there will be a delay in the project schedule if there is a lawsuit from Dilworth.
MVP - Fargo/Moorhead Feasibility Report (Minnesota Option) - Schedule Risk Analysis Model
Likely assumes no change from the baseline schedule.
This item captures the risk that will cause a variance from the baseline schedule for the project.
Assumes that project schedule will still be the baseline if there is not a lawsuit from Dilworth
USACE-MVP-0000087977

Risk Refer No. Risk Event Low Most Likely High
PR-5Political factors change at state, local, or federal level 0.0 Months 0.0 Months 12.0 Months
$0 $0 $12
Notes:
Likely Low
High
Assumption: Political factors change at state, local, or federal levelPercentile Assumption values
0% 0.0 Months10% 1.2 Months20% 2.4 Months30% 3.6 Months40% 4.8 Months50% 6.0 Months60% 7.2 Months70% 8.4 Months80% 9.6 Months90% 10.8 Months100% 12.0 Months
Assumes the political factors cause an increase from the baseline project schedule
MVP - Fargo/Moorhead Feasibility Report (Minnesota Option) - Schedule Risk Analysis Model
Likely assumes no change from the baseline schedule.
This item captures the risk that will cause a variance from the baseline schedule for the project.
Assumes the baseline schedule even if there are more favorable political changes and not any oppisition
USACE-MVP-0000087977

Risk Refer No. Risk Event Low Most Likely High
PR-7Lawsuit Risk from NGOs and Downstream Interests 0.0 Months 0.0 Months 12.0 Months
$0 $0 $12
Notes:
Likely Low
High
Assumption: Lawsuit Risk from NGOs and Downstream InterestsPercentile Assumption values
0% 0.0 Months10% 1.2 Months20% 2.5 Months30% 3.7 Months40% 4.8 Months50% 6.0 Months60% 7.2 Months70% 8.4 Months80% 9.6 Months90% 10.8 Months100% 12.0 Months
MVP - Fargo/Moorhead Feasibility Report (Minnesota Option) - Schedule Risk Analysis Model
This item captures the risk that will cause a variance from the baseline schedule for the project.Likely assumes no change from the baseline schedule.
Assumes an increase in the schedule due to lawsuits from downstream interest
Assumes the baseline schedule when there are not any lawsuits from Downstream interest
USACE-MVP-0000087977

Fargo-Moorhead Metro Flood Risk Management Project,
Feasibility Study, Phase 4
Locally Preferred Plan (LPP) – North Dakota Option
Project Cost and Schedule Risk Analysis Report
Prepared for:
U.S. Army Corps of Engineers, St. Paul District
Prepared by:
U.S. Army Corps of Engineers Cost Engineering Directory of Expertise, Walla Walla
May 2, 2011
US Army Corps of Engineers®
USACE-MVP-0000087977

TABLE OF CONTENTS
EXECUTIVE SUMMARY ................................................................................ ES-1
MAIN REPORT ..................................................................................................... 1
1.0 PURPOSE ...................................................................................................... 1
2.0 BACKGROUND .............................................................................................. 1
3.0 REPORT SCOPE ........................................................................................... 1
4.0 METHODOLOGY / PROCESS ....................................................................... 3
4.1 Identify and Assess Risk Factors ................................................................ 4
4.2 Quantify Risk Factor Impacts ...................................................................... 4
4.3 Analyze Cost Estimate and Schedule Contingency ..................................... 5
5.0 KEY ASSUMPTIONS ...................................................................................... 6
6.0 RESULTS ....................................................................................................... 7
6.1 Risk Register ............................................................................................... 7
6.2 Cost Contingency and Sensitivity Analysis .................................................. 7
6.2.1 Sensitivity Analysis ............................................................................... 8
6.2.2 Sensitivity Analysis Results .................................................................. 8
6.3 Schedule and Contingency Risk Analysis ................................................... 9
7.0 MAJOR FINDINGS/OBSERVATIONS/RECOMMENDATIONS .................... 12
7.1 Major Findings/Observations ..................................................................... 12
7.2 Recommendations .................................................................................... 16
USACE-MVP-0000087977

LIST OF TABLES
Table ES-1. Contingency Analysis ................................................................. ES-1
Table ES-2. Cost Summary ........................................................................... ES-2
Table 1. Project Cost Contingency Summary ...................................................... 8
Table 2. Schedule Duration Contingency Summary ............................................ 9
Table 3. Project Cost Comparison Summary ..................................................... 13
LIST OF FIGURES
Figure 1. Cost Sensitivity Analysis ..................................................................... 10
Figure 2. Schedule Sensitivity Analysis ............................................................. 11
Figure 3. Project Cost Summary ........................................................................ 14
Figure 4. Project Duration Summary .................................................................. 15
LIST OF APPENDICES
Risk Register .................................................................................... APPENDIX A
USACE-MVP-0000087977

EXECUTIVE SUMMARY
Under the auspices of the US Army Corps of Engineers (USACE), St. Paul District, this report presents a recommendation for the project cost and schedule contingencies for the Fargo-Moorhead Metro Flood Risk Management Project, Feasibility Study, Phase 4 Locally Preferred Plan (LPP) – North Dakota Option (Fargo-Moorhead FRM LPP). In compliance with Engineer Regulation (ER) 1110-2-1302 CIVIL WORKS COST ENGINEERING, dated September 15, 2008, a formal risk analysis study was conducted for the development of contingency on the project cost. The purpose of this risk analysis study was to establish project contingencies by identifying and measuring the cost and schedule impact of project uncertainties with respect to the estimated project cost.
Specific to the Fargo-Moorhead LPP Project, the most likely project cost (at price level) is estimated at approximately $1.387 Billion. Based on the results of the analysis, the Cost Engineering Directory of Expertise for Civil Works (Walla Walla District) recommends a contingency value of $367 Million, or 26%. This contingency includes $279 Million (20%) for cost growth potential due to risk analyzed in the base cost estimate and $88 Million (6%) for cost growth potential due to risk analyzed in the baseline schedule.
Walla Walla Cost Dx performed risk analysis using the Monte Carlo technique, producing the aforementioned contingencies and identifying key risk drivers.
The following table ES-1 portrays the development of contingencies (26%). The contingency is based on an 80% confidence level, as per USACE Civil Works guidance.
Table ES-1. Contingency Analysis Table
Most Likely Cost Estimate $1,387,078,819
Confidence Level Value ($$) Contingency (%) 5% $1,505,513,807
8.54%
50% $1,660,870,979
19.74%
80% $1,754,275,887
26.47%
95% $1,840,932,008
32.72%
The following table ES-2 portrays the full costs of the recommended alternative based on the anticipated contracts. The costs are intended to address the congressional request of estimates to implement the project. The contingency is based on an 80% confidence level, as per accepted USACE Civil Works guidance.
USACE-MVP-0000087977

Table ES-2. Cost Summary
FARGO-MOORHEAD LPP COST CNTG TOTAL ($1,000) ($1,000) ($1,000)
01 LANDS AND DAMAGES 214,845 56,875 271,720
02 RELOCATIONS 119,480 31,630 151,110
06 FISH AND WILDLIFE FACILITIES 51,113 13,531 64,644
08 ROADS, RAILROADS, AND BRIDGES 46,497 12,309 58,807
09 CHANNELS AND CANALS 609,705 161,405 771,110
11 LEVEES AND FLOODWALLS 111,190 29,435 140,624
14 RECREATION FACILITIES 23,027 6,096 29,123
30 PLANNING, ENGINEERING AND DESIGN 144,015 38,125 182,140
31 CONSTRUCTION MANAGEMENT 67,207 17,792 84,999
TOTAL PROJECT COSTS 1,387,079 367,197 1,754,276
Schedule Completion with Contingency 2 Apr 2020 117 months 17 Dec 2029 Notes:
1) Costs include the recommended contingency of 26%. 2) Costs exclude O&M and Life Cycle Cost estimates.
KEY FINDINGS/OBSERVATIONS RECOMMENDATIONS
The key cost risk drivers identified through sensitivity analysis were Risks PR-6 (Lawsuit Risk from NGOs and Upstream Interests), PPM-8 (Scope Changes) and CON-6 (Contract Modifications), which together contribute 65 percent of the statistical cost variance. PR-6 captures the risk that there may be perceived damages by upstream interests and non-sponsor communities. PPM-8 captures the risk that changes to scope, as required by stakeholders, may increase the cost of the project. CON-6 captures the risk that there may be cost growth due to post-award modifications to the contracts due to differing site conditions, engineering changes, and/or claims. The key schedule risk driver identified through sensitivity analysis was Risk PR-1 (Uncertainty with Funding Stream), which contributes 82 percent of the statistical schedule variance. PR-1 covers the risk that delay in obtaining necessary funding increments my significantly delay the project. Recommendations, as detailed within the main report, include the implementation of cost and schedule contingencies, further iterative study of risks throughout the project life-cycle, potential mitigation throughout the PED phase, and proactive monitoring and control of risk identified in this study.
USACE-MVP-0000087977

MAIN REPORT
1.0 PURPOSE Under the auspices of the US Army Corps of Engineers (USACE), St. Paul District, this report presents a recommendation for the project cost and schedule contingencies for the Fargo-Moorhead Metro Flood Risk Management Project, Feasibility Study, Phase 4 Locally Preferred Plan (LPP) – North Dakota Option (Fargo-Moorhead FRM LPP). 2.0 BACKGROUND
The purpose of the Fargo-Moorhead Feasibility Study is to identify measures and develop a regional system to reduce flood risk along the Red River of the North for the entire Fargo-Moorhead metropolitan area. The study PDT collected, evaluated and screened an array of possible flood risk management plans to define the costs, benefits and impacts to the project area. The plans resulted in a diversion channel alternative as the best measures to reduce the flood risk. A diversion through Minnesota around the city of Moorhead offered the plan with the lowest cost having a B/C ratio over one. The local sponsors preferred a diversion alternative through North Dakota around the city of Fargo as a locally preferred plan. The PDT has developed plans and estimates for both the National Economic Development (NED) - Minnesota Plan and the LPP – North Dakota plan. St. Paul District is preparing a Feasibility Report. As a part of this effort, St. Paul District requested that the USACE Cost Engineering Directory of Expertise for Civil Works (Cost Engineering Dx) provide an agency technical review (ATR) of the cost estimate and schedule for LRR. That tasking also included providing a risk analysis study to establish the resulting contingencies. 3.0 REPORT SCOPE
The scope of the risk analysis report is to calculate and present the cost and schedule contingencies at the 80 percent confidence level using the risk analysis processes, as mandated by U.S. Army Corps of Engineers (USACE) Engineer Regulation (ER) 1110-2-1150, Engineering and Design for Civil Works, ER 1110-2-1302, Civil Works Cost Engineering, and Engineer Technical Letter 1110-2-573, Construction Cost Estimating Guide for Civil Works. The report presents the contingency results for cost risks for all project features. The study and presentation does not include consideration for life cycle costs.
USACE-MVP-0000087977

3.1 Project Scope The formal process included extensive involvement of the PDT for risk identification and the development of the risk register. The analysis process evaluated the most likely Micro Computer Aided Cost Estimating System (MCACES) cost estimate, schedule, and funding profiles using Crystal Ball software to conduct a Monte Carlo simulation and statistical sensitivity analysis, per the guidance in Engineer Technical Letter (ETL) CONSTRUCTION COST ESTIMATING GUIDE FOR CIVIL WORKS, dated September 30, 2008.
The project technical scope, estimates and schedules were developed and presented by the St. Paul District. Consequently, these documents serve as the basis for the risk analysis.
The scope of this study addresses the identification of problems, needs, opportunities and potential solutions that are viable from an economic, environmental, and engineering viewpoint.
3.2 USACE Risk Analysis Process The risk analysis process for this study follows the USACE Headquarters requirements as well as the guidance provided by the Cost Engineering Dx. The risk analysis process reflected within this report uses probabilistic cost and schedule risk analysis methods within the framework of the Crystal Ball software. Furthermore, the scope of the report includes the identification and communication of important steps, logic, key assumptions, limitations, and decisions to help ensure that risk analysis results can be appropriately interpreted. Risk analysis results are also intended to provide project leadership with contingency information for scheduling, budgeting, and project control purposes, as well as to provide tools to support decision making and risk management as the project progresses through planning and implementation. To fully recognize its benefits, cost and schedule risk analysis should be considered as an ongoing process conducted concurrent to, and iteratively with, other important project processes such as scope and execution plan development, resource planning, procurement planning, cost estimating, budgeting and scheduling. In addition to broadly defined risk analysis standards and recommended practices, this risk analysis was performed to meet the requirements and recommendations of the following documents and sources:
• Cost and Schedule Risk Analysis Process guidance prepared by the USACE Cost Engineering Dx.
USACE-MVP-0000087977
• Engineer Regulation (ER) 1110-2-1302 CIVIL WORKS COST ENGINEERING, dated September 15, 2008.
• Engineer Technical Letter (ETL) CONSTRUCTION COST ESTIMATING GUIDE
FOR CIVIL WORKS, dated September 30, 2008.
4.0 METHODOLOGY / PROCESS
The Cost Engineering Dx assembled a team, also relying on local St. Paul District staff to further augment labor, expertise and information gathering. The Cost Engineering Dx team consisted of one senior civil cost engineer. The Cost Engineering Dx cost engineer facilitated a risk identification meeting on site with the St. Paul PDT on January 7, 2010. The initial risk identification meeting also included qualitative analysis to produce a risk register that served as the framework for the risk analysis. The cost and schedule risk models were completed and results reported on January 29, 2010. Several subsequent revisions to the estimates and risk analyses took place between January 29, 2010 and April 17, 2011. The final results were reported on April 17, 2011. The risk analysis process for this study is intended to determine the probability of various cost outcomes and quantify the required contingency needed in the cost estimate to achieve any desired level of cost confidence. In simple terms, contingency is an amount added to an estimate to allow for items, conditions or events for which the occurrence or impact is uncertain and that experience suggests will likely result in additional costs being incurred or additional time being required. The amount of contingency included in project control plans depends, at least in part, on the project leadership’s willingness to accept risk of project overruns. The less risk that project leadership is willing to accept the more contingency should be applied in the project control plans. The risk of overrun is expressed, in a probabilistic context, using confidence levels. The Cost Dx guidance for cost and schedule risk analysis generally focuses on the 80-percent level of confidence (P80) for cost contingency calculation. It should be noted that use of P80 as a decision criteria is a risk averse approach (whereas the use of P50 would be a risk neutral approach, and use of levels less than 50 percent would be risk seeking). Thus, a P80 confidence level results in greater contingency as compared to a P50 confidence level. The selection of contingency at a particular confidence level is ultimately the decision and responsibility of the project’s District and/or Division management.
USACE-MVP-0000087977

The risk analysis process uses Monte Carlo techniques to determine probabilities and contingency. The Monte Carlo techniques are facilitated computationally by a commercially available risk analysis software package (Crystal Ball) that is an add-in to Microsoft Excel. Cost estimates are packaged into an Excel format and used directly for cost risk analysis purposes. The level of detail recreated in the Excel-format schedule is sufficient for risk analysis purposes that reflect the established risk register, but generally less than that of the native format. The primary steps, in functional terms, of the risk analysis process are described in the following subsections. Risk analysis results are provided in Section 6. 4.1 Identify and Assess Risk Factors
Identifying the risk factors via the PDT is considered a qualitative process that results in establishing a risk register that serves as the document for the quantitative study using the Crystal Ball risk software. Risk factors are events and conditions that may influence or drive uncertainty in project performance. They may be inherent characteristics or conditions of the project or external influences, events, or conditions such as weather or economic conditions. Risk factors may have either favorable or unfavorable impacts on project cost and schedule.
Formal PDT meetings were held for the purposes of identifying and assessing risk factors. The formal meeting conducted on January 7, 2010 included representatives from plan formulation, project management, geotechnical and hydraulic design, cost engineering, construction, environmental compliance, real estate, and the project sponsors.
The initial formal meetings focused primarily on risk factor identification using brainstorming techniques, but also included some facilitated discussions based on risk factors common to projects of similar scope and geographic location. Subsequent meetings focused primarily on risk factor assessment and quantification.
Additionally, numerous conference calls and informal meetings were conducted throughout the risk analysis process on an as-needed basis to further facilitate risk factor identification, market analysis, and risk assessment. 4.2 Quantify Risk Factor Impacts The quantitative impacts of risk factors on project plans were analyzed using a combination of professional judgment, empirical data and analytical techniques. Risk factor impacts were quantified using probability distributions (density functions) because risk factors are entered into the Crystal Ball software in the form of probability density functions.
USACE-MVP-0000087977

Similar to the identification and assessment process, risk factor quantification involved multiple project team disciplines and functions. However, the quantification process relied more extensively on collaboration between cost engineering and risk analysis team members with lesser inputs from other functions and disciplines. This process used an iterative approach to estimate the following elements of each risk factor:
• Maximum possible value for the risk factor • Minimum possible value for the risk factor • Most likely value (the statistical mode), if applicable • Nature of the probability density function used to approximate risk factor
uncertainty • Mathematical correlations between risk factors • Affected cost estimate and schedule elements
The resulting product from the PDT discussions is captured within a risk register as presented in section 6 for both cost and schedule risk concerns. Note that the risk register records the PDT’s risk concerns, discussions related to those concerns, and potential impacts to the current cost and schedule estimates. The concerns and discussions support the team’s decisions related to event likelihood, impact, and the resulting risk levels for each risk event.
4.3 Analyze Cost Estimate and Schedule Contingency
Contingency is analyzed using the Crystal Ball software, an add-in to the Microsoft Excel format of the cost estimate and schedule. Monte Carlo simulations are performed by applying the risk factors (quantified as probability density functions) to the appropriate estimated cost and schedule elements identified by the PDT. Contingencies are calculated by applying only the moderate and high level risks identified for each option (i.e., low-level risks are typically not considered, but remain within the risk register to serve historical purposes as well as support follow-on risk studies as the project and risks evolve).
For the cost estimate, the contingency is calculated as the difference between the P80 cost forecast and the baseline cost estimate. Each option-specific contingency is then allocated on a civil works feature level based on the dollar-weighted relative risk of each feature as quantified by Monte Carlo simulation. Standard deviation is used as the feature-specific measure of risk for contingency allocation purposes. This approach results in a relatively larger portion of all the project feature cost contingency being allocated to features with relatively higher estimated cost uncertainty.
USACE-MVP-0000087977

5.0 PROJECT ASSUMPTIONS
The following data sources and assumptions were used in quantifying the costs associated with the Fargo-Moorhead LPP project.
a. The St. Paul District provided MII MCACES (Micro-Computer Aided Cost Estimating Software) files via email. The file title, “MVP LPP_ND_Diversion_Phase_4 with 2009 Equip Rate.mlp” was the basis for the cost and schedule risk analyses.
b. The cost comparisons and risk analyses performed and reflected within this report are based on design scope and estimates that are at the feasibility level.
c. Schedules are analyzed for impact to the project cost in terms of both uncaptured escalation (variance from OMB factors and the local market) and unavoidable fixed contract costs and/or languishing federal administration costs incurred throughout delay.
d. Per the CWCCIS Historical State Adjustment Factors in EM 1110-2-1304, State Adjustment Factors for Minnesota and North Dakota are 1.15 and 0.92, respectively. Taking this into account along with the historical RS Means labor inflation rate and Consumer Price Index (CPI) factor for Minnesota, the average suggests that true inflation is approximately 4.55% higher for the Fargo Metro area than for the national average. This rate was used to calculate the differential between the local market and OMB inflation factors for future construction. For the P80 schedule, this is approximately 1.59% of the contingency.
e. Per the data in the estimate, the Job Office Overhead (JOOH) amount comprises approximately 5% of the Project Cost at Baseline. Thus, the assumed residual fixed cost rate for this project is 5%. For the P80 schedule, this comprises approximately 4.77% of the total contingency due to the accrual of residual fixed costs associated with delay.
f. The Cost Dx guidance generally focuses on the eighty-percent level of confidence (P80) for cost contingency calculation. For this risk analysis, the eighty-percent level of confidence (P80) was used. It should be noted that the use of P80 as a decision criteria is a moderately risk averse approach, generally resulting in higher cost contingencies. However, the P80 level of confidence also assumes a small degree of risk that the recommended contingencies may be inadequate to capture actual project costs.
g. Only high and moderate risk level impacts, as identified in the risk register, were considered for the purposes of calculating cost contingency. Low level risk impacts should be maintained in project management documentation, and reviewed at each project milestone to determine if they should be placed on the risk “watch list”.
USACE-MVP-0000087977

6.0 RESULTS
The cost and schedule risk analysis results are provided in the following sections. In addition to contingency calculation results, sensitivity analyses are presented to provide decision makers with an understanding of variability and the key contributors to the cause of this variability. 6.1 Risk Register
A risk register is a tool commonly used in project planning and risk analysis. The actual risk register is provided in Appendix A. The complete risk register includes low level risks, as well as additional information regarding the nature and impacts of each risk.
It is important to note that a risk register can be an effective tool for managing identified risks throughout the project life cycle. As such, it is generally recommended that risk registers be updated as the designs, cost estimates, and schedule are further refined, especially on large projects with extended schedules. Recommended uses of the risk register going forward include:
• Documenting risk mitigation strategies being pursued in response to the identified risks and their assessment in terms of probability and impact.
• Providing project sponsors, stakeholders, and leadership/management with a documented framework from which risk status can be reported in the context of project controls.
• Communicating risk management issues. • Providing a mechanism for eliciting feedback and project control input. • Identifying risk transfer, elimination, or mitigation actions required for
implementation of risk management plans. 6.2 Cost Contingency and Sensitivity Analysis
Table 1 provides the construction cost contingencies calculated for the P80 confidence level and rounded to the nearest thousand. The construction cost contingencies for the P50 and P100 confidence levels are also provided for illustrative purposes only.
Contingency was quantified as approximately $367 Million at the P80 confidence level (26% of the baseline cost estimate). For comparison, the cost contingency at the P50 and P100 confidence levels was quantified as 20% and 47% of the baseline cost estimate, respectively.
USACE-MVP-0000087977

Table 1. Project Cost Contingency Summary
Risk Analysis Forecast Baseline Estimate Total Contingency1,2 ($)
Total Contingency (%)
50% Confidence Level Project Cost $1,660,870,979 $273,792,160 19.74%
80% Confidence Level Project Cost $1,754,275,887 $367,197,067 26.47%
100% Confidence Level Project Cost $2,040,970,710 $653,891,891 47.14%
Notes: 1) These figures combine uncertainty in the baseline cost estimates and schedule. 2) A P100 confidence level is an abstract concept for illustration only, as the nature of risk and uncertainty (specifically the presence of “unknown unknowns”) makes 100% confidence a theoretical impossibility.
6.2.1 Sensitivity Analysis Sensitivity analysis generally ranks the relative impact of each risk/opportunity as a percentage of total cost uncertainty. The Crystal Ball software uses a statistical measure (contribution to variance) that approximates the impact of each risk/opportunity contributing to variability of cost outcomes during Monte Carlo simulation. Key cost drivers identified in the sensitivity analysis can be used to support development of a risk management plan that will facilitate control of risk factors and their potential impacts throughout the project lifecycle. Together with the risk register, sensitivity analysis results can also be used to support development of strategies to eliminate, mitigate, accept or transfer key risks. 6.2.2 Sensitivity Analysis Results The risks/opportunities considered as key or primary cost drivers are ranked in order of importance in contribution to variance bar charts. Opportunities that have a potential to reduce project cost and are shown with a negative sign; risks are shown with a positive sign to reflect the potential to increase project cost. A longer bar in the sensitivity analysis chart represents a greater potential impact to project cost. Figure 1 presents a sensitivity analysis for cost growth risk from the high level cost risks identified in the risk register. Likewise, Figure 2 presents a sensitivity analysis for schedule growth risk from the high level schedule risks identified in the risk register.
USACE-MVP-0000087977

6.3 Schedule and Contingency Risk Analysis Table 2 provides the schedule duration contingencies calculated for the P80 confidence level. The schedule duration contingencies for the P50 and P100 confidence levels are also provided for illustrative purposes. Schedule duration contingency was quantified as 117 months based on the P80 level of confidence. These contingencies were used to calculate the projected residual fixed cost impact of project delays that are included in the Table 1 presentation of total cost contingency. The schedule contingencies were calculated by applying the high level schedule risks identified in the risk register for each option to the durations of critical path and near critical path tasks. The schedule was not resource loaded and contained open-ended tasks and non-zero lags (gaps in the logic between tasks) that limit the overall utility of the schedule risk analysis. These issues should be considered as limitations in the utility of the schedule contingency data presented. Schedule contingency impacts presented in this analysis are based solely on projected residual fixed costs. Table 2. Schedule Duration Contingency Summary
Risk Analysis Forecast
Baseline Schedule Duration (months)
Contingency1 (months)
50% Confidence Level Project Duration 122 74
80% Confidence Level Project Duration 122 95
100% Confidence Level Project Duration 122 176
Notes: 1) The schedule was not resource loaded and contained open-ended tasks and non-zero lags (gaps in the logic between tasks) that limit the overall utility of the schedule risk analysis. These issues should be considered as limitations in the utility of the schedule contingency data presented in Table 2. 2) A P100 confidence level is an abstract concept for illustration only, as the nature of risk and uncertainty (specifically the presence of “unknown unknowns”) makes 100% confidence a theoretical impossibility.
USACE-MVP-0000087977

Figure 1. Cost Sensitivity Analysis
USACE-MVP-0000087977

Figure 2. Schedule Sensitivity Analysis
USACE-MVP-0000087977

7.0 MAJOR FINDINGS/OBSERVATIONS/RECOMMENDATIONS
This section provides a summary of significant risk analysis results that are identified in the preceding sections of the report. Risk analysis results are intended to provide project leadership with contingency information for scheduling, budgeting, and project control purposes, as well as to provide tools to support decision making and risk management as projects progress through planning and implementation. Because of the potential for use of risk analysis results for such diverse purposes, this section also reiterates and highlights important steps, logic, key assumptions, limitations, and decisions to help ensure that the risk analysis results are appropriately interpreted. 7.1 Major Findings/Observations Project cost comparison summaries are provided in Table 3 and Figure 3. Additional major findings and observations of the risk analysis are listed below.
1. The key cost risk drivers identified through sensitivity analysis were Risks PR-6 (Lawsuit Risk from NGOs and Upstream Interests), PPM-8 (Scope Changes) and CON-6 (Contract Modifications), which together contribute 65 percent of the statistical cost variance.
2. The key schedule risk driver identified through sensitivity analysis was Risk PR-1
(Uncertainty with Funding Stream), which contributes 82 percent of the statistical schedule variance.
3. Operation and maintenance activities were not included in the cost estimate or
schedules. Therefore, a full lifecycle risk analysis could not be performed. Risk analysis results or conclusions could be significantly different if the necessary operation and maintenance activities were included.
USACE-MVP-0000087977

Table 3. Project Cost Comparison Summary
Confidence Level
Project Cost ($)
Contingency (%)
P0 $1,339,855,676 -3.40%
P5 $1,505,513,807 8.54%
P10 $1,538,269,944 10.90%
P15 $1,560,810,805 12.53%
P20 $1,577,802,468 13.75%
P25 $1,593,278,637 14.87%
P30 $1,607,580,440 15.90%
P35 $1,621,111,138 16.87%
P40 $1,634,694,783 17.85%
P45 $1,647,129,777 18.75%
P50 $1,660,870,979 19.74%
P55 $1,674,604,577 20.73%
P60 $1,688,826,432 21.75%
P65 $1,703,289,774 22.80%
P70 $1,719,421,608 23.96%
P75 $1,735,440,729 25.11%
P80 $1,754,275,887 26.47%
P85 $1,775,988,250 28.04%
P90 $1,802,415,619 29.94%
P95 $1,840,932,008 32.72%
P100 $2,040,970,710 47.14%
USACE-MVP-0000087977

Figure 3. Project Cost Summary
USACE-MVP-0000087977
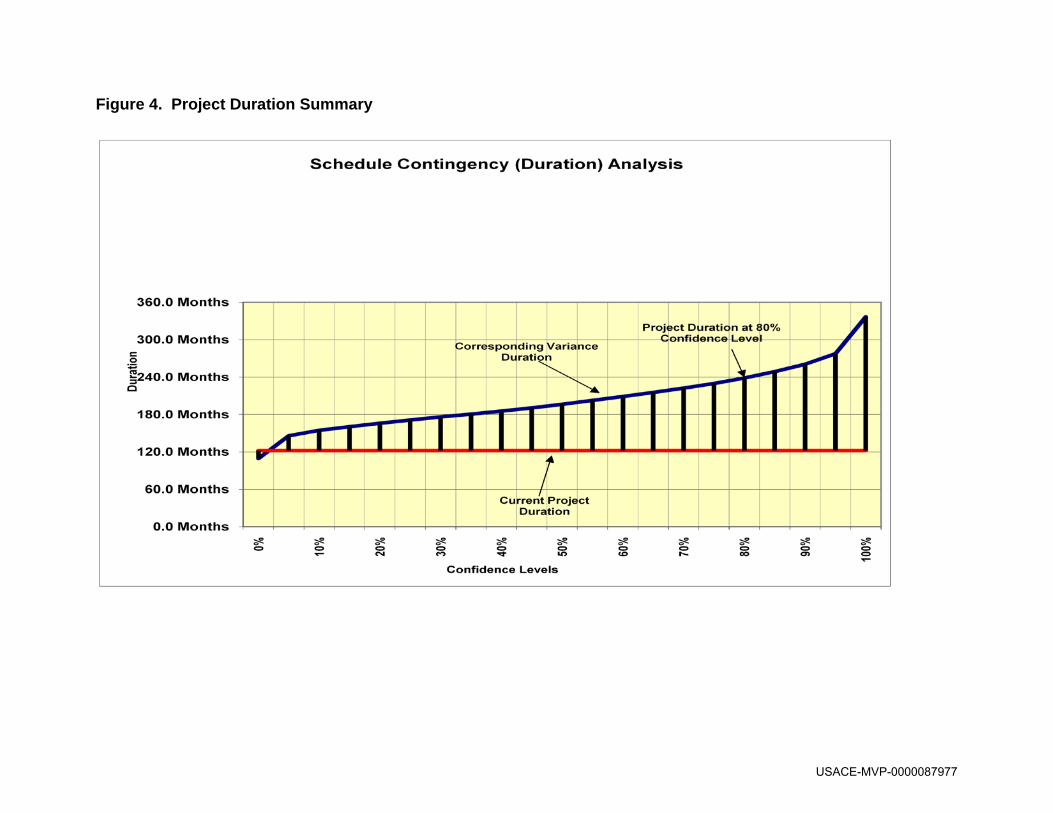
Figure 4. Project Duration Summary
USACE-MVP-0000087977

7.2 Recommendations Risk Management is an all-encompassing, iterative, and life-cycle process of project management. The Project Management Institute’s (PMI) A Guide to the Project Management Body of Knowledge (PMBOK® Guide), 4th edition, states that “project risk management includes the processes concerned with conducting risk management planning, identification, analysis, responses, and monitoring and control on a project.” Risk identification and analysis are processes within the knowledge area of risk management. Its outputs pertinent to this effort include the risk register, risk quantification (risk analysis model), contingency report, and the sensitivity analysis. The intended use of these outputs is implementation by the project leadership with respect to risk responses (such as mitigation) and risk monitoring and control. In short, the effectiveness of the project risk management effort requires that the proactive management of risks not conclude with the study completed in this report. The Cost and Schedule Risk Analysis (CSRA) produced by the PDT identifies issues that require the development of subsequent risk response and mitigation plans. This section provides a list of recommendations for continued management of the risks identified and analyzed in this study. Note that this list is not all inclusive and should not substitute a formal risk management and response plan. 1. Key Cost Risk Drivers: The key cost risk drivers identified through sensitivity analysis were Risks PR-6 (Lawsuit Risk from NGOs and Upstream Interests), PPM-8 (Scope Changes) and CON-6 (Contract Modifications), which together contribute 65 percent of the statistical cost variance.
a) Lawsuit Risk from NGOs and Upstream Interests: Project leadership should take proactive measures to obtain decisions as well as collect information regarding upstream interests. Project leadership should also communicate to management regarding the impact of these issues on cost performance. Ultimately, this is an external risk, and its impacts must be communicated to management, and funds should be maintained in project reserve for treatment of this risk.
b) Scope Changes: Project leadership should attempt to capture and finalize the scope of the project to the maximum extent possible. It is imperative to identify all features of work and probable methodologies, along with the accompanying risks associated with implementation. Iterative quantification (risk analysis) may be necessary to further develop and pinpoint sources of risk to identify needs for risk treatment in the risk response and management plan.
c) Contract Modifications: Project leadership should attempt to capture and finalize the scope of the project to the maximum extent possible. It is imperative to identify all features of work and probable methodologies, along with the accompanying risks associated with implementation. Iterative quantification (risk
USACE-MVP-0000087977

analysis) may be necessary to further develop and pinpoint sources of risk to identify needs for risk treatment in the risk response and management plan. Additionally, project leadership should determine acquisition strategy and make decisions early to impact the completion of contract documents as to minimize risk of engineering changes and potential claims.
2. Key Schedule Risk Drivers: The key schedule risk driver identified through sensitivity analysis was Risk PR-1 (Uncertainty with Funding Stream), which contributes 82 percent of the statistical schedule variance.
a) Uncertainty with Funding Stream: Project leadership should project leadership proactively develop accurate funding profile projections to capture probable funding requirements. Ultimately, this is an external risk, and its impacts must be communicated to management.
3. Risk Management: Project leadership should use of the outputs created during the risk analysis effort as tools in future risk management processes. The risk register should be updated at each major project milestone. The results of the sensitivity analysis may also be used for response planning strategy and development. These tools should be used in conjunction with regular risk review meetings. 4. Risk Analysis Updates: Project leadership should review risk items identified in the original risk register and add others, as required, throughout the project life-cycle. Risks should be reviewed for status and reevaluation (using qualitative measure, at a minimum) and placed on risk management watch lists if any risk’s likelihood or impact significantly increases. Project leadership should also be mindful of the potential for secondary (new risks created specifically by the response to an original risk) and residual risks (risks that remain and have unintended impact following response).
USACE-MVP-0000087977
APPENDIX A
USACE-MVP-0000087977

Overall Project ScopeVery LikelyLikelyUnlikelyVery UnlikelyNegligible
MarginalSignificantCriticalCrisis Cost ImpactsLow For the Fargo/Moorhead Project, any cost impact of $10 Million or higher should be considered at least "Significant."Moderate Anything over $5 Million should be considered at least "Marginal."High
Schedule ImpactsFor the Fargo/Moorhead Project, any schedule impact of 12 months or greater should be considered at least "Significant."Anything over 6 months should be considered at least "Marginal."
PDT Discussions Likelihood* Impact* Risk Level*Rough Order
Impact ($) Likelihood* Impact* Risk Level*Rough Order Impact (mo)
Correlation to Other(s)
PROJECT & PROGRAM MGMT
PPM-1Project Schedule in Question
Due to the size and magnitude of the project, as well as the complexity of the structures and sequencing, there is
inherent concern regarding the actual project schedule.This could cause a variance in the project schedule
(positive or negative, but most likely negative). Likely Significant High Likely Marginal Moderate Uniform Project Manager Project Cost & Schedule
PPM-2Accelerated Design Schedule
An accelerated schedule can result in inadequate studies, shortcuts in plans, change in contract acquisition strategy, failure to capture full scope, miss-steps, etc. There is the
potential of moving forward with limited information. The issue is covered in other risk events. Likely Significant High Likely Significant High Triangular District Management Project Cost & Schedule
PPM-3Unplanned Work that Must be Accommodated
Due to the preliminary stage of project development, there is potential that there may be features or subfeatures of
work that must be added to construction. Ice handling and sediment transport are the two most likely issues that must
be accommodated. There may also be mitigation requirements.
Most of these subfeatures are already captured in the design and estimate, but the configuration may change. Likely Marginal Moderate Likely Marginal Moderate Yes-No Project Manager Project Cost & Schedule
PPM-4Local Agency/Regulator Issues
The acceleration of the planning schedule has forced reviews and collaboration without much time given to local
agencies and regulators. Although there has been communication between the Government and the local
agencies, these agencies have not responded with definitive decisions. This could present potential impacts.
Eash of the agencies have provided formal comments and identified areas of concern, The design has been modified from when this concern was initially identified to increase the flows into the protected areas as coordinated with the
agencies. This could impact cost and schedule. Likely Marginal Moderate Likely Marginal Moderate Yes-No Project Manager Project Cost & Schedule
PPM-7 Conflicting Priorities
The District's workload and competing priorities may impede progress on this project related to staff availability and experience, related to design, investigations, contract
procurements, construction management.
Since the identity of this concern, the F-M project has been identified as a high priority regional project , and barring a
major national disater the F-M project will have all the resources it should need. Unlikely to cause cause any
variance in the cost or schedule. Unlikely Negligible Low Unlikely Negligible Low Uniform District Management Project Schedule
PPM-8 Scope Changes
The many competing interests & priorities, coupled with an accelerated schedule could result in scope changes currently uncaptured or unanticipated. These scope
changes would require additional coordination, cause further design and investigation and potentially impact the real
estate acquisitions.While minor alterations to the final alignment may occur,
there should not be any major changes. Likely Marginal Moderate Likely Significant High Yes-No Project Manager Project Cost & Schedule
CONTRACT ACQUISITION RISKS
The Fargo-Moorhead Feasibility Study purpose is to identify measures and develop a regional system to reduce flood risk along the Red River of the North for the entire F-M metroploitan area. The study PDT collected, evaluated and screened an array of possible flood risk management plans to define the costs, benefits and impacts to the project area. The plans resulted in a diversion channel alternative as the best measures to reduce the flood risk. A diversion through Minnesota around the city of Moorhead offered the plan with the lowest cost having a B/C ratio over one. The local sponsors preferred a diversion alternative through North Dakota around the city of Fargo as a locally preferred plan. The PDT has developed plans and estimates for both the MN Plan and the LPP ND plan.
MVP - Fargo/Moorhead Feasibility Report (LPP - North Dakota Option) - PDT Risk Register
Concerns
Contract Risks (Internal Risk Items are those that are generated, caused, or controlled within the PDT's sphere of influence.)
Project Cost Project Schedule
Risk No. Risk/Opportunity EventVariance
DistributionAffected Project
ComponentResponsibility/POC
VeryLikely Low Moderate High High High
Likely Low Moderate High High High
Unlikely Low Low Moderate Moderate High
VeryUnlikely Low Low Low Low High
Negligible Marginal Significant Critical Crisis
Impact or Consequence of Occurrence
Likelih
ood o
f Occu
rrence
Risk Level
USACE-MVP-0000087977

PDT Discussions Likelihood* Impact* Risk Level*Rough Order
Impact ($) Likelihood* Impact* Risk Level*Rough Order Impact (mo)
Correlation to Other(s)Concerns
Project Cost Project Schedule
Risk No. Risk/Opportunity EventVariance
DistributionAffected Project
ComponentResponsibility/POC
CA-1Undefined Acquisition Strategy
The overall acquisition strategy for both design and construction has not been defined. Acquisition strategy could affect/impact bid competition and bid costs. It can also move risk onto the Government, causing need for
greater contingencies. Clarification should be made related to number of contracts, contract types, etc. authority for this
procurement.Acquisition stratagy needs to be defined and could impact
the cost and schedule. Likely Marginal Moderate Unlikely Marginal Low Triangular TASBContract Cost & Project
Schedule
CA-2Preference to Small Business
Most of the larger requirements are so large that they would not be suitable for small business. However, there is
potential for some of the restoration, seeding, and mitigation may be suitable for small business. There is a requirement for review by the PARC if the requirements were less than
$50 Million.
The project is so large, it is likely that even separable requirements would not be suitable for small business.
Could impact cost and schedule. Unlikely Marginal Low Unlikely Marginal Low Triangular ContractingContract Cost & Project
Schedule
CA-3Numerous Separate Contracts
There is potential to have numerous separate contracts, especially if the continuing contracts authority is not granted.
Funding stream issues could also have an impact on the number of contracts.
The best case would be 8 contracts. The worst case would be in excess of 12 contracts. More contracts could increase bidding competition. This could have a significant effect on
cost and schedule (either positive or negative). Very Likely Significant High Unlikely Marginal Low Triangular Contracting Contract Cost
CA-4 Potential Bid Protests
The larger size of the project increase contractor interests in bidding, but also increases potntial risk for protets due to hungry economy and interest in obtaining project dollars. This could impact cost and schedule. Likely Marginal Moderate Likely Marginal Moderate Yes-No Contracting Contract Cost
TECHNICAL RISKS
TL-1Uncertainty with Geotechnical Conditions
There is uncertainty with geotechnical conditions but the Phase 4 estimate uses recent borings from 2010 to help define the the soil parameters for excavation and bearing
capacity and how that will impact the construction productivity. The material is all clay and silt.
The current working estimate is fairly conservative. However, variation in the ultimate characterization of
material could cause significant variance in productivity. Could impact cost and schedule (more likely positive than
negative). Likely Marginal Moderate Likely Marginal Moderate Triangular Geotechnical/Civil DesignContract Cost & Project
Schedule
TL-2 Survey Data IncompleteThe PDT currently has incomplete or outdated survey data
(for bathymetry for the Red River and Tributaries).
If the survey data uncovers data that differs greatly from current conceptual design, it could lead to variance in cost
(due to issues such as configuration and details for structures). More likely on ND side. Unlikely Marginal Low Unlikely Negligible Low Triangular Technical Lead
Contract Cost & Project Schedule
TL-3Maple Diversion Structure Concerns
Under very high flood events, water flows over and under the diversion structure. This could present issues, as this
an unusual technical approach.With the revised Phase 4 flow this structure does not submerge anymore and is not as much of a concern. Unlikely Marginal Low Unlikely Marginal Low Yes-No Hydrology/Hydraulic Design
Contract Cost & Project Schedule
TL-4 Sedimentation Modeling
The sedimentation modeling could show that higher flow accommodation may be necessary in the tributary
structures.
This issue is more likely on Wild Rice, but not as likely on the Sheyenne or the Maple. This could impact cost and
schedule. Unlikely Significant Moderate Unlikely Negligible Low Yes-No Hydrology/Hydraulic Design Contract Cost
TL-5Variation in Estimated Quantities
There is potential for variation of estimated quantities in the excavation and earthwork features. This could impact cost and schedule. Likely Significant High Likely Marginal Moderate Yes-No Hydrology/Hydraulic Design Contract Cost
TL-6 Flowrate Capacity
If during detailed design the hydraulics change, it could affect the amount of flow required for the diversion channel to handle. This would affect channel width, bridge lengths
and major hydraulic structure sizes This could impact cost and schedule. Likely Marginal Moderate Likely Marginal Moderate Yes-No Hydrology/Hydraulic Design Project Cost & Schedule
TL-7 Relocations - Utilities Quality of design at budget levelMost costs were obtained from affected utilities for the
major lines that are impacted. Likely Marginal Moderate Unlikely Negligible Low Triangular Cost Engineering Contract Cost
TL-8 Relocations - BridgesBridge costs will change depending on final diversion
channel width Bridge costs from historical DOT costs are fairly reliable. Likely Marginal Moderate Unlikely Negligible Low Triangular Cost Engineering Contract Cost
TL-9 Mitigation fish, wetlands, forest, adaptive management issues
Resource agencies have not agreed to any particular features yet so there is the potential for additional mitigation beyond what is proposed, though the Corps has laid out a
well planned approach to mitigating the issues Likely Significant High Likely Negligible Low Uniform Environmental Compliance Project Cost
TL-10 Railroad BridgesRR Bridge sizes have changed since the initial RR bridge
estimates and the costs have been scaled Bridge costs from BNSF's consulting engineer are at
conceptual design and cost could have significant changes Likely Significant High Unlikely Marginal Low Triangular Structural Design Project Cost
TL-11Diversions Excavations & Productivity
Excavations could be impacted by diversion alignment changes, productivity and/or model results Impacts should only affect quantities of different soil layers Likely Marginal Moderate Likely Marginal Moderate Triangular Technical Lead Contract Cost
TL-12 Hydraulic Structures Hydraulic structures will need to be modeled Model results could change design concepts Likely Significant High Likely Marginal Moderate Triangular Hydrology/Hydraulic DesignContract Cost & Project
Schedule
USACE-MVP-0000087977

PDT Discussions Likelihood* Impact* Risk Level*Rough Order
Impact ($) Likelihood* Impact* Risk Level*Rough Order Impact (mo)
Correlation to Other(s)Concerns
Project Cost Project Schedule
Risk No. Risk/Opportunity EventVariance
DistributionAffected Project
ComponentResponsibility/POC
TL-13 LeveesLevee heights and lengths could change depending on if
upstream staging is incorporatedLevees for upstream staging may depend on model studies
and landowner oppisition Likely Marginal Moderate Likely Marginal Moderate Triangular Hydrology/Hydraulic DesignContract Cost & Project
Schedule
TL-14Non-Structural Floodproofing
Costs for downstream impacts could change when the effects of have been fully developed
With Phase 4 LPP design with the upstream staging, there should not be any downstream impacts. Unlikely Negligible Low Unlikely Marginal Low Triangular Technical Lead Project Cost
TL-15 Recreational Facilities Feasibility is at conceptual designFnial designs could look different than Feasibility but overall
concepts should be similar Likely Marginal Moderate Unlikely Marginal Low Triangular Cost Engineering Contract Cost
TL-16 Fuel Cost Concerns Volatility in the price of fuel
Recent spikes in fuel could increase the cost of fule for the project. Conversely, if the world markets calm down, fuel
could return to a price lower that currently estimatesd in the project. Likely Significant High Unlikely Marginal Low Triangular Cost Engineering Contract Cost
LANDS AND DAMAGES RISKS
LD-1
Mitigation Needs Identified for Upstream Impacts due to staging
The effects of the project on areas upstream may require mitigation footprint that has not been finalized. The impacts
may not be fully captured.
This could significantly impact costs depending on final staging area configuration. It could significantly impact
schedule. Likely Significant High Likely Significant High Yes-No Real Estate Project Cost & Schedule
LD-2Potential Savings for Eliminating RR Bridge 4
Currently, the RRVW RR has limited use of this line and indicated that abandonement is possible This could save the cost of bridge and track raise Likely Significant High Very Unlikely Negligible Low Yes-No Project Manager Project Cost & Schedule
LD-4 Appraisal
Appraisals carry certain assumptions based on technical information. If the techncial information has the potential to
change, the appraisals could be impacted. Appraisals are using an average value Likely Significant High Likely Marginal Moderate Triangular Real Estate Project Cost
LD-5 Non-Appraisal
Real Estate office is responsible for establishing contingencies. There could be risks outside their domain
that can still impact the costs.
Real Estate has identified $29M in recapture cost that the sponsor could recoup on the Lands & Damages estimate. Real Estate office will be using the CSRA contingencies Likely Significant High Likely Marginal Moderate Triangular Real Estate Project Cost
REGULATORY AND ENVIRONMENTAL RISKS
RE-1Environmental Mitigation Feature Concerns
The PDT has estimated mitigation features for Phase 4 based on the expected impacts (to include construction and
real estate). This could impact the costs either positively or negatively. Likely Marginal Moderate Very Unlikely Negligible Low Triangular Environmental Compliance Project Cost
RE-2Historical Cultural Resource Issues
There is potential to find cultural resources, particularly on the riverbanks. No cultural resource survey has been
completed to date. Mitigiation will probably be necessary. Could impact cost. Very Likely Negligible Low Unlikely Marginal Low Triangular Environmental Compliance Project Cost
RE-3 HTRW Issues
There is some potential for discovery of HTRW in the project alignment. Most of the alignment is through
farmland.Any HTRW issues likely to be minor associated with farm
chemicals Unlikely Marginal Low Unlikely Negligible Low Uniform Environmental Compliance Project Cost & Schedule
RE-4 Fish Passage Issues
There will be fish passage requirement in the project, but the actual configuration has not been finalized/agreed upon
by the local agencies.Could impact cost of fish passage structures at assoicated
structures Likely Marginal Moderate Unlikely Negligible Low Triangular Technical Lead Project Cost
RE-5Pressure to Compress Permitting Activities
The local agencies perceive that they are being pressured through the project permitting process.
PDT has programmed this into the schedule, and the agencies are not constricted more than normal review
times. Very Unlikely Negligible Low Unlikely Negligible Low Uniform Environmental Compliance Project Cost & Schedule
USACE-MVP-0000087977

PDT Discussions Likelihood* Impact* Risk Level*Rough Order
Impact ($) Likelihood* Impact* Risk Level*Rough Order Impact (mo)
Correlation to Other(s)Concerns
Project Cost Project Schedule
Risk No. Risk/Opportunity EventVariance
DistributionAffected Project
ComponentResponsibility/POC
CONSTRUCTION RISKS
CON-1Unknown Residential Utility Conflicts
There is potential for the need to abandon some small residential utilities.
This could impact cost and schedule, but it would be negligible. Likely Negligible Low Unlikely Negligible Low Triangular Technical Lead
Contract Cost & Project Schedule
CON-2Control and Diversion of Water
Methodology of controlling water could be impacted by the sequencing and timing of relocation, the characterization of
materials, or other unknown impacts. Could impact cost and schedule. Likely Significant High Unlikely Marginal Low Triangular Technical Lead Contract Cost
CON-3Conflicts between Contractors
There is potential for conflicts between multiple contractors working in the same footprint at the same time.
Could impact cost. However, careful planning of the construction scheduling and sequencing should be able to
avoid any major conflicts. Likely Negligible Low Unlikely Negligible Low Triangular ConstructionContract Cost & Project
Schedule
CON-4 Sufficient QA Staff to manage numerous contracts, mods and claimsED-C is well aware of QA staffing issues and is planning
accordingly Unlikely Marginal Low Unlikely Negligible Low Triangular ConstructionContract Cost & Project
Schedule
CON-5 Project Sequencingconflicts between contractors and schedule impacts (one
contractor waiting on another)Conficts may develop at reaches interface, building of
bridges or hydraulic structures Likely Significant High Likely Marginal Moderate Uniform Construction Project Cost & Schedule
CON-6 Contract Mods
Contract mods and claims resulting from unforeseen site conditions, weather impacts, political and lawsuit impacts
are a concern and can impact both cost and schedule. Many of these concerns may be valid and impact the project Likely Significant High Likely Negligible Low Triangular Construction Contract Cost
ESTIMATE AND SCHEDULE RISKS
EST-1Potential Fluctuation in Labor Costs
There is concern that the labor force required for this work could be a challenge, requiring off-site labor, per diem and
premium pay, as well as unique markups and multipliers for workers compensation and other factors.
Estimate currently has National Wage rates, which are higher than the local Davis-Bacon Wage Determination.
The Estimate also includes $75/day for per diem. There is potential for savings, as the labor wage rate for North
Dakota is cheaper than Minnesota. This could impact costs either positively or negatively. Likely Significant High Very Unlikely Negligible Low Triangular Cost Engineering Contract Cost
EST-2WBS Elements - Estimate confidence
Certain WBS elements are better developed in scope and estimate than other scope areas. Some WBS elements
may be more or less conservative. Some elements have greater risk and resulting need for greater contingencies.
The major cost elements for the diversion excavation, hydraulic structures and bridges have been highly
developed for feasibility since they make up the bulk of the cost items. Environmental mitigation features are less
develop and more conceptual and likely will change. Real Estate may be another area of risk confidence Likely Marginal Moderate Likely Negligible Low Triangular Cost Engineering Contract Cost
EST-3 Estimate assumptions
The estimate assumptions may be flawed in certain cost areas related to scope, crews, productivity, material cost, markups, contingencies, etc. This could result in a flawed
budget development.
The estimate has been in development for enough time that scope, crews, productivety, matrerial costs and markups
are fairly well developed. Contingencies are from the CSRA Unlikely Marginal Low Likely Negligible Low Triangular Cost Engineering Contract Cost
EST-4 PED & CMThe estiamte currently uses 15% PED and 7% CM of the
constrcution cost.
With the high construction cost of this project and the amount of design required for excavation, these
percentages may be too high, based on about 16% for the $410M Grand Forks/East Grand Forks Flood project which
was more urban levees & floodwalls. Likely Significant High Unlikely Negligible Low Triangular Cost Engineering Project Cost
USACE-MVP-0000087977

PDT Discussions Likelihood* Impact* Risk Level*Rough Order
Impact ($) Likelihood* Impact* Risk Level*Rough Order Impact (mo)
Correlation to Other(s)Concerns
Project Cost Project Schedule
Risk No. Risk/Opportunity EventVariance
DistributionAffected Project
ComponentResponsibility/POC
PR-1Uncertainty with Funding Stream
There is a window of opportunity during the next couple years of obtaining the necessary increments on a timely basis. However, historically this has been a challenge in
obtaining the increments necessary to complete on schedule, and there have been challenges in obtaining them
on a timely basis. This could impact both cost and schedule. Very Likely Significant High Very Likely Significant High Uniform Project Manager Project Cost & Schedule
PR-2 Unusually Wet Season
If a given construction season is unusually higher than an average year, it could have significant impact on the
productivity of the work.If this it occurs, it reduces productivity and creates
substantial delays. Unlikely Marginal Low Unlikely Marginal Low Binomial N/A Project Cost & Schedule
PR-3 Flooding EventThere is a chance of a flooding event during construction that could cause damage to constructed work features. Could be minor impacts to cost and schedule. Very Unlikely Negligible Low Very Unlikely Negligible Low Binomial N/A Project Cost & Schedule
PR-4Political factors change at state, local, or federal level
Senator Dorgan has retired. He was very influential and favorable to the project interests. Since the authorization
was not obtained prior to his departure, there is concern that the project would not be authorized or funded on a timely
basis. Could be minor impacts to cost and schedule. Unlikely Marginal Low Unlikely Crisis High Yes-No Project Manager Project Schedule
PR-5 Political oppositionThere could be opposition from Federal Agenceis (FEMA,
FWS, and EPA). Could be minor impacts to cost and schedule. Unlikely Marginal Low Likely Marginal Moderate Uniform Project Manager Project Cost & Schedule
PR-6Lawsuit Risk from NGOs and Upstream Interests
There may be perceived damages from upstream concerns or non-sponsor cities that are affected. Could impact cost and schedule. Likely Significant High Unlikely Significant Moderate Uniform Project Manager Project Schedule
10. Project Implications identifies whether or not the risk item affects project cost, project schedule, or both. The PDT is responsible for conducting studies for both Project Cost and for Project Schedule.11. Results of the risk identification process are studied and further developed by the Cost Engineer, then analyzed through the Monte Carlo Analysis Method for Cost (Contingency) and Schedule (Escalation) Growth.
4. Impact is a measure of the event's effect on project objectives with relation to scope, cost, and/or schedule -- Negligible, Marginal, Significant, Critical, or Crisis. Impacts on Project Cost may vary in severity from impacts on Project Schedule.5. Risk Level is the resultant of Likelihood and Impact Low, Moderate, or High. Refer to the matrix located at top of page.
7. The responsibility or POC is the entity responsible as the Subject Matter Expert (SME) for action, monitoring, or information on the PDT for the identified risk or opportunity.
9. Affected Project Component identifies the specific item of the project to which the risk directly or strongly correlates.
6. Variance Distribution refers to the behavior of the individual risk item with respect to its potential effects on Project Cost and Schedule. For example, an item with clearly defined parameters and a solid most likely scenario would probably follow a triangular or normal distribution. A risk item for which the PDT has little data or probability of modeling with respect to effects on cost or schedule (i.e. "anyone's guess") would probably follow a uniform or discrete uniform distribution.
8. Correlation recognizes those risk events that may be related to one another. Care should be given to ensure the risks are handled correctly without a "double counting."
3. Likelihood is a measure of the probability of the event occurring -- Very Unlikely, Unlikely, Moderately Likely, Likely, Very Likely. The likelihood of the event will be the same for both Cost and Schedule, regardless of impact.
*Likelihood, Impact, and Risk Level to be verified through market research and analysis (conducted by cost engineer).1. Risk/Opportunity identified with reference to the Risk Identification Checklist and through deliberation and study of the PDT.2. Discussions and Concerns elaborates on Risk/Opportunity Events and includes any assumptions or findings (should contain information pertinent to eventual study and analysis of event's impact to project).
Programmatic Risks (External Risk Items are those that are generated, caused, or controlled exclusively outside the PDT's sphere of influence.)
USACE-MVP-0000087977

Contingency on Base Estimate 80% Confidence Project CostBaseline Estimate Cost (Most Likely) -> $1,387,078,819
Baseline Estimate Cost Contingency Amount -> $278,937,013Baseline Estimate Construction Cost (80% Confidence) -> $1,666,015,833
Contingency on Schedule 80% Confidence Project ScheduleProject Schedule Duration (Most Likely) -> 122.2 Months
Schedule Contingency Duration -> 116.6 MonthsProject Schedule Duration (80% Confidence) -> 238.7 Months
Project Schedule Contingency Amount (80% Confidence) -> $88,260,054
Project Contingency 80% Confidence Project CostProject Contingency Amount (80% Confidence) -> $367,197,067
Project Contingency Percentage (80% Confidence) -> 26%
Project Cost (80% Confidence) -> $1,754,275,887
Most LikelyCost Estimate
Confidence Level Project Cost Contingency Contingency %0% $1,339,855,676 ($47,223,143) -3.40% ########5% $1,505,513,807 $118,434,988 8.54% ########
10% $1,538,269,944 $151,191,124 10.90% ########15% $1,560,810,805 $173,731,985 12.53% ########20% $1,577,802,468 $190,723,649 13.75% ########25% $1,593,278,637 $206,199,818 14.87% ########30% $1,607,580,440 $220,501,621 15.90% ########35% $1,621,111,138 $234,032,319 16.87% ########40% $1,634,694,783 $247,615,964 17.85% ########45% $1,647,129,777 $260,050,958 18.75% ########50% $1,660,870,979 $273,792,160 19.74% ########55% $1,674,604,577 $287,525,758 20.73% ########60% $1,688,826,432 $301,747,612 21.75% ########65% $1,703,289,774 $316,210,955 22.80% ########70% $1,719,421,608 $332,342,789 23.96% ########75% $1,735,440,729 $348,361,910 25.11% ########80% $1,754,275,887 $367,197,067 26.47% ########85% $1,775,988,250 $388,909,431 28.04% ########90% $1,802,415,619 $415,336,800 29.94% ########95% $1,840,932,008 $453,853,189 32.72% ########
100% $2,040,970,710 $653,891,891 47.14% ########
MVP - Fargo/Moorhead Feasibility Report (North Dakota Option) - Cost & Schedule Risk Analysis
- PROJECT CONTINGENCY DEVELOPMENT -
Contingency Analysis$1,387,078,819
$1,200,000,000
$1,300,000,000
$1,400,000,000
$1,500,000,000
$1,600,000,000
$1,700,000,000
$1,800,000,000
$1,900,000,000
$2,000,000,000
$2,100,000,000
0% 10%
20%
30%
40%
50%
60%
70%
80%
90%
100%
Cos
t
Confidence Levels
Project Cost Contingency Analysis
Project Cost based at 80% Confidence Level
"Most Likely" Project Cost
Corresponding Contingency
Amount
USACE-MVP-0000087977

Most LikelyCost Estimate
Confidence Level Project Cost Contingency Contingency %0% $1,336,855,935 ($50,222,884) -3.62% ########5% $1,478,536,519 $91,457,700 6.59% ########
10% $1,505,453,347 $118,374,528 8.53% ########15% $1,524,147,605 $137,068,786 9.88% ########20% $1,537,481,951 $150,403,131 10.84% ########25% $1,549,681,209 $162,602,390 11.72% ########30% $1,560,624,812 $173,545,992 12.51% ########35% $1,571,117,586 $184,038,767 13.27% ########40% $1,581,539,408 $194,460,589 14.02% ########45% $1,590,558,739 $203,479,920 14.67% ########50% $1,600,501,068 $213,422,249 15.39% ########55% $1,610,094,229 $223,015,410 16.08% ########60% $1,620,246,516 $233,167,697 16.81% ########65% $1,630,424,107 $243,345,287 17.54% ########70% $1,641,958,964 $254,880,145 18.38% ########75% $1,653,035,337 $265,956,518 19.17% ########80% $1,666,015,833 $278,937,013 20.11% ########85% $1,681,112,745 $294,033,926 21.20% ########90% $1,699,645,557 $312,566,738 22.53% ########95% $1,727,019,327 $339,940,507 24.51% ########
100% $1,888,078,395 $500,999,575 36.12% ########
- BASE CONTINGENCY DEVELOPMENT -
Contingency Analysis$1,387,078,819
$1,200,000,000
$1,300,000,000
$1,400,000,000
$1,500,000,000
$1,600,000,000
$1,700,000,000
$1,800,000,000
$1,900,000,000
$2,000,000,000
0% 10%
20%
30%
40%
50%
60%
70%
80%
90%
100%
Cos
tConfidence Levels
Base Estimate Cost Contingency Analysis (Does not Include Escalation)
Project Cost based at 80% Confidence Level
"Most Likely" Project Cost
Corresponding Contingency Amount
USACE-MVP-0000087977

Most LikelySchedule
Confidence Level Project Duration Contingency Contingency %0% 109.6 Months -12.6 Months -10.29% 122 5% 145.9 Months 23.7 Months 19.44% 122
10% 154.8 Months 32.6 Months 26.68% 122 15% 160.6 Months 38.4 Months 31.45% 122 20% 166.1 Months 44.0 Months 35.99% 122 25% 171.1 Months 48.9 Months 40.05% 122 30% 176.2 Months 54.0 Months 44.21% 122 35% 180.8 Months 58.6 Months 47.98% 122 40% 185.6 Months 63.4 Months 51.90% 122 45% 190.7 Months 68.6 Months 56.14% 122 50% 196.5 Months 74.3 Months 60.85% 122 55% 202.8 Months 80.6 Months 65.98% 122 60% 208.9 Months 86.8 Months 71.03% 122 65% 215.4 Months 93.3 Months 76.34% 122 70% 222.4 Months 100.2 Months 82.04% 122 75% 229.9 Months 107.7 Months 88.17% 122 80% 238.7 Months 116.6 Months 95.43% 122 85% 248.7 Months 126.6 Months 103.63% 122 90% 260.7 Months 138.5 Months 113.42% 122 95% 277.6 Months 155.4 Months 127.23% 122
100% 336.6 Months 214.5 Months 175.56% 122
- SCHEDULE CONTINGENCY (DURATION) DEVELOPMENT -
Contingency Analysis122.2 Months
0.0 Months
60.0 Months
120.0 Months
180.0 Months
240.0 Months
300.0 Months
360.0 Months
0% 10%
20%
30%
40%
50%
60%
70%
80%
90%
100%
Dur
atio
n
Confidence Levels
Schedule Contingency (Duration) Analysis
Project Duration at 80% Confidence Level
Current Project Duration
Corresponding VarianceDuration
USACE-MVP-0000087977

Most LikelyCost Estimate
Confidence Level Project Cost Contingency Contingency %0% $1,390,078,560 $2,999,741 0.22% ########5% $1,414,056,107 $26,977,288 1.94% ########
10% $1,419,895,416 $32,816,596 2.37% ########15% $1,423,742,019 $36,663,200 2.64% ########20% $1,427,399,336 $40,320,517 2.91% ########25% $1,430,676,248 $43,597,428 3.14% ########30% $1,434,034,448 $46,955,629 3.39% ########35% $1,437,072,372 $49,993,552 3.60% ########40% $1,440,234,194 $53,155,375 3.83% ########45% $1,443,649,857 $56,571,038 4.08% ########50% $1,447,448,730 $60,369,911 4.35% ########55% $1,451,589,167 $64,510,348 4.65% ########60% $1,455,658,735 $68,579,915 4.94% ########65% $1,459,944,487 $72,865,667 5.25% ########70% $1,464,541,463 $77,462,644 5.58% ########75% $1,469,484,212 $82,405,392 5.94% ########80% $1,475,338,873 $88,260,054 6.36% ########85% $1,481,954,325 $94,875,505 6.84% ########90% $1,489,848,881 $102,770,062 7.41% ########95% $1,500,991,501 $113,912,681 8.21% ########
100% $1,539,971,135 $152,892,316 11.02% ########
- SCHEDULE CONTINGENCY (AMOUNT) DEVELOPMENT -
Contingency Analysis$1,387,078,819
$1,300,000,000
$1,350,000,000
$1,400,000,000
$1,450,000,000
$1,500,000,000
$1,550,000,000
$1,600,000,000
0% 10%
20%
30%
40%
50%
60%
70%
80%
90%
100%
Cos
t
Confidence Levels
Project Schedule Contingency Analysis
Project Cost Plus Schedule Contingency based at 80%
Confidence Level
"Most Likely" Project Cost
Corresponding Schedule Contingency
Amount
USACE-MVP-0000087977

MVP - Fargo/Moorhead Feasibility Report (North Dakota Option) - Cost Risk Analysis
USACE-MVP-0000087977
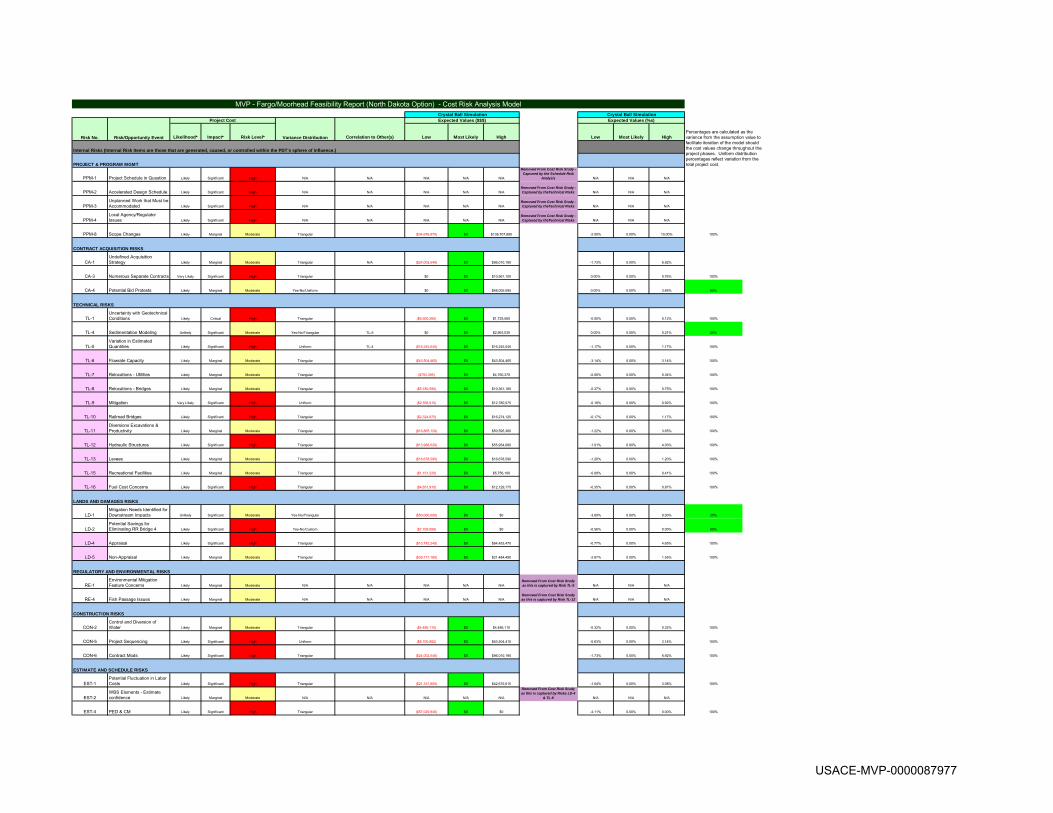
Likelihood* Impact* Risk Level* Correlation to Other(s) Low Most Likely High Low Most Likely High
PPM-1 Project Schedule in Question Likely Significant High N/A N/A N/A N/A N/A
Removed From Cost Risk Study - Captured by the Schedule Risk
Analysis N/A N/A N/A
PPM-2 Accelerated Design Schedule Likely Significant High N/A N/A N/A N/A N/ARemoved From Cost Risk Study - Captured by theTechnical Risks N/A N/A N/A 1
PPM-3Unplanned Work that Must be Accommodated Likely Significant High N/A N/A N/A N/A N/A
Removed From Cost Risk Study - Captured by theTechnical Risks N/A N/A N/A
PPM-4Local Agency/Regulator Issues Likely Significant High N/A N/A N/A N/A N/A
Removed From Cost Risk Study - Captured by theTechnical Risks N/A N/A N/A
PPM-8 Scope Changes Likely Marginal Moderate Triangular ($34,676,970) $0 $138,707,880 0 -2.50% 0.00% 10.00% 100%
CA-1Undefined Acquisition Strategy Likely Marginal Moderate Triangular N/A ($24,002,548) $0 $96,010,190 -1.73% 0.00% 6.92%
CA-3 Numerous Separate Contracts Very Likely Significant High Triangular $0 $0 $10,561,100 0 0.00% 0.00% 0.76% 100% 1
CA-4 Potential Bid Protests Likely Marginal Moderate Yes-No/Uniform $0 $0 $48,005,095 0 0.00% 0.00% 3.46% 65%
TL-1Uncertainty with Geotechnical Conditions Likely Critical High Triangular ($6,900,260) $0 $1,725,065 0 -0.50% 0.00% 0.12% 100% 1
TL-4 Sedimentation Modeling Unlikely Significant Moderate Yes-No/Triangular TL-5 $0 $0 $2,963,030 0 0.00% 0.00% 0.21% 25%
TL-5Variation in Estimated Quantities Likely Significant High Uniform TL-4 ($16,245,040) $0 $16,245,040 0 -1.17% 0.00% 1.17% 100%
TL-6 Flowrate Capacity Likely Marginal Moderate Triangular ($43,504,465) $0 $43,504,465 0 -3.14% 0.00% 3.14% 100%
TL-7 Relocations - Utilities Likely Marginal Moderate Triangular ($793,395) $0 $4,760,370 0 -0.06% 0.00% 0.34% 100%
TL-8 Relocations - Bridges Likely Marginal Moderate Triangular ($5,180,590) $0 $10,361,180 0 -0.37% 0.00% 0.75% 100%
TL-9 Mitigation Very Likely Significant High Uniform ($2,556,015) $0 $12,780,075 0 -0.18% 0.00% 0.92% 100%
TL-10 Railroad Bridges Likely Significant High Triangular ($2,324,875) $0 $16,274,125 0 -0.17% 0.00% 1.17% 100%
TL-11Diversions Excavations & Productivity Likely Marginal Moderate Triangular ($16,865,120) $0 $50,595,360 0 -1.22% 0.00% 3.65% 100%
TL-12 Hydraulic Structures Likely Significant High Triangular ($13,988,520) $0 $55,954,080 0 -1.01% 0.00% 4.03% 100%
TL-13 Levees Likely Marginal Moderate Triangular ($16,678,590) $0 $16,678,590 0 -1.20% 0.00% 1.20% 100%
TL-15 Recreational Facilities Likely Marginal Moderate Triangular ($1,151,220) $0 $5,756,100 0 -0.08% 0.00% 0.41% 100%
TL-16 Fuel Cost Concerns Likely Significant High Triangular ($4,851,910) $0 $12,129,775 0 -0.35% 0.00% 0.87% 100%
LD-1Mitigation Needs Identified for Downstream Impacts Unlikely Significant Moderate Yes-No/Triangular ($50,000,000) $0 $0 0 -3.60% 0.00% 0.00% 25%
LD-2Potential Savings for Eliminating RR Bridge 4 Likely Significant High Yes-No/Custom ($7,709,058) $0 $0 0 -0.56% 0.00% 0.00% 65%
LD-4 Appraisal Likely Significant High Triangular ($10,742,245) $0 $64,453,470 0 -0.77% 0.00% 4.65% 100%
LD-5 Non-Appraisal Likely Marginal Moderate Triangular ($39,777,160) $0 $21,484,490 0 -2.87% 0.00% 1.55% 100%
RE-1Environmental Mitigation Feature Concerns Likely Marginal Moderate N/A N/A N/A N/A N/A
Removed From Cost Risk Study as this is captured by Risk TL-9 N/A N/A N/A 1
RE-4 Fish Passage Issues Likely Marginal Moderate N/A N/A N/A N/A N/ARemoved From Cost Risk Study as this is captured by Risk TL-12 N/A N/A N/A 1
CON-2Control and Diversion of Water Likely Marginal Moderate Triangular ($4,486,110) $0 $4,486,110 0 -0.32% 0.00% 0.32% 100% 1
CON-5 Project Sequencing Likely Significant High Uniform ($8,700,882) $0 $43,504,410 0 -0.63% 0.00% 3.14% 100%
CON-6 Contract Mods Likely Significant High Triangular ($24,002,548) $0 $96,010,190 0 -1.73% 0.00% 6.92% 100%
EST-1Potential Fluctuation in Labor Costs Likely Significant High Triangular ($21,337,805) $0 $42,675,610 0 -1.54% 0.00% 3.08% 100% 1
EST-2WBS Elements - Estimate confidence Likely Marginal Moderate N/A N/A N/A N/A N/A
Removed From Cost Risk Study as this is captured by Risks LD-4
& TL-9 N/A N/A N/A
EST-4 PED & CM Likely Significant High Triangular ($57,029,940) $0 $0 -4.11% 0.00% 0.00% 100%
CONTRACT ACQUISITION RISKS
LANDS AND DAMAGES RISKS
TECHNICAL RISKS
ESTIMATE AND SCHEDULE RISKS
REGULATORY AND ENVIRONMENTAL RISKS
CONSTRUCTION RISKS
Percentages are calculated as the variance from the assumption value to facilitate iteration of the model should the cost values change throughout the project phases. Uniform distribution percentages reflect variation from the total project cost.PROJECT & PROGRAM MGMT
Risk No. Risk/Opportunity Event
MVP - Fargo/Moorhead Feasibility Report (North Dakota Option) - Cost Risk Analysis ModelCrystal Ball Simulation Crystal Ball Simulation
Expected Values (%s)
Variance Distribution
Expected Values ($$$)Project Cost
Internal Risks (Internal Risk Items are those that are generated, caused, or controlled within the PDT's sphere of influence.)
USACE-MVP-0000087977

PR-1Uncertainty with Funding Stream Likely Marginal Moderate N/A N/A N/A N/A N/A
Removed From Cost Risk Study - Captured by the Schedule Risk
Analysis N/A N/A N/A 1
PR-6Lawsuit Risk from NGOs and Upstream Interests Likely Significant High Uniform $0 $0 $138,616,880 0 0.00% 0.00% 9.99% 100%
$1,387,078,819
Not Part of Study - Placeholder for Project
Summation Purposes Only 100.0%
$0
Percentile Contingency Amount Baseline w/ Contingency Contingency %0% ($50,222,884) $1,336,855,935 -3.62%5% $91,457,700 $1,478,536,519 6.59%
10% $118,374,528 $1,505,453,347 8.53%15% $137,068,786 $1,524,147,605 9.88%20% $150,403,131 $1,537,481,951 10.84%25% $162,602,390 $1,549,681,209 11.72%30% $173,545,992 $1,560,624,812 12.51%35% $184,038,767 $1,571,117,586 13.27%40% $194,460,589 $1,581,539,408 14.02%45% $203,479,920 $1,590,558,739 14.67%50% $213,422,249 $1,600,501,068 15.39%55% $223,015,410 $1,610,094,229 16.08%60% $233,167,697 $1,620,246,516 16.81%65% $243,345,287 $1,630,424,107 17.54%70% $254,880,145 $1,641,958,964 18.38%75% $265,956,518 $1,653,035,337 19.17%80% $278,937,013 $1,666,015,833 20.11%85% $294,033,926 $1,681,112,745 21.20%90% $312,566,738 $1,699,645,557 22.53%95% $339,940,507 $1,727,019,327 24.51%
100% $500,999,575 $1,888,078,395 36.12%
39920822.847879342.36
49755944.651175947.97
52391087.853436537.9354404040.8455369007.1756296401.1763994740.8265225732.2766720886.4368882273.7377260091.28
Baseline TPC
Programmatic Risks (External Risk Items are those that are generated, caused, or controlled exclusively outside the PDT's sphere of influence.)
$1,387,078,819 $1,387,078,819
$1,387,078,819
$1,387,078,819 $1,387,078,819
$1,387,078,819
$1,387,078,819 $1,387,078,819
$1,387,078,819
$1,387,078,819 $1,387,078,819 $1,387,078,819 $1,387,078,819
$1,387,078,819 $1,387,078,819 $1,387,078,819
PROJECT COST (BASELINE)
$1,387,078,819 $1,387,078,819 $1,387,078,819
$1,387,078,819 $1,387,078,819
USACE-MVP-0000087977

Risk Refer No. Risk Event Low Most Likely HighPPM-1 Project Schedule in Question
-$15,804,595 ########### $31,609,190
MVP - Fargo/Moorhead Feasibility Report (North Dakota Option) - Cost Risk Analysis Model
Removed From Cost Risk Study as this is captured by the Schedule Risk Analysis
USACE-MVP-0000087977

Risk Refer No. Risk Event Low Most Likely HighPPM-2 Accelerated Design Schedule $0 $0 $0
$0 $0 $0
Notes: Most Likely
Likely $1,387,078,800 Project costLow
High
$1,387,078,800 Total
Assumption: Accelerated Design SchedulePercentile Assumption values
0%10%20%30%40%50%60%70%80%90%100%
Assume cost of project decreases 10% less than baseline
Assume cost of project increases 20% more the baseline
MVP - Fargo/Moorhead Feasibility Report (North Dakota Option) - Cost Risk Analysis Model
Likely assumes no change from the baseline estimate.
This item captures the risk that will cause a variance from the current working estimate for the project.
USACE-MVP-0000087977

Risk Refer No. Risk Event Low Most Likely High
PPM-3Unplanned Work that Must be Accommodated $0 $0 $0
$0 $0 $0
Notes: Most Likely
Likely $119,479,700 02 RelocationsLow $51,120,300 06 Fish & Wildlife - Mitigation
$46,497,500 08 RailroadsHigh $608,789,400 09 Channels
$111,190,600 11 Levees, Floodwalls & Floodproofing$23,024,400 14 Recreational Facilities
$960,101,900 Sub-total Construction Features
$144,015,000 30 PED$67,207,000 31 CM
$1,171,323,900 Total
Assumption: Unplanned Work that Must be AccommodatedPercentile Assumption values
0%10%20%30%40%50%60%70%80%90%
100%
Assume if there is not any unplanned work that it will = baseline
Assume that unplanned work will increase construction cost by 10%
MVP - Fargo/Moorhead Feasibility Report (North Dakota Option) - Cost Risk Analysis Model
Likely assumes no change from the baseline estimate.
This item captures the risk that will cause a variance from the current working estimate for the project.
USACE-MVP-0000087977

Risk Refer No. Risk Event Low Most Likely HighPPM-4 Local Agency/Regulator Issues $0 $0 $0
$0 $0 $0
Notes: Most Likely
Likely $51,120,300 06 MitigationLow
$7,668,000 30 PED for MitigationHigh $3,578,000 31 CM for Mitigation
$62,366,300 Total
Assumption: Local Agency/Regulator IssuesPercentile Assumption values
0%10%20%30%40%50%60%70%80%90%100%
Assumes 10% less cost of mitigation
Assumes 10% greater cost of mitigation
MVP - Fargo/Moorhead Feasibility Report (North Dakota Option) - Cost Risk Analysis Model
Likely assumes no change from the baseline estimate.
This item captures the risk that will cause a variance from the current working estimate for the project.
USACE-MVP-0000087977

Risk Refer No. Risk Event Low Most Likely HighPPM-8 Scope Changes ($34,676,970) $0 $138,707,880
$1,352,401,830 ########### $1,525,786,680
Notes: Most Likely
Likely $1,387,078,800 Project CostsLow
High
$1,387,078,800 Total
Assumption: Scope ChangesPercentile Assumption values
0% ($33,839,187)10% ($10,245,884)20% ($112,405)30% $8,689,15040% $18,145,42450% $28,617,95760% $40,273,63170% $53,417,88880% $68,734,73590% $89,334,596100% $136,773,842
MVP - Fargo/Moorhead Feasibility Report (North Dakota Option) - Cost Risk Analysis Model
This item captures the risk that will cause a variance from the current working estimate for the project.Likely assumes no change from the baseline estimate.
Assumes that scope changes decrease the project cost by 2.5%
Assumes that scope changes add additional features or costs of 10% to the project cost.
USACE-MVP-0000087977

Risk Refer No. Risk Event Low Most Likely HighCA-1 Undefined Acquisition Strategy ($24,002,548) $0 $96,010,190
$936,099,353 $960,101,900 $1,056,112,090
############Notes: Most Likely
Likely $119,479,700 02 RelocationsLow $51,120,300 06 Fish & Wildlife - Mitigation
$46,497,500 08 RailroadsHigh $608,789,400 09 Channels
$111,190,600 11 Levees, Floodwalls & Floodproofing$23,024,400 14 Recreational Facilities
$960,101,900 Sub-total Construction Features
$960,101,900 Total
Assumption: Undefined Acquisition StrategyPercentile Assumption values
0% ($23,954,682)10% ($6,962,741)20% ($36,595)30% $6,176,80640% $12,582,07750% $19,959,44160% $27,804,11470% $36,872,81080% $47,680,62890% $61,824,001100% $95,260,971
MVP - Fargo/Moorhead Feasibility Report (North Dakota Option) - Cost Risk Analysis Model
This item captures the risk that will cause a variance from the current working estimate for the project.Likely assumes no change from the baseline estimate.
Assumes 2.5% less of construction costs because of favorable acquisitions implementation.
Assumes 10% greater construction costs because of the undefined acquisition strategy at the feasibility level.
USACE-MVP-0000087977

Risk Refer No. Risk Event Low Most Likely HighCA-3 Numerous Separate Contracts $0 $0 $10,561,100
$211,222,000 $211,222,000 $221,783,100
Notes: Most Likely
Likely $144,015,000 30 PEDLow $67,207,000 31 CM
High
$211,222,000 Total.
Assumption: Numerous Separate ContractsPercentile Assumption values
0% $29610% $566,24820% $1,133,20630% $1,778,80440% $2,471,46950% $3,216,67660% $3,953,10070% $4,805,30580% $5,848,12390% $7,236,639100% $10,478,648
Assumes no cost decrease for PED and CM costs if contracting does not have numerous separate constracts
Assumes 5% greater PED and CM costs if contracting issues numerous separate contracts rather than 8 large annual contracts.
MVP - Fargo/Moorhead Feasibility Report (North Dakota Option) - Cost Risk Analysis Model
Likely assumes no change from the baseline estimate.
This item captures the risk that will cause a variance from the current working estimate for the project.
USACE-MVP-0000087977

Risk Refer No. Risk Event Low Most Likely HighCA-4 Potential Bid Protests $0 $0 $48,005,095
$960,101,900 $960,101,900 $1,008,106,995
Notes: Most Likely
Likely $119,479,700 02 RelocationsLow $51,120,300 06 Fish & Wildlife - Mitigation
$46,497,500 08 RailroadsHigh $608,789,400 09 Channels
$111,190,600 11 Levees, Floodwalls & Floodproofing$23,024,400 14 Recreational Facilities
$960,101,900 Sub-total Construction Features
(PED & CM covered in CA-3)
$960,101,900 Total
Assumption: Potential Bid ProtestsPercentile Assumption values
0% $6,11210% $4,880,22320% $9,788,76830% $14,366,17040% $19,363,80750% $24,406,86560% $29,037,39370% $33,797,70780% $38,612,31490% $43,171,752100% $48,002,586
MVP - Fargo/Moorhead Feasibility Report (North Dakota Option) - Cost Risk Analysis Model
This item captures the risk that will cause a variance from the current working estimate for the project.Likely assumes no change from the baseline estimate.
Assumes that without bid protests that costs would not decrease.
Assume that with bid protest that construction cost may be increase by 5%
USACE-MVP-0000087977

Risk Refer No. Risk Event Low Most Likely HighTL-1 Uncertainty with Geotechnical Conditions ($6,900,260) $0 $1,725,065
$27,601,040 $34,501,300 $36,226,365
Notes: Most Likely
Likely $785,000 (902020201) Piling for RRN Inlet Gated Structure Low $2,430,700 (902020301) Piling for RRN Inlet Structure Walls
$829,000 (903020201) Piling for Wolverton Creek StructureHigh $395,300 (904020201) Piling for WRR Inlet Gated Structure
$1,158,800 (904020301) Piling for WRR Inlet Structure Walls$580,600 (906020101) Piling for Inlet Weir Structure $761,300 (906020201) Piling for Inlet Weir Structure Walls
$4,271,500 (907020201) Piling for Sheyenne River Aqueduct Structure & Wingwalls$3,815,600 (90803) Piling for Drain 14 Structure$5,318,000 (909020201) Piling for Maple River Aqueduct Structure & Wingwalls$3,917,000 (910020201) Piling for Lower Rush River Drop Structure & Wingwalls$3,816,300 (911020201) Piling for Rush River Drop Structure & Wingwalls$2,299,500 (916020201) Piling for RRN Outlet Rollway Structure $2,285,300 (916020301) Piling for RRN Outlet Structure Walls
$918,700 (110503020201) Piling for Storage Area 1 North Structure & Walls$918,700 (110504020201) Piling for Storage Area 1 East Structure & Walls
$34,501,300 Total
Assumption: Uncertainty with Geotechnical ConditionsPercentile Assumption values
0% ($6,842,690)10% ($4,438,372)20% ($3,449,599)30% ($2,645,485)40% ($1,988,056)50% ($1,423,583)60% ($915,920)70% ($447,834)80% $8,08290% $510,233100% $1,692,320
Assumes 20% less costs for the piling of the hydraulic structures due to changes in the bearing capacity results for hydraulic structure pilings.
Assumes 5% greater costs for the piling of the hydraulic structures due to changes in the bearing capacity results for hydraulic structure pilings.
MVP - Fargo/Moorhead Feasibility Report (North Dakota Option) - Cost Risk Analysis Model
This item captures the risk that will cause a variance from the current working estimate for the project.Likely assumes no change from the baseline estimate.
USACE-MVP-0000087977

Risk Refer No. Risk Event Low Most Likely HighTL-4 Sedimentation Modeling $0 $0 $2,963,030
$29,630,300 $29,630,300 $32,593,330
Notes: Most Likely
Likely $29,630,300 WWR Control StructureLow
High
Assumption: Sedimentation ModelingPercentile Assumption values
0% $13710% $153,48620% $320,69230% $488,34140% $670,46550% $865,69760% $1,077,38470% $1,321,76480% $1,631,98590% $2,018,198100% $2,931,466
Assumes 0% less cost than baseline cost of WRR structure
Assumes 10% greater cost than baseline cost of the WRR structure
MVP - Fargo/Moorhead Feasibility Report (North Dakota Option) - Cost Risk Analysis Model
This item captures the risk that will cause a variance from the current working estimate for the project.Likely assumes no change from the baseline estimate.
USACE-MVP-0000087977

Risk Refer No. Risk Event Low Most Likely HighTL-5 Variation in Estimated Quantities ($16,245,040) $0 $16,245,040
$308,655,760 $324,900,800 $341,145,840
Notes: Most Likely
Likely $378,100 Reach 1 ExcavationLow $2,313,100 Reach 2 Excavation
$17,405,500 Reach 3 ExcavationHigh $55,596,500 Reach 4 Excavation
$11,279,200 Reach 5 Excavation$109,037,200 Reach 6 Excavation
$4,275,000 Reach 7 Excavation$1,139,900 Reach 8 Excavation
$11,685,400 (9020108) RRN Inlet Control Structure Excavation$3,804,900 (9040108) WRR Control Structure Excavation
$707,200 (9060109) Inlet Weir Excavation$11,443,400 (9070109) Sheyenne River Control Structure Excavation$6,937,000 (9090108) Maple River Control Structure Excavation$3,713,700 (9100107) Lower Rush River Control Structure Excavation$3,577,200 (9110107) Rush River Control Structure Excavation$2,866,800 (9160107) RRN Outlet Structure Excavation
$14,630,200 (110103) TBL East 2B Levee Excavation & Embankment$5,566,700 (110203) TBL Cass 17 Levee Excavation & Embankment$1,669,300 (110301) Connecting Channel 2018 Levee Excavation & Embankment$6,911,300 (110401 + 110402) Connecting Channel 2019 Levee Excavation & Embankment
$49,963,200 (11050105) Storage Area 1 Excavation & Embankment
$324,900,800 Total
Assumption: Variation in Estimated QuantitiesPercentile Assumption values
0% ($16,235,714)10% ($12,837,350)20% ($9,751,788)30% ($6,460,394)40% ($3,238,105)50% ($101,903)60% $3,260,80470% $6,491,59480% $9,809,37490% $12,994,490100% $16,233,593
Assumes quantities for excavation of diversion channel, control structures and levees costs 5% less than baseline amount.
Assumes quantities for excavation of diversion channel, control structures and levees costs 5% greater than baseline amount.
MVP - Fargo/Moorhead Feasibility Report (North Dakota Option) - Cost Risk Analysis Model
This item captures the risk that will cause a variance from the current working estimate for the project.Likely assumes no change from the baseline estimate.
USACE-MVP-0000087977

Risk Refer No. Risk Event Low Most Likely HighTL-6 Flowrate Capacity ($43,504,465) $0 $43,504,465
$826,584,835 ########### $913,593,765
Notes: Most Likely
Likely $103,611,800 02 Relocations - Roadway BridgesLow
$46,497,500 08 RailroadsHigh $608,789,400 09 Channels
$111,190,600 11 Levees, Floodwalls & Floodproofing
$870,089,300 Sub-total
$870,089,300 Total
Assumption: Flowrate CapacityPercentile Assumption values
0% ($42,755,438)10% ($24,098,505)20% ($16,017,924)30% ($9,994,294)40% ($4,579,017)50% $86,44160% $4,522,56970% $9,496,17680% $15,424,94090% $23,666,675
100% $43,275,554
MVP - Fargo/Moorhead Feasibility Report (North Dakota Option) - Cost Risk Analysis Model
This item captures the risk that will cause a variance from the current working estimate for the project.Likely assumes no change from the baseline estimate.Assumes 5% less cost than selected baseline cost for changes to the flowrate capcity that change features
Assumes 5% greater cost than selected baseline cost for changes to the flowrate capcity that change features
USACE-MVP-0000087977

Risk Refer No. Risk Event Low Most Likely HighTL-7 Relocations - Utilities ($793,395) $0 $4,760,370
$15,074,505 $15,867,900 $20,628,270
Notes: Most Likely
Likely $15,867,900 02 Relocations - UtilitiesLow
High
$15,867,900 total
Assumption: Relocations - UtilitiesPercentile Assumption values
0% ($777,429)10% ($133,506)20% $166,00130% $474,02840% $793,74050% $1,144,59060% $1,523,42970% $1,950,53380% $2,472,73590% $3,152,167100% $4,729,275
MVP - Fargo/Moorhead Feasibility Report (North Dakota Option) - Cost Risk Analysis Model
This item captures the risk that will cause a variance from the current working estimate for the project.Likely assumes no change from the baseline estimate.
Assumes 5% less cost than baseline cost for changes to the utility relocations
Assumes 30% greater cost than baseline cost for changes to the utility relocations
USACE-MVP-0000087977

Risk Refer No. Risk Event Low Most Likely HighTL-8 Relocations - Roadway Bridges ($5,180,590) $0 $10,361,180
$98,431,210 ########### $113,972,980
Notes: Most Likely
Likely $103,611,800 02 Relocations - Roadway BridgesLow
High
Assumption: Relocations - Roadway BridgesPercentile Assumption values
0% ($5,091,172)10% ($2,366,265)20% ($1,118,016)30% ($280,254)40% $527,97650% $1,396,51260% $2,367,86370% $3,430,87080% $4,705,16190% $6,330,013100% $10,114,164
MVP - Fargo/Moorhead Feasibility Report (North Dakota Option) - Cost Risk Analysis Model
This item captures the risk that will cause a variance from the current working estimate for the project.Likely assumes no change from the baseline estimate.
Assumes 5% less cost than baseline cost of Roadway Bridge structures
Assumes 10% greater cost than baseline cost of Roadway Bridge structures
USACE-MVP-0000087977

Risk Refer No. Risk Event Low Most Likely HighTL-9 Mitigation ($2,556,015) $0 $12,780,075
$48,564,285 $51,120,300 $63,900,375
Notes: Most Likely
Likely $51,120,300 06 MitigationLow
High
Assumption: MitigationPercentile Assumption values
0% ($2,552,682)10% ($1,007,328)20% $528,89230% $2,124,54640% $3,626,55250% $5,119,37360% $6,690,47770% $8,137,87680% $9,694,95290% $11,247,582100% $12,779,031
MVP - Fargo/Moorhead Feasibility Report (North Dakota Option) - Cost Risk Analysis Model
This item captures the risk that will cause a variance from the current working estimate for the project.Likely assumes no change from the baseline estimate.
Assumes that cost would be 5% less than estimated for mitigation
Assumes that cost would be 25% more than estimated for mitigation. (Talked with Jon & Elliot about variances)
USACE-MVP-0000087977

Risk Refer No. Risk Event Low Most Likely HighTL-10 Railroad Bridges ($2,324,875) $0 $16,274,125
$44,172,625 $46,497,500 $62,771,625
Notes: Most Likely
Likely $46,497,500 Railroad BridgesLow
High
Assumption: Railroad BridgesPercentile Assumption values
0% ($2,312,972)10% ($272,172)20% $690,75230% $1,712,15540% $2,800,39550% $3,886,12760% $5,202,63670% $6,686,94280% $8,447,36090% $10,696,869100% $16,210,634
MVP - Fargo/Moorhead Feasibility Report (North Dakota Option) - Cost Risk Analysis Model
This item captures the risk that will cause a variance from the current working estimate for the project.Likely assumes no change from the baseline estimate.
Assumes 5% less cost than baseline cost of the RR bridges
Assumes 35% greater cost than baseline cost of the RR bridges (based on RR estimate contingency)
USACE-MVP-0000087977

Risk Refer No. Risk Event Low Most Likely HighTL-11 Diversions Excavations & Productivity ($16,865,120) $0 $50,595,360
$320,437,280 ########### $387,897,760
Notes: Most Likely
Likely $337,302,400 Diversion Channel CostsLow
High
Assumption: Diversions Excavations & ProductivityPercentile Assumption values
0% ($16,584,792)10% ($6,032,992)20% ($1,809,367)30% $1,802,43240% $5,445,50650% $9,380,19260% $13,737,39270% $18,670,52380% $24,623,62390% $32,269,011100% $50,335,749
MVP - Fargo/Moorhead Feasibility Report (North Dakota Option) - Cost Risk Analysis Model
This item captures the risk that will cause a variance from the current working estimate for the project.Likely assumes no change from the baseline estimate.Assumes that cost would be 5% less than estimated (assumes that some of cost decrease is covered in TL-5, TL-6 and TL-16)
Assumes that cost would be 15% more than estimated (assumes that some of cost increase is covered in TL-5, TL-6 and TL-16)
USACE-MVP-0000087977

Risk Refer No. Risk Event Low Most Likely HighTL-12 Hydraulic Structures ($13,988,520) $0 $55,954,080
$265,781,880 ########### $335,724,480
Notes: Most Likely
Likely $48,276,200 RRN Inlet Control StructureLow $29,630,300 WRR Control Structure
$50,805,800 Sheyenne River Control StructureHigh $45,799,500 Maple River Control Structure
$17,743,600 Lower Rush River Control Structure$17,709,700 Rush River Control Structure$22,704,300 RRN Outlet Structure$4,366,300 Wolverton Creek Control Structure
$215,700 East Weir$9,942,200 Inlet Weir$8,378,200 Drain 14
$447,400 Large Drains$254,400 Small Drains
$8,453,100 Side Channel Inlets$5,662,300 Twin Side Channel Inlets$4,690,700 Storage Area 1 North Structure$4,690,700 Storage Area 1 East Structure
$279,770,400 Total
Assumption: Hydraulic StructuresPercentile Assumption values
0% ($13,620,969)10% ($3,943,240)20% $58,54630% $3,576,09740% $7,580,68450% $11,757,07760% $16,394,03370% $21,626,09980% $27,839,70390% $36,129,935100% $55,518,203
MVP - Fargo/Moorhead Feasibility Report (North Dakota Option) - Cost Risk Analysis Model
This item captures the risk that will cause a variance from the current working estimate for the project.Likely assumes no change from the baseline estimate.
Assumes 5% less cost than baseline for hydraulic structures
Assumes 20% greater cost than baseline for hydraulic structures
USACE-MVP-0000087977
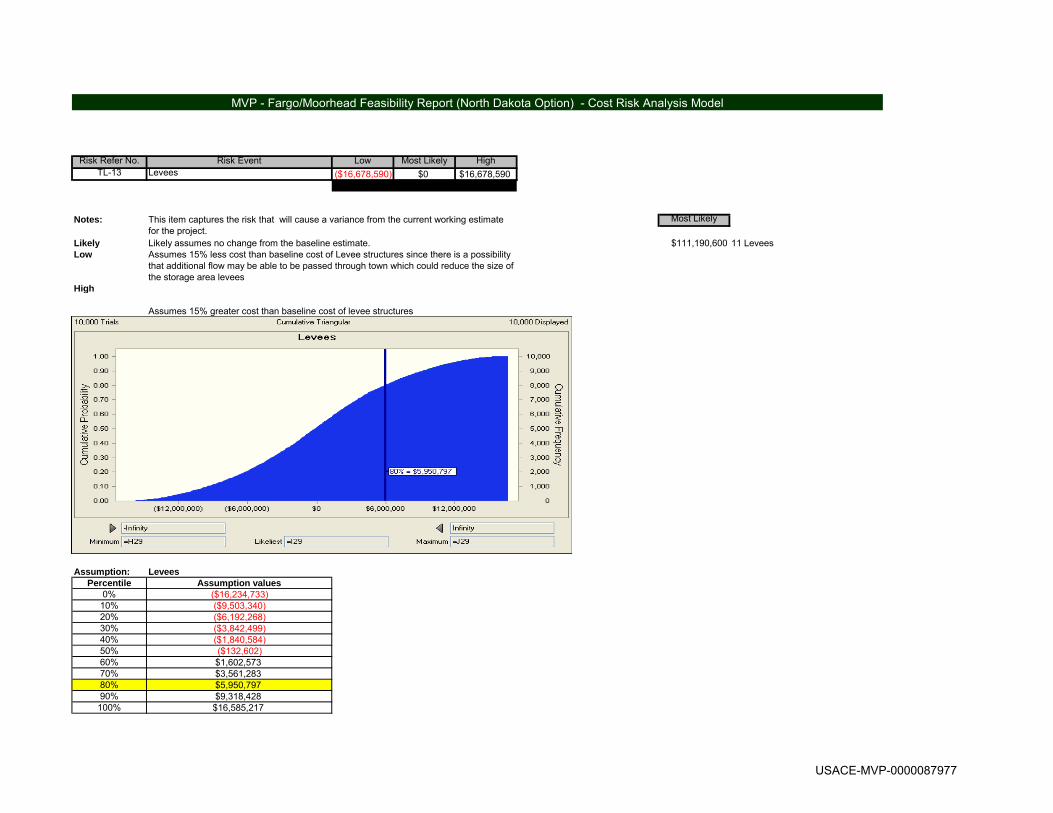
Risk Refer No. Risk Event Low Most Likely HighTL-13 Levees ($16,678,590) $0 $16,678,590
$94,512,010 ########### $127,869,190
Notes: Most Likely
Likely $111,190,600 11 LeveesLow
High
Assumption: LeveesPercentile Assumption values
0% ($16,234,733)10% ($9,503,340)20% ($6,192,268)30% ($3,842,499)40% ($1,840,584)50% ($132,602)60% $1,602,57370% $3,561,28380% $5,950,79790% $9,318,428100% $16,585,217
MVP - Fargo/Moorhead Feasibility Report (North Dakota Option) - Cost Risk Analysis Model
This item captures the risk that will cause a variance from the current working estimate for the project.Likely assumes no change from the baseline estimate.
Assumes 15% greater cost than baseline cost of levee structures
Assumes 15% less cost than baseline cost of Levee structures since there is a possibility that additional flow may be able to be passed through town which could reduce the size of the storage area levees
USACE-MVP-0000087977

Risk Refer No. Risk Event Low Most Likely HighTL-15 Recreational Facilities ($1,151,220) $0 $5,756,100
$21,873,180 $23,024,400 $28,780,500
Notes: Most Likely
Likely $23,024,400 14 Recreational FacilititesLow
High
Assumption: Recreational FacilitiesPercentile Assumption values
0% ($1,130,103)10% ($254,454)20% $110,46430% $464,28340% $855,52750% $1,276,53760% $1,773,44570% $2,301,32680% $2,953,02690% $3,764,057100% $5,674,666
MVP - Fargo/Moorhead Feasibility Report (North Dakota Option) - Cost Risk Analysis Model
This item captures the risk that will cause a variance from the current working estimate for the project.Likely assumes no change from the baseline estimate.
Assumes 5% less cost than baseline cost for the recreational features
Assumes 25% greater cost than baseline cost for the recreational features
USACE-MVP-0000087977
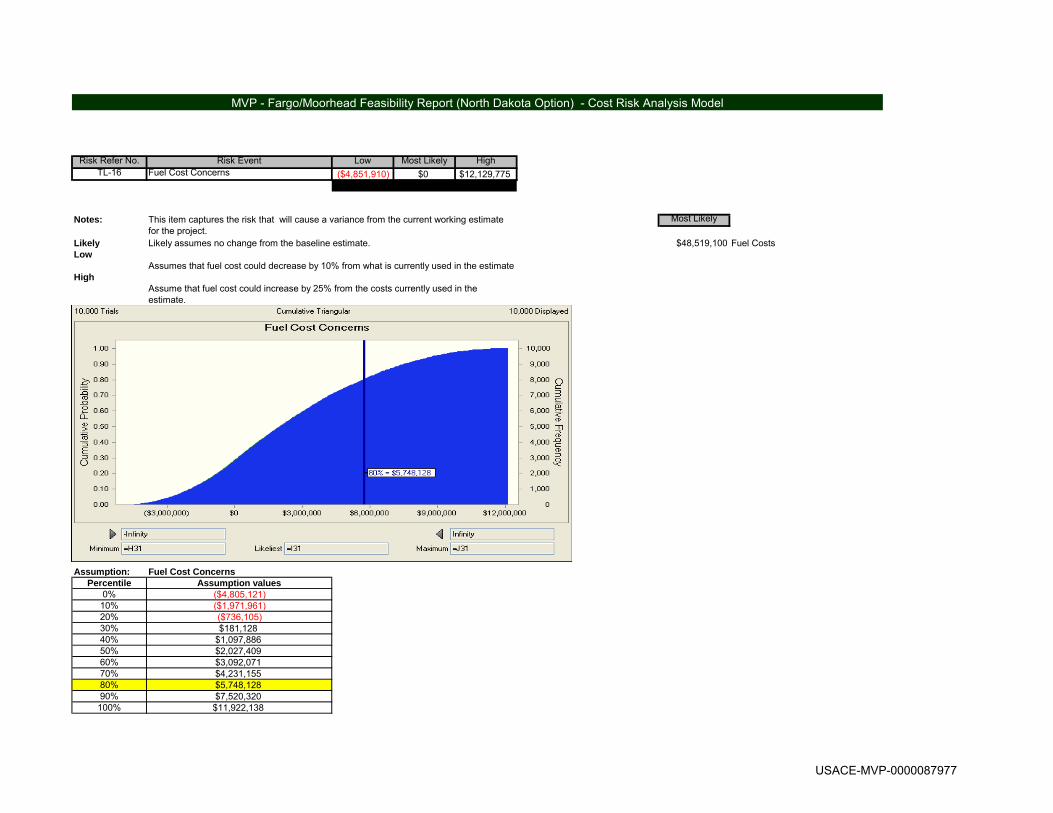
Risk Refer No. Risk Event Low Most Likely HighTL-16 Fuel Cost Concerns ($4,851,910) $0 $12,129,775
$43,667,190 $48,519,100 $60,648,875
Notes: Most Likely
Likely $48,519,100 Fuel CostsLow
High
Assumption: Fuel Cost ConcernsPercentile Assumption values
0% ($4,805,121)10% ($1,971,961)20% ($736,105)30% $181,12840% $1,097,88650% $2,027,40960% $3,092,07170% $4,231,15580% $5,748,12890% $7,520,320100% $11,922,138
MVP - Fargo/Moorhead Feasibility Report (North Dakota Option) - Cost Risk Analysis Model
This item captures the risk that will cause a variance from the current working estimate for the project.Likely assumes no change from the baseline estimate.
Assumes that fuel cost could decrease by 10% from what is currently used in the estimate
Assume that fuel cost could increase by 25% from the costs currently used in the estimate.
USACE-MVP-0000087977

Risk Refer No. Risk Event Low Most Likely High
LD-1Mitigation Needs Identified for Upstream Impacts due to staging ($50,000,000) $0 $0
-$49,750,000 $250,000 $250,000
Notes: Most Likely
Likely $250,000 Average Structure Cost $250,000 each Low
High
Assumption: Mitigation Needs Identified for Upstream Impacts due to stagingPercentile Assumption values
0% ($49,822,175)10% ($34,305,842)20% ($27,912,793)30% ($22,837,028)40% ($18,627,657)50% ($14,919,695)60% ($11,611,177)70% ($8,423,651)80% ($5,419,914)90% ($2,694,460)
100% ($2,724)
Assumes that an there are not any additional structures that are affected. (The way the hydraulic model has been set up maximized the area affected so number of structures is likely to go down)
MVP - Fargo/Moorhead Feasibility Report (North Dakota Option) - Cost Risk Analysis Model
This item captures the risk that will cause a variance from the current working estimate for the project.Likely assumes no change from the baseline estimate.There is a possibility that fewer structures may be impacted than is currently estimated based on the type of model used. Assume 200 fewer structures impacted x $250,000 each.
USACE-MVP-0000087977

Risk Refer No. Risk Event Low Most Likely High
LD-2Potential Savings for Eliminating RR Bridge 4 (RRVW 4th Sub) ($7,709,058) $0 $0
-$1,390,158 $6,318,900 $6,318,900
Notes: Most Likely
Likely $6,318,900 RR Bridge 4 + track workLow
High
Assumption: Potential Savings for Eliminating RR Bridge 4 (RRVW 4th Sub)Percentile Assumption values
0% ($7,709,058)10% ($7,709,058)20% ($7,709,058)30% ($7,709,058)40% ($7,709,058)50% ($7,709,058)60% ($7,709,058)70% ($7,709,058)80% ($7,709,058)90% ($7,709,058)
100% ($7,709,058)
MVP - Fargo/Moorhead Feasibility Report (North Dakota Option) - Cost Risk Analysis Model
This item captures the risk that will cause a variance from the current working estimate for the project.Likely assumes no change from the baseline estimate.If RR abondones RRVW 4th Sub line route this bridge would not be required. Saves cost of bridge + 15% PED and 7% CM
Cost for bridge already included in baseline
USACE-MVP-0000087977
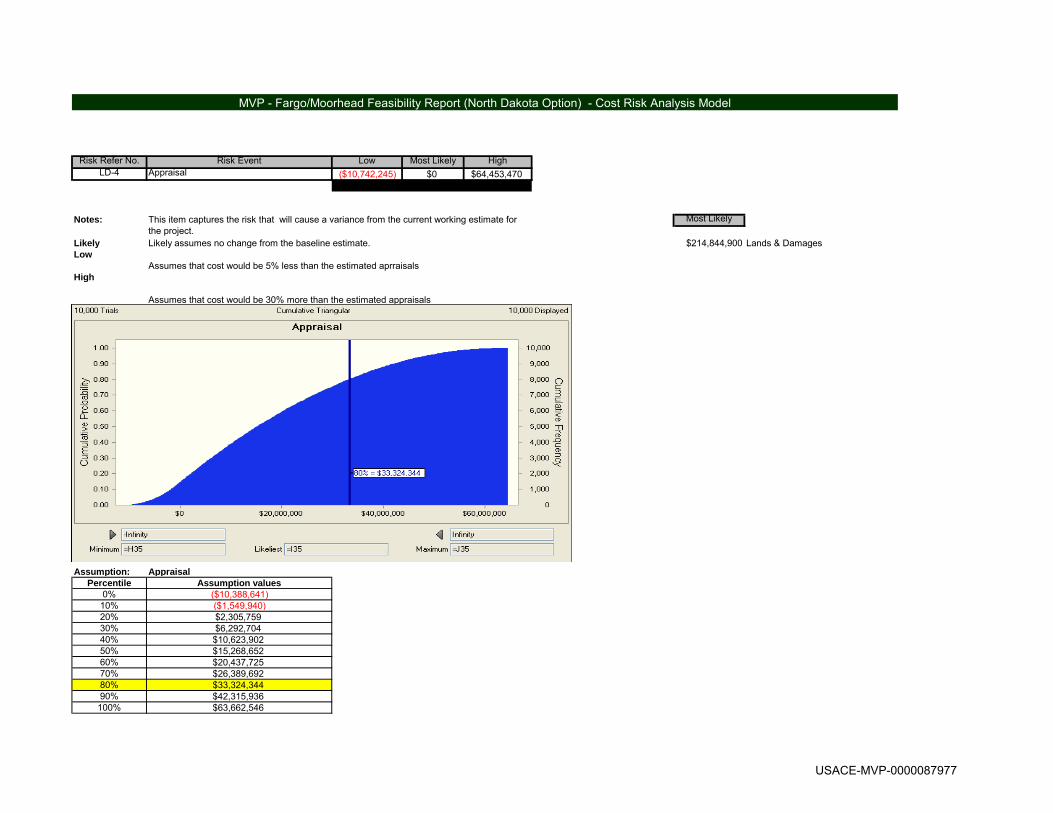
Risk Refer No. Risk Event Low Most Likely HighLD-4 Appraisal ($10,742,245) $0 $64,453,470
$204,102,655 ########### $279,298,370
Notes: Most Likely
Likely $214,844,900 Lands & DamagesLow
High
Assumption: AppraisalPercentile Assumption values
0% ($10,388,641)10% ($1,549,940)20% $2,305,75930% $6,292,70440% $10,623,90250% $15,268,65260% $20,437,72570% $26,389,69280% $33,324,34490% $42,315,936100% $63,662,546
MVP - Fargo/Moorhead Feasibility Report (North Dakota Option) - Cost Risk Analysis Model
This item captures the risk that will cause a variance from the current working estimate for the project.Likely assumes no change from the baseline estimate.
Assumes that cost would be 5% less than the estimated aprraisals
Assumes that cost would be 30% more than the estimated appraisals
USACE-MVP-0000087977

Risk Refer No. Risk Event Low Most Likely HighLD-5 Non-Appraisal ($39,777,160) $0 $21,484,490
$175,067,740 ########### $236,329,390
Notes: Most Likely
Likely $214,844,900 Lands & DamagesLow
High
Assumption: Non-AppraisalPercentile Assumption values
0% ($39,494,711)10% ($24,213,339)20% ($17,494,867)30% ($12,808,916)40% ($8,588,155)50% ($4,659,356)60% ($1,464,141)70% $1,710,91380% $5,292,64490% $9,929,246100% $21,267,254
MVP - Fargo/Moorhead Feasibility Report (North Dakota Option) - Cost Risk Analysis Model
This item captures the risk that will cause a variance from the current working estimate for the project.Likely assumes no change from the baseline estimate.
Assumes that cost would be 10% more than estimated due to increase of project footprint
Assumes that cost would be 5% less than estimated due to project footprint being less than currently estimated plus $29M recapture cost as identified and estimated by Real Estate Office
USACE-MVP-0000087977

Risk Refer No. Risk Event Low Most Likely High
RE-1 Environmental Mitigation Feature Concerns $0 $0 $0
$0 $0 $0
Notes: Most Likely
Likely $51,120,300 Environmental Mitigation CostLow
High
Assumption: Environmental Mitigation Feature ConcernsPercentile Assumption values
0%10%20%30%40%50%60%70%80%90%
100%
Assumes Mitigation work to be 20% more than the baseline
Assumes Mitigation work to be 20% less than the baseline
MVP - Fargo/Moorhead Feasibility Report (North Dakota Option) - Cost Risk Analysis Model
Likely assumes no change from the baseline estimate.
This item captures the risk that will cause a variance from the current working estimate for the project.
USACE-MVP-0000087977
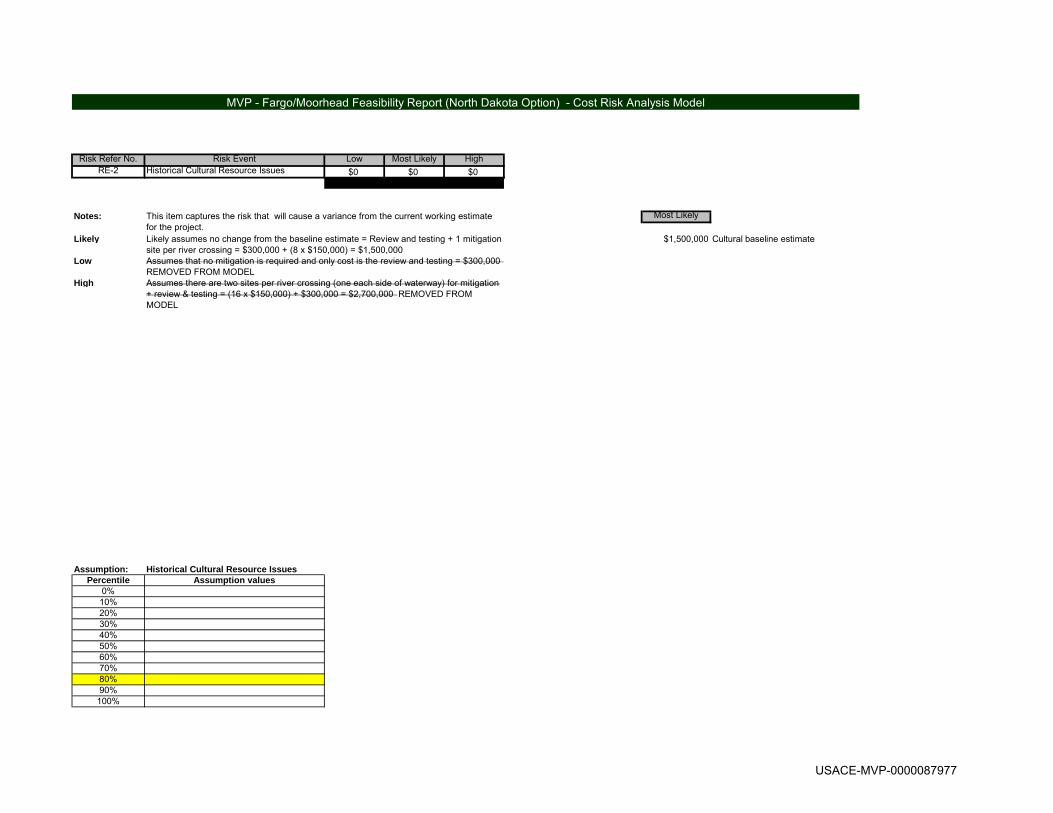
Risk Refer No. Risk Event Low Most Likely HighRE-2 Historical Cultural Resource Issues $0 $0 $0
$0 $0 $0
Notes: Most Likely
Likely $1,500,000 Cultural baseline estimate
Low
High
Assumption: Historical Cultural Resource IssuesPercentile Assumption values
0%10%20%30%40%50%60%70%80%90%
100%
Assumes that no mitigation is required and only cost is the review and testing = $300,000 REMOVED FROM MODELAssumes there are two sites per river crossing (one each side of waterway) for mitigation + review & testing = (16 x $150,000) + $300,000 = $2,700,000 REMOVED FROM MODEL
MVP - Fargo/Moorhead Feasibility Report (North Dakota Option) - Cost Risk Analysis Model
This item captures the risk that will cause a variance from the current working estimate for the project.Likely assumes no change from the baseline estimate = Review and testing + 1 mitigation site per river crossing = $300,000 + (8 x $150,000) = $1,500,000
USACE-MVP-0000087977
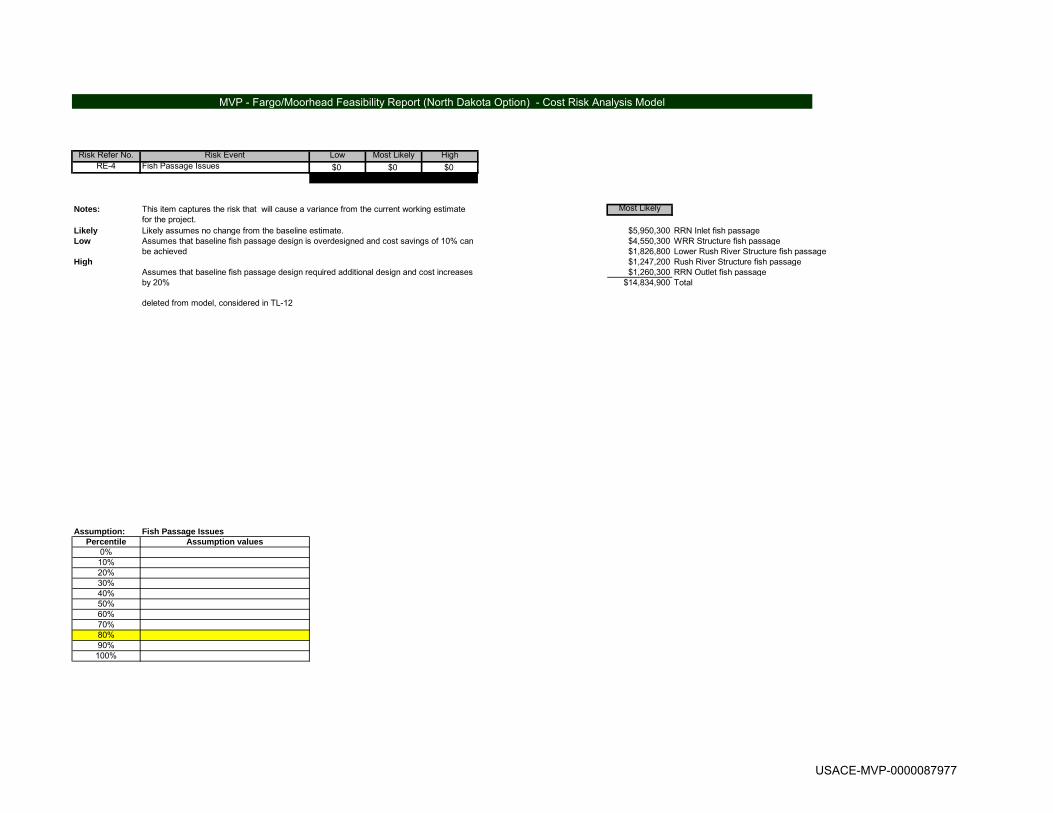
Risk Refer No. Risk Event Low Most Likely HighRE-4 Fish Passage Issues $0 $0 $0
$0 $0 $0
Notes: Most Likely
Likely $5,950,300 RRN Inlet fish passageLow $4,550,300 WRR Structure fish passage
$1,826,800 Lower Rush River Structure fish passageHigh $1,247,200 Rush River Structure fish passage
$1,260,300 RRN Outlet fish passage$14,834,900 Total
deleted from model, considered in TL-12
Assumption: Fish Passage IssuesPercentile Assumption values
0%10%20%30%40%50%60%70%80%90%
100%
Assumes that baseline fish passage design is overdesigned and cost savings of 10% can be achieved
Assumes that baseline fish passage design required additional design and cost increases by 20%
MVP - Fargo/Moorhead Feasibility Report (North Dakota Option) - Cost Risk Analysis Model
Likely assumes no change from the baseline estimate.
This item captures the risk that will cause a variance from the current working estimate for the project.
USACE-MVP-0000087977

Risk Refer No. Risk Event Low Most Likely HighCON-2 Control and Diversion of Water ($4,486,110) $0 $4,486,110
$10,467,590 $14,953,700 $19,439,810
Notes: Most Likely
Likely $503,800 Reach 1 Dewatering & Control of WaterLow $145,700 Reach 2 Dewatering & Control of Water
$744,300 Reach 3 Dewatering & Control of WaterHigh $2,656,300 Reach 4 Dewatering & Control of Water
$666,300 Reach 5 Dewatering & Control of Water$4,102,600 Reach 6 Dewatering & Control of Water
$306,200 Reach 7 Dewatering & Control of Water$194,300 Reach 8 Dewatering & Control of Water
$1,091,500 RRN Inlet Structure Dewatering$1,060,800 WRR Structure Dewatering$1,060,800 Sheyenne River Structure Dewatering$1,060,800 Maple River Structure Dewatering
$285,000 Lower Rush River Structure Dewatering$285,000 Rush River Structure Dewatering
$50,400 Wolverton Creek Dewatering$147,100 Inlet Weir Dewatering
$25,200 Drain 14 Dewatering$63,500 RRN Inlet Temporary Levees
$114,400 WRR Temporary Levees$31,800 Inlet Weir Temporary Levees
$200,200 Sheyenne River Structure Temp Levees$69,300 Maple River Structure Temp Levees$44,200 Lower Rush River Structure Temp Levees$44,200 Rush River Structure Temp Levees
$14,953,700 Total
Assumption: Control and Diversion of WaterPercentile Assumption values
0% ($4,377,189)10% ($2,530,566)20% ($1,664,013)30% ($1,031,560)40% ($437,215)50% $35,80460% $525,17770% $1,052,17680% $1,689,06990% $2,500,361
100% $4,427,802
Assumes 30% of baseline for Dewatering & Control of Water (Reduced from 50% --> 5% already in TL-6 and 15% already in TL12)
Assumes 30% greater than baseline for Dewatering & Control of Water
MVP - Fargo/Moorhead Feasibility Report (North Dakota Option) - Cost Risk Analysis Model
Likely assumes no change from the baseline estimate.
This item captures the risk that will cause a variance from the current working estimate for the project.
USACE-MVP-0000087977

Risk Refer No. Risk Event Low Most Likely HighCON-5 Project Sequencing ($8,700,882) $0 $43,504,410
$861,387,318 ########### $913,592,610
Notes: Most Likely
Likely $103,611,800 Roads & BridgesLow $46,497,500 Railroad Bridges
$608,789,400 Channels & CanalsHigh $111,189,500 Levees
$870,088,200
Assumption: Project SequencingPercentile Assumption values
0% ($8,697,537)10% ($3,686,013)20% $1,371,80530% $6,644,65340% $12,095,01150% $17,364,63760% $22,700,52670% $27,845,09880% $32,942,41590% $38,137,381100% $43,497,226
MVP - Fargo/Moorhead Feasibility Report (North Dakota Option) - Cost Risk Analysis Model
This item captures the risk that will cause a variance from the current working estimate for the project.Likely assumes no change from the baseline estimate.Assumes that cost would be 1% less than estimated due to sequencing actually saving money
Assumes that cost would be 5% more than estimated due to conflicts in project sequencing
USACE-MVP-0000087977

Risk Refer No. Risk Event Low Most Likely HighCON-6 Contract Mods ($24,002,548) $0 $96,010,190
$936,099,353 ########### ###########
Notes: Most Likely
Likely $119,479,700 02 RelocationsLow $51,120,300 06 Fish & Wildlife - Mitigation
$46,497,500 08 RailroadsHigh $608,789,400 09 Channels
$111,190,600 11 Levees, Floodwalls & Floodproofing$23,024,400 14 Recreational Facilities
$960,101,900 Total
Assumption: Contract ModsPercentile Assumption values
0% ($23,641,627)10% ($6,763,507)20% ($123,118)30% $6,190,90140% $12,618,92850% $20,036,33160% $27,912,05670% $36,500,59480% $47,359,55390% $62,372,258
100% $95,089,397
MVP - Fargo/Moorhead Feasibility Report (North Dakota Option) - Cost Risk Analysis Model
This item captures the risk that will cause a variance from the current working estimate for the project.Likely assumes no change from the baseline estimate.Assumes that cost would be 2.5% less than estimated due to contract mods that save money (i.e., by contractor VE proposals)
Assumes that cost would be 10% more than estimated due to contract mods (mods resulting from variation in quantities already in TL-5)
USACE-MVP-0000087977
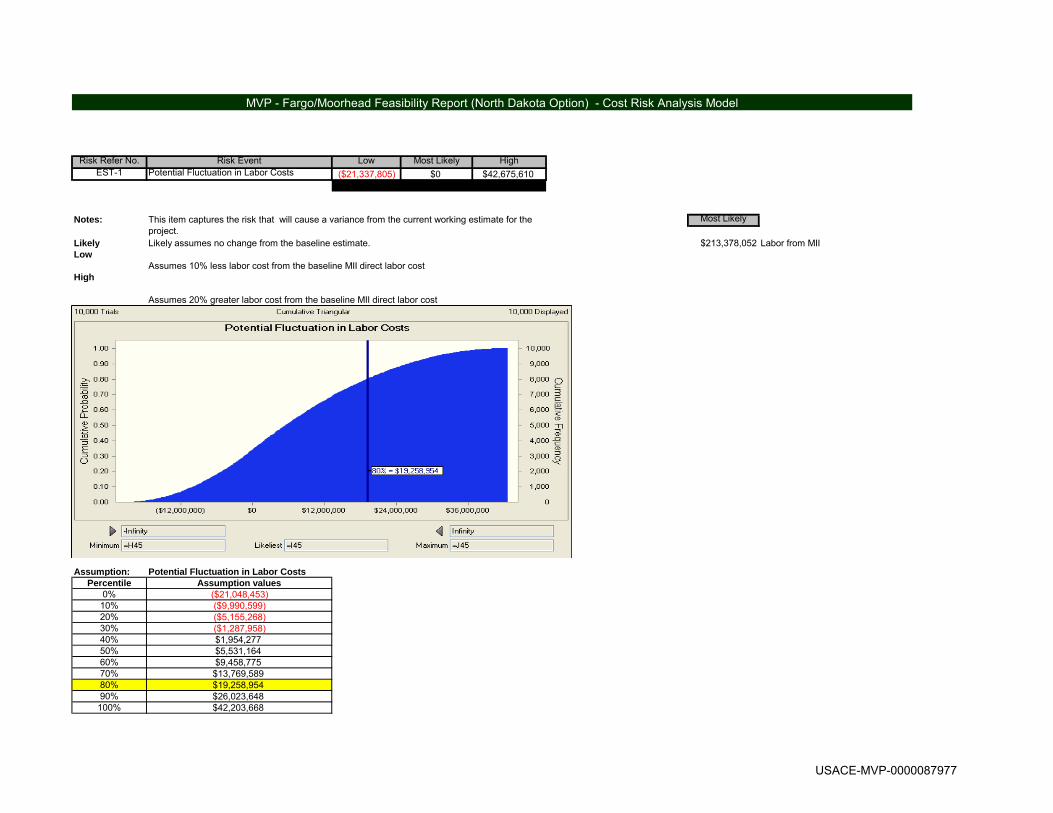
Risk Refer No. Risk Event Low Most Likely HighEST-1 Potential Fluctuation in Labor Costs ($21,337,805) $0 $42,675,610
$192,040,247 $213,378,052 $256,053,662
Notes: Most Likely
Likely $213,378,052 Labor from MIILow
High
Assumption: Potential Fluctuation in Labor CostsPercentile Assumption values
0% ($21,048,453)10% ($9,990,599)20% ($5,155,268)30% ($1,287,958)40% $1,954,27750% $5,531,16460% $9,458,77570% $13,769,58980% $19,258,95490% $26,023,648100% $42,203,668
Assumes 10% less labor cost from the baseline MII direct labor cost
Assumes 20% greater labor cost from the baseline MII direct labor cost
MVP - Fargo/Moorhead Feasibility Report (North Dakota Option) - Cost Risk Analysis Model
Likely assumes no change from the baseline estimate.
This item captures the risk that will cause a variance from the current working estimate for the project.
USACE-MVP-0000087977

Risk Refer No. Risk Event Low Most Likely HighEST-2 WBS Elements - Estimate confidence $0 $0 $0
$0 $0 $0
Notes: Most Likely
Likely $257,702,600 Lands & DamagesLow $51,120,300 Environmental Mitigation
High $308,822,900
Assumption: WBS Elements - Estimate confidencePercentile Assumption values
0%10%20%30%40%50%60%70%80%90%100%
MVP - Fargo/Moorhead Feasibility Report (North Dakota Option) - Cost Risk Analysis Model
This item captures the risk that will cause a variance from the current working estimate for the project.Likely assumes no change from the baseline estimate.
Assumes that cost would be 10% less than estimated for L&D and Mitigation
Assumes that cost would be 20% more than estimated for L&D and Mitigation
USACE-MVP-0000087977

Risk Refer No. Risk Event Low Most Likely HighEST-4 PED & CM ($57,029,940) $0 $0
$154,192,060 $211,222,000 $211,222,000
Notes: Most Likely
Likely $144,015,000 Lands & DamagesLow $67,207,000 Environmental Mitigation
High $211,222,000
Assumption: PED & CMPercentile Assumption values
0% ($56,470,612)10% ($39,661,854)20% ($31,915,392)30% ($26,143,891)40% ($20,875,317)50% ($16,574,122)60% ($12,797,376)70% ($9,350,377)80% ($5,914,976)90% ($2,900,895)100% ($9,808)
MVP - Fargo/Moorhead Feasibility Report (North Dakota Option) - Cost Risk Analysis Model
This item captures the risk that will cause a variance from the current working estimate for the project.Likely assumes no change from the baseline estimate.
Assumes that PED & CM cost would be the percent of the currently estimated construction cost used of 22% (15 + 7)
Assumes that PED & CM cost would be a total of 16% of the project cost rather than the currently used 22% (15 + 7). The 16% is based on the $410M Grand Forks/East Grand Forks Flood control project which was more urban levees & floodwalls. (16/22 = 0.727)
USACE-MVP-0000087977

Risk Refer No. Risk Event Low Most Likely HighPR-1 Uncertainty with Funding Stream $0 $0 $0
$0 $0 $0
Notes: Most Likely
Likely $214,844,900 01 Lands & DamagesLow $119,479,700 02 Relocations
$51,120,300 06 Environmental MitigationHigh $46,497,500 08 RR Bridges
$608,789,400 09 Diversion Channel$111,190,600 11 Levees & Floodwalls$23,024,400 14 Recreational Features
$144,015,000 30 PED$67,207,000 31 CM
$1,386,168,800 Total
Assumption: Uncertainty with Funding StreamPercentile Assumption values
0%10%20%30%40%50%60%70%80%90%100%
Assumes 10% less than baseline project cost estimate
Assumes 20% more than baseline project cost estimate
MVP - Fargo/Moorhead Feasibility Report (North Dakota Option) - Cost Risk Analysis Model
Likely assumes no change from the baseline estimate.
This item captures the risk that will cause a variance from the current working estimate for the project.
USACE-MVP-0000087977

Risk Refer No. Risk Event Low Most Likely High
PR-6Lawsuit Risk from NGOs and Upstream Interests $0 $0 $138,616,880
$1,386,168,800 $1,386,168,800 $1,524,785,680
Notes: Most Likely
Likely $214,844,900 01 Lands & DamagesLow $119,479,700 02 Relocations
$51,120,300 06 Environmental MitigationHigh $46,497,500 08 RR Bridges
$608,789,400 09 Diversion Channel$111,190,600 11 Levees & Floodwalls$23,024,400 14 Recreational Features
$144,015,000 30 PED$67,207,000 31 CM
$1,386,168,800 Total
Assumption: Lawsuit Risk from NGOs and Upstream InterestsPercentile Assumption values
0% $19,73110% $13,897,34920% $28,195,98730% $41,695,17440% $55,147,31450% $69,567,89960% $83,788,95470% $97,483,67480% $111,533,75190% $125,336,460
100% $138,614,006
MVP - Fargo/Moorhead Feasibility Report (North Dakota Option) - Cost Risk Analysis Model
This item captures the risk that will cause a variance from the current working estimate for the project.Likely assumes no change from the baseline estimate.
Assumes cost to remain at baseline if there are no lawsuits from upstream interest
Assumes 10% greater cost due to lawsuits from upstream interests that cause project delays or design changes
USACE-MVP-0000087977

PDT Discussions Likelihood* Impact* Risk Level*Rough Order
Impact ($) Likelihood* Impact* Risk Level*Rough Order Impact (mo)
Correlation to Other(s)
PROJECT & PROGRAM MGMT
PPM-1Project Schedule in Question
Due to the size and magnitude of the project, as well as the complexity of the structures and sequencing, there is inherent concern regarding the actual project schedule.
This could cause a variance in the project schedule (positive or negative, but most likely negative). Likely Significant High Likely Marginal Moderate Uniform Project Manager Project Cost & Schedule
PPM-2Accelerated Design Schedule
An accelerated schedule can result in inadequate studies, shortcuts in plans, change in contract acquisition strategy, failure to capture full scope, miss-steps, etc. There is the
potential of moving forward with limited information. The issue is covered in other risk events. Likely Significant High Likely Significant High Triangular District Management Project Cost & Schedule
PPM-3Unplanned Work that Must be Accommodated
Due to the preliminary stage of project development, there is potential that there may be features or subfeatures of
work that must be added to construction. Ice handling and sediment transport are the two most likely issues that must
be accommodated. There may also be mitigation requirements.
Most of these subfeatures are already captured in the design and estimate, but the configuration may change. Likely Significant High Likely Marginal Moderate Yes-No Project Manager Project Cost & Schedule
PPM-4Local Agency/Regulator Issues
The acceleration of the planning schedule has forced reviews and collaboration without much time given to local
agencies and regulators. Although there has been communication between the Government and the local
agencies, these agencies have not responded with definitive decisions. This could present potential impacts.
There has been some discussion and pushback from agencies to entertain altering the level of flows allowed in
the protected area from a 2-year as designed to a 5-year.Specifically, agencies may require that lower flows
must be accommodated. This could impact cost and schedule. Likely Significant High Likely Marginal Moderate Yes-No Project Manager Project Cost & Schedule
PPM-7 Contracting Staffing
Contracting is experiencing a lack of staffing, causing challenges in obtaining resources on a timely basis for all
procurements. Could cause a variance in the schedule. Unlikely Marginal Low Unlikely Marginal Low Uniform District Management Project Schedule
PPM-8 Scope Changes
The many competing interests & priorities, coupled with an accelerated schedule could result in scope changes currently uncaptured or unanticipated. These scope changes would require additional coordination, cause
further design and investigation and potentially impact the real estate acquisitions.
While minor alterations to the final alignment may occur, there should not be any major changes. Likely Marginal Moderate Likely Significant High Yes-No Project Manager Project Cost & Schedule
CONTRACT ACQUISITION RISKS
CA-1Undefined Acquisition Strategy
The overall acquisition strategy for both design and construction has not been defined. Acquisition strategy could affect/impact bid competition and bid costs. It can also move risk onto the Government, causing need for greater contingencies. Clarification should be made related to number of contracts, contract types, etc.
authority for this procurement.Acquisition stratagy needs to be defined and could impact
the cost and schedule. Likely Marginal Moderate Unlikely Marginal Low Triangular TASBContract Cost & Project
Schedule
CA-2Preference to Small Business
Most of the larger requirements are so large that they would not be suitable for small business. However, there
is potential for some of the restoration, seeding, and mitigation may be suitable for small business. There is a requirement for review by the PARC if the requirements
were less than $50 Million.
The project is so large, it is likely that even separable requirements would not be suitable for small business.
Could impact cost and schedule. Unlikely Marginal Low Unlikely Marginal Low Triangular ContractingContract Cost & Project
Schedule
CA-3Numerous Separate Contracts
There is potential to have numerous separate contracts, especially if the continuing contracts authority is not
granted. Funding stream issues could also have an impact on the number of contracts.
The best case would be 8 contracts. The worst case would be in excess of 12 contracts. More contracts could
increase bidding competition. This could have a significant effect on cost and schedule (either positive or
negative). Very Likely Significant High Unlikely Marginal Low Triangular Contracting Contract Cost
CA-4 Potential Bid Protests
The larger size of the project increase contractor interests in bidding, but also increases potntial risk for protets due
to hungry economy and interest in obtaining project dollars. This could impact cost and schedule. Likely Marginal Moderate Likely Marginal Moderate Yes-No Contracting Contract Cost
TECHNICAL RISKS
TL-1Uncertainty with Geotechnical Conditions
There is uncertainty with geotechnical conditions but the Phase 3 estimate uses recent borings from 2010 to help
define the the soil parameters for excavation and how that will impact the construction productivity. The material is all
clay and silt.
The current working estimate is fairly conservative. However, variation in the ultimate characterization of
material could cause significant variance in productivity. Could impact cost and schedule (positive or negative). Likely Critical High Likely Marginal Moderate Triangular Geotechnical/Civil Design
Contract Cost & Project Schedule
MVP - Fargo/Moorhead Feasibility Report (LPP - North Dakota Option) - PDT Risk Register
Concerns
Contract Risks (Internal Risk Items are those that are generated, caused, or controlled within the PDT's sphere of influence.)
Project Cost Project Schedule
Risk No. Risk/Opportunity EventVariance
DistributionAffected Project
ComponentResponsibility/POC
USACE-MVP-0000087977

PDT Discussions Likelihood* Impact* Risk Level*Rough Order
Impact ($) Likelihood* Impact* Risk Level*Rough Order Impact (mo)
Correlation to Other(s)Concerns
Project Cost Project Schedule
Risk No. Risk/Opportunity EventVariance
DistributionAffected Project
ComponentResponsibility/POC
TL-2 Survey Data IncompleteThe PDT currently has incomplete or outdated survey data
(for bathymetry for the Red River and Tributaries).
If the survey data uncovers data that differs greatly from current conceptual design, it could lead to variance in cost
(due to issues such as configuration and details for structures). More likely on ND side. Unlikely Marginal Low Unlikely Negligible Low Triangular Technical Lead
Contract Cost & Project Schedule
TL-3Maple Diversion Structure Concerns
Under very high flood events, water flows over and under the diversion structure. This could present issues, as this
an unusual technical approach.This could impact cost negatively. Could inpact the
schedule one year. Unlikely Marginal Low Unlikely Marginal Low Yes-No Hydrology/Hydraulic DesignContract Cost & Project
Schedule
TL-4 Sedimentation Modeling
The sedimentation modeling could show that higher flow accommodation may be necessary in the tributary
structures.
This issue is more likely on Wild Rice, but not as likely on the Sheyenne or the Maple. This could impact cost and
schedule. Unlikely Significant Moderate Unlikely Negligible Low Yes-No Hydrology/Hydraulic Design Contract Cost
TL-5Variation in Estimated Quantities
There is potential for variation of estimated quantities in the excavation and earthwork features. This could impact cost and schedule. Likely Significant High Likely Marginal Moderate Yes-No Hydrology/Hydraulic Design Contract Cost
TL-6 Flowrate Capacity
If during detailed design the hydraulics change, it could affect the amount of flow required for the diversion channel to handle. This would affect channel width, bridge lengths
and major hydraulic structure sizes This could impact cost and schedule. Likely Significant High Likely Marginal Moderate Yes-No Hydrology/Hydraulic Design Project Cost & Schedule
TL-7 Relocations - Utilities Quality of design at budget levelMost costs were obtained from affected utilities for the
major lines that are impacted. Likely Marginal Moderate Unlikely Negligible Low Triangular Cost Engineering Contract Cost
TL-8 Relocations - BridgesBridge costs will change depending on final diversion
channel width Bridge costs from historical DOT costs are fairly reliable. Likely Marginal Moderate Unlikely Negligible Low Triangular Cost Engineering Contract Cost
TL-9 Mitigation fish, wetlands, firest, adaptive management
Resource agencies have not agreed to any particular features yet so there is the potential for additional
mitigation beyond what is proposed. Very Likely Significant High Likely Negligible Low Uniform Environmental Compliance Project Cost
TL-10 Railroad BridgesRR Bridge sizes have changed since the initial RR bridge
estimates and the costs have been scaled Bridge costs from BNSF's consulting engineer are at
conceptual design and cost could have significant changes Likely Significant High Unlikely Marginal Low Triangular Structural Design Contract Cost
TL-11Diversions Excavations & Productivity
Excavations could be impacted by diversion alignment changes and/or model results Impacts should only affect quantities of different soil layers Likely Marginal Moderate Likely Marginal Moderate Triangular Geotechnical/Civil Design Contract Cost
TL-12 Hydraulic Structures Hydraulic structures will need to be modeled Model results could change design concepts Likely Significant High Likely Marginal Moderate Triangular Hydrology/Hydraulic DesignContract Cost & Project
Schedule
TL-13 LeveesLevee heights and lengths could change depending on if
upstream staging is incorporatedLevees for upstream staging may depend on model
studies and landowner oppisition Likely Marginal Moderate Likely Marginal Moderate Triangular Hydrology/Hydraulic DesignContract Cost & Project
Schedule
TL-14Non-Structural Floodproofing
Costs for downstream impacts could change when the effects of have been fully developed
With Phase 4 LPP design with the upstream staging, there should not be any downstream impacts. Unlikely Negligible Low Unlikely Marginal Low Triangular Technical Lead Project Cost
TL-15 Recreational Facilities Feasibility is at conceptual designFnial designs could look different than Feasibility but
overall concepts should be similar Likely Marginal Moderate Unlikely Marginal Low Triangular Cost Engineering Contract Cost
TL-16 Fuel Cost Concerns Volatility in the price of fuel
Recent spikes in fuel could increase the cost of fule for the project. Conversely, if the world markets calm down, fuel could return to a price lower that currently estimatesd in
the project. Likely Significant High Unlikely Marginal Low Triangular Cost Engineering Contract Cost
LANDS AND DAMAGES RISKS
LD-1
Mitigation Needs Identified for Upstream Impacts due to staging
The effects of the project on areas upstream may require mitigation footprint that has not been finalized. The
impacts may not be fully captured.
This could significantly impact costs depending on final staging area configuration. It could significantly impact
schedule. Likely Significant High Likely Significant High Yes-No Real Estate Project Cost & Schedule
LD-2Potential Savings for Eliminating RR Bridge 4
Currently, the RRVW RR has limited use of this line and indicated that abandonement is possible This could save the cost of bridge and track raise Likely Significant High Very Unlikely Negligible Low Yes-No Project Manager Project Cost & Schedule
LD-4 Appraisal
Appraisals carry certain assumptions based on technical information. If the techncial information has the potential
to change, the appraisals could be impacted. Appraisals are using an average value Likely Significant High Likely Marginal Moderate Triangular Real Estate Project Cost
LD-5 Non-Appraisal
Real Estate office is responsible for establishing contingencies. There could be risks outside their domain
that can still impact the costs. Real Estate office will be using the CSRA contingencies Likely Marginal Moderate Likely Marginal Moderate Triangular Real Estate Project Cost
REGULATORY AND ENVIRONMENTAL RISKS
USACE-MVP-0000087977

PDT Discussions Likelihood* Impact* Risk Level*Rough Order
Impact ($) Likelihood* Impact* Risk Level*Rough Order Impact (mo)
Correlation to Other(s)Concerns
Project Cost Project Schedule
Risk No. Risk/Opportunity EventVariance
DistributionAffected Project
ComponentResponsibility/POC
RE-1Environmental Mitigation Feature Concerns
The PDT is going to add a lump sum for separable environmental mitigation (to include construction and real
estate). This has not been well defined or finalized. This could impact the costs either positively or negatively. Likely Significant High Very Unlikely Negligible Low Triangular Environmental Compliance Project Cost
RE-2Historical Cultural Resource Issues
There is potential to find cultural resources, particularly on the riverbanks. No cultural resource survey has been
completed to date. Mitigiation will probably be necessary. Could impact cost. Very Likely Marginal Moderate Unlikely Marginal Low Triangular Environmental Compliance Project Cost
RE-3 HTRW Issues
There is some potential for discovery of HTRW in the project alignment. Most of the alignment is through
farmland. Could impact cost and schedule. Unlikely Marginal Low Unlikely Negligible Low Uniform Environmental Compliance Project Cost & Schedule
RE-4 Fish Passage Issues
There will be fish passage requirement in the project, but the actual configuration has not been finalized/agreed
upon by the local agencies. Could impact cost. Likely Marginal Moderate Unlikely Negligible Low Triangular Technical Lead Project Cost
RE-5Pressure to Compress Permitting Activities
The local agencies perceive that they are being pressured through the project permitting process.
PDT has programmed this into the schedule, and the agencies are not constricted more than normal review
times. Very Unlikely Negligible Low Unlikely Negligible Low Uniform Environmental Compliance Project Cost & Schedule
CONSTRUCTION RISKS
CON-1Unknown Residential Utility Conflicts
There is potential for the need to abandon some small residential utilities.
This could impact cost and schedule, but it would be negligible. Likely Negligible Low Unlikely Negligible Low Triangular Technical Lead
Contract Cost & Project Schedule
CON-2Control and Diversion of Water
Methodology of controlling water could be impacted by the sequencing and timing of relocation, the characterization
of materials, or other unknown impacts. Could impact cost and schedule. Likely Significant High Unlikely Marginal Low Triangular Technical Lead Contract Cost
CON-3Conflicts between Contractors
There is potential for conflicts between multiple contractors working in the same footprint at the same time. Could impact cost. Likely Negligible Low Unlikely Negligible Low Triangular Construction
Contract Cost & Project Schedule
CON-4 Sufficient QA Staff to manage numerous contracts, mods and claimsED-C is well aware of QA staffing issues and is planning
accordingly Unlikely Marginal Low Unlikely Negligible Low Triangular ContractingContract Cost & Project
Schedule
CON-5 Project Sequencingconflicts between contractors and schedule impacts (one
contractor waiting on another)Conficts may develop at reaches interface, building of
bridges or hydraulic structures Likely Significant High Likely Marginal Moderate Uniform Construction Project Cost & Schedule
CON-6 Contract Mods
Contract mods and claims resulting from unforeseen site conditions, weather impacts, political and lawsuit impacts
are a concern and can impact both cost and schedule.Many of these concerns may be valid and impact the
project Likely Significant High Likely Negligible Low Triangular Construction Contract Cost
ESTIMATE AND SCHEDULE RISKS
EST-1Potential Fluctuation in Labor Costs
There is concern that the labor force required for this work could be a challenge, requiring off-site labor, per diem and
premium pay, as well as unique markups and multipliers for workers compensation and other factors.
Estimate currently has National Wage rates, which are higher than the local Davis-Bacon Wage Determination.
The Estimate also includes $75/day for per diem. There is potential for savings, as the labor wage rate for North Dakota is cheaper than Minnesota. This could impact
costs either positively or negatively. Likely Significant High Very Unlikely Negligible Low Triangular Cost Engineering Contract Cost
EST-2WBS Elements - Estimate confidence
Certain WBS elements are better developed in scope and estimate than other scope areas. Some WBS elements may be more or less conservative. Some elements have greater risk and resulting need for greater contingencies.
The major cost elements for the diversion excavation, hydraulic structures and bridges have been highly
developed for feasibility since they make up the bulk of the cost items. Environmental mitigation features are less
develop and more conceptual and likely will change. Real Estate may be another area of risk confidence Likely Marginal Moderate Likely Marginal Low Triangular Cost Engineering Contract Cost
EST-3 Estimate assumptions
The estimate assumptions may be flawed in certain cost areas related to scope, crews, productivity, material cost, markups, contingencies, etc. This could result in a flawed
budget development.
The estimate has been in development for enough time that scope, crews, productivety, matrerial costs and
markups are fairly well developed. Contingencies are from the CSRA Unlikely Marginal Low Likely Negligible Low Triangular Cost Engineering Contract Cost
EST-4 PED & CMThe estiamte currently uses 15% PED and 7% CM of the
constrcution cost.
With the high construction cost of this project and the amount of design required for excavation, these
percentages may be too high, based on about 16% for the $410M Grand Forks/East Grand Forks Flood project which
was more urban levees & floodwalls. Likely Significant High Unlikely Negligible Low Triangular Cost Engineering Project Cost
USACE-MVP-0000087977

PDT Discussions Likelihood* Impact* Risk Level*Rough Order
Impact ($) Likelihood* Impact* Risk Level*Rough Order Impact (mo)
Correlation to Other(s)Concerns
Project Cost Project Schedule
Risk No. Risk/Opportunity EventVariance
DistributionAffected Project
ComponentResponsibility/POC
PR-1Uncertainty with Funding Stream
There is a window of opportunity during the next couple years of obtaining the necessary increments on a timely basis. However, historically this has been a challenge in
obtaining the increments necessary to complete on schedule, and there have been challenges in obtaining
them on a timely basis. This could impact both cost and schedule. Very Likely Significant High Very Likely Significant High Uniform Project Manager Project Cost & Schedule
PR-2 Unusually Wet Season
If a given construction season is unusually higher than an average year, it could have significant impact on the
productivity of the work.If this it occurs, it reduce productivity and create
substantial delays. Unlikely Marginal Low Unlikely Marginal Low Binomial N/A Project Cost & Schedule
PR-3 Flooding EventThere is a chance of a flooding event during construction that could cause damage to constructed work features. This could impact both cost and schedule. Very Unlikely Negligible Low Very Unlikely Negligible Low Binomial N/A Project Cost & Schedule
PR-4Political factors change at state, local, or federal level
Senator Dorgan has retired. He was very influential and favorable to the project interests. Since the authorization was not obtained prior to his departure, there is concern that the project would not be authorized or funded on a
timely basis. Could impact cost and schedule. Unlikely Marginal Low Unlikely Crisis High Yes-No Project Manager Project Schedule
PR-5 Political oppositionThere could be opposition from Federal Agenceis (FEMA,
FWS, and EPA). Could impact cost and schedule. Likely Marginal Low Likely Marginal Moderate Uniform Project Manager Project Cost & Schedule
PR-6Lawsuit Risk from NGOs and Upstream Interests
There may be perceived damages from upstream concerns or non-sponsor cities that are affected. Could impact cost and schedule. Likely Significant High Unlikely Significant Moderate Uniform Project Manager Project Schedule
11. Results of the risk identification process are studied and further developed by the Cost Engineer, then analyzed through the Monte Carlo Analysis Method for Cost (Contingency) and Schedule (Escalation) Growth.
4. Impact is a measure of the event's effect on project objectives with relation to scope, cost, and/or schedule -- Negligible, Marginal, Significant, Critical, or Crisis. Impacts on Project Cost may vary in severity from impacts on Project Schedule.5. Risk Level is the resultant of Likelihood and Impact Low, Moderate, or High. Refer to the matrix located at top of page.
7. The responsibility or POC is the entity responsible as the Subject Matter Expert (SME) for action, monitoring, or information on the PDT for the identified risk or opportunity.
9. Affected Project Component identifies the specific item of the project to which the risk directly or strongly correlates.
6. Variance Distribution refers to the behavior of the individual risk item with respect to its potential effects on Project Cost and Schedule. For example, an item with clearly defined parameters and a solid most likely scenario would probably follow a triangular or normal distribution. A risk item for which the PDT has little data or probability of modeling with respect to effects on cost or schedule (i.e. "anyone's guess") would probably follow a uniform or discrete uniform distribution.
8. Correlation recognizes those risk events that may be related to one another. Care should be given to ensure the risks are handled correctly without a "double counting."
10. Project Implications identifies whether or not the risk item affects project cost, project schedule, or both. The PDT is responsible for conducting studies for both Project Cost and for Project Schedule.
3. Likelihood is a measure of the probability of the event occurring -- Very Unlikely, Unlikely, Moderately Likely, Likely, Very Likely. The likelihood of the event will be the same for both Cost and Schedule, regardless of impact.
*Likelihood, Impact, and Risk Level to be verified through market research and analysis (conducted by cost engineer).1. Risk/Opportunity identified with reference to the Risk Identification Checklist and through deliberation and study of the PDT.2. Discussions and Concerns elaborates on Risk/Opportunity Events and includes any assumptions or findings (should contain information pertinent to eventual study and analysis of event's impact to project).
Programmatic Risks (External Risk Items are those that are generated, caused, or controlled exclusively outside the PDT's sphere of influence.)
USACE-MVP-0000087977

Contingency on Base Estimate 80% Confidence Project CostBaseline Estimate Cost (Most Likely) -> $1,387,078,819
Baseline Estimate Cost Contingency Amount -> $278,937,013Baseline Estimate Construction Cost (80% Confidence) -> $1,666,015,833
Contingency on Schedule 80% Confidence Project ScheduleProject Schedule Duration (Most Likely) -> 122.2 Months
Schedule Contingency Duration -> 116.6 MonthsProject Schedule Duration (80% Confidence) -> 238.7 Months
Project Schedule Contingency Amount (80% Confidence) -> $88,260,054
Project Contingency 80% Confidence Project CostProject Contingency Amount (80% Confidence) -> $367,197,067
Project Contingency Percentage (80% Confidence) -> 26%
Project Cost (80% Confidence) -> $1,754,275,887
Most LikelyCost Estimate
Confidence Level Project Cost Contingency Contingency %0% $1,339,855,676 ($47,223,143) -3.40% ########5% $1,505,513,807 $118,434,988 8.54% ########
10% $1,538,269,944 $151,191,124 10.90% ########15% $1,560,810,805 $173,731,985 12.53% ########20% $1,577,802,468 $190,723,649 13.75% ########25% $1,593,278,637 $206,199,818 14.87% ########30% $1,607,580,440 $220,501,621 15.90% ########35% $1,621,111,138 $234,032,319 16.87% ########40% $1,634,694,783 $247,615,964 17.85% ########45% $1,647,129,777 $260,050,958 18.75% ########50% $1,660,870,979 $273,792,160 19.74% ########55% $1,674,604,577 $287,525,758 20.73% ########60% $1,688,826,432 $301,747,612 21.75% ########65% $1,703,289,774 $316,210,955 22.80% ########70% $1,719,421,608 $332,342,789 23.96% ########75% $1,735,440,729 $348,361,910 25.11% ########80% $1,754,275,887 $367,197,067 26.47% ########85% $1,775,988,250 $388,909,431 28.04% ########90% $1,802,415,619 $415,336,800 29.94% ########95% $1,840,932,008 $453,853,189 32.72% ########
100% $2,040,970,710 $653,891,891 47.14% ########
MVP - Fargo/Moorhead Feasibility Report (North Dakota Option) - Cost & Schedule Risk Analysis
- PROJECT CONTINGENCY DEVELOPMENT -
Contingency Analysis$1,387,078,819
$1,200,000,000
$1,300,000,000
$1,400,000,000
$1,500,000,000
$1,600,000,000
$1,700,000,000
$1,800,000,000
$1,900,000,000
$2,000,000,000
$2,100,000,000
0% 10%
20%
30%
40%
50%
60%
70%
80%
90%
100%
Cos
t
Confidence Levels
Project Cost Contingency Analysis
Project Cost based at 80% Confidence Level
"Most Likely" Project Cost
Corresponding Contingency
Amount
USACE-MVP-0000087977

Most LikelyCost Estimate
Confidence Level Project Cost Contingency Contingency %0% $1,336,855,935 ($50,222,884) -3.62% ########5% $1,478,536,519 $91,457,700 6.59% ########
10% $1,505,453,347 $118,374,528 8.53% ########15% $1,524,147,605 $137,068,786 9.88% ########20% $1,537,481,951 $150,403,131 10.84% ########25% $1,549,681,209 $162,602,390 11.72% ########30% $1,560,624,812 $173,545,992 12.51% ########35% $1,571,117,586 $184,038,767 13.27% ########40% $1,581,539,408 $194,460,589 14.02% ########45% $1,590,558,739 $203,479,920 14.67% ########50% $1,600,501,068 $213,422,249 15.39% ########55% $1,610,094,229 $223,015,410 16.08% ########60% $1,620,246,516 $233,167,697 16.81% ########65% $1,630,424,107 $243,345,287 17.54% ########70% $1,641,958,964 $254,880,145 18.38% ########75% $1,653,035,337 $265,956,518 19.17% ########80% $1,666,015,833 $278,937,013 20.11% ########85% $1,681,112,745 $294,033,926 21.20% ########90% $1,699,645,557 $312,566,738 22.53% ########95% $1,727,019,327 $339,940,507 24.51% ########
100% $1,888,078,395 $500,999,575 36.12% ########
Contingency Analysis$1,387,078,819
- BASE CONTINGENCY DEVELOPMENT -
$1,200,000,000
$1,300,000,000
$1,400,000,000
$1,500,000,000
$1,600,000,000
$1,700,000,000
$1,800,000,000
$1,900,000,000
$2,000,000,000
0% 10%
20%
30%
40%
50%
60%
70%
80%
90%
100%
Cos
tConfidence Levels
Base Estimate Cost Contingency Analysis (Does not Include Escalation)
Project Cost based at 80% Confidence Level
"Most Likely" Project Cost
Corresponding Contingency Amount
USACE-MVP-0000087977

Most LikelySchedule
Confidence Level Project Duration Contingency Contingency %0% 109.6 Months -12.6 Months -10.29% 122 5% 145.9 Months 23.7 Months 19.44% 122
10% 154.8 Months 32.6 Months 26.68% 122 15% 160.6 Months 38.4 Months 31.45% 122 20% 166.1 Months 44.0 Months 35.99% 122 25% 171.1 Months 48.9 Months 40.05% 122 30% 176.2 Months 54.0 Months 44.21% 122 35% 180.8 Months 58.6 Months 47.98% 122 40% 185.6 Months 63.4 Months 51.90% 122 45% 190.7 Months 68.6 Months 56.14% 122 50% 196.5 Months 74.3 Months 60.85% 122 55% 202.8 Months 80.6 Months 65.98% 122 60% 208.9 Months 86.8 Months 71.03% 122 65% 215.4 Months 93.3 Months 76.34% 122 70% 222.4 Months 100.2 Months 82.04% 122 75% 229.9 Months 107.7 Months 88.17% 122 80% 238.7 Months 116.6 Months 95.43% 122 85% 248.7 Months 126.6 Months 103.63% 122 90% 260.7 Months 138.5 Months 113.42% 122 95% 277.6 Months 155.4 Months 127.23% 122
100% 336.6 Months 214.5 Months 175.56% 122
Contingency Analysis122.2 Months
- SCHEDULE CONTINGENCY (DURATION) DEVELOPMENT -
0.0 Months
60.0 Months
120.0 Months
180.0 Months
240.0 Months
300.0 Months
360.0 Months
0% 10%
20%
30%
40%
50%
60%
70%
80%
90%
100%
Dur
atio
n
Confidence Levels
Schedule Contingency (Duration) Analysis
Project Duration at 80% Confidence Level
Current Project Duration
Corresponding VarianceDuration
USACE-MVP-0000087977

Most LikelyCost Estimate
Confidence Level Project Cost Contingency Contingency %0% $1,390,078,560 $2,999,741 0.22% ########5% $1,414,056,107 $26,977,288 1.94% ########
10% $1,419,895,416 $32,816,596 2.37% ########15% $1,423,742,019 $36,663,200 2.64% ########20% $1,427,399,336 $40,320,517 2.91% ########25% $1,430,676,248 $43,597,428 3.14% ########30% $1,434,034,448 $46,955,629 3.39% ########35% $1,437,072,372 $49,993,552 3.60% ########40% $1,440,234,194 $53,155,375 3.83% ########45% $1,443,649,857 $56,571,038 4.08% ########50% $1,447,448,730 $60,369,911 4.35% ########55% $1,451,589,167 $64,510,348 4.65% ########60% $1,455,658,735 $68,579,915 4.94% ########65% $1,459,944,487 $72,865,667 5.25% ########70% $1,464,541,463 $77,462,644 5.58% ########75% $1,469,484,212 $82,405,392 5.94% ########80% $1,475,338,873 $88,260,054 6.36% ########85% $1,481,954,325 $94,875,505 6.84% ########90% $1,489,848,881 $102,770,062 7.41% ########95% $1,500,991,501 $113,912,681 8.21% ########
100% $1,539,971,135 $152,892,316 11.02% ########
Contingency Analysis$1,387,078,819
- SCHEDULE CONTINGENCY (AMOUNT) DEVELOPMENT -
$1,300,000,000
$1,350,000,000
$1,400,000,000
$1,450,000,000
$1,500,000,000
$1,550,000,000
$1,600,000,000
0% 10%
20%
30%
40%
50%
60%
70%
80%
90%
100%
Cos
t
Confidence Levels
Project Schedule Contingency Analysis
Project Cost Plus Schedule Contingency based at 80%
Confidence Level
"Most Likely" Project Cost
Corresponding Schedule Contingency
Amount
USACE-MVP-0000087977

MVP - Fargo/Moorhead Feasibility Report (North Dakota Option) - Schedule Risk Analysis
USACE-MVP-0000087977
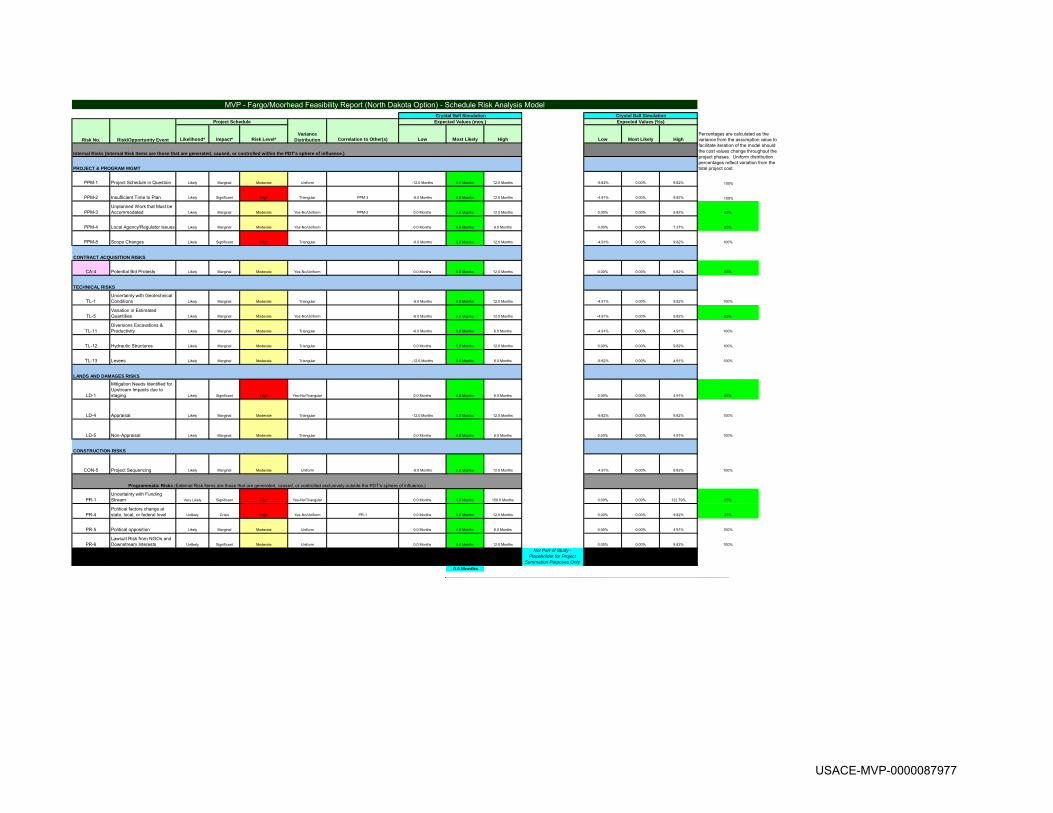
Likelihood* Impact* Risk Level* Correlation to Other(s) Low Most Likely High Low Most Likely High
PPM-1 Project Schedule in Question Likely Marginal Moderate Uniform -12.0 Months 0.0 Months 12.0 Months 0 -9.82% 0.00% 9.82% 100%
PPM-2 Insufficient Time to Plan Likely Significant High Triangular PPM-3 -6.0 Months 0.0 Months 12.0 Months 0 -4.91% 0.00% 9.82% 100%
PPM-3Unplanned Work that Must be Accommodated Likely Marginal Moderate Yes-No/Uniform PPM-2 0.0 Months 0.0 Months 12.0 Months 0 0.00% 0.00% 9.82% 65%
PPM-4 Local Agency/Regulator Issues Likely Marginal Moderate Yes-No/Uniform 0.0 Months 0.0 Months 9.0 Months 0 0.00% 0.00% 7.37% 65%
PPM-8 Scope Changes Likely Significant High Triangular -6.0 Months 0.0 Months 12.0 Months 0 -4.91% 0.00% 9.82% 100%
CA-4 Potential Bid Protests Likely Marginal Moderate Yes-No/Uniform 0.0 Months 0.0 Months 12.0 Months 0 0.00% 0.00% 9.82% 65%
TL-1Uncertainty with Geotechnical Conditions Likely Marginal Moderate Triangular -6.0 Months 0.0 Months 12.0 Months 0 -4.91% 0.00% 9.82% 100%
TL-5Variation in Estimated Quantities Likely Marginal Moderate Yes-No/Uniform -6.0 Months 0.0 Months 12.0 Months 0 -4.91% 0.00% 9.82% 65%
TL-11Diversions Excavations & Productivity Likely Marginal Moderate Triangular -6.0 Months 0.0 Months 6.0 Months 0 -4.91% 0.00% 4.91% 100%
TL-12 Hydraulic Structures Likely Marginal Moderate Triangular 0.0 Months 0.0 Months 12.0 Months 0 0.00% 0.00% 9.82% 100%
TL-13 Levees Likely Marginal Moderate Triangular -12.0 Months 0.0 Months 6.0 Months 0 -9.82% 0.00% 4.91% 100%
LD-1
Mitigation Needs Identified for Upstream Impacts due to staging Likely Significant High Yes-No/Triangular 0.0 Months 0.0 Months 6.0 Months 0 0.00% 0.00% 4.91% 65%
LD-4 Appraisal Likely Marginal Moderate Triangular -12.0 Months 0.0 Months 12.0 Months 0 -9.82% 0.00% 9.82% 100%
LD-5 Non-Appraisal Likely Marginal Moderate Triangular 0.0 Months 0.0 Months 6.0 Months 0 0.00% 0.00% 4.91% 100%
CON-5 Project Sequencing Likely Marginal Moderate Uniform -6.0 Months 0.0 Months 12.0 Months 0 -4.91% 0.00% 9.82% 100%
PR-1Uncertainty with Funding Stream Very Likely Significant High Yes-No/Triangular 0.0 Months 0.0 Months 150.0 Months 0 0.00% 0.00% 122.79% 85%
PR-4Political factors change at state, local, or federal level Unlikely Crisis High Yes-No/Uniform PR-1 0.0 Months 0.0 Months 12.0 Months 0 0.00% 0.00% 9.82% 25%
PR-5 Political opposition Likely Marginal Moderate Uniform 0.0 Months 0.0 Months 6.0 Months 0 0.00% 0.00% 4.91% 100%
PR-6Lawsuit Risk from NGOs and Downstream Interests Unlikely Significant Moderate Uniform 0.0 Months 0.0 Months 12.0 Months 0 0.00% 0.00% 9.82% 100%
$122
Not Part of Study - Placeholder for Project
Summation Purposes Only0.0 Months
MVP - Fargo/Moorhead Feasibility Report (North Dakota Option) - Schedule Risk Analysis ModelCrystal Ball SimulationExpected Values (%s)
TECHNICAL RISKS
Project ScheduleCrystal Ball Simulation
Programmatic Risks (External Risk Items are those that are generated, caused, or controlled exclusively outside the PDT's sphere of influence.)
Percentages are calculated as the variance from the assumption value to facilitate iteration of the model should the cost values change throughout the project phases. Uniform distribution percentages reflect variation from the total project cost.PROJECT & PROGRAM MGMT
Risk No. Risk/Opportunity Event
Internal Risks (Internal Risk Items are those that are generated, caused, or controlled within the PDT's sphere of influence.)
CONTRACT ACQUISITION RISKS
CONSTRUCTION RISKS
Variance Distribution
Expected Values (mos.)
LANDS AND DAMAGES RISKS
USACE-MVP-0000087977

Percentile Contingency Baseline w/ Contingency Contingency %0% -12.6 Months 109.6 Months -10.29%5% 23.7 Months 145.9 Months 19.44%10% 32.6 Months 154.8 Months 26.68%15% 38.4 Months 160.6 Months 31.45%20% 44.0 Months 166.1 Months 35.99%25% 48.9 Months 171.1 Months 40.05%30% 54.0 Months 176.2 Months 44.21%35% 58.6 Months 180.8 Months 47.98%40% 63.4 Months 185.6 Months 51.90%45% 68.6 Months 190.7 Months 56.14%50% 74.3 Months 196.5 Months 60.85%55% 80.6 Months 202.8 Months 65.98%60% 86.8 Months 208.9 Months 71.03%65% 93.3 Months 215.4 Months 76.34%70% 100.2 Months 222.4 Months 82.04%75% 107.7 Months 229.9 Months 88.17%80% 116.6 Months 238.7 Months 95.43%85% 126.6 Months 248.7 Months 103.63%90% 138.5 Months 260.7 Months 113.42%95% 155.4 Months 277.6 Months 127.23%100% 214.5 Months 336.6 Months 175.56%
39920822.847879342.3649755944.6
51175947.9752391087.8
53436537.9354404040.8455369007.1756296401.1763994740.8265225732.2766720886.4368882273.7377260091.28
122.2 Months122.2 Months122.2 Months
Baseline Schedule DurationPROJECT SCHEDULE
(BASELINE)
122.2 Months122.2 Months
122.2 Months
122.2 Months
122.2 Months
122.2 Months
122.2 Months122.2 Months122.2 Months122.2 Months122.2 Months
122.2 Months122.2 Months122.2 Months
122.2 Months122.2 Months122.2 Months122.2 Months
USACE-MVP-0000087977

Estimated Total Project Cost (Price Level) $1,387,078,819Max. Anticipated Annual Amount $136,337,605
Enter Current OMB Escalation Rate 1.80%Enter Current Project Location Escalation Rate 1.88%
Enter Assumed Hotel Rate 5.00%
Date Escalation Delta Amount Hotel Amount Total Schedule ContingencyEnter Current Project Start 29-Jan-10
Enter Baseline Project Completion 2-Apr-20 $11,297,281.96 $11,297,281.96
Project Completion at 0% Confidence 16-Mar-19 $10,134,997.51 ($7,135,256.72) $2,999,740.78
Project Completion at 5% Confidence 25-Mar-22 $13,493,670.85 $13,483,617.21 $26,977,288.05
Project Completion at 10% Confidence 19-Dec-22 $14,311,616.44 $18,504,979.94 $32,816,596.38
Project Completion at 15% Confidence 14-Jun-23 $14,850,432.34 $21,812,767.28 $36,663,199.62
Project Completion at 20% Confidence 30-Nov-23 $15,362,733.91 $24,957,783.31 $40,320,517.23
Project Completion at 25% Confidence 29-Apr-24 $15,821,749.76 $27,775,678.63 $43,597,428.39
Project Completion at 30% Confidence 30-Sep-24 $16,292,152.23 $30,663,476.35 $46,955,628.58
Project Completion at 35% Confidence 17-Feb-25 $16,717,691.72 $33,275,860.55 $49,993,552.27
Project Completion at 40% Confidence 13-Jul-25 $17,160,586.42 $35,994,788.26 $53,155,374.68
Project Completion at 45% Confidence 17-Dec-25 $17,639,038.10 $38,932,000.04 $56,571,038.14
Project Completion at 50% Confidence 11-Jun-26 $18,171,168.13 $42,198,742.85 $60,369,910.98
Project Completion at 55% Confidence 18-Dec-26 $18,751,143.00 $45,759,204.82 $64,510,347.82
Project Completion at 60% Confidence 24-Jun-27 $19,321,190.80 $49,258,724.58 $68,579,915.38
Project Completion at 65% Confidence 7-Jan-28 $19,921,520.81 $52,944,146.64 $72,865,667.46
Project Completion at 70% Confidence 6-Aug-28 $20,565,445.81 $56,897,198.04 $77,462,643.85
Project Completion at 75% Confidence 22-Mar-29 $21,257,805.09 $61,147,587.21 $82,405,392.30
Project Completion at 80% Confidence 17-Dec-29 $22,077,901.33 $66,182,152.71 $88,260,054.04
Project Completion at 85% Confidence 17-Oct-30 $23,004,565.76 $71,870,939.68 $94,875,505.45
Project Completion at 90% Confidence 16-Oct-31 $24,110,401.80 $78,659,659.99 $102,770,061.80
Project Completion at 95% Confidence 12-Mar-33 $25,671,212.80 $88,241,468.59 $113,912,681.38
Project Completion at 100% Confidence 10-Feb-38 $31,131,315.02 $121,761,000.86 $152,892,315.87
Entry Required
Do Not Overwrite
Summary Data -- Do Not Overwrite
MVP - Fargo/Moorhead Feasibility Report (North Dakota Option) - Schedule Risk Analysis Model
USACE-MVP-0000087977

Risk Refer No. Risk Event Low Most Likely HighPPM-1 Project Schedule in Question -12.0 Months 0.0 Months 12.0 Months
$115 $127 $139
Notes:
Likely Low
High
Assumption: Project Schedule in QuestionPercentile Assumption values
0% '-12.0 Months10% '-9.5 Months20% '-7.1 Months30% '-4.8 Months40% '-2.2 Months50% 0.1 Months60% 2.5 Months70% 4.8 Months80% 7.2 Months90% 9.5 Months
100% 12.0 Months
Assumes project schedule is delayed due to complexity of structures and sequencing
MVP - Fargo/Moorhead Feasibility Report (North Dakota Option) - Schedule Risk Analysis Model
Likely assumes no change from the baseline schedule.
This item captures the risk that will cause a variance from the baseline schedule for the project.
Assumes schedule concerns are conservative and actual project schedule can be exceeded
USACE-MVP-0000087977

Risk Refer No. Risk Event Low Most Likely HighPPM-2 Accelerated Design Schedule -6.0 Months 0.0 Months 12.0 Months
-$6 $0 $12
Notes:
Likely Low
High
Assumption: Accelerated Design SchedulePercentile Assumption values
0% '-6.0 Months10% '-2.7 Months20% '-1.3 Months30% '-0.3 Months40% 0.7 Months50% 1.7 Months60% 2.8 Months70% 4.1 Months80% 5.6 Months90% 7.4 Months
100% 11.9 Months
MVP - Fargo/Moorhead Feasibility Report (North Dakota Option) - Schedule Risk Analysis Model
Assumes that uncertainty with the diversion structure design and/or model results causes a 12 month delay in construction
Likely assumes no change from the baseline schedule.
This item captures the risk that will cause a variance from the baseline schedule for the project.
Assumes that best case diversion structure design allow construction to advance by 6 months
USACE-MVP-0000087977

Risk Refer No. Risk Event Low Most Likely High
PPM-3Unplanned Work that Must be Accommodated 0.0 Months 0.0 Months 12.0 Months
$0 $0 $12
Notes:
Likely Low
High
Assumption: Unplanned Work that Must be AccommodatedPercentile Assumption values
0% 0.0 Months10% 1.2 Months20% 2.4 Months30% 3.6 Months40% 4.8 Months50% 6.0 Months60% 7.2 Months70% 8.4 Months80% 9.6 Months90% 10.8 Months100% 12.0 Months
MVP - Fargo/Moorhead Feasibility Report (North Dakota Option) - Schedule Risk Analysis Model
Assumes 12 month delay from baseline due to unplanned work
Likely assumes no change from the baseline schedule.
This item captures the risk that will cause a variance from the baseline schedule for the project.
Assumes no time savings from baseline if there is not any umplanned work
USACE-MVP-0000087977

Risk Refer No. Risk Event Low Most Likely HighPPM-4 Local Agency/Regulator Issues 0.0 Months 0.0 Months 12.0 Months
$0 $0 $12
Notes:
Likely Low
High
Assumption: Local Agency/Regulator IssuesPercentile Assumption values
0% 0.0 Months10% 0.9 Months20% 1.8 Months30% 2.7 Months40% 3.7 Months50% 4.6 Months60% 5.5 Months70% 6.4 Months80% 7.2 Months90% 8.1 Months
100% 9.0 Months
MVP - Fargo/Moorhead Feasibility Report (North Dakota Option) - Schedule Risk Analysis Model
Assumes 12 month delay from baseline due to agency / regulator issues requiring changes to the design flow rates
Likely assumes no change from the baseline schedule.
This item captures the risk that will cause a variance from the baseline schedule for the project.
Assumes no time savings from baseline if the resource agencies accept the project as currently designed and do not require changes to the design flows
USACE-MVP-0000087977

Risk Refer No. Risk Event Low Most Likely HighPPM-8 Scope changes -6.0 Months 0.0 Months 12.0 Months
-$6 $0 $12
Notes:
Likely Low
High
Assumption: Scope changesPercentile Assumption values
0% '-5.9 Months10% '-2.7 Months20% '-1.3 Months30% '-0.3 Months40% 0.7 Months50% 1.6 Months60% 2.7 Months70% 4.0 Months80% 5.5 Months90% 7.5 Months
100% 11.8 Months
Assumes scope changes increase project features, footprint and schedule.
MVP - Fargo/Moorhead Feasibility Report (North Dakota Option) - Schedule Risk Analysis Model
This item captures the risk that will cause a variance from the baseline schedule for the project.Likely assumes no change from the baseline schedule.Assumes scope changes decrease project features and schedule.
USACE-MVP-0000087977

Risk Refer No. Risk Event Low Most Likely HighCA-4 Potential Bid Protests 0.0 Months 0.0 Months 12.0 Months
$0 $0 $12
Notes:
Likely Low
High
Assumption: Potential Bid ProtestsPercentile Assumption values
0% 0.0 Months10% 1.1 Months20% 2.3 Months30% 3.6 Months40% 4.7 Months50% 6.0 Months60% 7.2 Months70% 8.4 Months80% 9.7 Months90% 10.8 Months
100% 12.0 Months
Assumes 12 month delay from baseline due to bid protests delaying work
MVP - Fargo/Moorhead Feasibility Report (North Dakota Option) - Schedule Risk Analysis Model
This item captures the risk that will cause a variance from the baseline schedule for the project.Likely assumes no change from the baseline schedule.Assumes no time savings from baseline if there are not any bid protests
USACE-MVP-0000087977

Risk Refer No. Risk Event Low Most Likely HighTL-1 Uncertainty with Geotechnical Conditions -6.0 Months 0.0 Months 6.0 Months
-$6 $0 $6
Notes:
Likely Low
High
Assumption: Uncertainty with Geotechnical ConditionsPercentile Assumption values
0% '-5.9 Months10% '-2.7 Months20% '-1.3 Months30% '-0.3 Months40% 0.6 Months50% 1.6 Months60% 2.8 Months70% 4.0 Months80% 5.5 Months90% 7.4 Months
100% 11.9 Months
MVP - Fargo/Moorhead Feasibility Report (North Dakota Option) - Schedule Risk Analysis Model
Assumes that uncertainty with geotechnical condtions causes 6 month delay in construction
Likely assumes no change from the baseline schedule.
This item captures the risk that will cause a variance from the baseline schedule for the project.
Assumes that best case geotechnical conditions allow construction to advance by 6 months
USACE-MVP-0000087977

Risk Refer No. Risk Event Low Most Likely HighTL-5 Variation in Estimated Quantities -6.0 Months 0.0 Months 12.0 Months
-$6 $0 $12
Notes:
Likely LowHigh
Assumption: Variation in Estimated QuantitiesPercentile Assumption values
0% '-6.0 Months10% '-4.2 Months20% '-2.4 Months30% '-0.6 Months40% 1.2 Months50% 3.0 Months60% 4.8 Months70% 6.6 Months80% 8.4 Months90% 10.2 Months
100% 12.0 Months
MVP - Fargo/Moorhead Feasibility Report (North Dakota Option) - Schedule Risk Analysis Model
Assumes quantities are less than baseline and schedule is shortenedAssumes quantities are greater than baseline and causes an increase in the schedule
Likely assumes no change from the baseline schedule.
This item captures the risk that will cause a variance from the baseline schedule for the project.
USACE-MVP-0000087977

Risk Refer No. Risk Event Low Most Likely HighTL-11 Diversions -6.0 Months 0.0 Months 12.0 Months
-$6 $0 $12
Notes:
Likely Low
High
Assumption: DiversionsPercentile Assumption values
0% '-5.9 Months10% '-3.4 Months20% '-2.2 Months30% '-1.4 Months40% '-0.6 Months50% 0.0 Months60% 0.6 Months70% 1.4 Months80% 2.2 Months90% 3.3 Months
100% 5.9 Months
Assumes diverson alignment changes increase footprint and quantities making for a longer schedule than the baseline
MVP - Fargo/Moorhead Feasibility Report (North Dakota Option) - Schedule Risk Analysis Model
This item captures the risk that will cause a variance from the baseline schedule for the project.Likely assumes no change from the baseline schedule.Assumes diverson alignment changes decrease footprint and quantities making for a shorter schedule than the baseline
USACE-MVP-0000087977

Risk Refer No. Risk Event Low Most Likely HighTL-12 Hydraulic Structures 0.0 Months 0.0 Months 12.0 Months
$0 $0 $12
Notes:
Likely Low
High
Assumption: Hydraulic StructuresPercentile Assumption values
0% 0.0 Months10% 0.6 Months20% 1.3 Months30% 2.0 Months40% 2.7 Months50% 3.5 Months60% 4.3 Months70% 5.4 Months80% 6.6 Months90% 8.1 Months
100% 11.9 Months
MVP - Fargo/Moorhead Feasibility Report (North Dakota Option) - Schedule Risk Analysis Model
This item captures the risk that will cause a variance from the baseline schedule for the project.Likely assumes no change from the baseline schedule.
Assumes model studies of hydraulic structures shows that cuurent design is not adequate and that structures should be larger. Additional design and construction time may result
Assumes model studies of hydraulic structures shows that cuurent design is adequate or that structures can be smaller. However smaller structures would probably not reduce the project schedule from the baseline since channel excavation would most likely be controlling
USACE-MVP-0000087977
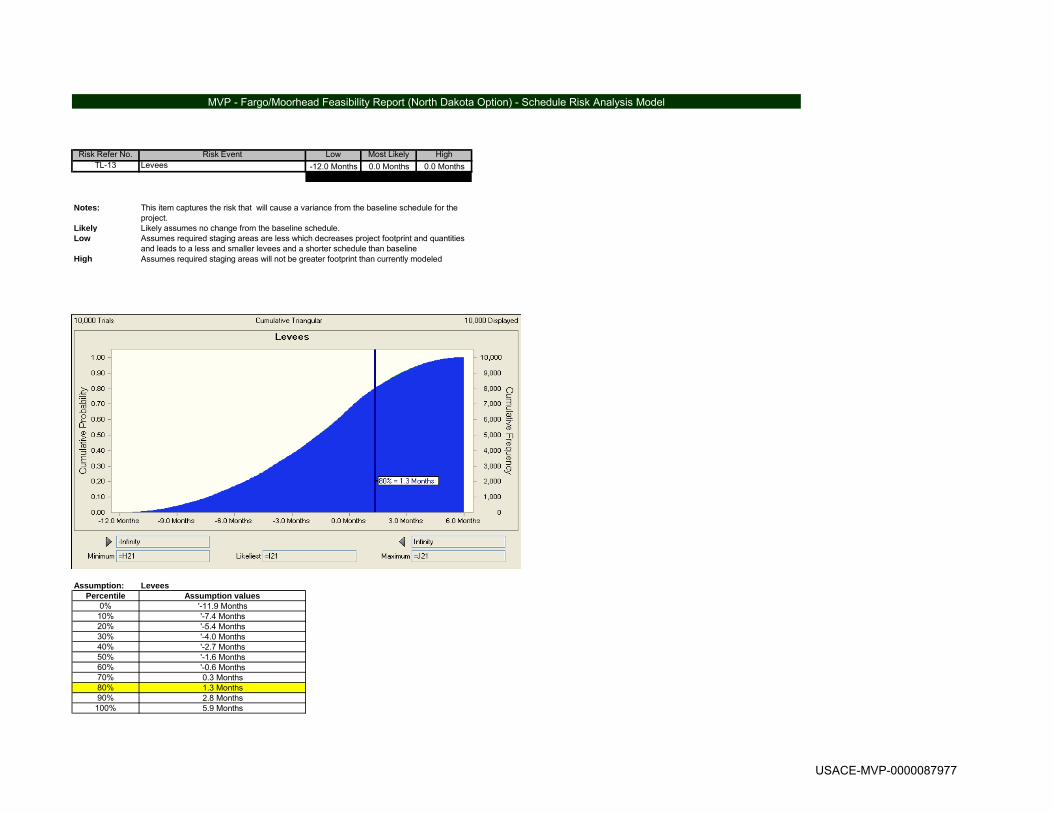
Risk Refer No. Risk Event Low Most Likely HighTL-13 Levees -12.0 Months 0.0 Months 0.0 Months
-$12 $0 $0
Notes:
Likely Low
High
Assumption: LeveesPercentile Assumption values
0% '-11.9 Months10% '-7.4 Months20% '-5.4 Months30% '-4.0 Months40% '-2.7 Months50% '-1.6 Months60% '-0.6 Months70% 0.3 Months80% 1.3 Months90% 2.8 Months
100% 5.9 Months
Assumes required staging areas will not be greater footprint than currently modeled
MVP - Fargo/Moorhead Feasibility Report (North Dakota Option) - Schedule Risk Analysis Model
This item captures the risk that will cause a variance from the baseline schedule for the project.Likely assumes no change from the baseline schedule.Assumes required staging areas are less which decreases project footprint and quantities and leads to a less and smaller levees and a shorter schedule than baseline
USACE-MVP-0000087977

Risk Refer No. Risk Event Low Most Likely High
LD-1Mitigation Needs Identified for Upstream Impacts due to staging 0.0 Months 0.0 Months 12.0 Months
$0 $0 $12
Notes:
Likely Low
High
Assumption: Mitigation Needs Identified for Upstream Impacts due to stagingPercentile Assumption values
0% 0.0 Months10% 0.3 Months20% 0.6 Months30% 1.0 Months40% 1.3 Months50% 1.7 Months60% 2.2 Months70% 2.7 Months80% 3.3 Months90% 4.0 Months100% 6.0 Months
Assumes delay in project to mitigate impacts to areas upstream.
MVP - Fargo/Moorhead Feasibility Report (North Dakota Option) - Schedule Risk Analysis Model
Likely assumes no change from the baseline schedule.
This item captures the risk that will cause a variance from the baseline schedule for the project.
Assumes no change from baseline if additional upstream mitigation is not required from the baseline project plan
USACE-MVP-0000087977

Risk Refer No. Risk Event Low Most Likely HighLD-4 Appraisal -12.0 Months 0.0 Months 12.0 Months
-$12 $0 $12
Notes:
Likely Low
High
Assumption: AppraisalPercentile Assumption values
0% '-11.9 Months10% '-6.7 Months20% '-4.5 Months30% '-2.8 Months40% '-1.3 Months50% 0.0 Months60% 1.2 Months70% 2.7 Months80% 4.4 Months90% 6.5 Months
100% 11.9 Months
Assumes that project schedule can increases if appraisals go take longer
MVP - Fargo/Moorhead Feasibility Report (North Dakota Option) - Schedule Risk Analysis Model
This item captures the risk that will cause a variance from the baseline schedule for the project.Likely assumes no change from the baseline schedule.
Assumes that project schedule can decrease if appraisals go smoothly
USACE-MVP-0000087977

Risk Refer No. Risk Event Low Most Likely HighLD-5 Non-Appraisal 0.0 Months 0.0 Months 6.0 Months
$0 $0 $6
Notes:
Likely Low
High
Assumption: Non-AppraisalPercentile Assumption values
0% 0.0 Months10% 0.3 Months20% 0.6 Months30% 1.0 Months40% 1.3 Months50% 1.8 Months60% 2.2 Months70% 2.7 Months80% 3.3 Months90% 4.1 Months
100% 6.0 Months
Assumes that project schedule can increase if non-appraisal issues delay project
MVP - Fargo/Moorhead Feasibility Report (North Dakota Option) - Schedule Risk Analysis Model
This item captures the risk that will cause a variance from the baseline schedule for the project.Likely assumes no change from the baseline schedule.Assumes that project schedule can will not change if there are not any non-appraisals issues
USACE-MVP-0000087977

Risk Refer No. Risk Event Low Most Likely HighCON-5 Project Sequencing -6.0 Months 0.0 Months 12.0 Months
-$6 $0 $12
Notes:
Likely Low
High
Assumption: Project SequencingPercentile Assumption values
0% '-6.0 Months10% '-4.2 Months20% '-2.3 Months30% '-0.6 Months40% 1.2 Months50% 2.9 Months60% 4.8 Months70% 6.6 Months80% 8.3 Months90% 10.1 Months
100% 12.0 Months
Assumes delay in project schedule if conflicts develop between contractors
MVP - Fargo/Moorhead Feasibility Report (North Dakota Option) - Schedule Risk Analysis Model
This item captures the risk that will cause a variance from the baseline schedule for the project.Likely assumes no change from the baseline schedule.Assumes project sequencing save time for schedule
USACE-MVP-0000087977

Risk Refer No. Risk Event Low Most Likely HighPR-1 Uncertainty with Funding Stream 0.0 Months 0.0 Months 150.0 Months
$0 $0 $150
Notes:
Likely Low
High
Assumption: Uncertainty with Funding StreamPercentile Assumption values
0% 0.0 Months10% 8.1 Months20% 16.2 Months30% 25.1 Months40% 34.6 Months50% 44.7 Months60% 55.4 Months70% 68.2 Months80% 83.7 Months90% 102.9 Months
100% 148.3 Months
Assumes that funding will be at the alternate funding of schedule of approximately $80M/year which may take an additional 12-13 years to complete the project
MVP - Fargo/Moorhead Feasibility Report (North Dakota Option) - Schedule Risk Analysis Model
Likely assumes no change from the baseline schedule.
This item captures the risk that will cause a variance from the baseline schedule for the project.
Assumes that funding will not be higher than the proposed project schedule
USACE-MVP-0000087977

Risk Refer No. Risk Event Low Most Likely High
PR-4Political factors change at state, local, or federal level 0.0 Months 0.0 Months 12.0 Months
$0 $0 $12
Notes:
Likely Low
High
Assumption: Political factors change at state, local, or federal levelPercentile Assumption values
0% 0.0 Months10% 1.2 Months20% 2.3 Months30% 3.5 Months40% 4.8 Months50% 6.1 Months60% 7.3 Months70% 8.5 Months80% 9.7 Months90% 10.8 Months100% 12.0 Months
Assumes the political factors cause an increase from the baseline project schedule
MVP - Fargo/Moorhead Feasibility Report (North Dakota Option) - Schedule Risk Analysis Model
Likely assumes no change from the baseline schedule.
This item captures the risk that will cause a variance from the baseline schedule for the project.
Assumes the baseline schedule when there is not any political oppisition
USACE-MVP-0000087977
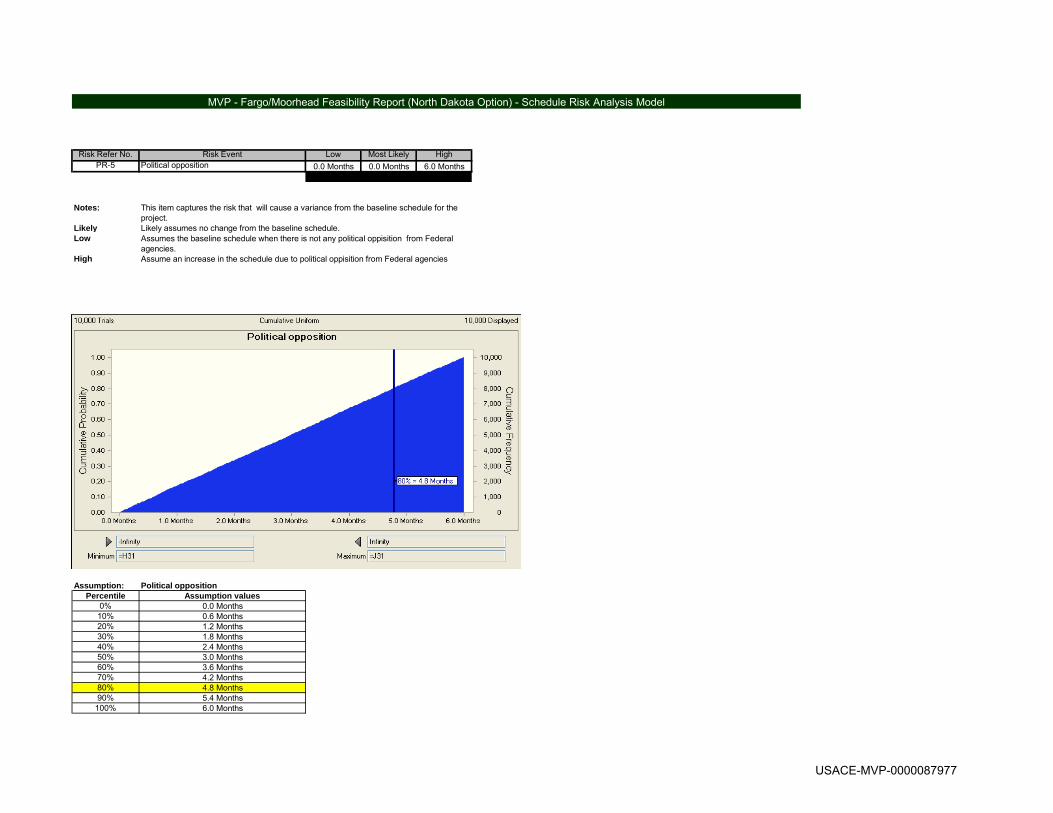
Risk Refer No. Risk Event Low Most Likely HighPR-5 Political opposition 0.0 Months 0.0 Months 6.0 Months
$0 $0 $6
Notes:
Likely Low
High
Assumption: Political oppositionPercentile Assumption values
0% 0.0 Months10% 0.6 Months20% 1.2 Months30% 1.8 Months40% 2.4 Months50% 3.0 Months60% 3.6 Months70% 4.2 Months80% 4.8 Months90% 5.4 Months
100% 6.0 Months
Assume an increase in the schedule due to political oppisition from Federal agencies
MVP - Fargo/Moorhead Feasibility Report (North Dakota Option) - Schedule Risk Analysis Model
Likely assumes no change from the baseline schedule.
This item captures the risk that will cause a variance from the baseline schedule for the project.
Assumes the baseline schedule when there is not any political oppisition from Federal agencies.
USACE-MVP-0000087977

Risk Refer No. Risk Event Low Most Likely High
PR-6Lawsuit Risk from NGOs and Downstream Interests 0.0 Months 0.0 Months 12.0 Months
$0 $0 $12
Notes:
Likely Low
High
Assumption: Lawsuit Risk from NGOs and Downstream InterestsPercentile Assumption values
0% 0.0 Months10% 1.3 Months20% 2.5 Months30% 3.7 Months40% 4.9 Months50% 6.1 Months60% 7.3 Months70% 8.4 Months80% 9.6 Months90% 10.8 Months100% 12.0 Months
Assumes an increase in the schedule due to lawsuits from upstream interest that delay the project
MVP - Fargo/Moorhead Feasibility Report (North Dakota Option) - Schedule Risk Analysis Model
Likely assumes no change from the baseline schedule.
This item captures the risk that will cause a variance from the baseline schedule for the project.
Assumes the baseline schedule when there are not any lawsuits from upstream interest
USACE-MVP-0000087977