appendix j physician specialist services data workbook...providers by health statistic region...
TRANSCRIPT

2019 Access Monitoring Review Plan
Appendix J – Physician Specialist
Services Data Workbook This appendix outlines Physician Specialist Services data, including provider enrollment, member utilization and provider-to-enrollee ratios. Note: The term beneficiary is used in place of member in this workbook. Statewide totals do not equal the combined totals from all seven HSR groupings. This is because there are some providers who do not have a HSR service location recorded in the Department’s enrollment system and are not assigned to one of the seven HSR groupings results. This workbook was exported directly from the CMS-approved Medicaid Access Data Collection Tool. The Department cannot make changes to the presentation of information in this workbook. In some instances, this results in an error being displayed e.g. some provider to enrollee ratios are listed as ‘#Div/0!’ or ‘#Num!’ – this is due to provider inputs fields equaling ‘0’ and therefore ratios cannot be calculated by the workbook. Certain categories are not displayed in the workbook due to issues with the template. The template will not export results where data fields are blank due to data blinding, even though text explanations were included. The following results were impacted by this issue:
• Number of Beneficiaries o Dermatology – HSR Grouping 1,2, 3, 4 & 7 (all fields were blinded as
results were less than 30) o Endocrinology – HSR Grouping 2 & 4 (all fields were blinded as results
were less than 30) o Gastroenterology – HSR Grouping 1 & 2 (all fields were blinded as
results were less than 30) • Number of Services:
o Dermatology – HSR Grouping 1 & 2 o Endocrinology – HSR Grouping 2 o Gastroenterology – HSR Grouping 1 & 2
• Ratio of Providers Accepting New Patients o Cardiology – HSR Grouping 1 – 2018 o Dermatology – HSR Grouping 1 – All Years
• Ratio of Services to Beneficiaries o Allergy/Immunology – HSR Grouping 2 – Individuals with Disabilities
2016/2017/2018 o Dermatology – HSR Grouping 1, 2, 3, 4 & 7– All Populations – All
Years o Dermatology – HSR Grouping 5 – Pediatric 2016/2017/2018, Adults
2018 & Individuals with Disabilities 2016/2017/2018
2019 Access Monitoring Review Plan
o Dermatology – HSR Grouping 6 – Pediatric 2016 & Individuals with Disabilities 2016/2017/2018
o Endocrinology – HSR Grouping 1 – Pediatric 2016/2017/2018, Adults 2017/2018 & Individuals with Disabilities 2016/2017/2018
o Endocrinology – HSR Grouping 2 & 4 – All Populations – All Years o Endocrinology – HSR Grouping 3 – Pediatric 2016/2017/2018 &
Individuals with Disabilities 2016/2018 o Endocrinology – HSR Grouping 5 – Pediatric 2016/2017/2018 &
Individuals with Disabilities 2016/2017/2018 o Endocrinology – HSR Grouping 6 – Pediatric 2016/2017/2018 &
Individuals with Disabilities 2016/2018 o Endocrinology – Statewide – Pediatric – All Years o Gastroenterology – HSR Grouping 1 – Pediatric 2016/2017/2018,
Adults 2016 & Individuals with Disabilities 2016/2017/2018 o Gastroenterology – HSR Grouping 2 – All Populations – All Years o Gastroenterology – HSR Grouping 4 - Pediatric 2016/2017/2018 &
Individuals with Disabilities 2016/2017/2018 o Gastroenterology – HSR Grouping 5 - Pediatric 2016/2017/2018 &
Individuals with Disabilities 2016/2017/2018 o Gastroenterology – HSR Grouping 7 – Pediatric 2016/2018 o Nuclear Medicine – HSR Grouping 1 – Pediatric 2016/2017/2018 o Nuclear Medicine – HSR Grouping 2 – Pediatric 2018 o Nuclear Medicine – HSR Grouping 4 – Pediatric 2016/2017/2018 o Nuclear Medicine – HSR Grouping 7 – Pediatric 2018 o Radiation Oncology – HSR Grouping 1, 2 & 4 - Pediatric
2016/2017/2018 & Individuals with Disabilities 2016/2017/2018 o Radiation Oncology – HSR Grouping 3, 5 & 6 - Pediatric
2016/2017/2018 o Radiation Oncology – HSR Grouping 7- Pediatric 2016/2017/2018,
Adults 2016 & Individuals with Disabilities 2016 o Radiation Oncology – Statewide- Pediatric 2016
Final conclusions on access will be made once stakeholder feedback has been received through the public comment period. Workbooks will be updated with these conclusions.

Template 4: Physician specialist services State: Colorado
Does the state have a fee-for-service population for which the service category applies? YesExplain why the service category does not apply:
Please define what is included in this service type:
Health First Colorado covers specialty services delivered by an enrolled licensed provider, when determined medically necessary, in a clinic, providers’ office, an ambulatory surgery center, outpatient hospital department, or inpatient hospital department. While primary care providers deliver preventative and comprehensive care, specialty services often involve treatment for a specific condition, chronic illness or acute event. The majority of utilizers for specialty care services are referred via their primary care provider.
For the purposes of this Plan, the Department classifies physician specialist services as the following categories of services:•Cardiology•Dermatology•Endocrinology•Gastroenterology•Immunology (Allergy)•Neurology•Ophthalmology•Otolaryngology (ENT)•Pulmonology•Radiation Oncology•Urology•Vascular Service
Unlike the other service categories in the AMRP, Physician Specialist Service providers are measured by billing provider rather than enrolled provider. This is because it is difficult to narrow down specialty care providers by provider types and taxonomies as many specialists are enrolled under the ‘05 Physician’ provider type with no additional information or taxonomy for identification purposes . Instead the Department defined which procedure codes were covered by each specialty and then determined, through billing providers, how many providers were delivering those services to beneficiaries.
Please indicate whether your state has sufficient access under Section 1902(a)30(A):
Please provide an explanation for sufficient or non-sufficient access in your state:
Will the state submit an addendum to this data collection template? No
Number of billing (active) Medicaid-enrolled providers (OCAM)
Service Provider: Allergy/ImmunologyGeographic Region: Health Statistic Region Grouping 1
20172016 160 135 2018 115ValueYear #3ValueYear #2ValueYear #1
MMISData Source: Data Source Other Specify:
Billing providers are those enrolled providers who have submitted a claim for a service delivered in the previous twelve months. Number of Providers by Health Statistic Region Grouping is based on service county location. HSR Grouping 1 - Eastern Plains includes Baca, Bent, Cheyenne, Crowley, Elbert, Huerfano, Kiowa, Kit Carson, Las Animas, Lincoln, Logan, Morgan, Otero, Phillips, Prowers, Sedgwick, Washington, and Yuma counties.
Describe the data sources, methodologies, baselines, assumptions, trends, factors, and thresholds:
Page 1
Template 4: Physician specialist services State: Colorado
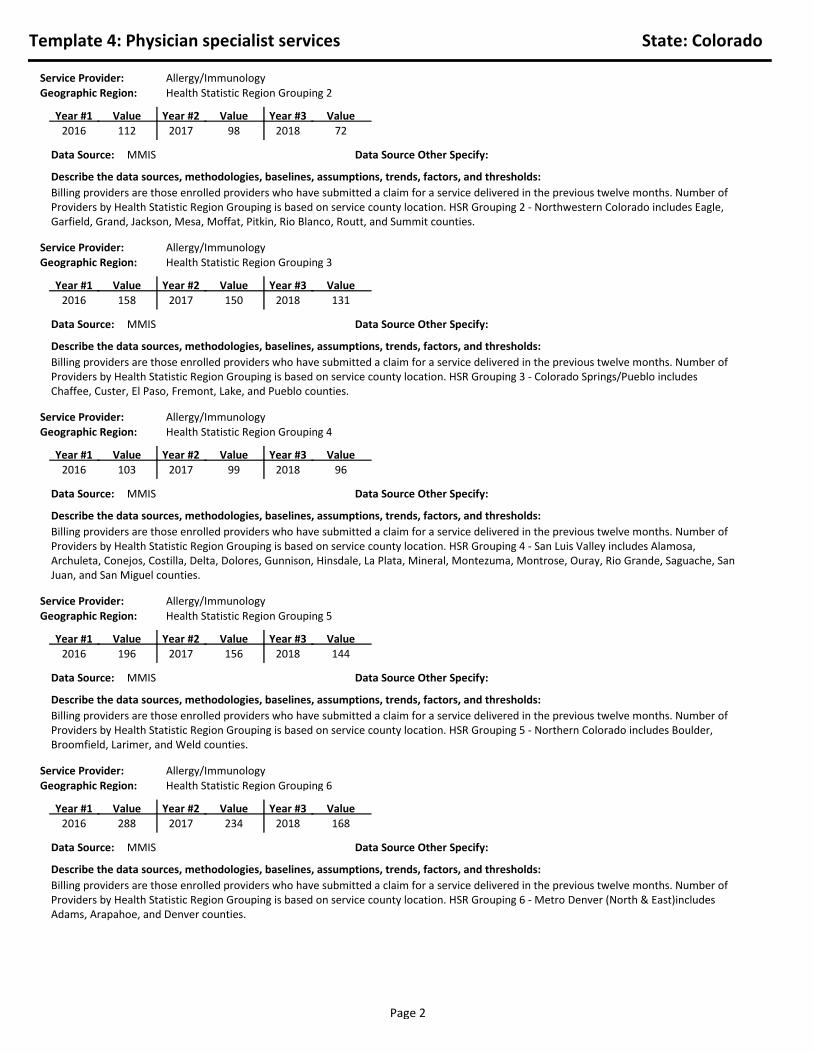
Service Provider: Allergy/ImmunologyGeographic Region: Health Statistic Region Grouping 2
20172016 112 98 2018 72ValueYear #3ValueYear #2ValueYear #1
MMISData Source: Data Source Other Specify:
Billing providers are those enrolled providers who have submitted a claim for a service delivered in the previous twelve months. Number of Providers by Health Statistic Region Grouping is based on service county location. HSR Grouping 2 - Northwestern Colorado includes Eagle, Garfield, Grand, Jackson, Mesa, Moffat, Pitkin, Rio Blanco, Routt, and Summit counties.
Describe the data sources, methodologies, baselines, assumptions, trends, factors, and thresholds:
Service Provider: Allergy/ImmunologyGeographic Region: Health Statistic Region Grouping 3
20172016 158 150 2018 131ValueYear #3ValueYear #2ValueYear #1
MMISData Source: Data Source Other Specify:
Billing providers are those enrolled providers who have submitted a claim for a service delivered in the previous twelve months. Number of Providers by Health Statistic Region Grouping is based on service county location. HSR Grouping 3 - Colorado Springs/Pueblo includes Chaffee, Custer, El Paso, Fremont, Lake, and Pueblo counties.
Describe the data sources, methodologies, baselines, assumptions, trends, factors, and thresholds:
Service Provider: Allergy/ImmunologyGeographic Region: Health Statistic Region Grouping 4
20172016 103 99 2018 96ValueYear #3ValueYear #2ValueYear #1
MMISData Source: Data Source Other Specify:
Billing providers are those enrolled providers who have submitted a claim for a service delivered in the previous twelve months. Number of Providers by Health Statistic Region Grouping is based on service county location. HSR Grouping 4 - San Luis Valley includes Alamosa, Archuleta, Conejos, Costilla, Delta, Dolores, Gunnison, Hinsdale, La Plata, Mineral, Montezuma, Montrose, Ouray, Rio Grande, Saguache, San Juan, and San Miguel counties.
Describe the data sources, methodologies, baselines, assumptions, trends, factors, and thresholds:
Service Provider: Allergy/ImmunologyGeographic Region: Health Statistic Region Grouping 5
20172016 196 156 2018 144ValueYear #3ValueYear #2ValueYear #1
MMISData Source: Data Source Other Specify:
Billing providers are those enrolled providers who have submitted a claim for a service delivered in the previous twelve months. Number of Providers by Health Statistic Region Grouping is based on service county location. HSR Grouping 5 - Northern Colorado includes Boulder, Broomfield, Larimer, and Weld counties.
Describe the data sources, methodologies, baselines, assumptions, trends, factors, and thresholds:
Service Provider: Allergy/ImmunologyGeographic Region: Health Statistic Region Grouping 6
20172016 288 234 2018 168ValueYear #3ValueYear #2ValueYear #1
MMISData Source: Data Source Other Specify:
Billing providers are those enrolled providers who have submitted a claim for a service delivered in the previous twelve months. Number of Providers by Health Statistic Region Grouping is based on service county location. HSR Grouping 6 - Metro Denver (North & East)includes Adams, Arapahoe, and Denver counties.
Describe the data sources, methodologies, baselines, assumptions, trends, factors, and thresholds:
Page 2
Template 4: Physician specialist services State: Colorado
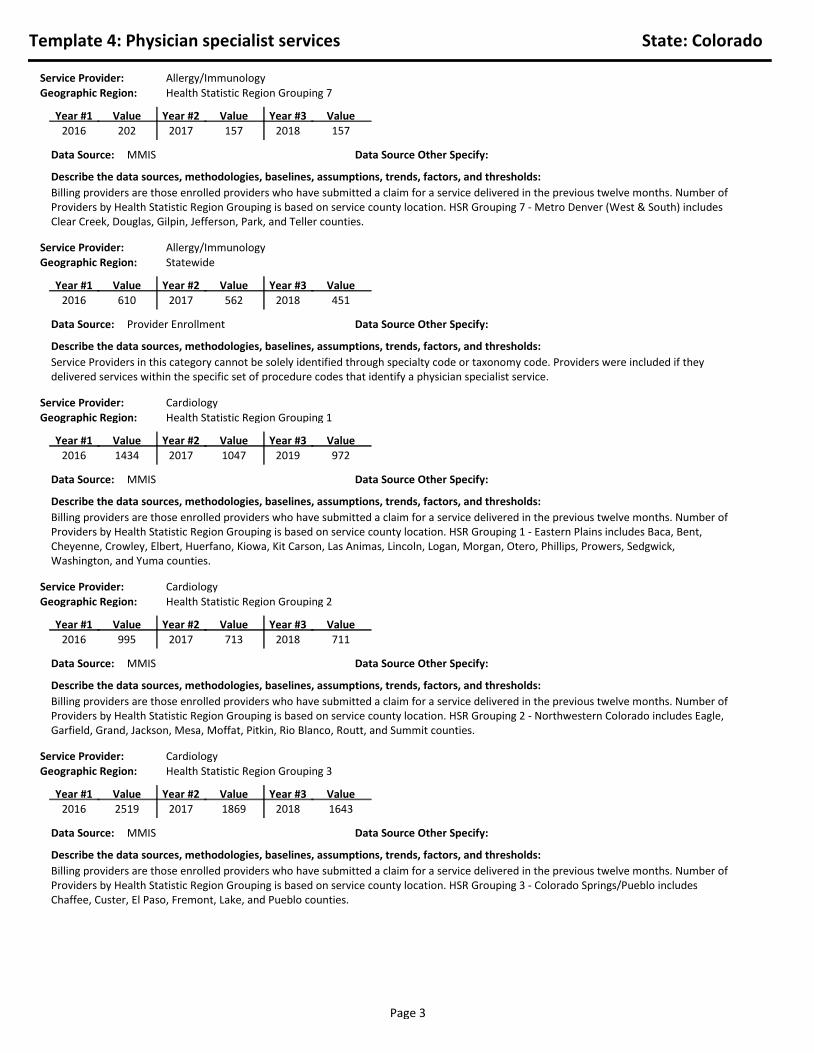
Service Provider: Allergy/ImmunologyGeographic Region: Health Statistic Region Grouping 7
20172016 202 157 2018 157ValueYear #3ValueYear #2ValueYear #1
MMISData Source: Data Source Other Specify:
Billing providers are those enrolled providers who have submitted a claim for a service delivered in the previous twelve months. Number of Providers by Health Statistic Region Grouping is based on service county location. HSR Grouping 7 - Metro Denver (West & South) includes Clear Creek, Douglas, Gilpin, Jefferson, Park, and Teller counties.
Describe the data sources, methodologies, baselines, assumptions, trends, factors, and thresholds:
Service Provider: Allergy/ImmunologyGeographic Region: Statewide
20172016 610 562 2018 451ValueYear #3ValueYear #2ValueYear #1
Provider EnrollmentData Source: Data Source Other Specify:
Service Providers in this category cannot be solely identified through specialty code or taxonomy code. Providers were included if they delivered services within the specific set of procedure codes that identify a physician specialist service.
Describe the data sources, methodologies, baselines, assumptions, trends, factors, and thresholds:
Service Provider: CardiologyGeographic Region: Health Statistic Region Grouping 1
20172016 1434 1047 2019 972ValueYear #3ValueYear #2ValueYear #1
MMISData Source: Data Source Other Specify:
Billing providers are those enrolled providers who have submitted a claim for a service delivered in the previous twelve months. Number of Providers by Health Statistic Region Grouping is based on service county location. HSR Grouping 1 - Eastern Plains includes Baca, Bent, Cheyenne, Crowley, Elbert, Huerfano, Kiowa, Kit Carson, Las Animas, Lincoln, Logan, Morgan, Otero, Phillips, Prowers, Sedgwick, Washington, and Yuma counties.
Describe the data sources, methodologies, baselines, assumptions, trends, factors, and thresholds:
Service Provider: CardiologyGeographic Region: Health Statistic Region Grouping 2
20172016 995 713 2018 711
ValueYear #3ValueYear #2ValueYear #1
MMISData Source: Data Source Other Specify:
Billing providers are those enrolled providers who have submitted a claim for a service delivered in the previous twelve months. Number of Providers by Health Statistic Region Grouping is based on service county location. HSR Grouping 2 - Northwestern Colorado includes Eagle, Garfield, Grand, Jackson, Mesa, Moffat, Pitkin, Rio Blanco, Routt, and Summit counties.
Describe the data sources, methodologies, baselines, assumptions, trends, factors, and thresholds:
Service Provider: CardiologyGeographic Region: Health Statistic Region Grouping 3
20172016 2519 1869 2018 1643ValueYear #3ValueYear #2ValueYear #1
MMISData Source: Data Source Other Specify:
Billing providers are those enrolled providers who have submitted a claim for a service delivered in the previous twelve months. Number of Providers by Health Statistic Region Grouping is based on service county location. HSR Grouping 3 - Colorado Springs/Pueblo includes Chaffee, Custer, El Paso, Fremont, Lake, and Pueblo counties.
Describe the data sources, methodologies, baselines, assumptions, trends, factors, and thresholds:
Page 3

Template 4: Physician specialist services State: Colorado
Service Provider: CardiologyGeographic Region: Health Statistic Region Grouping 4
20172016 1258 952 2018 905ValueYear #3ValueYear #2ValueYear #1
MMISData Source: Data Source Other Specify:
Billing providers are those enrolled providers who have submitted a claim for a service delivered in the previous twelve months. Number of Providers by Health Statistic Region Grouping is based on service county location. HSR Grouping 4 - San Luis Valley includes Alamosa, Archuleta, Conejos, Costilla, Delta, Dolores, Gunnison, Hinsdale, La Plata, Mineral, Montezuma, Montrose, Ouray, Rio Grande, Saguache, San Juan, and San Miguel counties.
Describe the data sources, methodologies, baselines, assumptions, trends, factors, and thresholds:
Service Provider: CardiologyGeographic Region: Health Statistic Region Grouping 5
20172016 2689 1949 2018 1751
ValueYear #3ValueYear #2ValueYear #1
MMISData Source: Data Source Other Specify:
Billing providers are those enrolled providers who have submitted a claim for a service delivered in the previous twelve months. Number of Providers by Health Statistic Region Grouping is based on service county location. HSR Grouping 5 - Northern Colorado includes Boulder, Broomfield, Larimer, and Weld counties.
Describe the data sources, methodologies, baselines, assumptions, trends, factors, and thresholds:
Service Provider: Cardiology
Geographic Region: Health Statistic Region Grouping 6
20172016 4440 3155 2018 2747ValueYear #3ValueYear #2ValueYear #1
MMISData Source: Data Source Other Specify:
Billing providers are those enrolled providers who have submitted a claim for a service delivered in the previous twelve months. Number of Providers by Health Statistic Region Grouping is based on service county location. HSR Grouping 6 - Metro Denver (North & East) includes Adams, Arapahoe, and Denver counties.
Describe the data sources, methodologies, baselines, assumptions, trends, factors, and thresholds:
Service Provider: CardiologyGeographic Region: Health Statistic Region Grouping 7
20172016 2843 2058 2018 1943ValueYear #3ValueYear #2ValueYear #1
MMISData Source: Data Source Other Specify:
Billing providers are those enrolled providers who have submitted a claim for a service delivered in the previous twelve months. Number of Providers by Health Statistic Region Grouping is based on service county location. HSR Grouping 7 - Metro Denver (West & South) includes Clear Creek, Douglas, Gilpin, Jefferson, Park, and Teller counties.
Describe the data sources, methodologies, baselines, assumptions, trends, factors, and thresholds:
Service Provider: CardiologyGeographic Region: Statewide
20172016 8454 5954 2018 4920ValueYear #3ValueYear #2ValueYear #1
MMISData Source: Data Source Other Specify:
Service Providers in this category cannot be solely identified through specialty code or taxonomy code. Providers were included if they delivered services within the specific set of procedure codes that identify a physician specialist service.
Describe the data sources, methodologies, baselines, assumptions, trends, factors, and thresholds:
Page 4

Template 4: Physician specialist services State: Colorado
Service Provider: DermatologyGeographic Region: Health Statistic Region Grouping 1
20172016 6 7 2018 5ValueYear #3ValueYear #2ValueYear #1
MMISData Source: Data Source Other Specify:
Billing providers are those enrolled providers who have submitted a claim for a service delivered in the previous twelve months. Number of Providers by Health Statistic Region Grouping is based on service county location. HSR Grouping 1 - Eastern Plains includes Baca, Bent, Cheyenne, Crowley, Elbert, Huerfano, Kiowa, Kit Carson, Las Animas, Lincoln, Logan, Morgan, Otero, Phillips, Prowers, Sedgwick, Washington, and Yuma counties.
Describe the data sources, methodologies, baselines, assumptions, trends, factors, and thresholds:
Service Provider: DermatologyGeographic Region: Health Statistic Region Grouping 2
20172016 2 4 2018 12
ValueYear #3ValueYear #2ValueYear #1
MMISData Source: Data Source Other Specify:
Billing providers are those enrolled providers who have submitted a claim for a service delivered in the previous twelve months. Number of Providers by Health Statistic Region Grouping is based on service county location. HSR Grouping 2 - Northwestern Colorado includes Eagle, Garfield, Grand, Jackson, Mesa, Moffat, Pitkin, Rio Blanco, Routt, and Summit counties.
Describe the data sources, methodologies, baselines, assumptions, trends, factors, and thresholds:
Service Provider: Dermatology
Geographic Region: Health Statistic Region Grouping 3
20172016 13 15 2018 13ValueYear #3ValueYear #2ValueYear #1
MMISData Source: Data Source Other Specify:
Billing providers are those enrolled providers who have submitted a claim for a service delivered in the previous twelve months. Number of Providers by Health Statistic Region Grouping is based on service county location. HSR Grouping 3 - Colorado Springs/Pueblo includes Chaffee, Custer, El Paso, Fremont, Lake, and Pueblo counties.
Describe the data sources, methodologies, baselines, assumptions, trends, factors, and thresholds:
Service Provider: DermatologyGeographic Region: Health Statistic Region Grouping 4
20172016 6 4 2018 12ValueYear #3ValueYear #2ValueYear #1
MMISData Source: Data Source Other Specify:
Billing providers are those enrolled providers who have submitted a claim for a service delivered in the previous twelve months. Number of Providers by Health Statistic Region Grouping is based on service county location. HSR Grouping 4 - San Luis Valley includes Alamosa, Archuleta, Conejos, Costilla, Delta, Dolores, Gunnison, Hinsdale, La Plata, Mineral, Montezuma, Montrose, Ouray, Rio Grande, Saguache, San Juan, and San Miguel counties.
Describe the data sources, methodologies, baselines, assumptions, trends, factors, and thresholds:
Service Provider: DermatologyGeographic Region: Health Statistic Region Grouping 5
20172016 26 26 2018 21
ValueYear #3ValueYear #2ValueYear #1
MMISData Source: Data Source Other Specify:
Billing providers are those enrolled providers who have submitted a claim for a service delivered in the previous twelve months. Number of Providers by Health Statistic Region Grouping is based on service county location. HSR Grouping 5 - Northern Colorado includes Boulder, Broomfield, Larimer, and Weld counties.
Describe the data sources, methodologies, baselines, assumptions, trends, factors, and thresholds:
Page 5

Template 4: Physician specialist services State: Colorado
Service Provider: DermatologyGeographic Region: Health Statistic Region Grouping 6
20172016 60 48 2018 43ValueYear #3ValueYear #2ValueYear #1
MMISData Source: Data Source Other Specify:
Billing providers are those enrolled providers who have submitted a claim for a service delivered in the previous twelve months. Number of Providers by Health Statistic Region Grouping is based on service county location. HSR Grouping 6 - Metro Denver (North & East) includes Adams, Arapahoe, and Denver counties.
Describe the data sources, methodologies, baselines, assumptions, trends, factors, and thresholds:
Service Provider: DermatologyGeographic Region: Health Statistic Region Grouping 7
20172016 33 26 2018 26ValueYear #3ValueYear #2ValueYear #1
MMISData Source: Data Source Other Specify:
Billing providers are those enrolled providers who have submitted a claim for a service delivered in the previous twelve months. Number of Providers by Health Statistic Region Grouping is based on service county location. HSR Grouping 7 - Metro Denver (West & South) includes Clear Creek, Douglas, Gilpin, Jefferson, Park, and Teller counties.
Describe the data sources, methodologies, baselines, assumptions, trends, factors, and thresholds:
Service Provider: DermatologyGeographic Region: Statewide
20172016 92 82 2018 86ValueYear #3ValueYear #2ValueYear #1
Data Source: Data Source Other Specify:
Service Providers in this category cannot be solely identified through specialty code or taxonomy code. Providers were included if they delivered services within the specific set of procedure codes that identify a physician specialist service.
Describe the data sources, methodologies, baselines, assumptions, trends, factors, and thresholds:
Service Provider: EndocrinologyGeographic Region: Health Statistic Region Grouping 1
20172016 34 34 2018 26ValueYear #3ValueYear #2ValueYear #1
MMISData Source: Data Source Other Specify:
Billing providers are those enrolled providers who have submitted a claim for a service delivered in the previous twelve months. Number of Providers by Health Statistic Region Grouping is based on service county location. HSR Grouping 1 - Eastern Plains includes Baca, Bent, Cheyenne, Crowley, Elbert, Huerfano, Kiowa, Kit Carson, Las Animas, Lincoln, Logan, Morgan, Otero, Phillips, Prowers, Sedgwick, Washington, and Yuma counties.
Describe the data sources, methodologies, baselines, assumptions, trends, factors, and thresholds:
Service Provider: EndocrinologyGeographic Region: Health Statistic Region Grouping 2
20172016 14 14 2018 25ValueYear #3ValueYear #2ValueYear #1
MMISData Source: Data Source Other Specify:
Billing providers are those enrolled providers who have submitted a claim for a service delivered in the previous twelve months. Number of Providers by Health Statistic Region Grouping is based on service county location. HSR Grouping 2 - Northwestern Colorado includes Eagle, Garfield, Grand, Jackson, Mesa, Moffat, Pitkin, Rio Blanco, Routt, and Summit counties.
Describe the data sources, methodologies, baselines, assumptions, trends, factors, and thresholds:
Page 6

Template 4: Physician specialist services State: Colorado
Service Provider: EndocrinologyGeographic Region: Health Statistic Region Grouping 3
20172016 48 65 2018 56ValueYear #3ValueYear #2ValueYear #1
MMISData Source: Data Source Other Specify:
Billing providers are those enrolled providers who have submitted a claim for a service delivered in the previous twelve months. Number of Providers by Health Statistic Region Grouping is based on service county location. HSR Grouping 3 - Colorado Springs/Pueblo includes Chaffee, Custer, El Paso, Fremont, Lake, and Pueblo counties.
Describe the data sources, methodologies, baselines, assumptions, trends, factors, and thresholds:
Service Provider: EndocrinologyGeographic Region: Health Statistic Region Grouping 4
20172016 26 31 2018 32ValueYear #3ValueYear #2ValueYear #1
MMISData Source: Data Source Other Specify:
Billing providers are those enrolled providers who have submitted a claim for a service delivered in the previous twelve months. Number of Providers by Health Statistic Region Grouping is based on service county location. HSR Grouping 4 - San Luis Valley includes Alamosa, Archuleta, Conejos, Costilla, Delta, Dolores, Gunnison, Hinsdale, La Plata, Mineral, Montezuma, Montrose, Ouray, Rio Grande, Saguache, San Juan, and San Miguel counties.
Describe the data sources, methodologies, baselines, assumptions, trends, factors, and thresholds:
Service Provider: Endocrinology
Geographic Region: Health Statistic Region Grouping 5
20172016 69 74 2018 63ValueYear #3ValueYear #2ValueYear #1
MMISData Source: Data Source Other Specify:
Billing providers are those enrolled providers who have submitted a claim for a service delivered in the previous twelve months. Number of Providers by Health Statistic Region Grouping is based on service county location. HSR Grouping 5 - Northern Colorado includes Boulder, Broomfield, Larimer, and Weld counties.
Describe the data sources, methodologies, baselines, assumptions, trends, factors, and thresholds:
Service Provider: EndocrinologyGeographic Region: Health Statistic Region Grouping 6
20172016 95 85 2018 85ValueYear #3ValueYear #2ValueYear #1
MMISData Source: Data Source Other Specify:
Billing providers are those enrolled providers who have submitted a claim for a service delivered in the previous twelve months. Number of Providers by Health Statistic Region Grouping is based on service county location. HSR Grouping 6 - Metro Denver (North & East) includes Adams, Arapahoe, and Denver counties.
Describe the data sources, methodologies, baselines, assumptions, trends, factors, and thresholds:
Service Provider: EndocrinologyGeographic Region: Health Statistic Region Grouping 7
20172016 48 62 2018 46ValueYear #3ValueYear #2ValueYear #1
MMISData Source: Data Source Other Specify:
Billing providers are those enrolled providers who have submitted a claim for a service delivered in the previous twelve months. Number of Providers by Health Statistic Region Grouping is based on service county location. HSR Grouping 7 - Metro Denver (West & South) includes Clear Creek, Douglas, Gilpin, Jefferson, Park, and Teller counties.
Describe the data sources, methodologies, baselines, assumptions, trends, factors, and thresholds:
Page 7

Template 4: Physician specialist services State: Colorado
Service Provider: EndocrinologyGeographic Region: Statewide
20172016 247 245 2018 212ValueYear #3ValueYear #2ValueYear #1
MMISData Source: Data Source Other Specify:
Service Providers in this category cannot be solely identified through specialty code or taxonomy code. Providers were included if they delivered services within the specific set of procedure codes that identify a physician specialist service.
Describe the data sources, methodologies, baselines, assumptions, trends, factors, and thresholds:
Service Provider: GastroenterologyGeographic Region: Health Statistic Region Grouping 1
20172016 33 45 2018 43ValueYear #3ValueYear #2ValueYear #1
MMISData Source: Data Source Other Specify:
Billing providers are those enrolled providers who have submitted a claim for a service delivered in the previous twelve months. Number of Providers by Health Statistic Region Grouping is based on service county location. HSR Grouping 1 - Eastern Plains includes Baca, Bent, Cheyenne, Crowley, Elbert, Huerfano, Kiowa, Kit Carson, Las Animas, Lincoln, Logan, Morgan, Otero, Phillips, Prowers, Sedgwick, Washington, and Yuma counties.
Describe the data sources, methodologies, baselines, assumptions, trends, factors, and thresholds:
Service Provider: GastroenterologyGeographic Region: Health Statistic Region Grouping 2
20172016 23 29 2018 27ValueYear #3ValueYear #2ValueYear #1
MMISData Source: Data Source Other Specify:
Billing providers are those enrolled providers who have submitted a claim for a service delivered in the previous twelve months. Number of Providers by Health Statistic Region Grouping is based on service county location. HSR Grouping 2 - Northwestern Colorado includes Eagle, Garfield, Grand, Jackson, Mesa, Moffat, Pitkin, Rio Blanco, Routt, and Summit counties.
Describe the data sources, methodologies, baselines, assumptions, trends, factors, and thresholds:
Service Provider: GastroenterologyGeographic Region: Health Statistic Region Grouping 3
20172016 80 65 2018 76
ValueYear #3ValueYear #2ValueYear #1
MMISData Source: Data Source Other Specify:
Billing providers are those enrolled providers who have submitted a claim for a service delivered in the previous twelve months. Number of Providers by Health Statistic Region Grouping is based on service county location. HSR Grouping 3 - Colorado Springs/Pueblo includes Chaffee, Custer, El Paso, Fremont, Lake, and Pueblo counties.
Describe the data sources, methodologies, baselines, assumptions, trends, factors, and thresholds:
Service Provider: GastroenterologyGeographic Region: Health Statistic Region Grouping 4
20172016 29 32 2018 45ValueYear #3ValueYear #2ValueYear #1
MMISData Source: Data Source Other Specify:
Billing providers are those enrolled providers who have submitted a claim for a service delivered in the previous twelve months. Number of Providers by Health Statistic Region Grouping is based on service county location. HSR Grouping 4 - San Luis Valley includes Alamosa, Archuleta, Conejos, Costilla, Delta, Dolores, Gunnison, Hinsdale, La Plata, Mineral, Montezuma, Montrose, Ouray, Rio Grande, Saguache, San Juan, and San Miguel counties.
Describe the data sources, methodologies, baselines, assumptions, trends, factors, and thresholds:
Page 8

Template 4: Physician specialist services State: Colorado
Service Provider: GastroenterologyGeographic Region: Health Statistic Region Grouping 5
20172016 91 78 2018 67ValueYear #3ValueYear #2ValueYear #1
MMISData Source: Data Source Other Specify:
Billing providers are those enrolled providers who have submitted a claim for a service delivered in the previous twelve months. Number of Providers by Health Statistic Region Grouping is based on service county location. HSR Grouping 5 - Northern Colorado includes Boulder, Broomfield, Larimer, and Weld counties.
Describe the data sources, methodologies, baselines, assumptions, trends, factors, and thresholds:
Service Provider: GastroenterologyGeographic Region: Health Statistic Region Grouping 6
20172016 151 106 2018 117ValueYear #3ValueYear #2ValueYear #1
MMISData Source: Data Source Other Specify:
Billing providers are those enrolled providers who have submitted a claim for a service delivered in the previous twelve months. Number of Providers by Health Statistic Region Grouping is based on service county location. HSR Grouping 6 - Metro Denver (North & East) includes Adams, Arapahoe, and Denver counties.
Describe the data sources, methodologies, baselines, assumptions, trends, factors, and thresholds:
Service Provider: GastroenterologyGeographic Region: Health Statistic Region Grouping 7
20172016 95 78 2018 84ValueYear #3ValueYear #2ValueYear #1
MMISData Source: Data Source Other Specify:
Billing providers are those enrolled providers who have submitted a claim for a service delivered in the previous twelve months. Number of Providers by Health Statistic Region Grouping is based on service county location. HSR Grouping 7 - Metro Denver (West & South) includes Clear Creek, Douglas, Gilpin, Jefferson, Park, and Teller counties.
Describe the data sources, methodologies, baselines, assumptions, trends, factors, and thresholds:
Service Provider: GastroenterologyGeographic Region: Statewide
20172016 276 213 2018 201
ValueYear #3ValueYear #2ValueYear #1
Provider EnrollmentData Source: Data Source Other Specify:
Service Providers in this category cannot be solely identified through specialty code or taxonomy code. Providers were included if they delivered services within the specific set of procedure codes that identify a physician specialist service.
Describe the data sources, methodologies, baselines, assumptions, trends, factors, and thresholds:
Service Provider: NeurologyGeographic Region: Health Statistic Region Grouping 1
20172016 239 185 2018 189
ValueYear #3ValueYear #2ValueYear #1
MMISData Source: Data Source Other Specify:
Billing providers are those enrolled providers who have submitted a claim for a service delivered in the previous twelve months. Number of Providers by Health Statistic Region Grouping is based on service county location. HSR Grouping 1 - Eastern Plains includes Baca, Bent, Cheyenne, Crowley, Elbert, Huerfano, Kiowa, Kit Carson, Las Animas, Lincoln, Logan, Morgan, Otero, Phillips, Prowers, Sedgwick, Washington, and Yuma counties.
Describe the data sources, methodologies, baselines, assumptions, trends, factors, and thresholds:
Page 9
Template 4: Physician specialist services State: Colorado
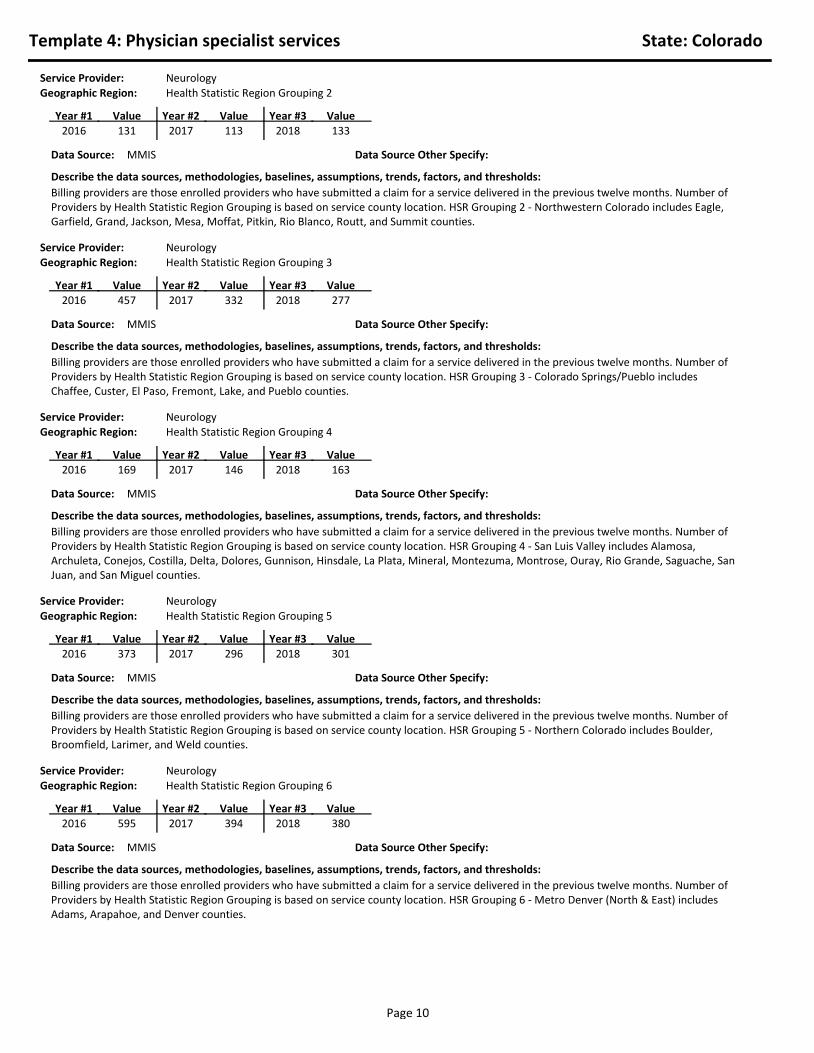
Service Provider: NeurologyGeographic Region: Health Statistic Region Grouping 2
20172016 131 113 2018 133ValueYear #3ValueYear #2ValueYear #1
MMISData Source: Data Source Other Specify:
Billing providers are those enrolled providers who have submitted a claim for a service delivered in the previous twelve months. Number of Providers by Health Statistic Region Grouping is based on service county location. HSR Grouping 2 - Northwestern Colorado includes Eagle, Garfield, Grand, Jackson, Mesa, Moffat, Pitkin, Rio Blanco, Routt, and Summit counties.
Describe the data sources, methodologies, baselines, assumptions, trends, factors, and thresholds:
Service Provider: NeurologyGeographic Region: Health Statistic Region Grouping 3
20172016 457 332 2018 277ValueYear #3ValueYear #2ValueYear #1
MMISData Source: Data Source Other Specify:
Billing providers are those enrolled providers who have submitted a claim for a service delivered in the previous twelve months. Number of Providers by Health Statistic Region Grouping is based on service county location. HSR Grouping 3 - Colorado Springs/Pueblo includes Chaffee, Custer, El Paso, Fremont, Lake, and Pueblo counties.
Describe the data sources, methodologies, baselines, assumptions, trends, factors, and thresholds:
Service Provider: NeurologyGeographic Region: Health Statistic Region Grouping 4
20172016 169 146 2018 163ValueYear #3ValueYear #2ValueYear #1
MMISData Source: Data Source Other Specify:
Billing providers are those enrolled providers who have submitted a claim for a service delivered in the previous twelve months. Number of Providers by Health Statistic Region Grouping is based on service county location. HSR Grouping 4 - San Luis Valley includes Alamosa, Archuleta, Conejos, Costilla, Delta, Dolores, Gunnison, Hinsdale, La Plata, Mineral, Montezuma, Montrose, Ouray, Rio Grande, Saguache, San Juan, and San Miguel counties.
Describe the data sources, methodologies, baselines, assumptions, trends, factors, and thresholds:
Service Provider: NeurologyGeographic Region: Health Statistic Region Grouping 5
20172016 373 296 2018 301ValueYear #3ValueYear #2ValueYear #1
MMISData Source: Data Source Other Specify:
Billing providers are those enrolled providers who have submitted a claim for a service delivered in the previous twelve months. Number of Providers by Health Statistic Region Grouping is based on service county location. HSR Grouping 5 - Northern Colorado includes Boulder, Broomfield, Larimer, and Weld counties.
Describe the data sources, methodologies, baselines, assumptions, trends, factors, and thresholds:
Service Provider: NeurologyGeographic Region: Health Statistic Region Grouping 6
20172016 595 394 2018 380ValueYear #3ValueYear #2ValueYear #1
MMISData Source: Data Source Other Specify:
Billing providers are those enrolled providers who have submitted a claim for a service delivered in the previous twelve months. Number of Providers by Health Statistic Region Grouping is based on service county location. HSR Grouping 6 - Metro Denver (North & East) includes Adams, Arapahoe, and Denver counties.
Describe the data sources, methodologies, baselines, assumptions, trends, factors, and thresholds:
Page 10

Template 4: Physician specialist services State: Colorado
Service Provider: NeurologyGeographic Region: Health Statistic Region Grouping 7
20172016 373 318 2018 298ValueYear #3ValueYear #2ValueYear #1
MMISData Source: Data Source Other Specify:
Billing providers are those enrolled providers who have submitted a claim for a service delivered in the previous twelve months. Number of Providers by Health Statistic Region Grouping is based on service county location. HSR Grouping 7 - Metro Denver (West & South) includes Clear Creek, Douglas, Gilpin, Jefferson, Park, and Teller counties.
Describe the data sources, methodologies, baselines, assumptions, trends, factors, and thresholds:
Service Provider: NeurologyGeographic Region: Statewide
20172016 1302 773 2018 640ValueYear #3ValueYear #2ValueYear #1
Provider EnrollmentData Source: Data Source Other Specify:
Service Providers in this category cannot be solely identified through specialty code or taxonomy code. Providers were included if they delivered services within the specific set of procedure codes that identify a physician specialist service.
Describe the data sources, methodologies, baselines, assumptions, trends, factors, and thresholds:
Service Provider: Nuclear MedicineGeographic Region: Health Statistic Region Grouping 1
20172016 480 246 2018 217ValueYear #3ValueYear #2ValueYear #1
MMISData Source: Data Source Other Specify:
Billing providers are those enrolled providers who have submitted a claim for a service delivered in the previous twelve months. Number of Providers by Health Statistic Region Grouping is based on service county location. HSR Grouping 1 - Eastern Plains includes Baca, Bent, Cheyenne, Crowley, Elbert, Huerfano, Kiowa, Kit Carson, Las Animas, Lincoln, Logan, Morgan, Otero, Phillips, Prowers, Sedgwick, Washington, and Yuma counties.
Describe the data sources, methodologies, baselines, assumptions, trends, factors, and thresholds:
Service Provider: Nuclear MedicineGeographic Region: Health Statistic Region Grouping 2
20172016 260 139 2018 103
ValueYear #3ValueYear #2ValueYear #1
MMISData Source: Data Source Other Specify:
Billing providers are those enrolled providers who have submitted a claim for a service delivered in the previous twelve months. Number of Providers by Health Statistic Region Grouping is based on service county location. HSR Grouping 2 - Northwestern Colorado includes Eagle, Garfield, Grand, Jackson, Mesa, Moffat, Pitkin, Rio Blanco, Routt, and Summit counties.
Describe the data sources, methodologies, baselines, assumptions, trends, factors, and thresholds:
Service Provider: Nuclear MedicineGeographic Region: Health Statistic Region Grouping 3
20172016 814 386 2018 230ValueYear #3ValueYear #2ValueYear #1
MMISData Source: Data Source Other Specify:
Billing providers are those enrolled providers who have submitted a claim for a service delivered in the previous twelve months. Number of Providers by Health Statistic Region Grouping is based on service county location. HSR Grouping 3 - Colorado Springs/Pueblo includes Chaffee, Custer, El Paso, Fremont, Lake, and Pueblo counties.
Describe the data sources, methodologies, baselines, assumptions, trends, factors, and thresholds:
Page 11

Template 4: Physician specialist services State: Colorado
Service Provider: Nuclear MedicineGeographic Region: Health Statistic Region Grouping 4
20172016 386 205 2018 156ValueYear #3ValueYear #2ValueYear #1
MMISData Source: Data Source Other Specify:
Billing providers are those enrolled providers who have submitted a claim for a service delivered in the previous twelve months. Number of Providers by Health Statistic Region Grouping is based on service county location. HSR Grouping 4 - San Luis Valley includes Alamosa, Archuleta, Conejos, Costilla, Delta, Dolores, Gunnison, Hinsdale, La Plata, Mineral, Montezuma, Montrose, Ouray, Rio Grande, Saguache, San Juan, and San Miguel counties.
Describe the data sources, methodologies, baselines, assumptions, trends, factors, and thresholds:
Service Provider: Nuclear MedicineGeographic Region: Health Statistic Region Grouping 5
20172016 874 361 2018 255
ValueYear #3ValueYear #2ValueYear #1
MMISData Source: Data Source Other Specify:
Billing providers are those enrolled providers who have submitted a claim for a service delivered in the previous twelve months. Number of Providers by Health Statistic Region Grouping is based on service county location. HSR Grouping 5 - Northern Colorado includes Boulder, Broomfield, Larimer, and Weld counties.
Describe the data sources, methodologies, baselines, assumptions, trends, factors, and thresholds:
Service Provider: Nuclear Medicine
Geographic Region: Health Statistic Region Grouping 6
20172016 1574 569 2018 352ValueYear #3ValueYear #2ValueYear #1
MMISData Source: Data Source Other Specify:
Billing providers are those enrolled providers who have submitted a claim for a service delivered in the previous twelve months. Number of Providers by Health Statistic Region Grouping is based on service county location. HSR Grouping 6 - Metro Denver (North & East) includes Adams, Arapahoe, and Denver counties.
Describe the data sources, methodologies, baselines, assumptions, trends, factors, and thresholds:
Service Provider: Nuclear MedicineGeographic Region: Health Statistic Region Grouping 7
20172016 812 360 2018 281ValueYear #3ValueYear #2ValueYear #1
MMISData Source: Data Source Other Specify:
Billing providers are those enrolled providers who have submitted a claim for a service delivered in the previous twelve months. Number of Providers by Health Statistic Region Grouping is based on service county location. HSR Grouping 7 - Metro Denver (West & South) includes Clear Creek, Douglas, Gilpin, Jefferson, Park, and Teller counties.
Describe the data sources, methodologies, baselines, assumptions, trends, factors, and thresholds:
Service Provider: Nuclear MedicineGeographic Region: Statewide
20172016 3497 1233 2018 628ValueYear #3ValueYear #2ValueYear #1
Provider EnrollmentData Source: Data Source Other Specify:
Service Providers in this category cannot be solely identified through specialty code or taxonomy code. Providers were included if they delivered services within the specific set of procedure codes that identify a physician specialist service.
Describe the data sources, methodologies, baselines, assumptions, trends, factors, and thresholds:
Page 12

Template 4: Physician specialist services State: Colorado
Service Provider: OphthalmologyGeographic Region: Health Statistic Region Grouping 1
20172016 684 664 2018 673ValueYear #3ValueYear #2ValueYear #1
MMISData Source: Data Source Other Specify:
Billing providers are those enrolled providers who have submitted a claim for a service delivered in the previous twelve months. Number of Providers by Health Statistic Region Grouping is based on service county location. HSR Grouping 1 - Eastern Plains includes Baca, Bent, Cheyenne, Crowley, Elbert, Huerfano, Kiowa, Kit Carson, Las Animas, Lincoln, Logan, Morgan, Otero, Phillips, Prowers, Sedgwick, Washington, and Yuma counties.
Describe the data sources, methodologies, baselines, assumptions, trends, factors, and thresholds:
Service Provider: OphthalmologyGeographic Region: Health Statistic Region Grouping 2
20172016 549 527 2018 480
ValueYear #3ValueYear #2ValueYear #1
MMISData Source: Data Source Other Specify:
Billing providers are those enrolled providers who have submitted a claim for a service delivered in the previous twelve months. Number of Providers by Health Statistic Region Grouping is based on service county location. HSR Grouping 2 - Northwestern Colorado includes Eagle, Garfield, Grand, Jackson, Mesa, Moffat, Pitkin, Rio Blanco, Routt, and Summit counties.
Describe the data sources, methodologies, baselines, assumptions, trends, factors, and thresholds:
Service Provider: Ophthalmology
Geographic Region: Health Statistic Region Grouping 3
20172016 1053 1040 2018 980ValueYear #3ValueYear #2ValueYear #1
MMISData Source: Data Source Other Specify:
Billing providers are those enrolled providers who have submitted a claim for a service delivered in the previous twelve months. Number of Providers by Health Statistic Region Grouping is based on service county location. HSR Grouping 3 - Colorado Springs/Pueblo includes Chaffee, Custer, El Paso, Fremont, Lake, and Pueblo counties.
Describe the data sources, methodologies, baselines, assumptions, trends, factors, and thresholds:
Service Provider: OphthalmologyGeographic Region: Health Statistic Region Grouping 4
20172016 529 507 2018 500ValueYear #3ValueYear #2ValueYear #1
MMISData Source: Data Source Other Specify:
Billing providers are those enrolled providers who have submitted a claim for a service delivered in the previous twelve months. Number of Providers by Health Statistic Region Grouping is based on service county location. HSR Grouping 4 - San Luis Valley includes Alamosa, Archuleta, Conejos, Costilla, Delta, Dolores, Gunnison, Hinsdale, La Plata, Mineral, Montezuma, Montrose, Ouray, Rio Grande, Saguache, San Juan, and San Miguel counties.
Describe the data sources, methodologies, baselines, assumptions, trends, factors, and thresholds:
Service Provider: OphthalmologyGeographic Region: Health Statistic Region Grouping 5
20172016 1256 1147 2018 1047
ValueYear #3ValueYear #2ValueYear #1
MMISData Source: Data Source Other Specify:
Billing providers are those enrolled providers who have submitted a claim for a service delivered in the previous twelve months. Number of Providers by Health Statistic Region Grouping is based on service county location. HSR Grouping 5 - Northern Colorado includes Boulder, Broomfield, Larimer, and Weld counties.
Describe the data sources, methodologies, baselines, assumptions, trends, factors, and thresholds:
Page 13

Template 4: Physician specialist services State: Colorado
Service Provider: OphthalmologyGeographic Region: Health Statistic Region Grouping 6
20172016 1727 1552 2018 1521ValueYear #3ValueYear #2ValueYear #1
MMISData Source: Data Source Other Specify:
Billing providers are those enrolled providers who have submitted a claim for a service delivered in the previous twelve months. Number of Providers by Health Statistic Region Grouping is based on service county location. HSR Grouping 6 - Metro Denver (North & East) includes Adams, Arapahoe, and Denver counties.
Describe the data sources, methodologies, baselines, assumptions, trends, factors, and thresholds:
Service Provider: OphthalmologyGeographic Region: Health Statistic Region Grouping 7
20172016 1220 1264 2018 1278ValueYear #3ValueYear #2ValueYear #1
MMISData Source: Data Source Other Specify:
Billing providers are those enrolled providers who have submitted a claim for a service delivered in the previous twelve months. Number of Providers by Health Statistic Region Grouping is based on service county location. HSR Grouping 7 - Metro Denver (West & South) includes Clear Creek, Douglas, Gilpin, Jefferson, Park, and Teller counties.
Describe the data sources, methodologies, baselines, assumptions, trends, factors, and thresholds:
Service Provider: OphthalmologyGeographic Region: Statewide
20172016 3367 2792 2018 2339ValueYear #3ValueYear #2ValueYear #1
Provider EnrollmentData Source: Data Source Other Specify:
Service Providers in this category cannot be solely identified through specialty code or taxonomy code. Providers were included if they delivered services within the specific set of procedure codes that identify a physician specialist service.
Describe the data sources, methodologies, baselines, assumptions, trends, factors, and thresholds:
Service Provider: OtolaryngologyGeographic Region: Health Statistic Region Grouping 1
20172016 265 192 2018 200ValueYear #3ValueYear #2ValueYear #1
MMISData Source: Data Source Other Specify:
Billing providers are those enrolled providers who have submitted a claim for a service delivered in the previous twelve months. Number of Providers by Health Statistic Region Grouping is based on service county location. HSR Grouping 1 - Eastern Plains includes Baca, Bent, Cheyenne, Crowley, Elbert, Huerfano, Kiowa, Kit Carson, Las Animas, Lincoln, Logan, Morgan, Otero, Phillips, Prowers, Sedgwick, Washington, and Yuma counties.
Describe the data sources, methodologies, baselines, assumptions, trends, factors, and thresholds:
Service Provider: OtolaryngologyGeographic Region: Health Statistic Region Grouping 2
20172016 178 124 2018 147ValueYear #3ValueYear #2ValueYear #1
MMISData Source: Data Source Other Specify:
Billing providers are those enrolled providers who have submitted a claim for a service delivered in the previous twelve months. Number of Providers by Health Statistic Region Grouping is based on service county location. HSR Grouping 2 - Northwestern Colorado includes Eagle, Garfield, Grand, Jackson, Mesa, Moffat, Pitkin, Rio Blanco, Routt, and Summit counties.
Describe the data sources, methodologies, baselines, assumptions, trends, factors, and thresholds:
Page 14

Template 4: Physician specialist services State: Colorado
Service Provider: OtolaryngologyGeographic Region: Health Statistic Region Grouping 3
20172016 518 379 2018 344ValueYear #3ValueYear #2ValueYear #1
MMISData Source: Data Source Other Specify:
Billing providers are those enrolled providers who have submitted a claim for a service delivered in the previous twelve months. Number of Providers by Health Statistic Region Grouping is based on service county location. HSR Grouping 3 - Colorado Springs/Pueblo includes Chaffee, Custer, El Paso, Fremont, Lake, and Pueblo counties.
Describe the data sources, methodologies, baselines, assumptions, trends, factors, and thresholds:
Service Provider: OtolaryngologyGeographic Region: Health Statistic Region Grouping 4
20172016 193 150 2018 150ValueYear #3ValueYear #2ValueYear #1
MMISData Source: Data Source Other Specify:
Billing providers are those enrolled providers who have submitted a claim for a service delivered in the previous twelve months. Number of Providers by Health Statistic Region Grouping is based on service county location. HSR Grouping 4 - San Luis Valley includes Alamosa, Archuleta, Conejos, Costilla, Delta, Dolores, Gunnison, Hinsdale, La Plata, Mineral, Montezuma, Montrose, Ouray, Rio Grande, Saguache, San Juan, and San Miguel counties.
Describe the data sources, methodologies, baselines, assumptions, trends, factors, and thresholds:
Service Provider: Otolaryngology
Geographic Region: Health Statistic Region Grouping 5
20172016 570 401 2018 367ValueYear #3ValueYear #2ValueYear #1
MMISData Source: Data Source Other Specify:
Billing providers are those enrolled providers who have submitted a claim for a service delivered in the previous twelve months. Number of Providers by Health Statistic Region Grouping is based on service county location. HSR Grouping 5 - Northern Colorado includes Boulder, Broomfield, Larimer, and Weld counties.
Describe the data sources, methodologies, baselines, assumptions, trends, factors, and thresholds:
Service Provider: OtolaryngologyGeographic Region: Health Statistic Region Grouping 6
20172016 1053 627 2018 603ValueYear #3ValueYear #2ValueYear #1
MMISData Source: Data Source Other Specify:
Billing providers are those enrolled providers who have submitted a claim for a service delivered in the previous twelve months. Number of Providers by Health Statistic Region Grouping is based on service county location. HSR Grouping 6 - Metro Denver (North & East) includes Adams, Arapahoe, and Denver counties.
Describe the data sources, methodologies, baselines, assumptions, trends, factors, and thresholds:
Service Provider: OtolaryngologyGeographic Region: Health Statistic Region Grouping 7
20172016 591 471 2018 467ValueYear #3ValueYear #2ValueYear #1
MMISData Source: Data Source Other Specify:
Billing providers are those enrolled providers who have submitted a claim for a service delivered in the previous twelve months. Number of Providers by Health Statistic Region Grouping is based on service county location. HSR Grouping 7 - Metro Denver (West & South) includes Clear Creek, Douglas, Gilpin, Jefferson, Park, and Teller counties.
Describe the data sources, methodologies, baselines, assumptions, trends, factors, and thresholds:
Page 15

Template 4: Physician specialist services State: Colorado
Service Provider: OtolaryngologyGeographic Region: Statewide
20172016 2090 1242 2018 1104ValueYear #3ValueYear #2ValueYear #1
Provider EnrollmentData Source: Data Source Other Specify:
Service Providers in this category cannot be solely identified through specialty code or taxonomy code. Providers were included if they delivered services within the specific set of procedure codes that identify a physician specialist service.
Describe the data sources, methodologies, baselines, assumptions, trends, factors, and thresholds:
Service Provider: Pulmonary DiseaseGeographic Region: Health Statistic Region Grouping 1
20172016 796 522 2018 414ValueYear #3ValueYear #2ValueYear #1
MMISData Source: Data Source Other Specify:
Billing providers are those enrolled providers who have submitted a claim for a service delivered in the previous twelve months. Number of Providers by Health Statistic Region Grouping is based on service county location. HSR Grouping 1 - Eastern Plains includes Baca, Bent, Cheyenne, Crowley, Elbert, Huerfano, Kiowa, Kit Carson, Las Animas, Lincoln, Logan, Morgan, Otero, Phillips, Prowers, Sedgwick, Washington, and Yuma counties.
Describe the data sources, methodologies, baselines, assumptions, trends, factors, and thresholds:
Service Provider: Pulmonary DiseaseGeographic Region: Health Statistic Region Grouping 2
20172016 695 478 2018 419ValueYear #3ValueYear #2ValueYear #1
MMISData Source: Data Source Other Specify:
Billing providers are those enrolled providers who have submitted a claim for a service delivered in the previous twelve months. Number of Providers by Health Statistic Region Grouping is based on service county location. HSR Grouping 2 - Northwestern Colorado includes Eagle, Garfield, Grand, Jackson, Mesa, Moffat, Pitkin, Rio Blanco, Routt, and Summit counties.
Describe the data sources, methodologies, baselines, assumptions, trends, factors, and thresholds:
Service Provider: Pulmonary DiseaseGeographic Region: Health Statistic Region Grouping 3
20172016 1701 1222 2018 874
ValueYear #3ValueYear #2ValueYear #1
MMISData Source: Data Source Other Specify:
Billing providers are those enrolled providers who have submitted a claim for a service delivered in the previous twelve months. Number of Providers by Health Statistic Region Grouping is based on service county location. HSR Grouping 3 - Colorado Springs/Pueblo includes Chaffee, Custer, El Paso, Fremont, Lake, and Pueblo counties.
Describe the data sources, methodologies, baselines, assumptions, trends, factors, and thresholds:
Service Provider: Pulmonary DiseaseGeographic Region: Health Statistic Region Grouping 4
20172016 749 476 2018 416ValueYear #3ValueYear #2ValueYear #1
MMISData Source: Data Source Other Specify:
Billing providers are those enrolled providers who have submitted a claim for a service delivered in the previous twelve months. Number of Providers by Health Statistic Region Grouping is based on service county location. HSR Grouping 4 - San Luis Valley includes Alamosa, Archuleta, Conejos, Costilla, Delta, Dolores, Gunnison, Hinsdale, La Plata, Mineral, Montezuma, Montrose, Ouray, Rio Grande, Saguache, San Juan, and San Miguel counties.
Describe the data sources, methodologies, baselines, assumptions, trends, factors, and thresholds:
Page 16

Template 4: Physician specialist services State: Colorado
Service Provider: Pulmonary DiseaseGeographic Region: Health Statistic Region Grouping 5
20172016 1751 1225 2018 999ValueYear #3ValueYear #2ValueYear #1
MMISData Source: Data Source Other Specify:
Billing providers are those enrolled providers who have submitted a claim for a service delivered in the previous twelve months. Number of Providers by Health Statistic Region Grouping is based on service county location. HSR Grouping 5 - Northern Colorado includes Boulder, Broomfield, Larimer, and Weld counties.
Describe the data sources, methodologies, baselines, assumptions, trends, factors, and thresholds:
Service Provider: Pulmonary DiseaseGeographic Region: Health Statistic Region Grouping 6
20172016 3507 2271 2018 1615ValueYear #3ValueYear #2ValueYear #1
MMISData Source: Data Source Other Specify:
Billing providers are those enrolled providers who have submitted a claim for a service delivered in the previous twelve months. Number of Providers by Health Statistic Region Grouping is based on service county location. HSR Grouping 6 - Metro Denver (North & East) includes Adams, Arapahoe, and Denver counties.
Describe the data sources, methodologies, baselines, assumptions, trends, factors, and thresholds:
Service Provider: Pulmonary DiseaseGeographic Region: Health Statistic Region Grouping 7
20172016 2036 1415 2018 1215ValueYear #3ValueYear #2ValueYear #1
MMISData Source: Data Source Other Specify:
Billing providers are those enrolled providers who have submitted a claim for a service delivered in the previous twelve months. Number of Providers by Health Statistic Region Grouping is based on service county location. HSR Grouping 7 - Metro Denver (West & South) includes Clear Creek, Douglas, Gilpin, Jefferson, Park, and Teller counties.
Describe the data sources, methodologies, baselines, assumptions, trends, factors, and thresholds:
Service Provider: Pulmonary DiseaseGeographic Region: Statewide
20172016 6707 4527 2018 3195
ValueYear #3ValueYear #2ValueYear #1
Provider EnrollmentData Source: Data Source Other Specify:
Service Providers in this category cannot be solely identified through specialty code or taxonomy code. Providers were included if they delivered services within the specific set of procedure codes that identify a physician specialist service.
Describe the data sources, methodologies, baselines, assumptions, trends, factors, and thresholds:
Service Provider: Radiation OncologyGeographic Region: Health Statistic Region Grouping 1
20172016 29 51 2018 42
ValueYear #3ValueYear #2ValueYear #1
MMISData Source: Data Source Other Specify:
Billing providers are those enrolled providers who have submitted a claim for a service delivered in the previous twelve months. Number of Providers by Health Statistic Region Grouping is based on service county location. HSR Grouping 1 - Eastern Plains includes Baca, Bent, Cheyenne, Crowley, Elbert, Huerfano, Kiowa, Kit Carson, Las Animas, Lincoln, Logan, Morgan, Otero, Phillips, Prowers, Sedgwick, Washington, and Yuma counties.
Describe the data sources, methodologies, baselines, assumptions, trends, factors, and thresholds:
Page 17

Template 4: Physician specialist services State: Colorado
Service Provider: Radiation OncologyGeographic Region: Health Statistic Region Grouping 2
20172016 32 30 2018 39ValueYear #3ValueYear #2ValueYear #1
MMISData Source: Data Source Other Specify:
Billing providers are those enrolled providers who have submitted a claim for a service delivered in the previous twelve months. Number of Providers by Health Statistic Region Grouping is based on service county location. HSR Grouping 2 - Northwestern Colorado includes Eagle, Garfield, Grand, Jackson, Mesa, Moffat, Pitkin, Rio Blanco, Routt, and Summit counties.
Describe the data sources, methodologies, baselines, assumptions, trends, factors, and thresholds:
Service Provider: Radiation OncologyGeographic Region: Health Statistic Region Grouping 3
20172016 53 48 2018 56ValueYear #3ValueYear #2ValueYear #1
MMISData Source: Data Source Other Specify:
Billing providers are those enrolled providers who have submitted a claim for a service delivered in the previous twelve months. Number of Providers by Health Statistic Region Grouping is based on service county location. HSR Grouping 3 - Colorado Springs/Pueblo includes Chaffee, Custer, El Paso, Fremont, Lake, and Pueblo counties.
Describe the data sources, methodologies, baselines, assumptions, trends, factors, and thresholds:
Service Provider: Radiation OncologyGeographic Region: Health Statistic Region Grouping 4
20172016 31 45 2018 42ValueYear #3ValueYear #2ValueYear #1
MMISData Source: Data Source Other Specify:
Billing providers are those enrolled providers who have submitted a claim for a service delivered in the previous twelve months. Number of Providers by Health Statistic Region Grouping is based on service county location. HSR Grouping 4 - San Luis Valley includes Alamosa, Archuleta, Conejos, Costilla, Delta, Dolores, Gunnison, Hinsdale, La Plata, Mineral, Montezuma, Montrose, Ouray, Rio Grande, Saguache, San Juan, and San Miguel counties.
Describe the data sources, methodologies, baselines, assumptions, trends, factors, and thresholds:
Service Provider: Radiation OncologyGeographic Region: Health Statistic Region Grouping 5
20172016 59 56 2018 59ValueYear #3ValueYear #2ValueYear #1
MMISData Source: Data Source Other Specify:
Billing providers are those enrolled providers who have submitted a claim for a service delivered in the previous twelve months. Number of Providers by Health Statistic Region Grouping is based on service county location. HSR Grouping 5 - Northern Colorado includes Boulder, Broomfield, Larimer, and Weld counties.
Describe the data sources, methodologies, baselines, assumptions, trends, factors, and thresholds:
Service Provider: Radiation OncologyGeographic Region: Health Statistic Region Grouping 6
20172016 109 94 2018 74ValueYear #3ValueYear #2ValueYear #1
MMISData Source: Data Source Other Specify:
Billing providers are those enrolled providers who have submitted a claim for a service delivered in the previous twelve months. Number of Providers by Health Statistic Region Grouping is based on service county location. HSR Grouping 6 - Metro Denver (North & East) includes Adams, Arapahoe, and Denver counties.
Describe the data sources, methodologies, baselines, assumptions, trends, factors, and thresholds:
Page 18
Template 4: Physician specialist services State: Colorado
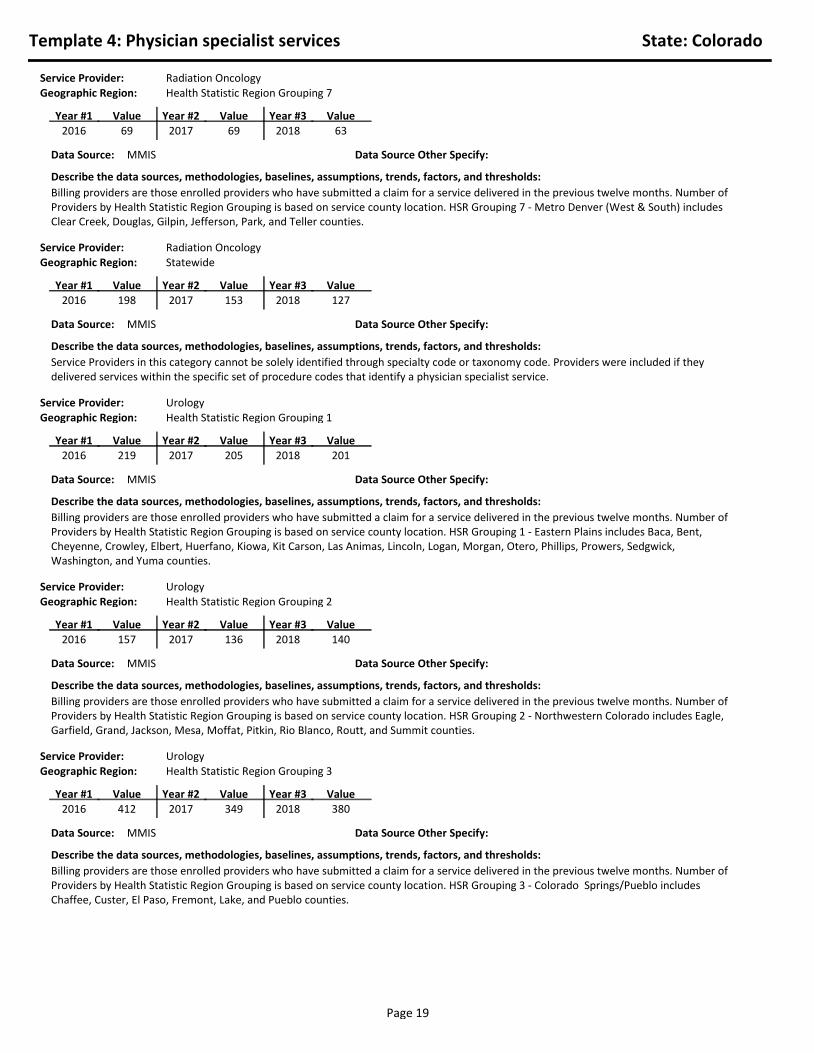
Service Provider: Radiation OncologyGeographic Region: Health Statistic Region Grouping 7
20172016 69 69 2018 63ValueYear #3ValueYear #2ValueYear #1
MMISData Source: Data Source Other Specify:
Billing providers are those enrolled providers who have submitted a claim for a service delivered in the previous twelve months. Number of Providers by Health Statistic Region Grouping is based on service county location. HSR Grouping 7 - Metro Denver (West & South) includes Clear Creek, Douglas, Gilpin, Jefferson, Park, and Teller counties.
Describe the data sources, methodologies, baselines, assumptions, trends, factors, and thresholds:
Service Provider: Radiation OncologyGeographic Region: Statewide
20172016 198 153 2018 127ValueYear #3ValueYear #2ValueYear #1
MMISData Source: Data Source Other Specify:
Service Providers in this category cannot be solely identified through specialty code or taxonomy code. Providers were included if they delivered services within the specific set of procedure codes that identify a physician specialist service.
Describe the data sources, methodologies, baselines, assumptions, trends, factors, and thresholds:
Service Provider: UrologyGeographic Region: Health Statistic Region Grouping 1
20172016 219 205 2018 201ValueYear #3ValueYear #2ValueYear #1
MMISData Source: Data Source Other Specify:
Billing providers are those enrolled providers who have submitted a claim for a service delivered in the previous twelve months. Number of Providers by Health Statistic Region Grouping is based on service county location. HSR Grouping 1 - Eastern Plains includes Baca, Bent, Cheyenne, Crowley, Elbert, Huerfano, Kiowa, Kit Carson, Las Animas, Lincoln, Logan, Morgan, Otero, Phillips, Prowers, Sedgwick, Washington, and Yuma counties.
Describe the data sources, methodologies, baselines, assumptions, trends, factors, and thresholds:
Service Provider: UrologyGeographic Region: Health Statistic Region Grouping 2
20172016 157 136 2018 140
ValueYear #3ValueYear #2ValueYear #1
MMISData Source: Data Source Other Specify:
Billing providers are those enrolled providers who have submitted a claim for a service delivered in the previous twelve months. Number of Providers by Health Statistic Region Grouping is based on service county location. HSR Grouping 2 - Northwestern Colorado includes Eagle, Garfield, Grand, Jackson, Mesa, Moffat, Pitkin, Rio Blanco, Routt, and Summit counties.
Describe the data sources, methodologies, baselines, assumptions, trends, factors, and thresholds:
Service Provider: UrologyGeographic Region: Health Statistic Region Grouping 3
20172016 412 349 2018 380ValueYear #3ValueYear #2ValueYear #1
MMISData Source: Data Source Other Specify:
Billing providers are those enrolled providers who have submitted a claim for a service delivered in the previous twelve months. Number of Providers by Health Statistic Region Grouping is based on service county location. HSR Grouping 3 - Colorado Springs/Pueblo includes Chaffee, Custer, El Paso, Fremont, Lake, and Pueblo counties.
Describe the data sources, methodologies, baselines, assumptions, trends, factors, and thresholds:
Page 19

Template 4: Physician specialist services State: Colorado
Service Provider: UrologyGeographic Region: Health Statistic Region Grouping 4
20172016 253 215 2018 179ValueYear #3ValueYear #2ValueYear #1
MMISData Source: Data Source Other Specify:
Billing providers are those enrolled providers who have submitted a claim for a service delivered in the previous twelve months. Number of Providers by Health Statistic Region Grouping is based on service county location. HSR Grouping 4 - San Luis Valley includes Alamosa, Archuleta, Conejos, Costilla, Delta, Dolores, Gunnison, Hinsdale, La Plata, Mineral, Montezuma, Montrose, Ouray, Rio Grande, Saguache, San Juan, and San Miguel counties.
Describe the data sources, methodologies, baselines, assumptions, trends, factors, and thresholds:
Service Provider: UrologyGeographic Region: Health Statistic Region Grouping 5
20172016 432 397 2018 338
ValueYear #3ValueYear #2ValueYear #1
MMISData Source: Data Source Other Specify:
Billing providers are those enrolled providers who have submitted a claim for a service delivered in the previous twelve months. Number of Providers by Health Statistic Region Grouping is based on service county location. HSR Grouping 5 - Northern Colorado includes Boulder, Broomfield, Larimer, and Weld counties.
Describe the data sources, methodologies, baselines, assumptions, trends, factors, and thresholds:
Service Provider: Urology
Geographic Region: Health Statistic Region Grouping 6
20172016 800 588 2018 606ValueYear #3ValueYear #2ValueYear #1
MMISData Source: Data Source Other Specify:
Billing providers are those enrolled providers who have submitted a claim for a service delivered in the previous twelve months. Number of Providers by Health Statistic Region Grouping is based on service county location. HSR Grouping 6 - Metro Denver (North & East) includes Adams, Arapahoe, and Denver counties.
Describe the data sources, methodologies, baselines, assumptions, trends, factors, and thresholds:
Service Provider: UrologyGeographic Region: Health Statistic Region Grouping 7
20172016 440 419 2018 390ValueYear #3ValueYear #2ValueYear #1
MMISData Source: Data Source Other Specify:
Billing providers are those enrolled providers who have submitted a claim for a service delivered in the previous twelve months. Number of Providers by Health Statistic Region Grouping is based on service county location. HSR Grouping 7 - Metro Denver (West & South) includes Clear Creek, Douglas, Gilpin, Jefferson, Park, and Teller counties.
Describe the data sources, methodologies, baselines, assumptions, trends, factors, and thresholds:
Service Provider: UrologyGeographic Region: Statewide
20172016 1750 1252 2018 1153ValueYear #3ValueYear #2ValueYear #1
MMISData Source: Data Source Other Specify:
Service Providers in this category cannot be solely identified through specialty code or taxonomy code. Providers were included if they delivered services within the specific set of procedure codes that identify a physician specialist service.
Describe the data sources, methodologies, baselines, assumptions, trends, factors, and thresholds:
Page 20

Template 4: Physician specialist services State: Colorado
Service Provider: Vascular SurgeryGeographic Region: Health Statistic Region Grouping 1
20172016 709 471 2018 440ValueYear #3ValueYear #2ValueYear #1
MMISData Source: Data Source Other Specify:
Billing providers are those enrolled providers who have submitted a claim for a service delivered in the previous twelve months. Number of Providers by Health Statistic Region Grouping is based on service county location. HSR Grouping 1 - Eastern Plains includes Baca, Bent, Cheyenne, Crowley, Elbert, Huerfano, Kiowa, Kit Carson, Las Animas, Lincoln, Logan, Morgan, Otero, Phillips, Prowers, Sedgwick, Washington, and Yuma counties.
Describe the data sources, methodologies, baselines, assumptions, trends, factors, and thresholds:
Service Provider: Vascular SurgeryGeographic Region: Health Statistic Region Grouping 2
20172016 365 255 2018 219
ValueYear #3ValueYear #2ValueYear #1
MMISData Source: Data Source Other Specify:
Billing providers are those enrolled providers who have submitted a claim for a service delivered in the previous twelve months. Number of Providers by Health Statistic Region Grouping is based on service county location. HSR Grouping 2 - Northwestern Colorado includes Eagle, Garfield, Grand, Jackson, Mesa, Moffat, Pitkin, Rio Blanco, Routt, and Summit counties.
Describe the data sources, methodologies, baselines, assumptions, trends, factors, and thresholds:
Service Provider: Vascular Surgery
Geographic Region: Health Statistic Region Grouping 3
20172016 1171 686 2018 492ValueYear #3ValueYear #2ValueYear #1
MMISData Source: Data Source Other Specify:
Billing providers are those enrolled providers who have submitted a claim for a service delivered in the previous twelve months. Number of Providers by Health Statistic Region Grouping is based on service county location. HSR Grouping 3 - Colorado Springs/Pueblo includes Chaffee, Custer, El Paso, Fremont, Lake, and Pueblo counties.
Describe the data sources, methodologies, baselines, assumptions, trends, factors, and thresholds:
Service Provider: Vascular SurgeryGeographic Region: Health Statistic Region Grouping 4
20172016 620 387 2018 301ValueYear #3ValueYear #2ValueYear #1
MMISData Source: Data Source Other Specify:
Billing providers are those enrolled providers who have submitted a claim for a service delivered in the previous twelve months. Number of Providers by Health Statistic Region Grouping is based on service county location. HSR Grouping 4 - San Luis Valley includes Alamosa, Archuleta, Conejos, Costilla, Delta, Dolores, Gunnison, Hinsdale, La Plata, Mineral, Montezuma, Montrose, Ouray, Rio Grande, Saguache, San Juan, and San Miguel counties.
Describe the data sources, methodologies, baselines, assumptions, trends, factors, and thresholds:
Service Provider: Vascular SurgeryGeographic Region: Health Statistic Region Grouping 5
20172016 1213 725 2018 543
ValueYear #3ValueYear #2ValueYear #1
MMISData Source: Data Source Other Specify:
Billing providers are those enrolled providers who have submitted a claim for a service delivered in the previous twelve months. Number of Providers by Health Statistic Region Grouping is based on service county location. HSR Grouping 5 - Northern Colorado includes Boulder, Broomfield, Larimer, and Weld counties.
Describe the data sources, methodologies, baselines, assumptions, trends, factors, and thresholds:
Page 21

Template 4: Physician specialist services State: Colorado
Service Provider: Vascular SurgeryGeographic Region: Health Statistic Region Grouping 6
20172016 2245 1246 2018 725ValueYear #3ValueYear #2ValueYear #1
MMISData Source: Data Source Other Specify:
Billing providers are those enrolled providers who have submitted a claim for a service delivered in the previous twelve months. Number of Providers by Health Statistic Region Grouping is based on service county location. HSR Grouping 6 - Metro Denver (North & East) includes Adams, Arapahoe, and Denver counties.
Describe the data sources, methodologies, baselines, assumptions, trends, factors, and thresholds:
Service Provider: Vascular SurgeryGeographic Region: Health Statistic Region Grouping 7
20172016 1194 738 2018 596ValueYear #3ValueYear #2ValueYear #1
MMISData Source: Data Source Other Specify:
Billing providers are those enrolled providers who have submitted a claim for a service delivered in the previous twelve months. Number of Providers by Health Statistic Region Grouping is based on service county location. HSR Grouping 7 - Metro Denver (West & South) includes Clear Creek, Douglas, Gilpin, Jefferson, Park, and Teller counties.
Describe the data sources, methodologies, baselines, assumptions, trends, factors, and thresholds:
Service Provider: Vascular SurgeryGeographic Region: Statewide
20172016 4616 2254 2018 1155ValueYear #3ValueYear #2ValueYear #1
MMISData Source: Data Source Other Specify:
Service Providers in this category cannot be solely identified through specialty code or taxonomy code. Providers were included if they delivered services within the specific set of procedure codes that identify a physician specialist service.
Describe the data sources, methodologies, baselines, assumptions, trends, factors, and thresholds:
Number of providers who billed CPT or modifier codes indicating that they saw new clients for this provider type (CAM)
Service Provider: Allergy/ImmunologyGeographic Region: Health Statistic Region Grouping 1
20172016 63 59 2018 46
ValueYear #3ValueYear #2ValueYear #1
MMISData Source: Data Source Other Specify:
New clients identified through CPT and modifier codes in claims data
Describe the data sources, methodologies, baselines, assumptions, trends, factors, and thresholds:
Service Provider: Allergy/ImmunologyGeographic Region: Health Statistic Region Grouping 2
20172016 63 66 2018 46ValueYear #3ValueYear #2ValueYear #1
MMISData Source: Data Source Other Specify:
New clients identified through CPT and modifier codes in claims data
Describe the data sources, methodologies, baselines, assumptions, trends, factors, and thresholds:
Page 22

Template 4: Physician specialist services State: Colorado
Service Provider: Allergy/ImmunologyGeographic Region: Health Statistic Region Grouping 3
20172016 55 65 2018 53ValueYear #3ValueYear #2ValueYear #1
MMISData Source: Data Source Other Specify:
New clients identified through CPT and modifier codes in claims data
Describe the data sources, methodologies, baselines, assumptions, trends, factors, and thresholds:
Service Provider: Allergy/ImmunologyGeographic Region: Health Statistic Region Grouping 4
20172016 54 56 2018 55ValueYear #3ValueYear #2ValueYear #1
MMISData Source: Data Source Other Specify:
New clients identified through CPT and modifier codes in claims data
Describe the data sources, methodologies, baselines, assumptions, trends, factors, and thresholds:
Service Provider: Allergy/ImmunologyGeographic Region: Health Statistic Region Grouping 5
20172016 76 75 2018 81ValueYear #3ValueYear #2ValueYear #1
MMISData Source: Data Source Other Specify:
New clients identified through CPT and modifier codes in claims data
Describe the data sources, methodologies, baselines, assumptions, trends, factors, and thresholds:
Service Provider: Allergy/ImmunologyGeographic Region: Health Statistic Region Grouping 6
20172016 249 179 2018 126ValueYear #3ValueYear #2ValueYear #1
MMISData Source: Data Source Other Specify:
New clients identified through CPT and modifier codes in claims data
Describe the data sources, methodologies, baselines, assumptions, trends, factors, and thresholds:
Service Provider: Allergy/ImmunologyGeographic Region: Health Statistic Region Grouping 7
20172016 33 45 2018 33ValueYear #3ValueYear #2ValueYear #1
MMISData Source: Data Source Other Specify:
New clients identified through CPT and modifier codes in claims data
Describe the data sources, methodologies, baselines, assumptions, trends, factors, and thresholds:
Service Provider: Allergy/ImmunologyGeographic Region: Statewide
20172016 601 543 2018 447
ValueYear #3ValueYear #2ValueYear #1
MMISData Source: Data Source Other Specify:
New clients identified through CPT and modifier codes in claims data
Describe the data sources, methodologies, baselines, assumptions, trends, factors, and thresholds:
Page 23

Template 4: Physician specialist services State: Colorado
Service Provider: CardiologyGeographic Region: Health Statistic Region Grouping 1
20172016 253 202 2018 149ValueYear #3ValueYear #2ValueYear #1
MMISData Source: Data Source Other Specify:
New clients identified through CPT and modifier codes in claims data
Describe the data sources, methodologies, baselines, assumptions, trends, factors, and thresholds:
Service Provider: CardiologyGeographic Region: Health Statistic Region Grouping 2
20172016 506 346 2018 287ValueYear #3ValueYear #2ValueYear #1
MMISData Source: Data Source Other Specify:
New clients identified through CPT and modifier codes in claims data
Describe the data sources, methodologies, baselines, assumptions, trends, factors, and thresholds:
Service Provider: CardiologyGeographic Region: Health Statistic Region Grouping 3
20172016 1095 879 2018 694ValueYear #3ValueYear #2ValueYear #1
MMISData Source: Data Source Other Specify:
New clients identified through CPT and modifier codes in claims data
Describe the data sources, methodologies, baselines, assumptions, trends, factors, and thresholds:
Service Provider: CardiologyGeographic Region: Health Statistic Region Grouping 4
20172016 439 321 2018 277ValueYear #3ValueYear #2ValueYear #1
MMISData Source: Data Source Other Specify:
New clients identified through CPT and modifier codes in claims data
Describe the data sources, methodologies, baselines, assumptions, trends, factors, and thresholds:
Service Provider: CardiologyGeographic Region: Health Statistic Region Grouping 5
20172016 1357 1020 2018 860ValueYear #3ValueYear #2ValueYear #1
MMISData Source: Data Source Other Specify:
New clients identified through CPT and modifier codes in claims data
Describe the data sources, methodologies, baselines, assumptions, trends, factors, and thresholds:
Service Provider: CardiologyGeographic Region: Health Statistic Region Grouping 6
20172016 3083 2017 2018 1518
ValueYear #3ValueYear #2ValueYear #1
MMISData Source: Data Source Other Specify:
New clients identified through CPT and modifier codes in claims data
Describe the data sources, methodologies, baselines, assumptions, trends, factors, and thresholds:
Page 24
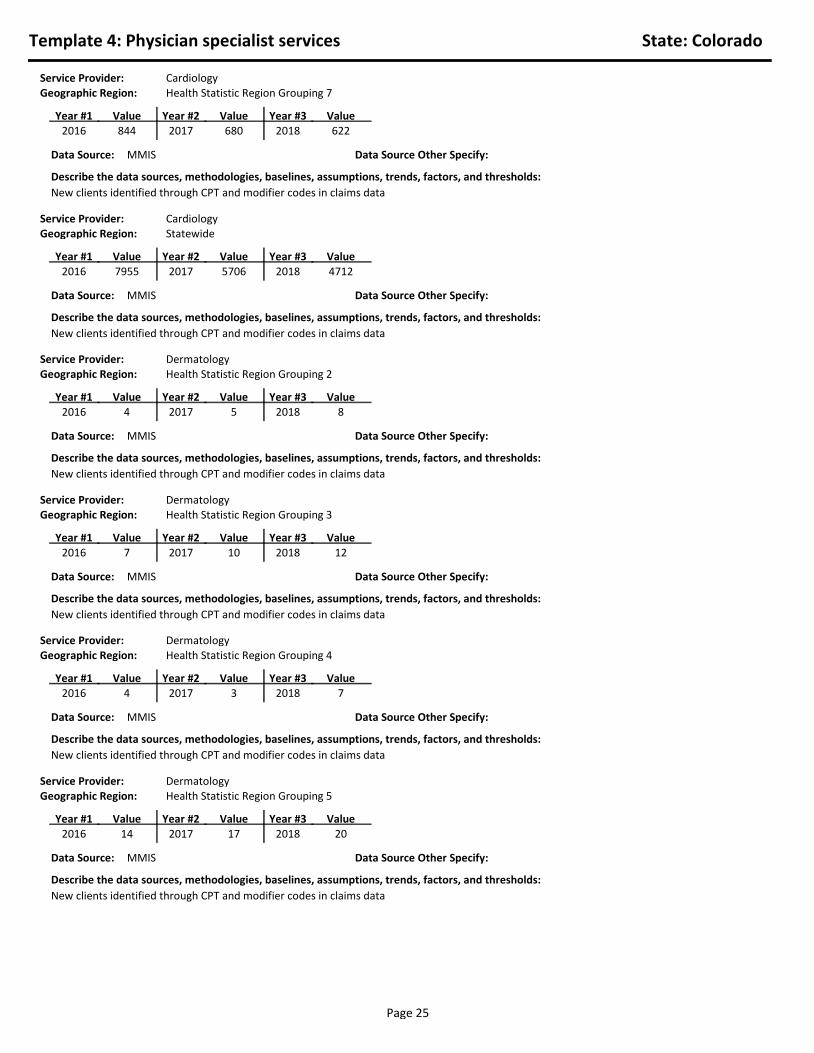
Template 4: Physician specialist services State: Colorado
Service Provider: CardiologyGeographic Region: Health Statistic Region Grouping 7
20172016 844 680 2018 622ValueYear #3ValueYear #2ValueYear #1
MMISData Source: Data Source Other Specify:
New clients identified through CPT and modifier codes in claims data
Describe the data sources, methodologies, baselines, assumptions, trends, factors, and thresholds:
Service Provider: CardiologyGeographic Region: Statewide
20172016 7955 5706 2018 4712ValueYear #3ValueYear #2ValueYear #1
MMISData Source: Data Source Other Specify:
New clients identified through CPT and modifier codes in claims data
Describe the data sources, methodologies, baselines, assumptions, trends, factors, and thresholds:
Service Provider: DermatologyGeographic Region: Health Statistic Region Grouping 2
20172016 4 5 2018 8ValueYear #3ValueYear #2ValueYear #1
MMISData Source: Data Source Other Specify:
New clients identified through CPT and modifier codes in claims data
Describe the data sources, methodologies, baselines, assumptions, trends, factors, and thresholds:
Service Provider: DermatologyGeographic Region: Health Statistic Region Grouping 3
20172016 7 10 2018 12ValueYear #3ValueYear #2ValueYear #1
MMISData Source: Data Source Other Specify:
New clients identified through CPT and modifier codes in claims data
Describe the data sources, methodologies, baselines, assumptions, trends, factors, and thresholds:
Service Provider: DermatologyGeographic Region: Health Statistic Region Grouping 4
20172016 4 3 2018 7ValueYear #3ValueYear #2ValueYear #1
MMISData Source: Data Source Other Specify:
New clients identified through CPT and modifier codes in claims data
Describe the data sources, methodologies, baselines, assumptions, trends, factors, and thresholds:
Service Provider: DermatologyGeographic Region: Health Statistic Region Grouping 5
20172016 14 17 2018 20
ValueYear #3ValueYear #2ValueYear #1
MMISData Source: Data Source Other Specify:
New clients identified through CPT and modifier codes in claims data
Describe the data sources, methodologies, baselines, assumptions, trends, factors, and thresholds:
Page 25

Template 4: Physician specialist services State: Colorado
Service Provider: DermatologyGeographic Region: Health Statistic Region Grouping 6
20172016 60 45 2018 36ValueYear #3ValueYear #2ValueYear #1
MMISData Source: Data Source Other Specify:
New clients identified through CPT and modifier codes in claims data
Describe the data sources, methodologies, baselines, assumptions, trends, factors, and thresholds:
Service Provider: DermatologyGeographic Region: Health Statistic Region Grouping 7
20172016 2 1 2018 2ValueYear #3ValueYear #2ValueYear #1
MMISData Source: Data Source Other Specify:
New clients identified through CPT and modifier codes in claims data
Describe the data sources, methodologies, baselines, assumptions, trends, factors, and thresholds:
Service Provider: DermatologyGeographic Region: Statewide
20172016 96 82 2018 85ValueYear #3ValueYear #2ValueYear #1
MMISData Source: Data Source Other Specify:
New clients identified through CPT and modifier codes in claims data
Describe the data sources, methodologies, baselines, assumptions, trends, factors, and thresholds:
Service Provider: EndocrinologyGeographic Region: Health Statistic Region Grouping 1
20172016 9 1 2018 1ValueYear #3ValueYear #2ValueYear #1
MMISData Source: Data Source Other Specify:
New clients identified through CPT and modifier codes in claims data
Describe the data sources, methodologies, baselines, assumptions, trends, factors, and thresholds:
Service Provider: EndocrinologyGeographic Region: Health Statistic Region Grouping 2
20172016 12 8 2018 17ValueYear #3ValueYear #2ValueYear #1
MMISData Source: Data Source Other Specify:
New clients identified through CPT and modifier codes in claims data
Describe the data sources, methodologies, baselines, assumptions, trends, factors, and thresholds:
Service Provider: EndocrinologyGeographic Region: Health Statistic Region Grouping 3
20172016 20 30 2018 29
ValueYear #3ValueYear #2ValueYear #1
MMISData Source: Data Source Other Specify:
New clients identified through CPT and modifier codes in claims data
Describe the data sources, methodologies, baselines, assumptions, trends, factors, and thresholds:
Page 26

Template 4: Physician specialist services State: Colorado
Service Provider: EndocrinologyGeographic Region: Health Statistic Region Grouping 4
20172016 13 16 2018 13ValueYear #3ValueYear #2ValueYear #1
MMISData Source: Data Source Other Specify:
New clients identified through CPT and modifier codes in claims data
Describe the data sources, methodologies, baselines, assumptions, trends, factors, and thresholds:
Service Provider: EndocrinologyGeographic Region: Health Statistic Region Grouping 5
20172016 63 58 2018 48ValueYear #3ValueYear #2ValueYear #1
MMISData Source: Data Source Other Specify:
New clients identified through CPT and modifier codes in claims data
Describe the data sources, methodologies, baselines, assumptions, trends, factors, and thresholds:
Service Provider: EndocrinologyGeographic Region: Health Statistic Region Grouping 6
20172016 76 66 2018 75ValueYear #3ValueYear #2ValueYear #1
MMISData Source: Data Source Other Specify:
New clients identified through CPT and modifier codes in claims data
Describe the data sources, methodologies, baselines, assumptions, trends, factors, and thresholds:
Service Provider: EndocrinologyGeographic Region: Health Statistic Region Grouping 7
20172016 22 29 2018 17ValueYear #3ValueYear #2ValueYear #1
MMISData Source: Data Source Other Specify:
New clients identified through CPT and modifier codes in claims data
Describe the data sources, methodologies, baselines, assumptions, trends, factors, and thresholds:
Service Provider: EndocrinologyGeographic Region: Statewide
20172016 221 217 2018 203ValueYear #3ValueYear #2ValueYear #1
Data Source: Data Source Other Specify:
New clients identified through CPT and modifier codes in claims data
Describe the data sources, methodologies, baselines, assumptions, trends, factors, and thresholds:
Service Provider: GastroenterologyGeographic Region: Health Statistic Region Grouping 1
20172016 0 2 2018 0ValueYear #3ValueYear #2ValueYear #1
MMISData Source: Data Source Other Specify:
New clients identified through CPT and modifier codes in claims data
Describe the data sources, methodologies, baselines, assumptions, trends, factors, and thresholds:
Page 27

Template 4: Physician specialist services State: Colorado
Service Provider: GastroenterologyGeographic Region: Health Statistic Region Grouping 2
20172016 7 13 2018 14ValueYear #3ValueYear #2ValueYear #1
MMISData Source: Data Source Other Specify:
New clients identified through CPT and modifier codes in claims data
Describe the data sources, methodologies, baselines, assumptions, trends, factors, and thresholds:
Service Provider: GastroenterologyGeographic Region: Health Statistic Region Grouping 3
20172016 26 23 2018 25ValueYear #3ValueYear #2ValueYear #1
MMISData Source: Data Source Other Specify:
New clients identified through CPT and modifier codes in claims data
Describe the data sources, methodologies, baselines, assumptions, trends, factors, and thresholds:
Service Provider: GastroenterologyGeographic Region: Health Statistic Region Grouping 4
20172016 7 7 2018 7ValueYear #3ValueYear #2ValueYear #1
MMISData Source: Data Source Other Specify:
New clients identified through CPT and modifier codes in claims data
Describe the data sources, methodologies, baselines, assumptions, trends, factors, and thresholds:
Service Provider: GastroenterologyGeographic Region: Health Statistic Region Grouping 5
20172016 39 33 2018 26ValueYear #3ValueYear #2ValueYear #1
MMISData Source: Data Source Other Specify:
New clients identified through CPT and modifier codes in claims data
Describe the data sources, methodologies, baselines, assumptions, trends, factors, and thresholds:
Service Provider: GastroenterologyGeographic Region: Health Statistic Region Grouping 6
20172016 158 96 2018 86ValueYear #3ValueYear #2ValueYear #1
MMISData Source: Data Source Other Specify:
New clients identified through CPT and modifier codes in claims data
Describe the data sources, methodologies, baselines, assumptions, trends, factors, and thresholds:
Service Provider: GastroenterologyGeographic Region: Health Statistic Region Grouping 7
20172016 34 34 2018 37
ValueYear #3ValueYear #2ValueYear #1
MMISData Source: Data Source Other Specify:
New clients identified through CPT and modifier codes in claims data
Describe the data sources, methodologies, baselines, assumptions, trends, factors, and thresholds:
Page 28

Template 4: Physician specialist services State: Colorado
Service Provider: GastroenterologyGeographic Region: Statewide
20172016 276 210 2018 198ValueYear #3ValueYear #2ValueYear #1
Data Source: Data Source Other Specify:
New clients identified through CPT and modifier codes in claims data
Describe the data sources, methodologies, baselines, assumptions, trends, factors, and thresholds:
Service Provider: NeurologyGeographic Region: Health Statistic Region Grouping 1
20172016 35 14 2018 11ValueYear #3ValueYear #2ValueYear #1
MMISData Source: Data Source Other Specify:
New clients identified through CPT and modifier codes in claims data
Describe the data sources, methodologies, baselines, assumptions, trends, factors, and thresholds:
Service Provider: NeurologyGeographic Region: Health Statistic Region Grouping 2
20172016 51 26 2018 25ValueYear #3ValueYear #2ValueYear #1
MMISData Source: Data Source Other Specify:
New clients identified through CPT and modifier codes in claims data
Describe the data sources, methodologies, baselines, assumptions, trends, factors, and thresholds:
Service Provider: NeurologyGeographic Region: Health Statistic Region Grouping 3
20172016 239 140 2018 81ValueYear #3ValueYear #2ValueYear #1
MMISData Source: Data Source Other Specify:
New clients identified through CPT and modifier codes in claims data
Describe the data sources, methodologies, baselines, assumptions, trends, factors, and thresholds:
Service Provider: NeurologyGeographic Region: Health Statistic Region Grouping 4
20172016 48 32 2018 24ValueYear #3ValueYear #2ValueYear #1
MMISData Source: Data Source Other Specify:
New clients identified through CPT and modifier codes in claims data
Describe the data sources, methodologies, baselines, assumptions, trends, factors, and thresholds:
Service Provider: NeurologyGeographic Region: Health Statistic Region Grouping 5
20172016 191 110 2018 92ValueYear #3ValueYear #2ValueYear #1
MMISData Source: Data Source Other Specify:
New clients identified through CPT and modifier codes in claims data
Describe the data sources, methodologies, baselines, assumptions, trends, factors, and thresholds:
Page 29

Template 4: Physician specialist services State: Colorado
Service Provider: NeurologyGeographic Region: Health Statistic Region Grouping 6
20172016 545 309 2018 259ValueYear #3ValueYear #2ValueYear #1
MMISData Source: Data Source Other Specify:
New clients identified through CPT and modifier codes in claims data
Describe the data sources, methodologies, baselines, assumptions, trends, factors, and thresholds:
Service Provider: NeurologyGeographic Region: Health Statistic Region Grouping 7
20172016 101 57 2018 53ValueYear #3ValueYear #2ValueYear #1
MMISData Source: Data Source Other Specify:
New clients identified through CPT and modifier codes in claims data
Describe the data sources, methodologies, baselines, assumptions, trends, factors, and thresholds:
Service Provider: NeurologyGeographic Region: Statewide
20172016 1233 713 2018 578ValueYear #3ValueYear #2ValueYear #1
MMISData Source: Data Source Other Specify:
New clients identified through CPT and modifier codes in claims data
Describe the data sources, methodologies, baselines, assumptions, trends, factors, and thresholds:
Service Provider: Nuclear MedicineGeographic Region: Health Statistic Region Grouping 1
20172016 105 36 2018 14ValueYear #3ValueYear #2ValueYear #1
MMISData Source: Data Source Other Specify:
Describe the data sources, methodologies, baselines, assumptions, trends, factors, and thresholds:
Service Provider: Nuclear MedicineGeographic Region: Health Statistic Region Grouping 2
20172016 150 44 2018 21ValueYear #3ValueYear #2ValueYear #1
MMISData Source: Data Source Other Specify:
Number of provider here is based on the billing providers in claims level.
Describe the data sources, methodologies, baselines, assumptions, trends, factors, and thresholds:
Service Provider: Nuclear MedicineGeographic Region: Health Statistic Region Grouping 3
20172016 478 169 2018 64ValueYear #3ValueYear #2ValueYear #1
MMISData Source: Data Source Other Specify:
Describe the data sources, methodologies, baselines, assumptions, trends, factors, and thresholds:
Page 30
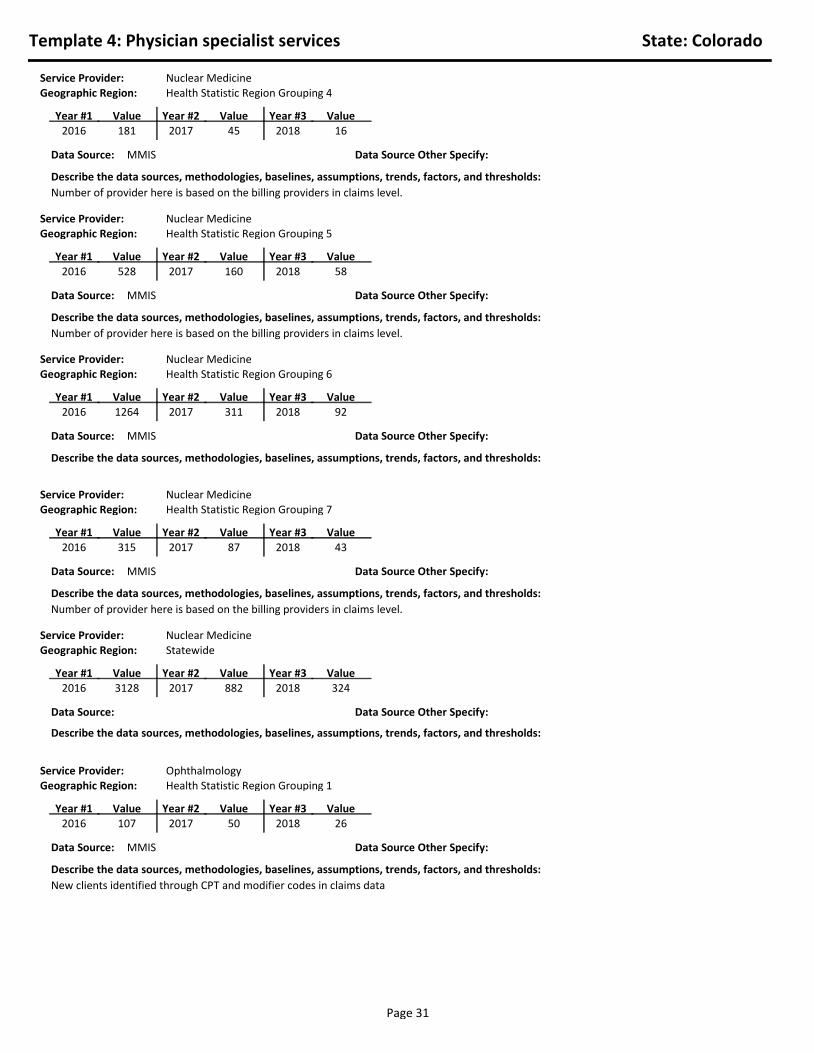
Template 4: Physician specialist services State: Colorado
Service Provider: Nuclear MedicineGeographic Region: Health Statistic Region Grouping 4
20172016 181 45 2018 16ValueYear #3ValueYear #2ValueYear #1
MMISData Source: Data Source Other Specify:
Number of provider here is based on the billing providers in claims level.
Describe the data sources, methodologies, baselines, assumptions, trends, factors, and thresholds:
Service Provider: Nuclear MedicineGeographic Region: Health Statistic Region Grouping 5
20172016 528 160 2018 58ValueYear #3ValueYear #2ValueYear #1
MMISData Source: Data Source Other Specify:
Number of provider here is based on the billing providers in claims level.
Describe the data sources, methodologies, baselines, assumptions, trends, factors, and thresholds:
Service Provider: Nuclear MedicineGeographic Region: Health Statistic Region Grouping 6
20172016 1264 311 2018 92ValueYear #3ValueYear #2ValueYear #1
MMISData Source: Data Source Other Specify:
Describe the data sources, methodologies, baselines, assumptions, trends, factors, and thresholds:
Service Provider: Nuclear MedicineGeographic Region: Health Statistic Region Grouping 7
20172016 315 87 2018 43ValueYear #3ValueYear #2ValueYear #1
MMISData Source: Data Source Other Specify:
Number of provider here is based on the billing providers in claims level.
Describe the data sources, methodologies, baselines, assumptions, trends, factors, and thresholds:
Service Provider: Nuclear MedicineGeographic Region: Statewide
20172016 3128 882 2018 324ValueYear #3ValueYear #2ValueYear #1
Data Source: Data Source Other Specify:
Describe the data sources, methodologies, baselines, assumptions, trends, factors, and thresholds:
Service Provider: OphthalmologyGeographic Region: Health Statistic Region Grouping 1
20172016 107 50 2018 26ValueYear #3ValueYear #2ValueYear #1
MMISData Source: Data Source Other Specify:
New clients identified through CPT and modifier codes in claims data
Describe the data sources, methodologies, baselines, assumptions, trends, factors, and thresholds:
Page 31

Template 4: Physician specialist services State: Colorado
Service Provider: OphthalmologyGeographic Region: Health Statistic Region Grouping 2
20172016 191 142 2018 67ValueYear #3ValueYear #2ValueYear #1
MMISData Source: Data Source Other Specify:
New clients identified through CPT and modifier codes in claims data
Describe the data sources, methodologies, baselines, assumptions, trends, factors, and thresholds:
Service Provider: OphthalmologyGeographic Region: Health Statistic Region Grouping 3
20172016 352 243 2018 182ValueYear #3ValueYear #2ValueYear #1
MMISData Source: Data Source Other Specify:
New clients identified through CPT and modifier codes in claims data
Describe the data sources, methodologies, baselines, assumptions, trends, factors, and thresholds:
Service Provider: OphthalmologyGeographic Region: Health Statistic Region Grouping 4
20172016 140 89 2018 54ValueYear #3ValueYear #2ValueYear #1
MMISData Source: Data Source Other Specify:
New clients identified through CPT and modifier codes in claims data
Describe the data sources, methodologies, baselines, assumptions, trends, factors, and thresholds:
Service Provider: OphthalmologyGeographic Region: Health Statistic Region Grouping 5
20172016 493 327 2018 219ValueYear #3ValueYear #2ValueYear #1
MMISData Source: Data Source Other Specify:
New clients identified through CPT and modifier codes in claims data
Describe the data sources, methodologies, baselines, assumptions, trends, factors, and thresholds:
Service Provider: OphthalmologyGeographic Region: Health Statistic Region Grouping 6
20172016 873 513 2018 388ValueYear #3ValueYear #2ValueYear #1
MMISData Source: Data Source Other Specify:
New clients identified through CPT and modifier codes in claims data
Describe the data sources, methodologies, baselines, assumptions, trends, factors, and thresholds:
Service Provider: OphthalmologyGeographic Region: Health Statistic Region Grouping 7
20172016 224 181 2018 161
ValueYear #3ValueYear #2ValueYear #1
MMISData Source: Data Source Other Specify:
New clients identified through CPT and modifier codes in claims data
Describe the data sources, methodologies, baselines, assumptions, trends, factors, and thresholds:
Page 32

Template 4: Physician specialist services State: Colorado
Service Provider: OphthalmologyGeographic Region: Statewide
20172016 2427 1575 2018 1121ValueYear #3ValueYear #2ValueYear #1
MMISData Source: Data Source Other Specify:
New clients identified through CPT and modifier codes in claims data
Describe the data sources, methodologies, baselines, assumptions, trends, factors, and thresholds:
Service Provider: OtolaryngologyGeographic Region: Health Statistic Region Grouping 1
20172016 56 19 2018 13ValueYear #3ValueYear #2ValueYear #1
MMISData Source: Data Source Other Specify:
New clients identified through CPT and modifier codes in claims data
Describe the data sources, methodologies, baselines, assumptions, trends, factors, and thresholds:
Service Provider: OtolaryngologyGeographic Region: Health Statistic Region Grouping 2
20172016 86 47 2018 49ValueYear #3ValueYear #2ValueYear #1
MMISData Source: Data Source Other Specify:
New clients identified through CPT and modifier codes in claims data
Describe the data sources, methodologies, baselines, assumptions, trends, factors, and thresholds:
Service Provider: OtolaryngologyGeographic Region: Health Statistic Region Grouping 3
20172016 247 104 2018 78ValueYear #3ValueYear #2ValueYear #1
MMISData Source: Data Source Other Specify:
New clients identified through CPT and modifier codes in claims data
Describe the data sources, methodologies, baselines, assumptions, trends, factors, and thresholds:
Service Provider: OtolaryngologyGeographic Region: Health Statistic Region Grouping 4
20172016 98 44 2018 44ValueYear #3ValueYear #2ValueYear #1
MMISData Source: Data Source Other Specify:
New clients identified through CPT and modifier codes in claims data
Describe the data sources, methodologies, baselines, assumptions, trends, factors, and thresholds:
Service Provider: OtolaryngologyGeographic Region: Health Statistic Region Grouping 5
20172016 281 117 2018 99
ValueYear #3ValueYear #2ValueYear #1
MMISData Source: Data Source Other Specify:
New clients identified through CPT and modifier codes in claims data
Describe the data sources, methodologies, baselines, assumptions, trends, factors, and thresholds:
Page 33

Template 4: Physician specialist services State: Colorado
Service Provider: OtolaryngologyGeographic Region: Health Statistic Region Grouping 6
20172016 757 266 2018 202ValueYear #3ValueYear #2ValueYear #1
MMISData Source: Data Source Other Specify:
New clients identified through CPT and modifier codes in claims data
Describe the data sources, methodologies, baselines, assumptions, trends, factors, and thresholds:
Service Provider: OtolaryngologyGeographic Region: Health Statistic Region Grouping 7
20172016 186 120 2018 106ValueYear #3ValueYear #2ValueYear #1
MMISData Source: Data Source Other Specify:
New clients identified through CPT and modifier codes in claims data
Describe the data sources, methodologies, baselines, assumptions, trends, factors, and thresholds:
Service Provider: OtolaryngologyGeographic Region: Statewide
20172016 1798 742 2018 611ValueYear #3ValueYear #2ValueYear #1
MMISData Source: Data Source Other Specify:
New clients identified through CPT and modifier codes in claims data
Describe the data sources, methodologies, baselines, assumptions, trends, factors, and thresholds:
Service Provider: Pulmonary DiseaseGeographic Region: Health Statistic Region Grouping 1
20172016 187 122 2018 79ValueYear #3ValueYear #2ValueYear #1
MMISData Source: Data Source Other Specify:
New clients identified through CPT and modifier codes in claims data
Describe the data sources, methodologies, baselines, assumptions, trends, factors, and thresholds:
Service Provider: Pulmonary DiseaseGeographic Region: Health Statistic Region Grouping 2
20172016 428 290 2018 235ValueYear #3ValueYear #2ValueYear #1
MMISData Source: Data Source Other Specify:
New clients identified through CPT and modifier codes in claims data
Describe the data sources, methodologies, baselines, assumptions, trends, factors, and thresholds:
Service Provider: Pulmonary DiseaseGeographic Region: Health Statistic Region Grouping 3
20172016 905 719 2018 456
ValueYear #3ValueYear #2ValueYear #1
MMISData Source: Data Source Other Specify:
New clients identified through CPT and modifier codes in claims data
Describe the data sources, methodologies, baselines, assumptions, trends, factors, and thresholds:
Page 34

Template 4: Physician specialist services State: Colorado
Service Provider: Pulmonary DiseaseGeographic Region: Health Statistic Region Grouping 4
20172016 356 235 2018 195ValueYear #3ValueYear #2ValueYear #1
MMISData Source: Data Source Other Specify:
New clients identified through CPT and modifier codes in claims data
Describe the data sources, methodologies, baselines, assumptions, trends, factors, and thresholds:
Service Provider: Pulmonary DiseaseGeographic Region: Health Statistic Region Grouping 5
20172016 982 757 2018 590ValueYear #3ValueYear #2ValueYear #1
MMISData Source: Data Source Other Specify:
New clients identified through CPT and modifier codes in claims data
Describe the data sources, methodologies, baselines, assumptions, trends, factors, and thresholds:
Service Provider: Pulmonary DiseaseGeographic Region: Health Statistic Region Grouping 6
20172016 2761 1689 2018 1026ValueYear #3ValueYear #2ValueYear #1
MMISData Source: Data Source Other Specify:
New clients identified through CPT and modifier codes in claims data
Describe the data sources, methodologies, baselines, assumptions, trends, factors, and thresholds:
Service Provider: Pulmonary DiseaseGeographic Region: Health Statistic Region Grouping 7
20172016 738 581 2018 464ValueYear #3ValueYear #2ValueYear #1
MMISData Source: Data Source Other Specify:
New clients identified through CPT and modifier codes in claims data
Describe the data sources, methodologies, baselines, assumptions, trends, factors, and thresholds:
Service Provider: Pulmonary DiseaseGeographic Region: Statewide
20172016 6601 4542 2018 3207ValueYear #3ValueYear #2ValueYear #1
MMISData Source: Data Source Other Specify:
New clients identified through CPT and modifier codes in claims data
Describe the data sources, methodologies, baselines, assumptions, trends, factors, and thresholds:
Service Provider: Radiation OncologyGeographic Region: Health Statistic Region Grouping 1
20172016 1 3 2018 3
ValueYear #3ValueYear #2ValueYear #1
MMISData Source: Data Source Other Specify:
New clients identified through CPT and modifier codes in claims data
Describe the data sources, methodologies, baselines, assumptions, trends, factors, and thresholds:
Page 35

Template 4: Physician specialist services State: Colorado
Service Provider: Radiation OncologyGeographic Region: Health Statistic Region Grouping 2
20172016 10 15 2018 13ValueYear #3ValueYear #2ValueYear #1
MMISData Source: Data Source Other Specify:
New clients identified through CPT and modifier codes in claims data
Describe the data sources, methodologies, baselines, assumptions, trends, factors, and thresholds:
Service Provider: Radiation OncologyGeographic Region: Health Statistic Region Grouping 3
20172016 22 13 2018 12ValueYear #3ValueYear #2ValueYear #1
MMISData Source: Data Source Other Specify:
New clients identified through CPT and modifier codes in claims data
Describe the data sources, methodologies, baselines, assumptions, trends, factors, and thresholds:
Service Provider: Radiation OncologyGeographic Region: Health Statistic Region Grouping 4
20172016 9 4 2018 4ValueYear #3ValueYear #2ValueYear #1
MMISData Source: Data Source Other Specify:
New clients identified through CPT and modifier codes in claims data
Describe the data sources, methodologies, baselines, assumptions, trends, factors, and thresholds:
Service Provider: Radiation OncologyGeographic Region: Health Statistic Region Grouping 5
20172016 28 25 2018 20ValueYear #3ValueYear #2ValueYear #1
MMISData Source: Data Source Other Specify:
New clients identified through CPT and modifier codes in claims data
Describe the data sources, methodologies, baselines, assumptions, trends, factors, and thresholds:
Service Provider: Radiation OncologyGeographic Region: Health Statistic Region Grouping 6
20172016 96 67 2018 48ValueYear #3ValueYear #2ValueYear #1
MMISData Source: Data Source Other Specify:
New clients identified through CPT and modifier codes in claims data
Describe the data sources, methodologies, baselines, assumptions, trends, factors, and thresholds:
Service Provider: Radiation OncologyGeographic Region: Health Statistic Region Grouping 7
20172016 17 15 2018 15
ValueYear #3ValueYear #2ValueYear #1
MMISData Source: Data Source Other Specify:
New clients identified through CPT and modifier codes in claims data
Describe the data sources, methodologies, baselines, assumptions, trends, factors, and thresholds:
Page 36
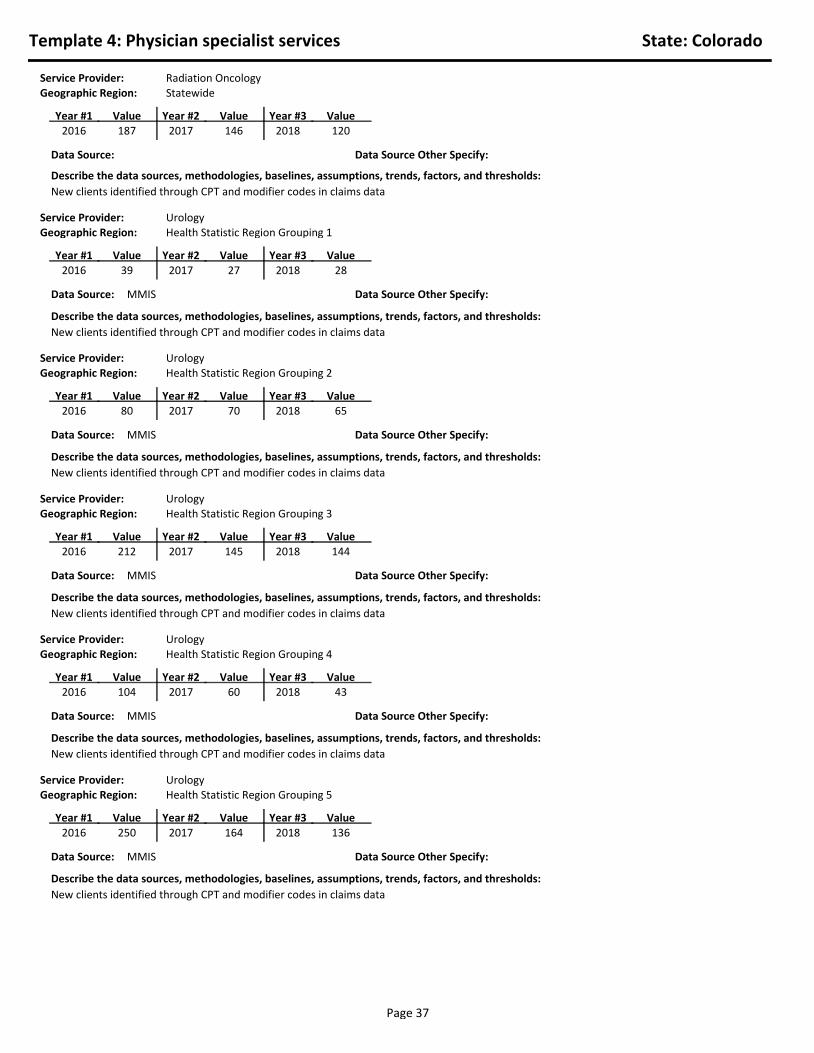
Template 4: Physician specialist services State: Colorado
Service Provider: Radiation OncologyGeographic Region: Statewide
20172016 187 146 2018 120ValueYear #3ValueYear #2ValueYear #1
Data Source: Data Source Other Specify:
New clients identified through CPT and modifier codes in claims data
Describe the data sources, methodologies, baselines, assumptions, trends, factors, and thresholds:
Service Provider: UrologyGeographic Region: Health Statistic Region Grouping 1
20172016 39 27 2018 28ValueYear #3ValueYear #2ValueYear #1
MMISData Source: Data Source Other Specify:
New clients identified through CPT and modifier codes in claims data
Describe the data sources, methodologies, baselines, assumptions, trends, factors, and thresholds:
Service Provider: UrologyGeographic Region: Health Statistic Region Grouping 2
20172016 80 70 2018 65ValueYear #3ValueYear #2ValueYear #1
MMISData Source: Data Source Other Specify:
New clients identified through CPT and modifier codes in claims data
Describe the data sources, methodologies, baselines, assumptions, trends, factors, and thresholds:
Service Provider: UrologyGeographic Region: Health Statistic Region Grouping 3
20172016 212 145 2018 144ValueYear #3ValueYear #2ValueYear #1
MMISData Source: Data Source Other Specify:
New clients identified through CPT and modifier codes in claims data
Describe the data sources, methodologies, baselines, assumptions, trends, factors, and thresholds:
Service Provider: UrologyGeographic Region: Health Statistic Region Grouping 4
20172016 104 60 2018 43ValueYear #3ValueYear #2ValueYear #1
MMISData Source: Data Source Other Specify:
New clients identified through CPT and modifier codes in claims data
Describe the data sources, methodologies, baselines, assumptions, trends, factors, and thresholds:
Service Provider: UrologyGeographic Region: Health Statistic Region Grouping 5
20172016 250 164 2018 136ValueYear #3ValueYear #2ValueYear #1
MMISData Source: Data Source Other Specify:
New clients identified through CPT and modifier codes in claims data
Describe the data sources, methodologies, baselines, assumptions, trends, factors, and thresholds:
Page 37

Template 4: Physician specialist services State: Colorado
Service Provider: UrologyGeographic Region: Health Statistic Region Grouping 6
20172016 654 424 2018 392ValueYear #3ValueYear #2ValueYear #1
MMISData Source: Data Source Other Specify:
New clients identified through CPT and modifier codes in claims data
Describe the data sources, methodologies, baselines, assumptions, trends, factors, and thresholds:
Service Provider: UrologyGeographic Region: Health Statistic Region Grouping 7
20172016 156 123 2018 130ValueYear #3ValueYear #2ValueYear #1
MMISData Source: Data Source Other Specify:
New clients identified through CPT and modifier codes in claims data
Describe the data sources, methodologies, baselines, assumptions, trends, factors, and thresholds:
Service Provider: UrologyGeographic Region: Statewide
20172016 1533 1081 2018 982ValueYear #3ValueYear #2ValueYear #1
Data Source: Data Source Other Specify:
New clients identified through CPT and modifier codes in claims data
Describe the data sources, methodologies, baselines, assumptions, trends, factors, and thresholds:
Service Provider: Vascular SurgeryGeographic Region: Health Statistic Region Grouping 1
20172016 165 68 2018 18ValueYear #3ValueYear #2ValueYear #1
MMISData Source: Data Source Other Specify:
New clients identified through CPT and modifier codes in claims data
Describe the data sources, methodologies, baselines, assumptions, trends, factors, and thresholds:
Service Provider: Vascular SurgeryGeographic Region: Health Statistic Region Grouping 2
20172016 193 59 2018 36ValueYear #3ValueYear #2ValueYear #1
MMISData Source: Data Source Other Specify:
New clients identified through CPT and modifier codes in claims data
Describe the data sources, methodologies, baselines, assumptions, trends, factors, and thresholds:
Service Provider: Vascular SurgeryGeographic Region: Health Statistic Region Grouping 3
20172016 619 274 2018 86ValueYear #3ValueYear #2ValueYear #1
MMISData Source: Data Source Other Specify:
New clients identified through CPT and modifier codes in claims data
Describe the data sources, methodologies, baselines, assumptions, trends, factors, and thresholds:
Page 38
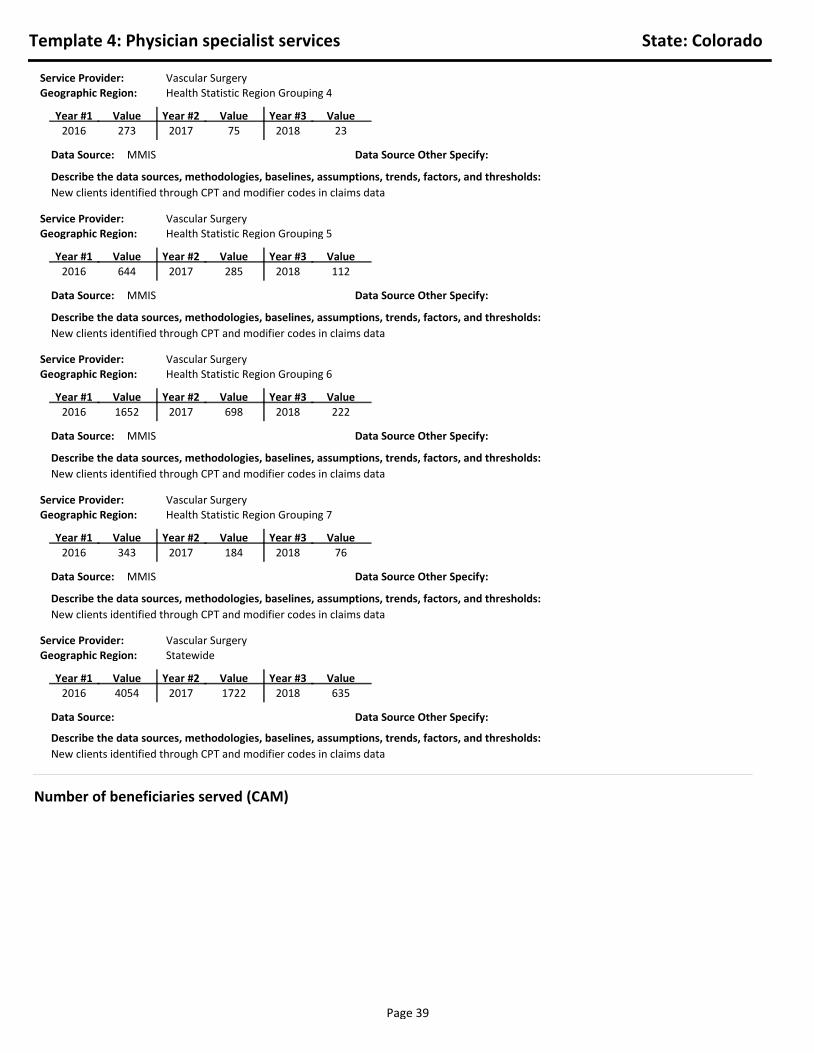
Template 4: Physician specialist services State: Colorado
Service Provider: Vascular SurgeryGeographic Region: Health Statistic Region Grouping 4
20172016 273 75 2018 23ValueYear #3ValueYear #2ValueYear #1
MMISData Source: Data Source Other Specify:
New clients identified through CPT and modifier codes in claims data
Describe the data sources, methodologies, baselines, assumptions, trends, factors, and thresholds:
Service Provider: Vascular SurgeryGeographic Region: Health Statistic Region Grouping 5
20172016 644 285 2018 112ValueYear #3ValueYear #2ValueYear #1
MMISData Source: Data Source Other Specify:
New clients identified through CPT and modifier codes in claims data
Describe the data sources, methodologies, baselines, assumptions, trends, factors, and thresholds:
Service Provider: Vascular SurgeryGeographic Region: Health Statistic Region Grouping 6
20172016 1652 698 2018 222ValueYear #3ValueYear #2ValueYear #1
MMISData Source: Data Source Other Specify:
New clients identified through CPT and modifier codes in claims data
Describe the data sources, methodologies, baselines, assumptions, trends, factors, and thresholds:
Service Provider: Vascular SurgeryGeographic Region: Health Statistic Region Grouping 7
20172016 343 184 2018 76ValueYear #3ValueYear #2ValueYear #1
MMISData Source: Data Source Other Specify:
New clients identified through CPT and modifier codes in claims data
Describe the data sources, methodologies, baselines, assumptions, trends, factors, and thresholds:
Service Provider: Vascular SurgeryGeographic Region: Statewide
20172016 4054 1722 2018 635ValueYear #3ValueYear #2ValueYear #1
Data Source: Data Source Other Specify:
New clients identified through CPT and modifier codes in claims data
Describe the data sources, methodologies, baselines, assumptions, trends, factors, and thresholds:
Number of beneficiaries served (CAM)
Page 39

Template 4: Physician specialist services State: Colorado
2016 263 2017 339 2018 281
Year #1 Value Year #2 Value Year #3 Value
2016 177 2017 168 2018 1652016 44 2017 39 2018 38
PediatricAdults
Individuals with Disabilities
Service Provider: Allergy/ImmunologyGeographic Region: Health Statistic Region Grouping 1
MMISData Source: Data Source Other Specify:
Total Number of Beneficiaries Served by Enrolled Providers identified through claims data. Number of Beneficiaries Served by Health Statistic Region Grouping is based on service county location. HSR Grouping 1 - Eastern Plains includes Baca,Bent, Cheyenne, Crowley, Elbert, Huerfano, Kiowa, Kit Carson, Las Animas, Lincoln, Logan, Morgan, Otero, Phillips, Prowers, Sedgwick, Washington, and Yuma counties.
Describe the data sources, methodologies, baselines, assumptions, trends, factors, and thresholds:
2016 521 2017 446 2018 406
Year #1 Value Year #2 Value Year #3 Value
2016 103 2017 110 2018 882016 2017 2018
PediatricAdults
Individuals with Disabilities
Service Provider: Allergy/ImmunologyGeographic Region: Health Statistic Region Grouping 2
MMISData Source: Data Source Other Specify:
Results for Individuals with Disabilities in all 3 years were less than 30. Note: Departmental guidelines require results less than 30 to be blinded. This is to ensure compliance with the Health Insurance Portability and Accountability Act of 1996 (HIPPA) regulations and to prevent potential identification of individual members. Number of Beneficiaries Served by Health Statistic Region Grouping is based on service county location. HSR Grouping 2 - Northwestern Colorado includes Eagle, Garfield, Grand, Jackson, Mesa, Moffat, Pitkin, Rio Blanco, Routt, and Summit counties.
Describe the data sources, methodologies, baselines, assumptions, trends, factors, and thresholds:
2016 1885 2017 1814 2018 1672
Year #1 Value Year #2 Value Year #3 Value
2016 1184 2017 1173 2018 11802016 266 2017 279 2018 299
PediatricAdults
Individuals with Disabilities
Service Provider: Allergy/Immunology
Geographic Region: Health Statistic Region Grouping 3
MMISData Source: Data Source Other Specify:
Total Number of Beneficiaries Served by Enrolled Providers identified through claims data. Number of Beneficiaries Served by Health Statistic Region Grouping is based on service county location. HSR Grouping 3 - Colorado Springs/Pueblo includes Chaffee, Custer, El Paso, Fremont, Lake, and Pueblo counties.
Describe the data sources, methodologies, baselines, assumptions, trends, factors, and thresholds:
2016 252 2017 249 2018 245
Year #1 Value Year #2 Value Year #3 Value
2016 174 2017 173 2018 1632016 41 2017 43 2018 30
PediatricAdults
Individuals with Disabilities
Service Provider: Allergy/ImmunologyGeographic Region: Health Statistic Region Grouping 4
MMISData Source: Data Source Other Specify:
Total Number of Beneficiaries Served by Enrolled Providers identified through claims data. Number of Beneficiaries Served by Health Statistic Region Grouping is based on service county location. HSR Grouping 4 - San Luis Valley includes Alamosa, Archuleta, Conejos, Costilla, Delta, Dolores, Gunnison, Hinsdale, La Plata, Mineral, Montezuma, Montrose, Ouray, Rio Grande, Saguache, San Juan, and San Miguel counties.
Describe the data sources, methodologies, baselines, assumptions, trends, factors, and thresholds:
Page 40

Template 4: Physician specialist services State: Colorado
2016 994 2017 1096 2018 1036
Year #1 Value Year #2 Value Year #3 Value
2016 822 2017 854 2018 9572016 148 2017 178 2018 212
PediatricAdults
Individuals with Disabilities
Service Provider: Allergy/ImmunologyGeographic Region: Health Statistic Region Grouping 5
MMISData Source: Data Source Other Specify:
Total Number of Beneficiaries Served by Enrolled Providers identified through claims data. Number of Beneficiaries Served by Health Statistic Region Grouping is based on service county location. HSR Grouping 5 - Northern Colorado includes Boulder, Broomfield, Larimer, and Weld counties.
Describe the data sources, methodologies, baselines, assumptions, trends, factors, and thresholds:
2016 2408 2017 3101 2018 3043
Year #1 Value Year #2 Value Year #3 Value
2016 1557 2017 1749 2018 17232016 257 2017 289 2018 347
PediatricAdults
Individuals with Disabilities
Service Provider: Allergy/ImmunologyGeographic Region: Health Statistic Region Grouping 6
Data Source: Data Source Other Specify:
Total Number of Beneficiaries Served by Enrolled Providers identified through claims data. Number of Beneficiaries Served by Health Statistic Region Grouping is based on service county location. HSR Grouping 6 - Metro Denver (North & East)includes Adams, Arapahoe, and Denver counties.
Describe the data sources, methodologies, baselines, assumptions, trends, factors, and thresholds:
2016 657 2017 823 2018 723
Year #1 Value Year #2 Value Year #3 Value
2016 568 2017 708 2018 7632016 73 2017 93 2018 118
PediatricAdults
Individuals with Disabilities
Service Provider: Allergy/ImmunologyGeographic Region: Health Statistic Region Grouping 7
MMISData Source: Data Source Other Specify:
Total Number of Beneficiaries Served by Enrolled Providers identified through claims data. Number of Beneficiaries Served by Health Statistic Region Grouping is based on service county location. HSR Grouping 7 - Metro Denver (West & South) includes Clear Creek, Douglas, Gilpin, Jefferson, Park, and Teller counties.
Describe the data sources, methodologies, baselines, assumptions, trends, factors, and thresholds:
2016 6962 2017 7844 2018 7384
Year #1 Value Year #2 Value Year #3 Value
2016 4561 2017 4917 2018 50172016 843 2017 937 2018 1063
PediatricAdults
Individuals with Disabilities
Service Provider: Allergy/ImmunologyGeographic Region: Statewide
MMISData Source: Data Source Other Specify:
Total Number of Beneficiaries Served by Enrolled Providers identified through claims data
Describe the data sources, methodologies, baselines, assumptions, trends, factors, and thresholds:
2016 431 2017 476 2018 483
Year #1 Value Year #2 Value Year #3 Value
2016 3671 2017 4051 2018 40422016 1161 2017 1210 2018 1243
PediatricAdults
Individuals with Disabilities
Service Provider: CardiologyGeographic Region: Health Statistic Region Grouping 1
MMISData Source: Data Source Other Specify:
Total Number of Beneficiaries Served by Enrolled Providers identified through claims data. Number of Beneficiaries Served by Health Statistic Region Grouping is based on service county location. HSR Grouping 1 - Eastern Plains includes Baca, Bent, Cheyenne, Crowley, Elbert, Huerfano, Kiowa, Kit Carson, Las Animas, Lincoln, Logan, Morgan, Otero, Phillips, Prowers, Sedgwick, Washington, and Yuma counties.
Describe the data sources, methodologies, baselines, assumptions, trends, factors, and thresholds:
Page 41

Template 4: Physician specialist services State: Colorado
2016 657 2017 592 2018 550
Year #1 Value Year #2 Value Year #3 Value
2016 1724 2017 1747 2018 19512016 366 2017 392 2018 446
PediatricAdults
Individuals with Disabilities
Service Provider: CardiologyGeographic Region: Health Statistic Region Grouping 2
MMISData Source: Data Source Other Specify:
Total Number of Beneficiaries Served by Enrolled Providers identified through claims data. Number of Beneficiaries Served by Health Statistic Region Grouping is based on service county location. HSR Grouping 2 - Northwestern Colorado includes Eagle, Garfield, Grand, Jackson, Mesa, Moffat, Pitkin, Rio Blanco, Routt, and Summit counties.
Describe the data sources, methodologies, baselines, assumptions, trends, factors, and thresholds:
2016 2410 2017 2614 2018 2627
Year #1 Value Year #2 Value Year #3 Value
2016 17721 2017 20356 2018 207342016 4734 2017 5417 2018 5831
PediatricAdults
Individuals with Disabilities
Service Provider: CardiologyGeographic Region: Health Statistic Region Grouping 3
MMISData Source: Data Source Other Specify:
Total Number of Beneficiaries Served by Enrolled Providers identified through claims data. Number of Beneficiaries Served by Health Statistic Region Grouping is based on service county location. HSR Grouping 3 - Colorado Springs/Pueblo includes Chaffee, Custer, El Paso, Fremont, Lake, and Pueblo counties.
Describe the data sources, methodologies, baselines, assumptions, trends, factors, and thresholds:
2016 449 2017 478 2018 453
Year #1 Value Year #2 Value Year #3 Value
2016 3699 2017 4049 2018 42162016 1053 2017 1027 2018 1121
PediatricAdults
Individuals with Disabilities
Service Provider: CardiologyGeographic Region: Health Statistic Region Grouping 4
MMISData Source: Data Source Other Specify:
Total Number of Beneficiaries Served by Enrolled Providers identified through claims data. Number of Beneficiaries Served by Health Statistic Region Grouping is based on service county location. HSR Grouping 4 - San Luis Valley includes Alamosa, Archuleta, Conejos, Costilla, Delta, Dolores, Gunnison, Hinsdale, La Plata, Mineral, Montezuma, Montrose, Ouray, Rio Grande, Saguache, San Juan, and San Miguel counties.
Describe the data sources, methodologies, baselines, assumptions, trends, factors, and thresholds:
2016 1612 2017 1665 2018 1718
Year #1 Value Year #2 Value Year #3 Value
2016 12327 2017 12893 2018 130582016 3011 2017 3096 2018 3219
PediatricAdults
Individuals with Disabilities
Service Provider: CardiologyGeographic Region: Health Statistic Region Grouping 5
MMISData Source: Data Source Other Specify:
Total Number of Beneficiaries Served by Enrolled Providers identified through claims data. Number of Beneficiaries Served by Health Statistic Region Grouping is based on service county location. HSR Grouping 5 - Northern Colorado includes Boulder, Broomfield, Larimer, and Weld counties.
Describe the data sources, methodologies, baselines, assumptions, trends, factors, and thresholds:
Page 42

Template 4: Physician specialist services State: Colorado
2016 4107 2017 4362 2018 4266
Year #1 Value Year #2 Value Year #3 Value
2016 32699 2017 33728 2018 336762016 7315 2017 7507 2018 7774
PediatricAdults
Individuals with Disabilities
Service Provider: CardiologyGeographic Region: Health Statistic Region Grouping 6
MMISData Source: Data Source Other Specify:
Total Number of Beneficiaries Served by Enrolled Providers identified through claims data. Number of Beneficiaries Served by Health Statistic Region Grouping is based on service county location. HSR Grouping 6 - Metro Denver (North & East) includes Adams, Arapahoe, and Denver counties.
Describe the data sources, methodologies, baselines, assumptions, trends, factors, and thresholds:
2016 1132 2017 1236 2018 1122
Year #1 Value Year #2 Value Year #3 Value
2016 10263 2017 10707 2018 107482016 2217 2017 2348 2018 2389
PediatricAdults
Individuals with Disabilities
Service Provider: CardiologyGeographic Region: Health Statistic Region Grouping 7
MMISData Source: Data Source Other Specify:
Total Number of Beneficiaries Served by Enrolled Providers identified through claims data. Number of Beneficiaries Served by Health Statistic Region Grouping is based on service county location. HSR Grouping 7 - Metro Denver (West & South) includes Clear Creek, Douglas, Gilpin, Jefferson, Park, and Teller counties.
Describe the data sources, methodologies, baselines, assumptions, trends, factors, and thresholds:
2016 10785 2017 11408 2018 11197
Year #1 Value Year #2 Value Year #3 Value
2016 81569 2017 87103 2018 877832016 19651 2017 20831 2018 21795
PediatricAdults
Individuals with Disabilities
Service Provider: CardiologyGeographic Region: Statewide
MMISData Source: Data Source Other Specify:
Total Number of Beneficiaries Served by Enrolled Providers identified through claims data
Describe the data sources, methodologies, baselines, assumptions, trends, factors, and thresholds:
2016 2017 2018
Year #1 Value Year #2 Value Year #3 Value
2016 30 2017 36 20182016 2017 2018
PediatricAdults
Individuals with Disabilities
Service Provider: DermatologyGeographic Region: Health Statistic Region Grouping 5
MMISData Source: Data Source Other Specify:
Results for all fields were below 30, except for results for Adults in 2016 and 2017. Note: Departmental guidelines require results less than 30 to be blinded. This is to ensure compliance with the Health Insurance Portability and Accountability Act of 1996 (HIPPA) regulations and to prevent potential identification of individual members. Number of Beneficiaries Served by Health Statistic Region Grouping is based on service county location. HSR Grouping 5 - Northern Colorado includes Boulder, Broomfield, Larimer, and Weld counties.
Describe the data sources, methodologies, baselines, assumptions, trends, factors, and thresholds:
Page 43

Template 4: Physician specialist services State: Colorado
2016 2017 47 2018 53
Year #1 Value Year #2 Value Year #3 Value
2016 83 2017 79 2018 732016 2017 2018
PediatricAdults
Individuals with Disabilities
Service Provider: DermatologyGeographic Region: Health Statistic Region Grouping 6
MMISData Source: Data Source Other Specify:
Results for Pediatric in 2016 and Individuals with Disabilities in all 3 years were less than 30. Note: Departmental guidelines require results less than 30 to be blinded. This is to ensure compliance with the Health Insurance Portability and Accountability Act of 1996 (HIPPA) regulations and to prevent potential identification of individual members. Number of Beneficiaries Served by Health Statistic Region Grouping is based on service county location. HSR Grouping 6 - Metro Denver (North & East) includes Adams, Arapahoe, and Denver counties.
Describe the data sources, methodologies, baselines, assumptions, trends, factors, and thresholds:
2016 59 2017 92 2018 73
Year #1 Value Year #2 Value Year #3 Value
2016 162 2017 158 2018 1592016 40 2017 45 2018 47
PediatricAdults
Individuals with Disabilities
Service Provider: DermatologyGeographic Region: Statewide
MMISData Source: Data Source Other Specify:
Total Number of Beneficiaries Served by Enrolled Providers identified through claims data
Describe the data sources, methodologies, baselines, assumptions, trends, factors, and thresholds:
2016 2017 2018
Year #1 Value Year #2 Value Year #3 Value
2016 33 2017 20182016 2017 2018
PediatricAdults
Individuals with Disabilities
Service Provider: EndocrinologyGeographic Region: Health Statistic Region Grouping 1
MMISData Source: Data Source Other Specify:
Results for Endocrinology were less than 30 for all fields, except results for Adults in 2016. Note: Departmental guidelines require results less than 30 to be blinded. This is to ensure compliance with the Health Insurance Portability and Accountability Act of 1996 (HIPPA) regulations and to prevent potential identification of individual members. Number of Beneficiaries Served by Health Statistic Region Grouping is based on service county location. HSR Grouping 1 - Eastern Plains includes Baca, Bent, Cheyenne, Crowley, Elbert, Huerfano, Kiowa, Kit Carson, Las Animas, Lincoln, Logan, Morgan, Otero, Phillips, Prowers, Sedgwick, Washington, and Yuma counties.
Describe the data sources, methodologies, baselines, assumptions, trends, factors, and thresholds:
2016 2017 2018
Year #1 Value Year #2 Value Year #3 Value
2016 91 2017 126 2018 752016 2017 30 2018
PediatricAdults
Individuals with Disabilities
Service Provider: EndocrinologyGeographic Region: Health Statistic Region Grouping 3
MMISData Source: Data Source Other Specify:
Results for Pediatric in all 3 years and Individuals with Disabilities in 2016 and 2018 were less than 30. Note: Departmental guidelines require results less than 30 to be blinded. This is to ensure compliance with the Health Insurance Portability and Accountability Act of 1996 (HIPPA) regulations and to prevent potential identification of individual members. Number of Beneficiaries Served by Health Statistic Region Grouping is based on service county location. HSR Grouping 3 - Colorado Springs/Pueblo includes Chaffee, Custer, El Paso, Fremont, Lake, and Pueblo counties.
Describe the data sources, methodologies, baselines, assumptions, trends, factors, and thresholds:
Page 44

Template 4: Physician specialist services State: Colorado
2016 2017 2018
Year #1 Value Year #2 Value Year #3 Value
2016 75 2017 85 2018 532016 2017 2018
PediatricAdults
Individuals with Disabilities
Service Provider: EndocrinologyGeographic Region: Health Statistic Region Grouping 5
MMISData Source: Data Source Other Specify:
Results for Pediatric and Individuals with Disabilities in all 3 years were less than 30. Note: Departmental guidelines require results less than 30 to be blinded. This is to ensure compliance with the Health Insurance Portability and Accountability Act of 1996 (HIPPA) regulations and to prevent potential identification of individual members. Number of Beneficiaries Served by Health Statistic Region Grouping is based on service county location. HSR Grouping 5 - Northern Colorado includes Boulder, Broomfield, Larimer, and Weld counties.
Describe the data sources, methodologies, baselines, assumptions, trends, factors, and thresholds:
2016 2017 2018
Year #1 Value Year #2 Value Year #3 Value
2016 122 2017 128 2018 1102016 2017 31 2018
PediatricAdults
Individuals with Disabilities
Service Provider: EndocrinologyGeographic Region: Health Statistic Region Grouping 6
MMISData Source: Data Source Other Specify:
Rsults for Pediatric in all 3 years and Individuals with Disabilities in 2016 and 2018 were less than 30. Note: Departmental guidelines require results less than 30 to be blinded. This is to ensure compliance with the Health Insurance Portability and Accountability Act of 1996 (HIPPA) regulations and to prevent potential identification of individual members. Number of Beneficiaries Served by Health Statistic Region Grouping is based on service county location. HSR Grouping 6 - Metro Denver (North & East) includes Adams, Arapahoe, and Denver counties.
Describe the data sources, methodologies, baselines, assumptions, trends, factors, and thresholds:
2016 2017 2018
Year #1 Value Year #2 Value Year #3 Value
2016 53 2017 45 2018 412016 2017 2018
PediatricAdults
Individuals with Disabilities
Service Provider: Endocrinology
Geographic Region: Health Statistic Region Grouping 7
MMISData Source: Data Source Other Specify:
Results for Pediatric and Individuals with Disabilities in all 3 years were less than 30. Note: Departmental guidelines require results less than 30 to be blinded. This is to ensure compliance with the Health Insurance Portability and Accountability Act of 1996 (HIPPA) regulations and to prevent potential identification of individual members. Number of Beneficiaries Served by Health Statistic Region Grouping is based on service county location. HSR Grouping 7 - Metro Denver (West & South) includes Clear Creek, Douglas, Gilpin, Jefferson, Park, and Teller counties.
Describe the data sources, methodologies, baselines, assumptions, trends, factors, and thresholds:
2016 2017 2018
Year #1 Value Year #2 Value Year #3 Value
2016 407 2017 439 2018 3382016 85 2017 95 2018 60
PediatricAdults
Individuals with Disabilities
Service Provider: EndocrinologyGeographic Region: Statewide
Data Source: Data Source Other Specify:
Results for Pediatric in Endocrinology were less than 30. Note: Departmental guidelines require results less than 30 to be blinded. This is to ensure compliance with the Health Insurance Portability and Accountability Act of 1996 (HIPPA) regulations and to prevent potential identification of individual members.
Describe the data sources, methodologies, baselines, assumptions, trends, factors, and thresholds:
Page 45

Template 4: Physician specialist services State: Colorado
2016 58 2017 39 2018 34
Year #1 Value Year #2 Value Year #3 Value
2016 146 2017 186 2018 3812016 66 2017 74 2018 140
PediatricAdults
Individuals with Disabilities
Service Provider: GastroenterologyGeographic Region: Health Statistic Region Grouping 3
MMISData Source: Data Source Other Specify:
Total Number of Beneficiaries Served by Enrolled Providers identified through claims data. Number of Beneficiaries Served by Health Statistic Region Grouping is based on service county location. HSR Grouping 3 - Colorado Springs/Pueblo includes Chaffee, Custer, El Paso, Fremont, Lake, and Pueblo counties.
Describe the data sources, methodologies, baselines, assumptions, trends, factors, and thresholds:
2016 2017 2018
Year #1 Value Year #2 Value Year #3 Value
2016 40 2017 34 2018 442016 2017 2018
PediatricAdults
Individuals with Disabilities
Service Provider: GastroenterologyGeographic Region: Health Statistic Region Grouping 4
MMISData Source: Data Source Other Specify:
Results for Pediatric and Individuals with Disabilities in all 3 years were less than 30. Note: Departmental guidelines require results less than 30 to be blinded. This is to ensure compliance with the Health Insurance Portability and Accountability Act of 1996 (HIPPA) regulations and to prevent potential identification of individual members. Number of Beneficiaries Served by Health Statistic Region Grouping is based on service county location. HSR Grouping 4 - San Luis Valley includes Alamosa, Archuleta, Conejos, Costilla, Delta, Dolores, Gunnison, Hinsdale, La Plata, Mineral, Montezuma, Montrose, Ouray, Rio Grande, Saguache, San Juan, and San Miguel counties.
Describe the data sources, methodologies, baselines, assumptions, trends, factors, and thresholds:
2016 2017 2018
Year #1 Value Year #2 Value Year #3 Value
2016 133 2017 162 2018 1512016 41 2017 47 2018 50
PediatricAdults
Individuals with Disabilities
Service Provider: GastroenterologyGeographic Region: Health Statistic Region Grouping 5
MMISData Source: Data Source Other Specify:
Results for Pediatric in all 3 years were less than 30. Note: Departmental guidelines require results less than 30 to be blinded. This is to ensure compliance with the Health Insurance Portability and Accountability Act of 1996 (HIPPA) regulations and to prevent potential identification of individual members. Number of Beneficiaries Served by Health Statistic Region Grouping is based on service county location. HSR Grouping 5 - Northern Colorado includes Boulder, Broomfield, Larimer, and Weld counties.
Describe the data sources, methodologies, baselines, assumptions, trends, factors, and thresholds:
2016 73 2017 63 2018 113
Year #1 Value Year #2 Value Year #3 Value
2016 467 2017 505 2018 5162016 127 2017 140 2018 169
PediatricAdults
Individuals with Disabilities
Service Provider: GastroenterologyGeographic Region: Health Statistic Region Grouping 6
MMISData Source: Data Source Other Specify:
Total Number of Beneficiaries Served by Enrolled Providers identified through claims data. Number of Beneficiaries Served by Health Statistic Region Grouping is based on service county location. HSR Grouping 6 - Metro Denver (North & East) includes Adams, Arapahoe, and Denver counties.
Describe the data sources, methodologies, baselines, assumptions, trends, factors, and thresholds:
Page 46

Template 4: Physician specialist services State: Colorado
2016 2017 31 2018
Year #1 Value Year #2 Value Year #3 Value
2016 149 2017 108 2018 1602016 49 2017 46 2018 49
PediatricAdults
Individuals with Disabilities
Service Provider: GastroenterologyGeographic Region: Health Statistic Region Grouping 7
MMISData Source: Data Source Other Specify:
Results for Pediatric in 2016 and 2018 were less than 30. Note: Departmental guidelines require results less than 30 to be blinded. This is to ensure compliance with the Health Insurance Portability and Accountability Act of 1996 (HIPPA) regulations and to prevent potential identification of individual members. Number of Beneficiaries Served by Health Statistic Region Grouping is based on service county location. HSR Grouping 7 - Metro Denver (West & South) includes Clear Creek, Douglas, Gilpin, Jefferson, Park, and Teller counties.
Describe the data sources, methodologies, baselines, assumptions, trends, factors, and thresholds:
2016 201 2017 199 2018 229
Year #1 Value Year #2 Value Year #3 Value
2016 975 2017 1069 2018 13132016 308 2017 336 2018 442
PediatricAdults
Individuals with Disabilities
Service Provider: GastroenterologyGeographic Region: Statewide
MMISData Source: Data Source Other Specify:
Total Number of Beneficiaries Served by Enrolled Providers identified through claims data
Describe the data sources, methodologies, baselines, assumptions, trends, factors, and thresholds:
2016 88 2017 116 2018 104
Year #1 Value Year #2 Value Year #3 Value
2016 464 2017 412 2018 4332016 219 2017 206 2018 225
PediatricAdults
Individuals with Disabilities
Service Provider: NeurologyGeographic Region: Health Statistic Region Grouping 1
MMISData Source: Data Source Other Specify:
Total Number of Beneficiaries Served by Enrolled Providers identified through claims data. Number of Beneficiaries Served by Health Statistic Region Grouping is based on service county location. HSR Grouping 1 - Eastern Plains includes Baca, Bent, Cheyenne, Crowley, Elbert, Huerfano, Kiowa, Kit Carson, Las Animas, Lincoln, Logan, Morgan, Otero, Phillips, Prowers, Sedgwick, Washington, and Yuma counties.
Describe the data sources, methodologies, baselines, assumptions, trends, factors, and thresholds:
2016 111 2017 173 2018 138
Year #1 Value Year #2 Value Year #3 Value
2016 180 2017 168 2018 2132016 86 2017 81 2018 93
PediatricAdults
Individuals with Disabilities
Service Provider: NeurologyGeographic Region: Health Statistic Region Grouping 2
MMISData Source: Data Source Other Specify:
Total Number of Beneficiaries Served by Enrolled Providers identified through claims data. Number of Beneficiaries Served by Health Statistic Region Grouping is based on service county location. HSR Grouping 2 - Northwestern Colorado includes Eagle, Garfield, Grand, Jackson, Mesa, Moffat, Pitkin, Rio Blanco, Routt, and Summit counties.
Describe the data sources, methodologies, baselines, assumptions, trends, factors, and thresholds:
Page 47

Template 4: Physician specialist services State: Colorado
2016 767 2017 714 2018 709
Year #1 Value Year #2 Value Year #3 Value
2016 2339 2017 2266 2018 23722016 1183 2017 1167 2018 1239
PediatricAdults
Individuals with Disabilities
Service Provider: NeurologyGeographic Region: Health Statistic Region Grouping 3
MMISData Source: Data Source Other Specify:
Total Number of Beneficiaries Served by Enrolled Providers identified through claims data. Number of Beneficiaries Served by Health Statistic Region Grouping is based on service county location. HSR Grouping 3 - Colorado Springs/Pueblo includes Chaffee, Custer, El Paso, Fremont, Lake, and Pueblo counties.
Describe the data sources, methodologies, baselines, assumptions, trends, factors, and thresholds:
2016 100 2017 119 2018 122
Year #1 Value Year #2 Value Year #3 Value
2016 472 2017 514 2018 4422016 172 2017 173 2018 151
PediatricAdults
Individuals with Disabilities
Service Provider: NeurologyGeographic Region: Health Statistic Region Grouping 4
MMISData Source: Data Source Other Specify:
Total Number of Beneficiaries Served by Enrolled Providers identified through claims data. Number of Beneficiaries Served by Health Statistic Region Grouping is based on service county location. HSR Grouping 4 - San Luis Valley includes Alamosa, Archuleta, Conejos, Costilla, Delta, Dolores, Gunnison, Hinsdale, La Plata, Mineral, Montezuma, Montrose, Ouray, Rio Grande, Saguache, San Juan, and San Miguel counties.
Describe the data sources, methodologies, baselines, assumptions, trends, factors, and thresholds:
2016 304 2017 318 2018 305
Year #1 Value Year #2 Value Year #3 Value
2016 1345 2017 1459 2018 15052016 620 2017 592 2018 700
PediatricAdults
Individuals with Disabilities
Service Provider: NeurologyGeographic Region: Health Statistic Region Grouping 5
MMISData Source: Data Source Other Specify:
Total Number of Beneficiaries Served by Enrolled Providers identified through claims data. Number of Beneficiaries Served by Health Statistic Region Grouping is based on service county location. HSR Grouping 5 - Northern Colorado includes Boulder, Broomfield, Larimer, and Weld counties.
Describe the data sources, methodologies, baselines, assumptions, trends, factors, and thresholds:
2016 737 2017 700 2018 720
Year #1 Value Year #2 Value Year #3 Value
2016 2822 2017 2746 2018 27662016 1232 2017 1296 2018 1371
PediatricAdults
Individuals with Disabilities
Service Provider: NeurologyGeographic Region: Health Statistic Region Grouping 6
MMISData Source: Data Source Other Specify:
Total Number of Beneficiaries Served by Enrolled Providers identified through claims data. Number of Beneficiaries Served by Health Statistic Region Grouping is based on service county location. HSR Grouping 6 - Metro Denver (North & East) includes Adams, Arapahoe, and Denver counties.
Describe the data sources, methodologies, baselines, assumptions, trends, factors, and thresholds:
Page 48

Template 4: Physician specialist services State: Colorado
2016 220 2017 238 2018 237
Year #1 Value Year #2 Value Year #3 Value
2016 986 2017 1059 2018 11022016 495 2017 515 2018 517
PediatricAdults
Individuals with Disabilities
Service Provider: NeurologyGeographic Region: Health Statistic Region Grouping 7
MMISData Source: Data Source Other Specify:
Total Number of Beneficiaries Served by Enrolled Providers identified through claims data. Number of Beneficiaries Served by Health Statistic Region Grouping is based on service county location. HSR Grouping 7 - Metro Denver (West & South) includes Clear Creek, Douglas, Gilpin, Jefferson, Park, and Teller counties.
Describe the data sources, methodologies, baselines, assumptions, trends, factors, and thresholds:
2016 2323 2017 2376 2018 2330
Year #1 Value Year #2 Value Year #3 Value
2016 8597 2017 8616 2018 88122016 3992 2017 4022 2018 4270
PediatricAdults
Individuals with Disabilities
Service Provider: NeurologyGeographic Region: Statewide
MMISData Source: Data Source Other Specify:
Total Number of Beneficiaries Served by Enrolled Providers identified through claims data
Describe the data sources, methodologies, baselines, assumptions, trends, factors, and thresholds:
2016 2017 2018
Year #1 Value Year #2 Value Year #3 Value
2016 510 2017 556 2018 5172016 193 2017 191 2018 155
PediatricAdults
Individuals with Disabilities
Service Provider: Nuclear MedicineGeographic Region: Health Statistic Region Grouping 1
MMISData Source: Data Source Other Specify:
Results for Pediatric in all years were less than 30. Note: Departmental guidelines require results less than 30 to be blinded. This is to ensure compliance with the Health Insurance Portability and Accountability Act of 1996 (HIPPA) regulations and to prevent potential identification of individual members. Number of Beneficiaries Served by Health Statistic Region Grouping is based on service county location. HSR Grouping 1 - Eastern Plains includes Baca, Bent, Cheyenne, Crowley, Elbert, Huerfano, Kiowa, Kit Carson, Las Animas, Lincoln, Logan, Morgan, Otero, Phillips, Prowers, Sedgwick, Washington, and Yuma counties.
Describe the data sources, methodologies, baselines, assumptions, trends, factors, and thresholds:
2016 46 2017 40 2018
Year #1 Value Year #2 Value Year #3 Value
2016 211 2017 216 2018 1742016 66 2017 65 2018 67
PediatricAdults
Individuals with Disabilities
Service Provider: Nuclear MedicineGeographic Region: Health Statistic Region Grouping 2
MMISData Source: Data Source Other Specify:
Results for Pediatric in 2018 were less than 30. Note: Departmental guidelines require results less than 30 to be blinded. This is to ensure compliance with the Health Insurance Portability and Accountability Act of 1996 (HIPPA) regulations and to prevent potential identification of individual members. Number of Beneficiaries Served by Health Statistic Region Grouping is based on service county location. HSR Grouping 2 - Northwestern Colorado includes Eagle, Garfield, Grand, Jackson, Mesa, Moffat, Pitkin, Rio Blanco, Routt, and Summit counties.
Describe the data sources, methodologies, baselines, assumptions, trends, factors, and thresholds:
Page 49

Template 4: Physician specialist services State: Colorado
2016 116 2017 116 2018 114
Year #1 Value Year #2 Value Year #3 Value
2016 2292 2017 2385 2018 22192016 751 2017 771 2018 761
PediatricAdults
Individuals with Disabilities
Service Provider: Nuclear MedicineGeographic Region: Health Statistic Region Grouping 3
MMISData Source: Data Source Other Specify:
Number of Beneficiaries Served by Health Statistic Region Grouping is based on service county location. HSR Grouping 3 - Colorado Springs/Pueblo includes Chaffee, Custer, El Paso, Fremont, Lake, and Pueblo counties.
Describe the data sources, methodologies, baselines, assumptions, trends, factors, and thresholds:
2016 2017 2018
Year #1 Value Year #2 Value Year #3 Value
2016 472 2017 500 2018 4892016 161 2017 166 2018 162
PediatricAdults
Individuals with Disabilities
Service Provider: Nuclear MedicineGeographic Region: Health Statistic Region Grouping 4
MMISData Source: Data Source Other Specify:
Results for Pediatric in all three years were less than 30. Note: Departmental guidelines require results less than 30 to be blinded. This is to ensure compliance with the Health Insurance Portability and Accountability Act of 1996 (HIPPA) regulations and to prevent potential identification of individual members. Number of Beneficiaries Served by Health Statistic Region Grouping is based on service county location. HSR Grouping 4 - San Luis Valley includes Alamosa, Archuleta, Conejos, Costilla, Delta, Dolores, Gunnison, Hinsdale, La Plata, Mineral, Montezuma, Montrose, Ouray, Rio Grande, Saguache, San Juan, and San Miguel counties.
Describe the data sources, methodologies, baselines, assumptions, trends, factors, and thresholds:
2016 56 2017 46 2018 33
Year #1 Value Year #2 Value Year #3 Value
2016 1565 2017 1585 2018 15182016 493 2017 515 2018 467
PediatricAdults
Individuals with Disabilities
Service Provider: Nuclear MedicineGeographic Region: Health Statistic Region Grouping 5
MMISData Source: Data Source Other Specify:
Number of Beneficiaries Served by Health Statistic Region Grouping is based on service county location. HSR Grouping 5 - Northern Colorado includes Boulder, Broomfield, Larimer, and Weld counties.
Describe the data sources, methodologies, baselines, assumptions, trends, factors, and thresholds:
2016 112 2017 105 2018 97
Year #1 Value Year #2 Value Year #3 Value
2016 3263 2017 3392 2018 32852016 984 2017 1031 2018 1006
PediatricAdults
Individuals with Disabilities
Service Provider: Nuclear MedicineGeographic Region: Health Statistic Region Grouping 6
MMISData Source: Data Source Other Specify:
Number of Beneficiaries Served by Health Statistic Region Grouping is based on service county location. HSR Grouping 6 - Metro Denver (North & East) includes Adams, Arapahoe, and Denver counties.
Describe the data sources, methodologies, baselines, assumptions, trends, factors, and thresholds:
Page 50

Template 4: Physician specialist services State: Colorado
2016 38 2017 33 2018
Year #1 Value Year #2 Value Year #3 Value
2016 1155 2017 1202 2018 11892016 341 2017 365 2018 347
PediatricAdults
Individuals with Disabilities
Service Provider: Nuclear MedicineGeographic Region: Health Statistic Region Grouping 7
MMISData Source: Data Source Other Specify:
Results for Pediatric in 2018 have been blinded. Note: Departmental guidelines require results less than 30 to be blinded. This is to ensure compliance with the Health Insurance Portability and Accountability Act of 1996 (HIPPA) regulations and to prevent potential identification of individual members. Number of Beneficiaries Served by Health Statistic Region Grouping is based on service county location. HSR Grouping 7 - Metro Denver (West & South) includes Clear Creek, Douglas, Gilpin, Jefferson, Park, and Teller counties.
Describe the data sources, methodologies, baselines, assumptions, trends, factors, and thresholds:
2016 417 2017 389 2018 349
Year #1 Value Year #2 Value Year #3 Value
2016 9457 2017 9828 2018 93732016 2985 2017 3099 2018 2958
PediatricAdults
Individuals with Disabilities
Service Provider: Nuclear MedicineGeographic Region: Statewide
MMISData Source: Data Source Other Specify:
Describe the data sources, methodologies, baselines, assumptions, trends, factors, and thresholds:
2016 5561 2017 5755 2018 6145
Year #1 Value Year #2 Value Year #3 Value
2016 4226 2017 4476 2018 48572016 1183 2017 1120 2018 1384
PediatricAdults
Individuals with Disabilities
Service Provider: OphthalmologyGeographic Region: Health Statistic Region Grouping 1
MMISData Source: Data Source Other Specify:
Total Number of Beneficiaries Served by Enrolled Providers identified through claims data. Number of Beneficiaries Served by Health Statistic Region Grouping is based on service county location. HSR Grouping 1 - Eastern Plains includes Baca, Bent, Cheyenne, Crowley, Elbert, Huerfano, Kiowa, Kit Carson, Las Animas, Lincoln, Logan, Morgan, Otero, Phillips, Prowers, Sedgwick, Washington, and Yuma counties.
Describe the data sources, methodologies, baselines, assumptions, trends, factors, and thresholds:
2016 5895 2017 6138 2018 6010
Year #1 Value Year #2 Value Year #3 Value
2016 1548 2017 1617 2018 18252016 370 2017 337 2018 423
PediatricAdults
Individuals with Disabilities
Service Provider: OphthalmologyGeographic Region: Health Statistic Region Grouping 2
MMISData Source: Data Source Other Specify:
Total Number of Beneficiaries Served by Enrolled Providers identified through claims data. Number of Beneficiaries Served by Health Statistic Region Grouping is based on service county location. HSR Grouping 2 - Northwestern Colorado includes Eagle, Garfield, Grand, Jackson, Mesa, Moffat, Pitkin, Rio Blanco, Routt, and Summit counties.
Describe the data sources, methodologies, baselines, assumptions, trends, factors, and thresholds:
2016 32047 2017 33244 2018 34111
Year #1 Value Year #2 Value Year #3 Value
2016 20185 2017 21468 2018 224842016 5636 2017 5747 2018 6432
PediatricAdults
Individuals with Disabilities
Service Provider: Ophthalmology
Geographic Region: Health Statistic Region Grouping 3
MMISData Source: Data Source Other Specify:
Total Number of Beneficiaries Served by Enrolled Providers identified through claims data. Number of Beneficiaries Served by Health Statistic Region Grouping is based on service county location. HSR Grouping 3 - Colorado Springs/Pueblo includes Chaffee, Custer, El Paso, Fremont, Lake, and Pueblo counties.
Describe the data sources, methodologies, baselines, assumptions, trends, factors, and thresholds:
Page 51

Template 4: Physician specialist services State: Colorado
2016 5128 2017 5181 2018 5504
Year #1 Value Year #2 Value Year #3 Value
2016 4707 2017 4845 2018 54652016 977 2017 973 2018 1105
PediatricAdults
Individuals with Disabilities
Service Provider: OphthalmologyGeographic Region: Health Statistic Region Grouping 4
MMISData Source: Data Source Other Specify:
Total Number of Beneficiaries Served by Enrolled Providers identified through claims data. Number of Beneficiaries Served by Health Statistic Region Grouping is based on service county location. HSR Grouping 4 - San Luis Valley includes Alamosa, Archuleta, Conejos, Costilla, Delta, Dolores, Gunnison, Hinsdale, La Plata, Mineral, Montezuma, Montrose, Ouray, Rio Grande, Saguache, San Juan, and San Miguel counties.
Describe the data sources, methodologies, baselines, assumptions, trends, factors, and thresholds:
2016 22643 2017 22849 2018 22400
Year #1 Value Year #2 Value Year #3 Value
2016 11914 2017 12352 2018 136182016 3175 2017 3181 2018 3728
PediatricAdults
Individuals with Disabilities
Service Provider: OphthalmologyGeographic Region: Health Statistic Region Grouping 5
MMISData Source: Data Source Other Specify:
Total Number of Beneficiaries Served by Enrolled Providers identified through claims data. Number of Beneficiaries Served by Health Statistic Region Grouping is based on service county location. HSR Grouping 5 - Northern Colorado includes Boulder, Broomfield, Larimer, and Weld counties.
Describe the data sources, methodologies, baselines, assumptions, trends, factors, and thresholds:
2016 42551 2017 42886 2018 44836
Year #1 Value Year #2 Value Year #3 Value
2016 21587 2017 22423 2018 263922016 6175 2017 6389 2018 7191
PediatricAdults
Individuals with Disabilities
Service Provider: OphthalmologyGeographic Region: Health Statistic Region Grouping 6
MMISData Source: Data Source Other Specify:
Total Number of Beneficiaries Served by Enrolled Providers identified through claims data. Number of Beneficiaries Served by Health Statistic Region Grouping is based on service county location. HSR Grouping 6 - Metro Denver (North & East) includes Adams, Arapahoe, and Denver counties.
Describe the data sources, methodologies, baselines, assumptions, trends, factors, and thresholds:
2016 9948 2017 10194 2018 10703
Year #1 Value Year #2 Value Year #3 Value
2016 6816 2017 7268 2018 81022016 2100 2017 2215 2018 2603
PediatricAdults
Individuals with Disabilities
Service Provider: OphthalmologyGeographic Region: Health Statistic Region Grouping 7
MMISData Source: Data Source Other Specify:
Total Number of Beneficiaries Served by Enrolled Providers identified through claims data. Number of Beneficiaries Served by Health Statistic Region Grouping is based on service county location. HSR Grouping 7 - Metro Denver (West & South) includes Clear Creek, Douglas, Gilpin, Jefferson, Park, and Teller counties.
Describe the data sources, methodologies, baselines, assumptions, trends, factors, and thresholds:
2016 123118 2017 125732 2018 128957
Year #1 Value Year #2 Value Year #3 Value
2016 70821 2017 74331 2018 825482016 19507 2017 19885 2018 22739
PediatricAdults
Individuals with Disabilities
Service Provider: OphthalmologyGeographic Region: Statewide
MMISData Source: Data Source Other Specify:
Total Number of Beneficiaries Served by Enrolled Providers identified through claims data
Describe the data sources, methodologies, baselines, assumptions, trends, factors, and thresholds:
Page 52

Template 4: Physician specialist services State: Colorado
2016 445 2017 666 2018 758
Year #1 Value Year #2 Value Year #3 Value
2016 333 2017 333 2018 3282016 157 2017 132 2018 164
PediatricAdults
Individuals with Disabilities
Service Provider: OtolaryngologyGeographic Region: Health Statistic Region Grouping 1
MMISData Source: Data Source Other Specify:
Total Number of Beneficiaries Served by Enrolled Providers identified through claims data. Number of Beneficiaries Served by Health Statistic Region Grouping is based on service county location. HSR Grouping 1 - Eastern Plains includes Baca, Bent, Cheyenne, Crowley, Elbert, Huerfano, Kiowa, Kit Carson, Las Animas, Lincoln, Logan, Morgan, Otero, Phillips, Prowers, Sedgwick, Washington, and Yuma counties.
Describe the data sources, methodologies, baselines, assumptions, trends, factors, and thresholds:
2016 1283 2017 1043 2018 1059
Year #1 Value Year #2 Value Year #3 Value
2016 166 2017 121 2018 1492016 85 2017 78 2018 88
PediatricAdults
Individuals with Disabilities
Service Provider: OtolaryngologyGeographic Region: Health Statistic Region Grouping 2
MMISData Source: Data Source Other Specify:
Total Number of Beneficiaries Served by Enrolled Providers identified through claims data. Number of Beneficiaries Served by Health Statistic Region Grouping is based on service county location. HSR Grouping 2 - Northwestern Colorado includes Eagle, Garfield, Grand, Jackson, Mesa, Moffat, Pitkin, Rio Blanco, Routt, and Summit counties.
Describe the data sources, methodologies, baselines, assumptions, trends, factors, and thresholds:
2016 4473 2017 3604 2018 2949
Year #1 Value Year #2 Value Year #3 Value
2016 1528 2017 1359 2018 15172016 905 2017 866 2018 920
PediatricAdults
Individuals with Disabilities
Service Provider: OtolaryngologyGeographic Region: Health Statistic Region Grouping 3
MMISData Source: Data Source Other Specify:
Total Number of Beneficiaries Served by Enrolled Providers identified through claims data. Number of Beneficiaries Served by Health Statistic Region Grouping is based on service county location. HSR Grouping 3 - Colorado Springs/Pueblo includes Chaffee, Custer, El Paso, Fremont, Lake, and Pueblo counties.
Describe the data sources, methodologies, baselines, assumptions, trends, factors, and thresholds:
2016 2028 2017 2449 2018 2400
Year #1 Value Year #2 Value Year #3 Value
2016 435 2017 452 2018 4522016 150 2017 156 2018 155
PediatricAdults
Individuals with Disabilities
Service Provider: OtolaryngologyGeographic Region: Health Statistic Region Grouping 4
MMISData Source: Data Source Other Specify:
Total Number of Beneficiaries Served by Enrolled Providers identified through claims data. Number of Beneficiaries Served by Health Statistic Region Grouping is based on service county location. HSR Grouping 4 - San Luis Valley includes Alamosa, Archuleta, Conejos, Costilla, Delta, Dolores, Gunnison, Hinsdale, La Plata, Mineral, Montezuma, Montrose, Ouray, Rio Grande, Saguache, San Juan, and San Miguel counties.
Describe the data sources, methodologies, baselines, assumptions, trends, factors, and thresholds:
Page 53

Template 4: Physician specialist services State: Colorado
2016 2341 2017 2633 2018 4166
Year #1 Value Year #2 Value Year #3 Value
2016 1123 2017 1186 2018 12162016 692 2017 779 2018 918
PediatricAdults
Individuals with Disabilities
Service Provider: OtolaryngologyGeographic Region: Health Statistic Region Grouping 5
MMISData Source: Data Source Other Specify:
Total Number of Beneficiaries Served by Enrolled Providers identified through claims data. Number of Beneficiaries Served by Health Statistic Region Grouping is based on service county location. HSR Grouping 5 - Northern Colorado includes Boulder, Broomfield, Larimer, and Weld counties.
Describe the data sources, methodologies, baselines, assumptions, trends, factors, and thresholds:
2016 13918 2017 13124 2018 14787
Year #1 Value Year #2 Value Year #3 Value
2016 2746 2017 2664 2018 29522016 1690 2017 1611 2018 1898
PediatricAdults
Individuals with Disabilities
Service Provider: OtolaryngologyGeographic Region: Health Statistic Region Grouping 6
MMISData Source: Data Source Other Specify:
Total Number of Beneficiaries Served by Enrolled Providers identified through claims data. Number of Beneficiaries Served by Health Statistic Region Grouping is based on service county location. HSR Grouping 6 - Metro Denver (North & East) includes Adams, Arapahoe, and Denver counties.
Describe the data sources, methodologies, baselines, assumptions, trends, factors, and thresholds:
2016 4454 2017 4485 2018 4494
Year #1 Value Year #2 Value Year #3 Value
2016 893 2017 1016 2018 10732016 575 2017 577 2018 647
PediatricAdults
Individuals with Disabilities
Service Provider: OtolaryngologyGeographic Region: Health Statistic Region Grouping 7
MMISData Source: Data Source Other Specify:
Total Number of Beneficiaries Served by Enrolled Providers identified through claims data. Number of Beneficiaries Served by Health Statistic Region Grouping is based on service county location. HSR Grouping 7 - Metro Denver (West & South) includes Clear Creek, Douglas, Gilpin, Jefferson, Park, and Teller counties.
Describe the data sources, methodologies, baselines, assumptions, trends, factors, and thresholds:
2016 28911 2017 27994 2018 30587
Year #1 Value Year #2 Value Year #3 Value
2016 7208 2017 7125 2018 76762016 4240 2017 4182 2018 4766
PediatricAdults
Individuals with Disabilities
Service Provider: OtolaryngologyGeographic Region: Statewide
MMISData Source: Data Source Other Specify:
Total Number of Beneficiaries Served by Enrolled Providers identified through claims data
Describe the data sources, methodologies, baselines, assumptions, trends, factors, and thresholds:
2016 756 2017 943 2018 889
Year #1 Value Year #2 Value Year #3 Value
2016 1163 2017 1427 2018 16382016 401 2017 525 2018 570
PediatricAdults
Individuals with Disabilities
Service Provider: Pulmonary DiseaseGeographic Region: Health Statistic Region Grouping 1
MMISData Source: Data Source Other Specify:
Total Number of Beneficiaries Served by Enrolled Providers identified through claims data. Number of Beneficiaries Served by Health Statistic Region Grouping is based on service county location. HSR Grouping 1 - Eastern Plains includes Baca, Bent, Cheyenne, Crowley, Elbert, Huerfano, Kiowa, Kit Carson, Las Animas, Lincoln, Logan, Morgan, Otero, Phillips, Prowers, Sedgwick, Washington, and Yuma counties.
Describe the data sources, methodologies, baselines, assumptions, trends, factors, and thresholds:
Page 54

Template 4: Physician specialist services State: Colorado
2016 1941 2017 1790 2018 1543
Year #1 Value Year #2 Value Year #3 Value
2016 770 2017 765 2018 8452016 165 2017 206 2018 222
PediatricAdults
Individuals with Disabilities
Service Provider: Pulmonary DiseaseGeographic Region: Health Statistic Region Grouping 2
MMISData Source: Data Source Other Specify:
Total Number of Beneficiaries Served by Enrolled Providers identified through claims data. Number of Beneficiaries Served by Health Statistic Region Grouping is based on service county location. HSR Grouping 2 - Northwestern Colorado includes Eagle, Garfield, Grand, Jackson, Mesa, Moffat, Pitkin, Rio Blanco, Routt, and Summit counties.
Describe the data sources, methodologies, baselines, assumptions, trends, factors, and thresholds:
2016 9989 2017 10031 2018 8795
Year #1 Value Year #2 Value Year #3 Value
2016 7698 2017 9578 2018 90772016 2337 2017 3022 2018 3050
PediatricAdults
Individuals with Disabilities
Service Provider: Pulmonary DiseaseGeographic Region: Health Statistic Region Grouping 3
MMISData Source: Data Source Other Specify:
Total Number of Beneficiaries Served by Enrolled Providers identified through claims data. Number of Beneficiaries Served by Health Statistic Region Grouping is based on service county location. HSR Grouping 3 - Colorado Springs/Pueblo includes Chaffee, Custer, El Paso, Fremont, Lake, and Pueblo counties.
Describe the data sources, methodologies, baselines, assumptions, trends, factors, and thresholds:
2016 1134 2017 1254 2018 1149
Year #1 Value Year #2 Value Year #3 Value
2016 1418 2017 1695 2018 17152016 378 2017 523 2018 510
PediatricAdults
Individuals with Disabilities
Service Provider: Pulmonary DiseaseGeographic Region: Health Statistic Region Grouping 4
MMISData Source: Data Source Other Specify:
Total Number of Beneficiaries Served by Enrolled Providers identified through claims data. Number of Beneficiaries Served by Health Statistic Region Grouping is based on service county location. HSR Grouping 4 - San Luis Valley includes Alamosa, Archuleta, Conejos, Costilla, Delta, Dolores, Gunnison, Hinsdale, La Plata, Mineral, Montezuma, Montrose, Ouray, Rio Grande, Saguache, San Juan, and San Miguel counties.
Describe the data sources, methodologies, baselines, assumptions, trends, factors, and thresholds:
2016 3367 2017 4114 2018 3953
Year #1 Value Year #2 Value Year #3 Value
2016 4310 2017 5372 2018 54972016 1066 2017 1344 2018 1512
PediatricAdults
Individuals with Disabilities
Service Provider: Pulmonary DiseaseGeographic Region: Health Statistic Region Grouping 5
MMISData Source: Data Source Other Specify:
Total Number of Beneficiaries Served by Enrolled Providers identified through claims data. Number of Beneficiaries Served by Health Statistic Region Grouping is based on service county location. HSR Grouping 5 - Northern Colorado includes Boulder, Broomfield, Larimer, and Weld counties.
Describe the data sources, methodologies, baselines, assumptions, trends, factors, and thresholds:
Page 55
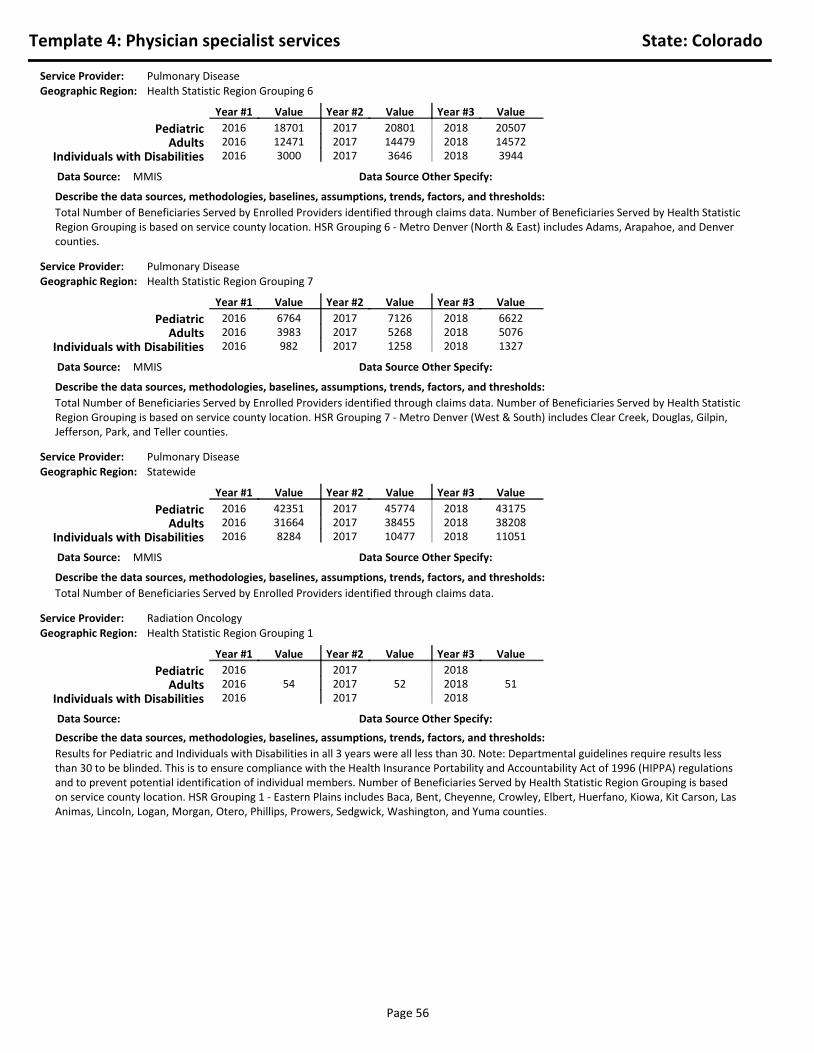
Template 4: Physician specialist services State: Colorado
2016 18701 2017 20801 2018 20507
Year #1 Value Year #2 Value Year #3 Value
2016 12471 2017 14479 2018 145722016 3000 2017 3646 2018 3944
PediatricAdults
Individuals with Disabilities
Service Provider: Pulmonary DiseaseGeographic Region: Health Statistic Region Grouping 6
MMISData Source: Data Source Other Specify:
Total Number of Beneficiaries Served by Enrolled Providers identified through claims data. Number of Beneficiaries Served by Health Statistic Region Grouping is based on service county location. HSR Grouping 6 - Metro Denver (North & East) includes Adams, Arapahoe, and Denver counties.
Describe the data sources, methodologies, baselines, assumptions, trends, factors, and thresholds:
2016 6764 2017 7126 2018 6622
Year #1 Value Year #2 Value Year #3 Value
2016 3983 2017 5268 2018 50762016 982 2017 1258 2018 1327
PediatricAdults
Individuals with Disabilities
Service Provider: Pulmonary DiseaseGeographic Region: Health Statistic Region Grouping 7
MMISData Source: Data Source Other Specify:
Total Number of Beneficiaries Served by Enrolled Providers identified through claims data. Number of Beneficiaries Served by Health Statistic Region Grouping is based on service county location. HSR Grouping 7 - Metro Denver (West & South) includes Clear Creek, Douglas, Gilpin, Jefferson, Park, and Teller counties.
Describe the data sources, methodologies, baselines, assumptions, trends, factors, and thresholds:
2016 42351 2017 45774 2018 43175
Year #1 Value Year #2 Value Year #3 Value
2016 31664 2017 38455 2018 382082016 8284 2017 10477 2018 11051
PediatricAdults
Individuals with Disabilities
Service Provider: Pulmonary DiseaseGeographic Region: Statewide
MMISData Source: Data Source Other Specify:
Total Number of Beneficiaries Served by Enrolled Providers identified through claims data.
Describe the data sources, methodologies, baselines, assumptions, trends, factors, and thresholds:
2016 2017 2018
Year #1 Value Year #2 Value Year #3 Value
2016 54 2017 52 2018 512016 2017 2018
PediatricAdults
Individuals with Disabilities
Service Provider: Radiation OncologyGeographic Region: Health Statistic Region Grouping 1
Data Source: Data Source Other Specify:
Results for Pediatric and Individuals with Disabilities in all 3 years were all less than 30. Note: Departmental guidelines require results less than 30 to be blinded. This is to ensure compliance with the Health Insurance Portability and Accountability Act of 1996 (HIPPA) regulations and to prevent potential identification of individual members. Number of Beneficiaries Served by Health Statistic Region Grouping is based on service county location. HSR Grouping 1 - Eastern Plains includes Baca, Bent, Cheyenne, Crowley, Elbert, Huerfano, Kiowa, Kit Carson, Las Animas, Lincoln, Logan, Morgan, Otero, Phillips, Prowers, Sedgwick, Washington, and Yuma counties.
Describe the data sources, methodologies, baselines, assumptions, trends, factors, and thresholds:
Page 56
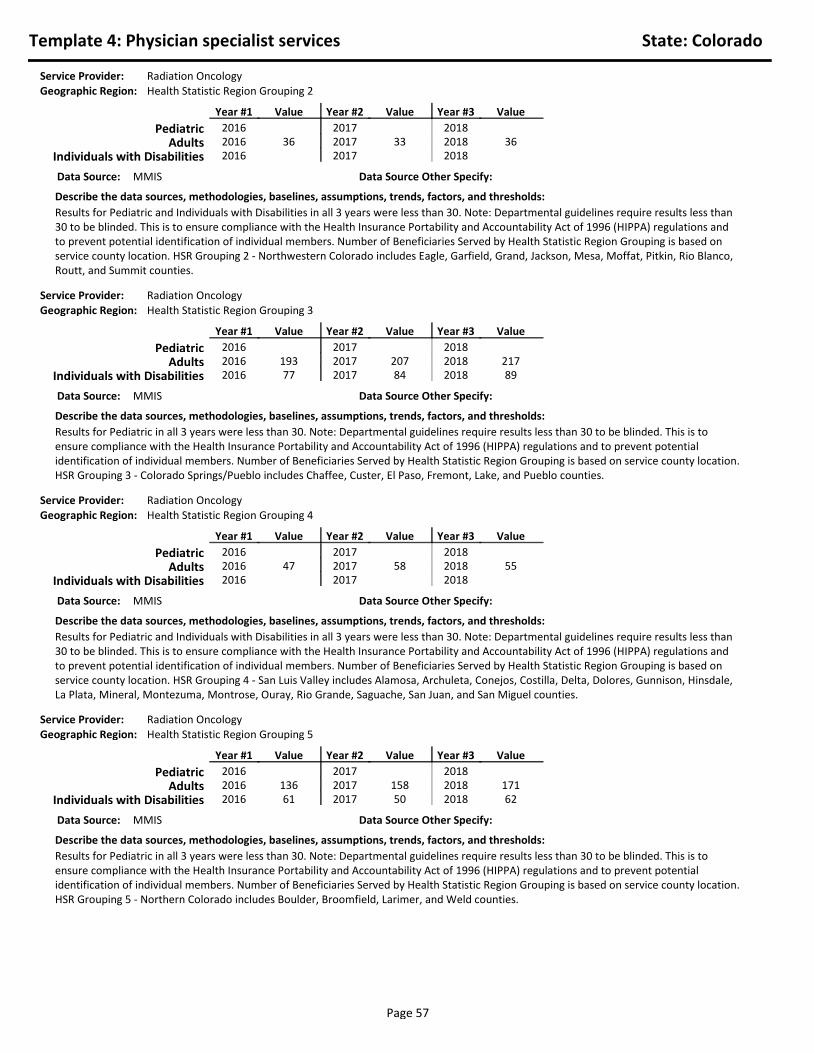
Template 4: Physician specialist services State: Colorado
2016 2017 2018
Year #1 Value Year #2 Value Year #3 Value
2016 36 2017 33 2018 362016 2017 2018
PediatricAdults
Individuals with Disabilities
Service Provider: Radiation OncologyGeographic Region: Health Statistic Region Grouping 2
MMISData Source: Data Source Other Specify:
Results for Pediatric and Individuals with Disabilities in all 3 years were less than 30. Note: Departmental guidelines require results less than 30 to be blinded. This is to ensure compliance with the Health Insurance Portability and Accountability Act of 1996 (HIPPA) regulations and to prevent potential identification of individual members. Number of Beneficiaries Served by Health Statistic Region Grouping is based on service county location. HSR Grouping 2 - Northwestern Colorado includes Eagle, Garfield, Grand, Jackson, Mesa, Moffat, Pitkin, Rio Blanco, Routt, and Summit counties.
Describe the data sources, methodologies, baselines, assumptions, trends, factors, and thresholds:
2016 2017 2018
Year #1 Value Year #2 Value Year #3 Value
2016 193 2017 207 2018 2172016 77 2017 84 2018 89
PediatricAdults
Individuals with Disabilities
Service Provider: Radiation OncologyGeographic Region: Health Statistic Region Grouping 3
MMISData Source: Data Source Other Specify:
Results for Pediatric in all 3 years were less than 30. Note: Departmental guidelines require results less than 30 to be blinded. This is to ensure compliance with the Health Insurance Portability and Accountability Act of 1996 (HIPPA) regulations and to prevent potential identification of individual members. Number of Beneficiaries Served by Health Statistic Region Grouping is based on service county location. HSR Grouping 3 - Colorado Springs/Pueblo includes Chaffee, Custer, El Paso, Fremont, Lake, and Pueblo counties.
Describe the data sources, methodologies, baselines, assumptions, trends, factors, and thresholds:
2016 2017 2018
Year #1 Value Year #2 Value Year #3 Value
2016 47 2017 58 2018 552016 2017 2018
PediatricAdults
Individuals with Disabilities
Service Provider: Radiation Oncology
Geographic Region: Health Statistic Region Grouping 4
MMISData Source: Data Source Other Specify:
Results for Pediatric and Individuals with Disabilities in all 3 years were less than 30. Note: Departmental guidelines require results less than 30 to be blinded. This is to ensure compliance with the Health Insurance Portability and Accountability Act of 1996 (HIPPA) regulations and to prevent potential identification of individual members. Number of Beneficiaries Served by Health Statistic Region Grouping is based on service county location. HSR Grouping 4 - San Luis Valley includes Alamosa, Archuleta, Conejos, Costilla, Delta, Dolores, Gunnison, Hinsdale, La Plata, Mineral, Montezuma, Montrose, Ouray, Rio Grande, Saguache, San Juan, and San Miguel counties.
Describe the data sources, methodologies, baselines, assumptions, trends, factors, and thresholds:
2016 2017 2018
Year #1 Value Year #2 Value Year #3 Value
2016 136 2017 158 2018 1712016 61 2017 50 2018 62
PediatricAdults
Individuals with Disabilities
Service Provider: Radiation OncologyGeographic Region: Health Statistic Region Grouping 5
MMISData Source: Data Source Other Specify:
Results for Pediatric in all 3 years were less than 30. Note: Departmental guidelines require results less than 30 to be blinded. This is to ensure compliance with the Health Insurance Portability and Accountability Act of 1996 (HIPPA) regulations and to prevent potential identification of individual members. Number of Beneficiaries Served by Health Statistic Region Grouping is based on service county location. HSR Grouping 5 - Northern Colorado includes Boulder, Broomfield, Larimer, and Weld counties.
Describe the data sources, methodologies, baselines, assumptions, trends, factors, and thresholds:
Page 57

Template 4: Physician specialist services State: Colorado
2016 2017 2018
Year #1 Value Year #2 Value Year #3 Value
2016 331 2017 336 2018 3332016 99 2017 110 2018 125
PediatricAdults
Individuals with Disabilities
Service Provider: Radiation OncologyGeographic Region: Health Statistic Region Grouping 6
MMISData Source: Data Source Other Specify:
Results for Pediatric in all 3 years were less than 30. Note: Departmental guidelines require results less than 30 to be blinded. This is to ensure compliance with the Health Insurance Portability and Accountability Act of 1996 (HIPPA) regulations and to prevent potential identification of individual members. Number of Beneficiaries Served by Health Statistic Region Grouping is based on service county location. HSR Grouping 6 - Metro Denver (North & East) includes Adams, Arapahoe, and Denver counties.
Describe the data sources, methodologies, baselines, assumptions, trends, factors, and thresholds:
2016 2017 2018
Year #1 Value Year #2 Value Year #3 Value
2016 106 2017 117 2018 1302016 2017 38 2018 44
PediatricAdults
Individuals with Disabilities
Service Provider: Radiation OncologyGeographic Region: Health Statistic Region Grouping 7
MMISData Source: Data Source Other Specify:
Results for Pediatric in all 3 years and Individuals with Disabilities in 2016 were less than 30. Note: Departmental guidelines require results less than 30 to be blinded. This is to ensure compliance with the Health Insurance Portability and Accountability Act of 1996 (HIPPA) regulations and to prevent potential identification of individual members. Number of Beneficiaries Served by Health Statistic Region Grouping is based on service county location. HSR Grouping 7 - Metro Denver (West & South) includes Clear Creek, Douglas, Gilpin, Jefferson, Park, and Teller counties.
Describe the data sources, methodologies, baselines, assumptions, trends, factors, and thresholds:
2016 2017 35 2018 31
Year #1 Value Year #2 Value Year #3 Value
2016 900 2017 954 2018 9862016 310 2017 328 2018 368
PediatricAdults
Individuals with Disabilities
Service Provider: Radiation Oncology
Geographic Region: Statewide
MMISData Source: Data Source Other Specify:
Results for Pediatric in Radiation Oncology in 2016 were less than 30. Note: Departmental guidelines require results less than 30 to be blinded. This is to ensure compliance with the Health Insurance Portability and Accountability Act of 1996 (HIPPA) regulations and to prevent potential identification of individual members.
Describe the data sources, methodologies, baselines, assumptions, trends, factors, and thresholds:
2016 38 2017 66 2018 71
Year #1 Value Year #2 Value Year #3 Value
2016 348 2017 369 2018 4712016 146 2017 175 2018 164
PediatricAdults
Individuals with Disabilities
Service Provider: UrologyGeographic Region: Health Statistic Region Grouping 1
MMISData Source: Data Source Other Specify:
Total Number of Beneficiaries Served by Enrolled Providers identified through claims data. Number of Beneficiaries Served by Health Statistic Region Grouping is based on service county location. HSR Grouping 1 - Eastern Plains includes Baca, Bent, Cheyenne, Crowley, Elbert, Huerfano, Kiowa, Kit Carson, Las Animas, Lincoln, Logan, Morgan, Otero, Phillips, Prowers, Sedgwick, Washington, and Yuma counties.
Describe the data sources, methodologies, baselines, assumptions, trends, factors, and thresholds:
Page 58

Template 4: Physician specialist services State: Colorado
2016 97 2017 114 2018 112
Year #1 Value Year #2 Value Year #3 Value
2016 220 2017 202 2018 2292016 76 2017 48 2018 70
PediatricAdults
Individuals with Disabilities
Service Provider: UrologyGeographic Region: Health Statistic Region Grouping 2
MMISData Source: Data Source Other Specify:
Total Number of Beneficiaries Served by Enrolled Providers identified through claims data. Number of Beneficiaries Served by Health Statistic Region Grouping is based on service county location. HSR Grouping 2 - Northwestern Colorado includes Eagle, Garfield, Grand, Jackson, Mesa, Moffat, Pitkin, Rio Blanco, Routt, and Summit counties.
Describe the data sources, methodologies, baselines, assumptions, trends, factors, and thresholds:
2016 172 2017 358 2018 382
Year #1 Value Year #2 Value Year #3 Value
2016 1474 2017 1723 2018 16902016 563 2017 680 2018 719
PediatricAdults
Individuals with Disabilities
Service Provider: UrologyGeographic Region: Health Statistic Region Grouping 3
MMISData Source: Data Source Other Specify:
Total Number of Beneficiaries Served by Enrolled Providers identified through claims data. Number of Beneficiaries Served by Health Statistic Region Grouping is based on service county location. HSR Grouping 3 - Colorado Springs/Pueblo includes Chaffee, Custer, El Paso, Fremont, Lake, and Pueblo counties.
Describe the data sources, methodologies, baselines, assumptions, trends, factors, and thresholds:
2016 74 2017 89 2018 80
Year #1 Value Year #2 Value Year #3 Value
2016 419 2017 473 2018 5272016 124 2017 153 2018 186
PediatricAdults
Individuals with Disabilities
Service Provider: UrologyGeographic Region: Health Statistic Region Grouping 4
MMISData Source: Data Source Other Specify:
Total Number of Beneficiaries Served by Enrolled Providers identified through claims data. Number of Beneficiaries Served by Health Statistic Region Grouping is based on service county location. HSR Grouping 4 - San Luis Valley includes Alamosa, Archuleta, Conejos, Costilla, Delta, Dolores, Gunnison, Hinsdale, La Plata, Mineral, Montezuma, Montrose, Ouray, Rio Grande, Saguache, San Juan, and San Miguel counties.
Describe the data sources, methodologies, baselines, assumptions, trends, factors, and thresholds:
2016 161 2017 246 2018 251
Year #1 Value Year #2 Value Year #3 Value
2016 998 2017 1224 2018 12552016 359 2017 402 2018 444
PediatricAdults
Individuals with Disabilities
Service Provider: UrologyGeographic Region: Health Statistic Region Grouping 5
MMISData Source: Data Source Other Specify:
Total Number of Beneficiaries Served by Enrolled Providers identified through claims data. Number of Beneficiaries Served by Health Statistic Region Grouping is based on service county location. HSR Grouping 5 - Northern Colorado includes Boulder, Broomfield, Larimer, and Weld counties.
Describe the data sources, methodologies, baselines, assumptions, trends, factors, and thresholds:
Page 59

Template 4: Physician specialist services State: Colorado
2016 449 2017 562 2018 575
Year #1 Value Year #2 Value Year #3 Value
2016 2009 2017 2414 2018 25612016 708 2017 853 2018 966
PediatricAdults
Individuals with Disabilities
Service Provider: UrologyGeographic Region: Health Statistic Region Grouping 6
MMISData Source: Data Source Other Specify:
Total Number of Beneficiaries Served by Enrolled Providers identified through claims data. Number of Beneficiaries Served by Health Statistic Region Grouping is based on service county location. HSR Grouping 6 - Metro Denver (North & East) includes Adams, Arapahoe, and Denver counties.
Describe the data sources, methodologies, baselines, assumptions, trends, factors, and thresholds:
2016 122 2017 195 2018 162
Year #1 Value Year #2 Value Year #3 Value
2016 764 2017 921 2018 8782016 256 2017 308 2018 364
PediatricAdults
Individuals with Disabilities
Service Provider: UrologyGeographic Region: Health Statistic Region Grouping 7
MMISData Source: Data Source Other Specify:
Total Number of Beneficiaries Served by Enrolled Providers identified through claims data. Number of Beneficiaries Served by Health Statistic Region Grouping is based on service county location. HSR Grouping 7 - Metro Denver (West & South) includes Clear Creek, Douglas, Gilpin, Jefferson, Park, and Teller counties.
Describe the data sources, methodologies, baselines, assumptions, trends, factors, and thresholds:
2016 1110 2017 1627 2018 1629
Year #1 Value Year #2 Value Year #3 Value
2016 6211 2017 7301 2018 75752016 2220 2017 2610 2018 2885
PediatricAdults
Individuals with Disabilities
Service Provider: UrologyGeographic Region: Statewide
MMISData Source: Data Source Other Specify:
Total Number of Beneficiaries Served by Enrolled Providers identified through claims data
Describe the data sources, methodologies, baselines, assumptions, trends, factors, and thresholds:
2016 56 2017 57 2018 57
Year #1 Value Year #2 Value Year #3 Value
2016 1133 2017 1135 2018 11532016 339 2017 359 2018 369
PediatricAdults
Individuals with Disabilities
Service Provider: Vascular SurgeryGeographic Region: Health Statistic Region Grouping 1
MMISData Source: Data Source Other Specify:
Total Number of Beneficiaries Served by Enrolled Providers identified through claims data. Number of Beneficiaries Served by Health Statistic Region Grouping is based on service county location. HSR Grouping 1 - Eastern Plains includes Baca, Bent, Cheyenne, Crowley, Elbert, Huerfano, Kiowa, Kit Carson, Las Animas, Lincoln, Logan, Morgan, Otero, Phillips, Prowers, Sedgwick, Washington, and Yuma counties.
Describe the data sources, methodologies, baselines, assumptions, trends, factors, and thresholds:
2016 43 2017 55 2018 57
Year #1 Value Year #2 Value Year #3 Value
2016 402 2017 431 2018 4402016 110 2017 121 2018 107
PediatricAdults
Individuals with Disabilities
Service Provider: Vascular SurgeryGeographic Region: Health Statistic Region Grouping 2
MMISData Source: Data Source Other Specify:
Total Number of Beneficiaries Served by Enrolled Providers identified through claims data. Number of Beneficiaries Served by Health Statistic Region Grouping is based on service county location. HSR Grouping 2 - Northwestern Colorado includes Eagle, Garfield, Grand, Jackson, Mesa, Moffat, Pitkin, Rio Blanco, Routt, and Summit counties.
Describe the data sources, methodologies, baselines, assumptions, trends, factors, and thresholds:
Page 60
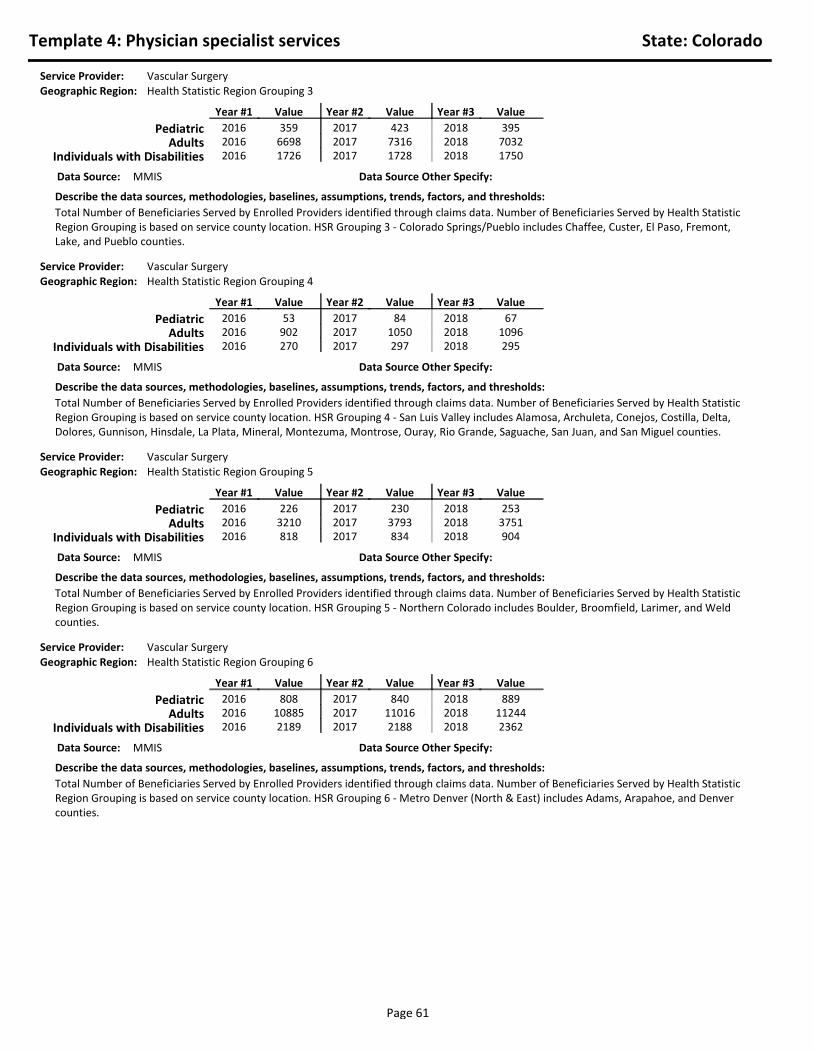
Template 4: Physician specialist services State: Colorado
2016 359 2017 423 2018 395
Year #1 Value Year #2 Value Year #3 Value
2016 6698 2017 7316 2018 70322016 1726 2017 1728 2018 1750
PediatricAdults
Individuals with Disabilities
Service Provider: Vascular SurgeryGeographic Region: Health Statistic Region Grouping 3
MMISData Source: Data Source Other Specify:
Total Number of Beneficiaries Served by Enrolled Providers identified through claims data. Number of Beneficiaries Served by Health Statistic Region Grouping is based on service county location. HSR Grouping 3 - Colorado Springs/Pueblo includes Chaffee, Custer, El Paso, Fremont, Lake, and Pueblo counties.
Describe the data sources, methodologies, baselines, assumptions, trends, factors, and thresholds:
2016 53 2017 84 2018 67
Year #1 Value Year #2 Value Year #3 Value
2016 902 2017 1050 2018 10962016 270 2017 297 2018 295
PediatricAdults
Individuals with Disabilities
Service Provider: Vascular SurgeryGeographic Region: Health Statistic Region Grouping 4
MMISData Source: Data Source Other Specify:
Total Number of Beneficiaries Served by Enrolled Providers identified through claims data. Number of Beneficiaries Served by Health Statistic Region Grouping is based on service county location. HSR Grouping 4 - San Luis Valley includes Alamosa, Archuleta, Conejos, Costilla, Delta, Dolores, Gunnison, Hinsdale, La Plata, Mineral, Montezuma, Montrose, Ouray, Rio Grande, Saguache, San Juan, and San Miguel counties.
Describe the data sources, methodologies, baselines, assumptions, trends, factors, and thresholds:
2016 226 2017 230 2018 253
Year #1 Value Year #2 Value Year #3 Value
2016 3210 2017 3793 2018 37512016 818 2017 834 2018 904
PediatricAdults
Individuals with Disabilities
Service Provider: Vascular SurgeryGeographic Region: Health Statistic Region Grouping 5
MMISData Source: Data Source Other Specify:
Total Number of Beneficiaries Served by Enrolled Providers identified through claims data. Number of Beneficiaries Served by Health Statistic Region Grouping is based on service county location. HSR Grouping 5 - Northern Colorado includes Boulder, Broomfield, Larimer, and Weld counties.
Describe the data sources, methodologies, baselines, assumptions, trends, factors, and thresholds:
2016 808 2017 840 2018 889
Year #1 Value Year #2 Value Year #3 Value
2016 10885 2017 11016 2018 112442016 2189 2017 2188 2018 2362
PediatricAdults
Individuals with Disabilities
Service Provider: Vascular SurgeryGeographic Region: Health Statistic Region Grouping 6
MMISData Source: Data Source Other Specify:
Total Number of Beneficiaries Served by Enrolled Providers identified through claims data. Number of Beneficiaries Served by Health Statistic Region Grouping is based on service county location. HSR Grouping 6 - Metro Denver (North & East) includes Adams, Arapahoe, and Denver counties.
Describe the data sources, methodologies, baselines, assumptions, trends, factors, and thresholds:
Page 61
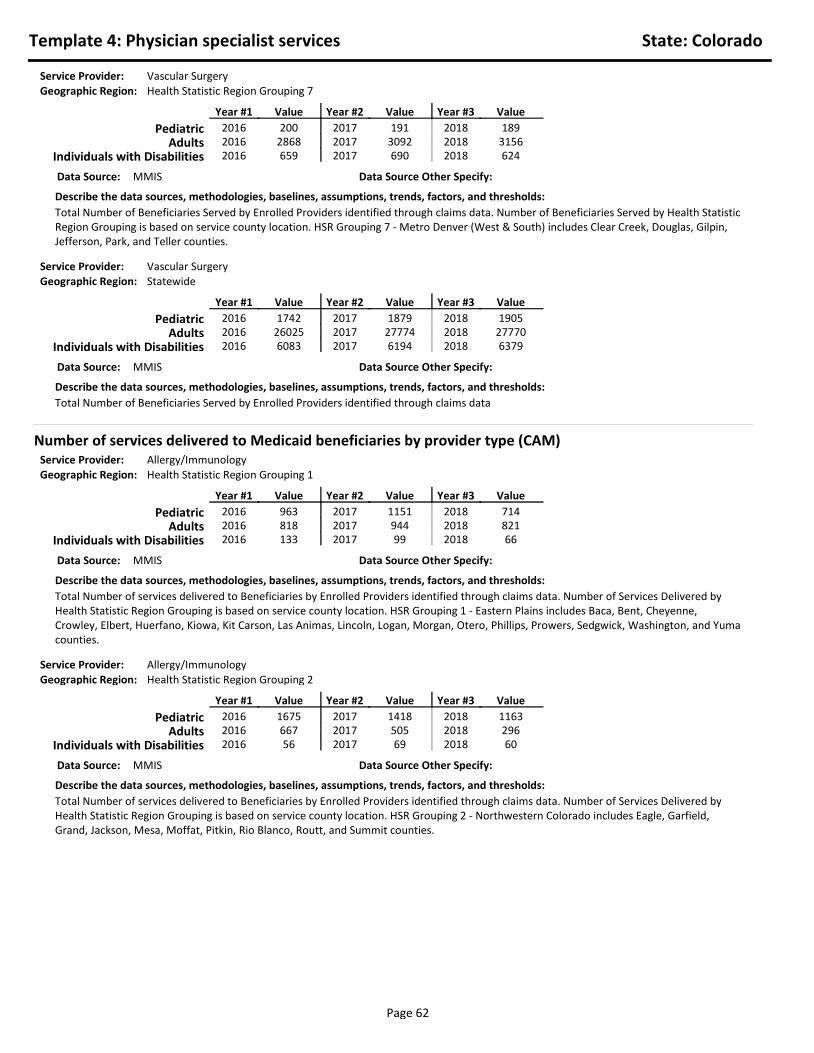
Template 4: Physician specialist services State: Colorado
2016 200 2017 191 2018 189
Year #1 Value Year #2 Value Year #3 Value
2016 2868 2017 3092 2018 31562016 659 2017 690 2018 624
PediatricAdults
Individuals with Disabilities
Service Provider: Vascular SurgeryGeographic Region: Health Statistic Region Grouping 7
MMISData Source: Data Source Other Specify:
Total Number of Beneficiaries Served by Enrolled Providers identified through claims data. Number of Beneficiaries Served by Health Statistic Region Grouping is based on service county location. HSR Grouping 7 - Metro Denver (West & South) includes Clear Creek, Douglas, Gilpin, Jefferson, Park, and Teller counties.
Describe the data sources, methodologies, baselines, assumptions, trends, factors, and thresholds:
2016 1742 2017 1879 2018 1905
Year #1 Value Year #2 Value Year #3 Value
2016 26025 2017 27774 2018 277702016 6083 2017 6194 2018 6379
PediatricAdults
Individuals with Disabilities
Service Provider: Vascular SurgeryGeographic Region: Statewide
MMISData Source: Data Source Other Specify:
Total Number of Beneficiaries Served by Enrolled Providers identified through claims data
Describe the data sources, methodologies, baselines, assumptions, trends, factors, and thresholds:
Number of services delivered to Medicaid beneficiaries by provider type (CAM)
2016 963 2017 1151 2018 714
Year #1 Value Year #2 Value Year #3 Value
2016 818 2017 944 2018 8212016 133 2017 99 2018 66
PediatricAdults
Individuals with Disabilities
Service Provider: Allergy/Immunology
Geographic Region: Health Statistic Region Grouping 1
MMISData Source: Data Source Other Specify:
Total Number of services delivered to Beneficiaries by Enrolled Providers identified through claims data. Number of Services Delivered by Health Statistic Region Grouping is based on service county location. HSR Grouping 1 - Eastern Plains includes Baca, Bent, Cheyenne, Crowley, Elbert, Huerfano, Kiowa, Kit Carson, Las Animas, Lincoln, Logan, Morgan, Otero, Phillips, Prowers, Sedgwick, Washington, and Yuma counties.
Describe the data sources, methodologies, baselines, assumptions, trends, factors, and thresholds:
2016 1675 2017 1418 2018 1163
Year #1 Value Year #2 Value Year #3 Value
2016 667 2017 505 2018 2962016 56 2017 69 2018 60
PediatricAdults
Individuals with Disabilities
Service Provider: Allergy/Immunology
Geographic Region: Health Statistic Region Grouping 2
MMISData Source: Data Source Other Specify:
Total Number of services delivered to Beneficiaries by Enrolled Providers identified through claims data. Number of Services Delivered by Health Statistic Region Grouping is based on service county location. HSR Grouping 2 - Northwestern Colorado includes Eagle, Garfield, Grand, Jackson, Mesa, Moffat, Pitkin, Rio Blanco, Routt, and Summit counties.
Describe the data sources, methodologies, baselines, assumptions, trends, factors, and thresholds:
Page 62
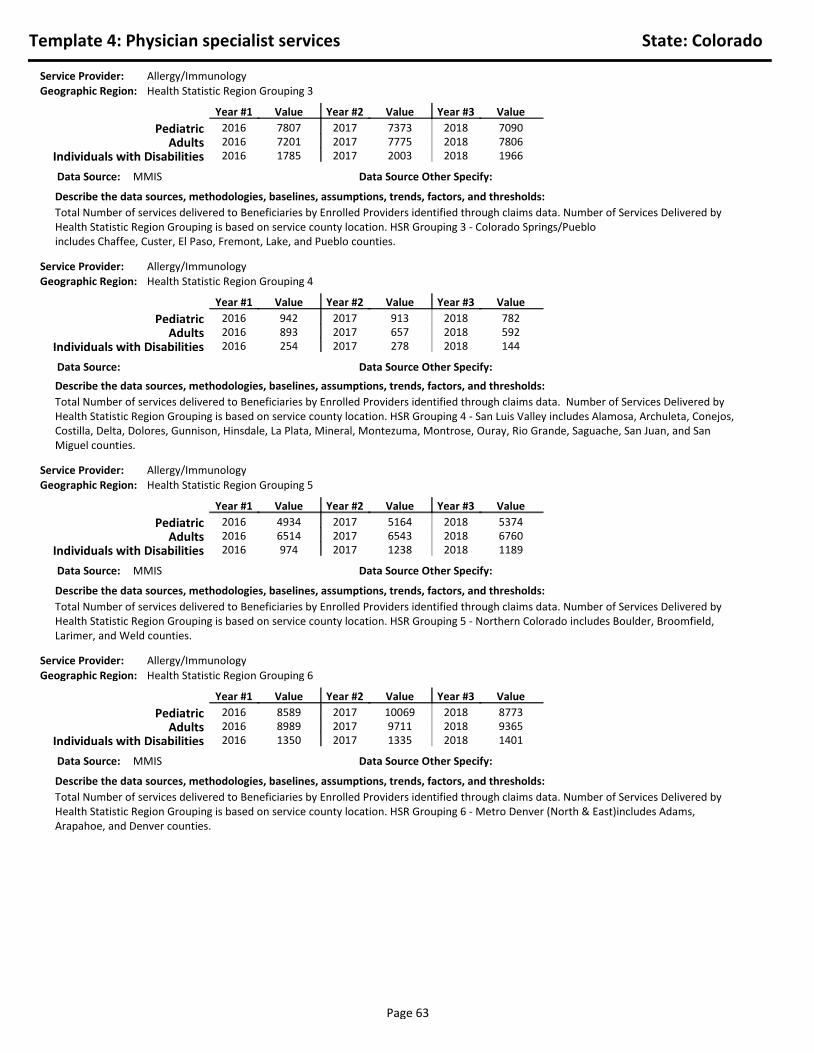
Template 4: Physician specialist services State: Colorado
2016 7807 2017 7373 2018 7090
Year #1 Value Year #2 Value Year #3 Value
2016 7201 2017 7775 2018 78062016 1785 2017 2003 2018 1966
PediatricAdults
Individuals with Disabilities
Service Provider: Allergy/ImmunologyGeographic Region: Health Statistic Region Grouping 3
MMISData Source: Data Source Other Specify:
Total Number of services delivered to Beneficiaries by Enrolled Providers identified through claims data. Number of Services Delivered by Health Statistic Region Grouping is based on service county location. HSR Grouping 3 - Colorado Springs/Puebloincludes Chaffee, Custer, El Paso, Fremont, Lake, and Pueblo counties.
Describe the data sources, methodologies, baselines, assumptions, trends, factors, and thresholds:
2016 942 2017 913 2018 782
Year #1 Value Year #2 Value Year #3 Value
2016 893 2017 657 2018 5922016 254 2017 278 2018 144
PediatricAdults
Individuals with Disabilities
Service Provider: Allergy/ImmunologyGeographic Region: Health Statistic Region Grouping 4
Data Source: Data Source Other Specify:
Total Number of services delivered to Beneficiaries by Enrolled Providers identified through claims data. Number of Services Delivered by Health Statistic Region Grouping is based on service county location. HSR Grouping 4 - San Luis Valley includes Alamosa, Archuleta, Conejos, Costilla, Delta, Dolores, Gunnison, Hinsdale, La Plata, Mineral, Montezuma, Montrose, Ouray, Rio Grande, Saguache, San Juan, and San Miguel counties.
Describe the data sources, methodologies, baselines, assumptions, trends, factors, and thresholds:
2016 4934 2017 5164 2018 5374
Year #1 Value Year #2 Value Year #3 Value
2016 6514 2017 6543 2018 67602016 974 2017 1238 2018 1189
PediatricAdults
Individuals with Disabilities
Service Provider: Allergy/ImmunologyGeographic Region: Health Statistic Region Grouping 5
MMISData Source: Data Source Other Specify:
Total Number of services delivered to Beneficiaries by Enrolled Providers identified through claims data. Number of Services Delivered by Health Statistic Region Grouping is based on service county location. HSR Grouping 5 - Northern Colorado includes Boulder, Broomfield, Larimer, and Weld counties.
Describe the data sources, methodologies, baselines, assumptions, trends, factors, and thresholds:
2016 8589 2017 10069 2018 8773
Year #1 Value Year #2 Value Year #3 Value
2016 8989 2017 9711 2018 93652016 1350 2017 1335 2018 1401
PediatricAdults
Individuals with Disabilities
Service Provider: Allergy/Immunology
Geographic Region: Health Statistic Region Grouping 6
MMISData Source: Data Source Other Specify:
Total Number of services delivered to Beneficiaries by Enrolled Providers identified through claims data. Number of Services Delivered by Health Statistic Region Grouping is based on service county location. HSR Grouping 6 - Metro Denver (North & East)includes Adams, Arapahoe, and Denver counties.
Describe the data sources, methodologies, baselines, assumptions, trends, factors, and thresholds:
Page 63

Template 4: Physician specialist services State: Colorado
2016 2374 2017 2656 2018 2231
Year #1 Value Year #2 Value Year #3 Value
2016 3454 2017 4436 2018 46192016 468 2017 430 2018 582
PediatricAdults
Individuals with Disabilities
Service Provider: Allergy/ImmunologyGeographic Region: Health Statistic Region Grouping 7
MMISData Source: Data Source Other Specify:
Total Number of services delivered to Beneficiaries by Enrolled Providers identified through claims data. Number of Services Delivered by Health Statistic Region Grouping is based on service county location. HSR Grouping 7 - Metro Denver (West & South) includes Clear Creek, Douglas, Gilpin, Jefferson, Park, and Teller counties.
Describe the data sources, methodologies, baselines, assumptions, trends, factors, and thresholds:
2016 27284 2017 28747 2018 26128
Year #1 Value Year #2 Value Year #3 Value
2016 28536 2017 30571 2018 302592016 5020 2017 5453 2018 5408
PediatricAdults
Individuals with Disabilities
Service Provider: Allergy/ImmunologyGeographic Region: Statewide
Data Source: Data Source Other Specify:
Total Number of services delivered to Beneficiaries by Enrolled Providers identified through claims data
Describe the data sources, methodologies, baselines, assumptions, trends, factors, and thresholds:
2016 863 2017 1112 2018 1072
Year #1 Value Year #2 Value Year #3 Value
2016 10211 2017 12055 2018 120052016 3561 2017 4135 2018 4121
PediatricAdults
Individuals with Disabilities
Service Provider: CardiologyGeographic Region: Health Statistic Region Grouping 1
MMISData Source: Data Source Other Specify:
Total Number of services delivered to Beneficiaries by Enrolled Providers identified through claims data. Number of Services Delivered by Health Statistic Region Grouping is based on service county location. HSR Grouping 1 - Eastern Plains includes Baca, Bent, Cheyenne, Crowley, Elbert, Huerfano, Kiowa, Kit Carson, Las Animas, Lincoln, Logan, Morgan, Otero, Phillips, Prowers, Sedgwick, Washington, and Yuma counties.
Describe the data sources, methodologies, baselines, assumptions, trends, factors, and thresholds:
2016 1238 2017 1087 2018 1071
Year #1 Value Year #2 Value Year #3 Value
2016 4011 2017 4174 2018 47882016 1082 2017 1276 2018 1328
PediatricAdults
Individuals with Disabilities
Service Provider: CardiologyGeographic Region: Health Statistic Region Grouping 2
MMISData Source: Data Source Other Specify:
Total Number of services delivered to Beneficiaries by Enrolled Providers identified through claims data. Number of Services Delivered by Health Statistic Region Grouping is based on service county location. HSR Grouping 2 - Northwestern Colorado includes Eagle, Garfield, Grand, Jackson, Mesa, Moffat, Pitkin, Rio Blanco, Routt, and Summit counties.
Describe the data sources, methodologies, baselines, assumptions, trends, factors, and thresholds:
Page 64

Template 4: Physician specialist services State: Colorado
2016 4113 2017 5283 2018 5591
Year #1 Value Year #2 Value Year #3 Value
2016 44506 2017 59151 2018 621222016 13766 2017 19351 2018 21167
PediatricAdults
Individuals with Disabilities
Service Provider: CardiologyGeographic Region: Health Statistic Region Grouping 3
MMISData Source: Data Source Other Specify:
Total Number of services delivered to Beneficiaries by Enrolled Providers identified through claims data. Number of Services Delivered by Health Statistic Region Grouping is based on service county location. HSR Grouping 3 - Colorado Springs/Pueblo includes Chaffee, Custer, El Paso, Fremont, Lake, and Pueblo counties.
Describe the data sources, methodologies, baselines, assumptions, trends, factors, and thresholds:
2016 825 2017 1016 2018 1028
Year #1 Value Year #2 Value Year #3 Value
2016 8949 2017 10840 2018 114992016 3009 2017 3173 2018 3348
PediatricAdults
Individuals with Disabilities
Service Provider: CardiologyGeographic Region: Health Statistic Region Grouping 4
MMISData Source: Data Source Other Specify:
Total Number of services delivered to Beneficiaries by Enrolled Providers identified through claims data. Number of Services Delivered by Health Statistic Region Grouping is based on service county location. HSR Grouping 4 - San Luis Valley includes Alamosa, Archuleta, Conejos, Costilla, Delta, Dolores, Gunnison, Hinsdale, La Plata, Mineral, Montezuma, Montrose, Ouray, Rio Grande, Saguache, San Juan, and San Miguel counties.
Describe the data sources, methodologies, baselines, assumptions, trends, factors, and thresholds:
2016 3613 2017 4300 2018 4338
Year #1 Value Year #2 Value Year #3 Value
2016 36407 2017 39399 2018 397202016 10461 2017 11575 2018 12131
PediatricAdults
Individuals with Disabilities
Service Provider: CardiologyGeographic Region: Health Statistic Region Grouping 5
MMISData Source: Data Source Other Specify:
Total Number of services delivered to Beneficiaries by Enrolled Providers identified through claims data. Number of Services Delivered by Health Statistic Region Grouping is based on service county location. HSR Grouping 5 - Northern Colorado includes Boulder, Broomfield, Larimer, and Weld counties.
Describe the data sources, methodologies, baselines, assumptions, trends, factors, and thresholds:
2016 7597 2017 10323 2018 10166
Year #1 Value Year #2 Value Year #3 Value
2016 96456 2017 100222 2018 1004072016 26531 2017 28914 2018 29428
PediatricAdults
Individuals with Disabilities
Service Provider: Cardiology
Geographic Region: Health Statistic Region Grouping 6
MMISData Source: Data Source Other Specify:
Total Number of services delivered to Beneficiaries by Enrolled Providers identified through claims data. Number of Services Delivered by Health Statistic Region Grouping is based on service county location. HSR Grouping 6 - Metro Denver (North & East) includes Adams, Arapahoe, and Denver counties.
Describe the data sources, methodologies, baselines, assumptions, trends, factors, and thresholds:
Page 65

Template 4: Physician specialist services State: Colorado
2016 2025 2017 2931 2018 2533
Year #1 Value Year #2 Value Year #3 Value
2016 26456 2017 29610 2018 3040402016 6646 2017 8063 2018 7750
PediatricAdults
Individuals with Disabilities
Service Provider: CardiologyGeographic Region: Health Statistic Region Grouping 7
MMISData Source: Data Source Other Specify:
Total Number of services delivered to Beneficiaries by Enrolled Providers identified through claims data. Number of Services Delivered by Health Statistic Region Grouping is based on service county location. HSR Grouping 7 - Metro Denver (West & South) includes Clear Creek, Douglas, Gilpin, Jefferson, Park, and Teller counties.
Describe the data sources, methodologies, baselines, assumptions, trends, factors, and thresholds:
2016 20274 2017 26057 2018 25804
Year #1 Value Year #2 Value Year #3 Value
2016 226995 2017 255487 2018 2609532016 65057 2017 76510 2018 79280
PediatricAdults
Individuals with Disabilities
Service Provider: CardiologyGeographic Region: Statewide
MMISData Source: Data Source Other Specify:
Total Number of services delivered to Beneficiaries by Enrolled Providers identified through claims data
Describe the data sources, methodologies, baselines, assumptions, trends, factors, and thresholds:
2016 127 2017 171 2018 181
Year #1 Value Year #2 Value Year #3 Value
2016 253 2017 243 2018 3052016 73 2017 135 2018 69
PediatricAdults
Individuals with Disabilities
Service Provider: DermatologyGeographic Region: Health Statistic Region Grouping 3
MMISData Source: Data Source Other Specify:
Total Number of services delivered to Beneficiaries by Enrolled Providers identified through claims data. Number of Services Delivered by Health Statistic Region Grouping is based on service county location. HSR Grouping 3 - Colorado Springs/Pueblo includes Chaffee, Custer, El Paso, Fremont, Lake, and Pueblo counties.
Describe the data sources, methodologies, baselines, assumptions, trends, factors, and thresholds:
2016 53 2017 41 2018 77
Year #1 Value Year #2 Value Year #3 Value
2016 31 2017 20182016 2017 2018
PediatricAdults
Individuals with Disabilities
Service Provider: DermatologyGeographic Region: Health Statistic Region Grouping 4
MMISData Source: Data Source Other Specify:
Results for Dermatology were less than 30 for all fields, except results for Pediatric and Adults in 2016. Note: Departmental guidelines require results less than 30 to be blinded. This is to ensure compliance with the Health Insurance Portability and Accountability Act of 1996 (HIPPA) regulations and to prevent potential identification of individual members. Number of Services Delivered by Health Statistic Region Grouping is based on service county location. HSR Grouping 4 - San Luis Valley includes Alamosa, Archuleta, Conejos, Costilla, Delta, Dolores, Gunnison, Hinsdale, La Plata, Mineral, Montezuma, Montrose, Ouray, Rio Grande, Saguache, San Juan, and San Miguel counties.
Describe the data sources, methodologies, baselines, assumptions, trends, factors, and thresholds:
Page 66

Template 4: Physician specialist services State: Colorado
2016 377 2017 442 2018 153
Year #1 Value Year #2 Value Year #3 Value
2016 319 2017 487 2018 1952016 64 2017 34 2018 75
PediatricAdults
Individuals with Disabilities
Service Provider: DermatologyGeographic Region: Health Statistic Region Grouping 5
MMISData Source: Data Source Other Specify:
Total Number of services delivered to Beneficiaries by Enrolled Providers identified through claims data. Number of Services Delivered by Health Statistic Region Grouping is based on service county location. HSR Grouping 5 - Northern Colorado includes Boulder, Broomfield, Larimer, and Weld counties.
Describe the data sources, methodologies, baselines, assumptions, trends, factors, and thresholds:
2016 400 2017 1097 2018 1325
Year #1 Value Year #2 Value Year #3 Value
2016 1133 2017 1010 2018 7852016 252 2017 142 2018 201
PediatricAdults
Individuals with Disabilities
Service Provider: DermatologyGeographic Region: Health Statistic Region Grouping 6
MMISData Source: Data Source Other Specify:
Total Number of services delivered to Beneficiaries by Enrolled Providers identified through claims data. Number of Services Delivered by Health Statistic Region Grouping is based on service county location. HSR Grouping 6 - Metro Denver (North & East) includes Adams, Arapahoe, and Denver counties.
Describe the data sources, methodologies, baselines, assumptions, trends, factors, and thresholds:
2016 38 2017 197 2018 163
Year #1 Value Year #2 Value Year #3 Value
2016 191 2017 182 2018 1322016 136 2017 83 2018 35
PediatricAdults
Individuals with Disabilities
Service Provider: DermatologyGeographic Region: Health Statistic Region Grouping 7
MMISData Source: Data Source Other Specify:
Total Number of services delivered to Beneficiaries by Enrolled Providers identified through claims data. Number of Services Delivered by Health Statistic Region Grouping is based on service county location. HSR Grouping 7 - Metro Denver (West & South) includes Clear Creek, Douglas, Gilpin, Jefferson, Park, and Teller counties.
Describe the data sources, methodologies, baselines, assumptions, trends, factors, and thresholds:
2016 1012 2017 2025 2018 1965
Year #1 Value Year #2 Value Year #3 Value
2016 1934 2017 1935 2018 14922016 544 2017 420 2018 400
PediatricAdults
Individuals with Disabilities
Service Provider: DermatologyGeographic Region: Statewide
MMISData Source: Data Source Other Specify:
Total Number of services delivered to Beneficiaries by Enrolled Providers identified through claims data
Describe the data sources, methodologies, baselines, assumptions, trends, factors, and thresholds:
Page 67

Template 4: Physician specialist services State: Colorado
2016 2017 2018
Year #1 Value Year #2 Value Year #3 Value
2016 64 2017 36 2018 362016 2017 2018
PediatricAdults
Individuals with Disabilities
Service Provider: EndocrinologyGeographic Region: Health Statistic Region Grouping 1
MMISData Source: Data Source Other Specify:
Results for Pediatric and Individuals with Disabilities in all 3 years were all less than 30. Note: Departmental guidelines require results less than 30 to be blinded. This is to ensure compliance with the Health Insurance Portability and Accountability Act of 1996 (HIPPA) regulations and to prevent potential identification of individual members. Number of Services Delivered by Health Statistic Region Grouping is based on service county location. HSR Grouping 1 - Eastern Plains includes Baca, Bent, Cheyenne, Crowley, Elbert, Huerfano, Kiowa, Kit Carson, Las Animas, Lincoln, Logan, Morgan, Otero, Phillips, Prowers, Sedgwick, Washington, and Yuma counties.
Describe the data sources, methodologies, baselines, assumptions, trends, factors, and thresholds:
2016 2017 2018
Year #1 Value Year #2 Value Year #3 Value
2016 142 2017 226 2018 1352016 2017 51 2018 32
PediatricAdults
Individuals with Disabilities
Service Provider: EndocrinologyGeographic Region: Health Statistic Region Grouping 3
MMISData Source: Data Source Other Specify:
Results for Pediatric in all 3 years and Individuals with Disabilities in 2016 were less than 30. Note: Departmental guidelines require results less than 30 to be blinded. This is to ensure compliance with the Health Insurance Portability and Accountability Act of 1996 (HIPPA) regulations and to prevent potential identification of individual members. Number of Services Delivered by Health Statistic Region Grouping is based on service county location. HSR Grouping 3 - Colorado Springs/Pueblo includes Chaffee, Custer, El Paso, Fremont, Lake, and Pueblo counties.
Describe the data sources, methodologies, baselines, assumptions, trends, factors, and thresholds:
2016 2017 2018
Year #1 Value Year #2 Value Year #3 Value
2016 50 2017 59 2018 432016 2017 2018
PediatricAdults
Individuals with Disabilities
Service Provider: EndocrinologyGeographic Region: Health Statistic Region Grouping 4
MMISData Source: Data Source Other Specify:
Results for Endocrinology were less than 30 for all fields, except results for Adults. Note: Departmental guidelines require results less than 30 to be blinded. This is to ensure compliance with the Health Insurance Portability and Accountability Act of 1996 (HIPPA) regulations and to prevent potential identification of individual members. Number of Services Delivered by Health Statistic Region Grouping is based on service county location. HSR Grouping 4 - San Luis Valley includes Alamosa, Archuleta, Conejos, Costilla, Delta, Dolores, Gunnison, Hinsdale, La Plata, Mineral, Montezuma, Montrose, Ouray, Rio Grande, Saguache, San Juan, and San Miguel counties.
Describe the data sources, methodologies, baselines, assumptions, trends, factors, and thresholds:
2016 2017 2018
Year #1 Value Year #2 Value Year #3 Value
2016 160 2017 188 2018 1142016 32 2017 2018
PediatricAdults
Individuals with Disabilities
Service Provider: EndocrinologyGeographic Region: Health Statistic Region Grouping 5
MMISData Source: Data Source Other Specify:
Results for Pediatric in all 3 years and Individuals with Disabilities in 2017 and 2018 were less than 30. Note: Departmental guidelines require results less than 30 to be blinded. This is to ensure compliance with the Health Insurance Portability and Accountability Act of 1996 (HIPPA) regulations and to prevent potential identification of individual members. Number of Services Delivered by Health Statistic Region Grouping is based on service county location. HSR Grouping 5 - Northern Colorado includes Boulder, Broomfield, Larimer, and Weld counties.
Describe the data sources, methodologies, baselines, assumptions, trends, factors, and thresholds:
Page 68

Template 4: Physician specialist services State: Colorado
2016 2017 2018
Year #1 Value Year #2 Value Year #3 Value
2016 191 2017 222 2018 2052016 50 2017 47 2018
PediatricAdults
Individuals with Disabilities
Service Provider: EndocrinologyGeographic Region: Health Statistic Region Grouping 6
MMISData Source: Data Source Other Specify:
Results for Pediatric in all 3 years and Individuals with Disabilities in 2018 were less than 30. Note: Departmental guidelines require results less than 30 to be blinded. This is to ensure compliance with the Health Insurance Portability and Accountability Act of 1996 (HIPPA) regulations and to prevent potential identification of individual members. Number of Services Delivered by Health Statistic Region Grouping is based on service county location. HSR Grouping 6 - Metro Denver (North & East) includes Adams, Arapahoe, and Denver counties.
Describe the data sources, methodologies, baselines, assumptions, trends, factors, and thresholds:
2016 2017 2018
Year #1 Value Year #2 Value Year #3 Value
2016 78 2017 81 2018 752016 2017 2018
PediatricAdults
Individuals with Disabilities
Service Provider: EndocrinologyGeographic Region: Health Statistic Region Grouping 7
MMISData Source: Data Source Other Specify:
Results for Pediatric and Individuals with Disabilities in all 3 years were less than 30. Note: Departmental guidelines require results less than 30 to be blinded. This is to ensure compliance with the Health Insurance Portability and Accountability Act of 1996 (HIPPA) regulations and to prevent potential identification of individual members. Number of Services Delivered by Health Statistic Region Grouping is based on service county location. HSR Grouping 7 - Metro Denver (West & South) includes Clear Creek, Douglas, Gilpin, Jefferson, Park, and Teller counties.
Describe the data sources, methodologies, baselines, assumptions, trends, factors, and thresholds:
2016 44 2017 44 2018 54
Year #1 Value Year #2 Value Year #3 Value
2016 706 2017 827 2018 6462016 149 2017 156 2018 99
PediatricAdults
Individuals with Disabilities
Service Provider: Endocrinology
Geographic Region: Statewide
MMISData Source: Data Source Other Specify:
Total Number of services delivered to Beneficiaries by Enrolled Providers identified through claims data
Describe the data sources, methodologies, baselines, assumptions, trends, factors, and thresholds:
2016 80 2017 62 2018 57
Year #1 Value Year #2 Value Year #3 Value
2016 218 2017 284 2018 5332016 88 2017 114 2018 213
PediatricAdults
Individuals with Disabilities
Service Provider: Gastroenterology
Geographic Region: Health Statistic Region Grouping 3
MMISData Source: Data Source Other Specify:
Total Number of services delivered to Beneficiaries by Enrolled Providers identified through claims data. Number of Services Delivered by Health Statistic Region Grouping is based on service county location. HSR Grouping 3 - Colorado Springs/Pueblo includes Chaffee, Custer, El Paso, Fremont, Lake, and Pueblo counties.
Describe the data sources, methodologies, baselines, assumptions, trends, factors, and thresholds:
Page 69

Template 4: Physician specialist services State: Colorado
2016 2017 2018
Year #1 Value Year #2 Value Year #3 Value
2016 51 2017 48 2018 662016 2017 2018
PediatricAdults
Individuals with Disabilities
Service Provider: GastroenterologyGeographic Region: Health Statistic Region Grouping 4
MMISData Source: Data Source Other Specify:
Results for Pediatric and Individuals with Disabilities in all 3 years were less than 30. Note: Departmental guidelines require results less than 30 to be blinded. This is to ensure compliance with the Health Insurance Portability and Accountability Act of 1996 (HIPPA) regulations and to prevent potential identification of individual members. Number of Services Delivered by Health Statistic Region Grouping is based on service county location. HSR Grouping 4 - San Luis Valley includes Alamosa, Archuleta, Conejos, Costilla, Delta, Dolores, Gunnison, Hinsdale, La Plata, Mineral, Montezuma, Montrose, Ouray, Rio Grande, Saguache, San Juan, and San Miguel counties.
Describe the data sources, methodologies, baselines, assumptions, trends, factors, and thresholds:
2016 2017 40 2018 48
Year #1 Value Year #2 Value Year #3 Value
2016 202 2017 255 2018 2382016 51 2017 75 2018 73
PediatricAdults
Individuals with Disabilities
Service Provider: GastroenterologyGeographic Region: Health Statistic Region Grouping 5
MMISData Source: Data Source Other Specify:
Results for Pediatric in 2016 were less than 30. Note: Departmental guidelines require results less than 30 to be blinded. This is to ensure compliance with the Health Insurance Portability and Accountability Act of 1996 (HIPPA) regulations and to prevent potential identification of individual members. Number of Services Delivered by Health Statistic Region Grouping is based on service county location. HSR Grouping 5 - Northern Colorado includes Boulder, Broomfield, Larimer, and Weld counties.
Describe the data sources, methodologies, baselines, assumptions, trends, factors, and thresholds:
2016 86 2017 99 2018 164
Year #1 Value Year #2 Value Year #3 Value
2016 714 2017 825 2018 9072016 177 2017 224 2018 262
PediatricAdults
Individuals with Disabilities
Service Provider: Gastroenterology
Geographic Region: Health Statistic Region Grouping 6
MMISData Source: Data Source Other Specify:
Total Number of services delivered to Beneficiaries by Enrolled Providers identified through claims data. Number of Services Delivered by Health Statistic Region Grouping is based on service county location. HSR Grouping 6 - Metro Denver (North & East) includes Adams, Arapahoe, and Denver counties.
Describe the data sources, methodologies, baselines, assumptions, trends, factors, and thresholds:
2016 32 2017 41 2018
Year #1 Value Year #2 Value Year #3 Value
2016 241 2017 180 2018 2772016 66 2017 62 2018 72
PediatricAdults
Individuals with Disabilities
Service Provider: GastroenterologyGeographic Region: Health Statistic Region Grouping 7
MMISData Source: Data Source Other Specify:
Results for Pediatric in 2018 were less than 30. Note: Departmental guidelines require results less than 30 to be blinded. This is to ensure compliance with the Health Insurance Portability and Accountability Act of 1996 (HIPPA) regulations and to prevent potential identification of individual members. Number of Services Delivered by Health Statistic Region Grouping is based on service county location. HSR Grouping 7 - Metro Denver (West & South) includes Clear Creek, Douglas, Gilpin, Jefferson, Park, and Teller counties.
Describe the data sources, methodologies, baselines, assumptions, trends, factors, and thresholds:
Page 70

Template 4: Physician specialist services State: Colorado
2016 244 2017 318 2018 348
Year #1 Value Year #2 Value Year #3 Value
2016 1444 2017 1703 2018 21222016 421 2017 516 2018 670
PediatricAdults
Individuals with Disabilities
Service Provider: GastroenterologyGeographic Region: Statewide
Data Source: Data Source Other Specify:
Total Number of services delivered to Beneficiaries by Enrolled Providers identified through claims data
Describe the data sources, methodologies, baselines, assumptions, trends, factors, and thresholds:
2016 130 2017 231 2018 224
Year #1 Value Year #2 Value Year #3 Value
2016 643 2017 603 2018 6262016 384 2017 403 2018 430
PediatricAdults
Individuals with Disabilities
Service Provider: NeurologyGeographic Region: Health Statistic Region Grouping 1
MMISData Source: Data Source Other Specify:
Total Number of services delivered to Beneficiaries by Enrolled Providers identified through claims data. Number of Services Delivered by Health Statistic Region Grouping is based on service county location. HSR Grouping 1 - Eastern Plains includes Baca, Bent, Cheyenne, Crowley, Elbert, Huerfano, Kiowa, Kit Carson, Las Animas, Lincoln, Logan, Morgan, Otero, Phillips, Prowers, Sedgwick, Washington, and Yuma counties.
Describe the data sources, methodologies, baselines, assumptions, trends, factors, and thresholds:
2016 182 2017 314 2018 244
Year #1 Value Year #2 Value Year #3 Value
2016 256 2017 292 2018 3502016 147 2017 191 2018 199
PediatricAdults
Individuals with Disabilities
Service Provider: NeurologyGeographic Region: Health Statistic Region Grouping 2
MMISData Source: Data Source Other Specify:
Total Number of services delivered to Beneficiaries by Enrolled Providers identified through claims data. Number of Services Delivered by Health Statistic Region Grouping is based on service county location. HSR Grouping 2 - Northwestern Colorado includes Eagle, Garfield, Grand, Jackson, Mesa, Moffat, Pitkin, Rio Blanco, Routt, and Summit counties.
Describe the data sources, methodologies, baselines, assumptions, trends, factors, and thresholds:
2016 1222 2017 1391 2018 1430
Year #1 Value Year #2 Value Year #3 Value
2016 3282 2017 3699 2018 36392016 2103 2017 2284 2018 2448
PediatricAdults
Individuals with Disabilities
Service Provider: NeurologyGeographic Region: Health Statistic Region Grouping 3
MMISData Source: Data Source Other Specify:
Total Number of services delivered to Beneficiaries by Enrolled Providers identified through claims data. Number of Services Delivered by Health Statistic Region Grouping is based on service county location. HSR Grouping 3 - Colorado Springs/Pueblo includes Chaffee, Custer, El Paso, Fremont, Lake, and Pueblo counties.
Describe the data sources, methodologies, baselines, assumptions, trends, factors, and thresholds:
Page 71

Template 4: Physician specialist services State: Colorado
2016 147 2017 229 2018 214
Year #1 Value Year #2 Value Year #3 Value
2016 600 2017 734 2018 6442016 246 2017 271 2018 265
PediatricAdults
Individuals with Disabilities
Service Provider: NeurologyGeographic Region: Health Statistic Region Grouping 4
MMISData Source: Data Source Other Specify:
Total Number of services delivered to Beneficiaries by Enrolled Providers identified through claims data. Number of Services Delivered by Health Statistic Region Grouping is based on service county location. HSR Grouping 4 - San Luis Valley includes Alamosa, Archuleta, Conejos, Costilla, Delta, Dolores, Gunnison, Hinsdale, La Plata, Mineral, Montezuma, Montrose, Ouray, Rio Grande, Saguache, San Juan, and San Miguel counties.
Describe the data sources, methodologies, baselines, assumptions, trends, factors, and thresholds:
2016 444 2017 601 2018 621
Year #1 Value Year #2 Value Year #3 Value
2016 2027 2017 2144 2018 22682016 1134 2017 1106 2018 1363
PediatricAdults
Individuals with Disabilities
Service Provider: NeurologyGeographic Region: Health Statistic Region Grouping 5
MMISData Source: Data Source Other Specify:
Total Number of services delivered to Beneficiaries by Enrolled Providers identified through claims data. Number of Services Delivered by Health Statistic Region Grouping is based on service county location. HSR Grouping 5 - Northern Colorado includes Boulder, Broomfield, Larimer, and Weld counties.
Describe the data sources, methodologies, baselines, assumptions, trends, factors, and thresholds:
2016 1119 2017 1473 2018 1553
Year #1 Value Year #2 Value Year #3 Value
2016 4513 2017 4807 2018 51232016 2409 2017 2707 2018 3081
PediatricAdults
Individuals with Disabilities
Service Provider: NeurologyGeographic Region: Health Statistic Region Grouping 6
MMISData Source: Data Source Other Specify:
Total Number of services delivered to Beneficiaries by Enrolled Providers identified through claims data. Number of Services Delivered by Health Statistic Region Grouping is based on service county location. HSR Grouping 6 - Metro Denver (North & East) includes Adams, Arapahoe, and Denver counties.
Describe the data sources, methodologies, baselines, assumptions, trends, factors, and thresholds:
2016 310 2017 486 2018 483
Year #1 Value Year #2 Value Year #3 Value
2016 1528 2017 1844 2018 19092016 906 2017 1062 2018 1108
PediatricAdults
Individuals with Disabilities
Service Provider: Neurology
Geographic Region: Health Statistic Region Grouping 7
MMISData Source: Data Source Other Specify:
Total Number of services delivered to Beneficiaries by Enrolled Providers identified through claims data. Number of Services Delivered by Health Statistic Region Grouping is based on service county location. HSR Grouping 7 - Metro Denver (West & South) includes Clear Creek, Douglas, Gilpin, Jefferson, Park, and Teller counties.
Describe the data sources, methodologies, baselines, assumptions, trends, factors, and thresholds:
Page 72

Template 4: Physician specialist services State: Colorado
2016 3554 2017 4727 2018 4769
Year #1 Value Year #2 Value Year #3 Value
2016 12849 2017 14126 2018 145622016 7329 2017 8025 2018 8894
PediatricAdults
Individuals with Disabilities
Service Provider: NeurologyGeographic Region: Statewide
MMISData Source: Data Source Other Specify:
Total Number of services delivered to Beneficiaries by Enrolled Providers identified through claims data
Describe the data sources, methodologies, baselines, assumptions, trends, factors, and thresholds:
2016 55 2017 48 2018 52
Year #1 Value Year #2 Value Year #3 Value
2016 1002 2017 1017 2018 9842016 401 2017 374 2018 290
PediatricAdults
Individuals with Disabilities
Service Provider: Nuclear MedicineGeographic Region: Health Statistic Region Grouping 1
MMISData Source: Data Source Other Specify:
Total Number of services delivered to Beneficiaries by Enrolled Providers identified through claims data. Number of Services Delivered by Health Statistic Region Grouping is based on service county location. HSR Grouping 1 - Eastern Plains includes Baca, Bent, Cheyenne, Crowley, Elbert, Huerfano, Kiowa, Kit Carson, Las Animas, Lincoln, Logan, Morgan, Otero, Phillips, Prowers, Sedgwick, Washington, and Yuma counties.
Describe the data sources, methodologies, baselines, assumptions, trends, factors, and thresholds:
2016 100 2017 82 2018 63
Year #1 Value Year #2 Value Year #3 Value
2016 396 2017 426 2018 3532016 132 2017 125 2018 140
PediatricAdults
Individuals with Disabilities
Service Provider: Nuclear MedicineGeographic Region: Health Statistic Region Grouping 2
MMISData Source: Data Source Other Specify:
Total Number of services delivered to Beneficiaries by Enrolled Providers identified through claims data. Number of Services Delivered by Health Statistic Region Grouping is based on service county location. HSR Grouping 2 - Northwestern Colorado includes Eagle, Garfield, Grand, Jackson, Mesa, Moffat, Pitkin, Rio Blanco, Routt, and Summit counties.
Describe the data sources, methodologies, baselines, assumptions, trends, factors, and thresholds:
2016 222 2017 233 2018 229
Year #1 Value Year #2 Value Year #3 Value
2016 4296 2017 4396 2018 41392016 1431 2017 1433 2018 1384
PediatricAdults
Individuals with Disabilities
Service Provider: Nuclear MedicineGeographic Region: Health Statistic Region Grouping 3
MMISData Source: Data Source Other Specify:
Total Number of services delivered to Beneficiaries by Enrolled Providers identified through claims data. Number of Services Delivered by Health Statistic Region Grouping is based on service county location. HSR Grouping 3 - Colorado Springs/Pueblo includes Chaffee, Custer, El Paso, Fremont, Lake, and Pueblo counties.
Describe the data sources, methodologies, baselines, assumptions, trends, factors, and thresholds:
Page 73

Template 4: Physician specialist services State: Colorado
2016 39 2017 58 2018 53
Year #1 Value Year #2 Value Year #3 Value
2016 922 2017 957 2018 9442016 314 2017 331 2018 310
PediatricAdults
Individuals with Disabilities
Service Provider: Nuclear MedicineGeographic Region: Health Statistic Region Grouping 4
MMISData Source: Data Source Other Specify:
Total Number of services delivered to Beneficiaries by Enrolled Providers identified through claims data. Number of Services Delivered by Health Statistic Region Grouping is based on service county location. HSR Grouping 4 - San Luis Valley includes Alamosa, Archuleta, Conejos, Costilla, Delta, Dolores, Gunnison, Hinsdale, La Plata, Mineral, Montezuma, Montrose, Ouray, Rio Grande, Saguache, San Juan, and San Miguel counties.
Describe the data sources, methodologies, baselines, assumptions, trends, factors, and thresholds:
2016 108 2017 86 2018 70
Year #1 Value Year #2 Value Year #3 Value
2016 2982 2017 3088 2018 29212016 893 2017 995 2018 894
PediatricAdults
Individuals with Disabilities
Service Provider: Nuclear MedicineGeographic Region: Health Statistic Region Grouping 5
MMISData Source: Data Source Other Specify:
Total Number of services delivered to Beneficiaries by Enrolled Providers identified through claims data. Number of Services Delivered by Health Statistic Region Grouping is based on service county location. HSR Grouping 5 - Northern Colorado includes Boulder, Broomfield, Larimer, and Weld counties.
Describe the data sources, methodologies, baselines, assumptions, trends, factors, and thresholds:
2016 244 2017 236 2018 217
Year #1 Value Year #2 Value Year #3 Value
2016 6146 2017 6317 2018 63452016 1831 2017 1964 2018 1942
PediatricAdults
Individuals with Disabilities
Service Provider: Nuclear MedicineGeographic Region: Health Statistic Region Grouping 6
MMISData Source: Data Source Other Specify:
Total Number of services delivered to Beneficiaries by Enrolled Providers identified through claims data. Number of Services Delivered by Health Statistic Region Grouping is based on service county location. HSR Grouping 6 - Metro Denver (North & East) includes Adams, Arapahoe, and Denver counties.
Describe the data sources, methodologies, baselines, assumptions, trends, factors, and thresholds:
2016 82 2017 66 2018 71
Year #1 Value Year #2 Value Year #3 Value
2016 2217 2017 2239 2018 22362016 636 2017 698 2018 682
PediatricAdults
Individuals with Disabilities
Service Provider: Nuclear Medicine
Geographic Region: Health Statistic Region Grouping 7
MMISData Source: Data Source Other Specify:
Total Number of services delivered to Beneficiaries by Enrolled Providers identified through claims data. Number of Services Delivered by Health Statistic Region Grouping is based on service county location. HSR Grouping 7 - Metro Denver (West & South) includes Clear Creek, Douglas, Gilpin, Jefferson, Park, and Teller counties.
Describe the data sources, methodologies, baselines, assumptions, trends, factors, and thresholds:
2016 850 2017 809 2018 755
Year #1 Value Year #2 Value Year #3 Value
2016 17961 2017 18444 2018 179222016 5638 2017 5920 2018 5642
PediatricAdults
Individuals with Disabilities
Service Provider: Nuclear MedicineGeographic Region: Statewide
MMISData Source: Data Source Other Specify:
Describe the data sources, methodologies, baselines, assumptions, trends, factors, and thresholds:
Page 74

Template 4: Physician specialist services State: Colorado
2016 11882 2017 12287 2018 13710
Year #1 Value Year #2 Value Year #3 Value
2016 6099 2017 6438 2018 70192016 2493 2017 2480 2018 3280
PediatricAdults
Individuals with Disabilities
Service Provider: OphthalmologyGeographic Region: Health Statistic Region Grouping 1
Data Source: Data Source Other Specify:
Total Number of services delivered to Beneficiaries by Enrolled Providers identified through claims data. Number of Services Delivered by Health Statistic Region Grouping is based on service county location. HSR Grouping 1 - Eastern Plains includes Baca, Bent, Cheyenne, Crowley, Elbert, Huerfano, Kiowa, Kit Carson, Las Animas, Lincoln, Logan, Morgan, Otero, Phillips, Prowers, Sedgwick, Washington, and Yuma counties.
Describe the data sources, methodologies, baselines, assumptions, trends, factors, and thresholds:
2016 13992 2017 14019 2018 15600
Year #1 Value Year #2 Value Year #3 Value
2016 2113 2017 2193 2018 25032016 1012 2017 843 2018 1312
PediatricAdults
Individuals with Disabilities
Service Provider: OphthalmologyGeographic Region: Health Statistic Region Grouping 2
MMISData Source: Data Source Other Specify:
Total Number of services delivered to Beneficiaries by Enrolled Providers identified through claims data. Number of Services Delivered by Health Statistic Region Grouping is based on service county location. HSR Grouping 2 - Northwestern Colorado includes Eagle, Garfield, Grand, Jackson, Mesa, Moffat, Pitkin, Rio Blanco, Routt, and Summit counties.
Describe the data sources, methodologies, baselines, assumptions, trends, factors, and thresholds:
2016 90301 2017 96760 2018 104321
Year #1 Value Year #2 Value Year #3 Value
2016 29783 2017 31738 2018 332962016 30133 2017 28112 2018 30387
PediatricAdults
Individuals with Disabilities
Service Provider: OphthalmologyGeographic Region: Health Statistic Region Grouping 3
MMISData Source: Data Source Other Specify:
Total Number of services delivered to Beneficiaries by Enrolled Providers identified through claims data. Number of Services Delivered by Health Statistic Region Grouping is based on service county location. HSR Grouping 3 - Colorado Springs/Pueblo includes Chaffee, Custer, El Paso, Fremont, Lake, and Pueblo counties.
Describe the data sources, methodologies, baselines, assumptions, trends, factors, and thresholds:
2016 9768 2017 10645 2018 12399
Year #1 Value Year #2 Value Year #3 Value
2016 6396 2017 6604 2018 75942016 2022 2017 2239 2018 2692
PediatricAdults
Individuals with Disabilities
Service Provider: Ophthalmology
Geographic Region: Health Statistic Region Grouping 4
MMISData Source: Data Source Other Specify:
Total Number of services delivered to Beneficiaries by Enrolled Providers identified through claims data. Number of Services Delivered by Health Statistic Region Grouping is based on service county location. HSR Grouping 4 - San Luis Valley includes Alamosa, Archuleta, Conejos, Costilla, Delta, Dolores, Gunnison, Hinsdale, La Plata, Mineral, Montezuma, Montrose, Ouray, Rio Grande, Saguache, San Juan, and San Miguel counties.
Describe the data sources, methodologies, baselines, assumptions, trends, factors, and thresholds:
Page 75

Template 4: Physician specialist services State: Colorado
2016 66803 2017 69049 2018 73950
Year #1 Value Year #2 Value Year #3 Value
2016 18800 2017 19712 2018 213432016 18662 2017 20711 2018 26715
PediatricAdults
Individuals with Disabilities
Service Provider: OphthalmologyGeographic Region: Health Statistic Region Grouping 5
MMISData Source: Data Source Other Specify:
Total Number of services delivered to Beneficiaries by Enrolled Providers identified through claims data. Number of Services Delivered by Health Statistic Region Grouping is based on service county location. HSR Grouping 5 - Northern Colorado includes Boulder, Broomfield, Larimer, and Weld counties.
Describe the data sources, methodologies, baselines, assumptions, trends, factors, and thresholds:
2016 149433 2017 150899 2018 166559
Year #1 Value Year #2 Value Year #3 Value
2016 35767 2017 39282 2018 456992016 42860 2017 42750 2018 50822
PediatricAdults
Individuals with Disabilities
Service Provider: OphthalmologyGeographic Region: Health Statistic Region Grouping 6
MMISData Source: Data Source Other Specify:
Total Number of services delivered to Beneficiaries by Enrolled Providers identified through claims data. Number of Services Delivered by Health Statistic Region Grouping is based on service county location. HSR Grouping 6 - Metro Denver (North & East) includes Adams, Arapahoe, and Denver counties.
Describe the data sources, methodologies, baselines, assumptions, trends, factors, and thresholds:
2016 32107 2017 32102 2018 37732
Year #1 Value Year #2 Value Year #3 Value
2016 10831 2017 11429 2018 131102016 15894 2017 15633 2018 19407
PediatricAdults
Individuals with Disabilities
Service Provider: OphthalmologyGeographic Region: Health Statistic Region Grouping 7
MMISData Source: Data Source Other Specify:
Total Number of services delivered to Beneficiaries by Enrolled Providers identified through claims data. Number of Services Delivered by Health Statistic Region Grouping is based on service county location. HSR Grouping 7 - Metro Denver (West & South) includes Clear Creek, Douglas, Gilpin, Jefferson, Park, and Teller counties.
Describe the data sources, methodologies, baselines, assumptions, trends, factors, and thresholds:
2016 374255 2017 385738 2018 424230
Year #1 Value Year #2 Value Year #3 Value
2016 109788 2017 116414 2018 1305672016 113067 2017 112761 2018 134600
PediatricAdults
Individuals with Disabilities
Service Provider: OphthalmologyGeographic Region: Statewide
MMISData Source: Data Source Other Specify:
Total Number of services delivered to Beneficiaries by Enrolled Providers identified through claims data
Describe the data sources, methodologies, baselines, assumptions, trends, factors, and thresholds:
Page 76

Template 4: Physician specialist services State: Colorado
2016 627 2017 770 2018 898
Year #1 Value Year #2 Value Year #3 Value
2016 402 2017 396 2018 3922016 295 2017 189 2018 330
PediatricAdults
Individuals with Disabilities
Service Provider: OtolaryngologyGeographic Region: Health Statistic Region Grouping 1
MMISData Source: Data Source Other Specify:
Total Number of services delivered to Beneficiaries by Enrolled Providers identified through claims data. Number of Services Delivered by Health Statistic Region Grouping is based on service county location. HSR Grouping 1 - Eastern Plains includes Baca, Bent, Cheyenne, Crowley, Elbert, Huerfano, Kiowa, Kit Carson, Las Animas, Lincoln, Logan, Morgan, Otero, Phillips, Prowers, Sedgwick, Washington, and Yuma counties.
Describe the data sources, methodologies, baselines, assumptions, trends, factors, and thresholds:
2016 1505 2017 1239 2018 1221
Year #1 Value Year #2 Value Year #3 Value
2016 186 2017 144 2018 1742016 148 2017 125 2018 179
PediatricAdults
Individuals with Disabilities
Service Provider: OtolaryngologyGeographic Region: Health Statistic Region Grouping 2
MMISData Source: Data Source Other Specify:
Total Number of services delivered to Beneficiaries by Enrolled Providers identified through claims data. Number of Services Delivered by Health Statistic Region Grouping is based on service county location. HSR Grouping 2 - Northwestern Colorado includes Eagle, Garfield, Grand, Jackson, Mesa, Moffat, Pitkin, Rio Blanco, Routt, and Summit counties.
Describe the data sources, methodologies, baselines, assumptions, trends, factors, and thresholds:
2016 5323 2017 4274 2018 3674
Year #1 Value Year #2 Value Year #3 Value
2016 1891 2017 1694 2018 18502016 4066 2017 3557 2018 3692
PediatricAdults
Individuals with Disabilities
Service Provider: OtolaryngologyGeographic Region: Health Statistic Region Grouping 3
MMISData Source: Data Source Other Specify:
Total Number of services delivered to Beneficiaries by Enrolled Providers identified through claims data. Number of Services Delivered by Health Statistic Region Grouping is based on service county location. HSR Grouping 3 - Colorado Springs/Pueblo includes Chaffee, Custer, El Paso, Fremont, Lake, and Pueblo counties.
Describe the data sources, methodologies, baselines, assumptions, trends, factors, and thresholds:
2016 2173 2017 2631 2018 2591
Year #1 Value Year #2 Value Year #3 Value
2016 522 2017 534 2018 5052016 197 2017 206 2018 226
PediatricAdults
Individuals with Disabilities
Service Provider: Otolaryngology
Geographic Region: Health Statistic Region Grouping 4
MMISData Source: Data Source Other Specify:
Total Number of services delivered to Beneficiaries by Enrolled Providers identified through claims data. Number of Services Delivered by Health Statistic Region Grouping is based on service county location. HSR Grouping 4 - San Luis Valley includes Alamosa, Archuleta, Conejos, Costilla, Delta, Dolores, Gunnison, Hinsdale, La Plata, Mineral, Montezuma, Montrose, Ouray, Rio Grande, Saguache, San Juan, and San Miguel counties.
Describe the data sources, methodologies, baselines, assumptions, trends, factors, and thresholds:
Page 77

Template 4: Physician specialist services State: Colorado
2016 5233 2017 7168 2018 11836
Year #1 Value Year #2 Value Year #3 Value
2016 1514 2017 1593 2018 15772016 5461 2017 6604 2018 9518
PediatricAdults
Individuals with Disabilities
Service Provider: OtolaryngologyGeographic Region: Health Statistic Region Grouping 5
MMISData Source: Data Source Other Specify:
Total Number of services delivered to Beneficiaries by Enrolled Providers identified through claims data. Number of Services Delivered by Health Statistic Region Grouping is based on service county location. HSR Grouping 5 - Northern Colorado includes Boulder, Broomfield, Larimer, and Weld counties.
Describe the data sources, methodologies, baselines, assumptions, trends, factors, and thresholds:
2016 17727 2017 17348 2018 19611
Year #1 Value Year #2 Value Year #3 Value
2016 3625 2017 3742 2018 39732016 14135 2017 13401 2018 14527
PediatricAdults
Individuals with Disabilities
Service Provider: OtolaryngologyGeographic Region: Health Statistic Region Grouping 6
MMISData Source: Data Source Other Specify:
Total Number of services delivered to Beneficiaries by Enrolled Providers identified through claims data. Number of Services Delivered by Health Statistic Region Grouping is based on service county location. HSR Grouping 6 - Metro Denver (North & East) includes Adams, Arapahoe, and Denver counties.
Describe the data sources, methodologies, baselines, assumptions, trends, factors, and thresholds:
2016 5176 2017 5062 2018 4949
Year #1 Value Year #2 Value Year #3 Value
2016 1236 2017 1477 2018 14342016 5241 2017 4832 2018 5473
PediatricAdults
Individuals with Disabilities
Service Provider: OtolaryngologyGeographic Region: Health Statistic Region Grouping 7
MMISData Source: Data Source Other Specify:
Total Number of services delivered to Beneficiaries by Enrolled Providers identified through claims data. Number of Services Delivered by Health Statistic Region Grouping is based on service county location. HSR Grouping 7 - Metro Denver (West & South) includes Clear Creek, Douglas, Gilpin, Jefferson, Park, and Teller counties.
Describe the data sources, methodologies, baselines, assumptions, trends, factors, and thresholds:
2016 37764 2017 38497 2018 44783
Year #1 Value Year #2 Value Year #3 Value
2016 9375 2017 9581 2018 99052016 29543 2017 28912 2018 33944
PediatricAdults
Individuals with Disabilities
Service Provider: OtolaryngologyGeographic Region: Statewide
MMISData Source: Data Source Other Specify:
Total Number of services delivered to Beneficiaries by Enrolled Providers identified through claims data
Describe the data sources, methodologies, baselines, assumptions, trends, factors, and thresholds:
Page 78
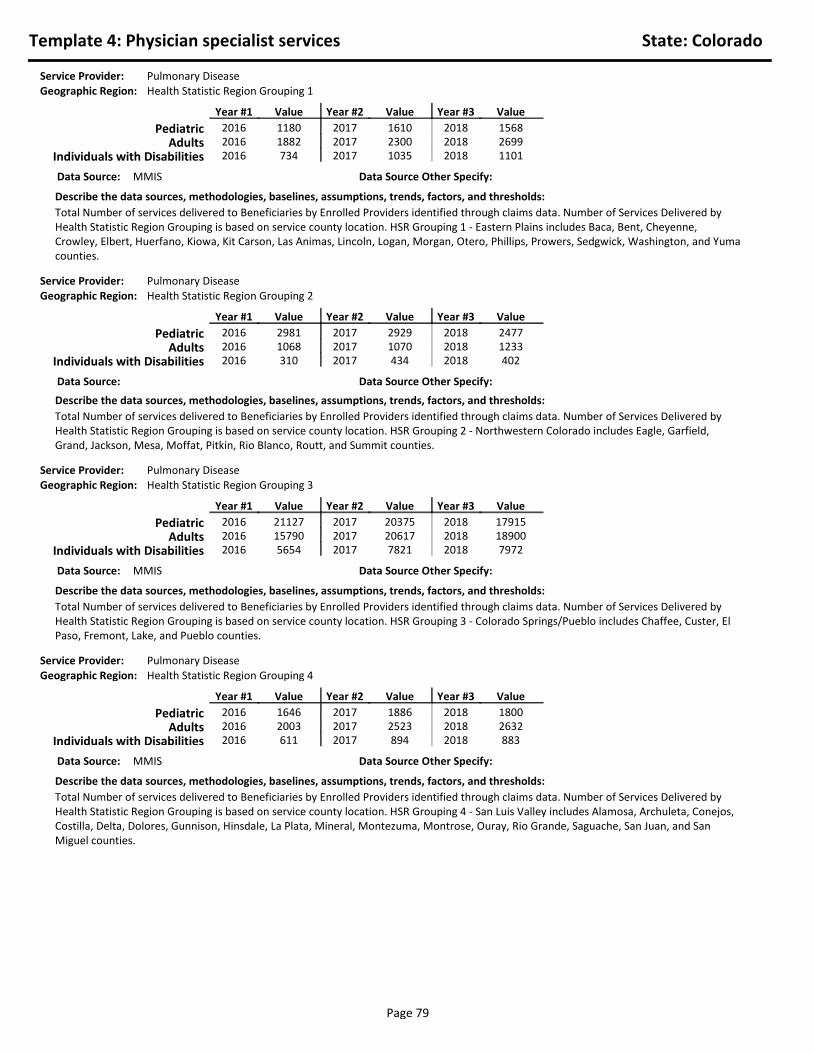
Template 4: Physician specialist services State: Colorado
2016 1180 2017 1610 2018 1568
Year #1 Value Year #2 Value Year #3 Value
2016 1882 2017 2300 2018 26992016 734 2017 1035 2018 1101
PediatricAdults
Individuals with Disabilities
Service Provider: Pulmonary DiseaseGeographic Region: Health Statistic Region Grouping 1
MMISData Source: Data Source Other Specify:
Total Number of services delivered to Beneficiaries by Enrolled Providers identified through claims data. Number of Services Delivered by Health Statistic Region Grouping is based on service county location. HSR Grouping 1 - Eastern Plains includes Baca, Bent, Cheyenne, Crowley, Elbert, Huerfano, Kiowa, Kit Carson, Las Animas, Lincoln, Logan, Morgan, Otero, Phillips, Prowers, Sedgwick, Washington, and Yuma counties.
Describe the data sources, methodologies, baselines, assumptions, trends, factors, and thresholds:
2016 2981 2017 2929 2018 2477
Year #1 Value Year #2 Value Year #3 Value
2016 1068 2017 1070 2018 12332016 310 2017 434 2018 402
PediatricAdults
Individuals with Disabilities
Service Provider: Pulmonary DiseaseGeographic Region: Health Statistic Region Grouping 2
Data Source: Data Source Other Specify:
Total Number of services delivered to Beneficiaries by Enrolled Providers identified through claims data. Number of Services Delivered by Health Statistic Region Grouping is based on service county location. HSR Grouping 2 - Northwestern Colorado includes Eagle, Garfield, Grand, Jackson, Mesa, Moffat, Pitkin, Rio Blanco, Routt, and Summit counties.
Describe the data sources, methodologies, baselines, assumptions, trends, factors, and thresholds:
2016 21127 2017 20375 2018 17915
Year #1 Value Year #2 Value Year #3 Value
2016 15790 2017 20617 2018 189002016 5654 2017 7821 2018 7972
PediatricAdults
Individuals with Disabilities
Service Provider: Pulmonary DiseaseGeographic Region: Health Statistic Region Grouping 3
MMISData Source: Data Source Other Specify:
Total Number of services delivered to Beneficiaries by Enrolled Providers identified through claims data. Number of Services Delivered by Health Statistic Region Grouping is based on service county location. HSR Grouping 3 - Colorado Springs/Pueblo includes Chaffee, Custer, El Paso, Fremont, Lake, and Pueblo counties.
Describe the data sources, methodologies, baselines, assumptions, trends, factors, and thresholds:
2016 1646 2017 1886 2018 1800
Year #1 Value Year #2 Value Year #3 Value
2016 2003 2017 2523 2018 26322016 611 2017 894 2018 883
PediatricAdults
Individuals with Disabilities
Service Provider: Pulmonary Disease
Geographic Region: Health Statistic Region Grouping 4
MMISData Source: Data Source Other Specify:
Total Number of services delivered to Beneficiaries by Enrolled Providers identified through claims data. Number of Services Delivered by Health Statistic Region Grouping is based on service county location. HSR Grouping 4 - San Luis Valley includes Alamosa, Archuleta, Conejos, Costilla, Delta, Dolores, Gunnison, Hinsdale, La Plata, Mineral, Montezuma, Montrose, Ouray, Rio Grande, Saguache, San Juan, and San Miguel counties.
Describe the data sources, methodologies, baselines, assumptions, trends, factors, and thresholds:
Page 79

Template 4: Physician specialist services State: Colorado
2016 5024 2017 6541 2018 6464
Year #1 Value Year #2 Value Year #3 Value
2016 6361 2017 8310 2018 90752016 1846 2017 2551 2018 2970
PediatricAdults
Individuals with Disabilities
Service Provider: Pulmonary DiseaseGeographic Region: Health Statistic Region Grouping 5
MMISData Source: Data Source Other Specify:
Total Number of services delivered to Beneficiaries by Enrolled Providers identified through claims data. Number of Services Delivered by Health Statistic Region Grouping is based on service county location. HSR Grouping 5 - Northern Colorado includes Boulder, Broomfield, Larimer, and Weld counties.
Describe the data sources, methodologies, baselines, assumptions, trends, factors, and thresholds:
2016 33612 2017 41444 2018 41867
Year #1 Value Year #2 Value Year #3 Value
2016 20519 2017 26244 2018 281922016 6100 2017 8302 2018 9104
PediatricAdults
Individuals with Disabilities
Service Provider: Pulmonary DiseaseGeographic Region: Health Statistic Region Grouping 6
MMISData Source: Data Source Other Specify:
Total Number of services delivered to Beneficiaries by Enrolled Providers identified through claims data. Number of Services Delivered by Health Statistic Region Grouping is based on service county location. HSR Grouping 6 - Metro Denver (North & East) includes Adams, Arapahoe, and Denver counties.
Describe the data sources, methodologies, baselines, assumptions, trends, factors, and thresholds:
2016 14418 2017 15632 2018 14795
Year #1 Value Year #2 Value Year #3 Value
2016 6990 2017 9859 2018 100302016 2103 2017 2843 2018 3147
PediatricAdults
Individuals with Disabilities
Service Provider: Pulmonary DiseaseGeographic Region: Health Statistic Region Grouping 7
MMISData Source: Data Source Other Specify:
Total Number of services delivered to Beneficiaries by Enrolled Providers identified through claims data. Number of Services Delivered by Health Statistic Region Grouping is based on service county location. HSR Grouping 7 - Metro Denver (West & South) includes Clear Creek, Douglas, Gilpin, Jefferson, Park, and Teller counties.
Describe the data sources, methodologies, baselines, assumptions, trends, factors, and thresholds:
2016 79988 2017 90433 2018 86897
Year #1 Value Year #2 Value Year #3 Value
2016 54613 2017 70931 2018 727642016 17357 2017 23883 2018 25580
PediatricAdults
Individuals with Disabilities
Service Provider: Pulmonary DiseaseGeographic Region: Statewide
MMISData Source: Data Source Other Specify:
Total Number of services delivered to Beneficiaries by Enrolled Providers identified through claims data
Describe the data sources, methodologies, baselines, assumptions, trends, factors, and thresholds:
Page 80

Template 4: Physician specialist services State: Colorado
2016 2017 2018
Year #1 Value Year #2 Value Year #3 Value
2016 432 2017 461 2018 3682016 105 2017 163 2018 140
PediatricAdults
Individuals with Disabilities
Service Provider: Radiation OncologyGeographic Region: Health Statistic Region Grouping 1
MMISData Source: Data Source Other Specify:
Results for Pediatric across all three years were below 30. Note: Departmental guidelines require results less than 30 to be blinded. This is to ensure compliance with the Health Insurance Portability and Accountability Act of 1996 (HIPPA) regulations and to prevent potential identification of individual members. Total Number of services delivered to Beneficiaries by Enrolled Providers identified through claims data. Number of Services Delivered by Health Statistic Region Grouping is based on service county location. HSR Grouping 1 - Eastern Plains includes Baca, Bent, Cheyenne, Crowley, Elbert, Huerfano, Kiowa, Kit Carson, Las Animas, Lincoln, Logan, Morgan, Otero, Phillips, Prowers, Sedgwick, Washington, and Yuma counties.
Describe the data sources, methodologies, baselines, assumptions, trends, factors, and thresholds:
2016 83 2017 45 2018 54
Year #1 Value Year #2 Value Year #3 Value
2016 204 2017 283 2018 2802016 47 2017 56 2018 132
PediatricAdults
Individuals with Disabilities
Service Provider: Radiation OncologyGeographic Region: Health Statistic Region Grouping 2
MMISData Source: Data Source Other Specify:
Total Number of services delivered to Beneficiaries by Enrolled Providers identified through claims data. Number of Services Delivered by Health Statistic Region Grouping is based on service county location. HSR Grouping 2 - Northwestern Colorado includes Eagle, Garfield, Grand, Jackson, Mesa, Moffat, Pitkin, Rio Blanco, Routt, and Summit counties.
Describe the data sources, methodologies, baselines, assumptions, trends, factors, and thresholds:
2016 57 2017 49 2018 49
Year #1 Value Year #2 Value Year #3 Value
2016 1825 2017 1594 2018 17552016 546 2017 722 2018 760
PediatricAdults
Individuals with Disabilities
Service Provider: Radiation Oncology
Geographic Region: Health Statistic Region Grouping 3
MMISData Source: Data Source Other Specify:
Total Number of services delivered to Beneficiaries by Enrolled Providers identified through claims data. Number of Services Delivered by Health Statistic Region Grouping is based on service county location. HSR Grouping 3 - Colorado Springs/Pueblo includes Chaffee, Custer, El Paso, Fremont, Lake, and Pueblo counties.
Describe the data sources, methodologies, baselines, assumptions, trends, factors, and thresholds:
2016 34 2017 40 2018 41
Year #1 Value Year #2 Value Year #3 Value
2016 408 2017 421 2018 5832016 146 2017 173 2018 152
PediatricAdults
Individuals with Disabilities
Service Provider: Radiation OncologyGeographic Region: Health Statistic Region Grouping 4
MMISData Source: Data Source Other Specify:
Total Number of services delivered to Beneficiaries by Enrolled Providers identified through claims data. Number of Services Delivered by Health Statistic Region Grouping is based on service county location. HSR Grouping 4 - San Luis Valley includes Alamosa, Archuleta, Conejos, Costilla, Delta, Dolores, Gunnison, Hinsdale, La Plata, Mineral, Montezuma, Montrose, Ouray, Rio Grande, Saguache, San Juan, and San Miguel counties.
Describe the data sources, methodologies, baselines, assumptions, trends, factors, and thresholds:
Page 81

Template 4: Physician specialist services State: Colorado
2016 2017 90 2018
Year #1 Value Year #2 Value Year #3 Value
2016 1542 2017 1800 2018 18242016 402 2017 457 2018 490
PediatricAdults
Individuals with Disabilities
Service Provider: Radiation OncologyGeographic Region: Health Statistic Region Grouping 5
MMISData Source: Data Source Other Specify:
Results for Pediatric in 2016 and 2018 were less than 30. Note: Departmental guidelines require results less than 30 to be blinded. This is to ensure compliance with the Health Insurance Portability and Accountability Act of 1996 (HIPPA) regulations and to prevent potential identification of individual members. Total Number of services delivered to Beneficiaries by Enrolled Providers identified through claims data. Number of Services Delivered by Health Statistic Region Grouping is based on service county location. HSR Grouping 5 - Northern Colorado includes Boulder, Broomfield, Larimer, and Weld counties.
Describe the data sources, methodologies, baselines, assumptions, trends, factors, and thresholds:
2016 54 2017 190 2018 211
Year #1 Value Year #2 Value Year #3 Value
2016 3773 2017 3276 2018 33052016 1068 2017 740 2018 1133
PediatricAdults
Individuals with Disabilities
Service Provider: Radiation OncologyGeographic Region: Health Statistic Region Grouping 6
MMISData Source: Data Source Other Specify:
Total Number of services delivered to Beneficiaries by Enrolled Providers identified through claims data. Number of Services Delivered by Health Statistic Region Grouping is based on service county location. HSR Grouping 6 - Metro Denver (North & East) includes Adams, Arapahoe, and Denver counties.
Describe the data sources, methodologies, baselines, assumptions, trends, factors, and thresholds:
2016 48 2017 2018
Year #1 Value Year #2 Value Year #3 Value
2016 1603 2017 1431 2018 15072016 307 2017 388 2018 420
PediatricAdults
Individuals with Disabilities
Service Provider: Radiation OncologyGeographic Region: Health Statistic Region Grouping 7
MMISData Source: Data Source Other Specify:
Results for Pediatric in 2017 and 2018 were below 30. Note: Departmental guidelines require results less than 30 to be blinded. This is to ensure compliance with the Health Insurance Portability and Accountability Act of 1996 (HIPPA) regulations and to prevent potential identification of individual members. Total Number of services delivered to Beneficiaries by Enrolled Providers identified through claims data. Number of Services Delivered by Health Statistic Region Grouping is based on service county location. HSR Grouping 7 - Metro Denver (West & South) includes Clear Creek, Douglas, Gilpin, Jefferson, Park, and Teller counties.
Describe the data sources, methodologies, baselines, assumptions, trends, factors, and thresholds:
2016 280 2017 414 2018 386
Year #1 Value Year #2 Value Year #3 Value
2016 9786 2017 9264 2018 96212016 2621 2017 2699 2018 3227
PediatricAdults
Individuals with Disabilities
Service Provider: Radiation Oncology
Geographic Region: Statewide
MMISData Source: Data Source Other Specify:
Total Number of services delivered to Beneficiaries by Enrolled Providers identified through claims data
Describe the data sources, methodologies, baselines, assumptions, trends, factors, and thresholds:
Page 82

Template 4: Physician specialist services State: Colorado
2016 67 2017 120 2018 130
Year #1 Value Year #2 Value Year #3 Value
2016 817 2017 865 2018 12042016 340 2017 345 2018 419
PediatricAdults
Individuals with Disabilities
Service Provider: UrologyGeographic Region: Health Statistic Region Grouping 1
MMISData Source: Data Source Other Specify:
Total Number of services delivered to Beneficiaries by Enrolled Providers identified through claims data. Number of Services Delivered by Health Statistic Region Grouping is based on service county location. HSR Grouping 1 - Eastern Plains includes Baca, Bent, Cheyenne, Crowley, Elbert, Huerfano, Kiowa, Kit Carson, Las Animas, Lincoln, Logan, Morgan, Otero, Phillips, Prowers, Sedgwick, Washington, and Yuma counties.
Describe the data sources, methodologies, baselines, assumptions, trends, factors, and thresholds:
2016 144 2017 169 2018 191
Year #1 Value Year #2 Value Year #3 Value
2016 424 2017 402 2018 4582016 142 2017 96 2018 145
PediatricAdults
Individuals with Disabilities
Service Provider: UrologyGeographic Region: Health Statistic Region Grouping 2
MMISData Source: Data Source Other Specify:
Total Number of services delivered to Beneficiaries by Enrolled Providers identified through claims data. Number of Services Delivered by Health Statistic Region Grouping is based on service county location. HSR Grouping 2 - Northwestern Colorado includes Eagle, Garfield, Grand, Jackson, Mesa, Moffat, Pitkin, Rio Blanco, Routt, and Summit counties.
Describe the data sources, methodologies, baselines, assumptions, trends, factors, and thresholds:
2016 246 2017 594 2018 627
Year #1 Value Year #2 Value Year #3 Value
2016 3233 2017 4242 2018 42872016 1463 2017 1818 2018 2128
PediatricAdults
Individuals with Disabilities
Service Provider: UrologyGeographic Region: Health Statistic Region Grouping 3
MMISData Source: Data Source Other Specify:
Total Number of services delivered to Beneficiaries by Enrolled Providers identified through claims data. Number of Services Delivered by Health Statistic Region Grouping is based on service county location. HSR Grouping 3 - Colorado Springs/Pueblo includes Chaffee, Custer, El Paso, Fremont, Lake, and Pueblo counties.
Describe the data sources, methodologies, baselines, assumptions, trends, factors, and thresholds:
2016 98 2017 127 2018 128
Year #1 Value Year #2 Value Year #3 Value
2016 813 2017 915 2018 10512016 302 2017 356 2018 429
PediatricAdults
Individuals with Disabilities
Service Provider: Urology
Geographic Region: Health Statistic Region Grouping 4
MMISData Source: Data Source Other Specify:
Total Number of services delivered to Beneficiaries by Enrolled Providers identified through claims data. Number of Services Delivered by Health Statistic Region Grouping is based on service county location. HSR Grouping 4 - San Luis Valley includes Alamosa, Archuleta, Conejos, Costilla, Delta, Dolores, Gunnison, Hinsdale, La Plata, Mineral, Montezuma, Montrose, Ouray, Rio Grande, Saguache, San Juan, and San Miguel counties.
Describe the data sources, methodologies, baselines, assumptions, trends, factors, and thresholds:
Page 83

Template 4: Physician specialist services State: Colorado
2016 249 2017 432 2018 500
Year #1 Value Year #2 Value Year #3 Value
2016 1289 2017 2552 2018 27332016 893 2017 987 2018 1043
PediatricAdults
Individuals with Disabilities
Service Provider: UrologyGeographic Region: Health Statistic Region Grouping 5
MMISData Source: Data Source Other Specify:
Total Number of services delivered to Beneficiaries by Enrolled Providers identified through claims data. Number of Services Delivered by Health Statistic Region Grouping is based on service county location. HSR Grouping 5 - Northern Colorado includes Boulder, Broomfield, Larimer, and Weld counties.
Describe the data sources, methodologies, baselines, assumptions, trends, factors, and thresholds:
2016 674 2017 958 2018 1151
Year #1 Value Year #2 Value Year #3 Value
2016 4884 2017 5526 2018 60582016 1886 2017 2183 2018 2564
PediatricAdults
Individuals with Disabilities
Service Provider: UrologyGeographic Region: Health Statistic Region Grouping 6
MMISData Source: Data Source Other Specify:
Total Number of services delivered to Beneficiaries by Enrolled Providers identified through claims data. Number of Services Delivered by Health Statistic Region Grouping is based on service county location. HSR Grouping 6 - Metro Denver (North & East) includes Adams, Arapahoe, and Denver counties.
Describe the data sources, methodologies, baselines, assumptions, trends, factors, and thresholds:
2016 164 2017 327 2018 291
Year #1 Value Year #2 Value Year #3 Value
2016 1854 2017 2048 2018 20122016 715 2017 862 2018 1009
PediatricAdults
Individuals with Disabilities
Service Provider: UrologyGeographic Region: Health Statistic Region Grouping 7
MMISData Source: Data Source Other Specify:
Total Number of services delivered to Beneficiaries by Enrolled Providers identified through claims data. Number of Services Delivered by Health Statistic Region Grouping is based on service county location. HSR Grouping 7 - Metro Denver (West & South) includes Clear Creek, Douglas, Gilpin, Jefferson, Park, and Teller counties.
Describe the data sources, methodologies, baselines, assumptions, trends, factors, and thresholds:
2016 1642 2017 2727 2018 3019
Year #1 Value Year #2 Value Year #3 Value
2016 14216 2017 16551 2018 178032016 5741 2017 6647 2018 7717
PediatricAdults
Individuals with Disabilities
Service Provider: UrologyGeographic Region: Statewide
MMISData Source: Data Source Other Specify:
Total Number of services delivered to Beneficiaries by Enrolled Providers identified through claims data
Describe the data sources, methodologies, baselines, assumptions, trends, factors, and thresholds:
Page 84

Template 4: Physician specialist services State: Colorado
2016 83 2017 76 2018 99
Year #1 Value Year #2 Value Year #3 Value
2016 2044 2017 2084 2018 21902016 685 2017 814 2018 740
PediatricAdults
Individuals with Disabilities
Service Provider: Vascular SurgeryGeographic Region: Health Statistic Region Grouping 1
MMISData Source: Data Source Other Specify:
Total Number of services delivered to Beneficiaries by Enrolled Providers identified through claims data. Number of Services Delivered by Health Statistic Region Grouping is based on service county location. HSR Grouping 1 - Eastern Plains includes Baca, Bent, Cheyenne, Crowley, Elbert, Huerfano, Kiowa, Kit Carson, Las Animas, Lincoln, Logan, Morgan, Otero, Phillips, Prowers, Sedgwick, Washington, and Yuma counties.
Describe the data sources, methodologies, baselines, assumptions, trends, factors, and thresholds:
2016 61 2017 92 2018 84
Year #1 Value Year #2 Value Year #3 Value
2016 638 2017 799 2018 8302016 191 2017 240 2018 244
PediatricAdults
Individuals with Disabilities
Service Provider: Vascular SurgeryGeographic Region: Health Statistic Region Grouping 2
MMISData Source: Data Source Other Specify:
Total Number of services delivered to Beneficiaries by Enrolled Providers identified through claims data. Number of Services Delivered by Health Statistic Region Grouping is based on service county location. HSR Grouping 2 - Northwestern Colorado includes Eagle, Garfield, Grand, Jackson, Mesa, Moffat, Pitkin, Rio Blanco, Routt, and Summit counties.
Describe the data sources, methodologies, baselines, assumptions, trends, factors, and thresholds:
2016 545 2017 676 2018 652
Year #1 Value Year #2 Value Year #3 Value
2016 10637 2017 13449 2018 130792016 3236 2017 3588 2018 3551
PediatricAdults
Individuals with Disabilities
Service Provider: Vascular SurgeryGeographic Region: Health Statistic Region Grouping 3
MMISData Source: Data Source Other Specify:
Total Number of services delivered to Beneficiaries by Enrolled Providers identified through claims data. Number of Services Delivered by Health Statistic Region Grouping is based on service county location. HSR Grouping 3 - Colorado Springs/Pueblo includes Chaffee, Custer, El Paso, Fremont, Lake, and Pueblo counties.
Describe the data sources, methodologies, baselines, assumptions, trends, factors, and thresholds:
2016 83 2017 142 2018 124
Year #1 Value Year #2 Value Year #3 Value
2016 1647 2017 1970 2018 20752016 563 2017 642 2018 600
PediatricAdults
Individuals with Disabilities
Service Provider: Vascular Surgery
Geographic Region: Health Statistic Region Grouping 4
MMISData Source: Data Source Other Specify:
Total Number of services delivered to Beneficiaries by Enrolled Providers identified through claims data. Number of Services Delivered by Health Statistic Region Grouping is based on service county location. HSR Grouping 4 - San Luis Valley includes Alamosa, Archuleta, Conejos, Costilla, Delta, Dolores, Gunnison, Hinsdale, La Plata, Mineral, Montezuma, Montrose, Ouray, Rio Grande, Saguache, San Juan, and San Miguel counties.
Describe the data sources, methodologies, baselines, assumptions, trends, factors, and thresholds:
Page 85

Template 4: Physician specialist services State: Colorado
2016 315 2017 423 2018 429
Year #1 Value Year #2 Value Year #3 Value
2016 5658 2017 7123 2018 71212016 1633 2017 1826 2018 1966
PediatricAdults
Individuals with Disabilities
Service Provider: Vascular SurgeryGeographic Region: Health Statistic Region Grouping 5
MMISData Source: Data Source Other Specify:
Total Number of services delivered to Beneficiaries by Enrolled Providers identified through claims data. Number of Services Delivered by Health Statistic Region Grouping is based on service county location. HSR Grouping 5 - Northern Colorado includes Boulder, Broomfield, Larimer, and Weld counties.
Describe the data sources, methodologies, baselines, assumptions, trends, factors, and thresholds:
2016 1207 2017 1727 2018 1846
Year #1 Value Year #2 Value Year #3 Value
2016 20642 2017 22375 2018 231322016 4596 2017 4949 2018 5302
PediatricAdults
Individuals with Disabilities
Service Provider: Vascular SurgeryGeographic Region: Health Statistic Region Grouping 6
MMISData Source: Data Source Other Specify:
Total Number of services delivered to Beneficiaries by Enrolled Providers identified through claims data. Number of Services Delivered by Health Statistic Region Grouping is based on service county location. HSR Grouping 6 - Metro Denver (North & East) includes Adams, Arapahoe, and Denver counties.
Describe the data sources, methodologies, baselines, assumptions, trends, factors, and thresholds:
2016 288 2017 365 2018 357
Year #1 Value Year #2 Value Year #3 Value
2016 4857 2017 5962 2018 62372016 1270 2017 1455 2018 1244
PediatricAdults
Individuals with Disabilities
Service Provider: Vascular SurgeryGeographic Region: Health Statistic Region Grouping 7
MMISData Source: Data Source Other Specify:
Total Number of services delivered to Beneficiaries by Enrolled Providers identified through claims data. Number of Services Delivered by Health Statistic Region Grouping is based on service county location. HSR Grouping 7 - Metro Denver (West & South) includes Clear Creek, Douglas, Gilpin, Jefferson, Park, and Teller counties.
Describe the data sources, methodologies, baselines, assumptions, trends, factors, and thresholds:
2016 2582 2017 3501 2018 3591
Year #1 Value Year #2 Value Year #3 Value
2016 46123 2017 53769 2018 546662016 12177 2017 13515 2018 13647
PediatricAdults
Individuals with Disabilities
Service Provider: Vascular SurgeryGeographic Region: Statewide
MMISData Source: Data Source Other Specify:
Total Number of services delivered to Beneficiaries by Enrolled Providers identified through claims data
Describe the data sources, methodologies, baselines, assumptions, trends, factors, and thresholds:
Service Provider Geographic Region Population Year Ratio
Ratio of providers accepting new Medicaid patients to the number of billing (active) Medicaid-enrolled providers
Allergy/Immunology Health Statistic Region Grouping 1 2016 39.38%
Allergy/Immunology Health Statistic Region Grouping 1 2017 43.70%
Allergy/Immunology Health Statistic Region Grouping 1 2018 40.00%
Allergy/Immunology Health Statistic Region Grouping 2 2016 56.25%
Allergy/Immunology Health Statistic Region Grouping 2 2017 67.35%
Allergy/Immunology Health Statistic Region Grouping 2 2018 63.89%
Allergy/Immunology Health Statistic Region Grouping 3 2016 34.81%
Page 86

Template 4: Physician specialist services State: Colorado
Service Provider Geographic Region Population Year Ratio
Ratio of providers accepting new Medicaid patients to the number of billing (active) Medicaid-enrolled providers
Allergy/Immunology Health Statistic Region Grouping 3 2017 43.33%
Allergy/Immunology Health Statistic Region Grouping 3 2018 40.46%
Allergy/Immunology Health Statistic Region Grouping 4 2016 52.43%
Allergy/Immunology Health Statistic Region Grouping 4 2017 56.57%
Allergy/Immunology Health Statistic Region Grouping 4 2018 57.29%
Allergy/Immunology Health Statistic Region Grouping 5 2016 38.78%
Allergy/Immunology Health Statistic Region Grouping 5 2017 48.08%
Allergy/Immunology Health Statistic Region Grouping 5 2018 56.25%
Allergy/Immunology Health Statistic Region Grouping 6 2016 86.46%
Allergy/Immunology Health Statistic Region Grouping 6 2017 76.50%
Allergy/Immunology Health Statistic Region Grouping 6 2018 75.00%
Allergy/Immunology Health Statistic Region Grouping 7 2016 16.34%
Allergy/Immunology Health Statistic Region Grouping 7 2017 28.66%
Allergy/Immunology Health Statistic Region Grouping 7 2018 21.02%
Allergy/Immunology Statewide 2016 98.52%
Allergy/Immunology Statewide 2017 96.62%
Allergy/Immunology Statewide 2018 99.11%
Cardiology Health Statistic Region Grouping 1 2016 17.64%
Cardiology Health Statistic Region Grouping 1 2017 19.29%
Cardiology Health Statistic Region Grouping 2 2016 50.85%
Cardiology Health Statistic Region Grouping 2 2017 48.53%
Cardiology Health Statistic Region Grouping 2 2018 40.37%
Cardiology Health Statistic Region Grouping 3 2016 43.47%
Cardiology Health Statistic Region Grouping 3 2017 47.03%
Cardiology Health Statistic Region Grouping 3 2018 42.24%
Cardiology Health Statistic Region Grouping 4 2016 34.90%
Cardiology Health Statistic Region Grouping 4 2017 33.72%
Cardiology Health Statistic Region Grouping 4 2018 30.61%
Cardiology Health Statistic Region Grouping 5 2016 50.46%
Cardiology Health Statistic Region Grouping 5 2017 52.33%
Cardiology Health Statistic Region Grouping 5 2018 49.11%
Cardiology Health Statistic Region Grouping 6 2016 69.44%
Cardiology Health Statistic Region Grouping 6 2017 63.93%
Cardiology Health Statistic Region Grouping 6 2018 55.26%
Cardiology Health Statistic Region Grouping 7 2016 29.69%
Cardiology Health Statistic Region Grouping 7 2017 33.04%
Cardiology Health Statistic Region Grouping 7 2018 32.01%
Cardiology Statewide 2016 94.10%
Cardiology Statewide 2017 95.83%
Cardiology Statewide 2018 95.77%
Dermatology Health Statistic Region Grouping 2 2016 200.00%
Dermatology Health Statistic Region Grouping 2 2017 125.00%
Dermatology Health Statistic Region Grouping 2 2018 66.67%
Dermatology Health Statistic Region Grouping 3 2016 53.85%
Dermatology Health Statistic Region Grouping 3 2017 66.67%
Dermatology Health Statistic Region Grouping 3 2018 92.31%
Dermatology Health Statistic Region Grouping 4 2016 66.67%
Dermatology Health Statistic Region Grouping 4 2017 75.00%
Dermatology Health Statistic Region Grouping 4 2018 58.33%
Dermatology Health Statistic Region Grouping 5 2016 53.85%
Dermatology Health Statistic Region Grouping 5 2017 65.38%
Dermatology Health Statistic Region Grouping 5 2018 95.24%
Dermatology Health Statistic Region Grouping 6 2016 100.00%
Dermatology Health Statistic Region Grouping 6 2017 93.75%
Dermatology Health Statistic Region Grouping 6 2018 83.72%
Dermatology Health Statistic Region Grouping 7 2016 6.06%
Page 87

Template 4: Physician specialist services State: Colorado
Service Provider Geographic Region Population Year Ratio
Ratio of providers accepting new Medicaid patients to the number of billing (active) Medicaid-enrolled providers
Dermatology Health Statistic Region Grouping 7 2017 3.85%
Dermatology Health Statistic Region Grouping 7 2018 7.69%
Dermatology Statewide 2016 104.35%
Dermatology Statewide 2017 100.00%
Dermatology Statewide 2018 98.84%
Endocrinology Health Statistic Region Grouping 1 2016 26.47%
Endocrinology Health Statistic Region Grouping 1 2017 2.94%
Endocrinology Health Statistic Region Grouping 1 2018 3.85%
Endocrinology Health Statistic Region Grouping 2 2016 85.71%
Endocrinology Health Statistic Region Grouping 2 2017 57.14%
Endocrinology Health Statistic Region Grouping 2 2018 68.00%
Endocrinology Health Statistic Region Grouping 3 2016 41.67%
Endocrinology Health Statistic Region Grouping 3 2017 46.15%
Endocrinology Health Statistic Region Grouping 3 2018 51.79%
Endocrinology Health Statistic Region Grouping 4 2016 50.00%
Endocrinology Health Statistic Region Grouping 4 2017 51.61%
Endocrinology Health Statistic Region Grouping 4 2018 40.63%
Endocrinology Health Statistic Region Grouping 5 2016 91.30%
Endocrinology Health Statistic Region Grouping 5 2017 78.38%
Endocrinology Health Statistic Region Grouping 5 2018 76.19%
Endocrinology Health Statistic Region Grouping 6 2016 80.00%
Endocrinology Health Statistic Region Grouping 6 2017 77.65%
Endocrinology Health Statistic Region Grouping 6 2018 88.24%
Endocrinology Health Statistic Region Grouping 7 2016 45.83%
Endocrinology Health Statistic Region Grouping 7 2017 46.77%
Endocrinology Health Statistic Region Grouping 7 2018 36.96%
Endocrinology Statewide 2016 89.47%
Endocrinology Statewide 2017 88.57%
Endocrinology Statewide 2018 95.75%
Gastroenterology Health Statistic Region Grouping 1 2016 0.00%
Gastroenterology Health Statistic Region Grouping 1 2017 4.44%
Gastroenterology Health Statistic Region Grouping 1 2018 0.00%
Gastroenterology Health Statistic Region Grouping 2 2016 30.43%
Gastroenterology Health Statistic Region Grouping 2 2017 44.83%
Gastroenterology Health Statistic Region Grouping 2 2018 51.85%
Gastroenterology Health Statistic Region Grouping 3 2016 32.50%
Gastroenterology Health Statistic Region Grouping 3 2017 35.38%
Gastroenterology Health Statistic Region Grouping 3 2018 32.89%
Gastroenterology Health Statistic Region Grouping 4 2016 24.14%
Gastroenterology Health Statistic Region Grouping 4 2017 21.88%
Gastroenterology Health Statistic Region Grouping 4 2018 15.56%
Gastroenterology Health Statistic Region Grouping 5 2016 42.86%
Gastroenterology Health Statistic Region Grouping 5 2017 42.31%
Gastroenterology Health Statistic Region Grouping 5 2018 38.81%
Gastroenterology Health Statistic Region Grouping 6 2016 104.64%
Gastroenterology Health Statistic Region Grouping 6 2017 90.57%
Gastroenterology Health Statistic Region Grouping 6 2018 73.50%
Gastroenterology Health Statistic Region Grouping 7 2016 35.79%
Gastroenterology Health Statistic Region Grouping 7 2017 43.59%
Gastroenterology Health Statistic Region Grouping 7 2018 44.05%
Gastroenterology Statewide 2016 100.00%
Gastroenterology Statewide 2017 98.59%
Gastroenterology Statewide 2018 98.51%
Neurology Health Statistic Region Grouping 1 2016 14.64%
Neurology Health Statistic Region Grouping 1 2017 7.57%
Neurology Health Statistic Region Grouping 1 2018 5.82%
Page 88

Template 4: Physician specialist services State: Colorado
Service Provider Geographic Region Population Year Ratio
Ratio of providers accepting new Medicaid patients to the number of billing (active) Medicaid-enrolled providers
Neurology Health Statistic Region Grouping 2 2016 38.93%
Neurology Health Statistic Region Grouping 2 2017 23.01%
Neurology Health Statistic Region Grouping 2 2018 18.80%
Neurology Health Statistic Region Grouping 3 2016 52.30%
Neurology Health Statistic Region Grouping 3 2017 42.17%
Neurology Health Statistic Region Grouping 3 2018 29.24%
Neurology Health Statistic Region Grouping 4 2016 28.40%
Neurology Health Statistic Region Grouping 4 2017 21.92%
Neurology Health Statistic Region Grouping 4 2018 14.72%
Neurology Health Statistic Region Grouping 5 2016 51.21%
Neurology Health Statistic Region Grouping 5 2017 37.16%
Neurology Health Statistic Region Grouping 5 2018 30.56%
Neurology Health Statistic Region Grouping 6 2016 91.60%
Neurology Health Statistic Region Grouping 6 2017 78.43%
Neurology Health Statistic Region Grouping 6 2018 68.16%
Neurology Health Statistic Region Grouping 7 2016 27.08%
Neurology Health Statistic Region Grouping 7 2017 17.92%
Neurology Health Statistic Region Grouping 7 2018 17.79%
Neurology Statewide 2016 94.70%
Neurology Statewide 2017 92.24%
Neurology Statewide 2018 90.31%
Nuclear Medicine Health Statistic Region Grouping 1 2016 21.88%
Nuclear Medicine Health Statistic Region Grouping 1 2017 14.63%
Nuclear Medicine Health Statistic Region Grouping 1 2018 6.45%
Nuclear Medicine Health Statistic Region Grouping 2 2016 57.69%
Nuclear Medicine Health Statistic Region Grouping 2 2017 31.65%
Nuclear Medicine Health Statistic Region Grouping 2 2018 20.39%
Nuclear Medicine Health Statistic Region Grouping 3 2016 58.72%
Nuclear Medicine Health Statistic Region Grouping 3 2017 43.78%
Nuclear Medicine Health Statistic Region Grouping 3 2018 27.83%
Nuclear Medicine Health Statistic Region Grouping 4 2016 46.89%
Nuclear Medicine Health Statistic Region Grouping 4 2017 21.95%
Nuclear Medicine Health Statistic Region Grouping 4 2018 10.26%
Nuclear Medicine Health Statistic Region Grouping 5 2016 60.41%
Nuclear Medicine Health Statistic Region Grouping 5 2017 44.32%
Nuclear Medicine Health Statistic Region Grouping 5 2018 22.75%
Nuclear Medicine Health Statistic Region Grouping 6 2016 80.30%
Nuclear Medicine Health Statistic Region Grouping 6 2017 54.66%
Nuclear Medicine Health Statistic Region Grouping 6 2018 26.14%
Nuclear Medicine Health Statistic Region Grouping 7 2016 38.79%
Nuclear Medicine Health Statistic Region Grouping 7 2017 24.17%
Nuclear Medicine Health Statistic Region Grouping 7 2018 15.30%
Nuclear Medicine Statewide 2016 89.45%
Nuclear Medicine Statewide 2017 71.53%
Nuclear Medicine Statewide 2018 51.59%
Ophthalmology Health Statistic Region Grouping 1 2016 15.64%
Ophthalmology Health Statistic Region Grouping 1 2017 7.53%
Ophthalmology Health Statistic Region Grouping 1 2018 3.86%
Ophthalmology Health Statistic Region Grouping 2 2016 34.79%
Ophthalmology Health Statistic Region Grouping 2 2017 26.94%
Ophthalmology Health Statistic Region Grouping 2 2018 13.96%
Ophthalmology Health Statistic Region Grouping 3 2016 33.43%
Ophthalmology Health Statistic Region Grouping 3 2017 23.37%
Ophthalmology Health Statistic Region Grouping 3 2018 18.57%
Ophthalmology Health Statistic Region Grouping 4 2016 26.47%
Ophthalmology Health Statistic Region Grouping 4 2017 17.55%
Page 89

Template 4: Physician specialist services State: Colorado
Service Provider Geographic Region Population Year Ratio
Ratio of providers accepting new Medicaid patients to the number of billing (active) Medicaid-enrolled providers
Ophthalmology Health Statistic Region Grouping 4 2018 10.80%
Ophthalmology Health Statistic Region Grouping 5 2016 39.25%
Ophthalmology Health Statistic Region Grouping 5 2017 28.51%
Ophthalmology Health Statistic Region Grouping 5 2018 20.92%
Ophthalmology Health Statistic Region Grouping 6 2016 50.55%
Ophthalmology Health Statistic Region Grouping 6 2017 33.05%
Ophthalmology Health Statistic Region Grouping 6 2018 25.51%
Ophthalmology Health Statistic Region Grouping 7 2016 18.36%
Ophthalmology Health Statistic Region Grouping 7 2017 14.32%
Ophthalmology Health Statistic Region Grouping 7 2018 12.60%
Ophthalmology Statewide 2016 72.08%
Ophthalmology Statewide 2017 56.41%
Ophthalmology Statewide 2018 47.93%
Otolaryngology Health Statistic Region Grouping 1 2016 21.13%
Otolaryngology Health Statistic Region Grouping 1 2017 9.90%
Otolaryngology Health Statistic Region Grouping 1 2018 6.50%
Otolaryngology Health Statistic Region Grouping 2 2016 48.31%
Otolaryngology Health Statistic Region Grouping 2 2017 37.90%
Otolaryngology Health Statistic Region Grouping 2 2018 33.33%
Otolaryngology Health Statistic Region Grouping 3 2016 47.68%
Otolaryngology Health Statistic Region Grouping 3 2017 27.44%
Otolaryngology Health Statistic Region Grouping 3 2018 22.67%
Otolaryngology Health Statistic Region Grouping 4 2016 50.78%
Otolaryngology Health Statistic Region Grouping 4 2017 29.33%
Otolaryngology Health Statistic Region Grouping 4 2018 29.33%
Otolaryngology Health Statistic Region Grouping 5 2016 49.30%
Otolaryngology Health Statistic Region Grouping 5 2017 29.18%
Otolaryngology Health Statistic Region Grouping 5 2018 26.98%
Otolaryngology Health Statistic Region Grouping 6 2016 71.89%
Otolaryngology Health Statistic Region Grouping 6 2017 42.42%
Otolaryngology Health Statistic Region Grouping 6 2018 33.50%
Otolaryngology Health Statistic Region Grouping 7 2016 31.47%
Otolaryngology Health Statistic Region Grouping 7 2017 25.48%
Otolaryngology Health Statistic Region Grouping 7 2018 22.70%
Otolaryngology Statewide 2016 86.03%
Otolaryngology Statewide 2017 59.74%
Otolaryngology Statewide 2018 55.34%
Pulmonary Disease Health Statistic Region Grouping 1 2016 23.49%
Pulmonary Disease Health Statistic Region Grouping 1 2017 23.37%
Pulmonary Disease Health Statistic Region Grouping 1 2018 19.08%
Pulmonary Disease Health Statistic Region Grouping 2 2016 61.58%
Pulmonary Disease Health Statistic Region Grouping 2 2017 60.67%
Pulmonary Disease Health Statistic Region Grouping 2 2018 56.09%
Pulmonary Disease Health Statistic Region Grouping 3 2016 53.20%
Pulmonary Disease Health Statistic Region Grouping 3 2017 58.84%
Pulmonary Disease Health Statistic Region Grouping 3 2018 52.17%
Pulmonary Disease Health Statistic Region Grouping 4 2016 47.53%
Pulmonary Disease Health Statistic Region Grouping 4 2017 49.37%
Pulmonary Disease Health Statistic Region Grouping 4 2018 46.88%
Pulmonary Disease Health Statistic Region Grouping 5 2016 56.08%
Pulmonary Disease Health Statistic Region Grouping 5 2017 61.80%
Pulmonary Disease Health Statistic Region Grouping 5 2018 59.06%
Pulmonary Disease Health Statistic Region Grouping 6 2016 78.73%
Pulmonary Disease Health Statistic Region Grouping 6 2017 74.37%
Pulmonary Disease Health Statistic Region Grouping 6 2018 63.53%
Pulmonary Disease Health Statistic Region Grouping 7 2016 36.25%
Page 90

Template 4: Physician specialist services State: Colorado
Service Provider Geographic Region Population Year Ratio
Ratio of providers accepting new Medicaid patients to the number of billing (active) Medicaid-enrolled providers
Pulmonary Disease Health Statistic Region Grouping 7 2017 41.06%
Pulmonary Disease Health Statistic Region Grouping 7 2018 38.19%
Pulmonary Disease Statewide 2016 98.42%
Pulmonary Disease Statewide 2017 100.33%
Pulmonary Disease Statewide 2018 100.38%
Radiation Oncology Health Statistic Region Grouping 1 2016 3.45%
Radiation Oncology Health Statistic Region Grouping 1 2017 5.88%
Radiation Oncology Health Statistic Region Grouping 1 2018 7.14%
Radiation Oncology Health Statistic Region Grouping 2 2016 31.25%
Radiation Oncology Health Statistic Region Grouping 2 2017 50.00%
Radiation Oncology Health Statistic Region Grouping 2 2018 33.33%
Radiation Oncology Health Statistic Region Grouping 3 2016 41.51%
Radiation Oncology Health Statistic Region Grouping 3 2017 27.08%
Radiation Oncology Health Statistic Region Grouping 3 2018 21.43%
Radiation Oncology Health Statistic Region Grouping 4 2016 29.03%
Radiation Oncology Health Statistic Region Grouping 4 2017 8.89%
Radiation Oncology Health Statistic Region Grouping 4 2018 9.52%
Radiation Oncology Health Statistic Region Grouping 5 2016 47.46%
Radiation Oncology Health Statistic Region Grouping 5 2017 44.64%
Radiation Oncology Health Statistic Region Grouping 5 2018 33.90%
Radiation Oncology Health Statistic Region Grouping 6 2016 88.07%
Radiation Oncology Health Statistic Region Grouping 6 2017 71.28%
Radiation Oncology Health Statistic Region Grouping 6 2018 64.86%
Radiation Oncology Health Statistic Region Grouping 7 2016 24.64%
Radiation Oncology Health Statistic Region Grouping 7 2017 21.74%
Radiation Oncology Health Statistic Region Grouping 7 2018 23.81%
Radiation Oncology Statewide 2016 94.44%
Radiation Oncology Statewide 2017 95.42%
Radiation Oncology Statewide 2018 94.49%
Urology Health Statistic Region Grouping 1 2016 17.81%
Urology Health Statistic Region Grouping 1 2017 13.17%
Urology Health Statistic Region Grouping 1 2018 13.93%
Urology Health Statistic Region Grouping 2 2016 50.96%
Urology Health Statistic Region Grouping 2 2017 51.47%
Urology Health Statistic Region Grouping 2 2018 46.43%
Urology Health Statistic Region Grouping 3 2016 51.46%
Urology Health Statistic Region Grouping 3 2017 41.55%
Urology Health Statistic Region Grouping 3 2018 37.89%
Urology Health Statistic Region Grouping 4 2016 41.11%
Urology Health Statistic Region Grouping 4 2017 27.91%
Urology Health Statistic Region Grouping 4 2018 24.02%
Urology Health Statistic Region Grouping 5 2016 57.87%
Urology Health Statistic Region Grouping 5 2017 41.31%
Urology Health Statistic Region Grouping 5 2018 40.24%
Urology Health Statistic Region Grouping 6 2016 81.75%
Urology Health Statistic Region Grouping 6 2017 72.11%
Urology Health Statistic Region Grouping 6 2018 64.69%
Urology Health Statistic Region Grouping 7 2016 35.45%
Urology Health Statistic Region Grouping 7 2017 29.36%
Urology Health Statistic Region Grouping 7 2018 33.33%
Urology Statewide 2016 87.60%
Urology Statewide 2017 86.34%
Urology Statewide 2018 85.17%
Vascular Surgery Health Statistic Region Grouping 1 2016 23.27%
Vascular Surgery Health Statistic Region Grouping 1 2017 14.44%
Vascular Surgery Health Statistic Region Grouping 1 2018 4.09%
Page 91

Template 4: Physician specialist services State: Colorado
Service Provider Geographic Region Population Year Ratio
Ratio of providers accepting new Medicaid patients to the number of billing (active) Medicaid-enrolled providers
Vascular Surgery Health Statistic Region Grouping 2 2016 52.88%
Vascular Surgery Health Statistic Region Grouping 2 2017 23.14%
Vascular Surgery Health Statistic Region Grouping 2 2018 16.44%
Vascular Surgery Health Statistic Region Grouping 3 2016 52.86%
Vascular Surgery Health Statistic Region Grouping 3 2017 39.94%
Vascular Surgery Health Statistic Region Grouping 3 2018 17.48%
Vascular Surgery Health Statistic Region Grouping 4 2016 44.03%
Vascular Surgery Health Statistic Region Grouping 4 2017 19.38%
Vascular Surgery Health Statistic Region Grouping 4 2018 7.64%
Vascular Surgery Health Statistic Region Grouping 5 2016 53.09%
Vascular Surgery Health Statistic Region Grouping 5 2017 39.31%
Vascular Surgery Health Statistic Region Grouping 5 2018 20.63%
Vascular Surgery Health Statistic Region Grouping 6 2016 73.59%
Vascular Surgery Health Statistic Region Grouping 6 2017 56.02%
Vascular Surgery Health Statistic Region Grouping 6 2018 30.62%
Vascular Surgery Health Statistic Region Grouping 7 2016 28.73%
Vascular Surgery Health Statistic Region Grouping 7 2017 24.93%
Vascular Surgery Health Statistic Region Grouping 7 2018 12.75%
Vascular Surgery Statewide 2016 87.82%
Vascular Surgery Statewide 2017 76.40%
Vascular Surgery Statewide 2018 54.98%
Service Provider Geographic Region Population Year Ratio
Ratio of services to beneficaries
Allergy/Immunology Health Statistic Region Grouping 1 Pediatric 2016 366.16%
Allergy/Immunology Health Statistic Region Grouping 1 Pediatric 2017 339.53%
Allergy/Immunology Health Statistic Region Grouping 1 Pediatric 2018 254.09%
Allergy/Immunology Health Statistic Region Grouping 1 Adults 2016 462.15%
Allergy/Immunology Health Statistic Region Grouping 1 Adults 2017 561.90%
Allergy/Immunology Health Statistic Region Grouping 1 Adults 2018 497.58%
Allergy/Immunology Health Statistic Region Grouping 1 Individuals with Disabilities 2016 302.27%
Allergy/Immunology Health Statistic Region Grouping 1 Individuals with Disabilities 2017 253.85%
Allergy/Immunology Health Statistic Region Grouping 1 Individuals with Disabilities 2018 173.68%
Allergy/Immunology Health Statistic Region Grouping 2 Pediatric 2016 321.50%
Allergy/Immunology Health Statistic Region Grouping 2 Pediatric 2017 317.94%
Allergy/Immunology Health Statistic Region Grouping 2 Pediatric 2018 286.45%
Allergy/Immunology Health Statistic Region Grouping 2 Adults 2016 647.57%
Allergy/Immunology Health Statistic Region Grouping 2 Adults 2017 459.09%
Allergy/Immunology Health Statistic Region Grouping 2 Adults 2018 336.36%
Allergy/Immunology Health Statistic Region Grouping 3 Pediatric 2016 414.16%
Allergy/Immunology Health Statistic Region Grouping 3 Pediatric 2017 406.45%
Allergy/Immunology Health Statistic Region Grouping 3 Pediatric 2018 424.04%
Allergy/Immunology Health Statistic Region Grouping 3 Adults 2016 608.19%
Allergy/Immunology Health Statistic Region Grouping 3 Adults 2017 662.83%
Allergy/Immunology Health Statistic Region Grouping 3 Adults 2018 661.53%
Allergy/Immunology Health Statistic Region Grouping 3 Individuals with Disabilities 2016 671.05%
Allergy/Immunology Health Statistic Region Grouping 3 Individuals with Disabilities 2017 717.92%
Allergy/Immunology Health Statistic Region Grouping 3 Individuals with Disabilities 2018 657.53%
Allergy/Immunology Health Statistic Region Grouping 4 Pediatric 2016 373.81%
Allergy/Immunology Health Statistic Region Grouping 4 Pediatric 2017 366.67%
Allergy/Immunology Health Statistic Region Grouping 4 Pediatric 2018 319.18%
Allergy/Immunology Health Statistic Region Grouping 4 Adults 2016 513.22%
Allergy/Immunology Health Statistic Region Grouping 4 Adults 2017 379.77%
Allergy/Immunology Health Statistic Region Grouping 4 Adults 2018 363.19%
Allergy/Immunology Health Statistic Region Grouping 4 Individuals with Disabilities 2016 619.51%
Allergy/Immunology Health Statistic Region Grouping 4 Individuals with Disabilities 2017 646.51%
Page 92

Template 4: Physician specialist services State: Colorado
Service Provider Geographic Region Population Year Ratio
Ratio of services to beneficaries
Allergy/Immunology Health Statistic Region Grouping 4 Individuals with Disabilities 2018 480.00%
Allergy/Immunology Health Statistic Region Grouping 5 Pediatric 2016 496.38%
Allergy/Immunology Health Statistic Region Grouping 5 Pediatric 2017 471.17%
Allergy/Immunology Health Statistic Region Grouping 5 Pediatric 2018 518.73%
Allergy/Immunology Health Statistic Region Grouping 5 Adults 2016 792.46%
Allergy/Immunology Health Statistic Region Grouping 5 Adults 2017 766.16%
Allergy/Immunology Health Statistic Region Grouping 5 Adults 2018 706.37%
Allergy/Immunology Health Statistic Region Grouping 5 Individuals with Disabilities 2016 658.11%
Allergy/Immunology Health Statistic Region Grouping 5 Individuals with Disabilities 2017 695.51%
Allergy/Immunology Health Statistic Region Grouping 5 Individuals with Disabilities 2018 560.85%
Allergy/Immunology Health Statistic Region Grouping 6 Pediatric 2016 356.69%
Allergy/Immunology Health Statistic Region Grouping 6 Pediatric 2017 324.70%
Allergy/Immunology Health Statistic Region Grouping 6 Pediatric 2018 288.30%
Allergy/Immunology Health Statistic Region Grouping 6 Adults 2016 577.33%
Allergy/Immunology Health Statistic Region Grouping 6 Adults 2017 555.23%
Allergy/Immunology Health Statistic Region Grouping 6 Adults 2018 543.53%
Allergy/Immunology Health Statistic Region Grouping 6 Individuals with Disabilities 2016 525.29%
Allergy/Immunology Health Statistic Region Grouping 6 Individuals with Disabilities 2017 461.94%
Allergy/Immunology Health Statistic Region Grouping 6 Individuals with Disabilities 2018 403.75%
Allergy/Immunology Health Statistic Region Grouping 7 Pediatric 2016 361.34%
Allergy/Immunology Health Statistic Region Grouping 7 Pediatric 2017 322.72%
Allergy/Immunology Health Statistic Region Grouping 7 Pediatric 2018 308.58%
Allergy/Immunology Health Statistic Region Grouping 7 Adults 2016 608.10%
Allergy/Immunology Health Statistic Region Grouping 7 Adults 2017 626.55%
Allergy/Immunology Health Statistic Region Grouping 7 Adults 2018 605.37%
Allergy/Immunology Health Statistic Region Grouping 7 Individuals with Disabilities 2016 641.10%
Allergy/Immunology Health Statistic Region Grouping 7 Individuals with Disabilities 2017 462.37%
Allergy/Immunology Health Statistic Region Grouping 7 Individuals with Disabilities 2018 493.22%
Allergy/Immunology Statewide Pediatric 2016 391.90%
Allergy/Immunology Statewide Pediatric 2017 366.48%
Allergy/Immunology Statewide Pediatric 2018 353.85%
Allergy/Immunology Statewide Adults 2016 625.65%
Allergy/Immunology Statewide Adults 2017 621.74%
Allergy/Immunology Statewide Adults 2018 603.13%
Allergy/Immunology Statewide Individuals with Disabilities 2016 595.49%
Allergy/Immunology Statewide Individuals with Disabilities 2017 581.96%
Allergy/Immunology Statewide Individuals with Disabilities 2018 508.75%
Cardiology Health Statistic Region Grouping 1 Pediatric 2016 200.23%
Cardiology Health Statistic Region Grouping 1 Pediatric 2017 233.61%
Cardiology Health Statistic Region Grouping 1 Pediatric 2018 221.95%
Cardiology Health Statistic Region Grouping 1 Adults 2016 278.15%
Cardiology Health Statistic Region Grouping 1 Adults 2017 297.58%
Cardiology Health Statistic Region Grouping 1 Adults 2018 297.01%
Cardiology Health Statistic Region Grouping 1 Individuals with Disabilities 2016 306.72%
Cardiology Health Statistic Region Grouping 1 Individuals with Disabilities 2017 341.74%
Cardiology Health Statistic Region Grouping 1 Individuals with Disabilities 2018 331.54%
Cardiology Health Statistic Region Grouping 2 Pediatric 2016 188.43%
Cardiology Health Statistic Region Grouping 2 Pediatric 2017 183.61%
Cardiology Health Statistic Region Grouping 2 Pediatric 2018 194.73%
Cardiology Health Statistic Region Grouping 2 Adults 2016 232.66%
Cardiology Health Statistic Region Grouping 2 Adults 2017 238.92%
Cardiology Health Statistic Region Grouping 2 Adults 2018 245.41%
Cardiology Health Statistic Region Grouping 2 Individuals with Disabilities 2016 295.63%
Cardiology Health Statistic Region Grouping 2 Individuals with Disabilities 2017 325.51%
Cardiology Health Statistic Region Grouping 2 Individuals with Disabilities 2018 297.76%
Cardiology Health Statistic Region Grouping 3 Pediatric 2016 170.66%
Cardiology Health Statistic Region Grouping 3 Pediatric 2017 202.10%
Cardiology Health Statistic Region Grouping 3 Pediatric 2018 212.83%
Page 93

Template 4: Physician specialist services State: Colorado
Service Provider Geographic Region Population Year Ratio
Ratio of services to beneficaries
Cardiology Health Statistic Region Grouping 3 Adults 2016 251.15%
Cardiology Health Statistic Region Grouping 3 Adults 2017 290.58%
Cardiology Health Statistic Region Grouping 3 Adults 2018 299.61%
Cardiology Health Statistic Region Grouping 3 Individuals with Disabilities 2016 290.79%
Cardiology Health Statistic Region Grouping 3 Individuals with Disabilities 2017 357.23%
Cardiology Health Statistic Region Grouping 3 Individuals with Disabilities 2018 363.01%
Cardiology Health Statistic Region Grouping 4 Pediatric 2016 183.74%
Cardiology Health Statistic Region Grouping 4 Pediatric 2017 212.55%
Cardiology Health Statistic Region Grouping 4 Pediatric 2018 226.93%
Cardiology Health Statistic Region Grouping 4 Adults 2016 241.93%
Cardiology Health Statistic Region Grouping 4 Adults 2017 267.72%
Cardiology Health Statistic Region Grouping 4 Adults 2018 272.75%
Cardiology Health Statistic Region Grouping 4 Individuals with Disabilities 2016 285.75%
Cardiology Health Statistic Region Grouping 4 Individuals with Disabilities 2017 308.96%
Cardiology Health Statistic Region Grouping 4 Individuals with Disabilities 2018 298.66%
Cardiology Health Statistic Region Grouping 5 Pediatric 2016 224.13%
Cardiology Health Statistic Region Grouping 5 Pediatric 2017 258.26%
Cardiology Health Statistic Region Grouping 5 Pediatric 2018 252.50%
Cardiology Health Statistic Region Grouping 5 Adults 2016 295.34%
Cardiology Health Statistic Region Grouping 5 Adults 2017 305.58%
Cardiology Health Statistic Region Grouping 5 Adults 2018 304.18%
Cardiology Health Statistic Region Grouping 5 Individuals with Disabilities 2016 347.43%
Cardiology Health Statistic Region Grouping 5 Individuals with Disabilities 2017 373.87%
Cardiology Health Statistic Region Grouping 5 Individuals with Disabilities 2018 376.86%
Cardiology Health Statistic Region Grouping 6 Pediatric 2016 184.98%
Cardiology Health Statistic Region Grouping 6 Pediatric 2017 236.66%
Cardiology Health Statistic Region Grouping 6 Pediatric 2018 238.30%
Cardiology Health Statistic Region Grouping 6 Adults 2016 294.98%
Cardiology Health Statistic Region Grouping 6 Adults 2017 297.15%
Cardiology Health Statistic Region Grouping 6 Adults 2018 298.16%
Cardiology Health Statistic Region Grouping 6 Individuals with Disabilities 2016 362.69%
Cardiology Health Statistic Region Grouping 6 Individuals with Disabilities 2017 385.16%
Cardiology Health Statistic Region Grouping 6 Individuals with Disabilities 2018 378.54%
Cardiology Health Statistic Region Grouping 7 Pediatric 2016 178.89%
Cardiology Health Statistic Region Grouping 7 Pediatric 2017 237.14%
Cardiology Health Statistic Region Grouping 7 Pediatric 2018 225.76%
Cardiology Health Statistic Region Grouping 7 Adults 2016 257.78%
Cardiology Health Statistic Region Grouping 7 Adults 2017 276.55%
Cardiology Health Statistic Region Grouping 7 Adults 2018 2828.81%
Cardiology Health Statistic Region Grouping 7 Individuals with Disabilities 2016 299.77%
Cardiology Health Statistic Region Grouping 7 Individuals with Disabilities 2017 343.40%
Cardiology Health Statistic Region Grouping 7 Individuals with Disabilities 2018 324.40%
Cardiology Statewide Pediatric 2016 187.98%
Cardiology Statewide Pediatric 2017 228.41%
Cardiology Statewide Pediatric 2018 230.45%
Cardiology Statewide Adults 2016 278.29%
Cardiology Statewide Adults 2017 293.32%
Cardiology Statewide Adults 2018 297.27%
Cardiology Statewide Individuals with Disabilities 2016 331.06%
Cardiology Statewide Individuals with Disabilities 2017 367.29%
Cardiology Statewide Individuals with Disabilities 2018 363.75%
Dermatology Health Statistic Region Grouping 5 Adults 2016 1063.33%
Dermatology Health Statistic Region Grouping 5 Adults 2017 1352.78%
Dermatology Health Statistic Region Grouping 6 Pediatric 2017 2334.04%
Dermatology Health Statistic Region Grouping 6 Pediatric 2018 2500.00%
Dermatology Health Statistic Region Grouping 6 Adults 2016 1365.06%
Dermatology Health Statistic Region Grouping 6 Adults 2017 1278.48%
Dermatology Health Statistic Region Grouping 6 Adults 2018 1075.34%
Page 94

Template 4: Physician specialist services State: Colorado
Service Provider Geographic Region Population Year Ratio
Ratio of services to beneficaries
Dermatology Statewide Pediatric 2016 1715.25%
Dermatology Statewide Pediatric 2017 2201.09%
Dermatology Statewide Pediatric 2018 2691.78%
Dermatology Statewide Adults 2016 1193.83%
Dermatology Statewide Adults 2017 1224.68%
Dermatology Statewide Adults 2018 938.36%
Dermatology Statewide Individuals with Disabilities 2016 1360.00%
Dermatology Statewide Individuals with Disabilities 2017 933.33%
Dermatology Statewide Individuals with Disabilities 2018 851.06%
Endocrinology Health Statistic Region Grouping 1 Adults 2016 193.94%
Endocrinology Health Statistic Region Grouping 3 Adults 2016 156.04%
Endocrinology Health Statistic Region Grouping 3 Adults 2017 179.37%
Endocrinology Health Statistic Region Grouping 3 Adults 2018 180.00%
Endocrinology Health Statistic Region Grouping 3 Individuals with Disabilities 2017 170.00%
Endocrinology Health Statistic Region Grouping 5 Adults 2016 213.33%
Endocrinology Health Statistic Region Grouping 5 Adults 2017 221.18%
Endocrinology Health Statistic Region Grouping 5 Adults 2018 215.09%
Endocrinology Health Statistic Region Grouping 6 Adults 2016 156.56%
Endocrinology Health Statistic Region Grouping 6 Adults 2017 173.44%
Endocrinology Health Statistic Region Grouping 6 Adults 2018 186.36%
Endocrinology Health Statistic Region Grouping 6 Individuals with Disabilities 2017 151.61%
Endocrinology Health Statistic Region Grouping 7 Adults 2016 147.17%
Endocrinology Health Statistic Region Grouping 7 Adults 2017 180.00%
Endocrinology Health Statistic Region Grouping 7 Adults 2018 182.93%
Endocrinology Statewide Adults 2016 173.46%
Endocrinology Statewide Adults 2017 188.38%
Endocrinology Statewide Adults 2018 191.12%
Endocrinology Statewide Individuals with Disabilities 2016 175.29%
Endocrinology Statewide Individuals with Disabilities 2017 164.21%
Endocrinology Statewide Individuals with Disabilities 2018 165.00%
Gastroenterology Health Statistic Region Grouping 1 Adults 2017 151.11%
Gastroenterology Health Statistic Region Grouping 1 Adults 2018 171.05%
Gastroenterology Health Statistic Region Grouping 3 Pediatric 2016 137.93%
Gastroenterology Health Statistic Region Grouping 3 Pediatric 2017 158.97%
Gastroenterology Health Statistic Region Grouping 3 Pediatric 2018 167.65%
Gastroenterology Health Statistic Region Grouping 3 Adults 2016 149.32%
Gastroenterology Health Statistic Region Grouping 3 Adults 2017 152.69%
Gastroenterology Health Statistic Region Grouping 3 Adults 2018 139.90%
Gastroenterology Health Statistic Region Grouping 3 Individuals with Disabilities 2016 133.33%
Gastroenterology Health Statistic Region Grouping 3 Individuals with Disabilities 2017 154.05%
Gastroenterology Health Statistic Region Grouping 3 Individuals with Disabilities 2018 152.14%
Gastroenterology Health Statistic Region Grouping 4 Adults 2016 127.50%
Gastroenterology Health Statistic Region Grouping 4 Adults 2017 141.18%
Gastroenterology Health Statistic Region Grouping 4 Adults 2018 150.00%
Gastroenterology Health Statistic Region Grouping 5 Adults 2016 151.88%
Gastroenterology Health Statistic Region Grouping 5 Adults 2017 157.41%
Gastroenterology Health Statistic Region Grouping 5 Adults 2018 157.62%
Gastroenterology Health Statistic Region Grouping 5 Individuals with Disabilities 2016 124.39%
Gastroenterology Health Statistic Region Grouping 5 Individuals with Disabilities 2017 159.57%
Gastroenterology Health Statistic Region Grouping 5 Individuals with Disabilities 2018 146.00%
Gastroenterology Health Statistic Region Grouping 6 Pediatric 2016 117.81%
Gastroenterology Health Statistic Region Grouping 6 Pediatric 2017 157.14%
Gastroenterology Health Statistic Region Grouping 6 Pediatric 2018 145.13%
Gastroenterology Health Statistic Region Grouping 6 Adults 2016 152.89%
Gastroenterology Health Statistic Region Grouping 6 Adults 2017 163.37%
Gastroenterology Health Statistic Region Grouping 6 Adults 2018 175.78%
Gastroenterology Health Statistic Region Grouping 6 Individuals with Disabilities 2016 139.37%
Gastroenterology Health Statistic Region Grouping 6 Individuals with Disabilities 2017 160.00%
Page 95
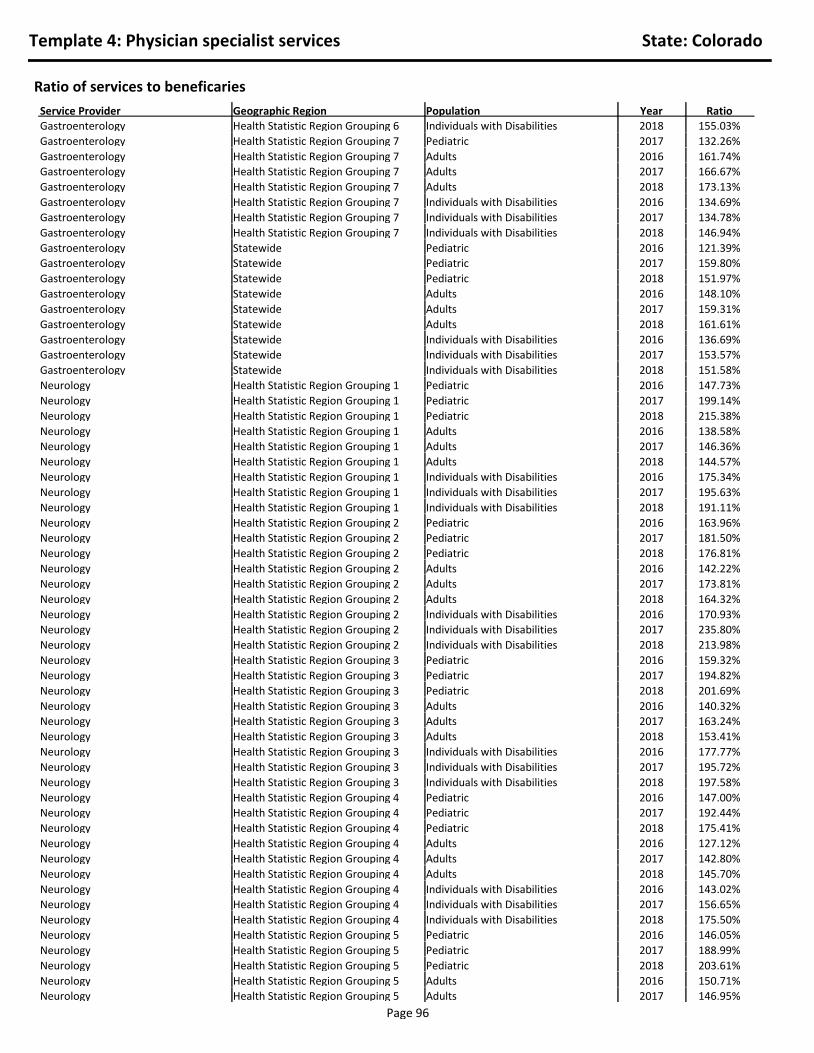
Template 4: Physician specialist services State: Colorado
Service Provider Geographic Region Population Year Ratio
Ratio of services to beneficaries
Gastroenterology Health Statistic Region Grouping 6 Individuals with Disabilities 2018 155.03%
Gastroenterology Health Statistic Region Grouping 7 Pediatric 2017 132.26%
Gastroenterology Health Statistic Region Grouping 7 Adults 2016 161.74%
Gastroenterology Health Statistic Region Grouping 7 Adults 2017 166.67%
Gastroenterology Health Statistic Region Grouping 7 Adults 2018 173.13%
Gastroenterology Health Statistic Region Grouping 7 Individuals with Disabilities 2016 134.69%
Gastroenterology Health Statistic Region Grouping 7 Individuals with Disabilities 2017 134.78%
Gastroenterology Health Statistic Region Grouping 7 Individuals with Disabilities 2018 146.94%
Gastroenterology Statewide Pediatric 2016 121.39%
Gastroenterology Statewide Pediatric 2017 159.80%
Gastroenterology Statewide Pediatric 2018 151.97%
Gastroenterology Statewide Adults 2016 148.10%
Gastroenterology Statewide Adults 2017 159.31%
Gastroenterology Statewide Adults 2018 161.61%
Gastroenterology Statewide Individuals with Disabilities 2016 136.69%
Gastroenterology Statewide Individuals with Disabilities 2017 153.57%
Gastroenterology Statewide Individuals with Disabilities 2018 151.58%
Neurology Health Statistic Region Grouping 1 Pediatric 2016 147.73%
Neurology Health Statistic Region Grouping 1 Pediatric 2017 199.14%
Neurology Health Statistic Region Grouping 1 Pediatric 2018 215.38%
Neurology Health Statistic Region Grouping 1 Adults 2016 138.58%
Neurology Health Statistic Region Grouping 1 Adults 2017 146.36%
Neurology Health Statistic Region Grouping 1 Adults 2018 144.57%
Neurology Health Statistic Region Grouping 1 Individuals with Disabilities 2016 175.34%
Neurology Health Statistic Region Grouping 1 Individuals with Disabilities 2017 195.63%
Neurology Health Statistic Region Grouping 1 Individuals with Disabilities 2018 191.11%
Neurology Health Statistic Region Grouping 2 Pediatric 2016 163.96%
Neurology Health Statistic Region Grouping 2 Pediatric 2017 181.50%
Neurology Health Statistic Region Grouping 2 Pediatric 2018 176.81%
Neurology Health Statistic Region Grouping 2 Adults 2016 142.22%
Neurology Health Statistic Region Grouping 2 Adults 2017 173.81%
Neurology Health Statistic Region Grouping 2 Adults 2018 164.32%
Neurology Health Statistic Region Grouping 2 Individuals with Disabilities 2016 170.93%
Neurology Health Statistic Region Grouping 2 Individuals with Disabilities 2017 235.80%
Neurology Health Statistic Region Grouping 2 Individuals with Disabilities 2018 213.98%
Neurology Health Statistic Region Grouping 3 Pediatric 2016 159.32%
Neurology Health Statistic Region Grouping 3 Pediatric 2017 194.82%
Neurology Health Statistic Region Grouping 3 Pediatric 2018 201.69%
Neurology Health Statistic Region Grouping 3 Adults 2016 140.32%
Neurology Health Statistic Region Grouping 3 Adults 2017 163.24%
Neurology Health Statistic Region Grouping 3 Adults 2018 153.41%
Neurology Health Statistic Region Grouping 3 Individuals with Disabilities 2016 177.77%
Neurology Health Statistic Region Grouping 3 Individuals with Disabilities 2017 195.72%
Neurology Health Statistic Region Grouping 3 Individuals with Disabilities 2018 197.58%
Neurology Health Statistic Region Grouping 4 Pediatric 2016 147.00%
Neurology Health Statistic Region Grouping 4 Pediatric 2017 192.44%
Neurology Health Statistic Region Grouping 4 Pediatric 2018 175.41%
Neurology Health Statistic Region Grouping 4 Adults 2016 127.12%
Neurology Health Statistic Region Grouping 4 Adults 2017 142.80%
Neurology Health Statistic Region Grouping 4 Adults 2018 145.70%
Neurology Health Statistic Region Grouping 4 Individuals with Disabilities 2016 143.02%
Neurology Health Statistic Region Grouping 4 Individuals with Disabilities 2017 156.65%
Neurology Health Statistic Region Grouping 4 Individuals with Disabilities 2018 175.50%
Neurology Health Statistic Region Grouping 5 Pediatric 2016 146.05%
Neurology Health Statistic Region Grouping 5 Pediatric 2017 188.99%
Neurology Health Statistic Region Grouping 5 Pediatric 2018 203.61%
Neurology Health Statistic Region Grouping 5 Adults 2016 150.71%
Neurology Health Statistic Region Grouping 5 Adults 2017 146.95%
Page 96

Template 4: Physician specialist services State: Colorado
Service Provider Geographic Region Population Year Ratio
Ratio of services to beneficaries
Neurology Health Statistic Region Grouping 5 Adults 2018 150.70%
Neurology Health Statistic Region Grouping 5 Individuals with Disabilities 2016 182.90%
Neurology Health Statistic Region Grouping 5 Individuals with Disabilities 2017 186.82%
Neurology Health Statistic Region Grouping 5 Individuals with Disabilities 2018 194.71%
Neurology Health Statistic Region Grouping 6 Pediatric 2016 151.83%
Neurology Health Statistic Region Grouping 6 Pediatric 2017 210.43%
Neurology Health Statistic Region Grouping 6 Pediatric 2018 215.69%
Neurology Health Statistic Region Grouping 6 Adults 2016 159.92%
Neurology Health Statistic Region Grouping 6 Adults 2017 175.05%
Neurology Health Statistic Region Grouping 6 Adults 2018 185.21%
Neurology Health Statistic Region Grouping 6 Individuals with Disabilities 2016 195.54%
Neurology Health Statistic Region Grouping 6 Individuals with Disabilities 2017 208.87%
Neurology Health Statistic Region Grouping 6 Individuals with Disabilities 2018 224.73%
Neurology Health Statistic Region Grouping 7 Pediatric 2016 140.91%
Neurology Health Statistic Region Grouping 7 Pediatric 2017 204.20%
Neurology Health Statistic Region Grouping 7 Pediatric 2018 203.80%
Neurology Health Statistic Region Grouping 7 Adults 2016 154.97%
Neurology Health Statistic Region Grouping 7 Adults 2017 174.13%
Neurology Health Statistic Region Grouping 7 Adults 2018 173.23%
Neurology Health Statistic Region Grouping 7 Individuals with Disabilities 2016 183.03%
Neurology Health Statistic Region Grouping 7 Individuals with Disabilities 2017 206.21%
Neurology Health Statistic Region Grouping 7 Individuals with Disabilities 2018 214.31%
Neurology Statewide Pediatric 2016 152.99%
Neurology Statewide Pediatric 2017 198.95%
Neurology Statewide Pediatric 2018 204.68%
Neurology Statewide Adults 2016 149.46%
Neurology Statewide Adults 2017 163.95%
Neurology Statewide Adults 2018 165.25%
Neurology Statewide Individuals with Disabilities 2016 183.59%
Neurology Statewide Individuals with Disabilities 2017 199.53%
Neurology Statewide Individuals with Disabilities 2018 208.29%
Nuclear Medicine Health Statistic Region Grouping 1 Adults 2016 196.47%
Nuclear Medicine Health Statistic Region Grouping 1 Adults 2017 182.91%
Nuclear Medicine Health Statistic Region Grouping 1 Adults 2018 190.33%
Nuclear Medicine Health Statistic Region Grouping 1 Individuals with Disabilities 2016 207.77%
Nuclear Medicine Health Statistic Region Grouping 1 Individuals with Disabilities 2017 195.81%
Nuclear Medicine Health Statistic Region Grouping 1 Individuals with Disabilities 2018 187.10%
Nuclear Medicine Health Statistic Region Grouping 2 Pediatric 2016 217.39%
Nuclear Medicine Health Statistic Region Grouping 2 Pediatric 2017 205.00%
Nuclear Medicine Health Statistic Region Grouping 2 Adults 2016 187.68%
Nuclear Medicine Health Statistic Region Grouping 2 Adults 2017 197.22%
Nuclear Medicine Health Statistic Region Grouping 2 Adults 2018 202.87%
Nuclear Medicine Health Statistic Region Grouping 2 Individuals with Disabilities 2016 200.00%
Nuclear Medicine Health Statistic Region Grouping 2 Individuals with Disabilities 2017 192.31%
Nuclear Medicine Health Statistic Region Grouping 2 Individuals with Disabilities 2018 208.96%
Nuclear Medicine Health Statistic Region Grouping 3 Pediatric 2016 191.38%
Nuclear Medicine Health Statistic Region Grouping 3 Pediatric 2017 200.86%
Nuclear Medicine Health Statistic Region Grouping 3 Pediatric 2018 200.88%
Nuclear Medicine Health Statistic Region Grouping 3 Adults 2016 187.43%
Nuclear Medicine Health Statistic Region Grouping 3 Adults 2017 184.32%
Nuclear Medicine Health Statistic Region Grouping 3 Adults 2018 186.53%
Nuclear Medicine Health Statistic Region Grouping 3 Individuals with Disabilities 2016 190.55%
Nuclear Medicine Health Statistic Region Grouping 3 Individuals with Disabilities 2017 185.86%
Nuclear Medicine Health Statistic Region Grouping 3 Individuals with Disabilities 2018 181.87%
Nuclear Medicine Health Statistic Region Grouping 4 Adults 2016 195.34%
Nuclear Medicine Health Statistic Region Grouping 4 Adults 2017 191.40%
Nuclear Medicine Health Statistic Region Grouping 4 Adults 2018 193.05%
Nuclear Medicine Health Statistic Region Grouping 4 Individuals with Disabilities 2016 195.03%
Page 97

Template 4: Physician specialist services State: Colorado
Service Provider Geographic Region Population Year Ratio
Ratio of services to beneficaries
Nuclear Medicine Health Statistic Region Grouping 4 Individuals with Disabilities 2017 199.40%
Nuclear Medicine Health Statistic Region Grouping 4 Individuals with Disabilities 2018 191.36%
Nuclear Medicine Health Statistic Region Grouping 5 Pediatric 2016 192.86%
Nuclear Medicine Health Statistic Region Grouping 5 Pediatric 2017 186.96%
Nuclear Medicine Health Statistic Region Grouping 5 Pediatric 2018 212.12%
Nuclear Medicine Health Statistic Region Grouping 5 Adults 2016 190.54%
Nuclear Medicine Health Statistic Region Grouping 5 Adults 2017 194.83%
Nuclear Medicine Health Statistic Region Grouping 5 Adults 2018 192.42%
Nuclear Medicine Health Statistic Region Grouping 5 Individuals with Disabilities 2016 181.14%
Nuclear Medicine Health Statistic Region Grouping 5 Individuals with Disabilities 2017 193.20%
Nuclear Medicine Health Statistic Region Grouping 5 Individuals with Disabilities 2018 191.43%
Nuclear Medicine Health Statistic Region Grouping 6 Pediatric 2016 217.86%
Nuclear Medicine Health Statistic Region Grouping 6 Pediatric 2017 224.76%
Nuclear Medicine Health Statistic Region Grouping 6 Pediatric 2018 223.71%
Nuclear Medicine Health Statistic Region Grouping 6 Adults 2016 188.35%
Nuclear Medicine Health Statistic Region Grouping 6 Adults 2017 186.23%
Nuclear Medicine Health Statistic Region Grouping 6 Adults 2018 193.15%
Nuclear Medicine Health Statistic Region Grouping 6 Individuals with Disabilities 2016 186.08%
Nuclear Medicine Health Statistic Region Grouping 6 Individuals with Disabilities 2017 190.49%
Nuclear Medicine Health Statistic Region Grouping 6 Individuals with Disabilities 2018 193.04%
Nuclear Medicine Health Statistic Region Grouping 7 Pediatric 2016 215.79%
Nuclear Medicine Health Statistic Region Grouping 7 Pediatric 2017 200.00%
Nuclear Medicine Health Statistic Region Grouping 7 Adults 2016 191.95%
Nuclear Medicine Health Statistic Region Grouping 7 Adults 2017 186.27%
Nuclear Medicine Health Statistic Region Grouping 7 Adults 2018 188.06%
Nuclear Medicine Health Statistic Region Grouping 7 Individuals with Disabilities 2016 186.51%
Nuclear Medicine Health Statistic Region Grouping 7 Individuals with Disabilities 2017 191.23%
Nuclear Medicine Health Statistic Region Grouping 7 Individuals with Disabilities 2018 196.54%
Nuclear Medicine Statewide Pediatric 2016 203.84%
Nuclear Medicine Statewide Pediatric 2017 207.97%
Nuclear Medicine Statewide Pediatric 2018 216.33%
Nuclear Medicine Statewide Adults 2016 189.92%
Nuclear Medicine Statewide Adults 2017 187.67%
Nuclear Medicine Statewide Adults 2018 191.21%
Nuclear Medicine Statewide Individuals with Disabilities 2016 188.88%
Nuclear Medicine Statewide Individuals with Disabilities 2017 191.03%
Nuclear Medicine Statewide Individuals with Disabilities 2018 190.74%
Ophthalmology Health Statistic Region Grouping 1 Pediatric 2016 213.67%
Ophthalmology Health Statistic Region Grouping 1 Pediatric 2017 213.50%
Ophthalmology Health Statistic Region Grouping 1 Pediatric 2018 223.11%
Ophthalmology Health Statistic Region Grouping 1 Adults 2016 144.32%
Ophthalmology Health Statistic Region Grouping 1 Adults 2017 143.83%
Ophthalmology Health Statistic Region Grouping 1 Adults 2018 144.51%
Ophthalmology Health Statistic Region Grouping 1 Individuals with Disabilities 2016 210.74%
Ophthalmology Health Statistic Region Grouping 1 Individuals with Disabilities 2017 221.43%
Ophthalmology Health Statistic Region Grouping 1 Individuals with Disabilities 2018 236.99%
Ophthalmology Health Statistic Region Grouping 2 Pediatric 2016 237.35%
Ophthalmology Health Statistic Region Grouping 2 Pediatric 2017 228.40%
Ophthalmology Health Statistic Region Grouping 2 Pediatric 2018 259.57%
Ophthalmology Health Statistic Region Grouping 2 Adults 2016 136.50%
Ophthalmology Health Statistic Region Grouping 2 Adults 2017 135.62%
Ophthalmology Health Statistic Region Grouping 2 Adults 2018 137.15%
Ophthalmology Health Statistic Region Grouping 2 Individuals with Disabilities 2016 273.51%
Ophthalmology Health Statistic Region Grouping 2 Individuals with Disabilities 2017 250.15%
Ophthalmology Health Statistic Region Grouping 2 Individuals with Disabilities 2018 310.17%
Ophthalmology Health Statistic Region Grouping 3 Pediatric 2016 281.78%
Ophthalmology Health Statistic Region Grouping 3 Pediatric 2017 291.06%
Ophthalmology Health Statistic Region Grouping 3 Pediatric 2018 305.83%
Page 98

Template 4: Physician specialist services State: Colorado
Service Provider Geographic Region Population Year Ratio
Ratio of services to beneficaries
Ophthalmology Health Statistic Region Grouping 3 Adults 2016 147.55%
Ophthalmology Health Statistic Region Grouping 3 Adults 2017 147.84%
Ophthalmology Health Statistic Region Grouping 3 Adults 2018 148.09%
Ophthalmology Health Statistic Region Grouping 3 Individuals with Disabilities 2016 534.65%
Ophthalmology Health Statistic Region Grouping 3 Individuals with Disabilities 2017 489.16%
Ophthalmology Health Statistic Region Grouping 3 Individuals with Disabilities 2018 472.43%
Ophthalmology Health Statistic Region Grouping 4 Pediatric 2016 190.48%
Ophthalmology Health Statistic Region Grouping 4 Pediatric 2017 205.46%
Ophthalmology Health Statistic Region Grouping 4 Pediatric 2018 225.27%
Ophthalmology Health Statistic Region Grouping 4 Adults 2016 135.88%
Ophthalmology Health Statistic Region Grouping 4 Adults 2017 136.31%
Ophthalmology Health Statistic Region Grouping 4 Adults 2018 138.96%
Ophthalmology Health Statistic Region Grouping 4 Individuals with Disabilities 2016 206.96%
Ophthalmology Health Statistic Region Grouping 4 Individuals with Disabilities 2017 230.11%
Ophthalmology Health Statistic Region Grouping 4 Individuals with Disabilities 2018 243.62%
Ophthalmology Health Statistic Region Grouping 5 Pediatric 2016 295.03%
Ophthalmology Health Statistic Region Grouping 5 Pediatric 2017 302.20%
Ophthalmology Health Statistic Region Grouping 5 Pediatric 2018 330.13%
Ophthalmology Health Statistic Region Grouping 5 Adults 2016 157.80%
Ophthalmology Health Statistic Region Grouping 5 Adults 2017 159.59%
Ophthalmology Health Statistic Region Grouping 5 Adults 2018 156.73%
Ophthalmology Health Statistic Region Grouping 5 Individuals with Disabilities 2016 587.78%
Ophthalmology Health Statistic Region Grouping 5 Individuals with Disabilities 2017 651.08%
Ophthalmology Health Statistic Region Grouping 5 Individuals with Disabilities 2018 716.60%
Ophthalmology Health Statistic Region Grouping 6 Pediatric 2016 351.19%
Ophthalmology Health Statistic Region Grouping 6 Pediatric 2017 351.86%
Ophthalmology Health Statistic Region Grouping 6 Pediatric 2018 371.48%
Ophthalmology Health Statistic Region Grouping 6 Adults 2016 165.69%
Ophthalmology Health Statistic Region Grouping 6 Adults 2017 175.19%
Ophthalmology Health Statistic Region Grouping 6 Adults 2018 173.15%
Ophthalmology Health Statistic Region Grouping 6 Individuals with Disabilities 2016 694.09%
Ophthalmology Health Statistic Region Grouping 6 Individuals with Disabilities 2017 669.12%
Ophthalmology Health Statistic Region Grouping 6 Individuals with Disabilities 2018 706.74%
Ophthalmology Health Statistic Region Grouping 7 Pediatric 2016 322.75%
Ophthalmology Health Statistic Region Grouping 7 Pediatric 2017 314.91%
Ophthalmology Health Statistic Region Grouping 7 Pediatric 2018 352.54%
Ophthalmology Health Statistic Region Grouping 7 Adults 2016 158.91%
Ophthalmology Health Statistic Region Grouping 7 Adults 2017 157.25%
Ophthalmology Health Statistic Region Grouping 7 Adults 2018 161.81%
Ophthalmology Health Statistic Region Grouping 7 Individuals with Disabilities 2016 756.86%
Ophthalmology Health Statistic Region Grouping 7 Individuals with Disabilities 2017 705.78%
Ophthalmology Health Statistic Region Grouping 7 Individuals with Disabilities 2018 745.56%
Ophthalmology Statewide Pediatric 2016 303.98%
Ophthalmology Statewide Pediatric 2017 306.79%
Ophthalmology Statewide Pediatric 2018 328.97%
Ophthalmology Statewide Adults 2016 155.02%
Ophthalmology Statewide Adults 2017 156.62%
Ophthalmology Statewide Adults 2018 158.17%
Ophthalmology Statewide Individuals with Disabilities 2016 579.62%
Ophthalmology Statewide Individuals with Disabilities 2017 567.07%
Ophthalmology Statewide Individuals with Disabilities 2018 591.93%
Otolaryngology Health Statistic Region Grouping 1 Pediatric 2016 140.90%
Otolaryngology Health Statistic Region Grouping 1 Pediatric 2017 115.62%
Otolaryngology Health Statistic Region Grouping 1 Pediatric 2018 118.47%
Otolaryngology Health Statistic Region Grouping 1 Adults 2016 120.72%
Otolaryngology Health Statistic Region Grouping 1 Adults 2017 118.92%
Otolaryngology Health Statistic Region Grouping 1 Adults 2018 119.51%
Otolaryngology Health Statistic Region Grouping 1 Individuals with Disabilities 2016 187.90%
Page 99

Template 4: Physician specialist services State: Colorado
Service Provider Geographic Region Population Year Ratio
Ratio of services to beneficaries
Otolaryngology Health Statistic Region Grouping 1 Individuals with Disabilities 2017 143.18%
Otolaryngology Health Statistic Region Grouping 1 Individuals with Disabilities 2018 201.22%
Otolaryngology Health Statistic Region Grouping 2 Pediatric 2016 117.30%
Otolaryngology Health Statistic Region Grouping 2 Pediatric 2017 118.79%
Otolaryngology Health Statistic Region Grouping 2 Pediatric 2018 115.30%
Otolaryngology Health Statistic Region Grouping 2 Adults 2016 112.05%
Otolaryngology Health Statistic Region Grouping 2 Adults 2017 119.01%
Otolaryngology Health Statistic Region Grouping 2 Adults 2018 116.78%
Otolaryngology Health Statistic Region Grouping 2 Individuals with Disabilities 2016 174.12%
Otolaryngology Health Statistic Region Grouping 2 Individuals with Disabilities 2017 160.26%
Otolaryngology Health Statistic Region Grouping 2 Individuals with Disabilities 2018 203.41%
Otolaryngology Health Statistic Region Grouping 3 Pediatric 2016 119.00%
Otolaryngology Health Statistic Region Grouping 3 Pediatric 2017 118.59%
Otolaryngology Health Statistic Region Grouping 3 Pediatric 2018 124.58%
Otolaryngology Health Statistic Region Grouping 3 Adults 2016 123.76%
Otolaryngology Health Statistic Region Grouping 3 Adults 2017 124.65%
Otolaryngology Health Statistic Region Grouping 3 Adults 2018 121.95%
Otolaryngology Health Statistic Region Grouping 3 Individuals with Disabilities 2016 449.28%
Otolaryngology Health Statistic Region Grouping 3 Individuals with Disabilities 2017 410.74%
Otolaryngology Health Statistic Region Grouping 3 Individuals with Disabilities 2018 401.30%
Otolaryngology Health Statistic Region Grouping 4 Pediatric 2016 107.15%
Otolaryngology Health Statistic Region Grouping 4 Pediatric 2017 107.43%
Otolaryngology Health Statistic Region Grouping 4 Pediatric 2018 107.96%
Otolaryngology Health Statistic Region Grouping 4 Adults 2016 120.00%
Otolaryngology Health Statistic Region Grouping 4 Adults 2017 118.14%
Otolaryngology Health Statistic Region Grouping 4 Adults 2018 111.73%
Otolaryngology Health Statistic Region Grouping 4 Individuals with Disabilities 2016 131.33%
Otolaryngology Health Statistic Region Grouping 4 Individuals with Disabilities 2017 132.05%
Otolaryngology Health Statistic Region Grouping 4 Individuals with Disabilities 2018 145.81%
Otolaryngology Health Statistic Region Grouping 5 Pediatric 2016 223.54%
Otolaryngology Health Statistic Region Grouping 5 Pediatric 2017 272.24%
Otolaryngology Health Statistic Region Grouping 5 Pediatric 2018 284.11%
Otolaryngology Health Statistic Region Grouping 5 Adults 2016 134.82%
Otolaryngology Health Statistic Region Grouping 5 Adults 2017 134.32%
Otolaryngology Health Statistic Region Grouping 5 Adults 2018 129.69%
Otolaryngology Health Statistic Region Grouping 5 Individuals with Disabilities 2016 789.16%
Otolaryngology Health Statistic Region Grouping 5 Individuals with Disabilities 2017 847.75%
Otolaryngology Health Statistic Region Grouping 5 Individuals with Disabilities 2018 1036.82%
Otolaryngology Health Statistic Region Grouping 6 Pediatric 2016 127.37%
Otolaryngology Health Statistic Region Grouping 6 Pediatric 2017 132.19%
Otolaryngology Health Statistic Region Grouping 6 Pediatric 2018 132.62%
Otolaryngology Health Statistic Region Grouping 6 Adults 2016 132.01%
Otolaryngology Health Statistic Region Grouping 6 Adults 2017 140.47%
Otolaryngology Health Statistic Region Grouping 6 Adults 2018 134.59%
Otolaryngology Health Statistic Region Grouping 6 Individuals with Disabilities 2016 836.39%
Otolaryngology Health Statistic Region Grouping 6 Individuals with Disabilities 2017 831.84%
Otolaryngology Health Statistic Region Grouping 6 Individuals with Disabilities 2018 765.38%
Otolaryngology Health Statistic Region Grouping 7 Pediatric 2016 116.21%
Otolaryngology Health Statistic Region Grouping 7 Pediatric 2017 112.87%
Otolaryngology Health Statistic Region Grouping 7 Pediatric 2018 110.12%
Otolaryngology Health Statistic Region Grouping 7 Adults 2016 138.41%
Otolaryngology Health Statistic Region Grouping 7 Adults 2017 145.37%
Otolaryngology Health Statistic Region Grouping 7 Adults 2018 133.64%
Otolaryngology Health Statistic Region Grouping 7 Individuals with Disabilities 2016 911.48%
Otolaryngology Health Statistic Region Grouping 7 Individuals with Disabilities 2017 837.44%
Otolaryngology Health Statistic Region Grouping 7 Individuals with Disabilities 2018 845.90%
Otolaryngology Statewide Pediatric 2016 130.62%
Otolaryngology Statewide Pediatric 2017 137.52%
Page 100

Template 4: Physician specialist services State: Colorado
Service Provider Geographic Region Population Year Ratio
Ratio of services to beneficaries
Otolaryngology Statewide Pediatric 2018 146.41%
Otolaryngology Statewide Adults 2016 130.06%
Otolaryngology Statewide Adults 2017 134.47%
Otolaryngology Statewide Adults 2018 129.04%
Otolaryngology Statewide Individuals with Disabilities 2016 696.77%
Otolaryngology Statewide Individuals with Disabilities 2017 691.34%
Otolaryngology Statewide Individuals with Disabilities 2018 712.21%
Pulmonary Disease Health Statistic Region Grouping 1 Pediatric 2016 156.08%
Pulmonary Disease Health Statistic Region Grouping 1 Pediatric 2017 170.73%
Pulmonary Disease Health Statistic Region Grouping 1 Pediatric 2018 176.38%
Pulmonary Disease Health Statistic Region Grouping 1 Adults 2016 161.82%
Pulmonary Disease Health Statistic Region Grouping 1 Adults 2017 161.18%
Pulmonary Disease Health Statistic Region Grouping 1 Adults 2018 164.77%
Pulmonary Disease Health Statistic Region Grouping 1 Individuals with Disabilities 2016 183.04%
Pulmonary Disease Health Statistic Region Grouping 1 Individuals with Disabilities 2017 197.14%
Pulmonary Disease Health Statistic Region Grouping 1 Individuals with Disabilities 2018 193.16%
Pulmonary Disease Health Statistic Region Grouping 2 Pediatric 2016 153.58%
Pulmonary Disease Health Statistic Region Grouping 2 Pediatric 2017 163.63%
Pulmonary Disease Health Statistic Region Grouping 2 Pediatric 2018 160.53%
Pulmonary Disease Health Statistic Region Grouping 2 Adults 2016 138.70%
Pulmonary Disease Health Statistic Region Grouping 2 Adults 2017 139.87%
Pulmonary Disease Health Statistic Region Grouping 2 Adults 2018 145.92%
Pulmonary Disease Health Statistic Region Grouping 2 Individuals with Disabilities 2016 187.88%
Pulmonary Disease Health Statistic Region Grouping 2 Individuals with Disabilities 2017 210.68%
Pulmonary Disease Health Statistic Region Grouping 2 Individuals with Disabilities 2018 181.08%
Pulmonary Disease Health Statistic Region Grouping 3 Pediatric 2016 211.50%
Pulmonary Disease Health Statistic Region Grouping 3 Pediatric 2017 203.12%
Pulmonary Disease Health Statistic Region Grouping 3 Pediatric 2018 203.70%
Pulmonary Disease Health Statistic Region Grouping 3 Adults 2016 205.12%
Pulmonary Disease Health Statistic Region Grouping 3 Adults 2017 215.25%
Pulmonary Disease Health Statistic Region Grouping 3 Adults 2018 208.22%
Pulmonary Disease Health Statistic Region Grouping 3 Individuals with Disabilities 2016 241.93%
Pulmonary Disease Health Statistic Region Grouping 3 Individuals with Disabilities 2017 258.80%
Pulmonary Disease Health Statistic Region Grouping 3 Individuals with Disabilities 2018 261.38%
Pulmonary Disease Health Statistic Region Grouping 4 Pediatric 2016 145.15%
Pulmonary Disease Health Statistic Region Grouping 4 Pediatric 2017 150.40%
Pulmonary Disease Health Statistic Region Grouping 4 Pediatric 2018 156.66%
Pulmonary Disease Health Statistic Region Grouping 4 Adults 2016 141.26%
Pulmonary Disease Health Statistic Region Grouping 4 Adults 2017 148.85%
Pulmonary Disease Health Statistic Region Grouping 4 Adults 2018 153.47%
Pulmonary Disease Health Statistic Region Grouping 4 Individuals with Disabilities 2016 161.64%
Pulmonary Disease Health Statistic Region Grouping 4 Individuals with Disabilities 2017 170.94%
Pulmonary Disease Health Statistic Region Grouping 4 Individuals with Disabilities 2018 173.14%
Pulmonary Disease Health Statistic Region Grouping 5 Pediatric 2016 149.21%
Pulmonary Disease Health Statistic Region Grouping 5 Pediatric 2017 158.99%
Pulmonary Disease Health Statistic Region Grouping 5 Pediatric 2018 163.52%
Pulmonary Disease Health Statistic Region Grouping 5 Adults 2016 147.59%
Pulmonary Disease Health Statistic Region Grouping 5 Adults 2017 154.69%
Pulmonary Disease Health Statistic Region Grouping 5 Adults 2018 165.09%
Pulmonary Disease Health Statistic Region Grouping 5 Individuals with Disabilities 2016 173.17%
Pulmonary Disease Health Statistic Region Grouping 5 Individuals with Disabilities 2017 189.81%
Pulmonary Disease Health Statistic Region Grouping 5 Individuals with Disabilities 2018 196.43%
Pulmonary Disease Health Statistic Region Grouping 6 Pediatric 2016 179.73%
Pulmonary Disease Health Statistic Region Grouping 6 Pediatric 2017 199.24%
Pulmonary Disease Health Statistic Region Grouping 6 Pediatric 2018 204.16%
Pulmonary Disease Health Statistic Region Grouping 6 Adults 2016 164.53%
Pulmonary Disease Health Statistic Region Grouping 6 Adults 2017 181.26%
Pulmonary Disease Health Statistic Region Grouping 6 Adults 2018 193.47%
Page 101

Template 4: Physician specialist services State: Colorado
Service Provider Geographic Region Population Year Ratio
Ratio of services to beneficaries
Pulmonary Disease Health Statistic Region Grouping 6 Individuals with Disabilities 2016 203.33%
Pulmonary Disease Health Statistic Region Grouping 6 Individuals with Disabilities 2017 227.70%
Pulmonary Disease Health Statistic Region Grouping 6 Individuals with Disabilities 2018 230.83%
Pulmonary Disease Health Statistic Region Grouping 7 Pediatric 2016 213.16%
Pulmonary Disease Health Statistic Region Grouping 7 Pediatric 2017 219.37%
Pulmonary Disease Health Statistic Region Grouping 7 Pediatric 2018 223.42%
Pulmonary Disease Health Statistic Region Grouping 7 Adults 2016 175.50%
Pulmonary Disease Health Statistic Region Grouping 7 Adults 2017 187.15%
Pulmonary Disease Health Statistic Region Grouping 7 Adults 2018 197.60%
Pulmonary Disease Health Statistic Region Grouping 7 Individuals with Disabilities 2016 214.15%
Pulmonary Disease Health Statistic Region Grouping 7 Individuals with Disabilities 2017 225.99%
Pulmonary Disease Health Statistic Region Grouping 7 Individuals with Disabilities 2018 237.15%
Pulmonary Disease Statewide Pediatric 2016 188.87%
Pulmonary Disease Statewide Pediatric 2017 197.56%
Pulmonary Disease Statewide Pediatric 2018 201.27%
Pulmonary Disease Statewide Adults 2016 172.48%
Pulmonary Disease Statewide Adults 2017 184.45%
Pulmonary Disease Statewide Adults 2018 190.44%
Pulmonary Disease Statewide Individuals with Disabilities 2016 209.52%
Pulmonary Disease Statewide Individuals with Disabilities 2017 227.96%
Pulmonary Disease Statewide Individuals with Disabilities 2018 231.47%
Radiation Oncology Health Statistic Region Grouping 1 Adults 2016 800.00%
Radiation Oncology Health Statistic Region Grouping 1 Adults 2017 886.54%
Radiation Oncology Health Statistic Region Grouping 1 Adults 2018 721.57%
Radiation Oncology Health Statistic Region Grouping 2 Adults 2016 566.67%
Radiation Oncology Health Statistic Region Grouping 2 Adults 2017 857.58%
Radiation Oncology Health Statistic Region Grouping 2 Adults 2018 777.78%
Radiation Oncology Health Statistic Region Grouping 3 Adults 2016 945.60%
Radiation Oncology Health Statistic Region Grouping 3 Adults 2017 770.05%
Radiation Oncology Health Statistic Region Grouping 3 Adults 2018 808.76%
Radiation Oncology Health Statistic Region Grouping 3 Individuals with Disabilities 2016 709.09%
Radiation Oncology Health Statistic Region Grouping 3 Individuals with Disabilities 2017 859.52%
Radiation Oncology Health Statistic Region Grouping 3 Individuals with Disabilities 2018 853.93%
Radiation Oncology Health Statistic Region Grouping 4 Adults 2016 868.09%
Radiation Oncology Health Statistic Region Grouping 4 Adults 2017 725.86%
Radiation Oncology Health Statistic Region Grouping 4 Adults 2018 1060.00%
Radiation Oncology Health Statistic Region Grouping 5 Adults 2016 1133.82%
Radiation Oncology Health Statistic Region Grouping 5 Adults 2017 1139.24%
Radiation Oncology Health Statistic Region Grouping 5 Adults 2018 1066.67%
Radiation Oncology Health Statistic Region Grouping 5 Individuals with Disabilities 2016 659.02%
Radiation Oncology Health Statistic Region Grouping 5 Individuals with Disabilities 2017 914.00%
Radiation Oncology Health Statistic Region Grouping 5 Individuals with Disabilities 2018 790.32%
Radiation Oncology Health Statistic Region Grouping 6 Adults 2016 1139.88%
Radiation Oncology Health Statistic Region Grouping 6 Adults 2017 975.00%
Radiation Oncology Health Statistic Region Grouping 6 Adults 2018 992.49%
Radiation Oncology Health Statistic Region Grouping 6 Individuals with Disabilities 2016 1078.79%
Radiation Oncology Health Statistic Region Grouping 6 Individuals with Disabilities 2017 672.73%
Radiation Oncology Health Statistic Region Grouping 6 Individuals with Disabilities 2018 906.40%
Radiation Oncology Health Statistic Region Grouping 7 Adults 2016 1512.26%
Radiation Oncology Health Statistic Region Grouping 7 Adults 2017 1223.08%
Radiation Oncology Health Statistic Region Grouping 7 Adults 2018 1159.23%
Radiation Oncology Health Statistic Region Grouping 7 Individuals with Disabilities 2017 1021.05%
Radiation Oncology Health Statistic Region Grouping 7 Individuals with Disabilities 2018 954.55%
Radiation Oncology Statewide Pediatric 2017 1182.86%
Radiation Oncology Statewide Pediatric 2018 1245.16%
Radiation Oncology Statewide Adults 2016 1087.33%
Radiation Oncology Statewide Adults 2017 971.07%
Radiation Oncology Statewide Adults 2018 975.76%
Page 102

Template 4: Physician specialist services State: Colorado
Service Provider Geographic Region Population Year Ratio
Ratio of services to beneficaries
Radiation Oncology Statewide Individuals with Disabilities 2016 845.48%
Radiation Oncology Statewide Individuals with Disabilities 2017 822.87%
Radiation Oncology Statewide Individuals with Disabilities 2018 876.90%
Urology Health Statistic Region Grouping 1 Pediatric 2016 176.32%
Urology Health Statistic Region Grouping 1 Pediatric 2017 181.82%
Urology Health Statistic Region Grouping 1 Pediatric 2018 183.10%
Urology Health Statistic Region Grouping 1 Adults 2016 234.77%
Urology Health Statistic Region Grouping 1 Adults 2017 234.42%
Urology Health Statistic Region Grouping 1 Adults 2018 255.63%
Urology Health Statistic Region Grouping 1 Individuals with Disabilities 2016 232.88%
Urology Health Statistic Region Grouping 1 Individuals with Disabilities 2017 197.14%
Urology Health Statistic Region Grouping 1 Individuals with Disabilities 2018 255.49%
Urology Health Statistic Region Grouping 2 Pediatric 2016 148.45%
Urology Health Statistic Region Grouping 2 Pediatric 2017 148.25%
Urology Health Statistic Region Grouping 2 Pediatric 2018 170.54%
Urology Health Statistic Region Grouping 2 Adults 2016 192.73%
Urology Health Statistic Region Grouping 2 Adults 2017 199.01%
Urology Health Statistic Region Grouping 2 Adults 2018 200.00%
Urology Health Statistic Region Grouping 2 Individuals with Disabilities 2016 186.84%
Urology Health Statistic Region Grouping 2 Individuals with Disabilities 2017 200.00%
Urology Health Statistic Region Grouping 2 Individuals with Disabilities 2018 207.14%
Urology Health Statistic Region Grouping 3 Pediatric 2016 143.02%
Urology Health Statistic Region Grouping 3 Pediatric 2017 165.92%
Urology Health Statistic Region Grouping 3 Pediatric 2018 164.14%
Urology Health Statistic Region Grouping 3 Adults 2016 219.34%
Urology Health Statistic Region Grouping 3 Adults 2017 246.20%
Urology Health Statistic Region Grouping 3 Adults 2018 253.67%
Urology Health Statistic Region Grouping 3 Individuals with Disabilities 2016 259.86%
Urology Health Statistic Region Grouping 3 Individuals with Disabilities 2017 267.35%
Urology Health Statistic Region Grouping 3 Individuals with Disabilities 2018 295.97%
Urology Health Statistic Region Grouping 4 Pediatric 2016 132.43%
Urology Health Statistic Region Grouping 4 Pediatric 2017 142.70%
Urology Health Statistic Region Grouping 4 Pediatric 2018 160.00%
Urology Health Statistic Region Grouping 4 Adults 2016 194.03%
Urology Health Statistic Region Grouping 4 Adults 2017 193.45%
Urology Health Statistic Region Grouping 4 Adults 2018 199.43%
Urology Health Statistic Region Grouping 4 Individuals with Disabilities 2016 243.55%
Urology Health Statistic Region Grouping 4 Individuals with Disabilities 2017 232.68%
Urology Health Statistic Region Grouping 4 Individuals with Disabilities 2018 230.65%
Urology Health Statistic Region Grouping 5 Pediatric 2016 154.66%
Urology Health Statistic Region Grouping 5 Pediatric 2017 175.61%
Urology Health Statistic Region Grouping 5 Pediatric 2018 199.20%
Urology Health Statistic Region Grouping 5 Adults 2016 129.16%
Urology Health Statistic Region Grouping 5 Adults 2017 208.50%
Urology Health Statistic Region Grouping 5 Adults 2018 217.77%
Urology Health Statistic Region Grouping 5 Individuals with Disabilities 2016 248.75%
Urology Health Statistic Region Grouping 5 Individuals with Disabilities 2017 245.52%
Urology Health Statistic Region Grouping 5 Individuals with Disabilities 2018 234.91%
Urology Health Statistic Region Grouping 6 Pediatric 2016 150.11%
Urology Health Statistic Region Grouping 6 Pediatric 2017 170.46%
Urology Health Statistic Region Grouping 6 Pediatric 2018 200.17%
Urology Health Statistic Region Grouping 6 Adults 2016 243.11%
Urology Health Statistic Region Grouping 6 Adults 2017 228.91%
Urology Health Statistic Region Grouping 6 Adults 2018 236.55%
Urology Health Statistic Region Grouping 6 Individuals with Disabilities 2016 266.38%
Urology Health Statistic Region Grouping 6 Individuals with Disabilities 2017 255.92%
Urology Health Statistic Region Grouping 6 Individuals with Disabilities 2018 265.42%
Urology Health Statistic Region Grouping 7 Pediatric 2016 134.43%
Page 103

Template 4: Physician specialist services State: Colorado
Service Provider Geographic Region Population Year Ratio
Ratio of services to beneficaries
Urology Health Statistic Region Grouping 7 Pediatric 2017 167.69%
Urology Health Statistic Region Grouping 7 Pediatric 2018 179.63%
Urology Health Statistic Region Grouping 7 Adults 2016 242.67%
Urology Health Statistic Region Grouping 7 Adults 2017 222.37%
Urology Health Statistic Region Grouping 7 Adults 2018 229.16%
Urology Health Statistic Region Grouping 7 Individuals with Disabilities 2016 279.30%
Urology Health Statistic Region Grouping 7 Individuals with Disabilities 2017 279.87%
Urology Health Statistic Region Grouping 7 Individuals with Disabilities 2018 277.20%
Urology Statewide Pediatric 2016 147.93%
Urology Statewide Pediatric 2017 167.61%
Urology Statewide Pediatric 2018 185.33%
Urology Statewide Adults 2016 228.88%
Urology Statewide Adults 2017 226.69%
Urology Statewide Adults 2018 235.02%
Urology Statewide Individuals with Disabilities 2016 258.60%
Urology Statewide Individuals with Disabilities 2017 254.67%
Urology Statewide Individuals with Disabilities 2018 267.49%
Vascular Surgery Health Statistic Region Grouping 1 Pediatric 2016 148.21%
Vascular Surgery Health Statistic Region Grouping 1 Pediatric 2017 133.33%
Vascular Surgery Health Statistic Region Grouping 1 Pediatric 2018 173.68%
Vascular Surgery Health Statistic Region Grouping 1 Adults 2016 180.41%
Vascular Surgery Health Statistic Region Grouping 1 Adults 2017 183.61%
Vascular Surgery Health Statistic Region Grouping 1 Adults 2018 189.94%
Vascular Surgery Health Statistic Region Grouping 1 Individuals with Disabilities 2016 202.06%
Vascular Surgery Health Statistic Region Grouping 1 Individuals with Disabilities 2017 226.74%
Vascular Surgery Health Statistic Region Grouping 1 Individuals with Disabilities 2018 200.54%
Vascular Surgery Health Statistic Region Grouping 2 Pediatric 2016 141.86%
Vascular Surgery Health Statistic Region Grouping 2 Pediatric 2017 167.27%
Vascular Surgery Health Statistic Region Grouping 2 Pediatric 2018 147.37%
Vascular Surgery Health Statistic Region Grouping 2 Adults 2016 158.71%
Vascular Surgery Health Statistic Region Grouping 2 Adults 2017 185.38%
Vascular Surgery Health Statistic Region Grouping 2 Adults 2018 188.64%
Vascular Surgery Health Statistic Region Grouping 2 Individuals with Disabilities 2016 173.64%
Vascular Surgery Health Statistic Region Grouping 2 Individuals with Disabilities 2017 198.35%
Vascular Surgery Health Statistic Region Grouping 2 Individuals with Disabilities 2018 228.04%
Vascular Surgery Health Statistic Region Grouping 3 Pediatric 2016 151.81%
Vascular Surgery Health Statistic Region Grouping 3 Pediatric 2017 159.81%
Vascular Surgery Health Statistic Region Grouping 3 Pediatric 2018 165.06%
Vascular Surgery Health Statistic Region Grouping 3 Adults 2016 158.81%
Vascular Surgery Health Statistic Region Grouping 3 Adults 2017 183.83%
Vascular Surgery Health Statistic Region Grouping 3 Adults 2018 185.99%
Vascular Surgery Health Statistic Region Grouping 3 Individuals with Disabilities 2016 187.49%
Vascular Surgery Health Statistic Region Grouping 3 Individuals with Disabilities 2017 207.64%
Vascular Surgery Health Statistic Region Grouping 3 Individuals with Disabilities 2018 202.91%
Vascular Surgery Health Statistic Region Grouping 4 Pediatric 2016 156.60%
Vascular Surgery Health Statistic Region Grouping 4 Pediatric 2017 169.05%
Vascular Surgery Health Statistic Region Grouping 4 Pediatric 2018 185.07%
Vascular Surgery Health Statistic Region Grouping 4 Adults 2016 182.59%
Vascular Surgery Health Statistic Region Grouping 4 Adults 2017 187.62%
Vascular Surgery Health Statistic Region Grouping 4 Adults 2018 189.32%
Vascular Surgery Health Statistic Region Grouping 4 Individuals with Disabilities 2016 208.52%
Vascular Surgery Health Statistic Region Grouping 4 Individuals with Disabilities 2017 216.16%
Vascular Surgery Health Statistic Region Grouping 4 Individuals with Disabilities 2018 203.39%
Vascular Surgery Health Statistic Region Grouping 5 Pediatric 2016 139.38%
Vascular Surgery Health Statistic Region Grouping 5 Pediatric 2017 183.91%
Vascular Surgery Health Statistic Region Grouping 5 Pediatric 2018 169.57%
Vascular Surgery Health Statistic Region Grouping 5 Adults 2016 176.26%
Vascular Surgery Health Statistic Region Grouping 5 Adults 2017 187.79%
Page 104

Template 4: Physician specialist services State: Colorado
Service Provider Geographic Region Population Year Ratio
Ratio of services to beneficaries
Vascular Surgery Health Statistic Region Grouping 5 Adults 2018 189.84%
Vascular Surgery Health Statistic Region Grouping 5 Individuals with Disabilities 2016 199.63%
Vascular Surgery Health Statistic Region Grouping 5 Individuals with Disabilities 2017 218.94%
Vascular Surgery Health Statistic Region Grouping 5 Individuals with Disabilities 2018 217.48%
Vascular Surgery Health Statistic Region Grouping 6 Pediatric 2016 149.38%
Vascular Surgery Health Statistic Region Grouping 6 Pediatric 2017 205.60%
Vascular Surgery Health Statistic Region Grouping 6 Pediatric 2018 207.65%
Vascular Surgery Health Statistic Region Grouping 6 Adults 2016 189.64%
Vascular Surgery Health Statistic Region Grouping 6 Adults 2017 203.11%
Vascular Surgery Health Statistic Region Grouping 6 Adults 2018 205.73%
Vascular Surgery Health Statistic Region Grouping 6 Individuals with Disabilities 2016 209.96%
Vascular Surgery Health Statistic Region Grouping 6 Individuals with Disabilities 2017 226.19%
Vascular Surgery Health Statistic Region Grouping 6 Individuals with Disabilities 2018 224.47%
Vascular Surgery Health Statistic Region Grouping 7 Pediatric 2016 144.00%
Vascular Surgery Health Statistic Region Grouping 7 Pediatric 2017 191.10%
Vascular Surgery Health Statistic Region Grouping 7 Pediatric 2018 188.89%
Vascular Surgery Health Statistic Region Grouping 7 Adults 2016 169.35%
Vascular Surgery Health Statistic Region Grouping 7 Adults 2017 192.82%
Vascular Surgery Health Statistic Region Grouping 7 Adults 2018 197.62%
Vascular Surgery Health Statistic Region Grouping 7 Individuals with Disabilities 2016 192.72%
Vascular Surgery Health Statistic Region Grouping 7 Individuals with Disabilities 2017 210.87%
Vascular Surgery Health Statistic Region Grouping 7 Individuals with Disabilities 2018 199.36%
Vascular Surgery Statewide Pediatric 2016 148.22%
Vascular Surgery Statewide Pediatric 2017 186.32%
Vascular Surgery Statewide Pediatric 2018 188.50%
Vascular Surgery Statewide Adults 2016 177.23%
Vascular Surgery Statewide Adults 2017 193.59%
Vascular Surgery Statewide Adults 2018 196.85%
Vascular Surgery Statewide Individuals with Disabilities 2016 200.18%
Vascular Surgery Statewide Individuals with Disabilities 2017 218.20%
Vascular Surgery Statewide Individuals with Disabilities 2018 213.94%
Page 105