appendix - iowa department of transportation · » iowa department of transportation’s “u.s....
TRANSCRIPT
Lock and Dam No. 19
Appendix All materials are available online at: www.iowadot.gov/TIGER14-river
SUPPLEMENTAL MATERIALS » Letters of Support
» USACE Priority Project List
» TIGER Planning Grant Application Cost-Benefit Economic Analysis
» Iowa Department of Transportation’s “U.S. Inland Waterway Modernization Reconnaissance Study” April 2013
» Iowa Department of Transportation’s Lock and Dam Modernization Handout
» Iowa Department of Transportation’s UMRS Action Plan Workshop Summary
» M-35 Application for Marine Highway Corridor Designation
M-35 Application for Marine Highway Corridor Designation

February 14, 2014
The Honorable Paul N. Jaenichen Sr.
Administrator
U.S. Department of Transportation
Maritime Administration
West Building
1200 New Jersey Avenue, SE
Washington, DC 20590
Dear Administrator Jaenichen,
The Marine Highway Initiative is an essential program in establishing the importance of the nation’s
inland waterway system as a safe, environmentally responsible and capacity efficient mode of
transportation. However, even being a critical corridor, the M-35 has yet to be recognized among the
Marine Highway network.
Sponsoring state department of transportations (DOTs) have joined together in submitting this
application to the U.S. DOT Maritime Administration (MARAD) for consideration of establishing a
Maritime Corridor linkage along the Mississippi River, from St. Louis, Missouri to St. Paul, Minnesota. We
have been informed and take pride in this being the first time that five states will come together to
submit a unified application for a Marine Highway designation.
The M-35, which can commonly be referred to as the “Waterway of the Saints” Marine Highway
Corridor, will provide a much needed link between the Upper Mississippi River and the existing M-55
Corridor. The Corridor’s linkage to the M-55 Corridor will provide a direct water route to the Gulf of
Mexico from the Upper Midwest. The designation of the Upper Mississippi as the M-35 Maritime
Highway connects seamlessly into the existing U.S. transportation system, assisting efforts in relieving
landside congestion, reducing air emission, and increasing the efficiency of other surface transportation
modes.
As you are aware, receiving Marine Highway designation provides access to crucial knowledge and
resources for terminals along the corridor by receiving technical assistance and consultation from the
Maritime Administration. Furthermore, Marine Highway designation acts as an important federal
endorsement for supporting economic development and increasing the potential of future federal
funding awards. The Upper Mississippi has long been a valued link of the inland waterways system,
servicing the export and import industries of mid-western commodities globally. Establishing such a
designation to the M-35 Corridor will provide benefits to locating adjacently to our region’s inland
waterways and maintaining navigable channels.
We respectfully encourage you to grant Marine Highway designation to the M-35 Corridor.
Sincerely,

Illinois Department of Transportation
Sign

M-35
“Waterway of the Saints”
Application for Marine Highway Corridor Designation to
Maritime Administration Division of U.S. DOT
Co-Sponsors:
Illinois Department of Transportation
Iowa Department of Transportation
Minnesota Department of Transportation
Missouri Department of Transportation
Wisconsin Department of Transportation
Application Date: February 14, 2014

2
TABLE OF CONTENTS
EXECUTIVE SUMMARY………………………………………………………………………………………………..... 3
SPONSORS ……………………………………………………………………………………………………………………. 5
SUPPORTERS & INVOLVED PARTIES …………….……………………………………………………………….. 6
CORRIDOR DESCRIPTION ……………………………………………………………………………………………… 6
LANDSIDE CORRIDOR SERVED ……………………………………………………………………………………… 7
SURFACE TRANSPORTATION CORRIDOR SERVED …………………………………………………………. 7
PASSENGERS & FREIGHT ………………………………………………………………………………………………. 7
CONGESTION REDUCTION ………………………………………………………………………………….......... 11
PUBLIC BENEFITS ……………………………………………………………………………………………………….. 15
SYSTEM IMPEDIMENTS ……………………………………………………………………………………………… 19
APPENDIXES
Appendix 1 – Listing of Statistical Areas within the Area of Influence for the M-35
Corridor of the Saints Marine Highway Corridor
Appendix 2 – Mid-America Freight Coalition Interstate 35 Corridor Draft Profile
Appendix 3 - Mid-America Freight Coalition Interstate 94 Corridor Draft Profile

3
PREFACE
Sponsoring state department of transportation agencies (DOTs) have joined together in
submitting this application to the U.S. DOT Maritime Administration (MARAD) for consideration
of establishing a Maritime Corridor along the Mississippi River from St. Louis, Missouri to St.
Paul, Minnesota. All state DOTs whose state is adjacent to this corridor have agreed to sponsor
this application knowing that such a corridor designation is an essential step toward giving this
waterway recognition among the navigable inland waterway system in the United States. It is
important to note that sponsorship of this corridor should not be viewed as giving an
endorsement or preference of one transportation mode over another, but rather sponsors
acknowledge that designation of this inland waterway as a Maritime Corridor is a necessary
step toward planning for one transportation system that supports operations and connections
among all modal networks. The designation of the Upper Mississippi as the M-35 Maritime
Highway connects seamlessly into the existing U.S. transportation system, assisting efforts in
relieving landside congestion, reducing air emission, and increasing the efficiency of other
surface transportation, such as railways. Once integrated, this corridor will serve to provide a
serviceable, effective, and sustainable transportation alternative among landside modal
options.
EXECUTIVE SUMMARY
The M-35, which can commonly be referred as “Waterway of the Saints” Marine Highway
Corridor will provide a much needed link between the Upper Mississippi River and the existing
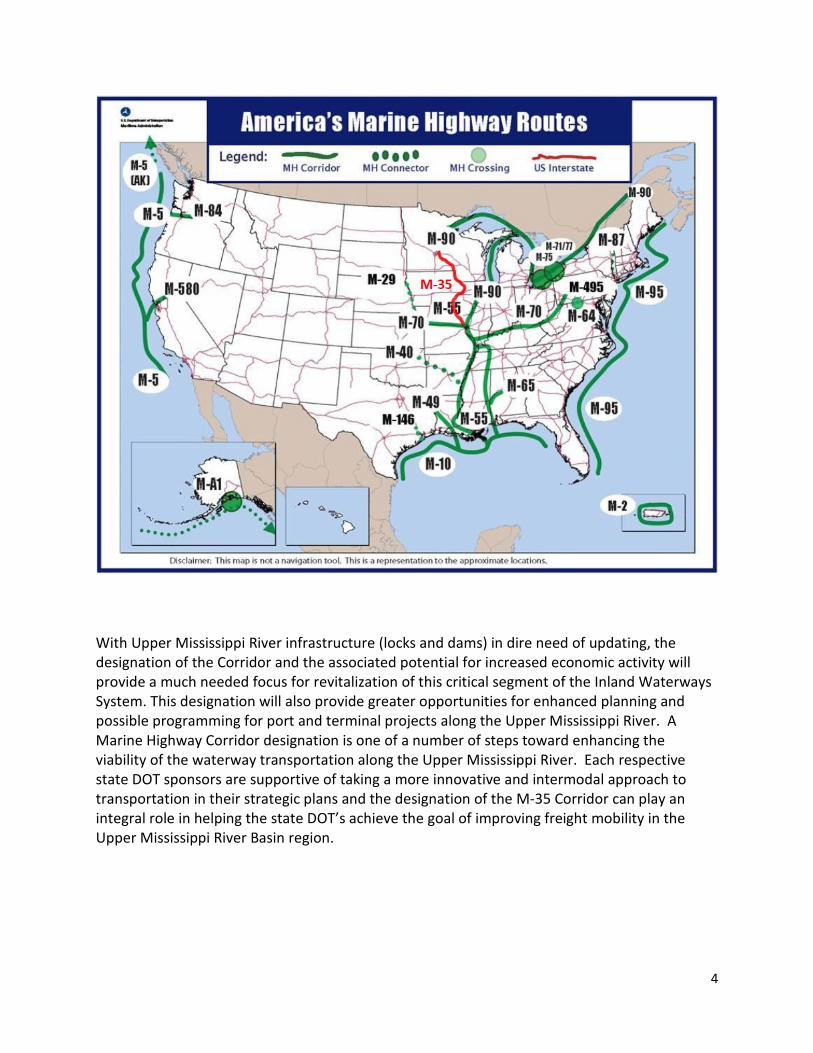
M-55 Corridor. The M-35 Corridor will run from Lock 1 at St. Paul-Minneapolis, Minnesota on
the Mississippi River the confluence of the Mississippi and Illinois Rivers in Grafton, Illinois,
where the M-55 Corridor begins. The Corridor’s linkage to the M-55 Corridor will provide a
direct water route to the Gulf of Mexico from the Upper Midwest. The proposed route of the
M-35 Corridor is highlighted in red on the map below, showing how the Corridor will become
part of the existing system of established Marine Highway Corridors and assisting in congestion
relief along I-35 and I-94 corridors.
4
With Upper Mississippi River infrastructure (locks and dams) in dire need of updating, the
designation of the Corridor and the associated potential for increased economic activity will
provide a much needed focus for revitalization of this critical segment of the Inland Waterways
System. This designation will also provide greater opportunities for enhanced planning and
possible programming for port and terminal projects along the Upper Mississippi River. A
Marine Highway Corridor designation is one of a number of steps toward enhancing the
viability of the waterway transportation along the Upper Mississippi River. Each respective
state DOT sponsors are supportive of taking a more innovative and intermodal approach to
transportation in their strategic plans and the designation of the M-35 Corridor can play an
integral role in helping the state DOT’s achieve the goal of improving freight mobility in the
Upper Mississippi River Basin region.

5
SPONSORS
The M-35 Corridor of the Saints sponsors and their respective POC’s are:
Illinois Address:
Department of Transportation
2300 South Dirksen Parkway
Springfield, Illinois 62764
POC: Kevin Schoeben, Phone: (217) 557-5434
Email: [email protected]
Iowa Address:
Department of Transportation
800 Lincoln Way
Ames, IA 50010
POC: Garrett Pedersen, Phone: (515) 239-1520
Email: [email protected]
Minnesota Address:
Department of Transportation
395 John Ireland Blvd., Mail Stop 470
St. Paul, MN 55155
POC: Dick Lambert, Phone: (651) 366-3683
Email: [email protected]
Missouri Address:
Department of Transportation
Multimodal Operations, P.O. Box 270
Jefferson City, MO 65102
POC: Cheryl Ball, Phone: (573) 526-5578
Email: [email protected]
Wisconsin Address:
Department of Transportation
4802 Sheboygan Ave, P.O. Box 7914
Madison, WI 53707-7914
POC: Sheri Walz, Phone: (608) 267-9319
Email: [email protected]

6
SUPPORTERS & INVOLVED PARTIES
Inland Rivers Ports and Terminals Association (Supporting Party)
The IRPT is a national trade association with a mission “To provide opportunity and a platform
for inland river port and terminal professionals to improve their businesses through networking
and developing key strategic alliances and to inform policy makers on the needs and economic
impacts of our industry.” Memberships are purchased by a number of groups, who then elect a
Board of Directors to represent each of the nation’s river basins. Members include private
businesses such as port and terminal owners/operators, port authorities, towing companies,
insurers, surveyors and engineers, as well as public entities such as government agencies and
educational institutions. Because the IRPT supports collaboration with the Maritime
Administration and promotes the benefits of inland waterway transit as an economically and
environmentally advantageous solution to freight transportation issues, they are a strong
supporter of the M-35 “Waterway of the Saints” Corridor application.
Upper Mississippi River Basin Association (Supporting Party)
UMRBA is a regional interstate organization formed by the Governors of Illinois, Iowa,
Minnesota, Missouri, and Wisconsin to coordinate the states' river-related programs and
policies and work with federal agencies that have river responsibilities. UMRBA is involved with
programs related to commercial navigation, ecosystem restoration, water quality, aquatic
nuisance species, hazardous spills, flood risk management, water supply, and other water
resource issues. The purpose of the UMRBA Association is to facilitate dialogue and cooperative
action regarding water and related land resource issues. UMRBA’s participation is key to
facilitating common resources, as the M-35 will be a multi-state coordinated effort along with
various federal agencies.
CORRIDOR DESCRIPTION
The M-35, “Waterway of the Saints” is anchored in the north by the Greater Twin Cities
(Minneapolis-St. Paul-Bloomington) Metropolitan Statistical Area (MSA) in east-central
Minnesota, which encompasses eleven counties in Minnesota and two in Wisconsin. It is the
15th largest MSA, with a population of 3.4 million. The MSA includes the city of Minneapolis,
MN and the Minnesota state capital of St. Paul, MN. The greater Twin Cities area lies within
close proximity to a large percentage of the U.S. population and several major Midwestern
metropolitan areas, including Chicago, Kansas City, Milwaukee, and Omaha. The Greater Twin
Cities boasts the second largest economy in the Midwest, following Chicago, Illinois.
The M-35 “Waterway of the Saints” is anchored in the south by the Greater Saint Louis
Metropolitan Statistical Area (MSA) in north-east Missouri which encompasses eight counties in
Illinois and eight counties in Missouri. The MSA includes the City of Saint Louis, MO and East
Saint Louis, IL. The greater Saint Louis Area lies in close proximity to a large percentage of the

7
U.S. population and several major Midwestern metropolitan areas, including Chicago, Kansas
City, Indianapolis, Cincinnati, Nashville, Memphis, and Little Rock.
The complete listing of statistical areas (economic areas of influence) for the M-35 “Waterway
of the Saints”, are identified in Appendix 1.
LANDSIDE CORRIDOR SERVED
The M-35 Corridor will aim to provide modal options in term of congestion relief to Interstates
I-35, I-94, and the Avenue of the Saints, which is a 563-mile-long highway that connects St.
Paul, Minnesota, and St. Louis, Missouri. This includes Interstate 35 in Minnesota and across
Iowa’s border, along with State Route 27 through Iowa, which connects with Missouri State
Route 27 and eventually U.S. Route 61. Other interstates in the region include I-29, I-39, I-74, I-
80 and I-90.
The M-35 Corridor will also intend to provide congestion relief to the following railroads: Union
Pacific, DM&E, Canadian Pacific, Canadian National and Burlington Northern Santa Fe Railroads.
SURFACE TRANSPORTATION CORRIDOR SERVED
The Upper Midwest region, Upper Mississippi River Basin, and Great Lakes region are the area’s
most directly served by the Corridor. Minnesota, Illinois, Iowa, Missouri and Wisconsin all
border the Mississippi River along the Corridor’s planned route. Other neighboring states such
as Ohio, Indiana, North Dakota, South Dakota, Kansas and Nebraska will also be positively
affected by the regional benefits of the M-35 “Waterway of the Saints” Marine Highway
Corridor.
PASSENGERS & FREIGHT
While, the establishment of this corridor is primarily intended to provide modal options for
freight, it also serves passengers travelling on roads potentially having the added benefit of
reduced congestion and improved safety. Due to the size and weight of freight trucks,
combined with the fact that they typically travel on interstate highways at high speeds, crashes
involving freight trucks tend to result in more passenger vehicle fatalities when they occur
(Blower & Woodroffe). Less freight on the road translates into safer roads because there will
be less congestion and fewer fatal crashes. In addition, because heavy freight comprises a
greater percentage of traffic near intermodal hubs, which are typically located in urban areas,
these areas will particularly benefit from congestion relief (VTPI).
The map below highlights the differences between modes in terms of annual freight tonnage.
Although tonnage on inland waterways tapers off as it heads north towards the Twin Cities,
tonnage on highways in the Greater Twin Cities reaches roughly 62.5 million tons per year. This

8
discrepancy demonstrates an opportunity for the Upper Mississippi River to take on higher
freight volumes via barge and to reduce roadway traffic and congestion.
Tonnage on Highways, Railways, and Inland Waterways 2007 (U.S.Dot)
STATE-BY-STATE FREIGHT BENEFITS
Minnesota - Freight tonnage on Minnesota’s five Mississippi River ports totaled 10.7 million net
tons in 2012, with annual tonnages ranging from 8 to almost 13 million since 2005. Agricultural
products are the state’s top river-transported commodity, with 60 percent of agricultural
exports being shipped by barge. Foreign grain demand affects annual tonnage numbers, as
does diversion to ethanol production, current freight rates, seasonal flooding, low water, and
ice conditions. Currently, commercial barges are subject to a $0.20 per gallon fuel tax and are
also required to fund half of Federal lock construction costs. The 29 locks already in operation
on the Upper Mississippi River are maintained by the U.S. Army Corps of Engineers. Because
agricultural products are exported internationally from Minnesota, connectivity to international
trade routes is crucial to state commerce. The Corridor will promote international trade to and
from the Greater Twin Cities by establishing a strong link to the Gulf of Mexico and the
transportation connections available there. It will also serve to curb or even reverse the trend
of decreasing shipments into and out of Minnesota ports over the last decade (MnDOT).
9
Because water transportation is generally slower than other modes and sometimes less
reliable, it tends to attract shipments that are less time-sensitive and lower in value but larger
in weight and quantity, such as bulk and semi-manufactured materials. Aside from agricultural
products, major commodities and materials handled by Minnesota’s Mississippi River ports
include coal, salt, cement, minerals, steel, fertilizer, petroleum, molasses and scrap metal.
Wisconsin – The State of Wisconsin borders 231 miles of the Upper Mississippi River. The river
provides an important transportation link for the shipment of grain and the receipt of coal for
this area. The state also borders the St. Croix River (Lake St. Croix), which in 2008 carried just
less than 300 thousand tons of commodities worth about $50 million on its 24.5 navigable
miles. There are ten 110’ x 600’ navigation locks and dams, all built in the 1930’s on the
Mississippi River bordering Wisconsin. An analysis of the waterborne commerce data for the
State of Wisconsin shows that 690 thousand tons of commodities were shipped on the river
system out of the state. Almost all of this tonnage consisted of grain. Docks in the state
received 3.7 million tons, with coal being the primary commodity. In 2008, the 4.4 million tons
shipped to and from Wisconsin had a value of $305 million. Wisconsin docks shipped
commodities by barge to 8 states and received commodities from 10 other states.
(Source: USACE Waterborne Commerce Statistics)
Iowa – Overall, Iowa moved 453 million tons of freight across all modes on its state network in
2010 (FAF). Iowa’s top three domestic trading partners when it comes to exports all border the
Mississippi River in Minnesota, Illinois and Louisiana. This Corridor would enhance foreign
trading as Iowa’s largest trading partners are currently Canada and Mexico. The State of Iowa
borders 312 miles of the upper Mississippi River. This area is a vital segment of the Inland
Waterway System, providing an economic transportation link from the upper Midwest to the
lower Mississippi Valley and the Gulf of Mexico. There were 60 barge terminals in Iowa that
shipped and received tonnage in 2010, 55 were on the Mississippi River. All but one of the main
locks located along Iowa’s Mississippi River border have a 110-foot by 600-foot chamber.
Keokuk is the northernmost port on the Mississippi River that is open to barge traffic
throughout the winter. In total there are 11 navigation locks and dams on the Mississippi River
bordering Iowa. An analysis of the waterborne commerce data for Iowa shows that 6.7 million
tons of commodities were shipped on the river system out of the state. Over 77% of this
tonnage (5.1 million tons) consisted of grain, mostly corn and soybeans. Docks in the state
received over 2.8 million tons, with coal being the primary commodity. Over 1.5 million tons
moved within the state. In 2008, the 11.1 million tons shipped to, from and within Iowa had a
value of almost $1.9 billion. Iowa docks shipped commodities by barge to 15 states and
received commodities from 16 other states. There were 56 manufacturing facilities, terminals,
and docks in Iowa that shipped and received tonnage in 2008. Trade growth on the Mississippi
River system is projected to increase 83 percent by 2039.
(Source: USACE Waterborne Commerce Statistics)

10
Illinois – In the year 2010, 1.26 billion tons of goods moved from, to and within the state of
Illinois, with 11 percent of those moving on waterways (FAF). Illinois is the 5th largest state by
population with a total of 12.9 million residents, 12.3 million of those live within 100 miles of
the major inland waterways, which include the Mississippi, Ohio and Illinois Rivers. In total
there are approximately 317 manufacturing facilities, terminals, and docks on the inland
navigation system in Illinois. The inland navigation system bordering the State of Illinois utilizes
fifteen locks, stretching over 580 miles on the Upper Mississippi River. Three deep draft harbors
(Waukegan, Chicago, and Calumet) provide access to domestic and international markets via
the Great Lakes and St. Lawrence Seaway.
In 2011 the predominate commodity being shipped from the state of Illinois was coal at 37
million tons, grain shipments for domestic consumption were a close second at 24 million tons,
followed by petroleum a distance third at 8 million tons. The state of Illinois ships out of the
state nearly 4 tons for every ton the state receives. In total the Mississippi River within the
State of Illinois moves 37.4 million tons, totaling $9.2 billion.
(Source: USACE Waterborne Commerce Statistics)
Missouri – The state of Missouri borders 488 miles of the Mississippi River, including 361 miles
of the Upper Mississippi River and 127 miles of the Lower Mississippi River. An analysis of the
waterborne commerce data for the State of Missouri shows that more than 16 million tons of
commodities were shipped on the river system out of the state. A sizeable portion of this
tonnage consisted of aggregates (6.6 million tons) and grain (5.8 million tons). Docks in the
state received 5.8 million tons, with coal being the largest commodity. Over 7 million tons
moved within the state. In 2008, the 29.0 million tons shipped to, from and within Missouri
were worth $3.9 billion. Missouri docks shipped commodities by barge to 15 states, and
received commodities from 16 states. There are approximately 195 manufacturing facilities,
terminals, and docks on the waterways of Missouri that shipped and received tonnage in 2008.
There are seven navigation locks and dams on the Mississippi River bordering Missouri.
The Port of Metropolitan St. Louis is defined as 71 miles of the Mississippi River and includes
facilities on both sides of the river. The port shipped and received 29.5 million tons in 2008
worth over $4.4 billion, making St. Louis the 3rd busiest inland port in the country. The main
commodity was coal, with over 11.8 million tons shipped and received. (Source: USACE Waterborne Commerce Statistics)

11
CONGESTION REDUCTION BENEFITS
Increasing the use of ports and waterways on the Corridor route between the Twin Cities and
the M-55 Corridor will serve to decrease the amount of freight traveling on local roads,
interstate highways and bridges, and railways throughout the Upper Mississippi River Basin.
Diverted traffic volumes will reduce wear on infrastructure, such as roads and railways, and also
slow its deterioration, thus lowering overall infrastructure and maintenance costs. By
intercepting freight and transferring it to barges as an alternative to crossing the Mississippi
River via road or rail, there would be significant savings on the construction and maintenance of
bridges as a result. Estimates by the Victoria Transport Policy Institute conclude that “A heavy
truck can impose road wear costs hundreds of times greater than an automobile,” (VTPI)
demonstrating how freight traffic contributes to premature deterioration, more frequently
needed maintenance, and higher costs of road and rail infrastructure Furthermore, a study by
the Government Accountability Office showed that for trucking, external costs of transportation
that the consumer passes on to society were six times more than the cost of rail and nine times
more than the cost of water (GAO). According to a 2010 report by the Congressional Budget
Office, “Spending on highways at all levels of government accounted for 43 percent of
expenditures for transportation and water infrastructure in 2007… and the remaining
State of Good Repair -
Maintenance Costs
(10.0 cents per VMT
for rural road
segments)
Emissions
Avoided
Value of Annual
costs of CO2
Description Miles# of Truckload
equivalents
# of Barge
equivalentsIf cargo is hauled by trucks…
(Difference btwn truck
and barge emissions)
(social costs of
emissions….estimate of
climate change
damage…)
Minnesota 43,109,000 190
I-35 from IA - MN
state line to
Minneapolis
114 1,724,360 1,642.2 19,657,704.00$ 189,603 5,676,713.82$
Iowa 9,740,000 312
I-35 from IA - MN
state line to SR 27 to
IA - MO state line
278 389,600 371.0 10,830,880.00$ 133,712 4,003,337.28$
Illinois 109,663,000 580
Davenport, IA to
Springfield to St.
Louis via I-74 to I-55
266 4,386,520 4,177.6 116,681,432.00$ 828,047 24,791,727.18$
Wisconsin 32,042,000 231
Hudson, WI to WI -
IA state line (near
Dubuque) via I-94 to
US 61
259 1,281,680 1,220.6 33,195,512.00$ 447,755 13,405,784.70$
Missouri 33,111,000 361
SR 27 @ IA - MO
state line to U.S. 61
to St. Louis/Miss.
River
185 1,324,440 1,261.4 24,502,140.00$ 201,728 6,039,736.32$
Cargo tons total -
CY 2011
Miss. River
Waterway
Mileage
Roadway mileage (est.) -
Route parallel to Miss.
River
Modal Cargo Capacity
M-35 Marine Highway Benefits Data
DISCLAIMER: The numbers in the table are calculated estimates using data from the sources listed below. For an actual valuation, more in-depth research would be needed.
However, this methodology is sufficient for providing general estimations for a marine highway corridor designation application.
State

12
categories of water transportation and water resources accounted for 5 percent” (CBO). This
demonstrates a clear and sizeable difference in the cost of infrastructure for roadways versus
waterways. Even with the shifting of freight transportation to waterways, it is unlikely that
these numbers would reverse because of the lower infrastructural demands of water transit in
general. The following chart illustrates this point, with water transportation having the lowest
infrastructure expenditures of all transportation modes.
INFRASTRUCTURE SPENDING IN THE UNITED STATES
(Congressional Budget Office)
STATE-BY-STATE CONGESTION REDUCTION BENEFITS
Minnesota - According to the Urban Mobility Report by Texas Transportation Institute, the Twin
Cities (Minneapolis-St. Paul) is the 16th most congested metro when compared to 101 other
metropolitan areas in the United States. The same report identified Minneapolis-St. Paul as
being 115 percent above the national average of large urban areas (over 1 million and less than
3 million population) in annual truck delays, with over 3 million hours. Minnesota in total has 5
bottleneck locations among the top 100, according to the Freight Performance measures.
Ranking the highest is the Interstate 35 - 494 Interchange in Minneapolis-St. Paul as the 17th
worst bottleneck in the nation. Along with the existing M-90 Marine Highway to the North, the
addition of the M-35 should assist with the congestion of the urban areas and statewide to the
South.
13
MAJOR HIGHWAY INTERCHANGE BOTTLENECKS FOR TRUCKS
(Texas Transportation Institute)
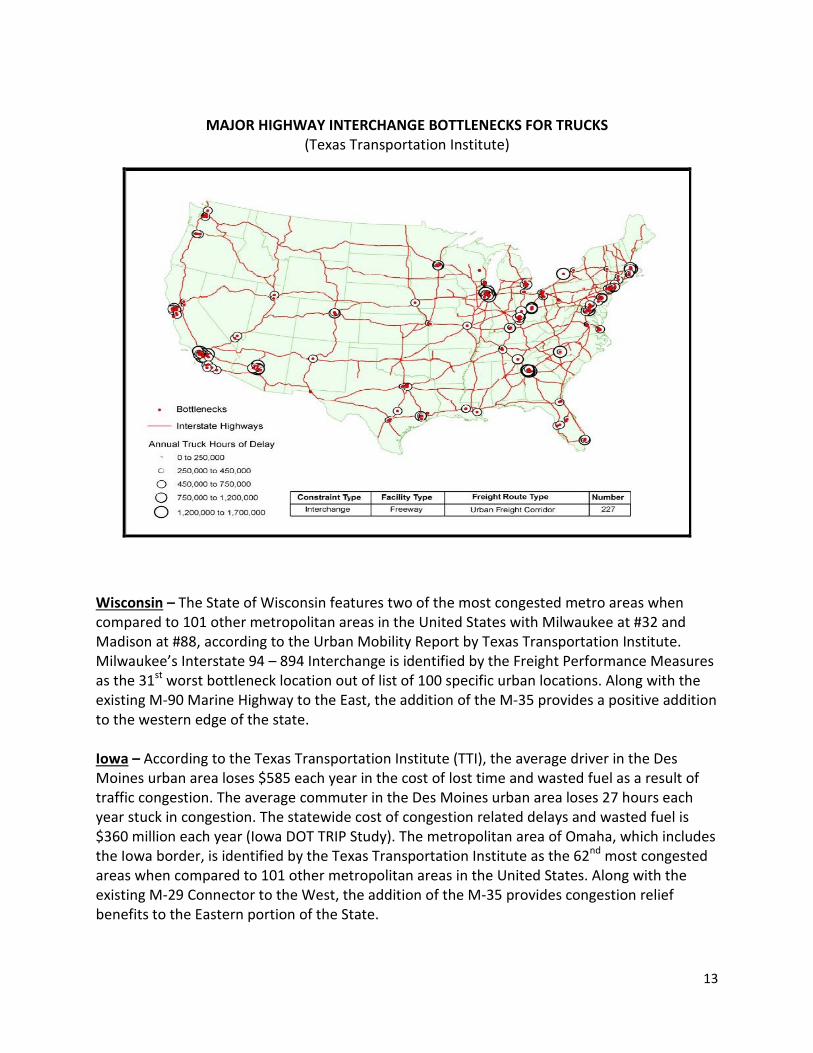
Wisconsin – The State of Wisconsin features two of the most congested metro areas when
compared to 101 other metropolitan areas in the United States with Milwaukee at #32 and
Madison at #88, according to the Urban Mobility Report by Texas Transportation Institute.
Milwaukee’s Interstate 94 – 894 Interchange is identified by the Freight Performance Measures
as the 31st worst bottleneck location out of list of 100 specific urban locations. Along with the
existing M-90 Marine Highway to the East, the addition of the M-35 provides a positive addition
to the western edge of the state.
Iowa – According to the Texas Transportation Institute (TTI), the average driver in the Des
Moines urban area loses $585 each year in the cost of lost time and wasted fuel as a result of
traffic congestion. The average commuter in the Des Moines urban area loses 27 hours each
year stuck in congestion. The statewide cost of congestion related delays and wasted fuel is
$360 million each year (Iowa DOT TRIP Study). The metropolitan area of Omaha, which includes
the Iowa border, is identified by the Texas Transportation Institute as the 62nd most congested
areas when compared to 101 other metropolitan areas in the United States. Along with the
existing M-29 Connector to the West, the addition of the M-35 provides congestion relief
benefits to the Eastern portion of the State.
14
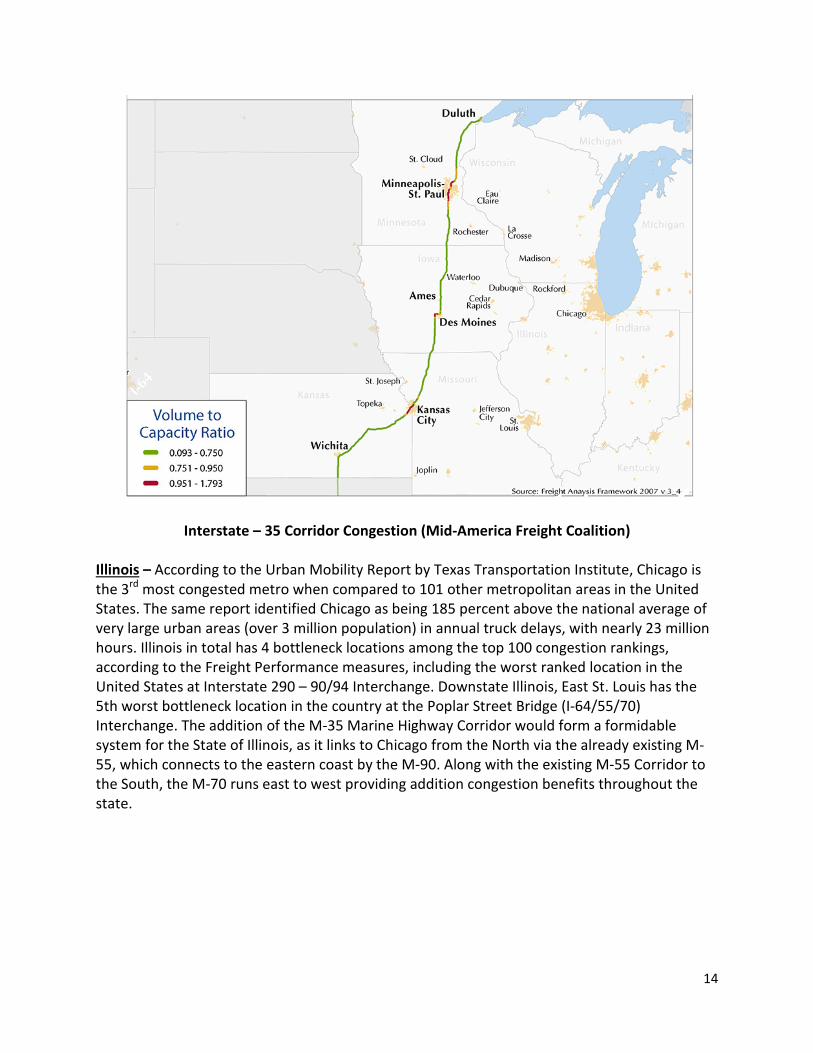
Interstate – 35 Corridor Congestion (Mid-America Freight Coalition)
Illinois – According to the Urban Mobility Report by Texas Transportation Institute, Chicago is
the 3rd most congested metro when compared to 101 other metropolitan areas in the United
States. The same report identified Chicago as being 185 percent above the national average of
very large urban areas (over 3 million population) in annual truck delays, with nearly 23 million
hours. Illinois in total has 4 bottleneck locations among the top 100 congestion rankings,
according to the Freight Performance measures, including the worst ranked location in the
United States at Interstate 290 – 90/94 Interchange. Downstate Illinois, East St. Louis has the
5th worst bottleneck location in the country at the Poplar Street Bridge (I-64/55/70)
Interchange. The addition of the M-35 Marine Highway Corridor would form a formidable
system for the State of Illinois, as it links to Chicago from the North via the already existing M-
55, which connects to the eastern coast by the M-90. Along with the existing M-55 Corridor to
the South, the M-70 runs east to west providing addition congestion benefits throughout the
state.

15
Interstate – 94 Corridor Congestion (Mid-America Freight Coalition)
Missouri – The State of Missouri features two of the most congested metro areas when
compared to 101 other metropolitan areas in the United States, St. Louis at #20 and Kansas City
at #29, according to the Urban Mobility Report by Texas Transportation Institute. The same
report identified St. Louis as being 165 percent above the national average of large urban areas
(over 1 million and less than 3 million population) in annual truck delays, with nearly over 4
million hours. Missouri has 2 bottleneck locations identified in the top 100 congestion rankings,
according to the Freight Performance measures. Ranking the highest for the State of Missouri is
the Poplar Street Bridge (I-64/55/70) Interchange in St. Louis, identified as the 5th worst
bottleneck location in the country. The addition of the M-35 Marine Highway Corridor would
form a formidable system for the State of Missouri to create a robust waterway system, directly
impacting congestion relief efforts. The M-35 would connect with the existing M-55, which
connects to the M-70, which connects to the M-29 throughout the state.
PUBLIC BENEFITS
In addition to congestion reduction, there would be a number of other benefits to the public as
a result of shifting freight traffic to inland waterways. Decreasing the number of freight trucks
on the road means safer roads for other passenger vehicles, since a disproportionately high
number of fatal accidents involve freight vehicles. According to a report released by the

16
University of Michigan Transportation Research Institute, “When measured by VMT [vehicle
miles traveled], trucks in the US tend to have higher involvement rates per mile traveled in fatal
crashes than smaller motor vehicles, but they have substantially lower rates in injury and PDO
(property damage only) crashes.” This means that although the overall number of crashes
involving freight trucks is low, when accidents do occur, they tend to be fatal. Although there is
a danger posed to freight truck drivers, especially in the case of truck rollover, it is more often
the other vehicles involved in these accidents that suffer fatalities. The report states that this is
because of the greater physical size and weight of freight trucks in comparison to passenger
vehicles and also because freight tends to travel on interstate highways and other roads with
higher speed limits, making accidents more dangerous when they do occur (Blower &
Woodroffe). Removing a portion of these freight vehicles from the road is likely to result in
lower rates of accidents involving freight trucks and lower rates of fatalities, making interstate
highways in the region a safer place for all vehicles. The chart below from the Texas
Transportation Institute illustrates the sizeable difference in fatality rates between the different
transportation modes, with highway fatalities ranking 155 times higher than inland waterways
and rail fatalities ranking almost 23 times higher.
RATIO OF FATALITIES PER BILLION TON-MILES
(Texas Transportation Institute)
Shifting freight to inland waterways also means lower vehicle emissions levels for the region
and improved air quality, which is accomplished in two ways. First, the vessels and barges used
in water transportation typically have lower fuel consumption and lower emissions than freight
trucks or trains. Secondly, congestion on interstates and other roadways causes trucks to
operate at a lower fuel efficiency and increases their emissions. According to a Mid-America

17
Freight Coalition Study, this is because “An engine operates most efficiently from both the
perspective of fuel consumption and of emissions at slightly below highway speeds. At low
speeds and at very high speeds, engines pollute much more than they do at moderate speeds.
Congestion will cause more pollution” (MAFC). The study has highlighted the connection
between congestion and pollution and has made clear the fact that congestion has a negative
impact on much more than just travel times. The public advantage of alleviating congestion by
reducing roadway freight traffic is enhanced by the added benefit of reduced pollution and
improved air quality. The study also states that with the Upper Midwest’s transportation
network of highways, waterways and railways currently operating at or near capacity, the
expected future growth of freight ton-miles by 80 percent over the next decade poses a major
challenge (MAFC). A significant solution is needed in order to avoid the impending congestion
catastrophe and diverting freight traffic to marine highways can be a part of that solution.
While modal diversion serves to provide congestion relief, it also will reduce wear and tear on
our roads with fewer trucks on the roads, Iowa does a great job of illustrating this comparison
below.
18
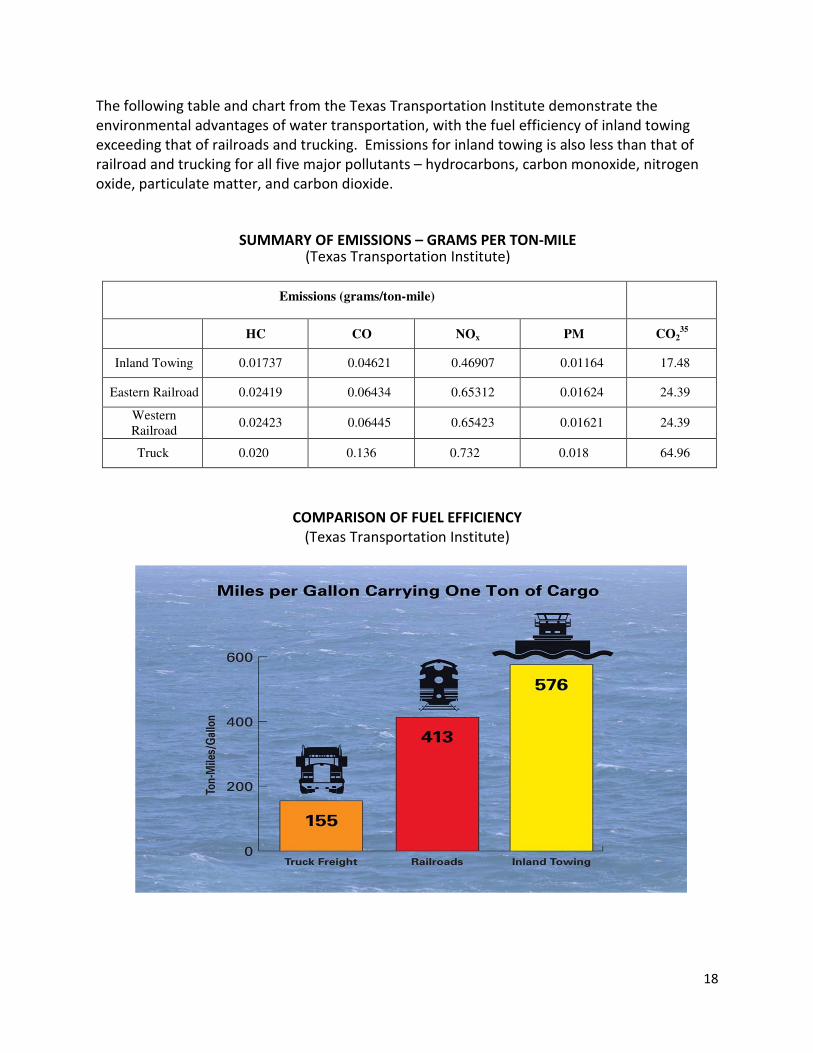
The following table and chart from the Texas Transportation Institute demonstrate the
environmental advantages of water transportation, with the fuel efficiency of inland towing
exceeding that of railroads and trucking. Emissions for inland towing is also less than that of
railroad and trucking for all five major pollutants – hydrocarbons, carbon monoxide, nitrogen
oxide, particulate matter, and carbon dioxide.
SUMMARY OF EMISSIONS – GRAMS PER TON-MILE
(Texas Transportation Institute)
Emissions (grams/ton-mile)
HC
CO
NOx
PM CO 35
2
Inland Towing 0.01737 0.04621 0.46907 0.01164 17.48
Eastern Railroad 0.02419 0.06434 0.65312 0.01624 24.39
Western
Railroad
0.02423
0.06445
0.65423
0.01621
24.39
Truck 0.020 0.136 0.732 0.018 64.96
COMPARISON OF FUEL EFFICIENCY
(Texas Transportation Institute)

19
SYSTEM IMPEDIMENTS
It is well reported that the aging lock and dam infrastructure on the Mississippi River is in dire
need of improvements, repairs and maintenance. Future growth will place a greater demand
on the performance of the navigable waterways infrastructure and will be a continual
impediment until significant investment is provided. Without new investment, our navigable
waterways will be challenged to provide low-cost transportation benefits to our inland
shippers, carriers, and industry. Also, operational needs and maintenance of lock and dam
facilities must receive proper awareness and attention so that transportation stakeholders can
have a greater trust in reliability and dependability of the Mississippi River as viable inland
waterway network.
Due to the lack of consistent funding for operations and maintenance, ensuring a safe and
navigable channel for inland waterway transport will continue to be an impediment for the U.S.
Army Corps of Engineers along the proposed M-35 Corridor. It is important to have a stable
source of funding for dredging and maintenance efforts throughout the Mississippi region so
that the Corps can adequately maintain the channels for safe and reliable navigation.
As mentioned before, these river corridor efforts are responding to existing and projected
metro road congestion problems resulting from increasing metro populations throughout the
country; and the fact that freight capacity on our inland waterways are not being used to its
fullest potential. The projected future growth in freight will need a multimodal system of
reliable and dependable networks of highways, railways, airways and waterways. The future
market will certainly provide opportunities for all other shipping and transportation modes,
even with a redistribution of freight to the inland waterways. For example, short-haul trucking
will still be needed to accommodate cargoes coming off of barges that are not yet at their final
destination. Freight traffic travelling east and west will require intermodal transit for a portion
of their journey due to the geographic limitations of travel on the Mississippi River, which runs
north and south.
Perhaps one of the biggest impediments facing the proposed M-35 Corridor is a lack of an
overall cohesive strategy and planning effort. The approval of the M-35 as a designated
corridor as a maritime highway by the U.S. DOT will serve as the most significant step for this
inland waterway to be recognized as an essential freight corridor. With co-sponsorship of all
adjacent state department of transportation agencies, regional collaboration is already
demonstrated with this application submission. With final approval of MARAD, co-sponsors can
enhance this communication and collaboration in an aim toward addressing these impediments
so that the M-35 serves to provide a viable option for freight transport for our transportation
stakeholders.
No specific organization has come forward opposing efforts of this application submission to
U.S.DOT MARAD. Supporters of this application will be encouraged to submit their own letter of
support under a separate cover.

20
APPENDIXES
Appendix 1 – Listing of Statistical Areas within the Area of Influence for the M-35 Waterway of
the Saints Marine Highway Corridor (Attached)
Appendix 2 – Mid-America Freight Coalition Interstate 35 Corridor Draft Profile (Attached)
Appendix 3 - Mid-America Freight Coalition Interstate 94 Corridor Draft Profile (Attached)
Document References
Daniel Blower & John Woodroffe. (2012). Survey of the Status of Truck Safety: Brazil,
China Australia and the United States.
Metropolitan Council. (2012). Assessment of Economic Impact of Potentially
Discontinuing the Operation of the Upper St. Anthony Falls Lock.
Mid-America Freight Coalition. (2006). Upper Midwest Freight Corridor Study.
Minnesota Department of Transportation. (2012). Statewide Multimodal Transportation
Plan.
Texas Transportation Institute. (2007). A Modal Comparison of Domestic Freight
Transportation Effects on the General Public.
Victoria Transport Policy Institute. (2011). Freight Transportation Management.
Appendix 1
Inclusive of the northern and southern MSA anchors for the M-35 Waterway of the Saints, the
statistical areas within the area of influence are the following statistical areas:
• Minneapolis-St. Paul-Bloomington, MN-WI
- Anoka County, MN
- Carver County, MN
- Chisago County, MN
- Dakota County, MN
- Hennepin County, MN
- Isanti County, MN
- Pierce County, WI
- Ramsey County, MN
- Scott County, MN
21
- Sherburne County, MN
- St. Croix County, WI
- Washington County, MN
- Wright County, MN
• Rochester, MN
- Dodge County
- Olmsted County
- Wabasha County
• Southeast Minnesota nonmetropolitan area
- Brown County
- Faribault County
- Fillmore County
- Freeborn County
- Goodhue County
- Le Sueur County
- Martin County
- Mower County
- Rice County
- Sibley County
- Steele County
- Waseca County
- Watonwan County
- Winona County
• La Crosse, WI-MN
- Houston County, MN
- La Crosse County, WI
• Southwestern Wisconsin nonmetropolitan area
- Buffalo County
- Crawford County
- Dunn County
- Jackson County
- Monroe County
- Pepin County
- Vernon County
• Dubuque, IA
- Dubuque County

22
• Northeast Iowa nonmetropolitan area
Allamakee County
Buchanan County
Butler County
Cerro Gordo County
Chickasaw County
Clayton County
Delaware County
Fayette County
Floyd County
Franklin County
Hardin County
Howard County
Mitchell County
Winneshiek County
Worth County
• Davenport-Moline-Rock Island, IA-IL
- Henry County, IL
- Mercer County, IL
- Rock Island County, IL
- Scott County, IA
• Southeast Iowa nonmetropolitan area
- Appanoose County
- Cedar County
- Clinton County
- Davis County
- Des Moines County
- Henry County
- Iowa County
- Jackson County
- Jasper County
- Jefferson County
- Keokuk County
- Lee County
- Louisa County
- Mahaska County
- Marion County
- Marshall County
- Monroe County
- Muscatine County
- Poweshiek County

23
- Tama County
- Van Buren County
- Wapello County
• Northwest Illinois nonmetropolitan area
- Bureau County
- Carroll County
- Jo Daviess County
- La Salle County
- Lee County
- Ogle County
- Putnam County
- Stephenson County
- Whiteside County
• West Central Illinois nonmetropolitan area
- Adams County
- Brown County
- Cass County
- Christian County
- De Witt County
- Fulton County
- Greene County
- Hancock County
- Henderson County
- Knox County
- Livingston County
- Logan County
- Mason County
- McDonough County
- Montgomery County
- Morgan County
- Moultrie County
- Pike County
- Schuyler County
- Scott County
- Shelby County
- Warren County
• North Missouri nonmetropolitan area
- Adair County
- Atchison County
- Carroll County
- Chariton County

24
- Clark County
- Daviess County
- Gentry County
- Grundy County
- Harrison County
- Holt County
- Knox County
- Lewis County
- Linn County
- Livingston County
- Macon County
- Marion County
- Mercer County
- Monroe County
- Nodaway County
- Pike County
- Putnam County
- Ralls County
- Schuyler County
- Scotland County
- Shelby County
- Sullivan County
- Worth County
• St. Louis, MO-IL
- Bond County, IL
- Calhoun County, IL
- Clinton County, IL
- Franklin County, MO
- Jefferson County, MO
- Jersey County, IL
- Lincoln County, MO
- Macoupin County, IL
- Madison County, IL
- Monroe County, IL
- St. Charles County, MO
- St. Clair County, IL
- St. Louis County, MO
- St. Louis city, MO
- Warren County, MO
- Washington County, MO