appendix iii classification tables -...
TRANSCRIPT
66
Appendix III
Classification Tables - Malta
67
HARMONIZATION OF DIETARY DATA
68
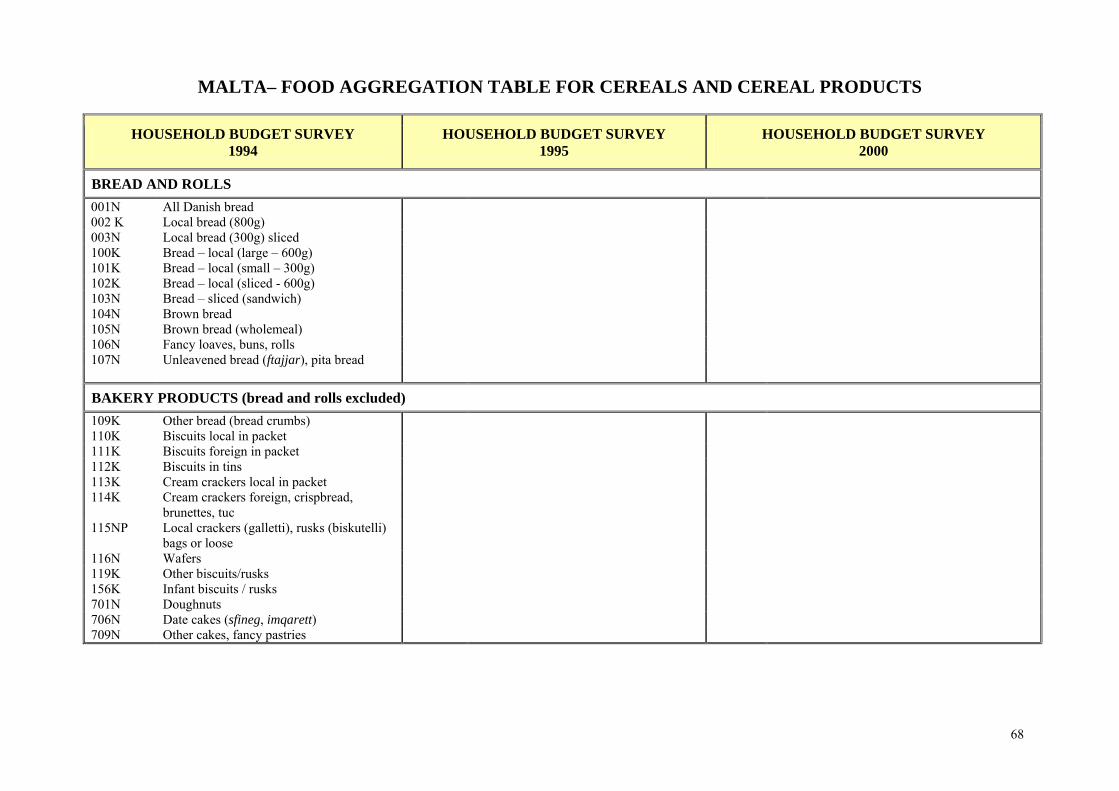
MALTA– FOOD AGGREGATION TABLE FOR CEREALS AND CEREAL PRODUCTS
HOUSEHOLD BUDGET SURVEY 1994
HOUSEHOLD BUDGET SURVEY 1995
HOUSEHOLD BUDGET SURVEY 2000
BREAD AND ROLLS 001N All Danish bread 002 K Local bread (800g) 003N Local bread (300g) sliced 100K Bread – local (large – 600g) 101K Bread – local (small – 300g) 102K Bread – local (sliced - 600g) 103N Bread – sliced (sandwich) 104N Brown bread 105N Brown bread (wholemeal) 106N Fancy loaves, buns, rolls 107N Unleavened bread (ftajjar), pita bread
BAKERY PRODUCTS (bread and rolls excluded) 109K Other bread (bread crumbs) 110K Biscuits local in packet 111K Biscuits foreign in packet 112K Biscuits in tins 113K Cream crackers local in packet 114K Cream crackers foreign, crispbread,
brunettes, tuc
115NP Local crackers (galletti), rusks (biskutelli) bags or loose
116N Wafers 119K Other biscuits/rusks 156K Infant biscuits / rusks 701N Doughnuts 706N Date cakes (sfineg, imqarett) 709N Other cakes, fancy pastries
69
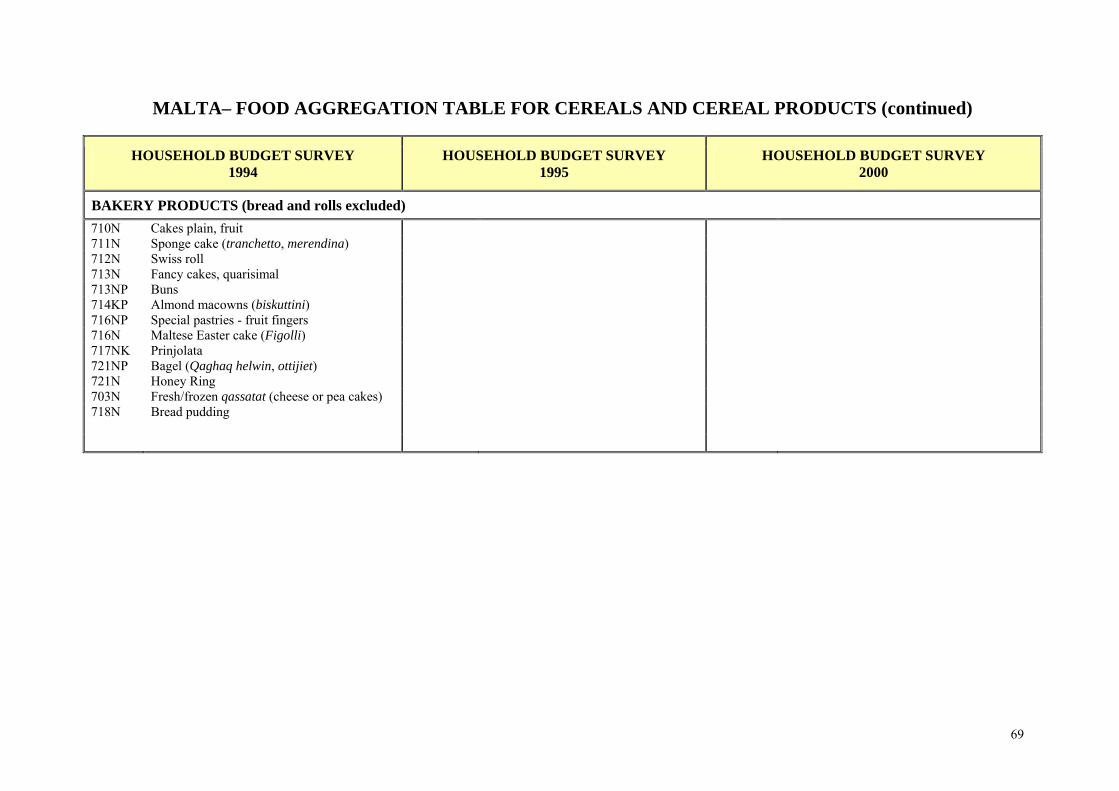
MALTA– FOOD AGGREGATION TABLE FOR CEREALS AND CEREAL PRODUCTS (continued)
HOUSEHOLD BUDGET SURVEY 1994
HOUSEHOLD BUDGET SURVEY 1995
HOUSEHOLD BUDGET SURVEY 2000
BAKERY PRODUCTS (bread and rolls excluded) 710N Cakes plain, fruit 711N Sponge cake (tranchetto, merendina) 712N Swiss roll 713N Fancy cakes, quarisimal 713NP Buns 714KP Almond macowns (biskuttini) 716NP Special pastries - fruit fingers 716N Maltese Easter cake (Figolli) 717NK Prinjolata 721NP Bagel (Qaghaq helwin, ottijiet) 721N Honey Ring 703N Fresh/frozen qassatat (cheese or pea cakes) 718N Bread pudding
70
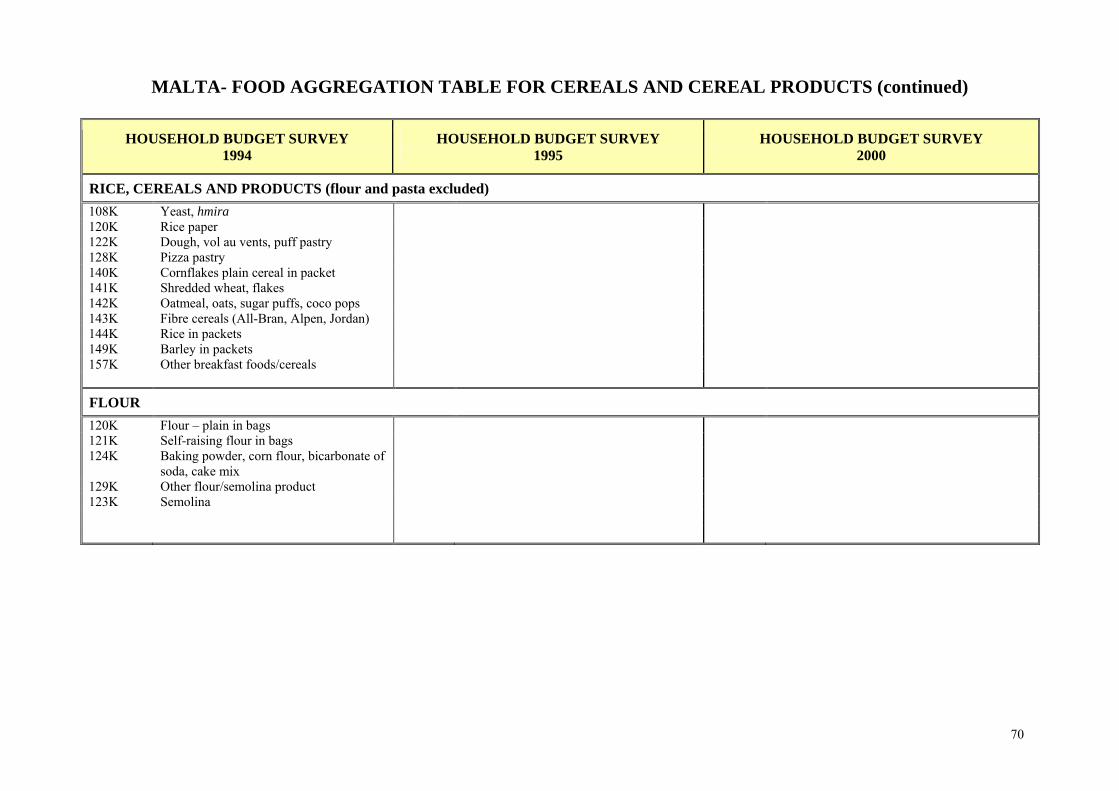
MALTA- FOOD AGGREGATION TABLE FOR CEREALS AND CEREAL PRODUCTS (continued)
HOUSEHOLD BUDGET SURVEY
1994 HOUSEHOLD BUDGET SURVEY
1995 HOUSEHOLD BUDGET SURVEY
2000
RICE, CEREALS AND PRODUCTS (flour and pasta excluded) 108K Yeast, hmira
120K Rice paper 122K Dough, vol au vents, puff pastry 128K Pizza pastry 140K Cornflakes plain cereal in packet 141K Shredded wheat, flakes 142K Oatmeal, oats, sugar puffs, coco pops 143K Fibre cereals (All-Bran, Alpen, Jordan) 144K Rice in packets 149K Barley in packets 157K Other breakfast foods/cereals
FLOUR 120K Flour – plain in bags 121K Self-raising flour in bags 124K Baking powder, corn flour, bicarbonate of
soda, cake mix
129K Other flour/semolina product 123K Semolina
71
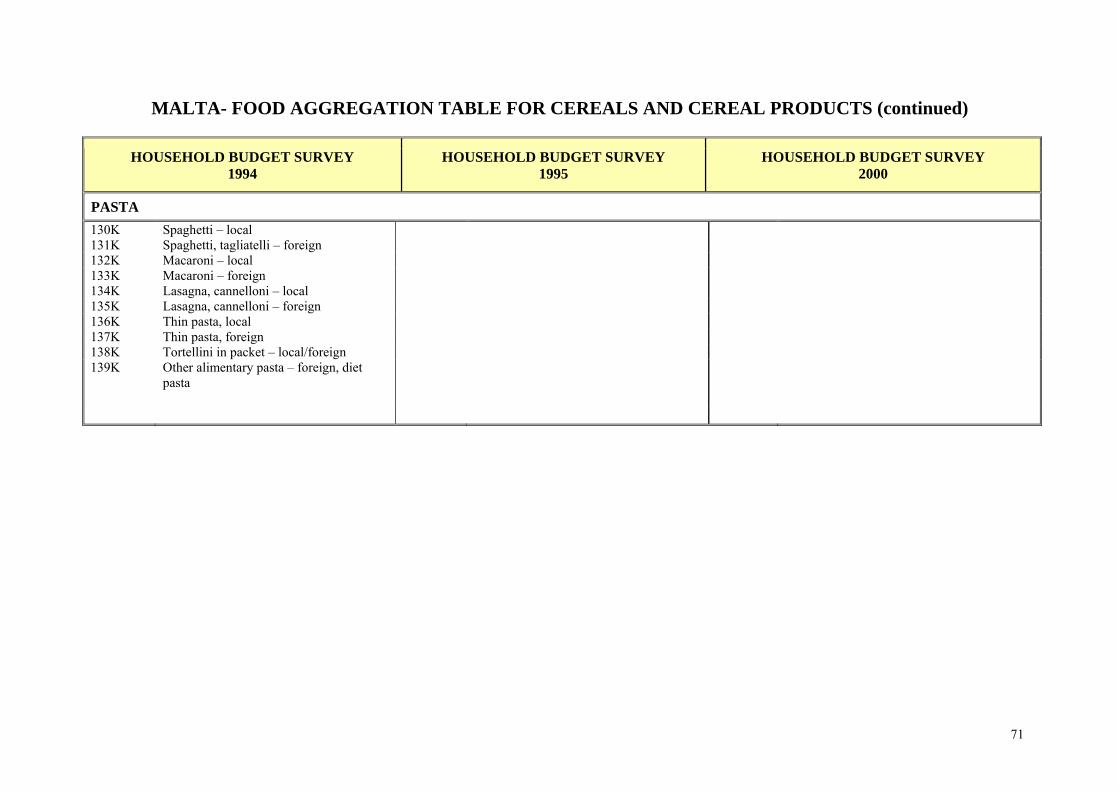
MALTA- FOOD AGGREGATION TABLE FOR CEREALS AND CEREAL PRODUCTS (continued)
HOUSEHOLD BUDGET SURVEY 1994
HOUSEHOLD BUDGET SURVEY 1995
HOUSEHOLD BUDGET SURVEY 2000
PASTA 130K Spaghetti – local 131K Spaghetti, tagliatelli – foreign 132K Macaroni – local 133K Macaroni – foreign 134K Lasagna, cannelloni – local 135K Lasagna, cannelloni – foreign 136K Thin pasta, local 137K Thin pasta, foreign 138K Tortellini in packet – local/foreign 139K Other alimentary pasta – foreign, diet
pasta
72
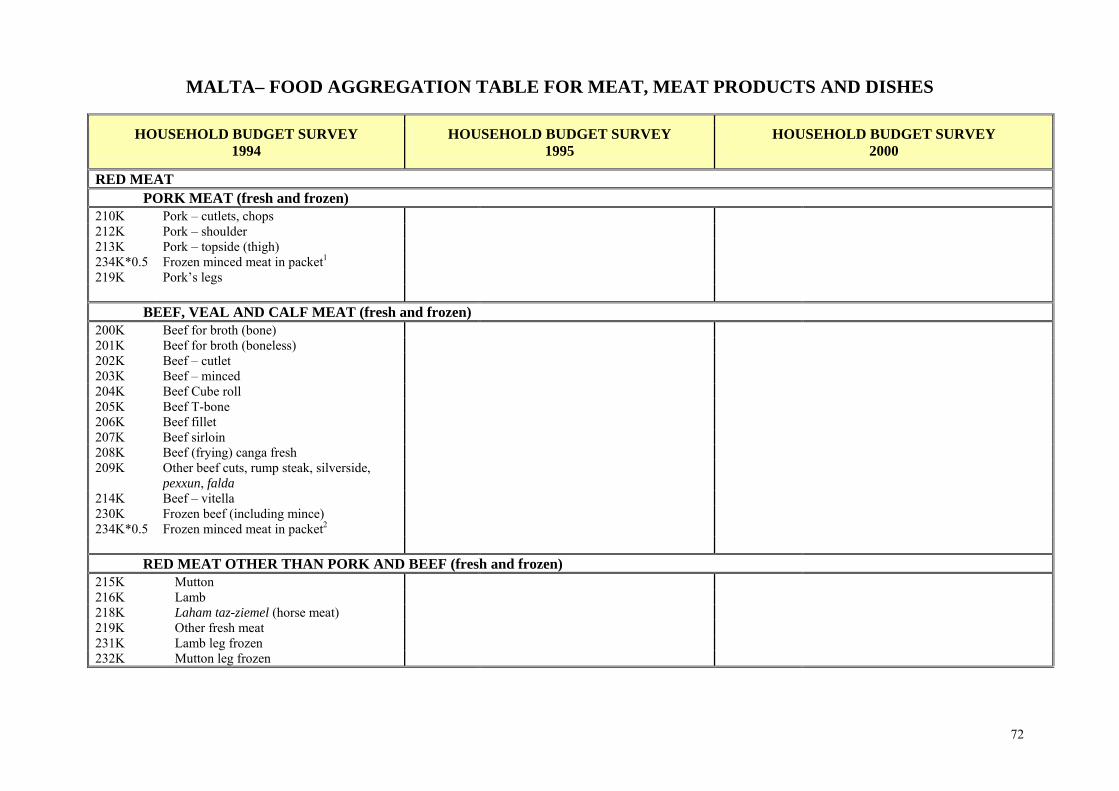
MALTA– FOOD AGGREGATION TABLE FOR MEAT, MEAT PRODUCTS AND DISHES
HOUSEHOLD BUDGET SURVEY 1994
HOUSEHOLD BUDGET SURVEY 1995
HOUSEHOLD BUDGET SURVEY 2000
RED MEAT PORK MEAT (fresh and frozen) 210K Pork – cutlets, chops 212K Pork – shoulder 213K Pork – topside (thigh) 234K*0.5 Frozen minced meat in packet1 219K Pork’s legs BEEF, VEAL AND CALF MEAT (fresh and frozen) 200K Beef for broth (bone)
201K Beef for broth (boneless)
202K Beef – cutlet
203K Beef – minced
204K Beef Cube roll
205K Beef T-bone
206K Beef fillet
207K Beef sirloin
208K Beef (frying) canga fresh
209K Other beef cuts, rump steak, silverside, pexxun, falda
214K Beef – vitella
230K Frozen beef (including mince)
234K*0.5 Frozen minced meat in packet2
RED MEAT OTHER THAN PORK AND BEEF (fresh and frozen) 215K Mutton 216K Lamb 218K Laham taz-ziemel (horse meat)
219K Other fresh meat
231K Lamb leg frozen
232K Mutton leg frozen
73
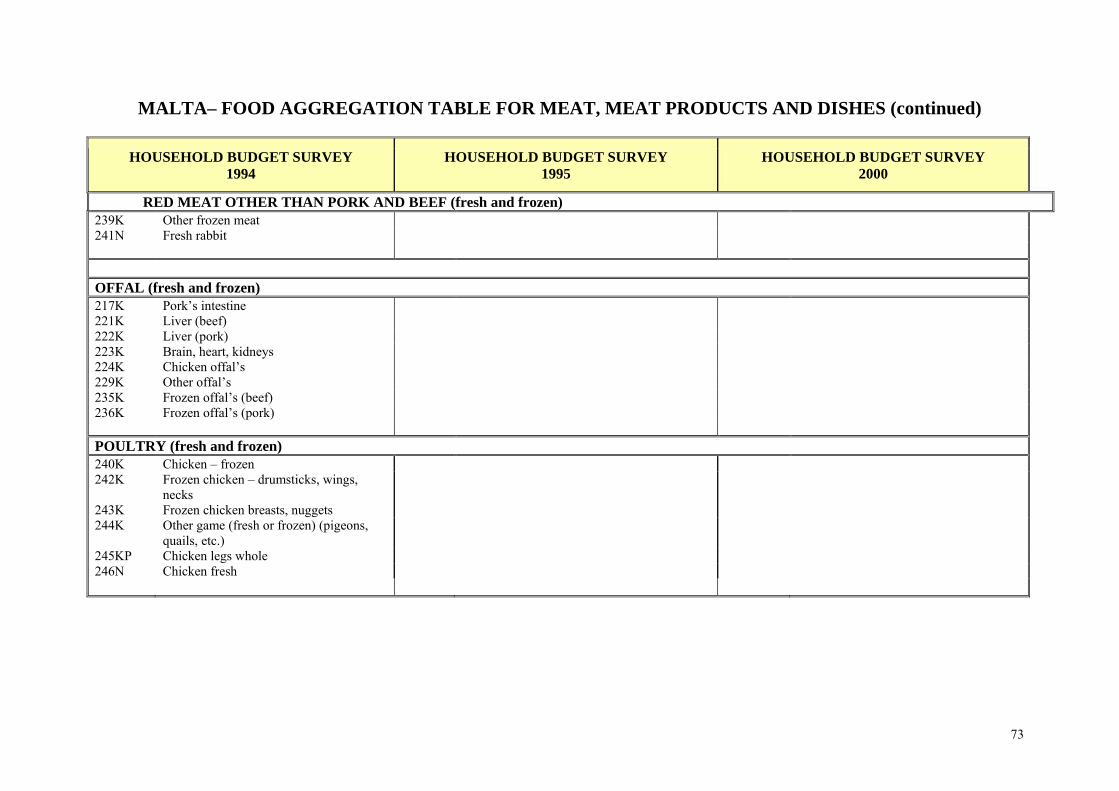
MALTA– FOOD AGGREGATION TABLE FOR MEAT, MEAT PRODUCTS AND DISHES (continued)
HOUSEHOLD BUDGET SURVEY 1994
HOUSEHOLD BUDGET SURVEY 1995
HOUSEHOLD BUDGET SURVEY 2000
RED MEAT OTHER THAN PORK AND BEEF (fresh and frozen) 239K Other frozen meat 241N Fresh rabbit OFFAL (fresh and frozen) 217K Pork’s intestine 221K Liver (beef) 222K Liver (pork) 223K Brain, heart, kidneys 224K Chicken offal’s 229K Other offal’s 235K Frozen offal’s (beef) 236K Frozen offal’s (pork) POULTRY (fresh and frozen) 240K Chicken – frozen 242K Frozen chicken – drumsticks, wings,
necks
243K Frozen chicken breasts, nuggets 244K Other game (fresh or frozen) (pigeons,
quails, etc.)
245KP Chicken legs whole 246N Chicken fresh
74
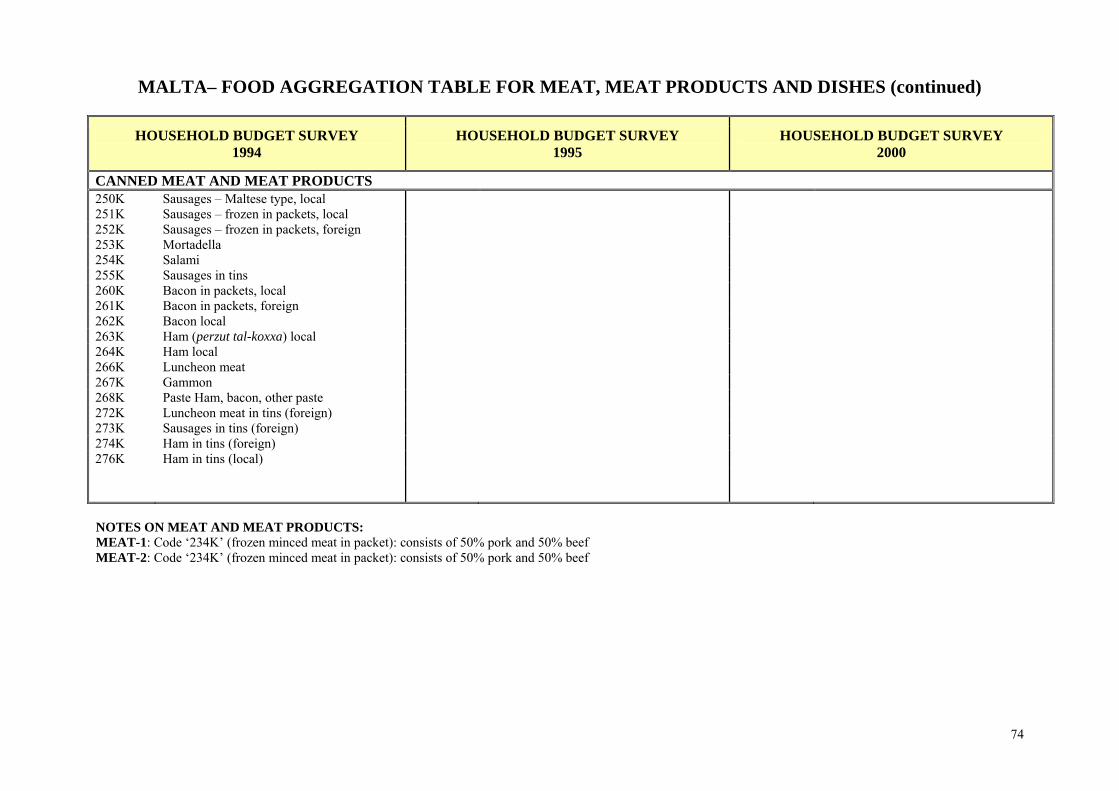
MALTA– FOOD AGGREGATION TABLE FOR MEAT, MEAT PRODUCTS AND DISHES (continued)
HOUSEHOLD BUDGET SURVEY 1994
HOUSEHOLD BUDGET SURVEY 1995
HOUSEHOLD BUDGET SURVEY 2000
CANNED MEAT AND MEAT PRODUCTS 250K Sausages – Maltese type, local 251K Sausages – frozen in packets, local 252K Sausages – frozen in packets, foreign 253K Mortadella 254K Salami 255K Sausages in tins 260K Bacon in packets, local 261K Bacon in packets, foreign 262K Bacon local 263K Ham (perzut tal-koxxa) local 264K Ham local 266K Luncheon meat 267K Gammon 268K Paste Ham, bacon, other paste 272K Luncheon meat in tins (foreign) 273K Sausages in tins (foreign) 274K Ham in tins (foreign) 276K Ham in tins (local) NOTES ON MEAT AND MEAT PRODUCTS: MEAT-1: Code ‘234K’ (frozen minced meat in packet): consists of 50% pork and 50% beef MEAT-2: Code ‘234K’ (frozen minced meat in packet): consists of 50% pork and 50% beef
75
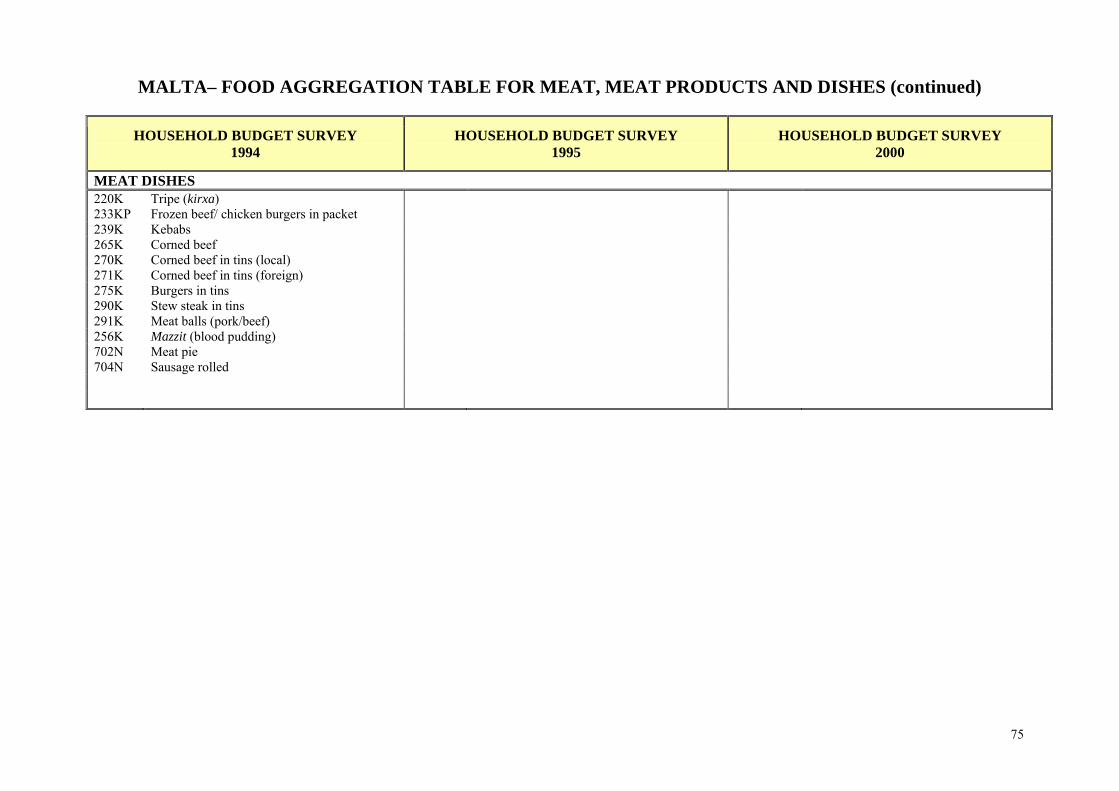
MALTA– FOOD AGGREGATION TABLE FOR MEAT, MEAT PRODUCTS AND DISHES (continued)
HOUSEHOLD BUDGET SURVEY 1994
HOUSEHOLD BUDGET SURVEY 1995
HOUSEHOLD BUDGET SURVEY 2000
MEAT DISHES 220K Tripe (kirxa) 233KP Frozen beef/ chicken burgers in packet
239K Kebabs
265K Corned beef
270K Corned beef in tins (local)
271K Corned beef in tins (foreign)
275K Burgers in tins
290K Stew steak in tins
291K Meat balls (pork/beef)
256K Mazzit (blood pudding)
702N Meat pie
704N Sausage rolled
76
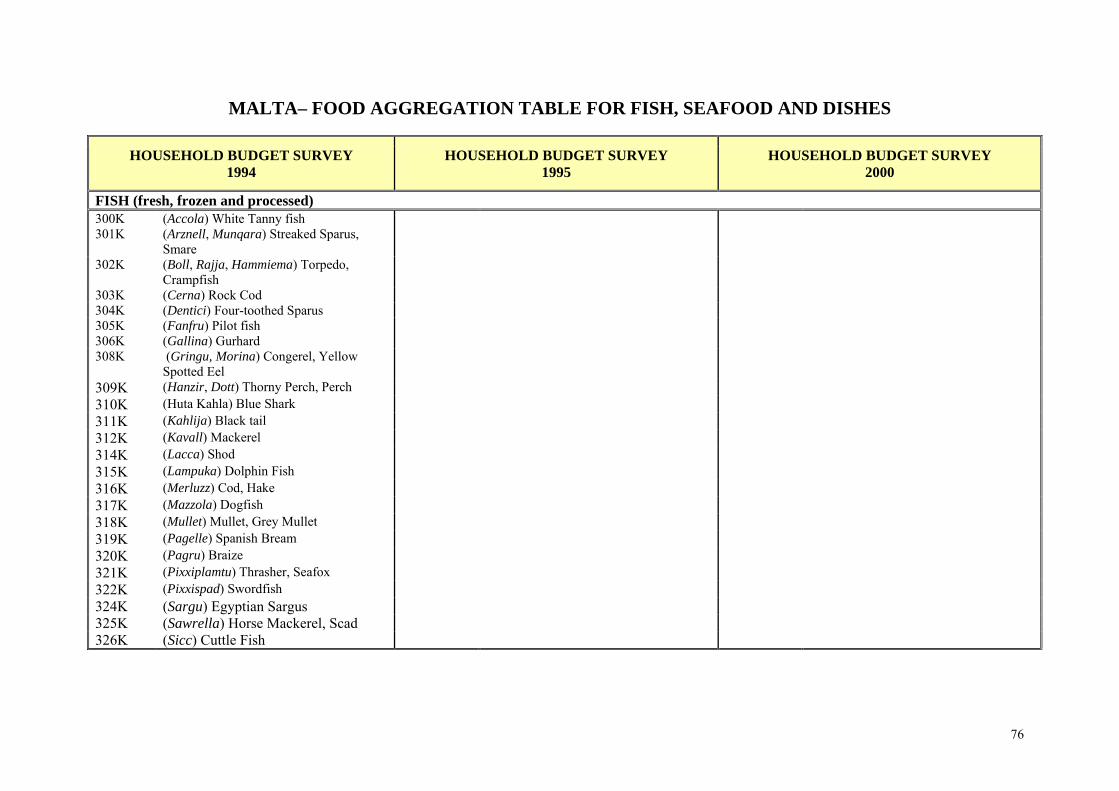
MALTA– FOOD AGGREGATION TABLE FOR FISH, SEAFOOD AND DISHES
HOUSEHOLD BUDGET SURVEY 1994
HOUSEHOLD BUDGET SURVEY 1995
HOUSEHOLD BUDGET SURVEY 2000
FISH (fresh, frozen and processed) 300K (Accola) White Tanny fish
301K (Arznell, Munqara) Streaked Sparus, Smare
302K (Boll, Rajja, Hammiema) Torpedo, Crampfish
303K (Cerna) Rock Cod
304K (Dentici) Four-toothed Sparus
305K (Fanfru) Pilot fish
306K (Gallina) Gurhard
308K (Gringu, Morina) Congerel, Yellow Spotted Eel
309K (Hanzir, Dott) Thorny Perch, Perch
310K (Huta Kahla) Blue Shark
311K (Kahlija) Black tail
312K (Kavall) Mackerel
314K (Lacca) Shod
315K (Lampuka) Dolphin Fish
316K (Merluzz) Cod, Hake
317K (Mazzola) Dogfish
318K (Mullet) Mullet, Grey Mullet
319K (Pagelle) Spanish Bream
320K (Pagru) Braize
321K (Pixxiplamtu) Thrasher, Seafox
322K (Pixxispad) Swordfish
324K (Sargu) Egyptian Sargus
325K (Sawrella) Horse Mackerel, Scad 326K (Sicc) Cuttle Fish
77
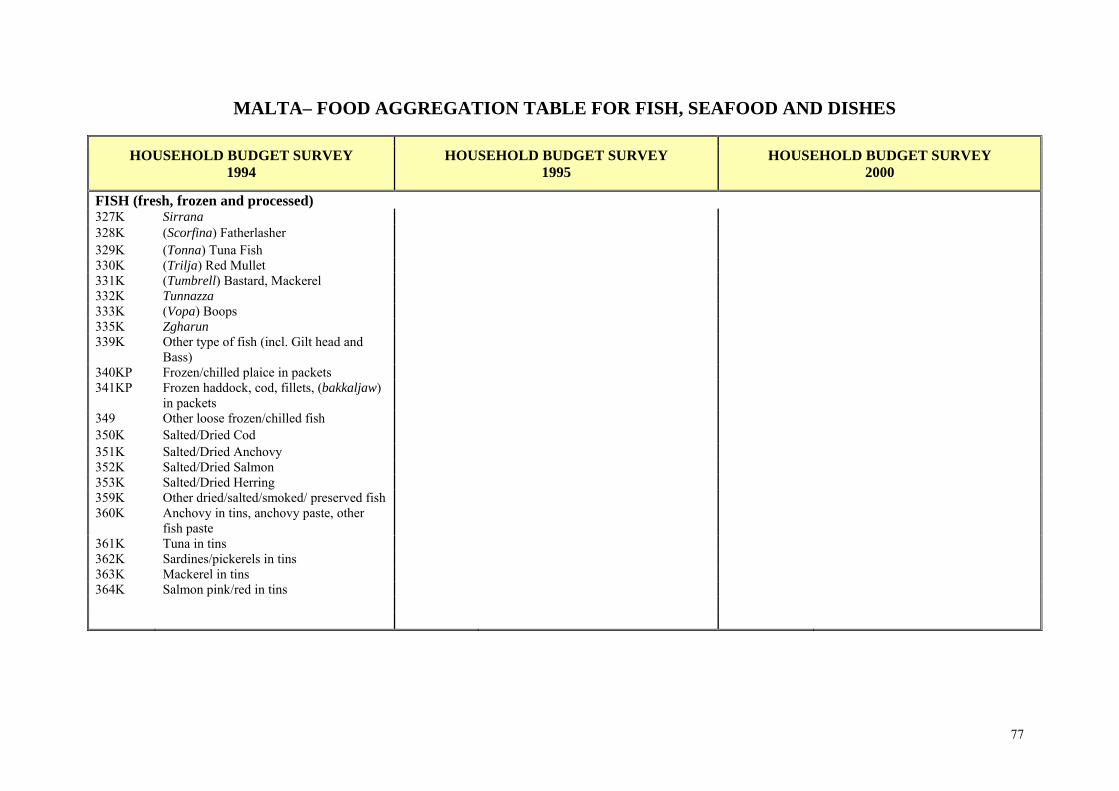
MALTA– FOOD AGGREGATION TABLE FOR FISH, SEAFOOD AND DISHES
HOUSEHOLD BUDGET SURVEY 1994
HOUSEHOLD BUDGET SURVEY 1995
HOUSEHOLD BUDGET SURVEY 2000
FISH (fresh, frozen and processed) 327K Sirrana 328K (Scorfina) Fatherlasher 329K (Tonna) Tuna Fish 330K (Trilja) Red Mullet 331K (Tumbrell) Bastard, Mackerel 332K Tunnazza 333K (Vopa) Boops 335K Zgharun 339K Other type of fish (incl. Gilt head and
Bass)
340KP Frozen/chilled plaice in packets 341KP Frozen haddock, cod, fillets, (bakkaljaw)
in packets
349 Other loose frozen/chilled fish 350K Salted/Dried Cod 351K Salted/Dried Anchovy 352K Salted/Dried Salmon 353K Salted/Dried Herring 359K Other dried/salted/smoked/ preserved fish 360K Anchovy in tins, anchovy paste, other
fish paste
361K Tuna in tins 362K Sardines/pickerels in tins 363K Mackerel in tins 364K Salmon pink/red in tins
78
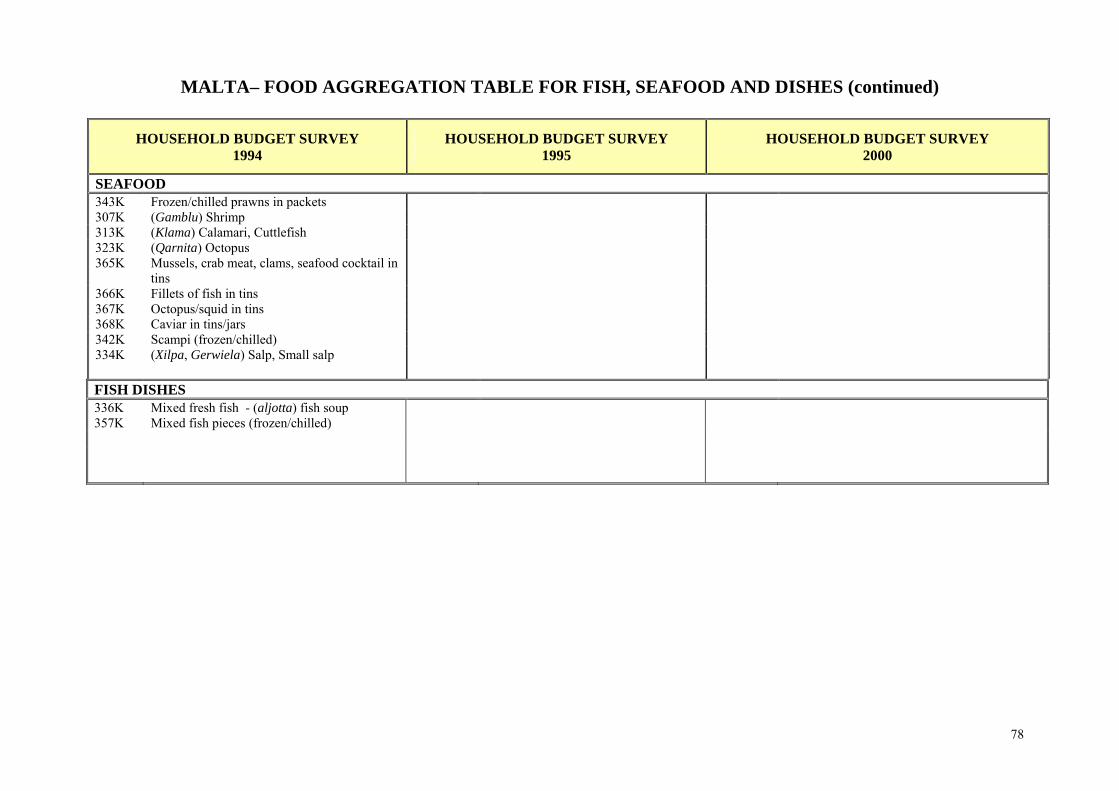
MALTA– FOOD AGGREGATION TABLE FOR FISH, SEAFOOD AND DISHES (continued)
HOUSEHOLD BUDGET SURVEY 1994
HOUSEHOLD BUDGET SURVEY 1995
HOUSEHOLD BUDGET SURVEY 2000
SEAFOOD 343K Frozen/chilled prawns in packets 307K (Gamblu) Shrimp 313K (Klama) Calamari, Cuttlefish 323K (Qarnita) Octopus 365K Mussels, crab meat, clams, seafood cocktail in
tins
366K Fillets of fish in tins 367K Octopus/squid in tins 368K Caviar in tins/jars 342K Scampi (frozen/chilled) 334K (Xilpa, Gerwiela) Salp, Small salp FISH DISHES 336K Mixed fresh fish - (aljotta) fish soup 357K Mixed fish pieces (frozen/chilled)
79
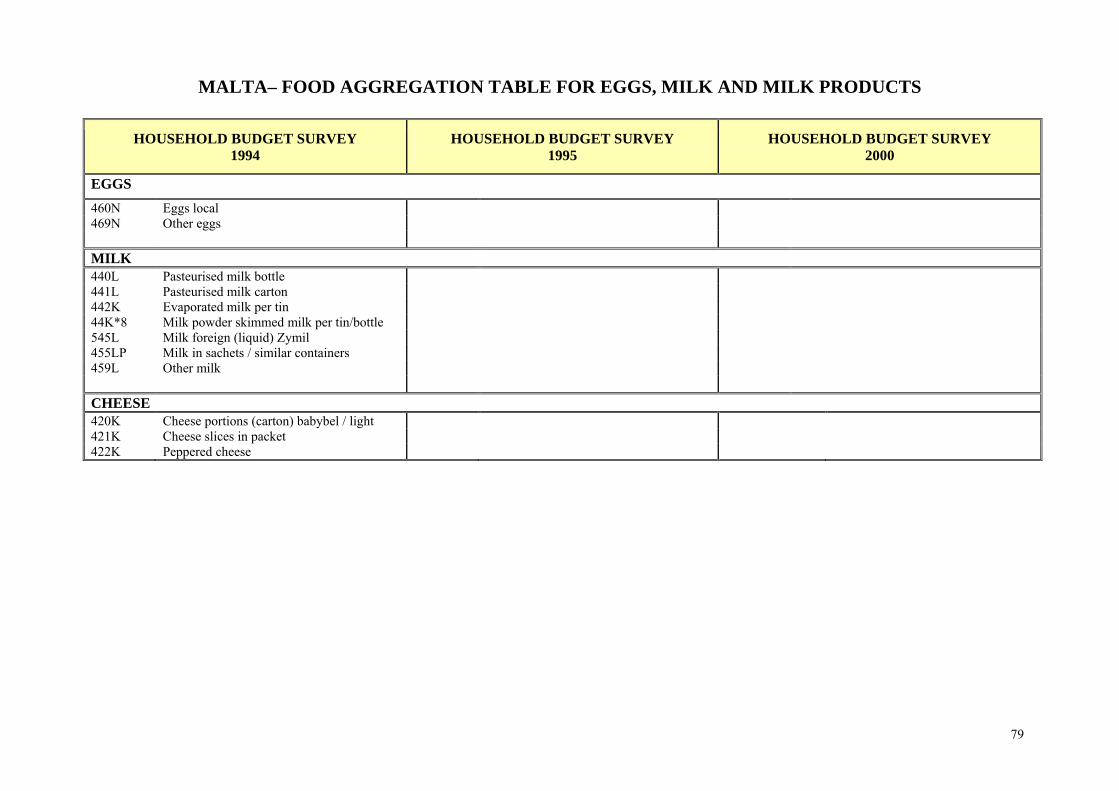
MALTA– FOOD AGGREGATION TABLE FOR EGGS, MILK AND MILK PRODUCTS
HOUSEHOLD BUDGET SURVEY 1994
HOUSEHOLD BUDGET SURVEY 1995
HOUSEHOLD BUDGET SURVEY 2000
EGGS
460N Eggs local 469N Other eggs MILK
440L Pasteurised milk bottle 441L Pasteurised milk carton 442K Evaporated milk per tin 44K*8 Milk powder skimmed milk per tin/bottle 545L Milk foreign (liquid) Zymil 455LP Milk in sachets / similar containers 459L Other milk CHEESE 420K Cheese portions (carton) babybel / light 421K Cheese slices in packet 422K Peppered cheese
80
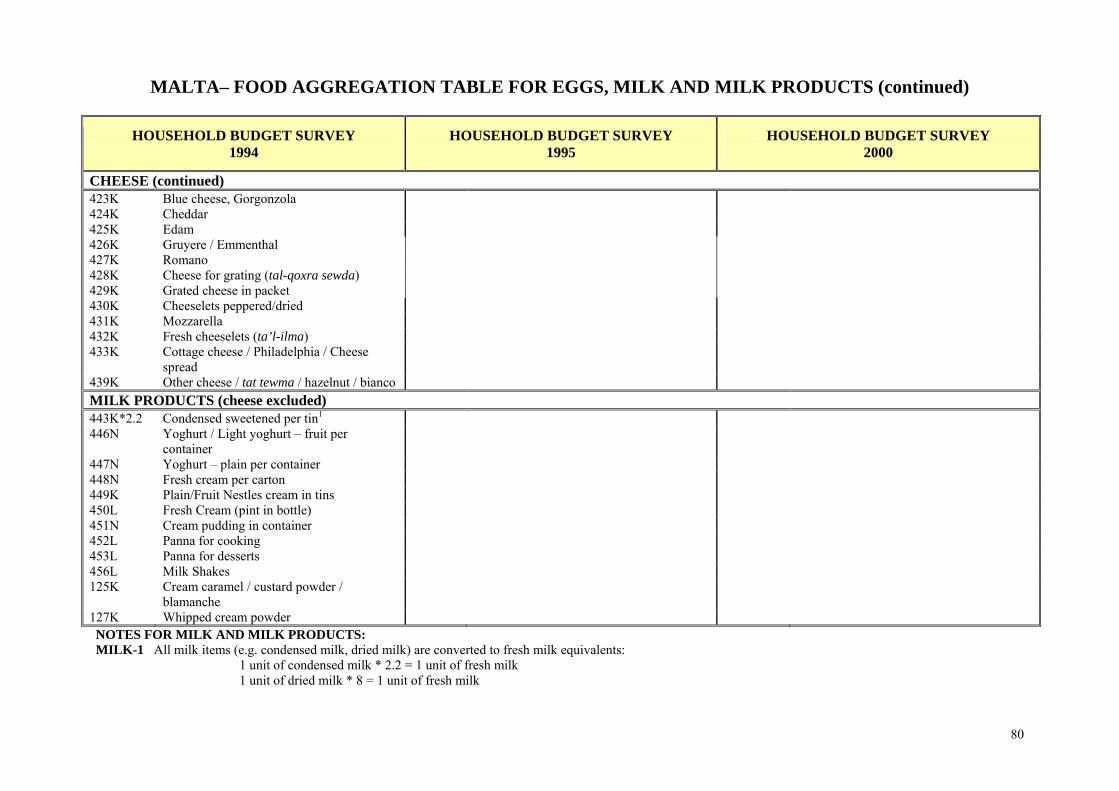
MALTA– FOOD AGGREGATION TABLE FOR EGGS, MILK AND MILK PRODUCTS (continued)
HOUSEHOLD BUDGET SURVEY 1994
HOUSEHOLD BUDGET SURVEY 1995
HOUSEHOLD BUDGET SURVEY 2000
CHEESE (continued) 423K Blue cheese, Gorgonzola 424K Cheddar 425K Edam 426K Gruyere / Emmenthal 427K Romano 428K Cheese for grating (tal-qoxra sewda) 429K Grated cheese in packet 430K Cheeselets peppered/dried 431K Mozzarella 432K Fresh cheeselets (ta’l-ilma) 433K Cottage cheese / Philadelphia / Cheese
spread
439K Other cheese / tat tewma / hazelnut / bianco MILK PRODUCTS (cheese excluded) 443K*2.2 Condensed sweetened per tin1
446N Yoghurt / Light yoghurt – fruit per container
447N Yoghurt – plain per container 448N Fresh cream per carton 449K Plain/Fruit Nestles cream in tins 450L Fresh Cream (pint in bottle) 451N Cream pudding in container 452L Panna for cooking 453L Panna for desserts 456L Milk Shakes 125K Cream caramel / custard powder /
blamanche
127K Whipped cream powder NOTES FOR MILK AND MILK PRODUCTS: MILK-1 All milk items (e.g. condensed milk, dried milk) are converted to fresh milk equivalents:
1 unit of condensed milk * 2.2 = 1 unit of fresh milk 1 unit of dried milk * 8 = 1 unit of fresh milk
81
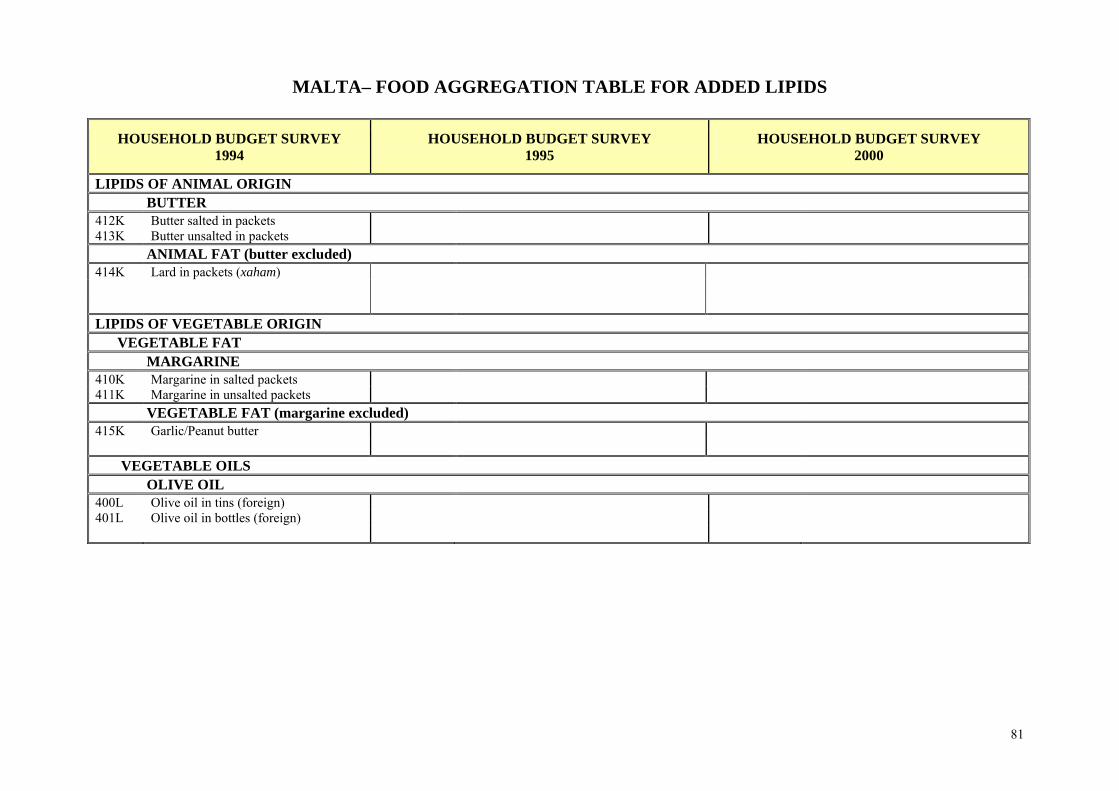
MALTA– FOOD AGGREGATION TABLE FOR ADDED LIPIDS
HOUSEHOLD BUDGET SURVEY 1994
HOUSEHOLD BUDGET SURVEY 1995
HOUSEHOLD BUDGET SURVEY 2000
LIPIDS OF ANIMAL ORIGIN BUTTER 412K Butter salted in packets 413K Butter unsalted in packets ANIMAL FAT (butter excluded) 414K Lard in packets (xaham) LIPIDS OF VEGETABLE ORIGIN VEGETABLE FAT MARGARINE 410K Margarine in salted packets 411K Margarine in unsalted packets VEGETABLE FAT (margarine excluded) 415K Garlic/Peanut butter VEGETABLE OILS OLIVE OIL 400L Olive oil in tins (foreign) 401L Olive oil in bottles (foreign)
82
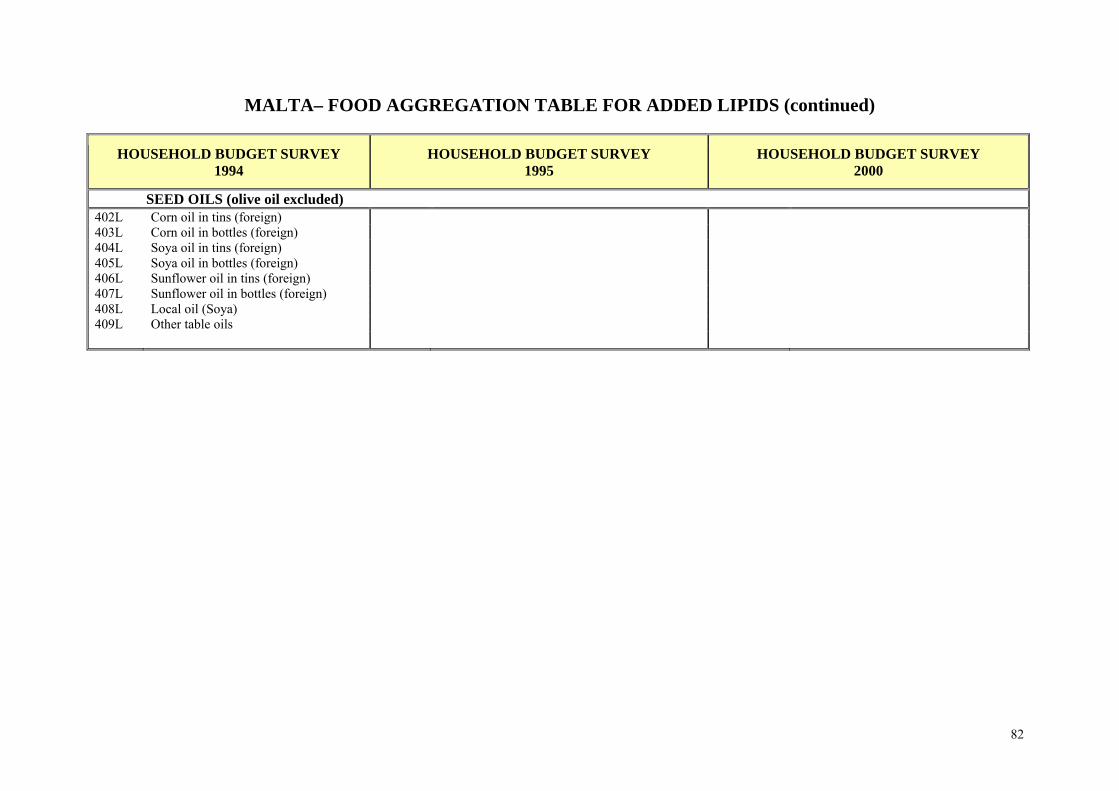
MALTA– FOOD AGGREGATION TABLE FOR ADDED LIPIDS (continued)
HOUSEHOLD BUDGET SURVEY 1994
HOUSEHOLD BUDGET SURVEY 1995
HOUSEHOLD BUDGET SURVEY 2000
SEED OILS (olive oil excluded) 402L Corn oil in tins (foreign) 403L Corn oil in bottles (foreign) 404L Soya oil in tins (foreign) 405L Soya oil in bottles (foreign) 406L Sunflower oil in tins (foreign) 407L Sunflower oil in bottles (foreign) 408L Local oil (Soya) 409L Other table oils
83
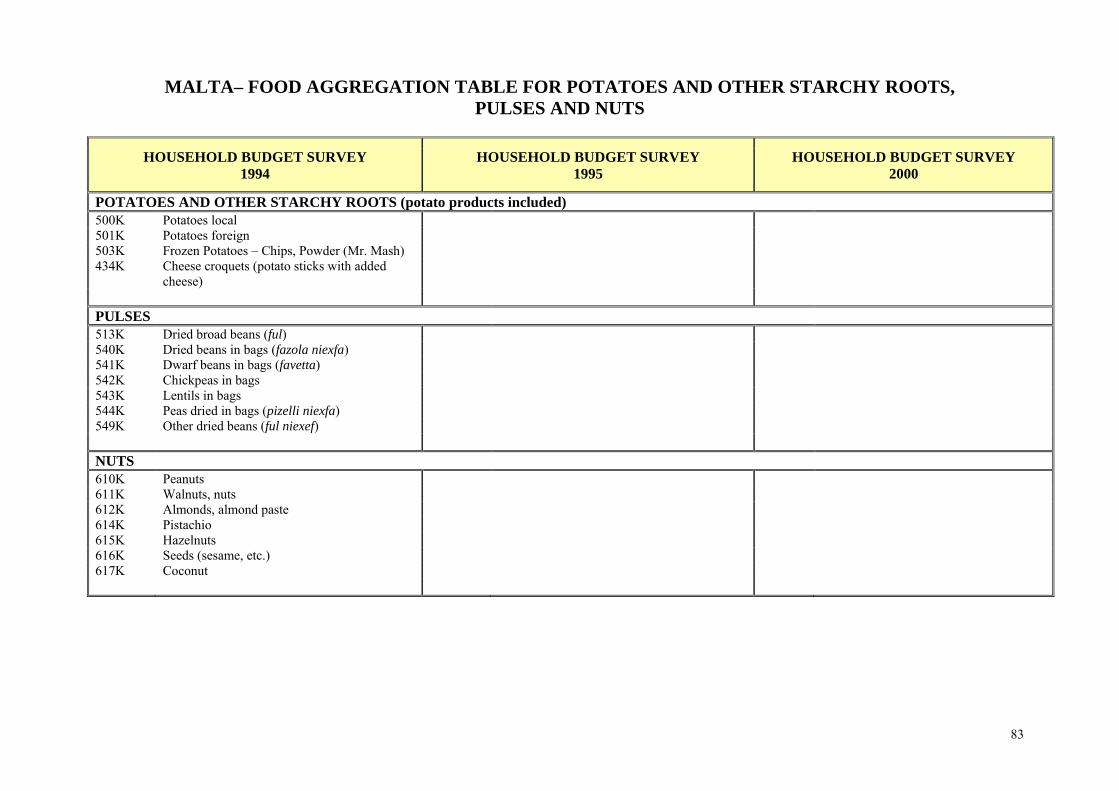
MALTA– FOOD AGGREGATION TABLE FOR POTATOES AND OTHER STARCHY ROOTS, PULSES AND NUTS
HOUSEHOLD BUDGET SURVEY 1994
HOUSEHOLD BUDGET SURVEY 1995
HOUSEHOLD BUDGET SURVEY 2000
POTATOES AND OTHER STARCHY ROOTS (potato products included) 500K Potatoes local 501K Potatoes foreign 503K Frozen Potatoes – Chips, Powder (Mr. Mash) 434K Cheese croquets (potato sticks with added
cheese)
PULSES 513K Dried broad beans (ful) 540K Dried beans in bags (fazola niexfa) 541K Dwarf beans in bags (favetta) 542K Chickpeas in bags 543K Lentils in bags 544K Peas dried in bags (pizelli niexfa) 549K Other dried beans (ful niexef) NUTS 610K Peanuts 611K Walnuts, nuts 612K Almonds, almond paste 614K Pistachio 615K Hazelnuts 616K Seeds (sesame, etc.) 617K Coconut
84
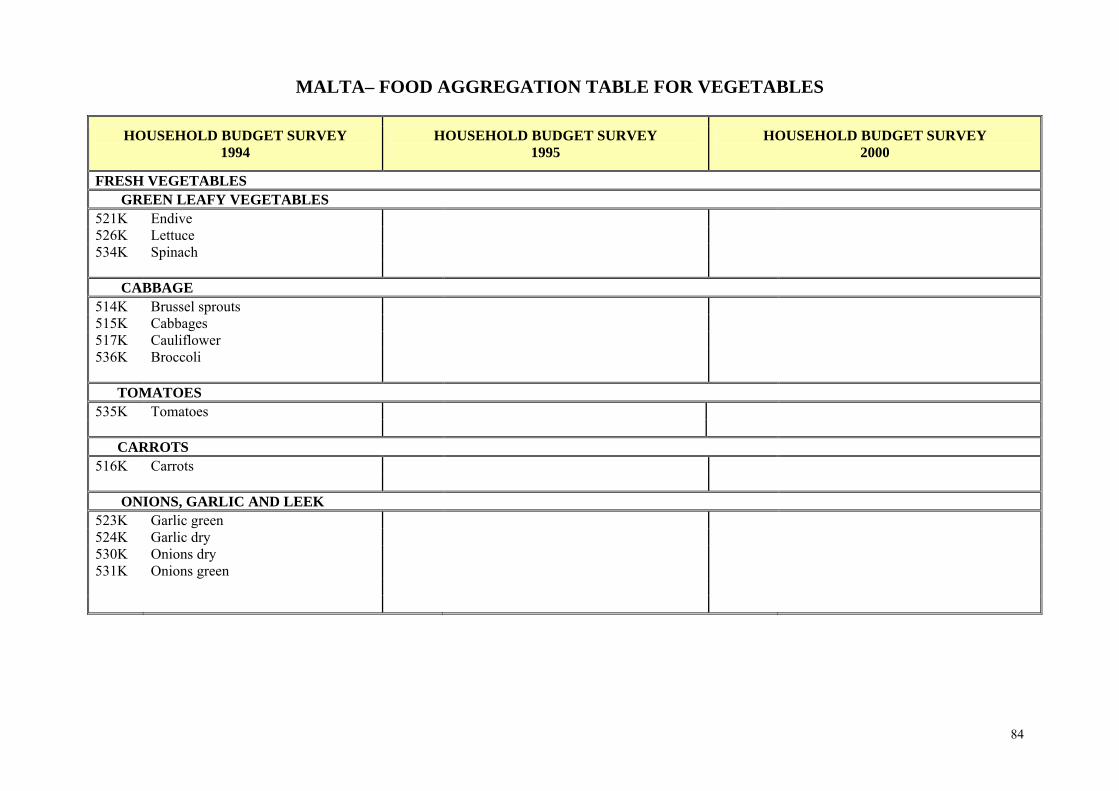
MALTA– FOOD AGGREGATION TABLE FOR VEGETABLES
HOUSEHOLD BUDGET SURVEY 1994
HOUSEHOLD BUDGET SURVEY 1995
HOUSEHOLD BUDGET SURVEY 2000
FRESH VEGETABLES GREEN LEAFY VEGETABLES 521K Endive 526K Lettuce 534K Spinach CABBAGE 514K Brussel sprouts 515K Cabbages 517K Cauliflower 536K Broccoli TOMATOES 535K Tomatoes CARROTS 516K Carrots ONIONS, GARLIC AND LEEK 523K Garlic green 524K Garlic dry 530K Onions dry 531K Onions green
85
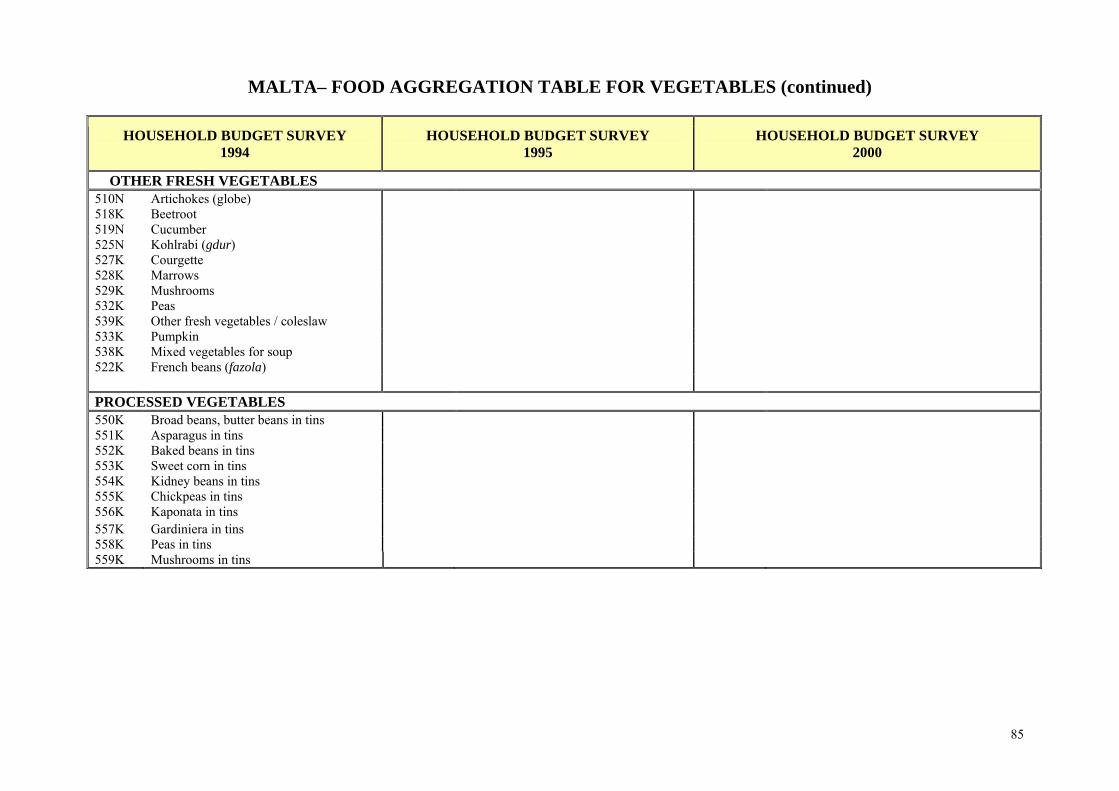
MALTA– FOOD AGGREGATION TABLE FOR VEGETABLES (continued)
HOUSEHOLD BUDGET SURVEY 1994
HOUSEHOLD BUDGET SURVEY 1995
HOUSEHOLD BUDGET SURVEY 2000
OTHER FRESH VEGETABLES 510N Artichokes (globe) 518K Beetroot 519N Cucumber 525N Kohlrabi (gdur) 527K Courgette 528K Marrows 529K Mushrooms 532K Peas 539K Other fresh vegetables / coleslaw 533K Pumpkin 538K Mixed vegetables for soup 522K French beans (fazola) PROCESSED VEGETABLES 550K Broad beans, butter beans in tins 551K Asparagus in tins 552K Baked beans in tins 553K Sweet corn in tins 554K Kidney beans in tins 555K Chickpeas in tins 556K Kaponata in tins 557K Gardiniera in tins 558K Peas in tins 559K Mushrooms in tins
86
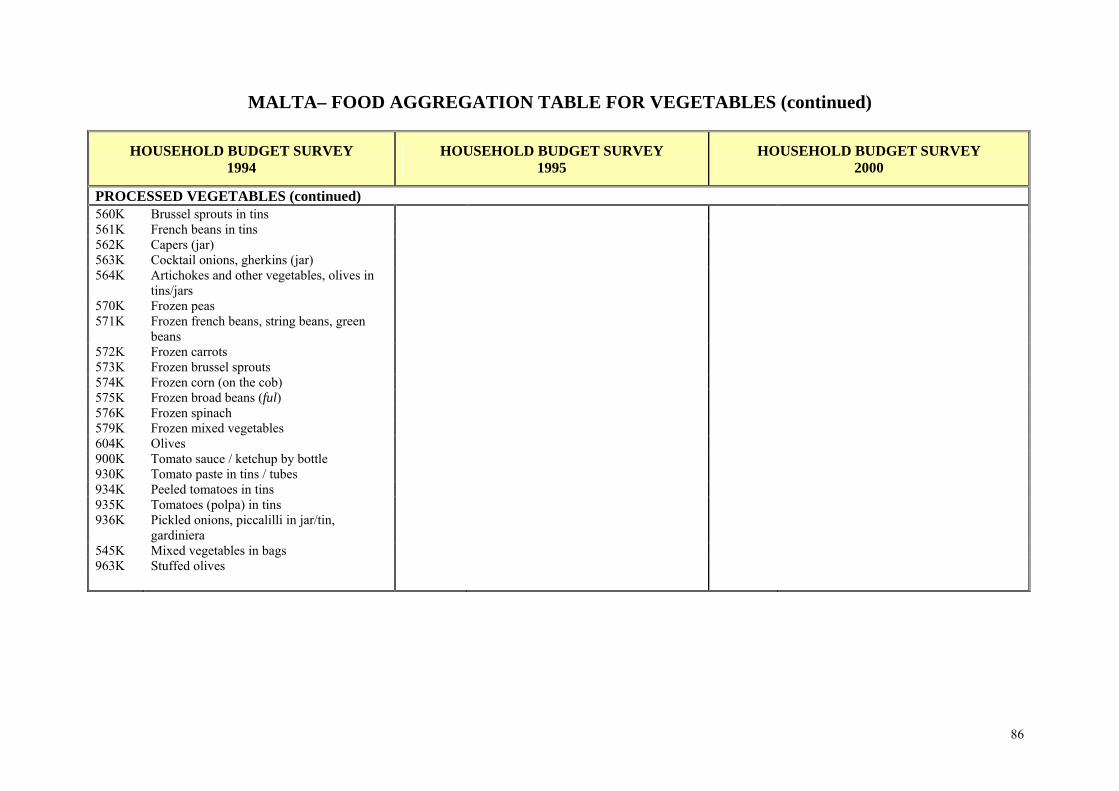
MALTA– FOOD AGGREGATION TABLE FOR VEGETABLES (continued)
HOUSEHOLD BUDGET SURVEY 1994
HOUSEHOLD BUDGET SURVEY 1995
HOUSEHOLD BUDGET SURVEY 2000
PROCESSED VEGETABLES (continued) 560K Brussel sprouts in tins 561K French beans in tins 562K Capers (jar) 563K Cocktail onions, gherkins (jar) 564K Artichokes and other vegetables, olives in
tins/jars
570K Frozen peas 571K Frozen french beans, string beans, green
beans
572K Frozen carrots 573K Frozen brussel sprouts 574K Frozen corn (on the cob) 575K Frozen broad beans (ful) 576K Frozen spinach 579K Frozen mixed vegetables 604K Olives 900K Tomato sauce / ketchup by bottle 930K Tomato paste in tins / tubes 934K Peeled tomatoes in tins 935K Tomatoes (polpa) in tins 936K Pickled onions, piccalilli in jar/tin,
gardiniera
545K Mixed vegetables in bags 963K Stuffed olives
87
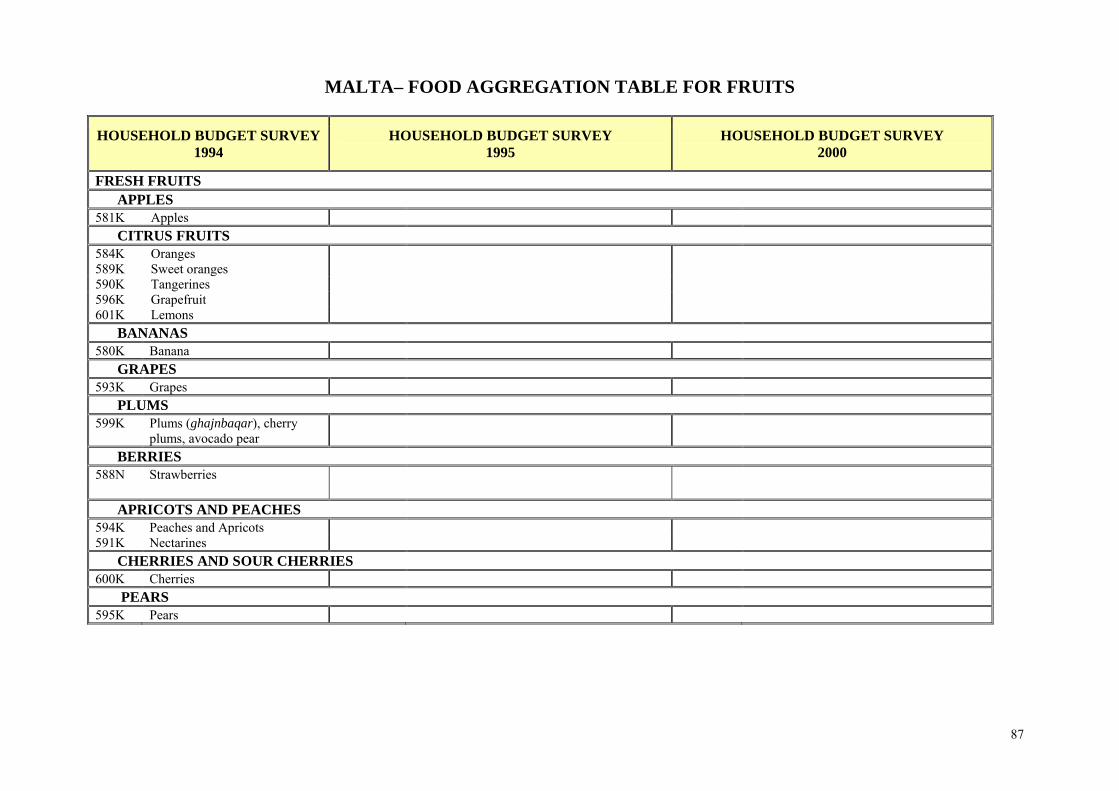
MALTA– FOOD AGGREGATION TABLE FOR FRUITS
HOUSEHOLD BUDGET SURVEY 1994
HOUSEHOLD BUDGET SURVEY 1995
HOUSEHOLD BUDGET SURVEY 2000
FRESH FRUITS APPLES 581K Apples CITRUS FRUITS 584K Oranges 589K Sweet oranges 590K Tangerines 596K Grapefruit 601K Lemons BANANAS 580K Banana GRAPES 593K Grapes PLUMS 599K Plums (ghajnbaqar), cherry
plums, avocado pear
BERRIES 588N Strawberries APRICOTS AND PEACHES 594K Peaches and Apricots 591K Nectarines CHERRIES AND SOUR CHERRIES 600K Cherries PEARS 595K Pears
88
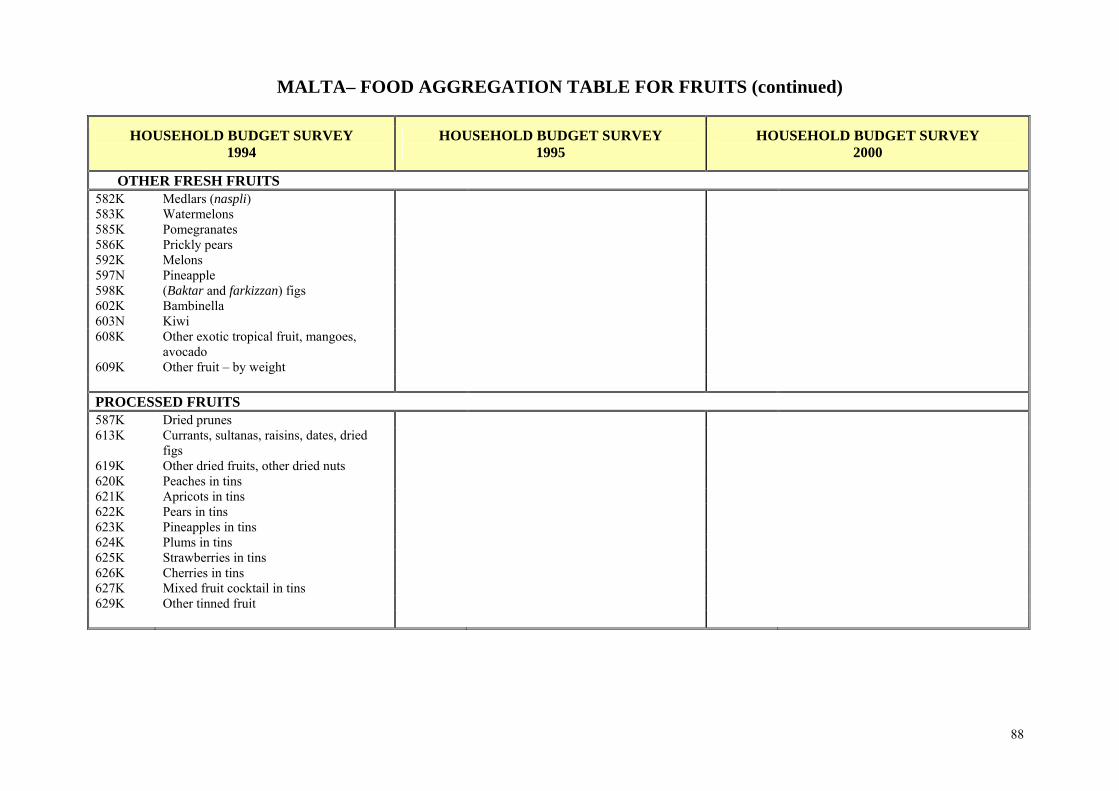
MALTA– FOOD AGGREGATION TABLE FOR FRUITS (continued)
HOUSEHOLD BUDGET SURVEY 1994
HOUSEHOLD BUDGET SURVEY 1995
HOUSEHOLD BUDGET SURVEY 2000
OTHER FRESH FRUITS 582K Medlars (naspli) 583K Watermelons 585K Pomegranates 586K Prickly pears 592K Melons 597N Pineapple 598K (Baktar and farkizzan) figs 602K Bambinella 603N Kiwi 608K Other exotic tropical fruit, mangoes,
avocado
609K Other fruit – by weight PROCESSED FRUITS 587K Dried prunes 613K Currants, sultanas, raisins, dates, dried
figs
619K Other dried fruits, other dried nuts
620K Peaches in tins
621K Apricots in tins
622K Pears in tins
623K Pineapples in tins
624K Plums in tins 625K Strawberries in tins 626K Cherries in tins 627K Mixed fruit cocktail in tins 629K Other tinned fruit
89
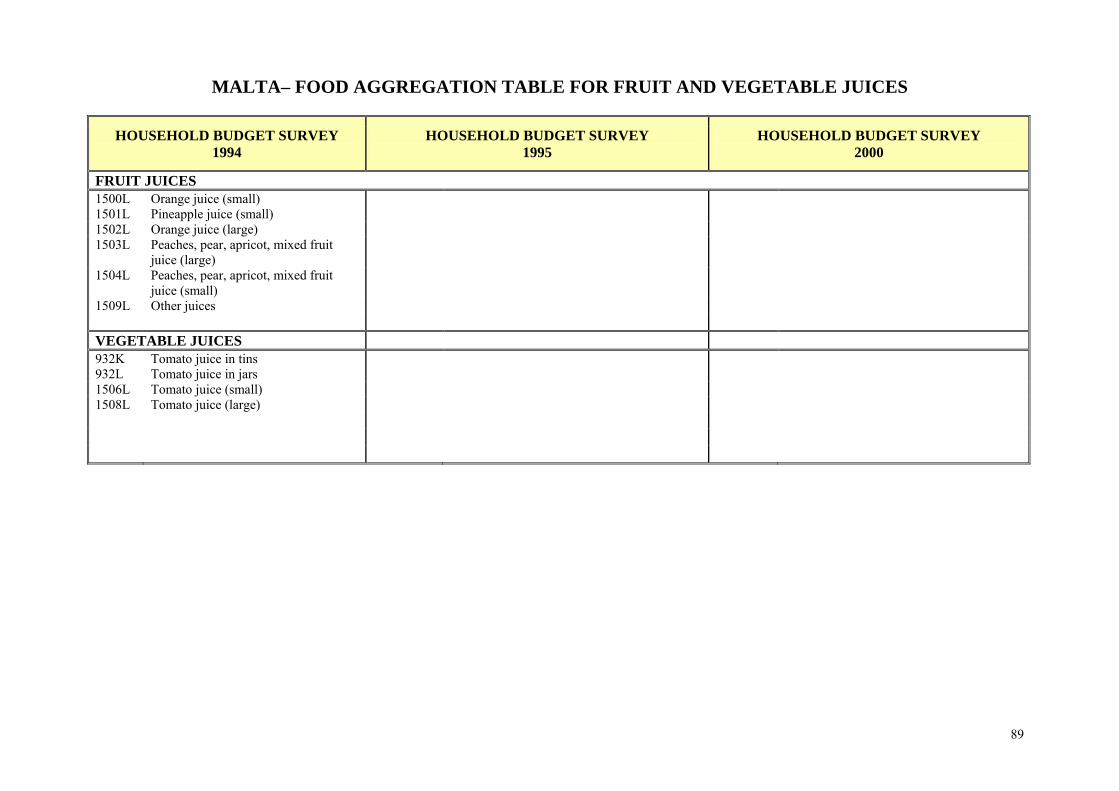
MALTA– FOOD AGGREGATION TABLE FOR FRUIT AND VEGETABLE JUICES
HOUSEHOLD BUDGET SURVEY 1994
HOUSEHOLD BUDGET SURVEY 1995
HOUSEHOLD BUDGET SURVEY 2000
FRUIT JUICES 1500L Orange juice (small) 1501L Pineapple juice (small) 1502L Orange juice (large) 1503L Peaches, pear, apricot, mixed fruit
juice (large)
1504L Peaches, pear, apricot, mixed fruit juice (small)
1509L Other juices VEGETABLE JUICES 932K Tomato juice in tins 932L Tomato juice in jars 1506L Tomato juice (small) 1508L Tomato juice (large)
90
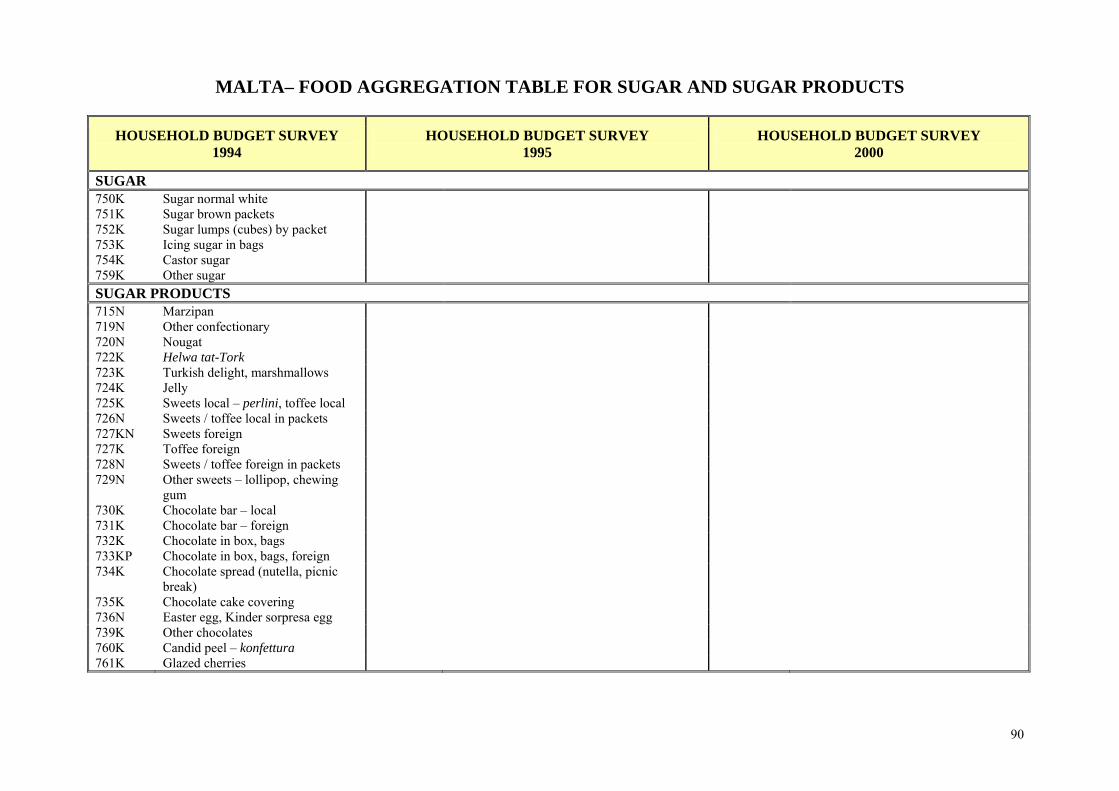
MALTA– FOOD AGGREGATION TABLE FOR SUGAR AND SUGAR PRODUCTS
HOUSEHOLD BUDGET SURVEY 1994
HOUSEHOLD BUDGET SURVEY 1995
HOUSEHOLD BUDGET SURVEY 2000
SUGAR 750K Sugar normal white 751K Sugar brown packets 752K Sugar lumps (cubes) by packet 753K Icing sugar in bags 754K Castor sugar 759K Other sugar SUGAR PRODUCTS 715N Marzipan 719N Other confectionary 720N Nougat 722K Helwa tat-Tork 723K Turkish delight, marshmallows 724K Jelly 725K Sweets local – perlini, toffee local 726N Sweets / toffee local in packets 727KN Sweets foreign 727K Toffee foreign 728N Sweets / toffee foreign in packets 729N Other sweets – lollipop, chewing
gum
730K Chocolate bar – local 731K Chocolate bar – foreign 732K Chocolate in box, bags 733KP Chocolate in box, bags, foreign 734K Chocolate spread (nutella, picnic
break)
735K Chocolate cake covering 736N Easter egg, Kinder sorpresa egg 739K Other chocolates 760K Candid peel – konfettura 761K Glazed cherries
91
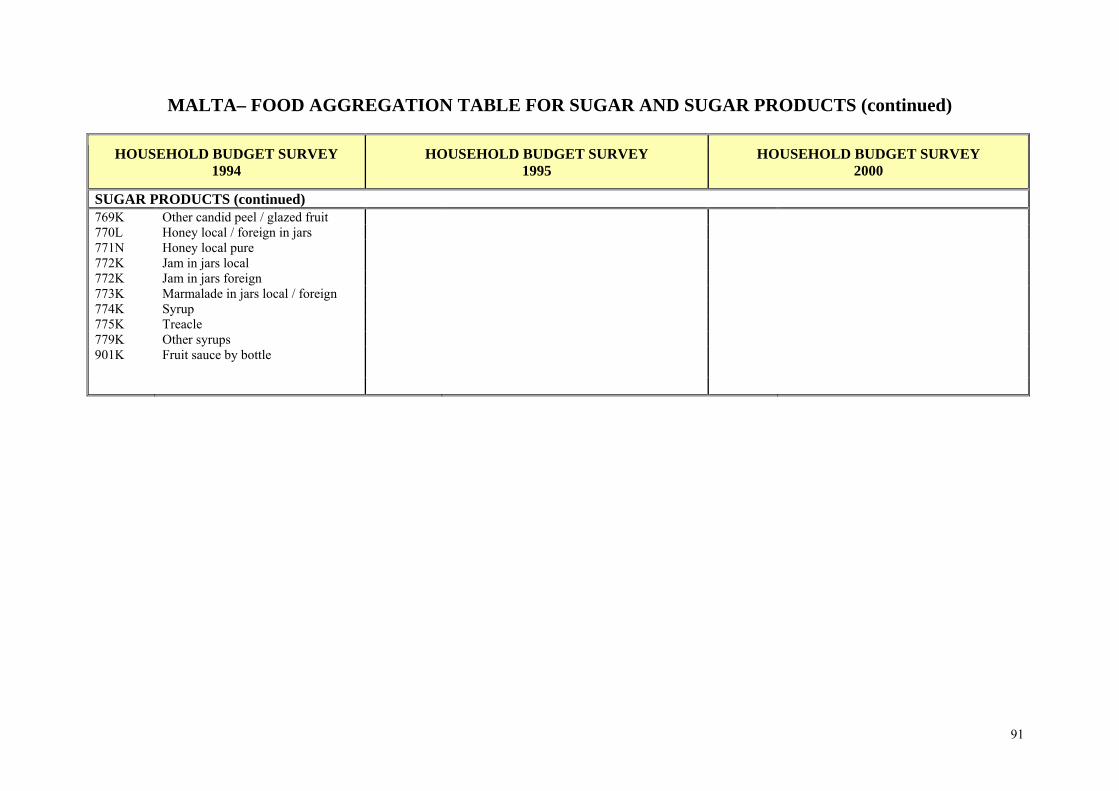
MALTA– FOOD AGGREGATION TABLE FOR SUGAR AND SUGAR PRODUCTS (continued)
HOUSEHOLD BUDGET SURVEY 1994
HOUSEHOLD BUDGET SURVEY 1995
HOUSEHOLD BUDGET SURVEY 2000
SUGAR PRODUCTS (continued) 769K Other candid peel / glazed fruit 770L Honey local / foreign in jars 771N Honey local pure 772K Jam in jars local 772K Jam in jars foreign 773K Marmalade in jars local / foreign 774K Syrup 775K Treacle 779K Other syrups 901K Fruit sauce by bottle
92
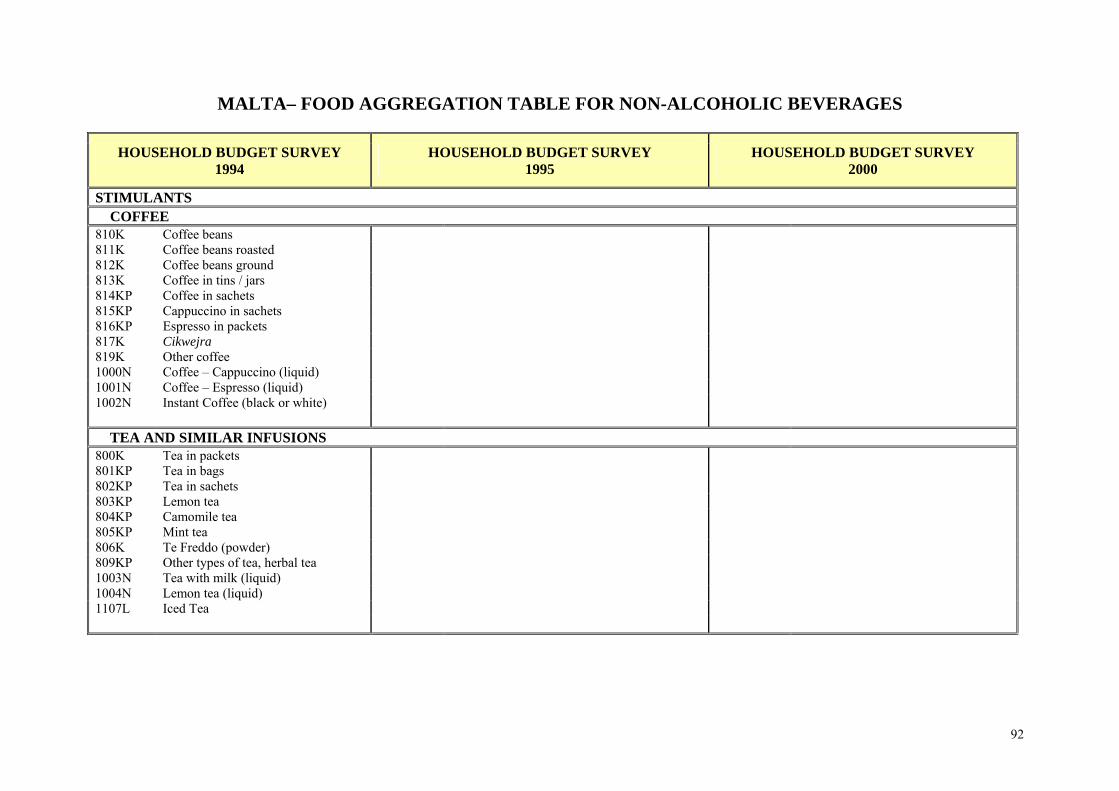
MALTA– FOOD AGGREGATION TABLE FOR NON-ALCOHOLIC BEVERAGES
HOUSEHOLD BUDGET SURVEY 1994
HOUSEHOLD BUDGET SURVEY 1995
HOUSEHOLD BUDGET SURVEY 2000
STIMULANTS COFFEE 810K Coffee beans 811K Coffee beans roasted 812K Coffee beans ground 813K Coffee in tins / jars 814KP Coffee in sachets 815KP Cappuccino in sachets 816KP Espresso in packets 817K Cikwejra 819K Other coffee 1000N Coffee – Cappuccino (liquid) 1001N Coffee – Espresso (liquid) 1002N Instant Coffee (black or white) TEA AND SIMILAR INFUSIONS 800K Tea in packets 801KP Tea in bags 802KP Tea in sachets 803KP Lemon tea 804KP Camomile tea 805KP Mint tea 806K Te Freddo (powder) 809KP Other types of tea, herbal tea 1003N Tea with milk (liquid) 1004N Lemon tea (liquid) 1107L Iced Tea
93
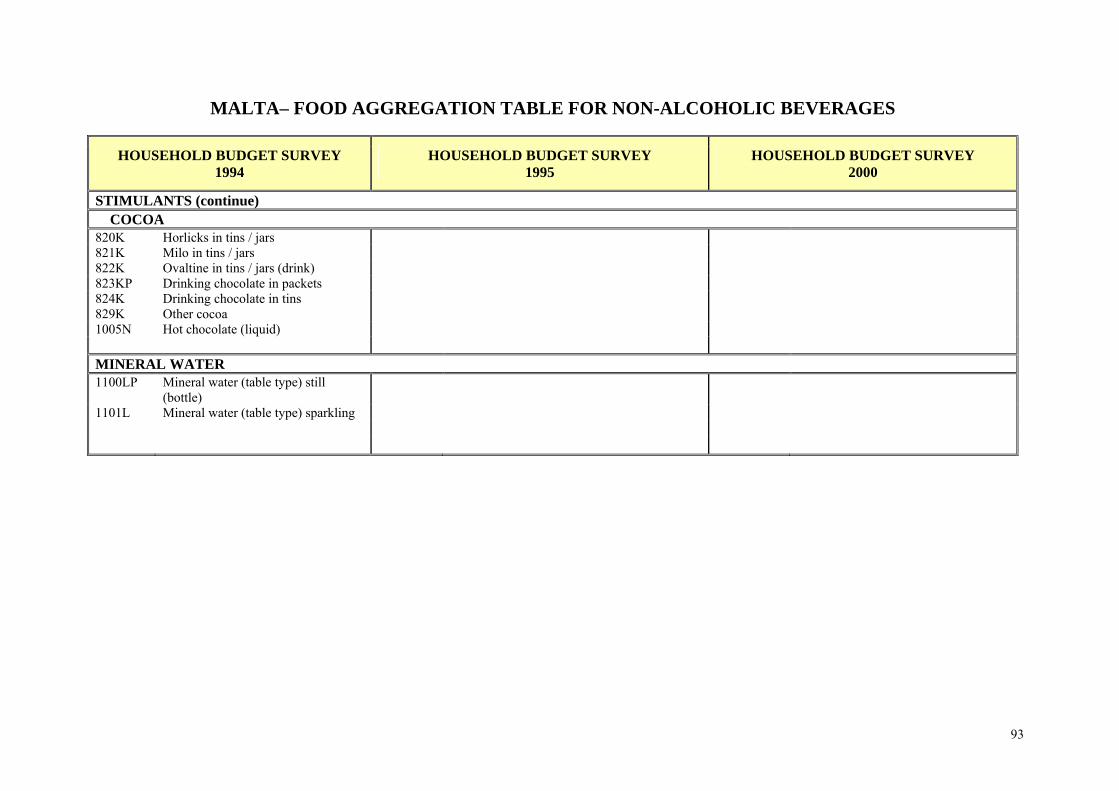
MALTA– FOOD AGGREGATION TABLE FOR NON-ALCOHOLIC BEVERAGES
HOUSEHOLD BUDGET SURVEY 1994
HOUSEHOLD BUDGET SURVEY 1995
HOUSEHOLD BUDGET SURVEY 2000
STIMULANTS (continue) COCOA 820K Horlicks in tins / jars 821K Milo in tins / jars 822K Ovaltine in tins / jars (drink) 823KP Drinking chocolate in packets 824K Drinking chocolate in tins 829K Other cocoa 1005N Hot chocolate (liquid) MINERAL WATER 1100LP Mineral water (table type) still
(bottle)
1101L Mineral water (table type) sparkling
94
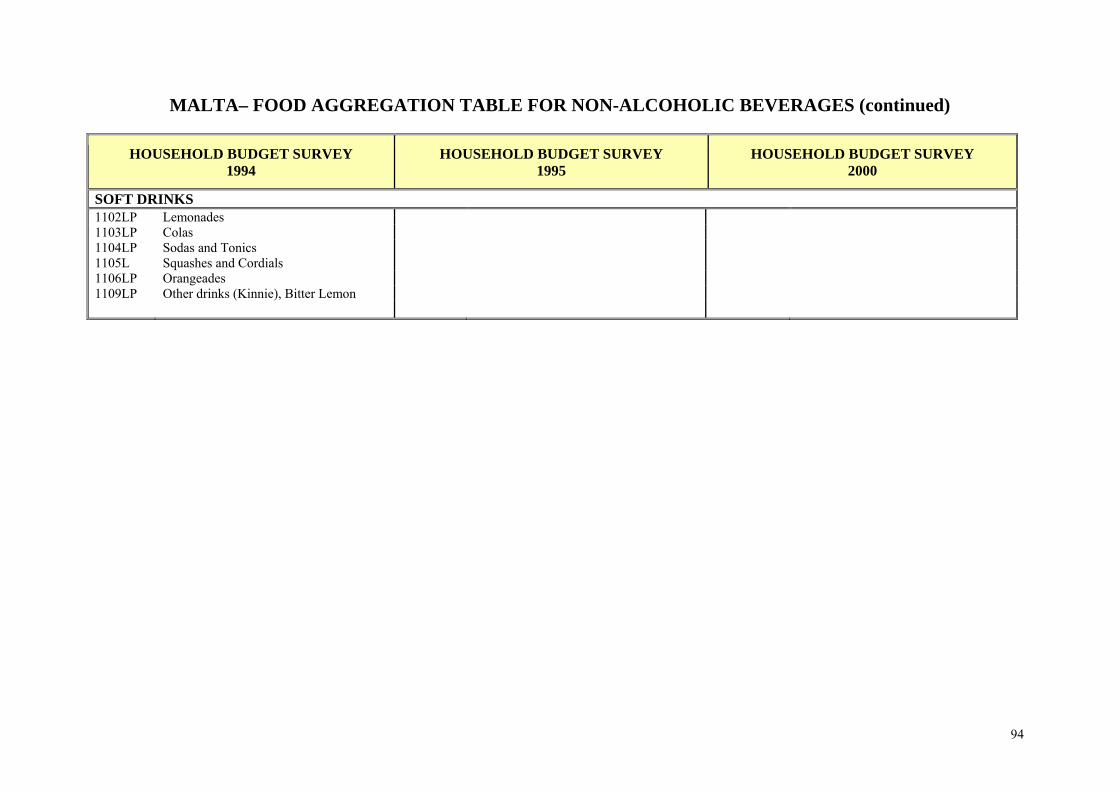
MALTA– FOOD AGGREGATION TABLE FOR NON-ALCOHOLIC BEVERAGES (continued)
HOUSEHOLD BUDGET SURVEY 1994
HOUSEHOLD BUDGET SURVEY 1995
HOUSEHOLD BUDGET SURVEY 2000
SOFT DRINKS 1102LP Lemonades 1103LP Colas 1104LP Sodas and Tonics 1105L Squashes and Cordials 1106LP Orangeades 1109LP Other drinks (Kinnie), Bitter Lemon
95
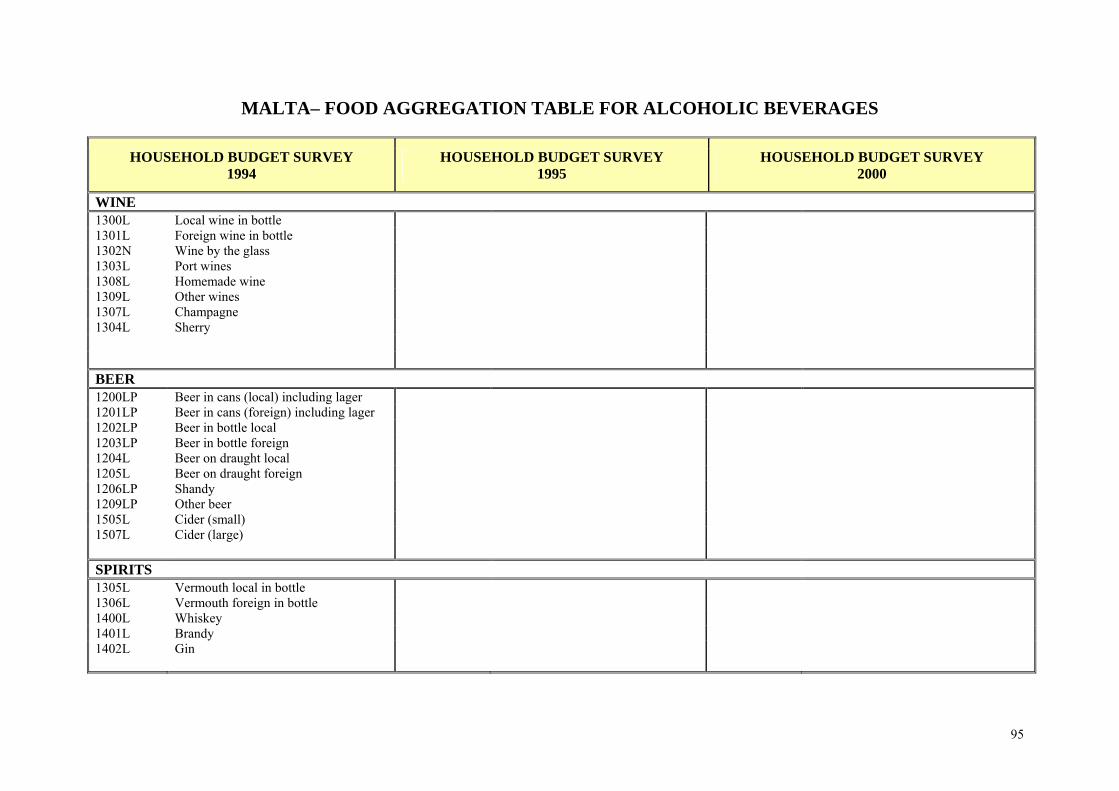
MALTA– FOOD AGGREGATION TABLE FOR ALCOHOLIC BEVERAGES
HOUSEHOLD BUDGET SURVEY 1994
HOUSEHOLD BUDGET SURVEY 1995
HOUSEHOLD BUDGET SURVEY 2000
WINE 1300L Local wine in bottle 1301L Foreign wine in bottle 1302N Wine by the glass 1303L Port wines 1308L Homemade wine 1309L Other wines 1307L Champagne 1304L Sherry BEER 1200LP Beer in cans (local) including lager 1201LP Beer in cans (foreign) including lager
1202LP Beer in bottle local
1203LP Beer in bottle foreign
1204L Beer on draught local
1205L Beer on draught foreign
1206LP Shandy
1209LP Other beer
1505L Cider (small) 1507L Cider (large) SPIRITS 1305L Vermouth local in bottle 1306L Vermouth foreign in bottle 1400L Whiskey 1401L Brandy 1402L Gin
96
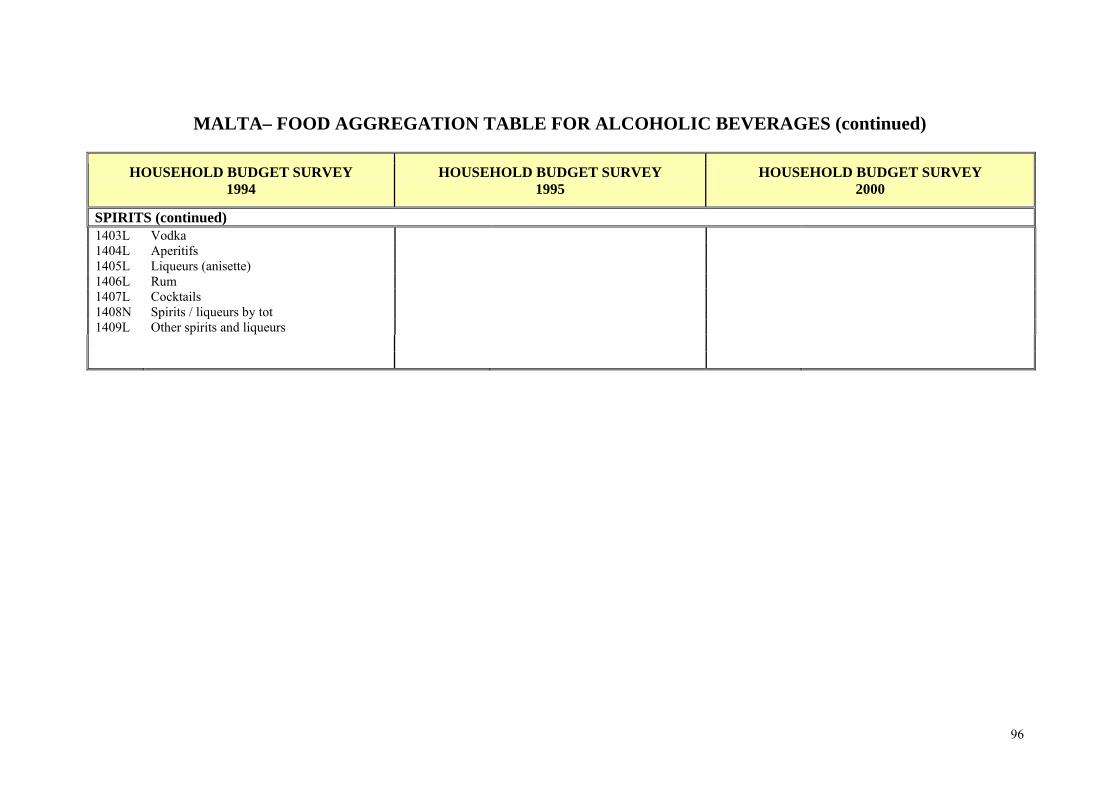
MALTA– FOOD AGGREGATION TABLE FOR ALCOHOLIC BEVERAGES (continued)
HOUSEHOLD BUDGET SURVEY 1994
HOUSEHOLD BUDGET SURVEY 1995
HOUSEHOLD BUDGET SURVEY 2000
SPIRITS (continued) 1403L Vodka 1404L Aperitifs 1405L Liqueurs (anisette) 1406L Rum 1407L Cocktails 1408N Spirits / liqueurs by tot 1409L Other spirits and liqueurs
97
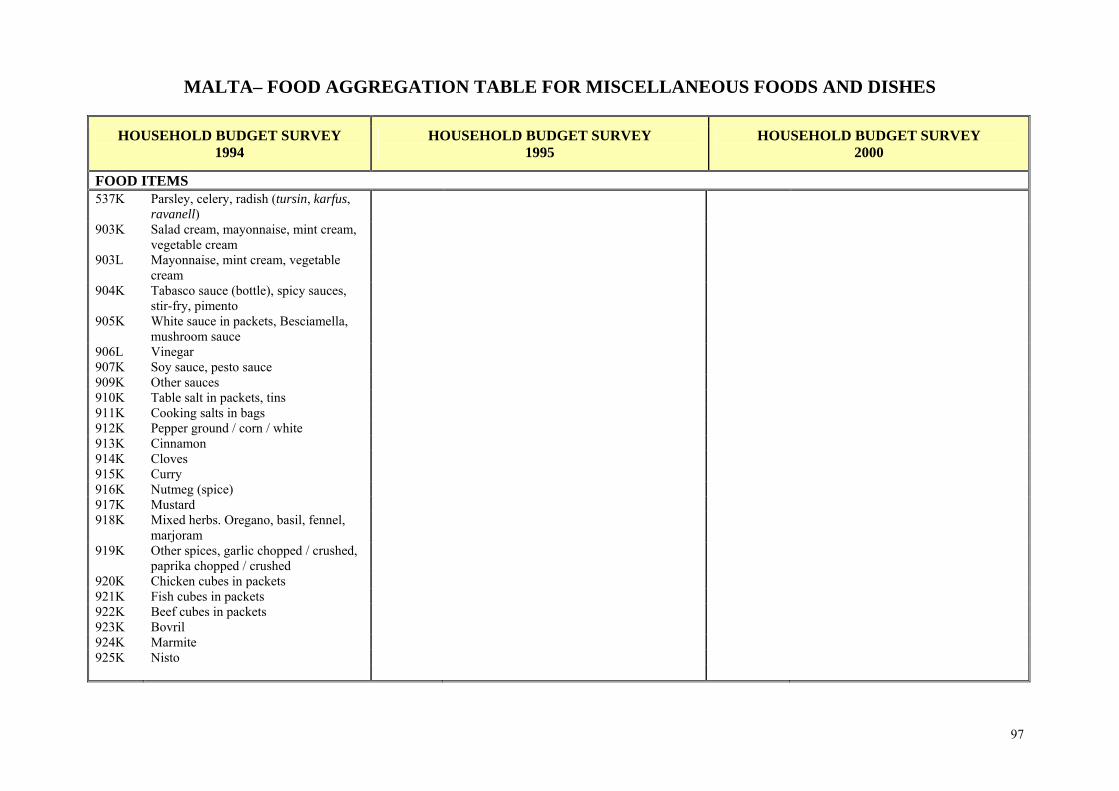
MALTA– FOOD AGGREGATION TABLE FOR MISCELLANEOUS FOODS AND DISHES
HOUSEHOLD BUDGET SURVEY 1994
HOUSEHOLD BUDGET SURVEY 1995
HOUSEHOLD BUDGET SURVEY 2000
FOOD ITEMS 537K Parsley, celery, radish (tursin, karfus,
ravanell)
903K Salad cream, mayonnaise, mint cream, vegetable cream
903L Mayonnaise, mint cream, vegetable cream
904K Tabasco sauce (bottle), spicy sauces, stir-fry, pimento
905K White sauce in packets, Besciamella, mushroom sauce
906L Vinegar 907K Soy sauce, pesto sauce 909K Other sauces 910K Table salt in packets, tins 911K Cooking salts in bags 912K Pepper ground / corn / white 913K Cinnamon 914K Cloves 915K Curry 916K Nutmeg (spice) 917K Mustard 918K Mixed herbs. Oregano, basil, fennel,
marjoram
919K Other spices, garlic chopped / crushed, paprika chopped / crushed
920K Chicken cubes in packets 921K Fish cubes in packets 922K Beef cubes in packets 923K Bovril 924K Marmite 925K Nisto
98
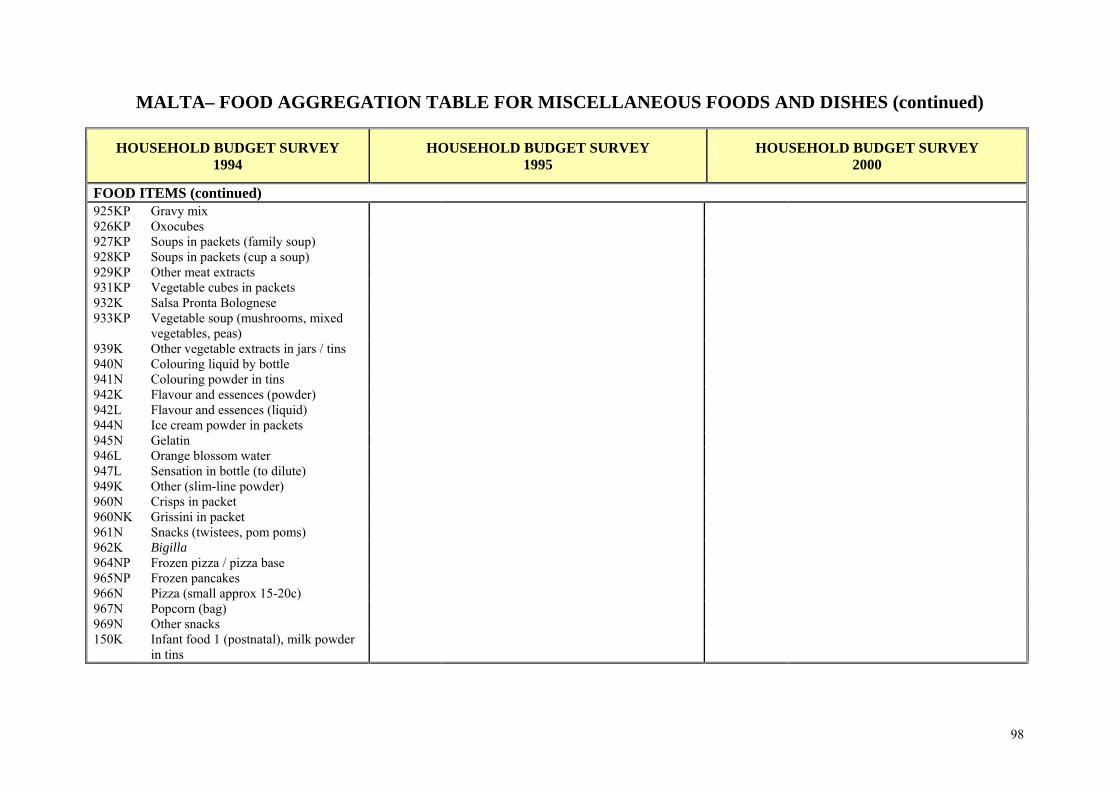
MALTA– FOOD AGGREGATION TABLE FOR MISCELLANEOUS FOODS AND DISHES (continued)
HOUSEHOLD BUDGET SURVEY 1994
HOUSEHOLD BUDGET SURVEY 1995
HOUSEHOLD BUDGET SURVEY 2000
FOOD ITEMS (continued) 925KP Gravy mix 926KP Oxocubes 927KP Soups in packets (family soup) 928KP Soups in packets (cup a soup) 929KP Other meat extracts 931KP Vegetable cubes in packets 932K Salsa Pronta Bolognese 933KP Vegetable soup (mushrooms, mixed
vegetables, peas)
939K Other vegetable extracts in jars / tins 940N Colouring liquid by bottle 941N Colouring powder in tins 942K Flavour and essences (powder) 942L Flavour and essences (liquid) 944N Ice cream powder in packets 945N Gelatin 946L Orange blossom water 947L Sensation in bottle (to dilute) 949K Other (slim-line powder) 960N Crisps in packet 960NK Grissini in packet 961N Snacks (twistees, pom poms) 962K Bigilla 964NP Frozen pizza / pizza base 965NP Frozen pancakes 966N Pizza (small approx 15-20c) 967N Popcorn (bag) 969N Other snacks 150K Infant food 1 (postnatal), milk powder
in tins
99
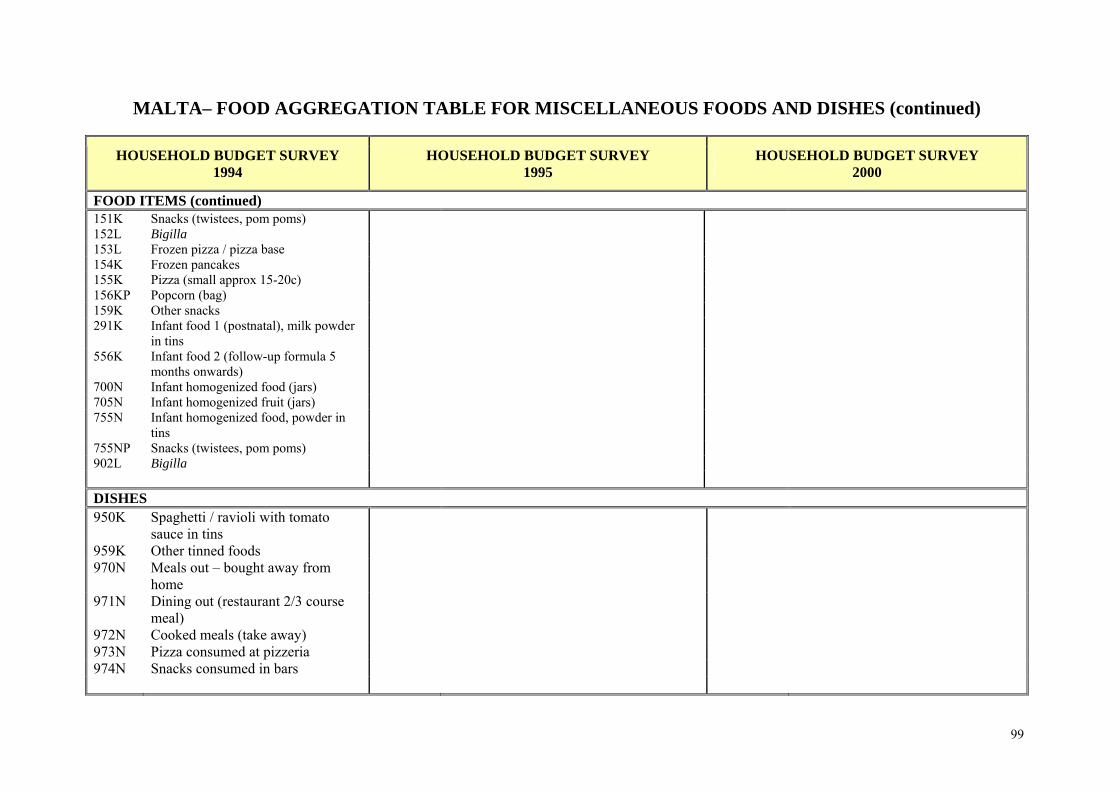
MALTA– FOOD AGGREGATION TABLE FOR MISCELLANEOUS FOODS AND DISHES (continued)
HOUSEHOLD BUDGET SURVEY 1994
HOUSEHOLD BUDGET SURVEY 1995
HOUSEHOLD BUDGET SURVEY 2000
FOOD ITEMS (continued) 151K Snacks (twistees, pom poms) 152L Bigilla 153L Frozen pizza / pizza base 154K Frozen pancakes 155K Pizza (small approx 15-20c) 156KP Popcorn (bag) 159K Other snacks 291K Infant food 1 (postnatal), milk powder
in tins
556K Infant food 2 (follow-up formula 5 months onwards)
700N Infant homogenized food (jars) 705N Infant homogenized fruit (jars) 755N Infant homogenized food, powder in
tins
755NP Snacks (twistees, pom poms) 902L Bigilla DISHES 950K Spaghetti / ravioli with tomato
sauce in tins
959K Other tinned foods 970N Meals out – bought away from
home
971N Dining out (restaurant 2/3 course meal)
972N Cooked meals (take away) 973N Pizza consumed at pizzeria 974N Snacks consumed in bars
100
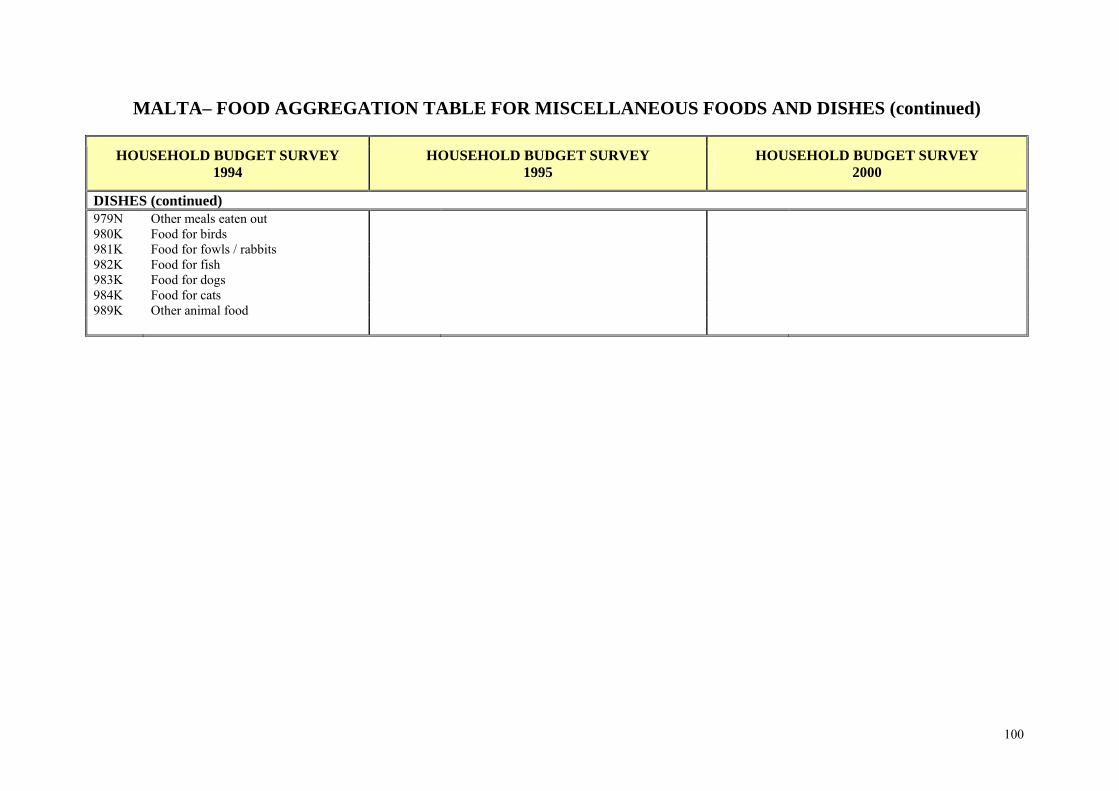
MALTA– FOOD AGGREGATION TABLE FOR MISCELLANEOUS FOODS AND DISHES (continued)
HOUSEHOLD BUDGET SURVEY 1994
HOUSEHOLD BUDGET SURVEY 1995
HOUSEHOLD BUDGET SURVEY 2000
DISHES (continued) 979N Other meals eaten out 980K Food for birds 981K Food for fowls / rabbits 982K Food for fish 983K Food for dogs 984K Food for cats 989K Other animal food
101
HARMONIZATION OF SOCIO-DEMOGRAPHIC DATA
102
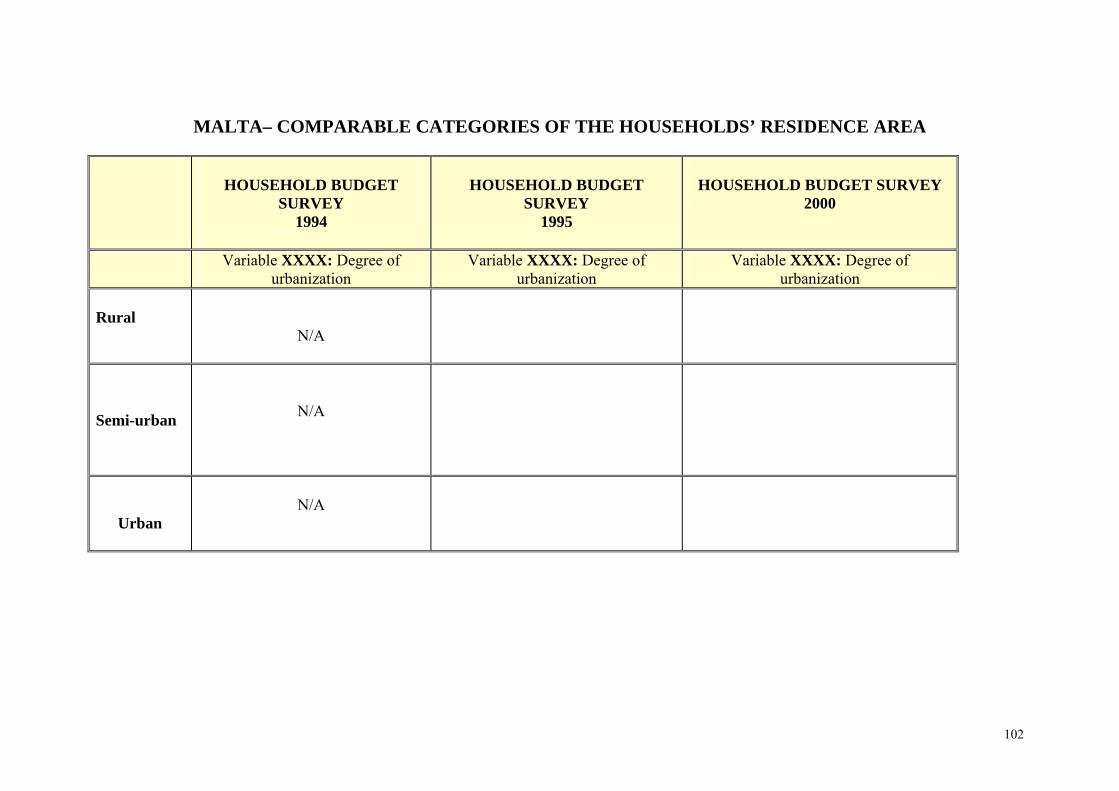
MALTA– COMPARABLE CATEGORIES OF THE HOUSEHOLDS’ RESIDENCE AREA
HOUSEHOLD BUDGET SURVEY
1994
HOUSEHOLD BUDGET
SURVEY 1995
HOUSEHOLD BUDGET SURVEY
2000
Variable XXXX: Degree of urbanization
Variable XXXX: Degree of urbanization
Variable XXXX: Degree of urbanization
Rural
N/A
Semi-urban
N/A
Urban
N/A
103
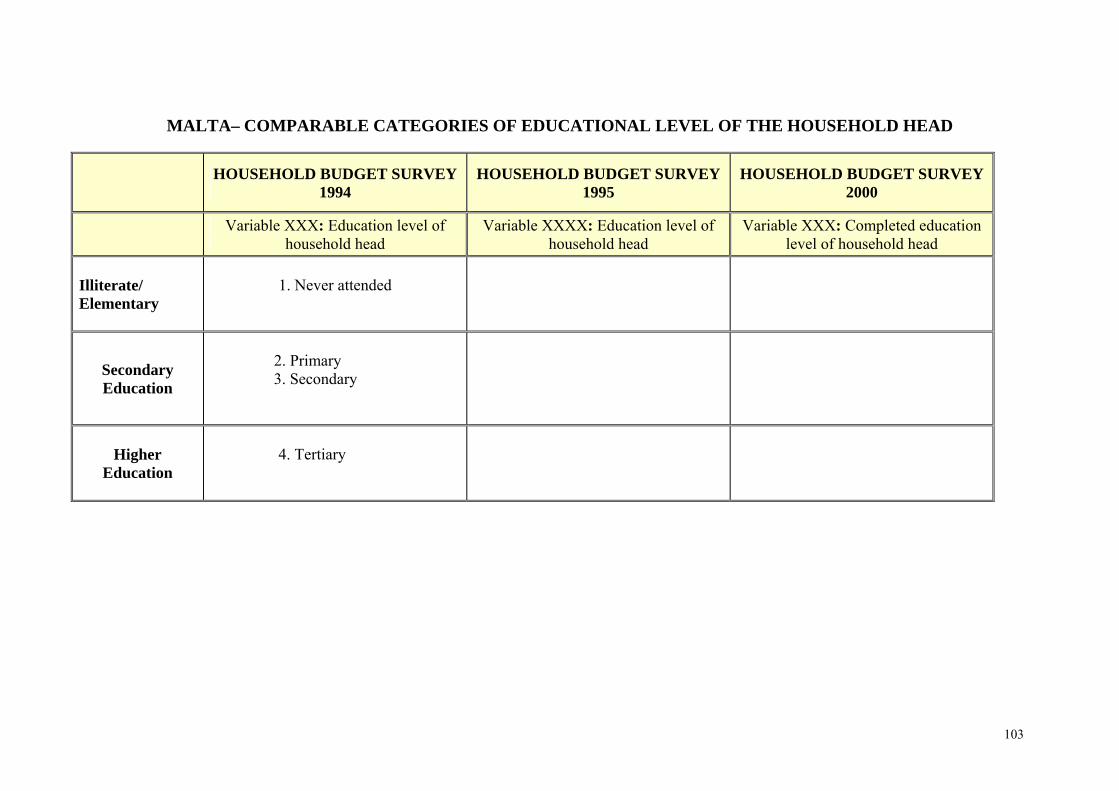
MALTA– COMPARABLE CATEGORIES OF EDUCATIONAL LEVEL OF THE HOUSEHOLD HEAD
HOUSEHOLD BUDGET SURVEY 1994
HOUSEHOLD BUDGET SURVEY 1995
HOUSEHOLD BUDGET SURVEY 2000
Variable XXX: Education level of household head
Variable XXXX: Education level of household head
Variable XXX: Completed education level of household head
Illiterate/ Elementary
1. Never attended
Secondary Education
2. Primary
3. Secondary
Higher Education
4. Tertiary
104
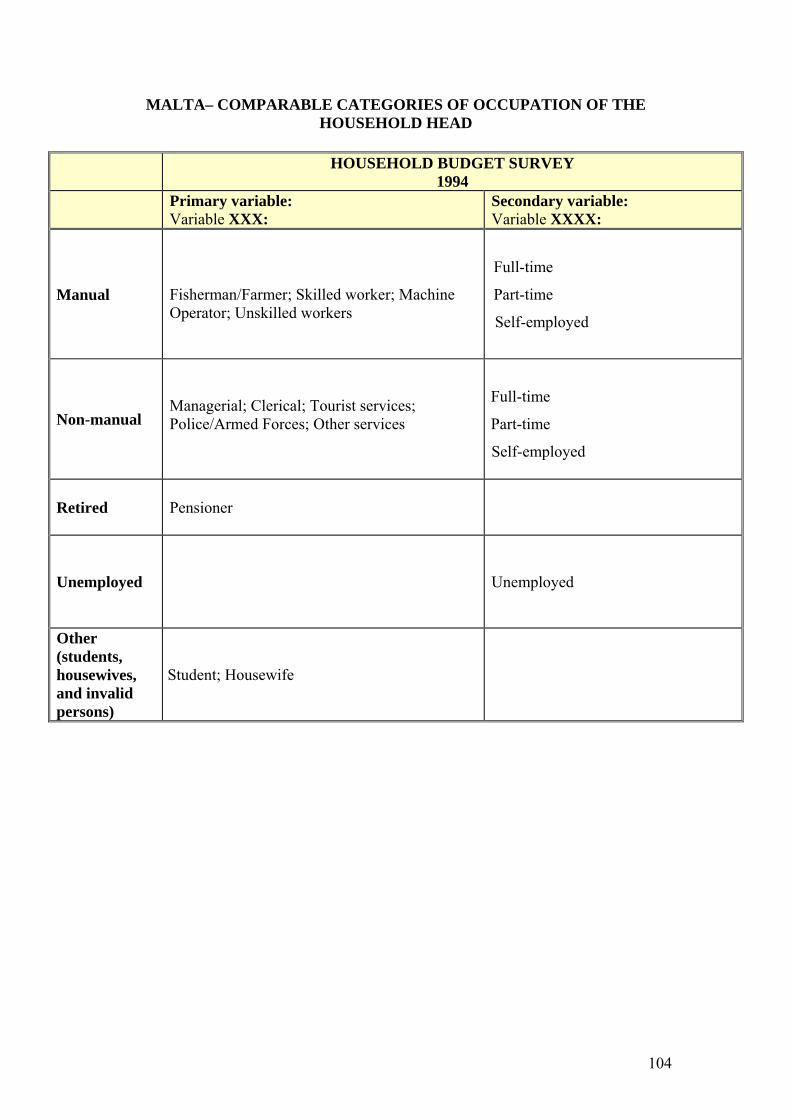
MALTA– COMPARABLE CATEGORIES OF OCCUPATION OF THE HOUSEHOLD HEAD
HOUSEHOLD BUDGET SURVEY
1994 Primary variable:
Variable XXX: Secondary variable: Variable XXXX:
Manual
Fisherman/Farmer; Skilled worker; Machine Operator; Unskilled workers
Full-time
Part-time
Self-employed
Non-manual
Managerial; Clerical; Tourist services; Police/Armed Forces; Other services
Full-time
Part-time
Self-employed
Retired Pensioner
Unemployed
Unemployed
Other (students, housewives, and invalid persons)
Student; Housewife
105
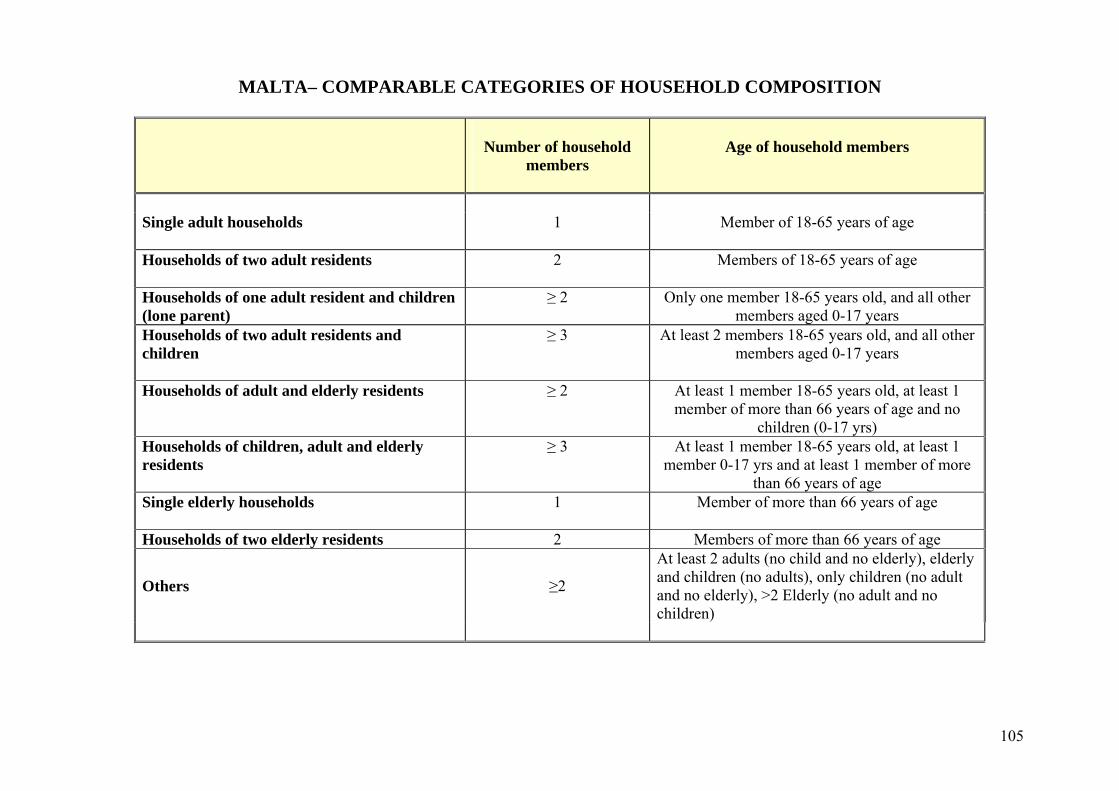
MALTA– COMPARABLE CATEGORIES OF HOUSEHOLD COMPOSITION
Number of household
members
Age of household members
Single adult households
1 Member of 18-65 years of age
Households of two adult residents
2 Members of 18-65 years of age
Households of one adult resident and children (lone parent)
≥ 2 Only one member 18-65 years old, and all other members aged 0-17 years
Households of two adult residents and children
≥ 3 At least 2 members 18-65 years old, and all other members aged 0-17 years
Households of adult and elderly residents
≥ 2 At least 1 member 18-65 years old, at least 1 member of more than 66 years of age and no
children (0-17 yrs) Households of children, adult and elderly residents
≥ 3 At least 1 member 18-65 years old, at least 1 member 0-17 yrs and at least 1 member of more
than 66 years of age Single elderly households
1 Member of more than 66 years of age
Households of two elderly residents 2 Members of more than 66 years of age
Others ≥2
At least 2 adults (no child and no elderly), elderly and children (no adults), only children (no adult and no elderly), >2 Elderly (no adult and no children)

This report was produced by a contractor for Health & Consumer Protection Directorate General and represents the views of thecontractor or author. These views have not been adopted or in any way approved by the Commission and do not necessarilyrepresent the view of the Commission or the Directorate General for Health and Consumer Protection. The EuropeanCommission does not guarantee the accuracy of the data included in this study, nor does it accept responsibility for any use madethereof.