appendix i compilation of reports describing … of the pacific, stockton, ca. stringfellow, w.t.,...
TRANSCRIPT
Appendix I
Compilation of Reports Describing Temporal Trends in Water Quality Data in the Upstream San
Joaquin River
Remie Burks1
Chelsea Spier1
Sharon Borglin1
Randy Dahlgren2
Jeremy Hanlon1
Justin Graham1
William Stringfellow1
February 2008
Environmental Engineering Research Program School of Engineering & Computer Sciences
University of the Pacific 3601 Pacific Ave, Sears Hall
Stockton, CA 95211
Department of Land, Air, and Water Resources University of California, Davis
Davis, CA
Appendix I Page 1 of 1262 687
Temporal Plots of 2005-2007 Total Phosphorus Data from the Upstream San Joaquin River
Chelsea Spier1
Remie Burks1
Sharon Borglin1
Randy Dahlgren2
Jeremy Hanlon1
Justin Graham1
William Stringfellow1
February 2008
1Environmental Engineering Research Program School of Engineering & Computer Sciences
University of the Pacific, 3601 Pacific Avenue, Sears Hall
Stockton, CA 95211 2UC Davis, Davis, CA
Appendix I Page 3 of 1262 688
1 of 40
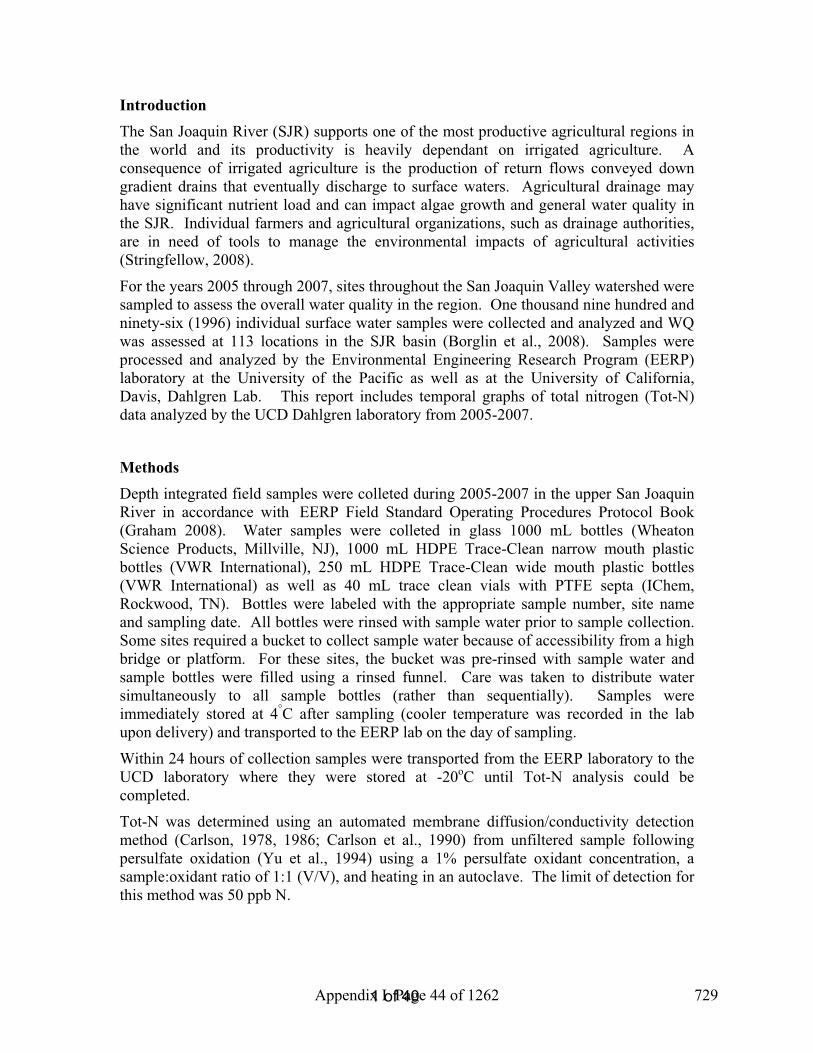
Introduction The San Joaquin River (SJR) supports one of the most productive agricultural regions in the world and its productivity is heavily dependant on irrigated agriculture. A consequence of irrigated agriculture is the production of return flows conveyed down gradient drains that eventually discharge to surface waters. Agricultural drainage may have significant nutrient load and can impact algae growth and general water quality in the SJR. Individual farmers and agricultural organizations, such as drainage authorities, are in need of tools to manage the environmental impacts of agricultural activities (Stringfellow, 2008).
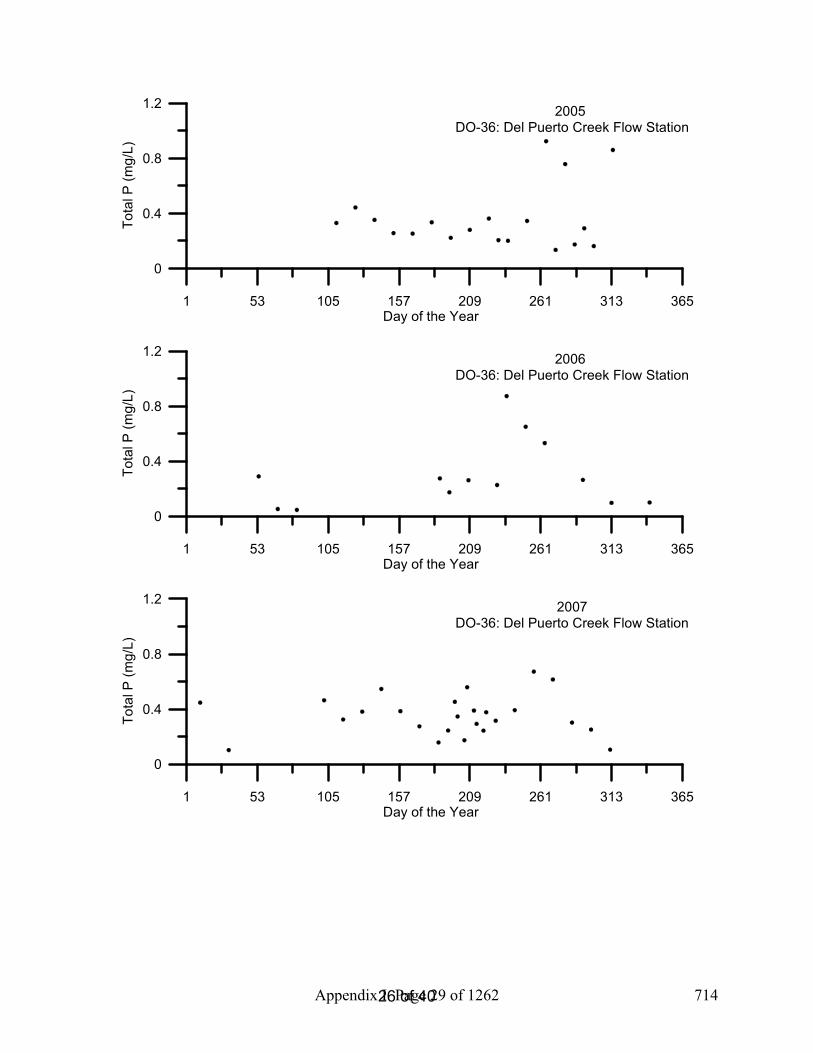
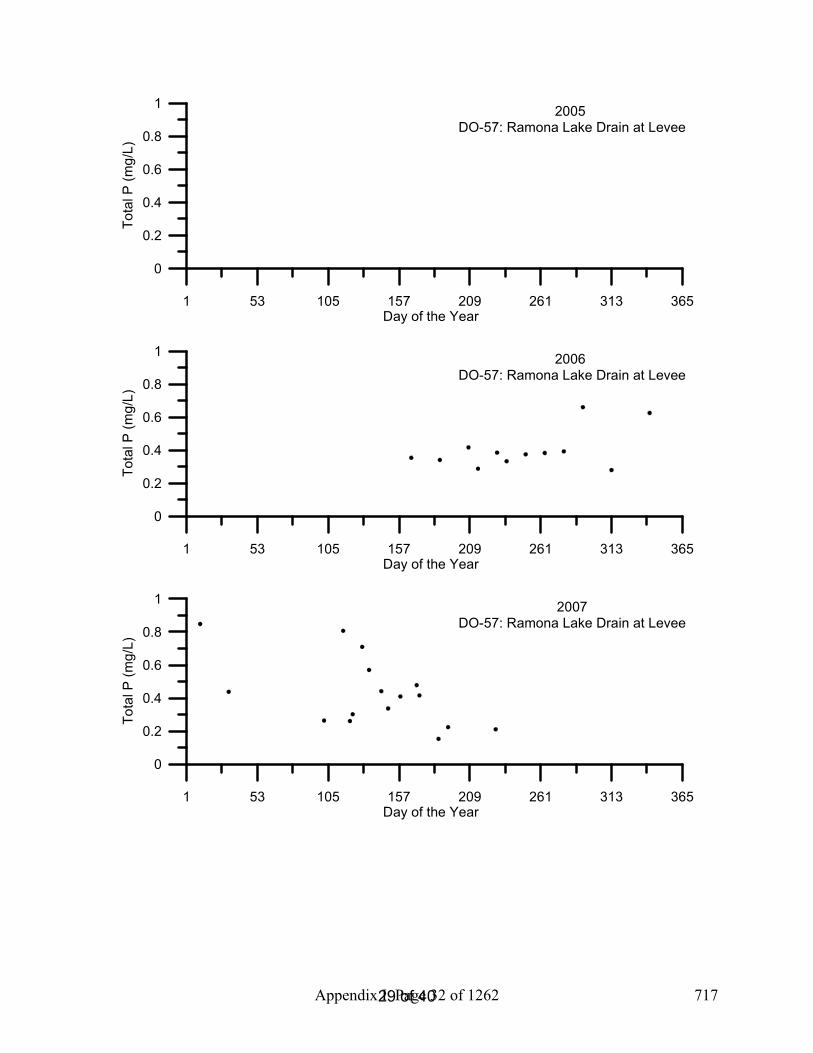
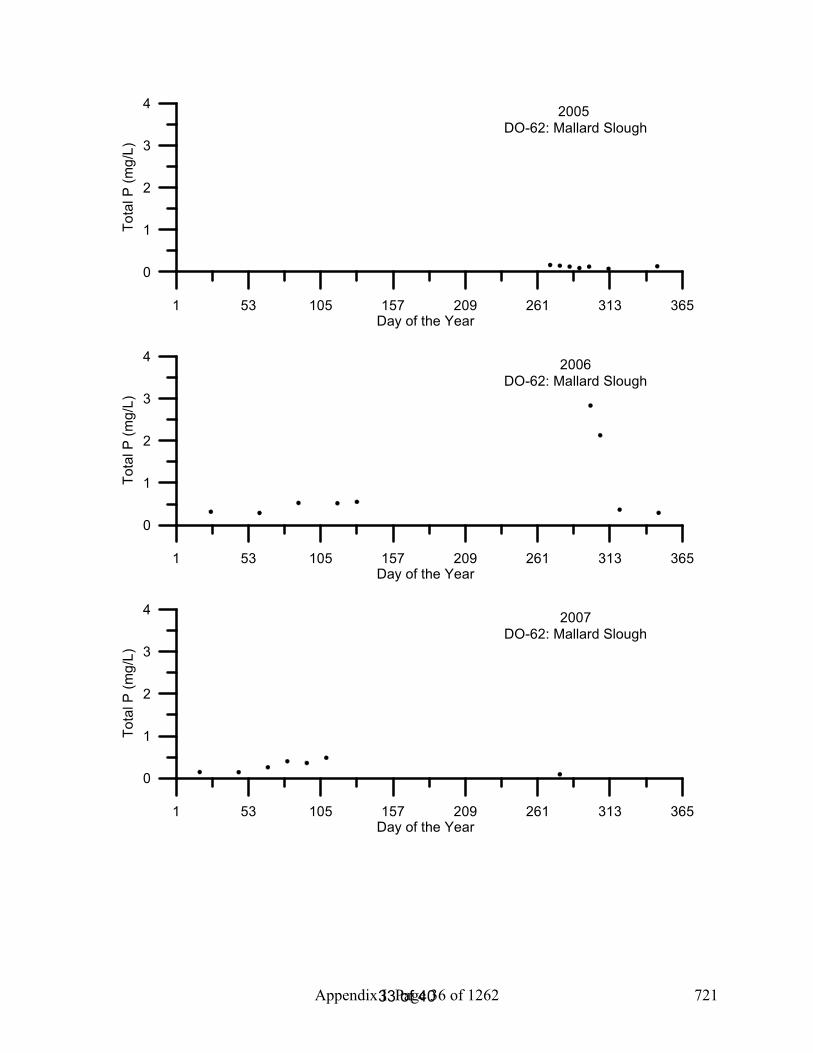
For the years 2005 through 2007, sites throughout the San Joaquin Valley watershed were sampled to assess the overall water quality in the region. One thousand nine hundred and ninety-six (1996) individual surface water samples were collected and analyzed and WQ was assessed at 113 locations in the SJR basin (Borglin et al., 2008). Samples were processed and analyzed by the Environmental Engineering Research Program (EERP) laboratory at the University of the Pacific as well as at the University of California, Davis, Dahlgren Lab. This report includes temporal graphs of total phosphorus (Tot-P) data analyzed by the UCD Dahlgren laboratory from 2005-2007.
MethodsDepth integrated field samples were colleted during 2005-2007 in the upper San Joaquin River in accordance with EERP Field Standard Operating Procedures Protocol Book (Graham 2008). Water samples were colleted in glass 1000 mL bottles (Wheaton Science Products, Millville, NJ), 1000 mL HDPE Trace-Clean narrow mouth plastic bottles (VWR International), 250 mL HDPE Trace-Clean wide mouth plastic bottles (VWR International) as well as 40 mL trace clean vials with PTFE septa (IChem, Rockwood, TN). Bottles were labeled with the appropriate sample number, site name and sampling date. All bottles were rinsed with sample water prior to sample collection. Some sites required a bucket to collect sample water because of accessibility from a high bridge or platform. For these sites, the bucket was pre-rinsed with sample water and sample bottles were filled using a rinsed funnel. Care was taken to distribute water simultaneously to all sample bottles (rather than sequentially). Samples were immediately stored at 4°C after sampling (cooler temperature was recorded in the lab upon delivery) and transported to the EERP lab on the day of sampling.
Within 24 hours of collection samples were transported from the EERP laboratory to the UCD laboratory were they were stored at -20°C until the analysis could be completed.
Tot-P was analyzed on unfiltered samples using the stannous chloride method after digestion using the SM 4500-P.D (APHA,2005). To digest, 5.0 mL of each sample was aliquotted into trace clean, 5.0 mL digestion reagent was added (10 g potassium persulfate, 6 g boric acid, and 3 g NaOH in 1000mL Millipore water) was added and then was autoclaved for 1 hour. After cooling, Tot-P was determined using the stannous chloride method.
Appendix I Page 4 of 1262 689
2 of 40
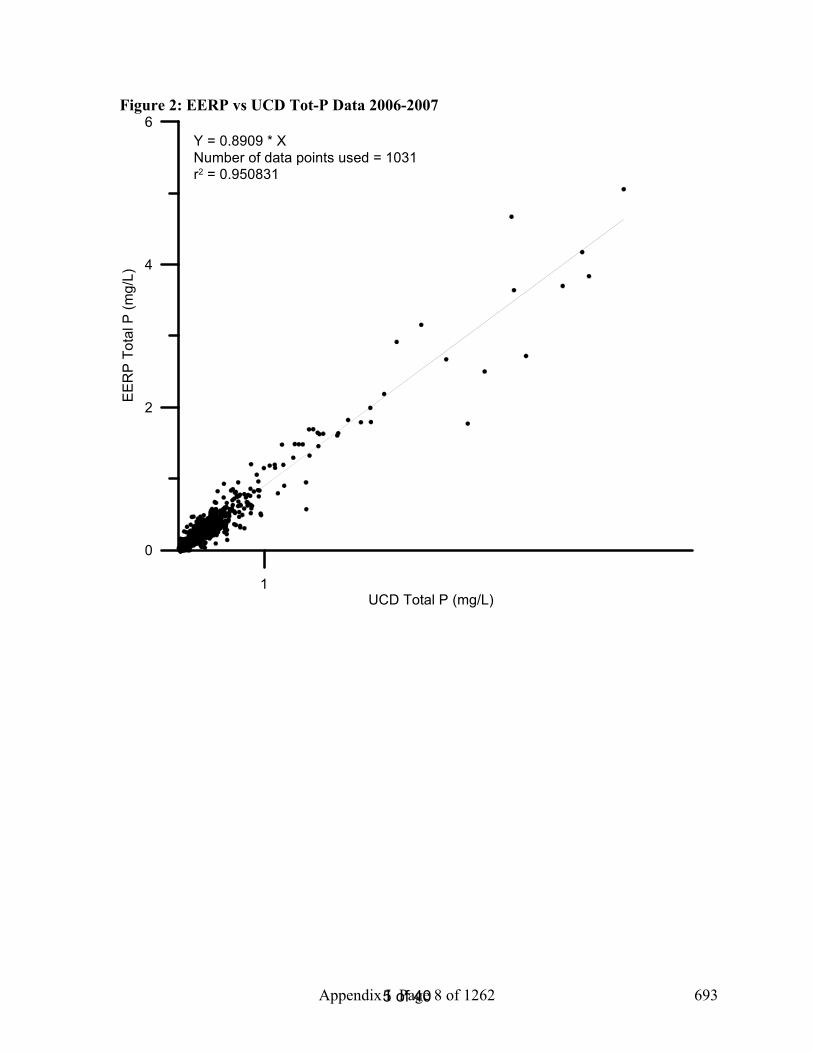
Results/DiscussionWith each set of Tot-P field samples analyzed in the UCD laboratory, quality assurance samples including a a field duplicate, a trip blank, and lab blanks were also analyzed. Between 2005 and 2007, 95.0% of all quality assurance samples were within a passing range (Borglin et al, 2008). Proficiency check samples, standards with unknown concentration to the laboratory analyst, were run approximately twice a year. Four proficiency check samples were analyzed for Tot-P in the UCD laboratory during 2005-2007, and all of these samples were found to be within the acceptable range. Samples were measured ranging from 0.01-6.34 mg/L Tot-P. The average concentration of Tot-P in water samples collected was 0.33 mg/L Tot-P. Tot-P was also analyzed by the EERP laboratory on all of the same water samples starting in late 2006 and has a high correlation to values measured by EERP. When all data points measured by the two labs are compared they have r2=0.951, and both labs have similar recovery rates. EERP measured 89.1% of Tot-P as UCD (Figure 2).
These temporal plots (Figures 3-104) as well as plotting EERP data against UCD’s data (Figure 2) created an easy visual way to find outliers and double check data entry for possible mistakes.
References American Public Health Association (APHA). 2005. Standard Methods for the Examination of
Water and Wastewater, 21st Edition. American Public Health Association, Washington, DC.
Borglin, S., W. Stringfellow, J. Hanlon. 2005. Standard Operating Procedures for the Up-Stream Dissolved Oxygen TMDL Project. LBNL/Pub-937.
Borglin, S., Burks, R., Hanlon, J., Graham, J., Spier, C., Stringfellow, W., and Dahlgren, R., (2008) Methods overview, quality assurance, and quality control, University of the Pacific, Stockton, CA
Graham, J., Hanlon, J.S., Stringfellow, W.T., (2008) EERP Field Protocol Book, University of the Pacific, Stockton, CA.
Stringfellow, W.T., et al., (2008) Evaluation of Vegitated Ditches, Ponds, and Wetlands as BMPs for Mitigating the Water Quality Impact of Irrigated Agriculture in the San Joaquin Valley, University of the Pacific, Stockton, CA
YSI Environmental Operations Manual (2005) 6-Series Environmental Monitoring Systems, Yellow Springs, OH.
Appendix I Page 5 of 1262 690

3 of 40
Table 1: EERP Sampling Site List DO Number
Site Name Type
4 SJR at Mossdale Core sites 5 SJR at Vernalis-McCune Station (River Club) Core sites, BMP 6 SJR at Maze Core sites, BMP 7 SJR at Patterson Core sites, BMP 8 SJR at Crows Landing Core sites, BMP
10 SJR at Lander Avenue Core sites 12 Stanislaus River at Caswell Park Core sites 14 Tuolumne River at Shiloh Bridge Core sites 16 Merced River at River Road Core sites 18 Mud Slough near Gustine Core sites, Wetland 19 Salt Slough at Lander Avenue Core sites, Wetland 20 Los Banos Creek Flow Station Core sites, Wetland 21 Orestimba Creek at River Road Core sites, BMP 23 Modesto ID Lateral 5 to Tuolumne Core sites 25 Modesto ID Main Drain to Stan. R. via Miller Lake Core sites 28 Turlock ID Westport Drain Flow station Core sites 29 Turlock ID Harding Drain Core sites 30 Turlock ID Lateral 6 & 7 at Levee Core sites 33 Hospital Creek Intermittent, BMP 34 Ingram Creek Core sites, BMP 36 Del Puerto Creek Flow Station Core sites, BMP 44 San Luis Drain End Core sites 53 Salt Slough at Wolfsen Road Wetland 57 Ramona Lake Drain Core sites, BMP 59 SJR Laird Park Core sites 60 Moffit 1 South Wetland 61 Deadman's Slough Wetland 62 Mallard Slough Wetland 63 Inlet C Canal Wetland 80 South Marsh-1-Inlet Wetland 81 South Marsh-1-Outlet Wetland 82 South Marsh-3-Inlet Wetland 83 South Marsh-3-Outlet Wetland 95 Ramona drain at Ramona Lake BMP, Intermittent
Appendix I Page 6 of 1262 691

4 of 40
Figure 1: EERP Sampling Site Map of SJR Watershed and Tributaries
Appendix I Page 7 of 1262 692
5 of 40
Figure 2: EERP vs UCD Tot-P Data 2006-2007
1UCD Total P (mg/L)
0
2
4
6E
ER
P T
otal
P (m
g/L)
Y = 0.8909 * XNumber of data points used = 1031r2 = 0.950831
Appendix I Page 8 of 1262 693

6 of 40
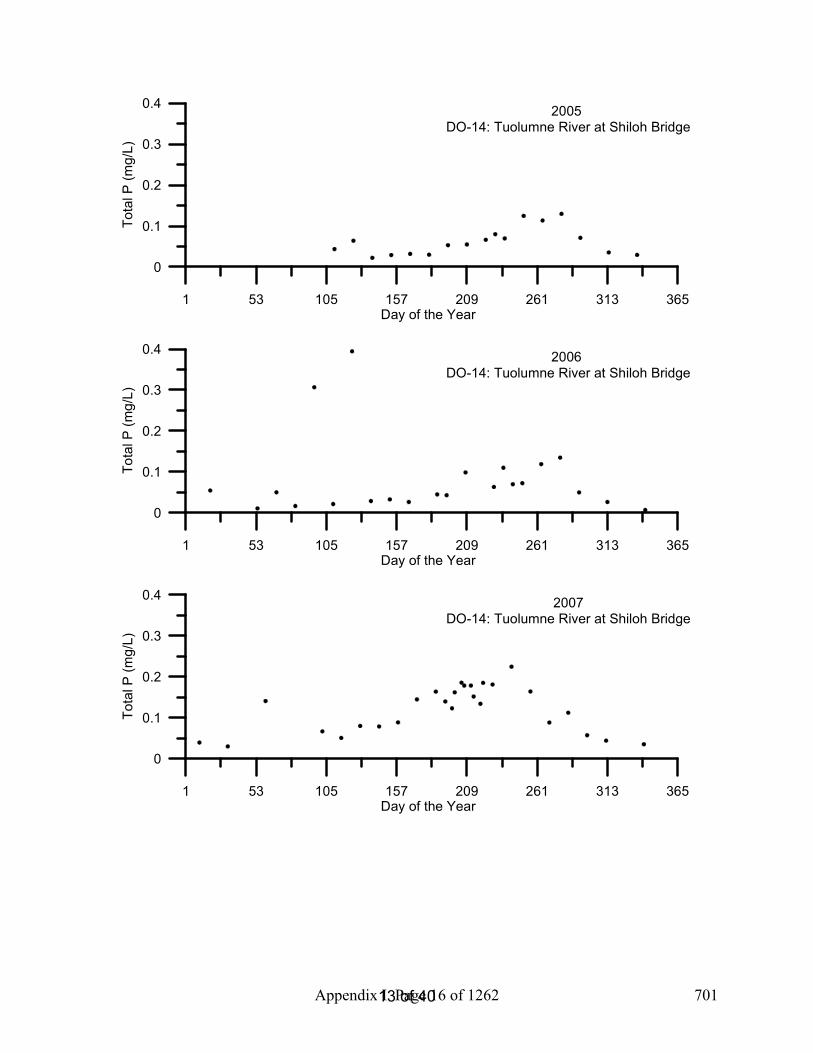
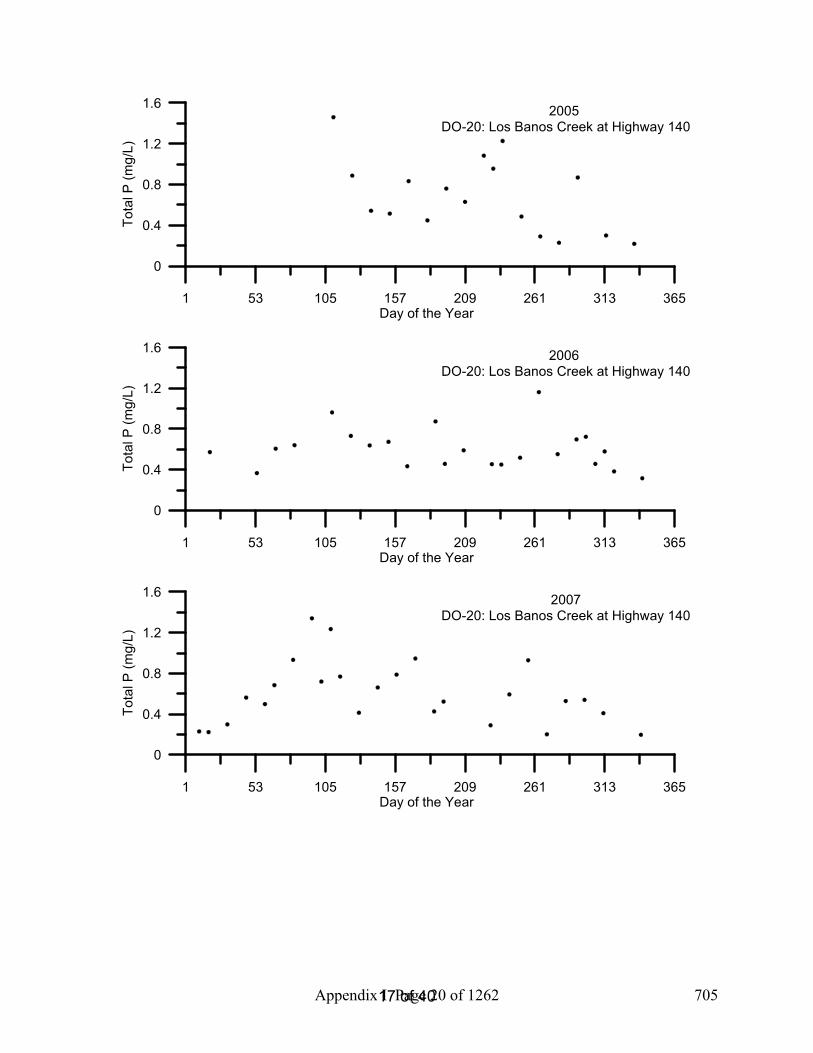
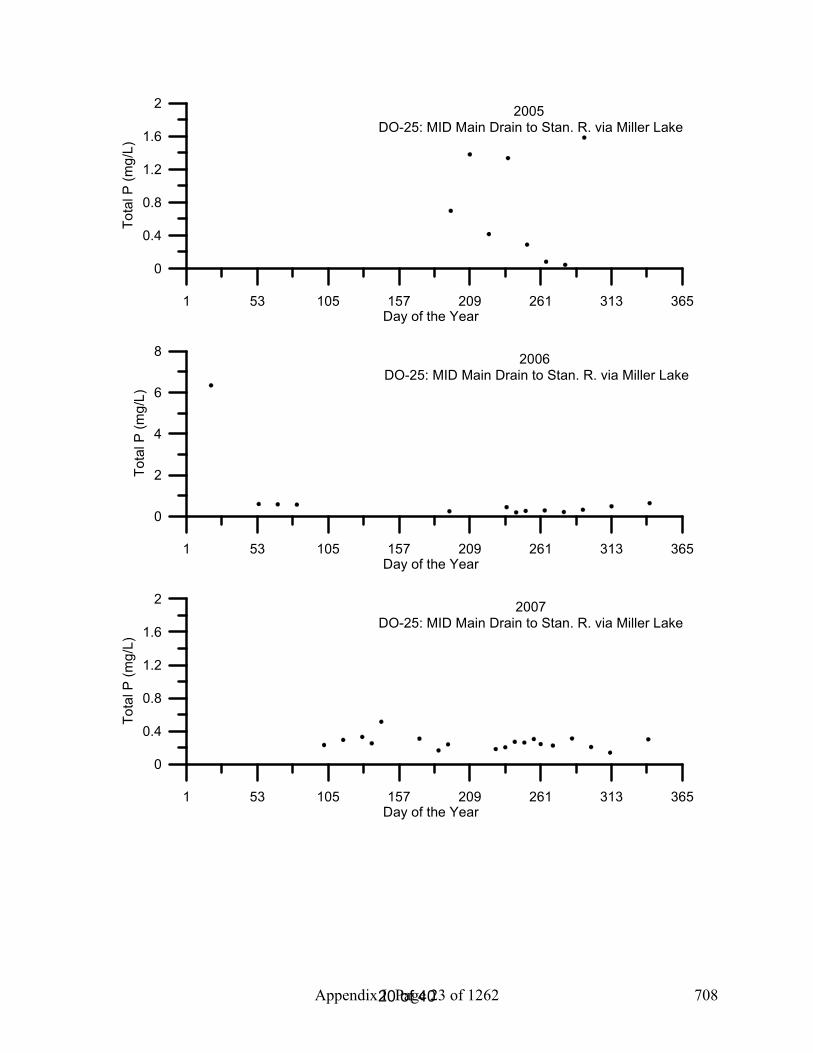
Figures 3 -104: Temporal Plots of Tot-P By Site ID
1 53 105 157 209 261 313 365Day of the Year
0
0.1
0.2
0.3
0.4To
tal P
(mg/
L)2005
DO-04: SJR at Mossdale
1 53 105 157 209 261 313 365Day of the Year
0
0.1
0.2
0.3
0.4
Tota
l P (m
g/L)
2006 DO-04: SJR at Mossdale
1 53 105 157 209 261 313 365Day of the Year
0
0.1
0.2
0.3
0.4
Tota
l P (m
g/L)
2007 DO-04: SJR at Mossdale
Appendix I Page 9 of 1262 694

7 of 40
1 53 105 157 209 261 313 365Day of the Year
0
0.2
0.4
0.6
0.8
Tota
l P (m
g/L)
2005 DO-05: SJR at Vernalis-McCune Station
1 53 105 157 209 261 313 365Day of the Year
0
0.2
0.4
0.6
0.8
Tota
l P (m
g/L)
2006 DO-05: SJR at Vernalis-McCune Station
1 53 105 157 209 261 313 365Day of the Year
0
0.2
0.4
0.6
0.8
Tota
l P (m
g/L)
2007 DO-05: SJR at Vernalis-McCune Station
Appendix I Page 10 of 1262 695

8 of 40
1 53 105 157 209 261 313 365Day of the Year
0
0.2
0.4
0.6
Tota
l P (m
g/L)
2005 DO-06: SJR at Maze
1 53 105 157 209 261 313 365Day of the Year
0
0.2
0.4
0.6
Tota
l P (m
g/L)
2006 DO-06: SJR at Maze
1 53 105 157 209 261 313 365Day of the Year
0
0.2
0.4
0.6
Tota
l P (m
g/L)
2007 DO-06: SJR at Maze
Appendix I Page 11 of 1262 696

9 of 40
1 53 105 157 209 261 313 365Day of the Year
0
0.2
0.4
0.6
0.8
1
Tota
l P (m
g/L)
2005 DO-07: SJR at Patterson
1 53 105 157 209 261 313 365Day of the Year
0
0.2
0.4
0.6
0.8
1
Tota
l P (m
g/L)
2006 DO-07: SJR at Patterson
1 53 105 157 209 261 313 365Day of the Year
0
0.2
0.4
0.6
0.8
1
Tota
l P (m
g/L)
2007 DO-07: SJR at Patterson
Appendix I Page 12 of 1262 697

10 of 40
1 53 105 157 209 261 313 365Day of the Year
0
0.1
0.2
0.3
0.4
Tota
l P (m
g/L)
2005 DO-08: SJR at Crows Landing
1 53 105 157 209 261 313 365Day of the Year
0
0.1
0.2
0.3
0.4
Tota
l P (m
g/L)
2006 DO-08: SJR at Crows Landing
1 53 105 157 209 261 313 365Day of the Year
0
0.1
0.2
0.3
0.4
Tota
l P (m
g/L)
2007DO-08: SJR at Crows Landing
Appendix I Page 13 of 1262 698

11 of 40
1 53 105 157 209 261 313 365Day of the Year
0
0.2
0.4
0.6To
tal P
(mg/
L)2005
DO-10: SJR at Lander Avenue
1 53 105 157 209 261 313 365Day of the Year
0
0.2
0.4
0.6
Tota
l P (m
g/L)
2006 DO-10: SJR at Lander Avenue
1 53 105 157 209 261 313 365Day of the Year
0
0.2
0.4
0.6
Tota
l P (m
g/L)
2007DO-10: SJR at Lander Avenue
Appendix I Page 14 of 1262 699

12 of 40
1 53 105 157 209 261 313 365Day of the Year
0
0.04
0.08
0.12
0.16
0.2
Tota
l P (m
g/L)
2005 DO-12: Stanislaus River at Caswell Park
1 53 105 157 209 261 313 365Day of the Year
0
0.1
0.2
0.3
0.4
Tota
l P (m
g/L)
2006 DO-12: Stanislaus River at Caswell Park
1 53 105 157 209 261 313 365Day of the Year
0
0.04
0.08
0.12
0.16
0.2
Tota
l P (m
g/L)
2007DO-12: Stanislaus River at Caswell Park
Appendix I Page 15 of 1262 700
13 of 40
1 53 105 157 209 261 313 365Day of the Year
0
0.1
0.2
0.3
0.4
Tota
l P (m
g/L)
2005 DO-14: Tuolumne River at Shiloh Bridge
1 53 105 157 209 261 313 365Day of the Year
0
0.1
0.2
0.3
0.4
Tota
l P (m
g/L)
2006 DO-14: Tuolumne River at Shiloh Bridge
1 53 105 157 209 261 313 365Day of the Year
0
0.1
0.2
0.3
0.4
Tota
l P (m
g/L)
2007DO-14: Tuolumne River at Shiloh Bridge
Appendix I Page 16 of 1262 701

14 of 40
1 53 105 157 209 261 313 365Day of the Year
0
0.02
0.04
0.06
0.08
Tota
l P (m
g/L)
2005 DO-16: Merced River at River Road
1 53 105 157 209 261 313 365Day of the Year
0
0.1
0.2
0.3
0.4
0.5
Tota
l P (m
g/L)
2006 DO-16: Merced River at River Road
1 53 105 157 209 261 313 365Day of the Year
0
0.1
0.2
0.3
0.4
0.5
Tota
l P (m
g/L)
2007DO-16: Merced River at River Road
Appendix I Page 17 of 1262 702

15 of 40
1 53 105 157 209 261 313 365Day of the Year
0
0.2
0.4
0.6
0.8
Tota
l P (m
g/L)
2005 DO-18: Mud Slough near Gustine
1 53 105 157 209 261 313 365Day of the Year
0
0.2
0.4
0.6
0.8
Tota
l P (m
g/L)
2006 DO-18: Mud Slough near Gustine
1 53 105 157 209 261 313 365Day of the Year
0
0.2
0.4
0.6
0.8
Tota
l P (m
g/L)
2007DO-18: Mud Slough near Gustine
Appendix I Page 18 of 1262 703

16 of 40
1 53 105 157 209 261 313 365Day of the Year
0
0.2
0.4
0.6
0.8
1
Tota
l P (m
g/L)
2005 DO-19: Salt Slough at Lander Avenue
1 53 105 157 209 261 313 365Day of the Year
0
0.2
0.4
0.6
0.8
1
Tota
l P (m
g/L)
2006 DO-19: Salt Slough at Lander Avenue
1 53 105 157 209 261 313 365Day of the Year
0
0.2
0.4
0.6
0.8
1
Tota
l P (m
g/L)
2007DO-19: Salt Slough at Lander Avenue
Appendix I Page 19 of 1262 704
17 of 40
1 53 105 157 209 261 313 365Day of the Year
0
0.4
0.8
1.2
1.6
Tota
l P (m
g/L)
2005 DO-20: Los Banos Creek at Highway 140
1 53 105 157 209 261 313 365Day of the Year
0
0.4
0.8
1.2
1.6
Tota
l P (m
g/L)
2006 DO-20: Los Banos Creek at Highway 140
1 53 105 157 209 261 313 365Day of the Year
0
0.4
0.8
1.2
1.6
Tota
l P (m
g/L)
2007DO-20: Los Banos Creek at Highway 140
Appendix I Page 20 of 1262 705

18 of 40
1 53 105 157 209 261 313 365Day of the Year
0
0.2
0.4
0.6
0.8
Tota
l P (m
g/L)
2005 DO-21: Orestimba Creek at River Road
1 53 105 157 209 261 313 365Day of the Year
0
0.2
0.4
0.6
0.8
Tota
l P (m
g/L)
2006 DO-21: Orestimba Creek at River Road
1 53 105 157 209 261 313 365Day of the Year
0
0.2
0.4
0.6
0.8
Tota
l P (m
g/L)
2007DO-21: Orestimba Creek at River Road
Appendix I Page 21 of 1262 706

19 of 40
1 53 105 157 209 261 313 365Day of the Year
0
0.4
0.8
1.2
1.6
Tota
l P (m
g/L)
2005 DO-23: Modesto ID Lateral 5 to Tuolumne
1 53 105 157 209 261 313 365Day of the Year
0
0.4
0.8
1.2
1.6
Tota
l P (m
g/L)
2006 DO-23: Modesto ID Lateral 5 to Tuolumne
1 53 105 157 209 261 313 365Day of the Year
0
0.4
0.8
1.2
1.6
Tota
l P (m
g/L)
2007DO-23: Modesto ID Lateral 5 to Tuolumne
Appendix I Page 22 of 1262 707
20 of 40
1 53 105 157 209 261 313 365Day of the Year
0
0.4
0.8
1.2
1.6
2
Tota
l P (m
g/L)
2005DO-25: MID Main Drain to Stan. R. via Miller Lake
1 53 105 157 209 261 313 365Day of the Year
0
2
4
6
8
Tota
l P (m
g/L)
2006 DO-25: MID Main Drain to Stan. R. via Miller Lake
1 53 105 157 209 261 313 365Day of the Year
0
0.4
0.8
1.2
1.6
2
Tota
l P (m
g/L)
2007DO-25: MID Main Drain to Stan. R. via Miller Lake
Appendix I Page 23 of 1262 708

21 of 40
1 53 105 157 209 261 313 365Day of the Year
0
0.2
0.4
0.6
0.8
1
Tota
l P (m
g/L)
2005 DO-28: Turlock ID Westport Drain Flow Station
1 53 105 157 209 261 313 365Day of the Year
0
0.2
0.4
0.6
0.8
1
Tota
l P (m
g/L)
2006 DO-28: Turlock ID Westport Drain Flow Station
1 53 105 157 209 261 313 365Day of the Year
0
0.2
0.4
0.6
0.8
1
Tota
l P (m
g/L)
2007DO-28: Turlock ID Westport Drain Flow Station
Appendix I Page 24 of 1262 709

22 of 40
1 53 105 157 209 261 313 365Day of the Year
0
2
4
6
Tota
l P (m
g/L)
2005DO-29: Turlock ID Harding Drain
1 53 105 157 209 261 313 365Day of the Year
0
2
4
6
Tota
l P (m
g/L)
2006DO-29: Turlock ID Harding Drain
1 53 105 157 209 261 313 365Day of the Year
0
2
4
6
Tota
l P (m
g/L)
2007DO-29: Turlock ID Harding Drain
Appendix I Page 25 of 1262 710

23 of 40
1 53 105 157 209 261 313 365Day of the Year
0
0.4
0.8
1.2
1.6
Tota
l P (m
g/L)
2005 DO-30: TID Lat 6 & 7 at River Rd.
1 53 105 157 209 261 313 365Day of the Year
0
0.4
0.8
1.2
1.6
Tota
l P (m
g/L)
2006 DO-30: TID Lat 6 & 7 at River Rd.
1 53 105 157 209 261 313 365Day of the Year
0
0.4
0.8
1.2
1.6
Tota
l P (m
g/L)
2007DO-30: TID Lat 6 & 7 at River Rd.
Appendix I Page 26 of 1262 711

24 of 40
1 53 105 157 209 261 313 365Day of the Year
0
0.4
0.8
1.2
1.6
Tota
l P (m
g/L)
2005 DO-33: Hospital Creek
1 53 105 157 209 261 313 365Day of the Year
0
0.4
0.8
1.2
1.6
Tota
l P (m
g/L)
2006 DO-33: Hospital Creek
1 53 105 157 209 261 313 365Day of the Year
0
0.4
0.8
1.2
1.6
Tota
l P (m
g/L)
2007DO-33: Hospital Creek
Appendix I Page 27 of 1262 712

25 of 40
1 53 105 157 209 261 313 365Day of the Year
0
0.4
0.8
1.2
1.6
Tota
l P (m
g/L)
2005 DO-34: Ingram Creek Flow Station
1 53 105 157 209 261 313 365Day of the Year
0
0.4
0.8
1.2
1.6
Tota
l P (m
g/L)
2006 DO-34: Ingram Creek Flow Station
1 53 105 157 209 261 313 365Day of the Year
0
0.4
0.8
1.2
1.6
Tota
l P (m
g/L)
2007DO-34: Ingram Creek Flow Station
Appendix I Page 28 of 1262 713
26 of 40
1 53 105 157 209 261 313 365Day of the Year
0
0.4
0.8
1.2
Tota
l P (m
g/L)
2005 DO-36: Del Puerto Creek Flow Station
1 53 105 157 209 261 313 365Day of the Year
0
0.4
0.8
1.2
Tota
l P (m
g/L)
2006 DO-36: Del Puerto Creek Flow Station
1 53 105 157 209 261 313 365Day of the Year
0
0.4
0.8
1.2
Tota
l P (m
g/L)
2007DO-36: Del Puerto Creek Flow Station
Appendix I Page 29 of 1262 714

27 of 40
1 53 105 157 209 261 313 365Day of the Year
0
0.05
0.1
0.15
0.2
0.25
Tota
l P (m
g/L)
2005 DO-44: San Luis Drain End
1 53 105 157 209 261 313 365Day of the Year
0
0.05
0.1
0.15
0.2
0.25
Tota
l P (m
g/L)
2006 DO-44: San Luis Drain End
1 53 105 157 209 261 313 365Day of the Year
0
0.05
0.1
0.15
0.2
0.25
Tota
l P (m
g/L)
2007DO-44: San Luis Drain End
Appendix I Page 30 of 1262 715

28 of 40
1 53 105 157 209 261 313 365Day of the Year
0
0.2
0.4
0.6
0.8
1
Tota
l P (m
g/L)
2005 DO-53: Salt Slough at Wolfsen Road
1 53 105 157 209 261 313 365Day of the Year
0
0.2
0.4
0.6
0.8
1
Tota
l P (m
g/L)
2006 DO-53: Salt Slough at Wolfsen Road
1 53 105 157 209 261 313 365Day of the Year
0
0.2
0.4
0.6
0.8
1
Tota
l P (m
g/L)
2007DO-53: Salt Slough at Wolfsen Road
Appendix I Page 31 of 1262 716
29 of 40
1 53 105 157 209 261 313 365Day of the Year
0
0.2
0.4
0.6
0.8
1
Tota
l P (m
g/L)
2005 DO-57: Ramona Lake Drain at Levee
1 53 105 157 209 261 313 365Day of the Year
0
0.2
0.4
0.6
0.8
1
Tota
l P (m
g/L)
2006 DO-57: Ramona Lake Drain at Levee
1 53 105 157 209 261 313 365Day of the Year
0
0.2
0.4
0.6
0.8
1
Tota
l P (m
g/L)
2007DO-57: Ramona Lake Drain at Levee
Appendix I Page 32 of 1262 717

30 of 40
1 53 105 157 209 261 313 365Day of the Year
0
0.1
0.2
0.3
0.4
0.5
Tota
l P (m
g/L)
2005 DO-59: SJR Laird Park
1 53 105 157 209 261 313 365Day of the Year
0
0.1
0.2
0.3
0.4
0.5
Tota
l P (m
g/L)
2006 DO-59: SJR Laird Park
1 53 105 157 209 261 313 365Day of the Year
0
0.1
0.2
0.3
0.4
0.5
Tota
l P (m
g/L)
2007DO-59: SJR Laird Park
Appendix I Page 33 of 1262 718

31 of 40
1 53 105 157 209 261 313 365Day of the Year
0
0.2
0.4
0.6
Tota
l P (m
g/L)
2005 DO-60: Moffit 1 South
1 53 105 157 209 261 313 365Day of the Year
0
0.2
0.4
0.6
Tota
l P (m
g/L)
2006 DO-60: Moffit 1 South
1 53 105 157 209 261 313 365Day of the Year
0
0.2
0.4
0.6
Tota
l P (m
g/L)
2007DO-60: Moffit 1 South
Appendix I Page 34 of 1262 719

32 of 40
1 53 105 157 209 261 313 365Day of the Year
0
0.4
0.8
1.2
Tota
l P (m
g/L)
2005 DO-61: Deadman's Slough
1 53 105 157 209 261 313 365Day of the Year
0
0.4
0.8
1.2
Tota
l P (m
g/L)
2006 DO-61: Deadman's Slough
1 53 105 157 209 261 313 365Day of the Year
0
0.4
0.8
1.2
Tota
l P (m
g/L)
2007DO-61: Deadman's Slough
Appendix I Page 35 of 1262 720
33 of 40
1 53 105 157 209 261 313 365Day of the Year
0
1
2
3
4
Tota
l P (m
g/L)
2005DO-62: Mallard Slough
1 53 105 157 209 261 313 365Day of the Year
0
1
2
3
4
Tota
l P (m
g/L)
2006DO-62: Mallard Slough
1 53 105 157 209 261 313 365Day of the Year
0
1
2
3
4
Tota
l P (m
g/L)
2007DO-62: Mallard Slough
Appendix I Page 36 of 1262 721

34 of 40
1 53 105 157 209 261 313 365Day of the Year
0
0.4
0.8
1.2
Tota
l P (m
g/L)
2005 DO-63: Inlet C Canal
1 53 105 157 209 261 313 365Day of the Year
0
0.4
0.8
1.2
Tota
l P (m
g/L)
2006DO-63: Inlet C Canal
1 53 105 157 209 261 313 365Day of the Year
0
0.4
0.8
1.2
Tota
l P (m
g/L)
2007DO-63: Inlet C Canal
Appendix I Page 37 of 1262 722

35 of 40
1 53 105 157 209 261 313 365Day of the Year
0
0.1
0.2
0.3
0.4
Tota
l P (m
g/L)
2005 DO-80: South Marsh 1 Inlet
1 53 105 157 209 261 313 365Day of the Year
0
0.1
0.2
0.3
0.4
Tota
l P (m
g/L)
2006DO-80: South Marsh 1 Inlet
1 53 105 157 209 261 313 365Day of the Year
0
0.1
0.2
0.3
0.4
Tota
l P (m
g/L)
2007DO-80: South Marsh 1 Inlet
Appendix I Page 38 of 1262 723

36 of 40
1 53 105 157 209 261 313 365Day of the Year
0
0.4
0.8
1.2
Tota
l P (m
g/L)
2005 DO-81: South Marsh 1 Outlet
1 53 105 157 209 261 313 365Day of the Year
0
0.4
0.8
1.2
Tota
l P (m
g/L)
2006DO-81: South Marsh 1 Outlet
1 53 105 157 209 261 313 365Day of the Year
0
0.4
0.8
1.2
Tota
l P (m
g/L)
2007DO-81: South Marsh 1 Outlet
Appendix I Page 39 of 1262 724

37 of 40
1 53 105 157 209 261 313 365Day of the Year
0
0.4
0.8
1.2
1.6
2
Tota
l P (m
g/L)
2005 DO-82: South Marsh 3 Inlet
1 53 105 157 209 261 313 365Day of the Year
0
0.4
0.8
1.2
1.6
2
Tota
l P (m
g/L)
2006DO-82: South Marsh 3 Inlet
1 53 105 157 209 261 313 365Day of the Year
0
0.4
0.8
1.2
1.6
2
Tota
l P (m
g/L)
2007DO-82: South Marsh 3 Inlet
Appendix I Page 40 of 1262 725

38 of 40
1 53 105 157 209 261 313 365Day of the Year
0
0.4
0.8
1.2
1.6
Tota
l P (m
g/L)
2005 DO-83: South Marsh 3 Outlet
1 53 105 157 209 261 313 365Day of the Year
0
0.4
0.8
1.2
1.6
Tota
l P (m
g/L)
2006DO-83: South Marsh 3 Outlet
1 53 105 157 209 261 313 365Day of the Year
0
0.4
0.8
1.2
1.6
Tota
l P (m
g/L)
2007DO-83: South Marsh 3 Outlet
Appendix I Page 41 of 1262 726

39 of 40
1 53 105 157 209 261 313 365Day of the Year
0
0.2
0.4
0.6
0.8
1
Tota
l P (m
g/L)
2005 DO-95: Ramona Lake Entrance
1 53 105 157 209 261 313 365Day of the Year
0
0.2
0.4
0.6
0.8
1
Tota
l P (m
g/L)
2006DO-95: Ramona Lake Entrance
1 53 105 157 209 261 313 365Day of the Year
0
0.2
0.4
0.6
0.8
1
Tota
l P (m
g/L)
2007DO-95: Ramona Lake Entrance
Appendix I Page 42 of 1262 727

Temporal Plots of 2005-2007 Total Nitrogen Data from the Upstream San Joaquin River
Chelsea Spier1
Remie Burks1
Sharon Borglin1
Randy Dahlgren2
Jeremy Hanlon1
Justin Graham1
William Stringfellow1
February 2008
1Environmental Engineering Research Program School of Engineering & Computer Sciences
University of the Pacific 3601 Pacific Avenue, Sears Hall
Stockton, CA 95211 2UC Davis, Davis, CA
Appendix I Page 43 of 1262 728
1 of 40
Introduction The San Joaquin River (SJR) supports one of the most productive agricultural regions in the world and its productivity is heavily dependant on irrigated agriculture. A consequence of irrigated agriculture is the production of return flows conveyed down gradient drains that eventually discharge to surface waters. Agricultural drainage may have significant nutrient load and can impact algae growth and general water quality in the SJR. Individual farmers and agricultural organizations, such as drainage authorities, are in need of tools to manage the environmental impacts of agricultural activities (Stringfellow, 2008).
For the years 2005 through 2007, sites throughout the San Joaquin Valley watershed were sampled to assess the overall water quality in the region. One thousand nine hundred and ninety-six (1996) individual surface water samples were collected and analyzed and WQ was assessed at 113 locations in the SJR basin (Borglin et al., 2008). Samples were processed and analyzed by the Environmental Engineering Research Program (EERP) laboratory at the University of the Pacific as well as at the University of California, Davis, Dahlgren Lab. This report includes temporal graphs of total nitrogen (Tot-N) data analyzed by the UCD Dahlgren laboratory from 2005-2007.
MethodsDepth integrated field samples were colleted during 2005-2007 in the upper San Joaquin River in accordance with EERP Field Standard Operating Procedures Protocol Book (Graham 2008). Water samples were colleted in glass 1000 mL bottles (Wheaton Science Products, Millville, NJ), 1000 mL HDPE Trace-Clean narrow mouth plastic bottles (VWR International), 250 mL HDPE Trace-Clean wide mouth plastic bottles (VWR International) as well as 40 mL trace clean vials with PTFE septa (IChem, Rockwood, TN). Bottles were labeled with the appropriate sample number, site name and sampling date. All bottles were rinsed with sample water prior to sample collection. Some sites required a bucket to collect sample water because of accessibility from a high bridge or platform. For these sites, the bucket was pre-rinsed with sample water and sample bottles were filled using a rinsed funnel. Care was taken to distribute water simultaneously to all sample bottles (rather than sequentially). Samples were immediately stored at 4°C after sampling (cooler temperature was recorded in the lab upon delivery) and transported to the EERP lab on the day of sampling.
Within 24 hours of collection samples were transported from the EERP laboratory to the UCD laboratory where they were stored at -20oC until Tot-N analysis could be completed.
Tot-N was determined using an automated membrane diffusion/conductivity detection method (Carlson, 1978, 1986; Carlson et al., 1990) from unfiltered sample following persulfate oxidation (Yu et al., 1994) using a 1% persulfate oxidant concentration, a sample:oxidant ratio of 1:1 (V/V), and heating in an autoclave. The limit of detection for this method was 50 ppb N.
Appendix I Page 44 of 1262 729

2 of 40
Results/DiscussionWith each set of Tot-N field samples analyzed in the UCD laboratory, quality assurance samples including a field duplicate, a trip blank, and lab blanks were also analyzed. 96.17% of all quality assurance samples were within a passing range (Spier et al, 2008). Proficiency check samples, standards with unknown concentration to the laboratory analyst, were run approximately twice a year. Twelve proficiency check samples were analyzed for Tot-N in the EERP laboratory during 2007, and nine of these samples were found to be within the acceptable range. Samples were measured ranging from 0.02-40.06 mg/L Tot-N. The average concentration of Tot-N found in samples collected was 4.39 mg/L Tot-N. Tot-N was also analyzed by the EERP laboratory on the same water samples starting in the summer of 2007and has a high correlation to values measured by EERP. When all data points measured by the two labs are compared they have r2=0.9896(Spier et al, 2008). Tot-N samples measured by EERP have about 101% as much Tot-N as the same samples measured by UCD (Figure 2).
References American Public Health Association (APHA). 2005. Standard Methods for the Examination of
Water and Wastewater, 21st Edition. American Public Health Association, Washington, DC.
Borglin, S., W. Stringfellow, J. Hanlon. 2005. Standard Operating Procedures for the Up-Stream Dissolved Oxygen TMDL Project. LBNL/Pub-937.
Borglin, S., Burks, R., Hanlon, J., Graham, J., Spier, C., Stringfellow, W., and Dahlgren, R., (2008) Methods overview, quality assurance, and quality control, University of the Pacific, Stockton, CA
Borglin, S.E., Burks, R.D., Hanlon, J.S., Stringfellow, W.T. (2008) EERP Lab Protocol Book, University of the Pacific, Stockton, CA.
Carlson, R.M., R. Cabrera, J. Paul, J. Quick and R.Y. Evans. 1990. Rapid direct determination of ammonium and nitrate in soil and plant tissue extracts. Comm. Soil Sci. Plant Anal. 21:1519-1530.
Graham, J., Hanlon, J.S., Stringfellow, W.T., (2008) EERP Field Protocol Book, University of the Pacific, Stockton, CA.
Spier, C., Burks, R., Borglin, S.E. (2008) Comparison of Methods for Analyzing Ammonia, Nitrate and Total Nitrogen, University of the Pacific, Stockton, CA.
Stringfellow, W.T., et al., (2008) Evaluation of Vegitated Ditches, Ponds, and Wetlands as BMPs for Mitigating the Water Quality Impact of Irrigated Agriculture in the San Joaquin Valley, University of the Pacific, Stockton, CA
YSI Environmental Operations Manual (2005) 6-Series Environmental Monitoring Systems, Yellow Springs, OH.
Appendix I Page 45 of 1262 730

3 of 40
Table 1: EERP Sampling Site List DO Number
Site Name Type
4 SJR at Mossdale Core sites 5 SJR at Vernalis-McCune Station (River Club) Core sites, BMP 6 SJR at Maze Core sites, BMP 7 SJR at Patterson Core sites, BMP 8 SJR at Crows Landing Core sites, BMP
10 SJR at Lander Avenue Core sites 12 Stanislaus River at Caswell Park Core sites 14 Tuolumne River at Shiloh Bridge Core sites 16 Merced River at River Road Core sites 18 Mud Slough near Gustine Core sites, Wetland 19 Salt Slough at Lander Avenue Core sites, Wetland 20 Los Banos Creek Flow Station Core sites, Wetland 21 Orestimba Creek at River Road Core sites, BMP 23 Modesto ID Lateral 5 to Tuolumne Core sites 25 Modesto ID Main Drain to Stan. R. via Miller Lake Core sites 28 Turlock ID Westport Drain Flow station Core sites 29 Turlock ID Harding Drain Core sites 30 Turlock ID Lateral 6 & 7 at Levee Core sites 33 Hospital Creek Intermittent, BMP 34 Ingram Creek Core sites, BMP 36 Del Puerto Creek Flow Station Core sites, BMP 44 San Luis Drain End Core sites 53 Salt Slough at Wolfsen Road Wetland 57 Ramona Lake Drain Core sites, BMP 59 SJR Laird Park Core sites 60 Moffit 1 South Wetland 61 Deadman's Slough Wetland 62 Mallard Slough Wetland 63 Inlet C Canal Wetland 80 South Marsh-1-Inlet Wetland 81 South Marsh-1-Outlet Wetland 82 South Marsh-3-Inlet Wetland 83 South Marsh-3-Outlet Wetland 95 Ramona drain at Ramona Lake BMP, Intermittent
Appendix I Page 46 of 1262 731

4 of 40
Figure 1: EERP Sampling Site Map of SJR Watershed and Tributaries
Appendix I Page 47 of 1262 732

5 of 40
Figure 2: UCD vs EERP Timberline Plot of Tot-N.
0 10 20 30 40 50UC Davis Total N (mg/L)
0
10
20
30
40
50EE
RP
Tim
berli
ne T
otal
N (m
g/L)
Y = 1.0103 * XNumber of data points used = 604r2 = 0.9896
Appendix I Page 48 of 1262 733
6 of 40
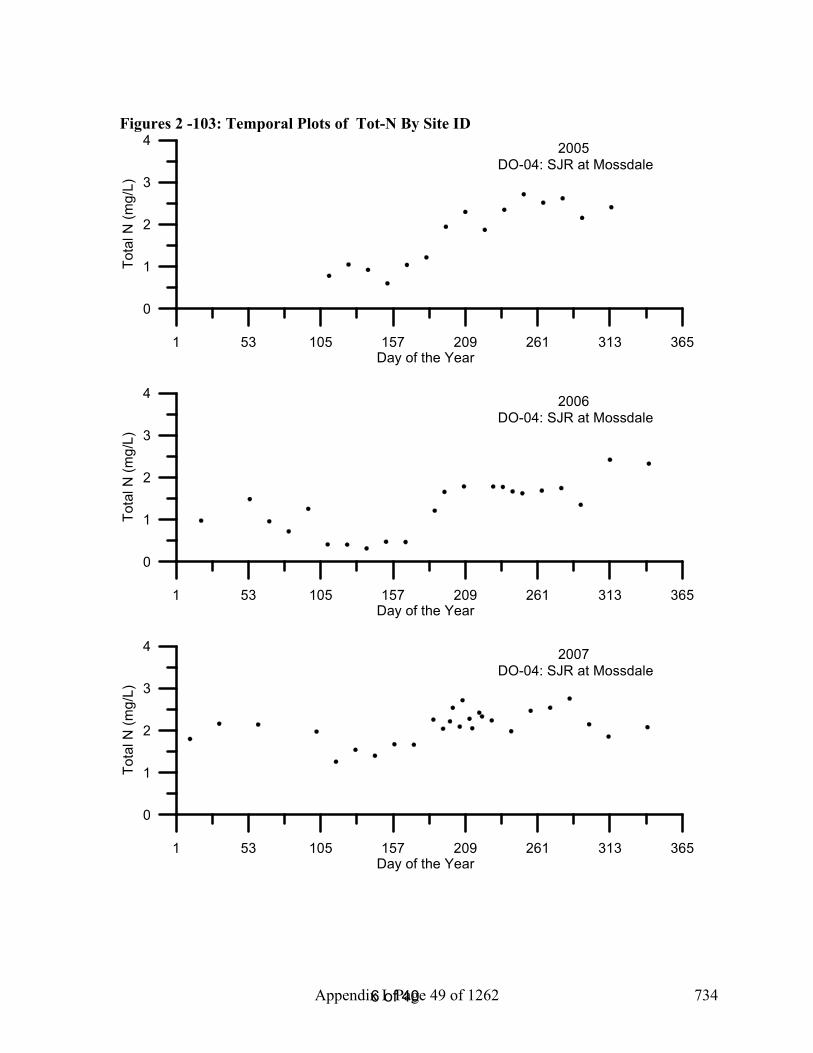
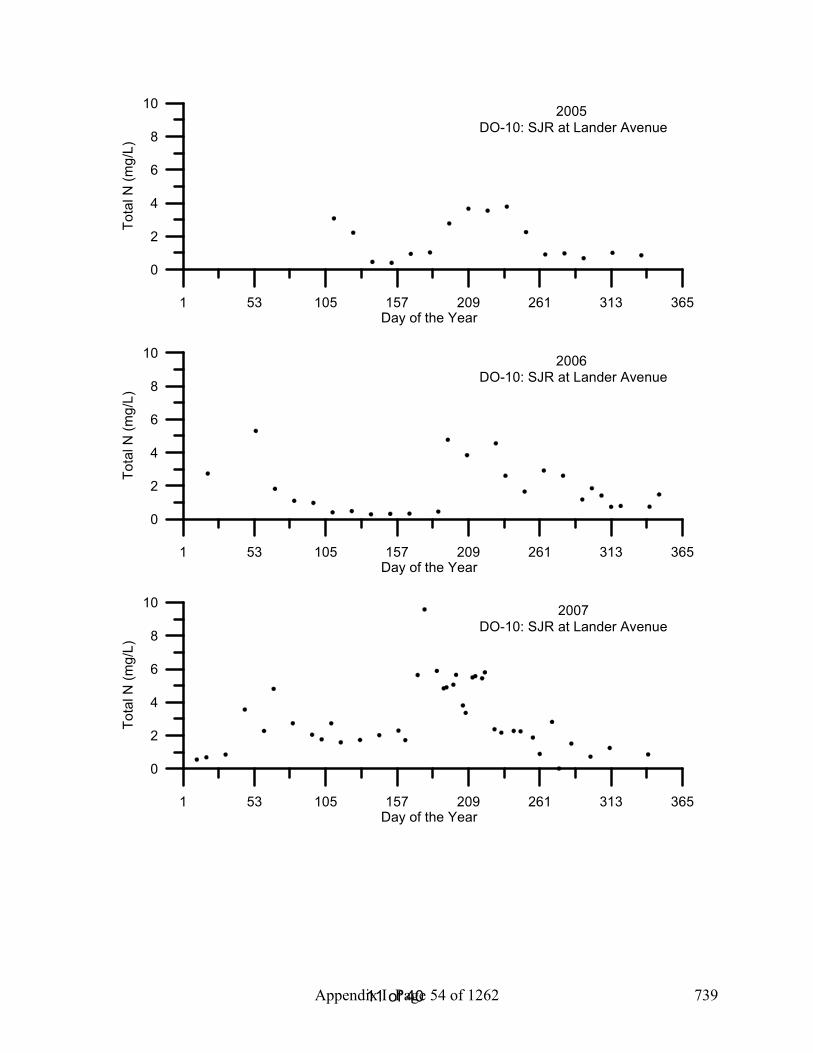
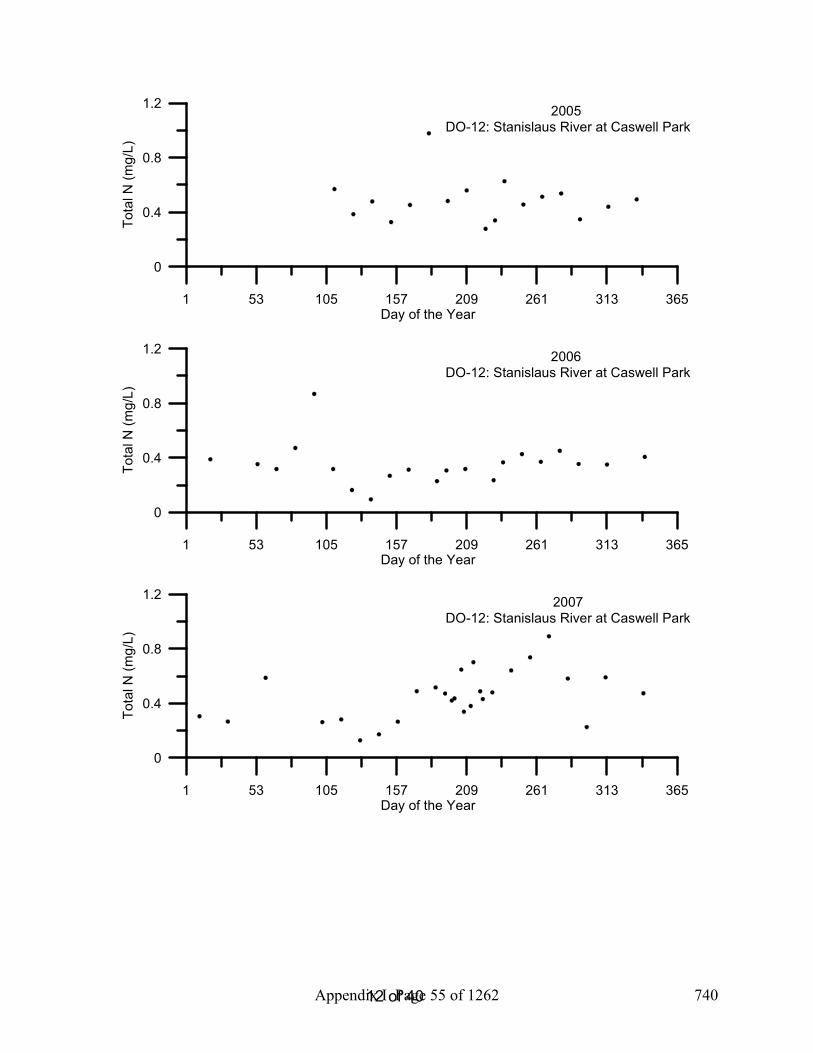
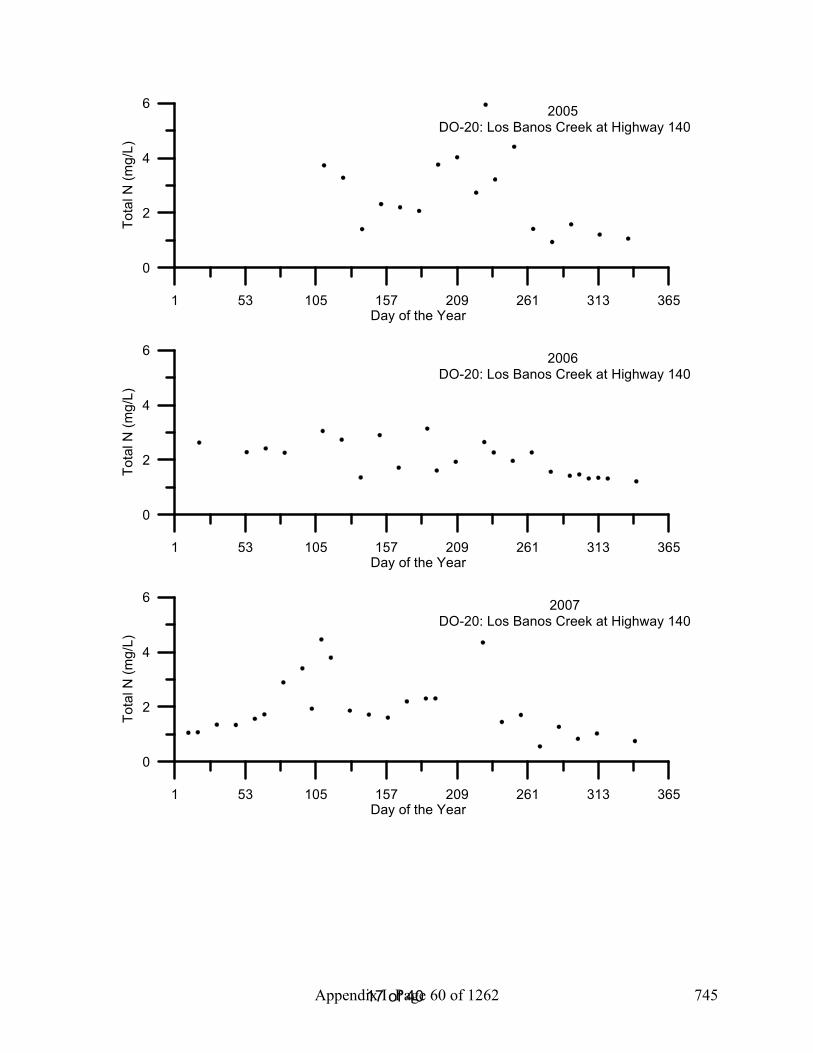
Figures 2 -103: Temporal Plots of Tot-N By Site ID
1 53 105 157 209 261 313 365Day of the Year
0
1
2
3
4To
tal N
(mg/
L)2005
DO-04: SJR at Mossdale
1 53 105 157 209 261 313 365Day of the Year
0
1
2
3
4
Tota
l N (m
g/L)
2006DO-04: SJR at Mossdale
1 53 105 157 209 261 313 365Day of the Year
0
1
2
3
4
Tota
l N (m
g/L)
2007 DO-04: SJR at Mossdale
Appendix I Page 49 of 1262 734

7 of 40
1 53 105 157 209 261 313 365Day of the Year
0
1
2
3
4
Tota
l N (m
g/L)
2005 DO-05: SJR at Vernalis-McCune Station
1 53 105 157 209 261 313 365Day of the Year
0
1
2
3
4
Tota
l N (m
g/L)
2006 DO-05: SJR at Vernalis-McCune Station
1 53 105 157 209 261 313 365Day of the Year
0
1
2
3
4
Tota
l N (m
g/L)
2007 DO-05: SJR at Vernalis-McCune Station
Appendix I Page 50 of 1262 735

8 of 40
1 53 105 157 209 261 313 365Day of the Year
0
1
2
3
4
5
Tota
l N (m
g/L)
2005DO-06: SJR at Maze
1 53 105 157 209 261 313 365Day of the Year
0
1
2
3
4
5
Tota
l N (m
g/L)
2006 DO-06: SJR at Maze
1 53 105 157 209 261 313 365Day of the Year
0
1
2
3
4
5
Tota
l N (m
g/L)
2007 DO-06: SJR at Maze
Appendix I Page 51 of 1262 736

9 of 40
1 53 105 157 209 261 313 365Day of the Year
0
2
4
6
8
Tota
l N (m
g/L)
2005DO-07: SJR at Patterson
1 53 105 157 209 261 313 365Day of the Year
0
2
4
6
8
Tota
l N (m
g/L)
2006DO-07: SJR at Patterson
1 53 105 157 209 261 313 365Day of the Year
0
2
4
6
8
Tota
l N (m
g/L)
2007 DO-07: SJR at Patterson
Appendix I Page 52 of 1262 737

10 of 40
1 53 105 157 209 261 313 365Day of the Year
0
2
4
6
8
Tota
l N (m
g/L)
2005DO-08: SJR at Crows Landing
1 53 105 157 209 261 313 365Day of the Year
0
2
4
6
8
Tota
l N (m
g/L)
2006DO-08: SJR at Crows Landing
1 53 105 157 209 261 313 365Day of the Year
0
2
4
6
8
Tota
l N (m
g/L)
2007DO-08: SJR at Crows Landing
Appendix I Page 53 of 1262 738
11 of 40
1 53 105 157 209 261 313 365Day of the Year
0
2
4
6
8
10
Tota
l N (m
g/L)
2005 DO-10: SJR at Lander Avenue
1 53 105 157 209 261 313 365Day of the Year
0
2
4
6
8
10
Tota
l N (m
g/L)
2006 DO-10: SJR at Lander Avenue
1 53 105 157 209 261 313 365Day of the Year
0
2
4
6
8
10
Tota
l N (m
g/L)
2007DO-10: SJR at Lander Avenue
Appendix I Page 54 of 1262 739
12 of 40
1 53 105 157 209 261 313 365Day of the Year
0
0.4
0.8
1.2
Tota
l N (m
g/L)
2005 DO-12: Stanislaus River at Caswell Park
1 53 105 157 209 261 313 365Day of the Year
0
0.4
0.8
1.2
Tota
l N (m
g/L)
2006 DO-12: Stanislaus River at Caswell Park
1 53 105 157 209 261 313 365Day of the Year
0
0.4
0.8
1.2
Tota
l N (m
g/L)
2007DO-12: Stanislaus River at Caswell Park
Appendix I Page 55 of 1262 740

13 of 40
1 53 105 157 209 261 313 365Day of the Year
0
1
2
3
4
Tota
l N (m
g/L)
2005 DO-14: Tuolumne River at Shiloh Bridge
1 53 105 157 209 261 313 365Day of the Year
0
1
2
3
4
Tota
l N (m
g/L)
2006 DO-14: Tuolumne River at Shiloh Bridge
1 53 105 157 209 261 313 365Day of the Year
0
1
2
3
4
Tota
l N (m
g/L)
2007DO-14: Tuolumne River at Shiloh Bridge
Appendix I Page 56 of 1262 741

14 of 40
1 53 105 157 209 261 313 365Day of the Year
0
1
2
3
4
Tota
l N (m
g/L)
2005 DO-16: Merced River at River Road
1 53 105 157 209 261 313 365Day of the Year
0
1
2
3
4
Tota
l N (m
g/L)
2006 DO-16: Merced River at River Road
1 53 105 157 209 261 313 365Day of the Year
0
4
8
12
16
Tota
l N (m
g/L)
2007DO-16: Merced River at River Road
Appendix I Page 57 of 1262 742

15 of 40
1 53 105 157 209 261 313 365Day of the Year
0
4
8
12
16
Tota
l N (m
g/L)
2005 DO-18: Mud Slough near Gustine
1 53 105 157 209 261 313 365Day of the Year
0
4
8
12
16
Tota
l N (m
g/L)
2006 DO-18: Mud Slough near Gustine
1 53 105 157 209 261 313 365Day of the Year
0
4
8
12
16
Tota
l N (m
g/L)
2007DO-18: Mud Slough near Gustine
Appendix I Page 58 of 1262 743

16 of 40
1 53 105 157 209 261 313 365Day of the Year
0
2
4
6
Tota
l N (m
g/L)
2005 DO-19: Salt Slough at Lander Avenue
1 53 105 157 209 261 313 365Day of the Year
0
2
4
6
Tota
l N (m
g/L)
2006 DO-19: Salt Slough at Lander Avenue
1 53 105 157 209 261 313 365Day of the Year
0
2
4
6
Tota
l N (m
g/L)
2007DO-19: Salt Slough at Lander Avenue
Appendix I Page 59 of 1262 744
17 of 40
1 53 105 157 209 261 313 365Day of the Year
0
2
4
6
Tota
l N (m
g/L)
2005 DO-20: Los Banos Creek at Highway 140
1 53 105 157 209 261 313 365Day of the Year
0
2
4
6
Tota
l N (m
g/L)
2006 DO-20: Los Banos Creek at Highway 140
1 53 105 157 209 261 313 365Day of the Year
0
2
4
6
Tota
l N (m
g/L)
2007DO-20: Los Banos Creek at Highway 140
Appendix I Page 60 of 1262 745

18 of 40
1 53 105 157 209 261 313 365Day of the Year
0
4
8
12
16
Tota
l N (m
g/L)
2005 DO-21: Orestimba Creek at River Road
1 53 105 157 209 261 313 365Day of the Year
0
4
8
12
16
Tota
l N (m
g/L)
2006 DO-21: Orestimba Creek at River Road
1 53 105 157 209 261 313 365Day of the Year
0
4
8
12
16
Tota
l N (m
g/L)
2007DO-21: Orestimba Creek at River Road
Appendix I Page 61 of 1262 746

19 of 40
1 53 105 157 209 261 313 365Day of the Year
0
4
8
12
16
20
Tota
l N (m
g/L)
2005 DO-23: Modesto ID Lateral 5 to Tuolumne
1 53 105 157 209 261 313 365Day of the Year
0
4
8
12
16
20
Tota
l N (m
g/L)
2006 DO-23: Modesto ID Lateral 5 to Tuolumne
1 53 105 157 209 261 313 365Day of the Year
0
4
8
12
16
20
Tota
l N (m
g/L)
2007DO-23: Modesto ID Lateral 5 to Tuolumne
Appendix I Page 62 of 1262 747

20 of 40
1 53 105 157 209 261 313 365Day of the Year
0
2
4
6To
tal N
(mg/
L)
2005 DO-25: MID Main Drain to Stan. R. via Miller Lake
1 53 105 157 209 261 313 365Day of the Year
0
10
20
30
40
Tota
l N (m
g/L)
2006 DO-25: MID Main Drain to Stan. R. via Miller Lake
1 53 105 157 209 261 313 365Day of the Year
0
2
4
6
Tota
l N (m
g/L)
2007DO-25: MID Main Drain to Stan. R. via Miller Lake
Appendix I Page 63 of 1262 748
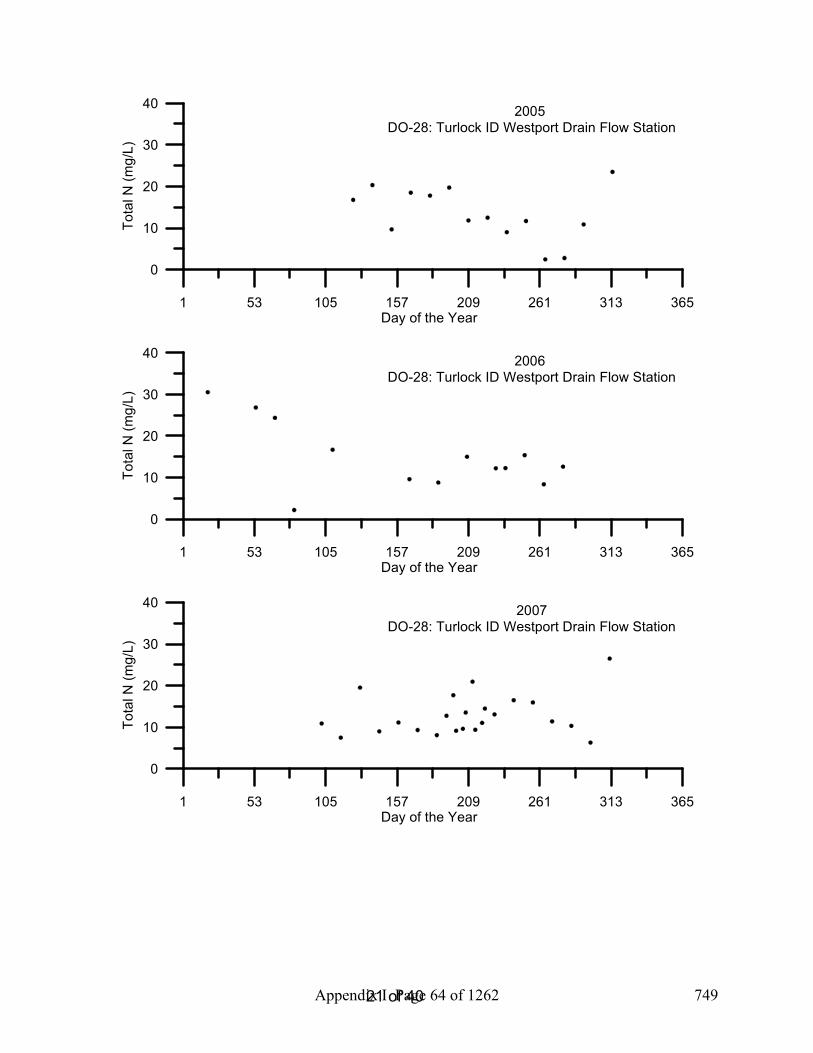
21 of 40
1 53 105 157 209 261 313 365Day of the Year
0
10
20
30
40
Tota
l N (m
g/L)
2005 DO-28: Turlock ID Westport Drain Flow Station
1 53 105 157 209 261 313 365Day of the Year
0
10
20
30
40
Tota
l N (m
g/L)
2006 DO-28: Turlock ID Westport Drain Flow Station
1 53 105 157 209 261 313 365Day of the Year
0
10
20
30
40
Tota
l N (m
g/L)
2007DO-28: Turlock ID Westport Drain Flow Station
Appendix I Page 64 of 1262 749

22 of 40
1 53 105 157 209 261 313 365Day of the Year
0
5
10
15
20
25
Tota
l N (m
g/L)
2005 DO-29: Turlock ID Harding Drain
1 53 105 157 209 261 313 365Day of the Year
0
5
10
15
20
25
Tota
l N (m
g/L)
2006 DO-29: Turlock ID Harding Drain
1 53 105 157 209 261 313 365Day of the Year
0
5
10
15
20
25
Tota
l N (m
g/L)
2007DO-29: Turlock ID Harding Drain
Appendix I Page 65 of 1262 750

23 of 40
1 53 105 157 209 261 313 365Day of the Year
0
10
20
30
40
50
Tota
l N (m
g/L)
2005 DO-30: TID Lat 6 & 7 at River Rd.
1 53 105 157 209 261 313 365Day of the Year
0
10
20
30
40
50
Tota
l N (m
g/L)
2006 DO-30: TID Lat 6 & 7 at River Rd.
1 53 105 157 209 261 313 365Day of the Year
0
10
20
30
40
50
Tota
l N (m
g/L)
2007DO-30: TID Lat 6 & 7 at River Rd.
Appendix I Page 66 of 1262 751

24 of 40
1 53 105 157 209 261 313 365Day of the Year
0
2
4
6
Tota
l N (m
g/L)
2005DO-33: Hospital Creek
1 53 105 157 209 261 313 365Day of the Year
0
2
4
6
Tota
l N (m
g/L)
2006 DO-33: Hospital Creek
1 53 105 157 209 261 313 365Day of the Year
0
2
4
6
Tota
l N (m
g/L)
2007DO-33: Hospital Creek
Appendix I Page 67 of 1262 752

25 of 40
1 53 105 157 209 261 313 365Day of the Year
0
4
8
12
16
20
Tota
l N (m
g/L)
2005 DO-34: Ingram Creek Flow Station
1 53 105 157 209 261 313 365Day of the Year
0
4
8
12
16
20
Tota
l N (m
g/L)
2006 DO-34: Ingram Creek Flow Station
1 53 105 157 209 261 313 365Day of the Year
0
4
8
12
16
20
Tota
l N (m
g/L)
2007DO-34: Ingram Creek Flow Station
Appendix I Page 68 of 1262 753

26 of 40
1 53 105 157 209 261 313 365Day of the Year
0
4
8
12
16
20
Tota
l N (m
g/L)
2005 DO-36: Del Puerto Creek Flow Station
1 53 105 157 209 261 313 365Day of the Year
0
4
8
12
16
20
Tota
l N (m
g/L)
2006 DO-36: Del Puerto Creek Flow Station
1 53 105 157 209 261 313 365Day of the Year
0
4
8
12
16
20
Tota
l N (m
g/L)
2007DO-36: Del Puerto Creek Flow Station
Appendix I Page 69 of 1262 754

27 of 40
1 53 105 157 209 261 313 365Day of the Year
0
10
20
30
Tota
l N (m
g/L)
2005 DO-44: San Luis Drain End
1 53 105 157 209 261 313 365Day of the Year
0
10
20
30
Tota
l N (m
g/L)
2006 DO-44: San Luis Drain End
1 53 105 157 209 261 313 365Day of the Year
0
10
20
30
Tota
l N (m
g/L)
2007DO-44: San Luis Drain End
Appendix I Page 70 of 1262 755

28 of 40
1 53 105 157 209 261 313 365Day of the Year
0
1
2
3
4
5
Tota
l N (m
g/L)
2005DO-53: Salt Slough at Wolfsen Road
1 53 105 157 209 261 313 365Day of the Year
0
1
2
3
4
5
Tota
l N (m
g/L)
2006DO-53: Salt Slough at Wolfsen Road
1 53 105 157 209 261 313 365Day of the Year
0
1
2
3
4
5
Tota
l N (m
g/L)
2007DO-53: Salt Slough at Wolfsen Road
Appendix I Page 71 of 1262 756
29 of 40
1 53 105 157 209 261 313 365Day of the Year
0
2
4
6
8
Tota
l N (m
g/L)
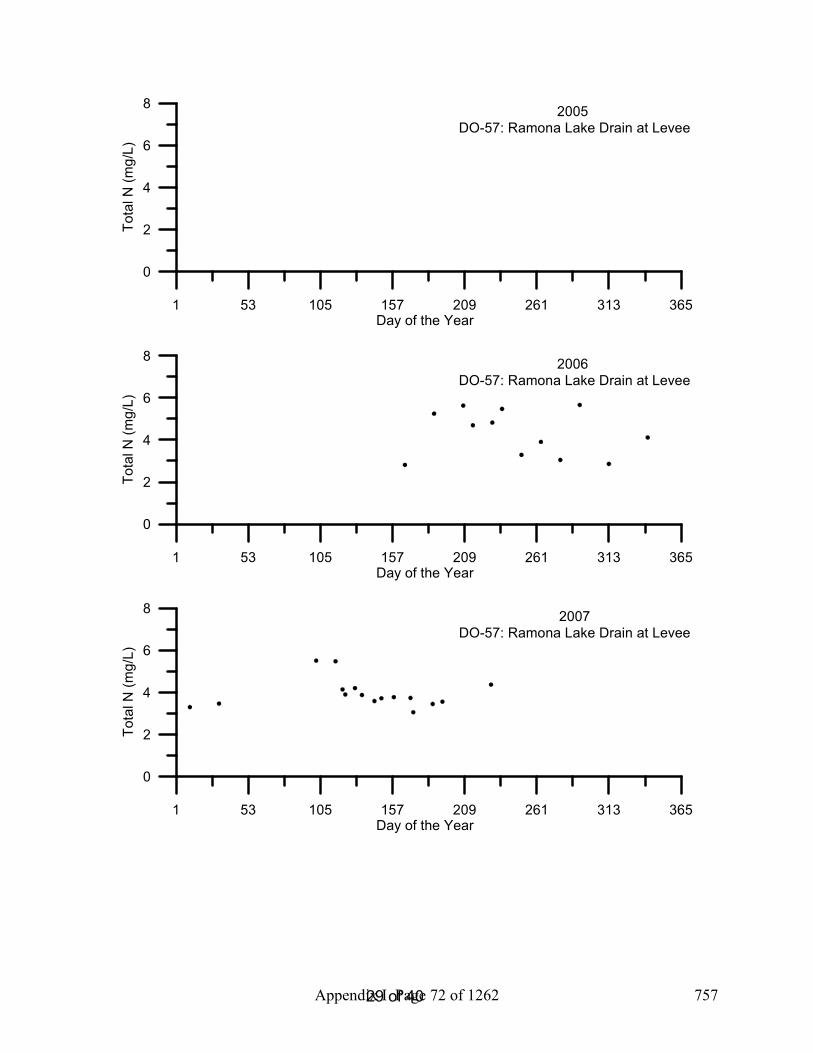
2005 DO-57: Ramona Lake Drain at Levee
1 53 105 157 209 261 313 365Day of the Year
0
2
4
6
8
Tota
l N (m
g/L)
2006 DO-57: Ramona Lake Drain at Levee
1 53 105 157 209 261 313 365Day of the Year
0
2
4
6
8
Tota
l N (m
g/L)
2007DO-57: Ramona Lake Drain at Levee
Appendix I Page 72 of 1262 757
30 of 40
1 53 105 157 209 261 313 365Day of the Year
0
2
4
6
8
10
Tota
l N (m
g/L)
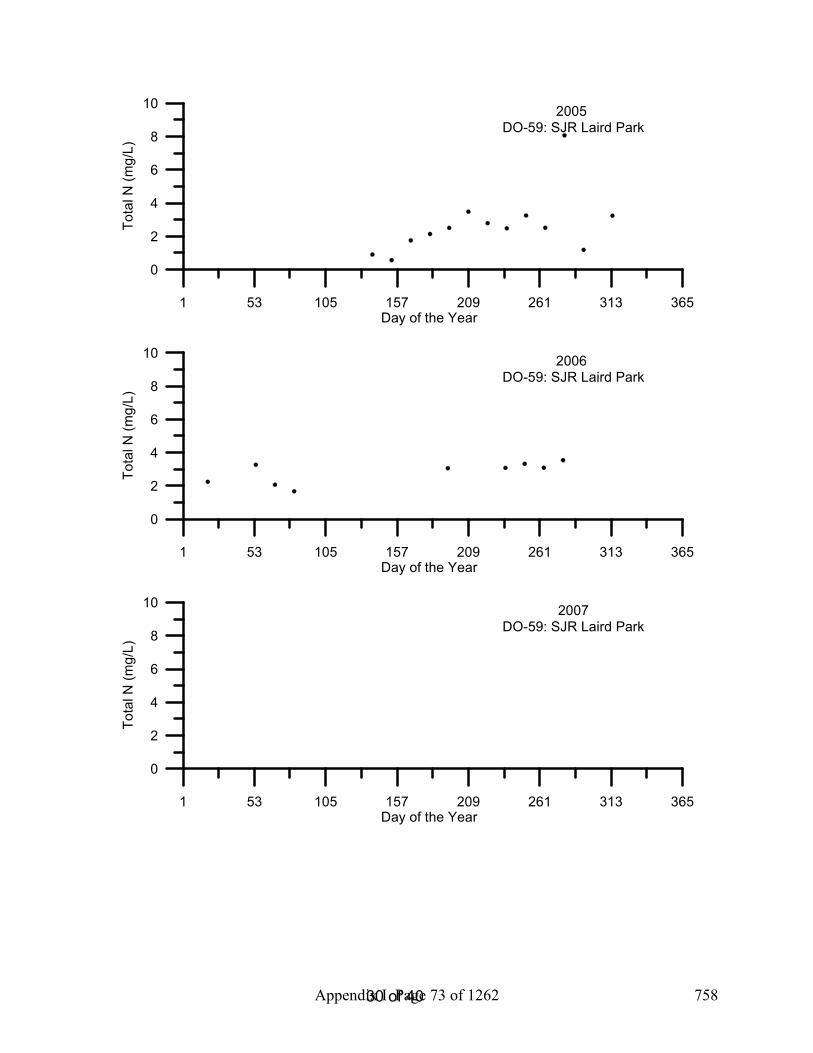
2005 DO-59: SJR Laird Park
1 53 105 157 209 261 313 365Day of the Year
0
2
4
6
8
10
Tota
l N (m
g/L)
2006 DO-59: SJR Laird Park
1 53 105 157 209 261 313 365Day of the Year
0
2
4
6
8
10
Tota
l N (m
g/L)
2007DO-59: SJR Laird Park
Appendix I Page 73 of 1262 758

31 of 40
1 53 105 157 209 261 313 365Day of the Year
0
0.5
1
1.5
2
2.5
Tota
l N (m
g/L)
2005 DO-60: Moffit 1 South
1 53 105 157 209 261 313 365Day of the Year
0
0.5
1
1.5
2
2.5
Tota
l N (m
g/L)
2006 DO-60: Moffit 1 South
1 53 105 157 209 261 313 365Day of the Year
0
0.5
1
1.5
2
2.5
Tota
l N (m
g/L)
2007DO-60: Moffit 1 South
Appendix I Page 74 of 1262 759

32 of 40
1 53 105 157 209 261 313 365Day of the Year
0
1
2
3
4
Tota
l N (m
g/L)
2005 DO-61: Deadman's Slough
1 53 105 157 209 261 313 365Day of the Year
0
1
2
3
4
Tota
l N (m
g/L)
2006 DO-61: Deadman's Slough
1 53 105 157 209 261 313 365Day of the Year
0
1
2
3
4
Tota
l N (m
g/L)
2007DO-61: Deadman's Slough
Appendix I Page 75 of 1262 760

33 of 40
1 53 105 157 209 261 313 365Day of the Year
0
0.5
1
1.5
2
2.5
Tota
l N (m
g/L)
2005 DO-62: Mallard Slough
1 53 105 157 209 261 313 365Day of the Year
0
0.5
1
1.5
2
2.5
Tota
l N (m
g/L)
2006DO-62: Mallard Slough
1 53 105 157 209 261 313 365Day of the Year
0
0.5
1
1.5
2
2.5
Tota
l N (m
g/L)
2007DO-62: Mallard Slough
Appendix I Page 76 of 1262 761

34 of 40
1 53 105 157 209 261 313 365Day of the Year
0
2
4
6
Tota
l N (m
g/L)
2005DO-63: Inlet C Canal
1 53 105 157 209 261 313 365Day of the Year
0
2
4
6
Tota
l N (m
g/L)
2006DO-63: Inlet C Canal
1 53 105 157 209 261 313 365Day of the Year
0
2
4
6
Tota
l N (m
g/L)
2007DO-63: Inlet C Canal
Appendix I Page 77 of 1262 762

35 of 40
1 53 105 157 209 261 313 365Day of the Year
0
2
4
6
Tota
l N (m
g/L)
2005DO-80: South Marsh 1 Inlet
1 53 105 157 209 261 313 365Day of the Year
0
2
4
6
Tota
l N (m
g/L)
2006DO-80: South Marsh 1 Inlet
1 53 105 157 209 261 313 365Day of the Year
0
2
4
6
Tota
l N (m
g/L)
2007DO-80: South Marsh 1 Inlet
Appendix I Page 78 of 1262 763

36 of 40
1 53 105 157 209 261 313 365Day of the Year
0
1
2
3
4
5
Tota
l N (m
g/L)
2005DO-81: South Marsh 1 Outlet
1 53 105 157 209 261 313 365Day of the Year
0
1
2
3
4
5
Tota
l N (m
g/L)
2006DO-81: South Marsh 1 Outlet
1 53 105 157 209 261 313 365Day of the Year
0
1
2
3
4
5
Tota
l N (m
g/L)
2007DO-81: South Marsh 1 Outlet
Appendix I Page 79 of 1262 764

37 of 40
1 53 105 157 209 261 313 365Day of the Year
0
0.5
1
1.5
2
2.5
Tota
l N (m
g/L)
2005 DO-82: South Marsh 3 Inlet
1 53 105 157 209 261 313 365Day of the Year
0
0.5
1
1.5
2
2.5
Tota
l N (m
g/L)
2006DO-82: South Marsh 3 Inlet
1 53 105 157 209 261 313 365Day of the Year
0
0.5
1
1.5
2
2.5
Tota
l N (m
g/L)
2007DO-82: South Marsh 3 Inlet
Appendix I Page 80 of 1262 765

38 of 40
1 53 105 157 209 261 313 365Day of the Year
0
0.4
0.8
1.2
1.6
2
Tota
l N (m
g/L)
2005 DO-83: South Marsh 3 Outlet
1 53 105 157 209 261 313 365Day of the Year
0
0.4
0.8
1.2
1.6
2
Tota
l N (m
g/L)
2006DO-83: South Marsh 3 Outlet
1 53 105 157 209 261 313 365Day of the Year
0
0.4
0.8
1.2
1.6
2
Tota
l N (m
g/L)
2007DO-83: South Marsh 3 Outlet
Appendix I Page 81 of 1262 766

39 of 40
1 53 105 157 209 261 313 365Day of the Year
0
2
4
6
8
Tota
l N (m
g/L)
2005DO-95: Ramona Lake Entrance
1 53 105 157 209 261 313 365Day of the Year
0
2
4
6
8
Tota
l N (m
g/L)
2006DO-95: Ramona Lake Entrance
1 53 105 157 209 261 313 365Day of the Year
0
2
4
6
8
Tota
l N (m
g/L)
2007DO-95: Ramona Lake Entrance
Appendix I Page 82 of 1262 767
Temporal Plots of 2005-2007 Sulfate Data from the Upstream San Joaquin River
Chelsea Spier1
Remie Burks1
Sharon Borglin1
Randy Dahlgren2
Jeremy Hanlon1
Justin Graham1
William Stringfellow1
February 2008
1Environmental Engineering Research Program School of Engineering & Computer Sciences
University of the Pacific 3601 Pacific Avenue, Sears Hall
Stockton, CA 95211 2UC Davis, Davis, CA
Appendix I Page 83 of 1262 768

1 of 39
Introduction The San Joaquin River (SJR) supports one of the most productive agricultural regions in the world and its productivity is heavily dependant on irrigated agriculture. A consequence of irrigated agriculture is the production of return flows conveyed down gradient drains that eventually discharge to surface waters. Agricultural drainage may have significant nutrient load and can impact algae growth and general water quality in the SJR. Individual farmers and agricultural organizations, such as drainage authorities, are in need of tools to manage the environmental impacts of agricultural activities (Stringfellow, 2008).
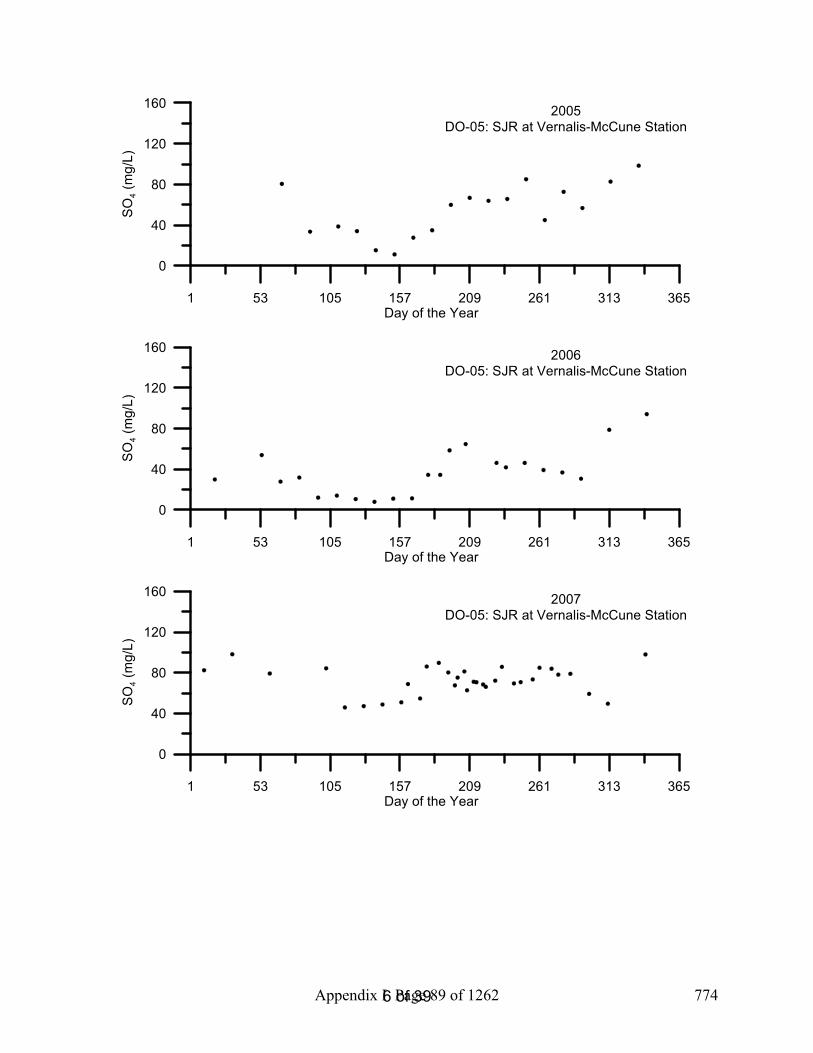
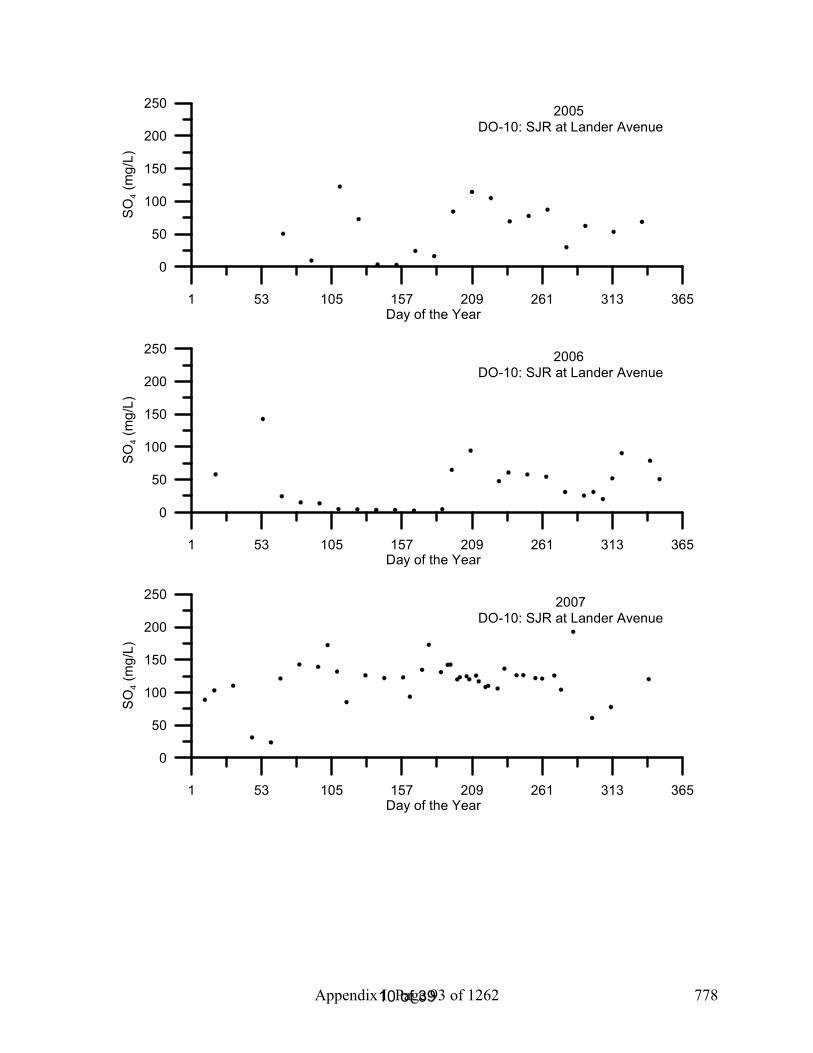
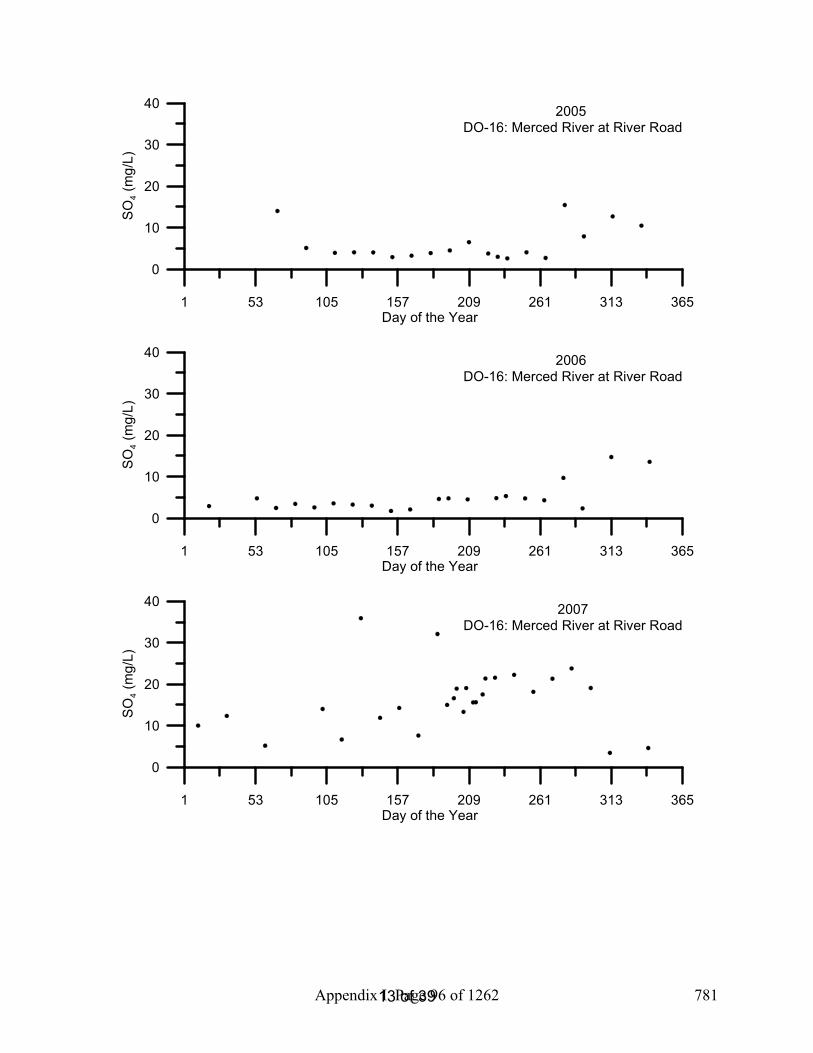
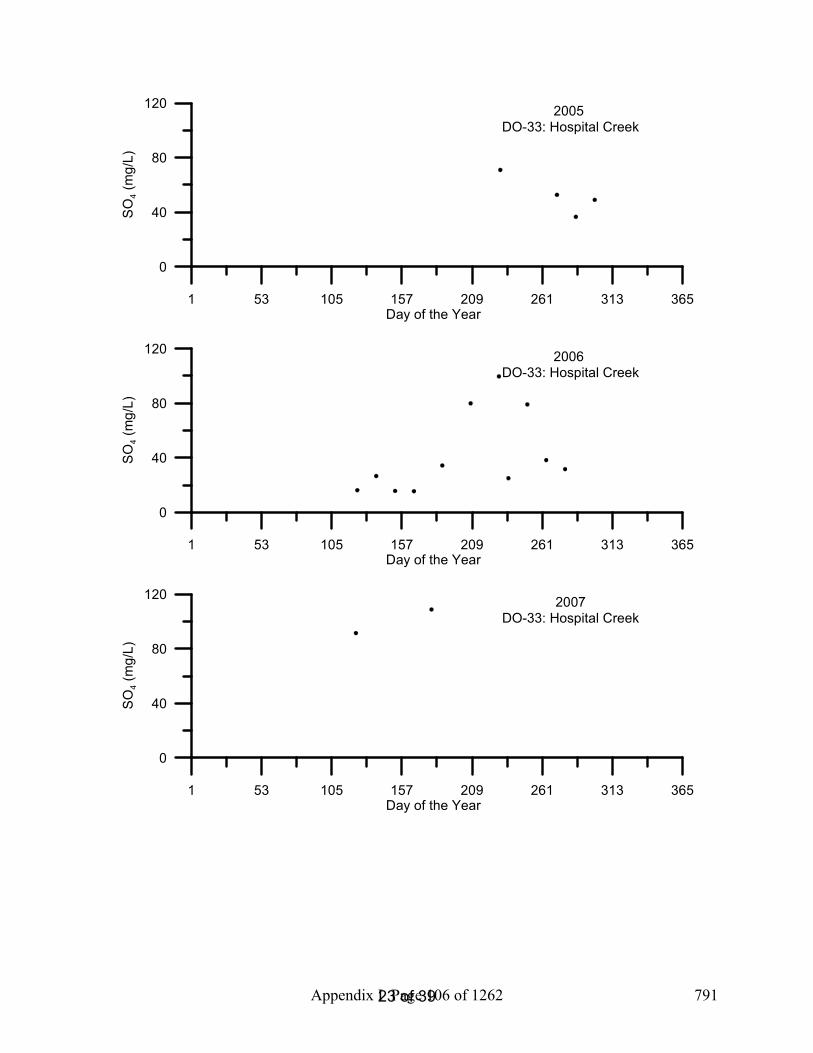
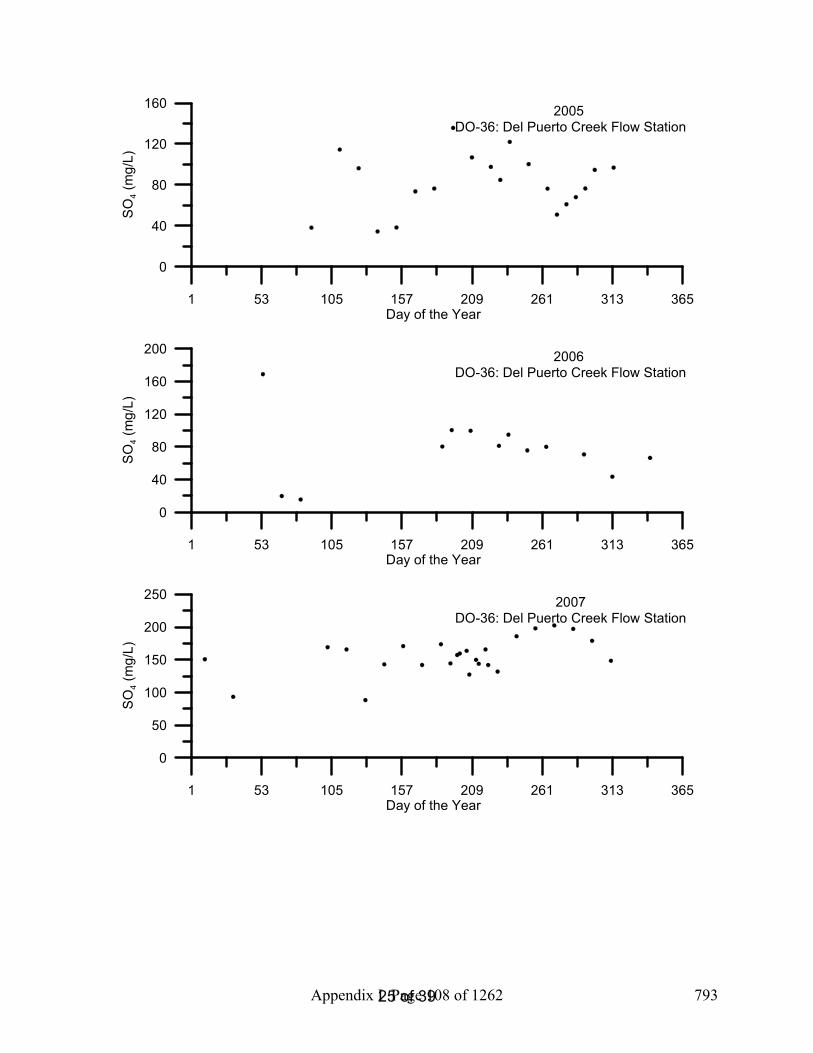
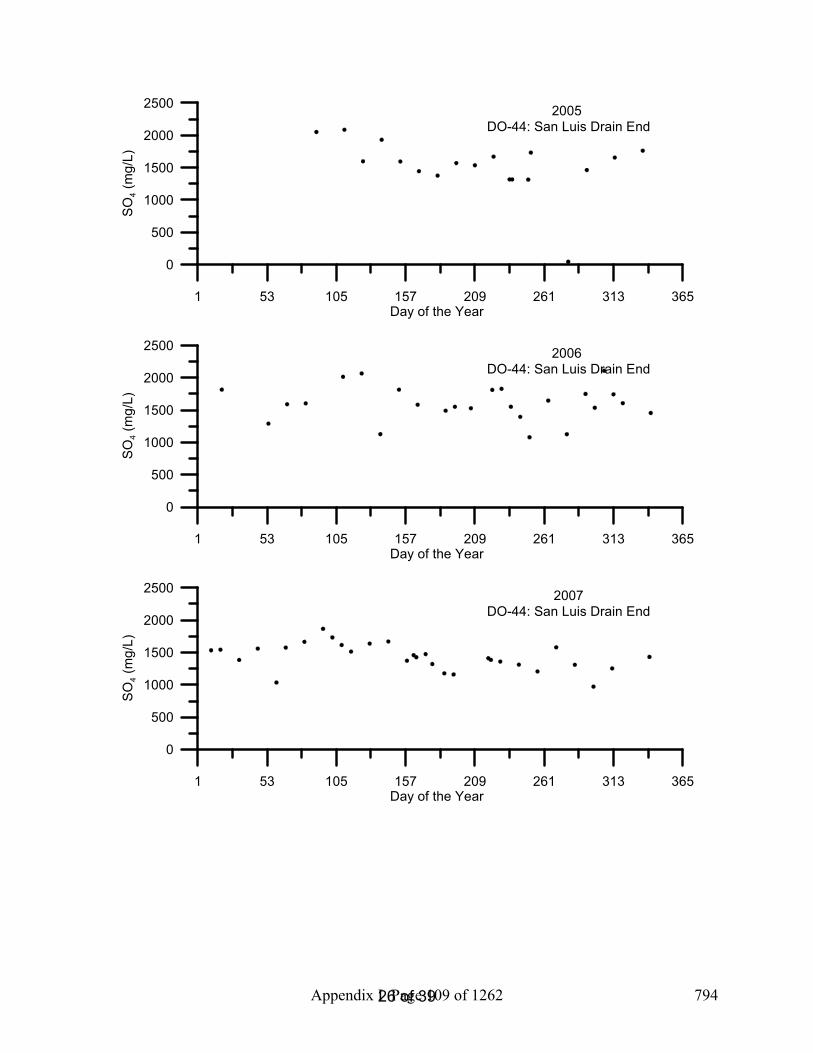
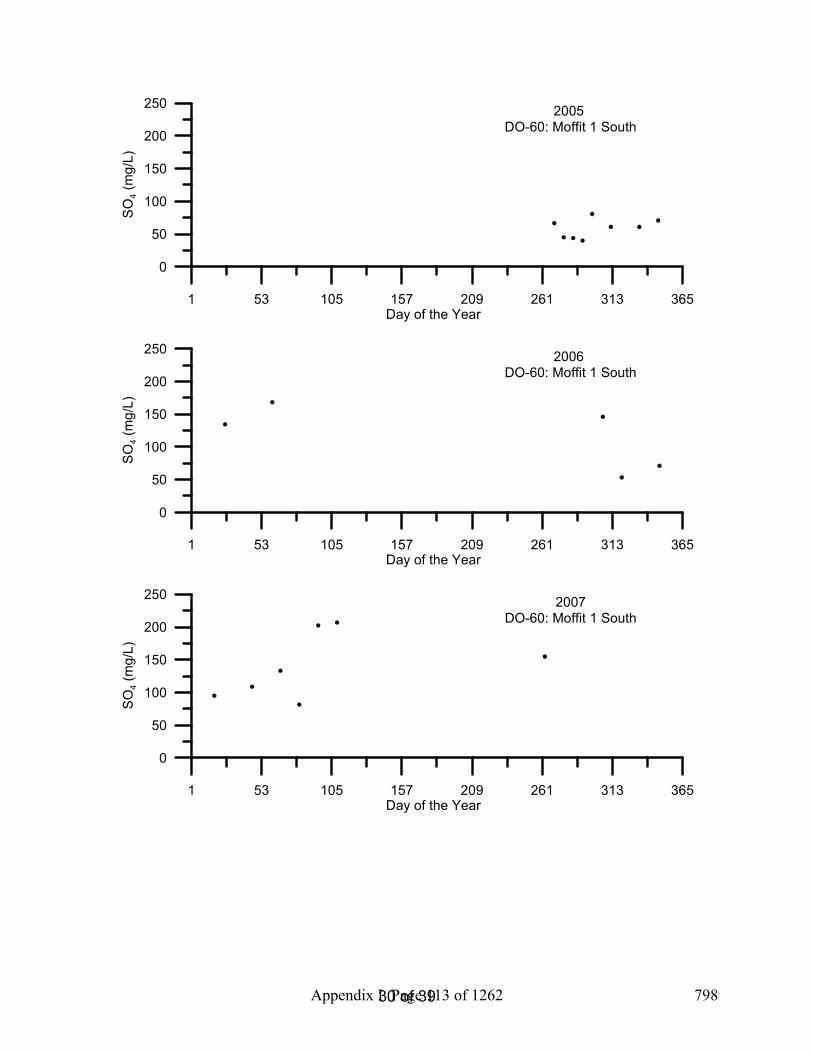
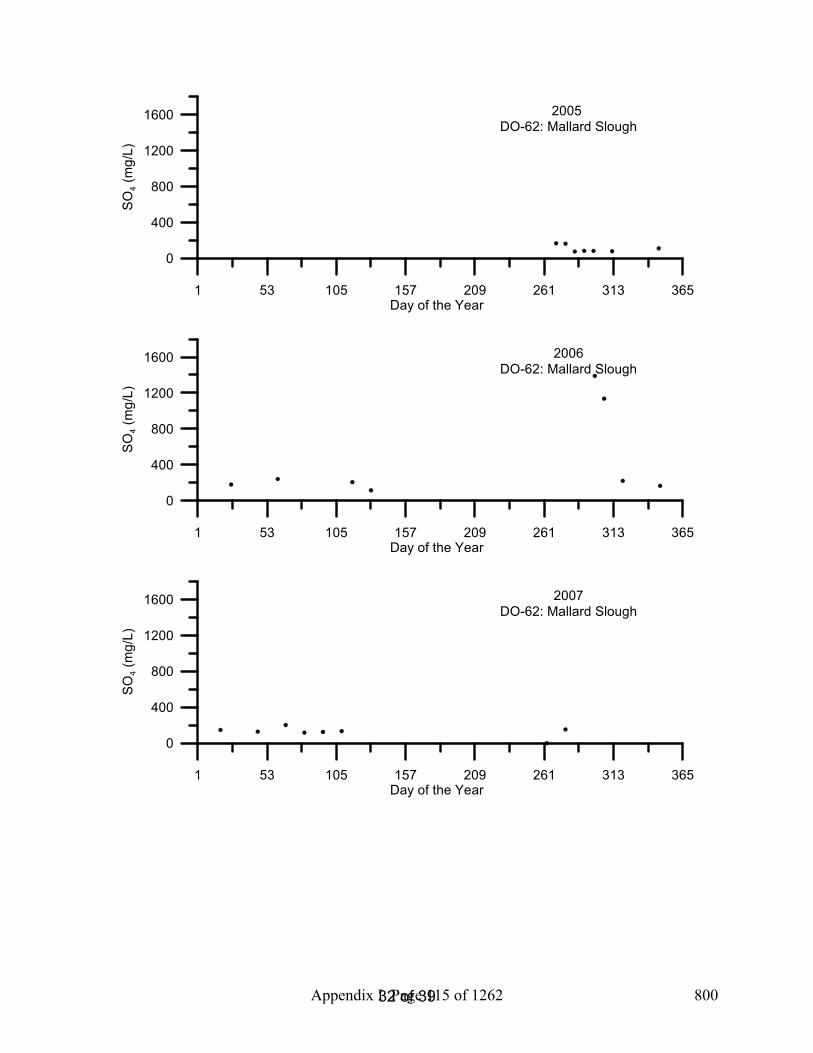
For the years 2005 through 2007, sites throughout the San Joaquin Valley watershed were sampled to assess the overall water quality in the region. One thousand nine hundred and ninety-six (1996) individual surface water samples were collected and analyzed and WQ was assessed at 113 locations in the SJR basin (Borglin et al., 2008). Samples were processed and analyzed by the Environmental Engineering Research Program (EERP) laboratory at the University of the Pacific as well as at the University of California, Davis, Dahlgren Lab. This report includes temporal graphs of sulfate (SO4) data analyzed by the UCD Dahlgren laboratory between 2005 and 2007.
MethodsDepth integrated field samples were colleted during 2005-2007 in the upper San Joaquin River in accordance with EERP Field Standard Operating Procedures Protocol Book (Graham 2008). Water samples were colleted in glass 1000 mL bottles (Wheaton Science Products, Millville, NJ), 1000 mL HDPE Trace-Clean narrow mouth plastic bottles (VWR International), 250 mL HDPE Trace-Clean wide mouth plastic bottles (VWR International) as well as 40 mL trace clean vials with PTFE septa (IChem, Rockwood, TN). Bottles were labeled with the appropriate sample number, site name and sampling date. All bottles were rinsed with sample water prior to sample collection. Some sites required a bucket to collect sample water because of accessibility from a high bridge or platform. For these sites, the bucket was pre-rinsed with sample water and sample bottles were filled using a rinsed funnel. Care was taken to distribute water simultaneously to all sample bottles (rather than sequentially). Samples were immediately stored at 4°C after sampling (cooler temperature was recorded in the lab upon delivery) and transported to the EERP lab on the day of sampling.
Within 24 hours of collection samples were transported from the EERP laboratory to the UCD laboratory for analysis, during this time period samples were stored in coolers at 4°C.
Ion chromatography was utilized for measuring SO42- using a Dionex ICS-2000 Ion
Chromatograph (Dionex Corporation, Sunnyvale, CA) (SM-4110 B). The reportable limit for this method is 0.02 mg/L SO4
2- .
Appendix I Page 84 of 1262 769

2 of 39
Results/DiscussionSamples were measured ranging from 0.0-2108 mg/L SO4. The average concentration of SO4 in water samples collected was 213.9 mg/L SO4. These temporal plots (Figures 3-104) created an easy visual way to find outliers and double check data entry for possible mistakes.
References American Public Health Association (APHA). 2005. Standard Methods for the Examination of
Water and Wastewater, 21st Edition. American Public Health Association, Washington, DC.
Borglin, S., W. Stringfellow, J. Hanlon. 2005. Standard Operating Procedures for the Up-Stream Dissolved Oxygen TMDL Project. LBNL/Pub-937.
Borglin, S., Burks, R., Hanlon, J., Graham, J., Spier, C., Stringfellow, W., and Dahlgren, R., (2008) Methods overview, quality assurance, and quality control, University of the Pacific, Stockton, CA
Borglin, S.E., Burks, R.D., Hanlon, J.S., Stringfellow, W.T. (2008) EERP Lab Protocol Book, University of the Pacific, Stockton, CA.
Graham, J., Hanlon, J.S., Stringfellow, W.T., (2008) EERP Field Protocol Book, University of the Pacific, Stockton, CA.
Stringfellow, W.T., et al., (2008) Evaluation of Vegitated Ditches, Ponds, and Wetlands as BMPs for Mitigating the Water Quality Impact of Irrigated Agriculture in the San Joaquin Valley, University of the Pacific, Stockton, CA
YSI Environmental Operations Manual (2005) 6-Series Environmental Monitoring Systems, Yellow Springs, OH.
Appendix I Page 85 of 1262 770

3 of 39
Table 1: EERP Sampling Site List DO Number
Site Name Type
4 SJR at Mossdale Core sites 5 SJR at Vernalis-McCune Station (River Club) Core sites, BMP 6 SJR at Maze Core sites, BMP 7 SJR at Patterson Core sites, BMP 8 SJR at Crows Landing Core sites, BMP
10 SJR at Lander Avenue Core sites 12 Stanislaus River at Caswell Park Core sites 14 Tuolumne River at Shiloh Bridge Core sites 16 Merced River at River Road Core sites 18 Mud Slough near Gustine Core sites, Wetland 19 Salt Slough at Lander Avenue Core sites, Wetland 20 Los Banos Creek Flow Station Core sites, Wetland 21 Orestimba Creek at River Road Core sites, BMP 23 Modesto ID Lateral 5 to Tuolumne Core sites 25 Modesto ID Main Drain to Stan. R. via Miller Lake Core sites 28 Turlock ID Westport Drain Flow station Core sites 29 Turlock ID Harding Drain Core sites 30 Turlock ID Lateral 6 & 7 at Levee Core sites 33 Hospital Creek Intermittent, BMP 34 Ingram Creek Core sites, BMP 36 Del Puerto Creek Flow Station Core sites, BMP 44 San Luis Drain End Core sites 53 Salt Slough at Wolfsen Road Wetland 57 Ramona Lake Drain Core sites, BMP 59 SJR Laird Park Core sites 60 Moffit 1 South Wetland 61 Deadman's Slough Wetland 62 Mallard Slough Wetland 63 Inlet C Canal Wetland 80 South Marsh-1-Inlet Wetland 81 South Marsh-1-Outlet Wetland 82 South Marsh-3-Inlet Wetland 83 South Marsh-3-Outlet Wetland 95 Ramona drain at Ramona Lake BMP, Intermittent
Appendix I Page 86 of 1262 771

4 of 39
Figure 1: EERP Sampling Site Map of SJR Watershed and Tributaries
Appendix I Page 87 of 1262 772

5 of 39
Figures 2 -103: Temporal Plots of SO4By Site ID
1 53 105 157 209 261 313 365Day of the Year
0
40
80
120S
O4 (
mg/
L)2005
DO-04: SJR at Mossdale
1 53 105 157 209 261 313 365Day of the Year
0
40
80
120
SO
4 (m
g/L)
2006 DO-04: SJR at Mossdale
1 53 105 157 209 261 313 365Day of the Year
0
40
80
120
SO
4 (m
g/L)
2007 DO-04: SJR at Mossdale
Appendix I Page 88 of 1262 773
6 of 39
1 53 105 157 209 261 313 365Day of the Year
0
40
80
120
160
SO
4 (m
g/L)
2005 DO-05: SJR at Vernalis-McCune Station
1 53 105 157 209 261 313 365Day of the Year
0
40
80
120
160
SO
4 (m
g/L)
2006 DO-05: SJR at Vernalis-McCune Station
1 53 105 157 209 261 313 365Day of the Year
0
40
80
120
160
SO
4 (m
g/L)
2007 DO-05: SJR at Vernalis-McCune Station
Appendix I Page 89 of 1262 774

7 of 39
1 53 105 157 209 261 313 365Day of the Year
0
40
80
120
160
SO
4 (m
g/L)
2005DO-06: SJR at Maze
1 53 105 157 209 261 313 365Day of the Year
0
40
80
120
160
SO
4 (m
g/L)
2006DO-06: SJR at Maze
1 53 105 157 209 261 313 365Day of the Year
0
40
80
120
160
SO
4 (m
g/L)
2007 DO-06: SJR at Maze
Appendix I Page 90 of 1262 775

8 of 39
1 53 105 157 209 261 313 365Day of the Year
0
100
200
300
SO
4 (m
g/L)
2005 DO-07: SJR at Patterson
1 53 105 157 209 261 313 365Day of the Year
0
100
200
300
SO
4 (m
g/L)
2006 DO-07: SJR at Patterson
1 53 105 157 209 261 313 365Day of the Year
0
100
200
300
SO
4 (m
g/L)
2007 DO-07: SJR at Patterson
Appendix I Page 91 of 1262 776

9 of 39
1 53 105 157 209 261 313 365Day of the Year
0
100
200
300
SO
4 (m
g/L)
2005 DO-08: SJR at Crows Landing
1 53 105 157 209 261 313 365Day of the Year
0
100
200
300
SO
4 (m
g/L)
2006 DO-08: SJR at Crows Landing
1 53 105 157 209 261 313 365Day of the Year
0
100
200
300
SO
4 (m
g/L)
2007DO-08: SJR at Crows Landing
Appendix I Page 92 of 1262 777
10 of 39
1 53 105 157 209 261 313 365Day of the Year
0
50
100
150
200
250
SO
4 (m
g/L)
2005 DO-10: SJR at Lander Avenue
1 53 105 157 209 261 313 365Day of the Year
0
50
100
150
200
250
SO
4 (m
g/L)
2006 DO-10: SJR at Lander Avenue
1 53 105 157 209 261 313 365Day of the Year
0
50
100
150
200
250
SO
4 (m
g/L)
2007DO-10: SJR at Lander Avenue
Appendix I Page 93 of 1262 778

11 of 39
1 53 105 157 209 261 313 365Day of the Year
0
4
8
12
SO
4 (m
g/L)
2005 DO-12: Stanislaus River at Caswell Park
1 53 105 157 209 261 313 365Day of the Year
0
4
8
12
SO
4 (m
g/L)
2006 DO-12: Stanislaus River at Caswell Park
1 53 105 157 209 261 313 365Day of the Year
0
4
8
12
SO
4 (m
g/L)
2007DO-12: Stanislaus River at Caswell Park
Appendix I Page 94 of 1262 779

12 of 39
1 53 105 157 209 261 313 365Day of the Year
0
4
8
12
16S
O4 (
mg/
L)2005
DO-14: Tuolumne River at Shiloh Bridge
1 53 105 157 209 261 313 365Day of the Year
0
4
8
12
16
SO
4 (m
g/L)
2006 DO-14: Tuolumne River at Shiloh Bridge
1 53 105 157 209 261 313 365Day of the Year
0
4
8
12
16
SO
4 (m
g/L)
2007DO-14: Tuolumne River at Shiloh Bridge
Appendix I Page 95 of 1262 780
13 of 39
1 53 105 157 209 261 313 365Day of the Year
0
10
20
30
40
SO
4 (m
g/L)
2005 DO-16: Merced River at River Road
1 53 105 157 209 261 313 365Day of the Year
0
10
20
30
40
SO
4 (m
g/L)
2006 DO-16: Merced River at River Road
1 53 105 157 209 261 313 365Day of the Year
0
10
20
30
40
SO
4 (m
g/L)
2007DO-16: Merced River at River Road
Appendix I Page 96 of 1262 781

14 of 39
1 53 105 157 209 261 313 365Day of the Year
0
400
800
1200
1600S
O4 (
mg/
L)2005
DO-18: Mud Slough near Gustine
1 53 105 157 209 261 313 365Day of the Year
0
400
800
1200
1600
SO
4 (m
g/L)
2006 DO-18: Mud Slough near Gustine
1 53 105 157 209 261 313 365Day of the Year
0
400
800
1200
1600
SO
4 (m
g/L)
2007DO-18: Mud Slough near Gustine
Appendix I Page 97 of 1262 782

15 of 39
1 53 105 157 209 261 313 365Day of the Year
0
100
200
300
400
SO
4 (m
g/L)
2005 DO-19: Salt Slough at Lander Avenue
1 53 105 157 209 261 313 365Day of the Year
0
100
200
300
400
SO
4 (m
g/L)
2006 DO-19: Salt Slough at Lander Avenue
1 53 105 157 209 261 313 365Day of the Year
0
200
400
600
800
1000
SO
4 (m
g/L)
2007DO-19: Salt Slough at Lander Avenue
Appendix I Page 98 of 1262 783

16 of 39
1 53 105 157 209 261 313 365Day of the Year
0
100
200
300
400
500
SO
4 (m
g/L)
2005 DO-20: Los Banos Creek at Highway 140
1 53 105 157 209 261 313 365Day of the Year
0
100
200
300
400
500
SO
4 (m
g/L)
2006 DO-20: Los Banos Creek at Highway 140
1 53 105 157 209 261 313 365Day of the Year
0
100
200
300
400
500
SO
4 (m
g/L)
2007DO-20: Los Banos Creek at Highway 140
Appendix I Page 99 of 1262 784

17 of 39
1 53 105 157 209 261 313 365Day of the Year
0
50
100
150
200
250
SO
4 (m
g/L)
2005 DO-21: Orestimba Creek at River Road
1 53 105 157 209 261 313 365Day of the Year
0
50
100
150
200
250
SO
4 (m
g/L)
2006 DO-21: Orestimba Creek at River Road
1 53 105 157 209 261 313 365Day of the Year
0
50
100
150
200
250
SO
4 (m
g/L)
2007DO-21: Orestimba Creek at River Road
Appendix I Page 100 of 1262 785

18 of 39
1 53 105 157 209 261 313 365Day of the Year
0
20
40
60
80
SO
4 (m
g/L)
2005 DO-23: Modesto ID Lateral 5 to Tuolumne
1 53 105 157 209 261 313 365Day of the Year
0
20
40
60
80
SO
4 (m
g/L)
2006 DO-23: Modesto ID Lateral 5 to Tuolumne
1 53 105 157 209 261 313 365Day of the Year
0
20
40
60
80
SO
4 (m
g/L)
2007DO-23: Modesto ID Lateral 5 to Tuolumne
Appendix I Page 101 of 1262 786

19 of 39
1 53 105 157 209 261 313 365Day of the Year
0
10
20
30
40
SO
4 (m
g/L)
2005 DO-25: MID Main Drain to Stan. R. via Miller Lake
1 53 105 157 209 261 313 365Day of the Year
0
10
20
30
40
SO
4 (m
g/L)
2006 DO-25: MID Main Drain to Stan. R. via Miller Lake
1 53 105 157 209 261 313 365Day of the Year
0
40
80
120
160
200
SO
4 (m
g/L)
2007DO-25: MID Main Drain to Stan. R. via Miller Lake
Appendix I Page 102 of 1262 787

20 of 39
1 53 105 157 209 261 313 365Day of the Year
0
20
40
60
80
100
SO
4 (m
g/L)
2005 DO-28: Turlock ID Westport Drain Flow Station
1 53 105 157 209 261 313 365Day of the Year
0
20
40
60
80
100
SO
4 (m
g/L)
2006 DO-28: Turlock ID Westport Drain Flow Station
1 53 105 157 209 261 313 365Day of the Year
0
20
40
60
80
100
SO
4 (m
g/L)
2007DO-28: Turlock ID Westport Drain Flow Station
Appendix I Page 103 of 1262 788

21 of 39
1 53 105 157 209 261 313 365Day of the Year
0
20
40
60
80
100
SO
4 (m
g/L)
2005 DO-29: Turlock ID Harding Drain
1 53 105 157 209 261 313 365Day of the Year
0
20
40
60
80
100
SO
4 (m
g/L)
2006 DO-29: Turlock ID Harding Drain
1 53 105 157 209 261 313 365Day of the Year
0
20
40
60
80
100
SO
4 (m
g/L)
2007DO-29: Turlock ID Harding Drain
Appendix I Page 104 of 1262 789

22 of 39
1 53 105 157 209 261 313 365Day of the Year
0
20
40
60
80
100
SO
4 (m
g/L)
2005 DO-30: TID Lat 6 & 7 at River Rd.
1 53 105 157 209 261 313 365Day of the Year
0
20
40
60
80
100
SO
4 (m
g/L)
2006 DO-30: TID Lat 6 & 7 at River Rd.
1 53 105 157 209 261 313 365Day of the Year
0
20
40
60
80
100
SO
4 (m
g/L)
2007DO-30: TID Lat 6 & 7 at River Rd.
Appendix I Page 105 of 1262 790
23 of 39
1 53 105 157 209 261 313 365Day of the Year
0
40
80
120
SO
4 (m
g/L)
2005DO-33: Hospital Creek
1 53 105 157 209 261 313 365Day of the Year
0
40
80
120
SO
4 (m
g/L)
2006DO-33: Hospital Creek
1 53 105 157 209 261 313 365Day of the Year
0
40
80
120
SO
4 (m
g/L)
2007DO-33: Hospital Creek
Appendix I Page 106 of 1262 791

24 of 39
1 53 105 157 209 261 313 365Day of the Year
0
100
200
300
400
SO
4 (m
g/L)
2005 DO-34: Ingram Creek Flow Station
1 53 105 157 209 261 313 365Day of the Year
0
100
200
300
400
SO
4 (m
g/L)
2006 DO-34: Ingram Creek Flow Station
1 53 105 157 209 261 313 365Day of the Year
0
100
200
300
400
SO
4 (m
g/L)
2007DO-34: Ingram Creek Flow Station
Appendix I Page 107 of 1262 792
25 of 39
1 53 105 157 209 261 313 365Day of the Year
0
40
80
120
160
SO
4 (m
g/L)
2005 DO-36: Del Puerto Creek Flow Station
1 53 105 157 209 261 313 365Day of the Year
0
40
80
120
160
200
SO
4 (m
g/L)
2006 DO-36: Del Puerto Creek Flow Station
1 53 105 157 209 261 313 365Day of the Year
0
50
100
150
200
250
SO
4 (m
g/L)
2007DO-36: Del Puerto Creek Flow Station
Appendix I Page 108 of 1262 793
26 of 39
1 53 105 157 209 261 313 365Day of the Year
0
500
1000
1500
2000
2500
SO
4 (m
g/L)
2005 DO-44: San Luis Drain End
1 53 105 157 209 261 313 365Day of the Year
0
500
1000
1500
2000
2500
SO
4 (m
g/L)
2006 DO-44: San Luis Drain End
1 53 105 157 209 261 313 365Day of the Year
0
500
1000
1500
2000
2500
SO
4 (m
g/L)
2007DO-44: San Luis Drain End
Appendix I Page 109 of 1262 794

27 of 39
1 53 105 157 209 261 313 365Day of the Year
0
100
200
300
400
SO
4 (m
g/L)
2005 DO-53: Salt Slough at Wolfsen Road
1 53 105 157 209 261 313 365Day of the Year
0
100
200
300
400
SO
4 (m
g/L)
2006 DO-53: Salt Slough at Wolfsen Road
1 53 105 157 209 261 313 365Day of the Year
0
100
200
300
400
SO
4 (m
g/L)
2007DO-53: Salt Slough at Wolfsen Road
Appendix I Page 110 of 1262 795

28 of 39
1 53 105 157 209 261 313 365Day of the Year
0
100
200
300
400
SO
4 (m
g/L)
2005 DO-57: Ramona Lake Drain at Levee
1 53 105 157 209 261 313 365Day of the Year
0
100
200
300
400
SO
4 (m
g/L)
2006 DO-57: Ramona Lake Drain at Levee
1 53 105 157 209 261 313 365Day of the Year
0
100
200
300
400
SO
4 (m
g/L)
2007DO-57: Ramona Lake Drain at Levee
Appendix I Page 111 of 1262 796

29 of 39
1 53 105 157 209 261 313 365Day of the Year
0
500
1000
1500
2000
2500
SO
4 (m
g/L)
2005 DO-59: SJR Laird Park
1 53 105 157 209 261 313 365Day of the Year
0
500
1000
1500
2000
2500
SO
4 (m
g/L)
2006 DO-59: SJR Laird Park
1 53 105 157 209 261 313 365Day of the Year
0
500
1000
1500
2000
2500
SO
4 (m
g/L)
2007DO-59: SJR Laird Park
Appendix I Page 112 of 1262 797
30 of 39
1 53 105 157 209 261 313 365Day of the Year
0
50
100
150
200
250
SO
4 (m
g/L)
2005 DO-60: Moffit 1 South
1 53 105 157 209 261 313 365Day of the Year
0
50
100
150
200
250
SO
4 (m
g/L)
2006 DO-60: Moffit 1 South
1 53 105 157 209 261 313 365Day of the Year
0
50
100
150
200
250
SO
4 (m
g/L)
2007DO-60: Moffit 1 South
Appendix I Page 113 of 1262 798

31 of 39
1 53 105 157 209 261 313 365Day of the Year
0
100
200
300
SO
4 (m
g/L)
2005 DO-61: Deadman's Slough
1 53 105 157 209 261 313 365Day of the Year
0
100
200
300
SO
4 (m
g/L)
2006 DO-61: Deadman's Slough
1 53 105 157 209 261 313 365Day of the Year
0
100
200
300
SO
4 (m
g/L)
2007DO-61: Deadman's Slough
Appendix I Page 114 of 1262 799
32 of 39
1 53 105 157 209 261 313 365Day of the Year
0
400
800
1200
1600S
O4 (
mg/
L)2005
DO-62: Mallard Slough
1 53 105 157 209 261 313 365Day of the Year
0
400
800
1200
1600
SO
4 (m
g/L)
2006DO-62: Mallard Slough
1 53 105 157 209 261 313 365Day of the Year
0
400
800
1200
1600
SO
4 (m
g/L)
2007DO-62: Mallard Slough
Appendix I Page 115 of 1262 800

33 of 39
1 53 105 157 209 261 313 365Day of the Year
0
50
100
150
200
250
SO
4 (m
g/L)
2005 DO-63: Inlet C Canal
1 53 105 157 209 261 313 365Day of the Year
0
50
100
150
200
250
SO
4 (m
g/L)
2006DO-63: Inlet C Canal
1 53 105 157 209 261 313 365Day of the Year
0
50
100
150
200
250
SO
4 (m
g/L)
2007DO-63: Inlet C Canal
Appendix I Page 116 of 1262 801

34 of 39
1 53 105 157 209 261 313 365Day of the Year
0
40
80
120
160
SO
4 (m
g/L)
2005 DO-80: South Marsh 1 Inlet
1 53 105 157 209 261 313 365Day of the Year
0
40
80
120
160
SO
4 (m
g/L)
2006DO-80: South Marsh 1 Inlet
1 53 105 157 209 261 313 365Day of the Year
0
40
80
120
160
SO
4 (m
g/L)
2007DO-80: South Marsh 1 Inlet
Appendix I Page 117 of 1262 802

35 of 39
1 53 105 157 209 261 313 365Day of the Year
0
40
80
120
SO
4 (m
g/L)
2005 DO-81: South Marsh 1 Outlet
1 53 105 157 209 261 313 365Day of the Year
0
40
80
120
SO
4 (m
g/L)
2006DO-81: South Marsh 1 Outlet
1 53 105 157 209 261 313 365Day of the Year
0
40
80
120
SO
4 (m
g/L)
2007DO-81: South Marsh 1 Outlet
Appendix I Page 118 of 1262 803

36 of 39
1 53 105 157 209 261 313 365Day of the Year
0
100
200
300
SO
4 (m
g/L)
2005 DO-82: South Marsh 3 Inlet
1 53 105 157 209 261 313 365Day of the Year
0
100
200
300
SO
4 (m
g/L)
2006DO-82: South Marsh 3 Inlet
1 53 105 157 209 261 313 365Day of the Year
0
100
200
300
SO
4 (m
g/L)
2007DO-82: South Marsh 3 Inlet
Appendix I Page 119 of 1262 804

37 of 39
1 53 105 157 209 261 313 365Day of the Year
0
100
200
300
400
SO
4 (m
g/L)
2005 DO-83: South Marsh 3 Outlet
1 53 105 157 209 261 313 365Day of the Year
0
100
200
300
400
SO
4 (m
g/L)
2006DO-83: South Marsh 3 Outlet
1 53 105 157 209 261 313 365Day of the Year
0
100
200
300
400
SO
4 (m
g/L)
2007DO-83: South Marsh 3 Outlet
Appendix I Page 120 of 1262 805

38 of 39
1 53 105 157 209 261 313 365Day of the Year
0
100
200
300
400
SO
4 (m
g/L)
2005 DO-95: Ramona Lake Entrance
1 53 105 157 209 261 313 365Day of the Year
0
100
200
300
400
SO
4 (m
g/L)
2006DO-95: Ramona Lake Entrance
1 53 105 157 209 261 313 365Day of the Year
0
100
200
300
400
SO
4 (m
g/L)
2007DO-95: Ramona Lake Entrance
Appendix I Page 121 of 1262 806

Temporal Plots of 2005-2007 Sodium Data from the Upstream San Joaquin River
Chelsea Spier1
Remie Burks1
Sharon Borglin1
Randy Dahlgren2
Jeremy Hanlon1
Justin Graham1
William Stringfellow1
February 2008
1Environmental Engineering Research Program School of Engineering & Computer Sciences
University of the Pacific 3601 Pacific Avenue, Sears Hall
Stockton, CA 95211 2UC Davis, Davis, CA
Appendix I Page 122 of 1262 807

1 of 39
Introduction The San Joaquin River (SJR) supports one of the most productive agricultural regions in the world and its productivity is heavily dependant on irrigated agriculture. A consequence of irrigated agriculture is the production of return flows conveyed down gradient drains that eventually discharge to surface waters. Agricultural drainage may have significant nutrient load and can impact algae growth and general water quality in the SJR. Individual farmers and agricultural organizations, such as drainage authorities, are in need of tools to manage the environmental impacts of agricultural activities (Stringfellow, 2008).
For the years 2005 through 2007, sites throughout the San Joaquin Valley watershed were sampled to assess the overall water quality in the region. One thousand nine hundred and ninety-six (1996) individual surface water samples were collected and analyzed and WQ was assessed at 113 locations in the SJR basin (Borglin et al., 2008). Samples were processed and analyzed by the Environmental Engineering Research Program (EERP) laboratory at the University of the Pacific as well as at the University of California, Davis, Dahlgren Lab. This report includes temporal graphs of sodium (Na) data analyzed by the UCD Dahlgren laboratory between 2005 and 2007.
MethodsDepth integrated field samples were colleted during 2005-2007 in the upper San Joaquin River in accordance with EERP Field Standard Operating Procedures Protocol Book (Graham 2008). Water samples were colleted in glass 1000 mL bottles (Wheaton Science Products, Millville, NJ), 1000 mL HDPE Trace-Clean narrow mouth plastic bottles (VWR International), 250 mL HDPE Trace-Clean wide mouth plastic bottles (VWR International) as well as 40 mL trace clean vials with PTFE septa (IChem, Rockwood, TN). Bottles were labeled with the appropriate sample number, site name and sampling date. All bottles were rinsed with sample water prior to sample collection. Some sites required a bucket to collect sample water because of accessibility from a high bridge or platform. For these sites, the bucket was pre-rinsed with sample water and sample bottles were filled using a rinsed funnel. Care was taken to distribute water simultaneously to all sample bottles (rather than sequentially). Samples were immediately stored at 4°C after sampling (cooler temperature was recorded in the lab upon delivery) and transported to the EERP lab on the day of sampling.
Within 24 hours of collection samples were transported from the EERP laboratory to the UCD laboratory for analysis, during this time period samples were stored in coolers at 4°C.
Ion chromatography was utilized for measuring Na+ using a Dionex ICS-2000 Ion Chromatograph (Dionex Corporation, Sunnyvale, CA) (ASTM D6919-03). The reportable limit for this method is 0.05 mg/L Na+ .
Appendix I Page 123 of 1262 808
2 of 39
Results/DiscussionSamples were measured ranging from 0.0-1043 mg/L Na. The average concentration of Na in water samples collected was 159.31 mg/L Na. These temporal plots (Figures 3-104) created an easy visual way to find outliers and double check data entry for possible mistakes.
References American Public Health Association (APHA). 2005. Standard Methods for the Examination of
Water and Wastewater, 21st Edition. American Public Health Association, Washington, DC.
Borglin, S., W. Stringfellow, J. Hanlon. 2005. Standard Operating Procedures for the Up-Stream Dissolved Oxygen TMDL Project. LBNL/Pub-937.
Borglin, S., Burks, R., Hanlon, J., Graham, J., Spier, C., Stringfellow, W., and Dahlgren, R., (2008) Methods overview, quality assurance, and quality control, University of the Pacific, Stockton, CA
Borglin, S.E., Burks, R.D., Hanlon, J.S., Stringfellow, W.T. (2008) EERP Lab Protocol Book, University of the Pacific, Stockton, CA.
Graham, J., Hanlon, J.S., Stringfellow, W.T., (2008) EERP Field Protocol Book, University of the Pacific, Stockton, CA.
Stringfellow, W.T., et al., (2008) Evaluation of Vegitated Ditches, Ponds, and Wetlands as BMPs for Mitigating the Water Quality Impact of Irrigated Agriculture in the San Joaquin Valley, University of the Pacific, Stockton, CA
YSI Environmental Operations Manual (2005) 6-Series Environmental Monitoring Systems, Yellow Springs, OH.
Appendix I Page 124 of 1262 809

3 of 39
Table 1: EERP Sampling Site List DO Number
Site Name Type
4 SJR at Mossdale Core sites 5 SJR at Vernalis-McCune Station (River Club) Core sites, BMP 6 SJR at Maze Core sites, BMP 7 SJR at Patterson Core sites, BMP 8 SJR at Crows Landing Core sites, BMP
10 SJR at Lander Avenue Core sites 12 Stanislaus River at Caswell Park Core sites 14 Tuolumne River at Shiloh Bridge Core sites 16 Merced River at River Road Core sites 18 Mud Slough near Gustine Core sites, Wetland 19 Salt Slough at Lander Avenue Core sites, Wetland 20 Los Banos Creek Flow Station Core sites, Wetland 21 Orestimba Creek at River Road Core sites, BMP 23 Modesto ID Lateral 5 to Tuolumne Core sites 25 Modesto ID Main Drain to Stan. R. via Miller Lake Core sites 28 Turlock ID Westport Drain Flow station Core sites 29 Turlock ID Harding Drain Core sites 30 Turlock ID Lateral 6 & 7 at Levee Core sites 33 Hospital Creek Intermittent, BMP 34 Ingram Creek Core sites, BMP 36 Del Puerto Creek Flow Station Core sites, BMP 44 San Luis Drain End Core sites 53 Salt Slough at Wolfsen Road Wetland 57 Ramona Lake Drain Core sites, BMP 59 SJR Laird Park Core sites 60 Moffit 1 South Wetland 61 Deadman's Slough Wetland 62 Mallard Slough Wetland 63 Inlet C Canal Wetland 80 South Marsh-1-Inlet Wetland 81 South Marsh-1-Outlet Wetland 82 South Marsh-3-Inlet Wetland 83 South Marsh-3-Outlet Wetland 95 Ramona drain at Ramona Lake BMP, Intermittent
Appendix I Page 125 of 1262 810

4 of 39
Figure 1: EERP Sampling Site Map of SJR Watershed and Tributaries
Appendix I Page 126 of 1262 811

5 of 39
Figures 2 -103: Temporal Plots of Na By Site ID
1 53 105 157 209 261 313 365Day of the Year
0
40
80
120N
a (m
g/L)
2005 DO-04: SJR at Mossdale
1 53 105 157 209 261 313 365Day of the Year
0
40
80
120
Na
(mg/
L)
2006 DO-04: SJR at Mossdale
1 53 105 157 209 261 313 365Day of the Year
0
40
80
120
Na
(mg/
L)
2007 DO-04: SJR at Mossdale
Appendix I Page 127 of 1262 812

6 of 39
1 53 105 157 209 261 313 365Day of the Year
0
40
80
120N
a (m
g/L)
2005 DO-05: SJR at Vernalis-McCune Station
1 53 105 157 209 261 313 365Day of the Year
0
40
80
120
Na
(mg/
L)
2006 DO-05: SJR at Vernalis-McCune Station
1 53 105 157 209 261 313 365Day of the Year
20
40
60
80
100
120
Na
(mg/
L)
2007 DO-05: SJR at Vernalis-McCune Station
Appendix I Page 128 of 1262 813

7 of 39
1 53 105 157 209 261 313 365Day of the Year
0
40
80
120
160N
a (m
g/L)
2005 DO-06: SJR at Maze
1 53 105 157 209 261 313 365Day of the Year
0
40
80
120
160
Na
(mg/
L)
2006 DO-06: SJR at Maze
1 53 105 157 209 261 313 365Day of the Year
0
40
80
120
160
Na
(mg/
L)
2007 DO-06: SJR at Maze
Appendix I Page 129 of 1262 814

8 of 39
1 53 105 157 209 261 313 365Day of the Year
0
50
100
150
200
250
Na
(mg/
L)2005
DO-07: SJR at Patterson
1 53 105 157 209 261 313 365Day of the Year
0
50
100
150
200
250
Na
(mg/
L)
2006 DO-07: SJR at Patterson
1 53 105 157 209 261 313 365Day of the Year
0
50
100
150
200
250
Na
(mg/
L)
2007 DO-07: SJR at Patterson
Appendix I Page 130 of 1262 815
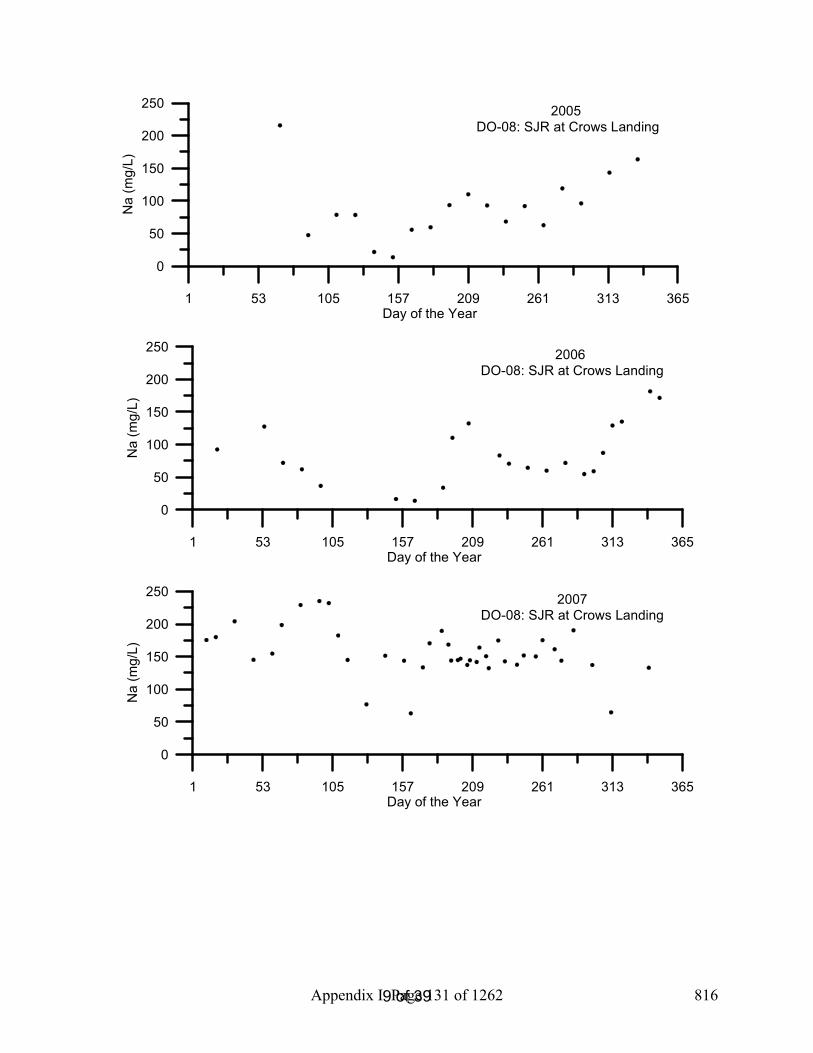
9 of 39
1 53 105 157 209 261 313 365Day of the Year
0
50
100
150
200
250
Na
(mg/
L)2005
DO-08: SJR at Crows Landing
1 53 105 157 209 261 313 365Day of the Year
0
50
100
150
200
250
Na
(mg/
L)
2006 DO-08: SJR at Crows Landing
1 53 105 157 209 261 313 365Day of the Year
0
50
100
150
200
250
Na
(mg/
L)
2007DO-08: SJR at Crows Landing
Appendix I Page 131 of 1262 816

10 of 39
1 53 105 157 209 261 313 365Day of the Year
0
4
8
12N
a (m
g/L)
2005 DO-10: SJR at Lander Avenue
1 53 105 157 209 261 313 365Day of the Year
0
4
8
12
Na
(mg/
L)
2006 DO-10: SJR at Lander Avenue
1 53 105 157 209 261 313 365Day of the Year
0
4
8
12
Na
(mg/
L)
2007DO-10: SJR at Lander Avenue
Appendix I Page 132 of 1262 817

11 of 39
1 53 105 157 209 261 313 365Day of the Year
0
4
8
12N
a (m
g/L)
2005 DO-12: Stanislaus River at Caswell Park
1 53 105 157 209 261 313 365Day of the Year
0
4
8
12
Na
(mg/
L)
2006 DO-12: Stanislaus River at Caswell Park
1 53 105 157 209 261 313 365Day of the Year
0
4
8
12
Na
(mg/
L)
2007DO-12: Stanislaus River at Caswell Park
Appendix I Page 133 of 1262 818

12 of 39
1 53 105 157 209 261 313 365Day of the Year
0
10
20
30
40
Na
(mg/
L)2005
DO-14: Tuolumne River at Shiloh Bridge
1 53 105 157 209 261 313 365Day of the Year
0
10
20
30
40
Na
(mg/
L)
2006 DO-14: Tuolumne River at Shiloh Bridge
1 53 105 157 209 261 313 365Day of the Year
0
10
20
30
40
Na
(mg/
L)
2007DO-14: Tuolumne River at Shiloh Bridge
Appendix I Page 134 of 1262 819

13 of 39
1 53 105 157 209 261 313 365Day of the Year
0
20
40
60
Na
(mg/
L)2005
DO-16: Merced River at River Road
1 53 105 157 209 261 313 365Day of the Year
0
20
40
60
Na
(mg/
L)
2006 DO-16: Merced River at River Road
1 53 105 157 209 261 313 365Day of the Year
0
20
40
60
Na
(mg/
L)
2007DO-16: Merced River at River Road
Appendix I Page 135 of 1262 820
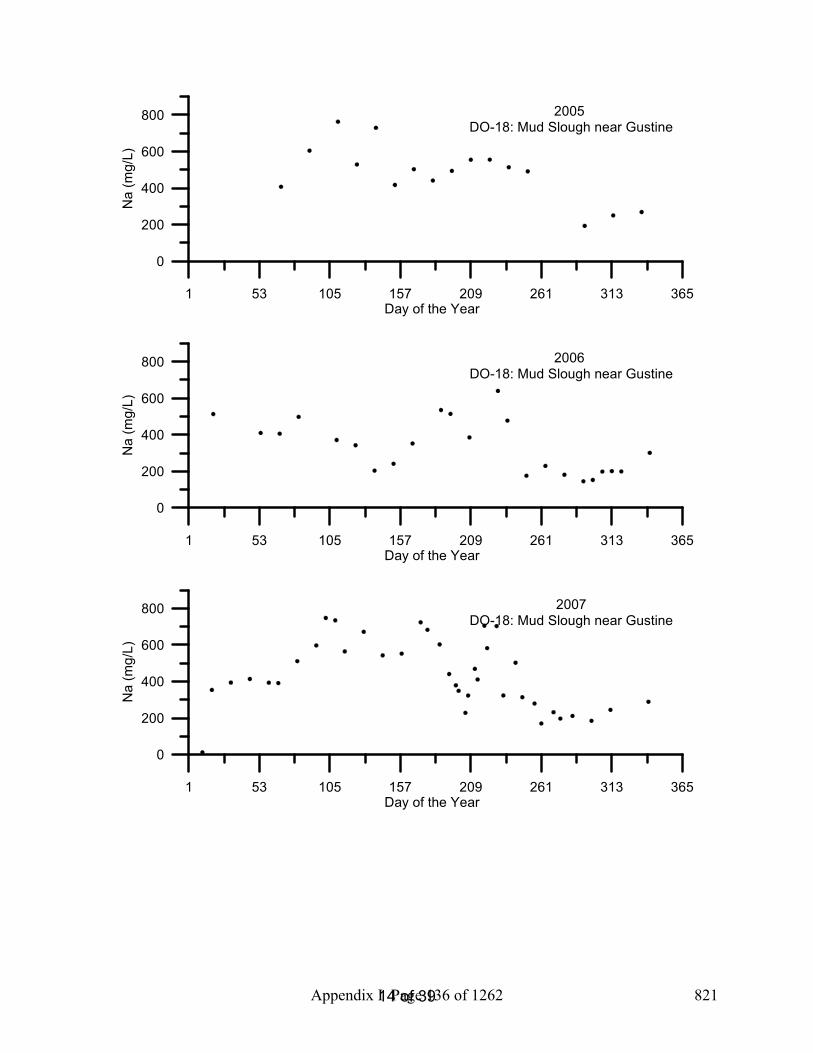
14 of 39
1 53 105 157 209 261 313 365Day of the Year
0
200
400
600
800N
a (m
g/L)
2005 DO-18: Mud Slough near Gustine
1 53 105 157 209 261 313 365Day of the Year
0
200
400
600
800
Na
(mg/
L)
2006 DO-18: Mud Slough near Gustine
1 53 105 157 209 261 313 365Day of the Year
0
200
400
600
800
Na
(mg/
L)
2007DO-18: Mud Slough near Gustine
Appendix I Page 136 of 1262 821

15 of 39
1 53 105 157 209 261 313 365Day of the Year
0
200
400N
a (m
g/L)
2005 DO-19: Salt Slough at Lander Avenue
1 53 105 157 209 261 313 365Day of the Year
0
200
400
Na
(mg/
L)
2006 DO-19: Salt Slough at Lander Avenue
1 53 105 157 209 261 313 365Day of the Year
0
200
400
Na
(mg/
L)
2007DO-19: Salt Slough at Lander Avenue
Appendix I Page 137 of 1262 822

16 of 39
1 53 105 157 209 261 313 365Day of the Year
0
200
400
600
Na
(mg/
L)2005
DO-20: Los Banos Creek at Highway 140
1 53 105 157 209 261 313 365Day of the Year
0
200
400
600
Na
(mg/
L)
2006 DO-20: Los Banos Creek at Highway 140
1 53 105 157 209 261 313 365Day of the Year
0
200
400
600
Na
(mg/
L)
2007DO-20: Los Banos Creek at Highway 140
Appendix I Page 138 of 1262 823

17 of 39
1 53 105 157 209 261 313 365Day of the Year
0
40
80
120
160
200
Na
(mg/
L)2005
DO-21: Orestimba Creek at River Road
1 53 105 157 209 261 313 365Day of the Year
0
40
80
120
160
200
Na
(mg/
L)
2006 DO-21: Orestimba Creek at River Road
1 53 105 157 209 261 313 365Day of the Year
0
40
80
120
160
200
Na
(mg/
L)
2007DO-21: Orestimba Creek at River Road
Appendix I Page 139 of 1262 824

18 of 39
1 53 105 157 209 261 313 365Day of the Year
0
20
40
60
80N
a (m
g/L)
2005 DO-23: Modesto ID Lateral 5 to Tuolumne
1 53 105 157 209 261 313 365Day of the Year
0
20
40
60
80
Na
(mg/
L)
2006 DO-23: Modesto ID Lateral 5 to Tuolumne
1 53 105 157 209 261 313 365Day of the Year
0
20
40
60
80
Na
(mg/
L)
2007DO-23: Modesto ID Lateral 5 to Tuolumne
Appendix I Page 140 of 1262 825

19 of 39
1 53 105 157 209 261 313 365Day of the Year
0
40
80
120
160
200
Na
(mg/
L)2005
DO-25: MID Main Drain to Stan. R. via Miller Lake
1 53 105 157 209 261 313 365Day of the Year
0
40
80
120
160
200
Na
(mg/
L)
2006 DO-25: MID Main Drain to Stan. R. via Miller Lake
1 53 105 157 209 261 313 365Day of the Year
0
40
80
120
160
200
Na
(mg/
L)
2007DO-25: MID Main Drain to Stan. R. via Miller Lake
Appendix I Page 141 of 1262 826

20 of 39
1 53 105 157 209 261 313 365Day of the Year
0
40
80
120
160
200
Na
(mg/
L)2005
DO-28: Turlock ID Westport Drain Flow Station
1 53 105 157 209 261 313 365Day of the Year
0
40
80
120
160
200
Na
(mg/
L)
2006 DO-28: Turlock ID Westport Drain Flow Station
1 53 105 157 209 261 313 365Day of the Year
0
40
80
120
160
200
Na
(mg/
L)
2007DO-28: Turlock ID Westport Drain Flow Station
Appendix I Page 142 of 1262 827

21 of 39
1 53 105 157 209 261 313 365Day of the Year
0
40
80
120
160
200
Na
(mg/
L)2005
DO-29: Turlock ID Harding Drain
1 53 105 157 209 261 313 365Day of the Year
0
40
80
120
160
200
Na
(mg/
L)
2006 DO-29: Turlock ID Harding Drain
1 53 105 157 209 261 313 365Day of the Year
0
40
80
120
160
200
Na
(mg/
L)
2007DO-29: Turlock ID Harding Drain
Appendix I Page 143 of 1262 828
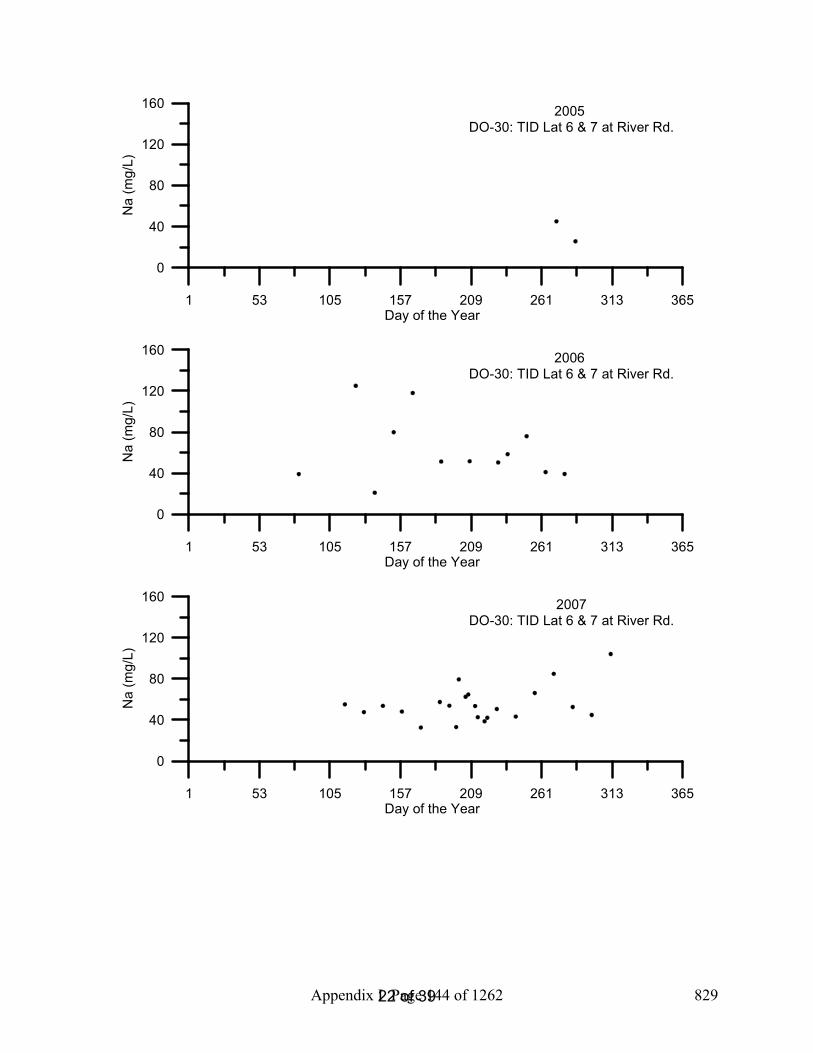
22 of 39
1 53 105 157 209 261 313 365Day of the Year
0
40
80
120
160
Na
(mg/
L)2005
DO-30: TID Lat 6 & 7 at River Rd.
1 53 105 157 209 261 313 365Day of the Year
0
40
80
120
160
Na
(mg/
L)
2006 DO-30: TID Lat 6 & 7 at River Rd.
1 53 105 157 209 261 313 365Day of the Year
0
40
80
120
160
Na
(mg/
L)
2007DO-30: TID Lat 6 & 7 at River Rd.
Appendix I Page 144 of 1262 829
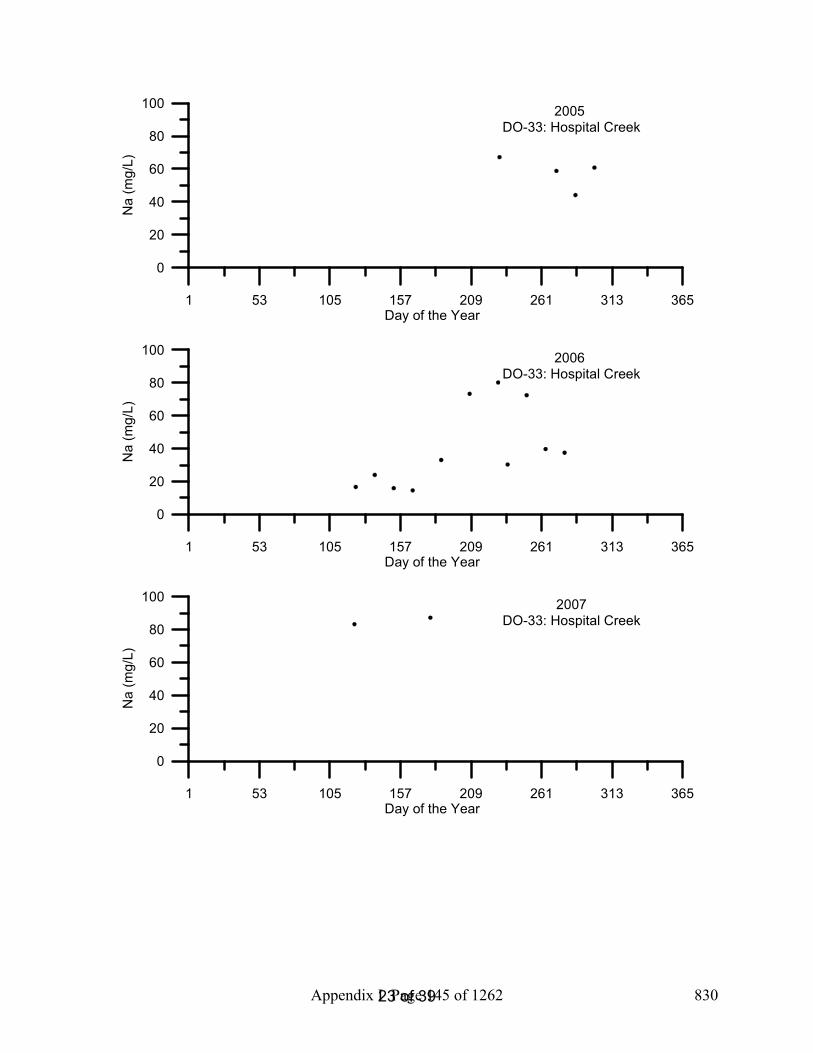
23 of 39
1 53 105 157 209 261 313 365Day of the Year
0
20
40
60
80
100
Na
(mg/
L)2005
DO-33: Hospital Creek
1 53 105 157 209 261 313 365Day of the Year
0
20
40
60
80
100
Na
(mg/
L)
2006 DO-33: Hospital Creek
1 53 105 157 209 261 313 365Day of the Year
0
20
40
60
80
100
Na
(mg/
L)
2007DO-33: Hospital Creek
Appendix I Page 145 of 1262 830

24 of 39
1 53 105 157 209 261 313 365Day of the Year
0
100
200
300
Na
(mg/
L)2005
DO-34: Ingram Creek Flow Station
1 53 105 157 209 261 313 365Day of the Year
0
100
200
300
Na
(mg/
L)
2006 DO-34: Ingram Creek Flow Station
1 53 105 157 209 261 313 365Day of the Year
0
100
200
300
Na
(mg/
L)
2007DO-34: Ingram Creek Flow Station
Appendix I Page 146 of 1262 831

25 of 39
1 53 105 157 209 261 313 365Day of the Year
0
50
100
150
200
250
Na
(mg/
L)2005
DO-36: Del Puerto Creek Flow Station
1 53 105 157 209 261 313 365Day of the Year
0
50
100
150
200
250
Na
(mg/
L)
2006 DO-36: Del Puerto Creek Flow Station
1 53 105 157 209 261 313 365Day of the Year
0
50
100
150
200
250
Na
(mg/
L)
2007DO-36: Del Puerto Creek Flow Station
Appendix I Page 147 of 1262 832
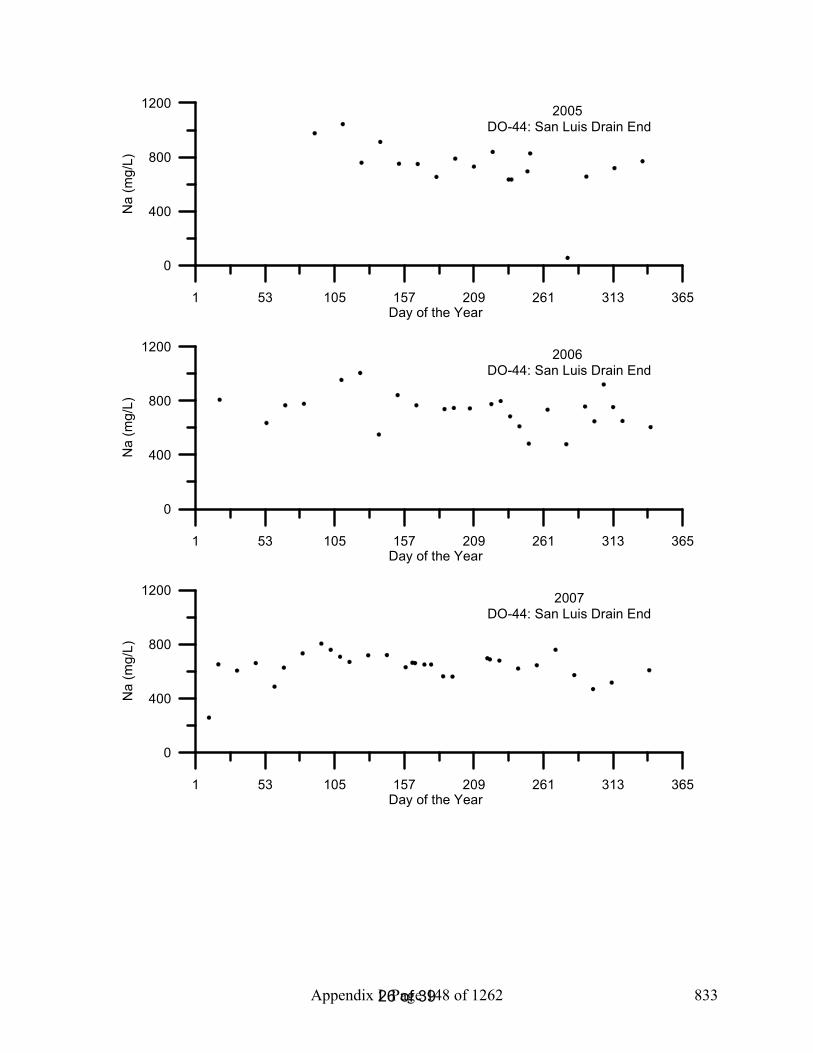
26 of 39
1 53 105 157 209 261 313 365Day of the Year
0
400
800
1200
Na
(mg/
L)2005
DO-44: San Luis Drain End
1 53 105 157 209 261 313 365Day of the Year
0
400
800
1200
Na
(mg/
L)
2006 DO-44: San Luis Drain End
1 53 105 157 209 261 313 365Day of the Year
0
400
800
1200
Na
(mg/
L)
2007DO-44: San Luis Drain End
Appendix I Page 148 of 1262 833

27 of 39
1 53 105 157 209 261 313 365Day of the Year
0
100
200
300
400
Na
(mg/
L)2005
DO-53: Salt Slough at Wolfsen Road
1 53 105 157 209 261 313 365Day of the Year
0
100
200
300
400
Na
(mg/
L)
2006 DO-53: Salt Slough at Wolfsen Road
1 53 105 157 209 261 313 365Day of the Year
0
100
200
300
400
Na
(mg/
L)
2007DO-53: Salt Slough at Wolfsen Road
Appendix I Page 149 of 1262 834

28 of 39
1 53 105 157 209 261 313 365Day of the Year
0
100
200
300
Na
(mg/
L)2005
DO-57: Ramona Lake Drain at Levee
1 53 105 157 209 261 313 365Day of the Year
0
100
200
300
Na
(mg/
L)
2006 DO-57: Ramona Lake Drain at Levee
1 53 105 157 209 261 313 365Day of the Year
0
100
200
300
Na
(mg/
L)
2007DO-57: Ramona Lake Drain at Levee
Appendix I Page 150 of 1262 835

29 of 39
1 53 105 157 209 261 313 365Day of the Year
0
200
400
600
800
1000
Na
(mg/
L)2005
DO-59: SJR Laird Park
1 53 105 157 209 261 313 365Day of the Year
0
200
400
600
800
1000
Na
(mg/
L)
2006 DO-59: SJR Laird Park
1 53 105 157 209 261 313 365Day of the Year
0
200
400
600
800
1000
Na
(mg/
L)
2007DO-59: SJR Laird Park
Appendix I Page 151 of 1262 836

30 of 39
1 53 105 157 209 261 313 365Day of the Year
0
50
100
150
200
250
Na
(mg/
L)2005
DO-60: Moffit 1 South
1 53 105 157 209 261 313 365Day of the Year
0
50
100
150
200
250
Na
(mg/
L)
2006 DO-60: Moffit 1 South
1 53 105 157 209 261 313 365Day of the Year
0
50
100
150
200
250
Na
(mg/
L)
2007DO-60: Moffit 1 South
Appendix I Page 152 of 1262 837

31 of 39
1 53 105 157 209 261 313 365Day of the Year
0
100
200
300
400
Na
(mg/
L)2005
DO-61: Deadman's Slough
1 53 105 157 209 261 313 365Day of the Year
0
100
200
300
400
Na
(mg/
L)
2006 DO-61: Deadman's Slough
1 53 105 157 209 261 313 365Day of the Year
0
100
200
300
400
Na
(mg/
L)
2007DO-61: Deadman's Slough
Appendix I Page 153 of 1262 838

32 of 39
1 53 105 157 209 261 313 365Day of the Year
0
200
400
600
800
1000
Na
(mg/
L)2005
DO-62: Mallard Slough
1 53 105 157 209 261 313 365Day of the Year
0
200
400
600
800
1000
Na
(mg/
L)
2006DO-62: Mallard Slough
1 53 105 157 209 261 313 365Day of the Year
0
200
400
600
800
1000
Na
(mg/
L)
2007DO-62: Mallard Slough
Appendix I Page 154 of 1262 839

33 of 39
1 53 105 157 209 261 313 365Day of the Year
0
40
80
120
160
200
Na
(mg/
L)2005
DO-63: Inlet C Canal
1 53 105 157 209 261 313 365Day of the Year
0
40
80
120
160
200
Na
(mg/
L)
2006DO-63: Inlet C Canal
1 53 105 157 209 261 313 365Day of the Year
0
40
80
120
160
200
Na
(mg/
L)
2007DO-63: Inlet C Canal
Appendix I Page 155 of 1262 840

34 of 39
1 53 105 157 209 261 313 365Day of the Year
0
40
80
120
160
Na
(mg/
L)2005
DO-80: South Marsh 1 Inlet
1 53 105 157 209 261 313 365Day of the Year
0
40
80
120
160
Na
(mg/
L)
2006DO-80: South Marsh 1 Inlet
1 53 105 157 209 261 313 365Day of the Year
0
40
80
120
160
Na
(mg/
L)
2007DO-80: South Marsh 1 Inlet
Appendix I Page 156 of 1262 841

35 of 39
1 53 105 157 209 261 313 365Day of the Year
0
40
80
120
160N
a (m
g/L)
2005 DO-81: South Marsh 1 Outlet
1 53 105 157 209 261 313 365Day of the Year
0
40
80
120
160
Na
(mg/
L)
2006DO-81: South Marsh 1 Outlet
1 53 105 157 209 261 313 365Day of the Year
0
40
80
120
160
Na
(mg/
L)
2007DO-81: South Marsh 1 Outlet
Appendix I Page 157 of 1262 842

36 of 39
1 53 105 157 209 261 313 365Day of the Year
0
100
200
300
400
Na
(mg/
L)2005
DO-82: South Marsh 3 Inlet
1 53 105 157 209 261 313 365Day of the Year
0
100
200
300
400
Na
(mg/
L)
2006DO-82: South Marsh 3 Inlet
1 53 105 157 209 261 313 365Day of the Year
0
100
200
300
400
Na
(mg/
L)
2007DO-82: South Marsh 3 Inlet
Appendix I Page 158 of 1262 843

37 of 39
1 53 105 157 209 261 313 365Day of the Year
0
40
80
120
160
Na
(mg/
L)2005
DO-83: South Marsh 3 Outlet
1 53 105 157 209 261 313 365Day of the Year
0
100
200
300
400
Na
(mg/
L)
2006DO-83: South Marsh 3 Outlet
1 53 105 157 209 261 313 365Day of the Year
0
50
100
150
200
250
Na
(mg/
L)
2007DO-83: South Marsh 3 Outlet
Appendix I Page 159 of 1262 844

38 of 39
1 53 105 157 209 261 313 365Day of the Year
0
100
200
300
Na
(mg/
L)2005
DO-95: Ramona Lake Entrance
1 53 105 157 209 261 313 365Day of the Year
0
100
200
300
Na
(mg/
L)
2006DO-95: Ramona Lake Entrance
1 53 105 157 209 261 313 365Day of the Year
0
100
200
300
Na
(mg/
L)
2007DO-95: Ramona Lake Entrance
Appendix I Page 160 of 1262 845

Temporal Plots of 2005-2007 Potassium Data from the Upstream San Joaquin River
Chelsea Spier1
Remie Burks1
Sharon Borglin1
Randy Dahlgren2
Jeremy Hanlon1
Justin Graham1
William Stringfellow1
February 2008
1Environmental Engineering Research Program School of Engineering & Computer Sciences
University of the Pacific 3601 Pacific Avenue, Sears Hall
Stockton, CA 95211 2UC Davis, Davis, CA
Appendix I Page 161 of 1262 846

1 of 39
Introduction The San Joaquin River (SJR) supports one of the most productive agricultural regions in the world and its productivity is heavily dependant on irrigated agriculture. A consequence of irrigated agriculture is the production of return flows conveyed down gradient drains that eventually discharge to surface waters. Agricultural drainage may have significant nutrient load and can impact algae growth and general water quality in the SJR. Individual farmers and agricultural organizations, such as drainage authorities, are in need of tools to manage the environmental impacts of agricultural activities (Stringfellow, 2008).
For the years 2005 through 2007, sites throughout the San Joaquin Valley watershed were sampled to assess the overall water quality in the region. One thousand nine hundred and ninety-six (1996) individual surface water samples were collected and analyzed and WQ was assessed at 113 locations in the SJR basin (Borglin et al., 2008). Samples were processed and analyzed by the Environmental Engineering Research Program (EERP) laboratory at the University of the Pacific as well as at the University of California, Davis, Dahlgren Lab. This report includes temporal graphs of potassium (K) data analyzed by the UCD Dahlgren laboratory between 2005 and 2007.
MethodsDepth integrated field samples were colleted during 2005-2007 in the upper San Joaquin River in accordance with EERP Field Standard Operating Procedures Protocol Book (Graham 2008). Water samples were colleted in glass 1000 mL bottles (Wheaton Science Products, Millville, NJ), 1000 mL HDPE Trace-Clean narrow mouth plastic bottles (VWR International), 250 mL HDPE Trace-Clean wide mouth plastic bottles (VWR International) as well as 40 mL trace clean vials with PTFE septa (IChem, Rockwood, TN). Bottles were labeled with the appropriate sample number, site name and sampling date. All bottles were rinsed with sample water prior to sample collection. Some sites required a bucket to collect sample water because of accessibility from a high bridge or platform. For these sites, the bucket was pre-rinsed with sample water and sample bottles were filled using a rinsed funnel. Care was taken to distribute water simultaneously to all sample bottles (rather than sequentially). Samples were immediately stored at 4°C after sampling (cooler temperature was recorded in the lab upon delivery) and transported to the EERP lab on the day of sampling.
Within 24 hours of collection samples were transported from the EERP laboratory to the UCD laboratory for analysis, during this time period samples were stored in coolers at 4°C.
Ion chromatography was utilized for measuring K+ using a Dionex ICS-2000 Ion Chromatograph (Dionex Corporation, Sunnyvale, CA) (ASTM D6919-03). The reportable limit for this method is 0.05 mg/L K2+ .
Appendix I Page 162 of 1262 847
2 of 39
Results/DiscussionSamples were measured ranging from 0.0-54.7 mg/L K. The average concentration of K in water samples collected was 5.24 mg/L K. These temporal plots (Figures 3-104) created an easy visual way to find outliers and double check data entry for possible mistakes.
References American Public Health Association (APHA). 2005. Standard Methods for the Examination of
Water and Wastewater, 21st Edition. American Public Health Association, Washington, DC.
Borglin, S., W. Stringfellow, J. Hanlon. 2005. Standard Operating Procedures for the Up-Stream Dissolved Oxygen TMDL Project. LBNL/Pub-937.
Borglin, S., Burks, R., Hanlon, J., Graham, J., Spier, C., Stringfellow, W., and Dahlgren, R., (2008) Methods overview, quality assurance, and quality control, University of the Pacific, Stockton, CA
Borglin, S.E., Burks, R.D., Hanlon, J.S., Stringfellow, W.T. (2008) EERP Lab Protocol Book, University of the Pacific, Stockton, CA.
Graham, J., Hanlon, J.S., Stringfellow, W.T., (2008) EERP Field Protocol Book, University of the Pacific, Stockton, CA.
Stringfellow, W.T., et al., (2008) Evaluation of Vegitated Ditches, Ponds, and Wetlands as BMPs for Mitigating the Water Quality Impact of Irrigated Agriculture in the San Joaquin Valley, University of the Pacific, Stockton, CA
YSI Environmental Operations Manual (2005) 6-Series Environmental Monitoring Systems, Yellow Springs, OH.
Appendix I Page 163 of 1262 848

3 of 39
Table 1: EERP Sampling Site List DO Number
Site Name Type
4 SJR at Mossdale Core sites 5 SJR at Vernalis-McCune Station (River Club) Core sites, BMP 6 SJR at Maze Core sites, BMP 7 SJR at Patterson Core sites, BMP 8 SJR at Crows Landing Core sites, BMP
10 SJR at Lander Avenue Core sites 12 Stanislaus River at Caswell Park Core sites 14 Tuolumne River at Shiloh Bridge Core sites 16 Merced River at River Road Core sites 18 Mud Slough near Gustine Core sites, Wetland 19 Salt Slough at Lander Avenue Core sites, Wetland 20 Los Banos Creek Flow Station Core sites, Wetland 21 Orestimba Creek at River Road Core sites, BMP 23 Modesto ID Lateral 5 to Tuolumne Core sites 25 Modesto ID Main Drain to Stan. R. via Miller Lake Core sites 28 Turlock ID Westport Drain Flow station Core sites 29 Turlock ID Harding Drain Core sites 30 Turlock ID Lateral 6 & 7 at Levee Core sites 33 Hospital Creek Intermittent, BMP 34 Ingram Creek Core sites, BMP 36 Del Puerto Creek Flow Station Core sites, BMP 44 San Luis Drain End Core sites 53 Salt Slough at Wolfsen Road Wetland 57 Ramona Lake Drain Core sites, BMP 59 SJR Laird Park Core sites 60 Moffit 1 South Wetland 61 Deadman's Slough Wetland 62 Mallard Slough Wetland 63 Inlet C Canal Wetland 80 South Marsh-1-Inlet Wetland 81 South Marsh-1-Outlet Wetland 82 South Marsh-3-Inlet Wetland 83 South Marsh-3-Outlet Wetland 95 Ramona drain at Ramona Lake BMP, Intermittent
Appendix I Page 164 of 1262 849

4 of 39
Figure 1: EERP Sampling Site Map of SJR Watershed and Tributaries
Appendix I Page 165 of 1262 850
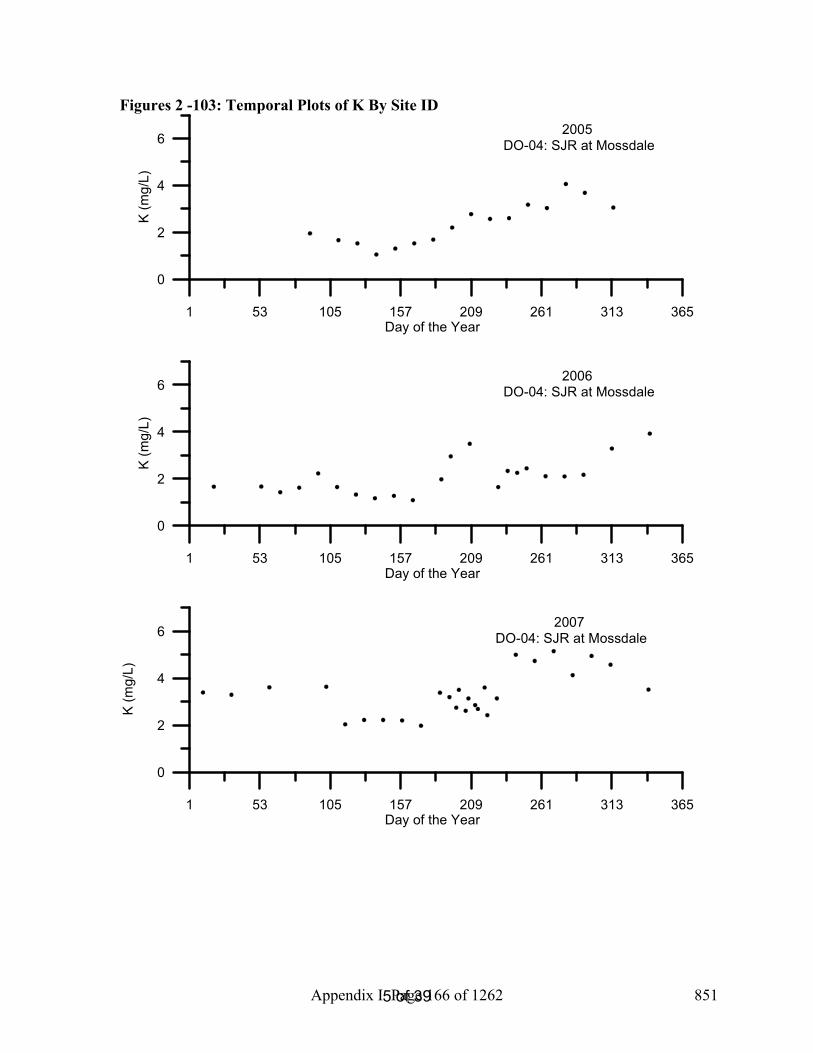
5 of 39
Figures 2 -103: Temporal Plots of K By Site ID
1 53 105 157 209 261 313 365Day of the Year
0
2
4
6K
(mg/
L)2005
DO-04: SJR at Mossdale
1 53 105 157 209 261 313 365Day of the Year
0
2
4
6
K (m
g/L)
2006 DO-04: SJR at Mossdale
1 53 105 157 209 261 313 365Day of the Year
0
2
4
6
K (m
g/L)
2007 DO-04: SJR at Mossdale
Appendix I Page 166 of 1262 851

6 of 39
1 53 105 157 209 261 313 365Day of the Year
0
2
4
6K
(mg/
L)2005
DO-05: SJR at Vernalis-McCune Station
1 53 105 157 209 261 313 365Day of the Year
0
2
4
6
K (m
g/L)
2006 DO-05: SJR at Vernalis-McCune Station
1 53 105 157 209 261 313 365Day of the Year
0
2
4
6
K (m
g/L)
2007 DO-05: SJR at Vernalis-McCune Station
Appendix I Page 167 of 1262 852

7 of 39
1 53 105 157 209 261 313 365Day of the Year
0
2
4
6
8
10
K (m
g/L)
2005 DO-06: SJR at Maze
1 53 105 157 209 261 313 365Day of the Year
0
2
4
6
8
10
K (m
g/L)
2006 DO-06: SJR at Maze
1 53 105 157 209 261 313 365Day of the Year
0
2
4
6
8
10
K (m
g/L)
2007 DO-06: SJR at Maze
Appendix I Page 168 of 1262 853

8 of 39
1 53 105 157 209 261 313 365Day of the Year
0
4
8
12
K (m
g/L)
2005 DO-07: SJR at Patterson
1 53 105 157 209 261 313 365Day of the Year
0
4
8
12
K (m
g/L)
2006 DO-07: SJR at Patterson
1 53 105 157 209 261 313 365Day of the Year
0
4
8
12
K (m
g/L)
2007 DO-07: SJR at Patterson
Appendix I Page 169 of 1262 854
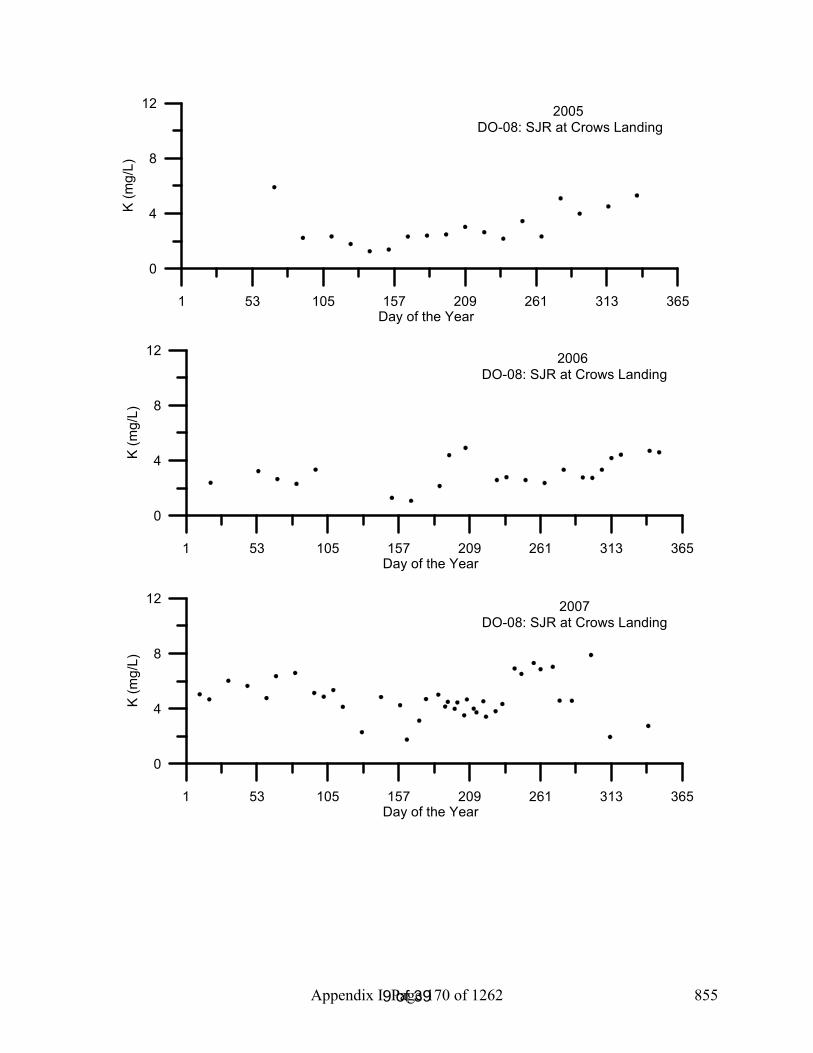
9 of 39
1 53 105 157 209 261 313 365Day of the Year
0
4
8
12
K (m
g/L)
2005 DO-08: SJR at Crows Landing
1 53 105 157 209 261 313 365Day of the Year
0
4
8
12
K (m
g/L)
2006DO-08: SJR at Crows Landing
1 53 105 157 209 261 313 365Day of the Year
0
4
8
12
K (m
g/L)
2007DO-08: SJR at Crows Landing
Appendix I Page 170 of 1262 855

10 of 39
1 53 105 157 209 261 313 365Day of the Year
0
4
8
12K
(mg/
L)2005
DO-10: SJR at Lander Avenue
1 53 105 157 209 261 313 365Day of the Year
0
4
8
12
K (m
g/L)
2006 DO-10: SJR at Lander Avenue
1 53 105 157 209 261 313 365Day of the Year
0
4
8
12
K (m
g/L)
2007DO-10: SJR at Lander Avenue
Appendix I Page 171 of 1262 856

11 of 39
1 53 105 157 209 261 313 365Day of the Year
0
0.5
1
1.5
2
2.5
K (m
g/L)
2005 DO-12: Stanislaus River at Caswell Park
1 53 105 157 209 261 313 365Day of the Year
0
0.5
1
1.5
2
2.5
K (m
g/L)
2006 DO-12: Stanislaus River at Caswell Park
1 53 105 157 209 261 313 365Day of the Year
0
0.5
1
1.5
2
2.5
K (m
g/L)
2007DO-12: Stanislaus River at Caswell Park
Appendix I Page 172 of 1262 857

12 of 39
1 53 105 157 209 261 313 365Day of the Year
0
0.5
1
1.5
2
2.5
K (m
g/L)
2005 DO-14: Tuolumne River at Shiloh Bridge
1 53 105 157 209 261 313 365Day of the Year
0
0.5
1
1.5
2
2.5
K (m
g/L)
2006 DO-14: Tuolumne River at Shiloh Bridge
1 53 105 157 209 261 313 365Day of the Year
0
4
8
12
K (m
g/L)
2007DO-14: Tuolumne River at Shiloh Bridge
Appendix I Page 173 of 1262 858
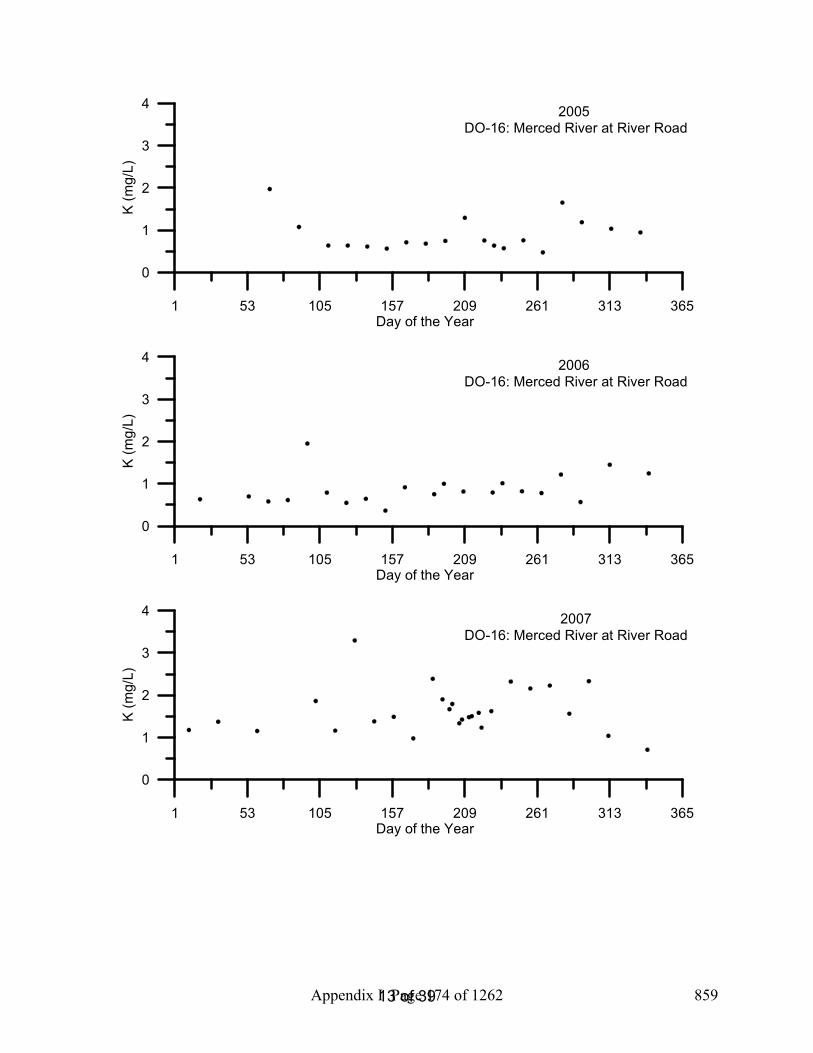
13 of 39
1 53 105 157 209 261 313 365Day of the Year
0
1
2
3
4
K (m
g/L)
2005 DO-16: Merced River at River Road
1 53 105 157 209 261 313 365Day of the Year
0
1
2
3
4
K (m
g/L)
2006 DO-16: Merced River at River Road
1 53 105 157 209 261 313 365Day of the Year
0
1
2
3
4
K (m
g/L)
2007DO-16: Merced River at River Road
Appendix I Page 174 of 1262 859

14 of 39
1 53 105 157 209 261 313 365Day of the Year
0
4
8
12
16
K (m
g/L)
2005 DO-18: Mud Slough near Gustine
1 53 105 157 209 261 313 365Day of the Year
0
4
8
12
16
K (m
g/L)
2006 DO-18: Mud Slough near Gustine
1 53 105 157 209 261 313 365Day of the Year
0
4
8
12
16
K (m
g/L)
2007DO-18: Mud Slough near Gustine
Appendix I Page 175 of 1262 860
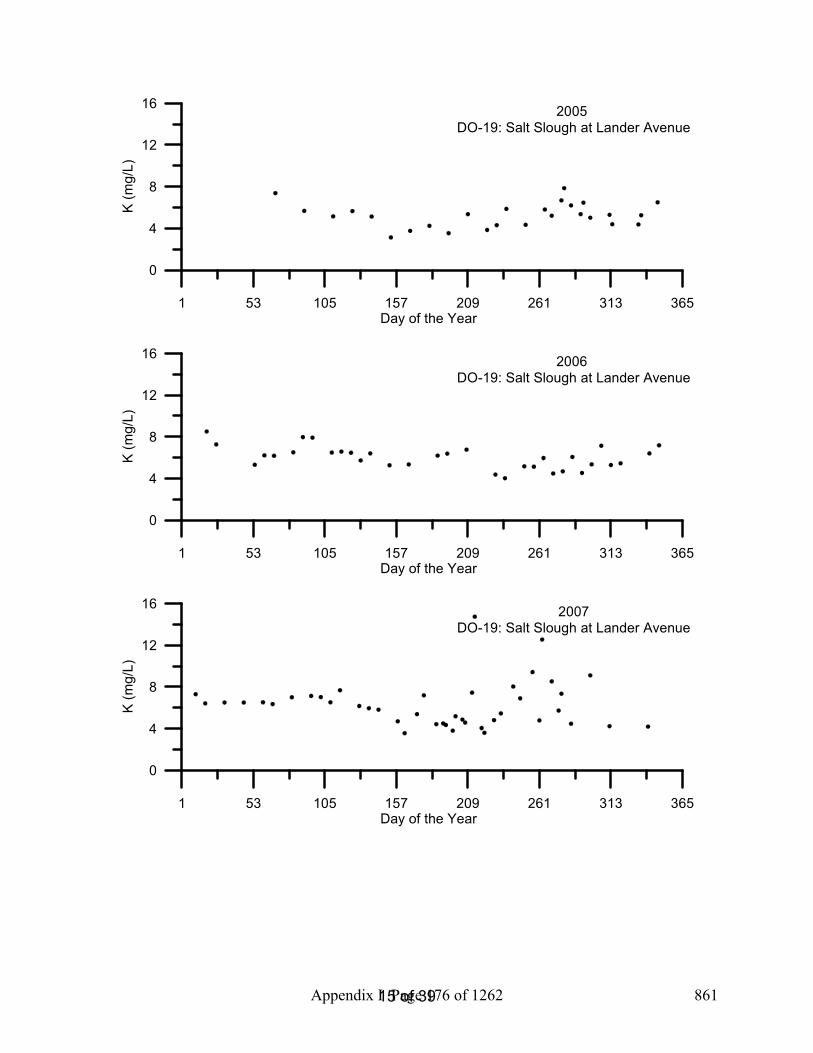
15 of 39
1 53 105 157 209 261 313 365Day of the Year
0
4
8
12
16
K (m
g/L)
2005 DO-19: Salt Slough at Lander Avenue
1 53 105 157 209 261 313 365Day of the Year
0
4
8
12
16
K (m
g/L)
2006 DO-19: Salt Slough at Lander Avenue
1 53 105 157 209 261 313 365Day of the Year
0
4
8
12
16
K (m
g/L)
2007DO-19: Salt Slough at Lander Avenue
Appendix I Page 176 of 1262 861

16 of 39
1 53 105 157 209 261 313 365Day of the Year
0
4
8
12
16
20
K (m
g/L)
2005 DO-20: Los Banos Creek at Highway 140
1 53 105 157 209 261 313 365Day of the Year
0
4
8
12
16
20
K (m
g/L)
2006 DO-20: Los Banos Creek at Highway 140
1 53 105 157 209 261 313 365Day of the Year
0
4
8
12
16
20
K (m
g/L)
2007DO-20: Los Banos Creek at Highway 140
Appendix I Page 177 of 1262 862

17 of 39
1 53 105 157 209 261 313 365Day of the Year
0
2
4
6
8
10
K (m
g/L)
2005 DO-21: Orestimba Creek at River Road
1 53 105 157 209 261 313 365Day of the Year
0
2
4
6
8
10
K (m
g/L)
2006 DO-21: Orestimba Creek at River Road
1 53 105 157 209 261 313 365Day of the Year
0
2
4
6
8
10
K (m
g/L)
2007DO-21: Orestimba Creek at River Road
Appendix I Page 178 of 1262 863
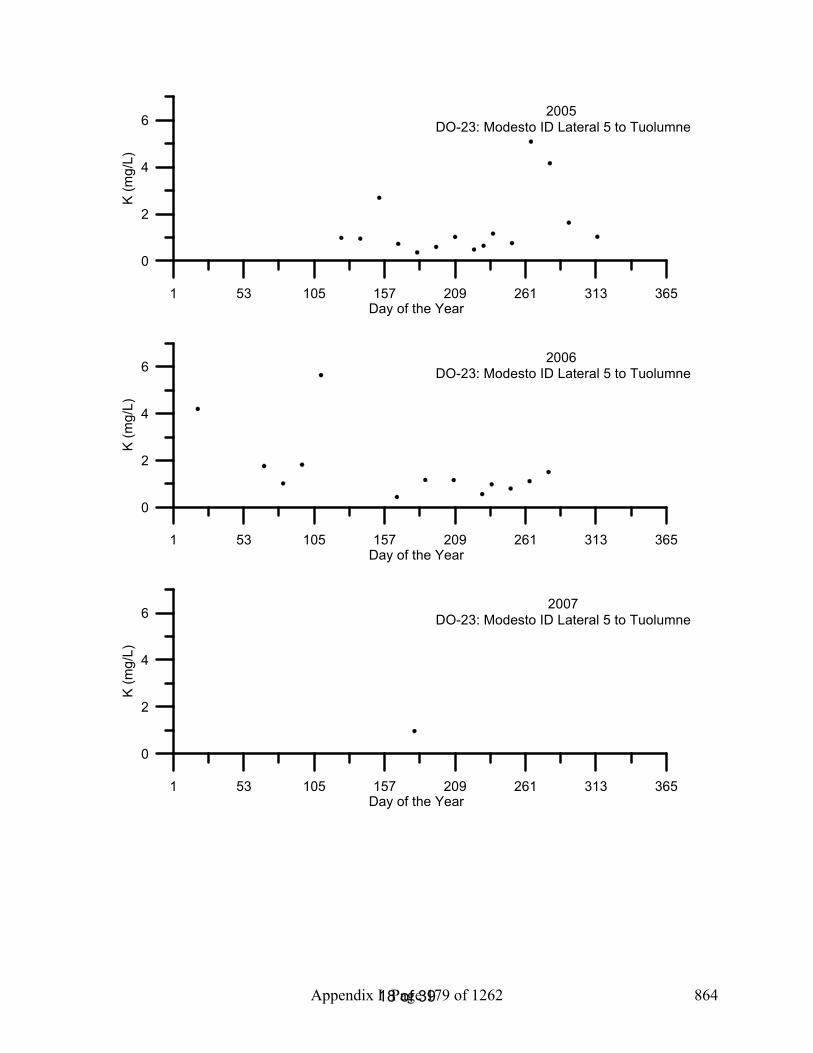
18 of 39
1 53 105 157 209 261 313 365Day of the Year
0
2
4
6K
(mg/
L)2005
DO-23: Modesto ID Lateral 5 to Tuolumne
1 53 105 157 209 261 313 365Day of the Year
0
2
4
6
K (m
g/L)
2006 DO-23: Modesto ID Lateral 5 to Tuolumne
1 53 105 157 209 261 313 365Day of the Year
0
2
4
6
K (m
g/L)
2007DO-23: Modesto ID Lateral 5 to Tuolumne
Appendix I Page 179 of 1262 864
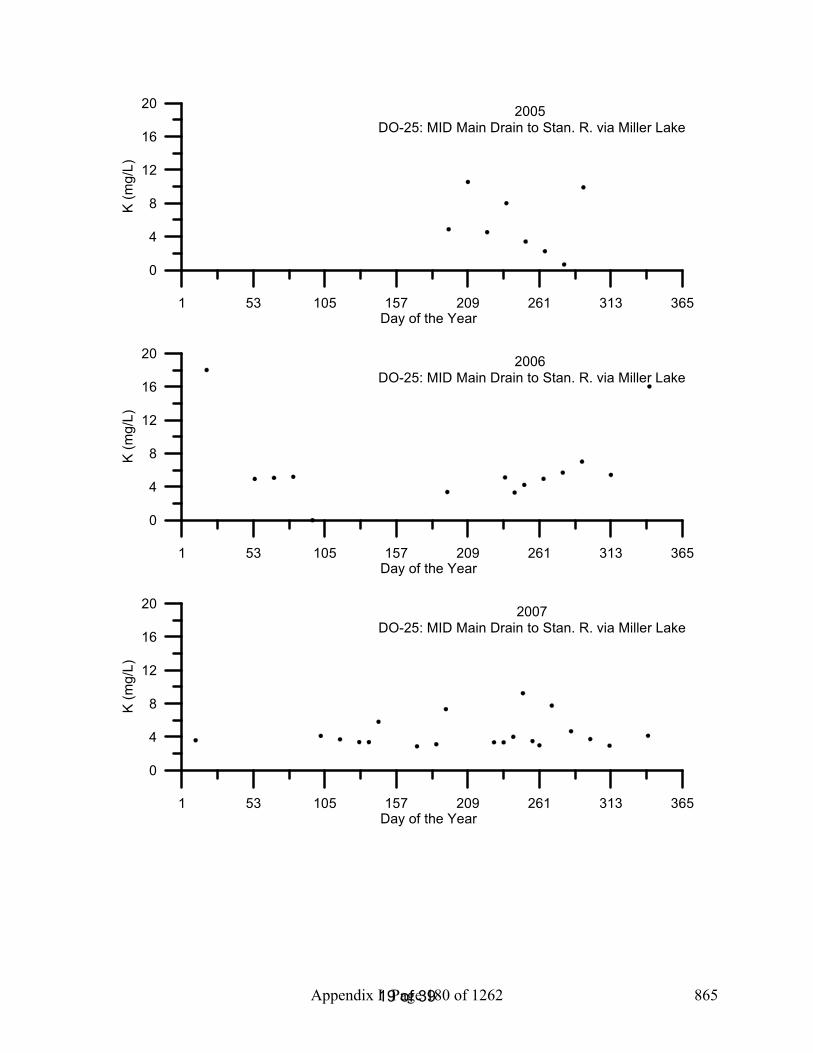
19 of 39
1 53 105 157 209 261 313 365Day of the Year
0
4
8
12
16
20
K (m
g/L)
2005 DO-25: MID Main Drain to Stan. R. via Miller Lake
1 53 105 157 209 261 313 365Day of the Year
0
4
8
12
16
20
K (m
g/L)
2006 DO-25: MID Main Drain to Stan. R. via Miller Lake
1 53 105 157 209 261 313 365Day of the Year
0
4
8
12
16
20
K (m
g/L)
2007DO-25: MID Main Drain to Stan. R. via Miller Lake
Appendix I Page 180 of 1262 865

20 of 39
1 53 105 157 209 261 313 365Day of the Year
0
4
8
12
K (m
g/L)
2005 DO-28: Turlock ID Westport Drain Flow Station
1 53 105 157 209 261 313 365Day of the Year
0
4
8
12
K (m
g/L)
2006 DO-28: Turlock ID Westport Drain Flow Station
1 53 105 157 209 261 313 365Day of the Year
0
10
20
30
40
K (m
g/L)
2007DO-28: Turlock ID Westport Drain Flow Station
Appendix I Page 181 of 1262 866

21 of 39
1 53 105 157 209 261 313 365Day of the Year
0
10
20
30
K (m
g/L)
2005 DO-29: Turlock ID Harding Drain
1 53 105 157 209 261 313 365Day of the Year
0
10
20
30
K (m
g/L)
2006 DO-29: Turlock ID Harding Drain
1 53 105 157 209 261 313 365Day of the Year
0
10
20
30
K (m
g/L)
2007DO-29: Turlock ID Harding Drain
Appendix I Page 182 of 1262 867

22 of 39
1 53 105 157 209 261 313 365Day of the Year
0
4
8
12
16
K (m
g/L)
2005 DO-30: TID Lat 6 & 7 at River Rd.
1 53 105 157 209 261 313 365Day of the Year
0
4
8
12
16
K (m
g/L)
2006 DO-30: TID Lat 6 & 7 at River Rd.
1 53 105 157 209 261 313 365Day of the Year
0
4
8
12
16
K (m
g/L)
2007DO-30: TID Lat 6 & 7 at River Rd.
Appendix I Page 183 of 1262 868

23 of 39
1 53 105 157 209 261 313 365Day of the Year
0
2
4
6
8
K (m
g/L)
2005 DO-33: Hospital Creek
1 53 105 157 209 261 313 365Day of the Year
0
2
4
6
8
K (m
g/L)
2006 DO-33: Hospital Creek
1 53 105 157 209 261 313 365Day of the Year
0
2
4
6
8
K (m
g/L)
2007DO-33: Hospital Creek
Appendix I Page 184 of 1262 869
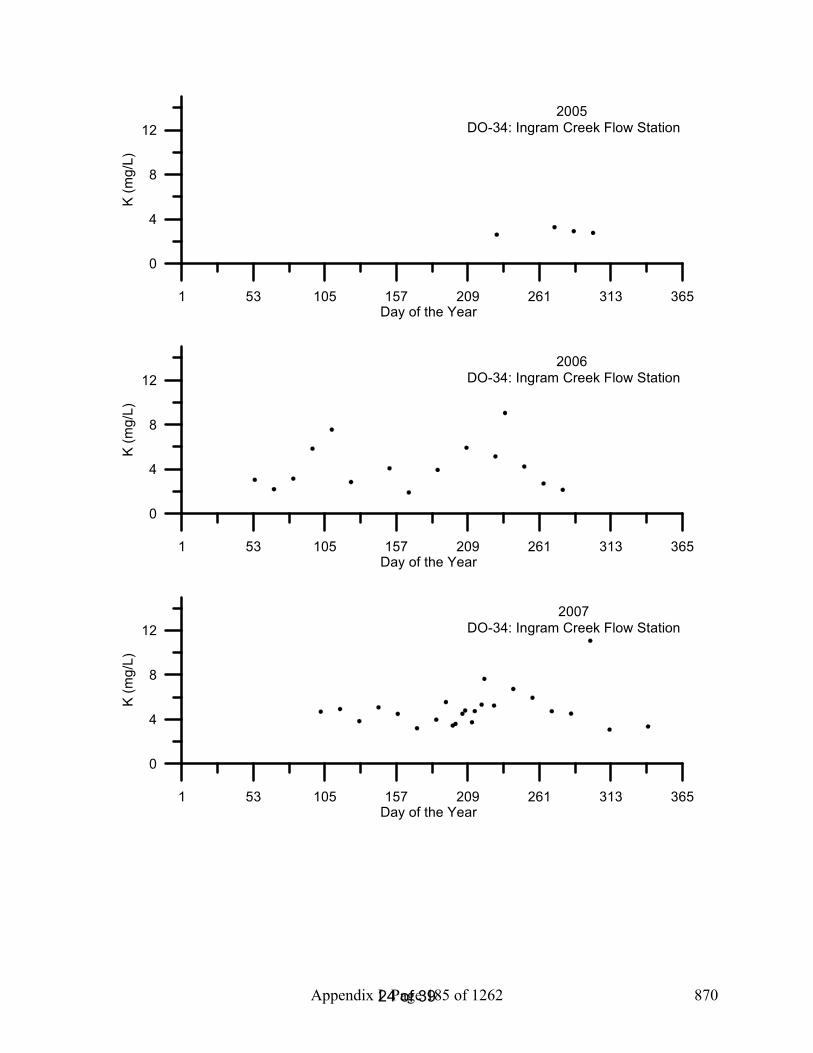
24 of 39
1 53 105 157 209 261 313 365Day of the Year
0
4
8
12K
(mg/
L)2005
DO-34: Ingram Creek Flow Station
1 53 105 157 209 261 313 365Day of the Year
0
4
8
12
K (m
g/L)
2006 DO-34: Ingram Creek Flow Station
1 53 105 157 209 261 313 365Day of the Year
0
4
8
12
K (m
g/L)
2007DO-34: Ingram Creek Flow Station
Appendix I Page 185 of 1262 870
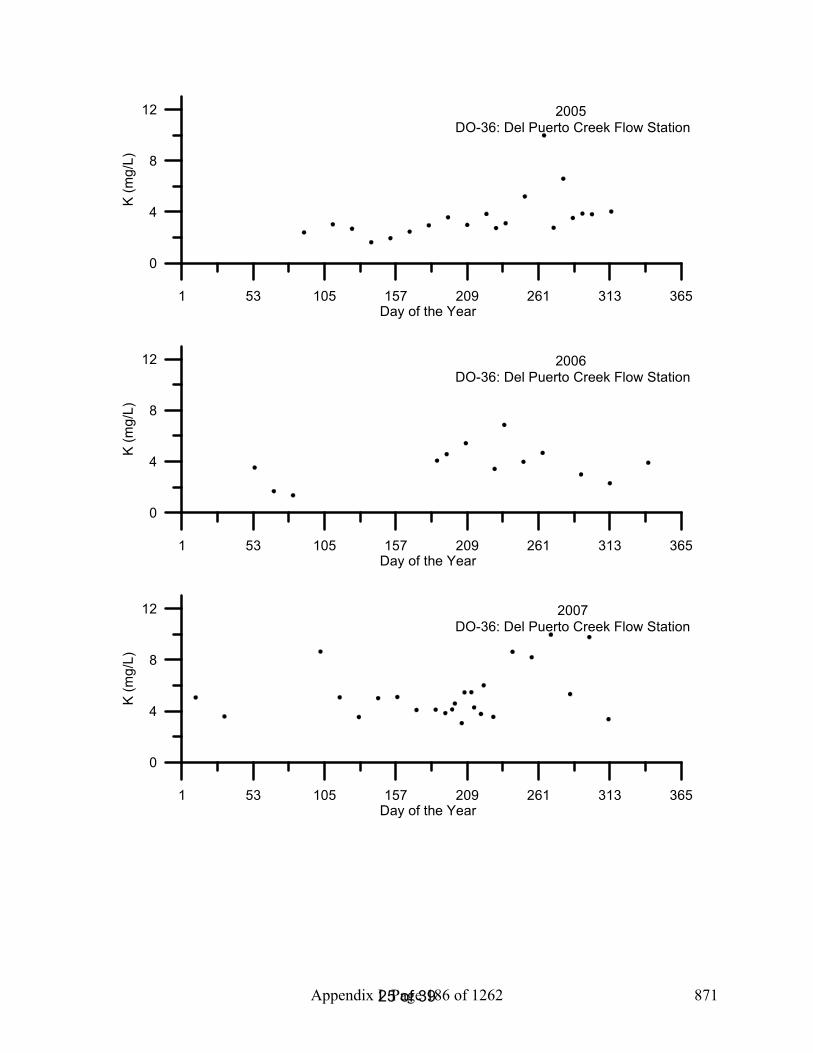
25 of 39
1 53 105 157 209 261 313 365Day of the Year
0
4
8
12K
(mg/
L)2005
DO-36: Del Puerto Creek Flow Station
1 53 105 157 209 261 313 365Day of the Year
0
4
8
12
K (m
g/L)
2006 DO-36: Del Puerto Creek Flow Station
1 53 105 157 209 261 313 365Day of the Year
0
4
8
12
K (m
g/L)
2007DO-36: Del Puerto Creek Flow Station
Appendix I Page 186 of 1262 871
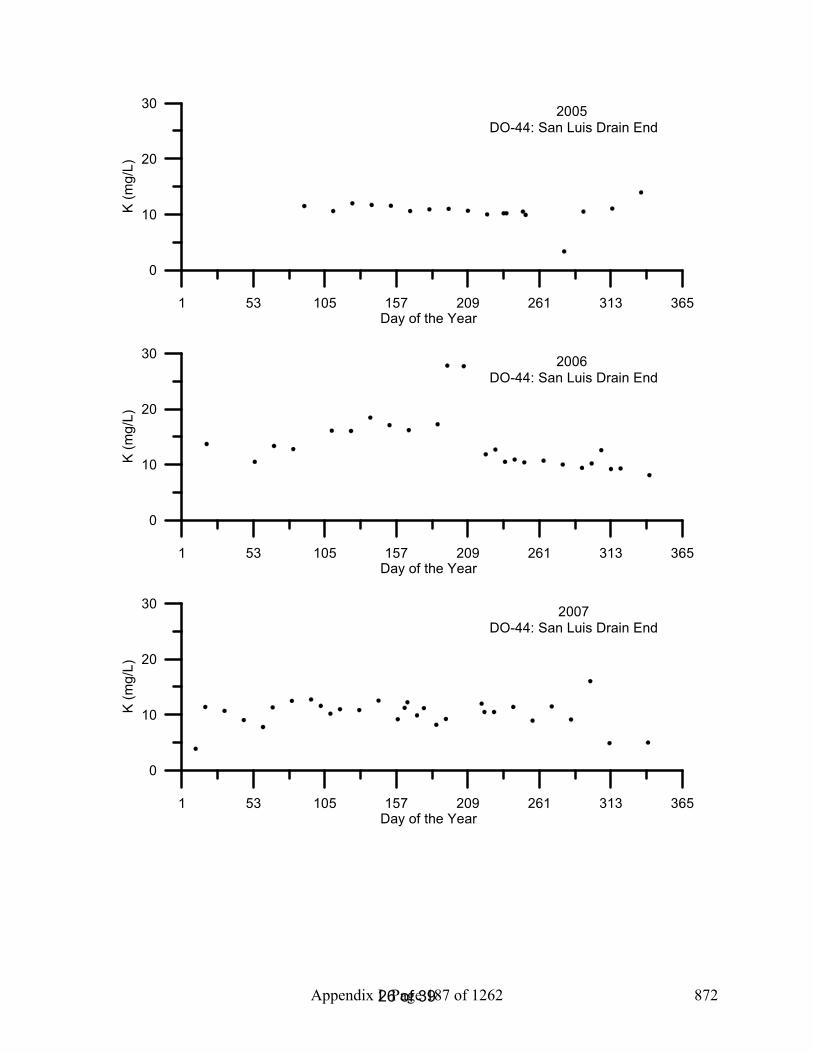
26 of 39
1 53 105 157 209 261 313 365Day of the Year
0
10
20
30
K (m
g/L)
2005 DO-44: San Luis Drain End
1 53 105 157 209 261 313 365Day of the Year
0
10
20
30
K (m
g/L)
2006 DO-44: San Luis Drain End
1 53 105 157 209 261 313 365Day of the Year
0
10
20
30
K (m
g/L)
2007DO-44: San Luis Drain End
Appendix I Page 187 of 1262 872
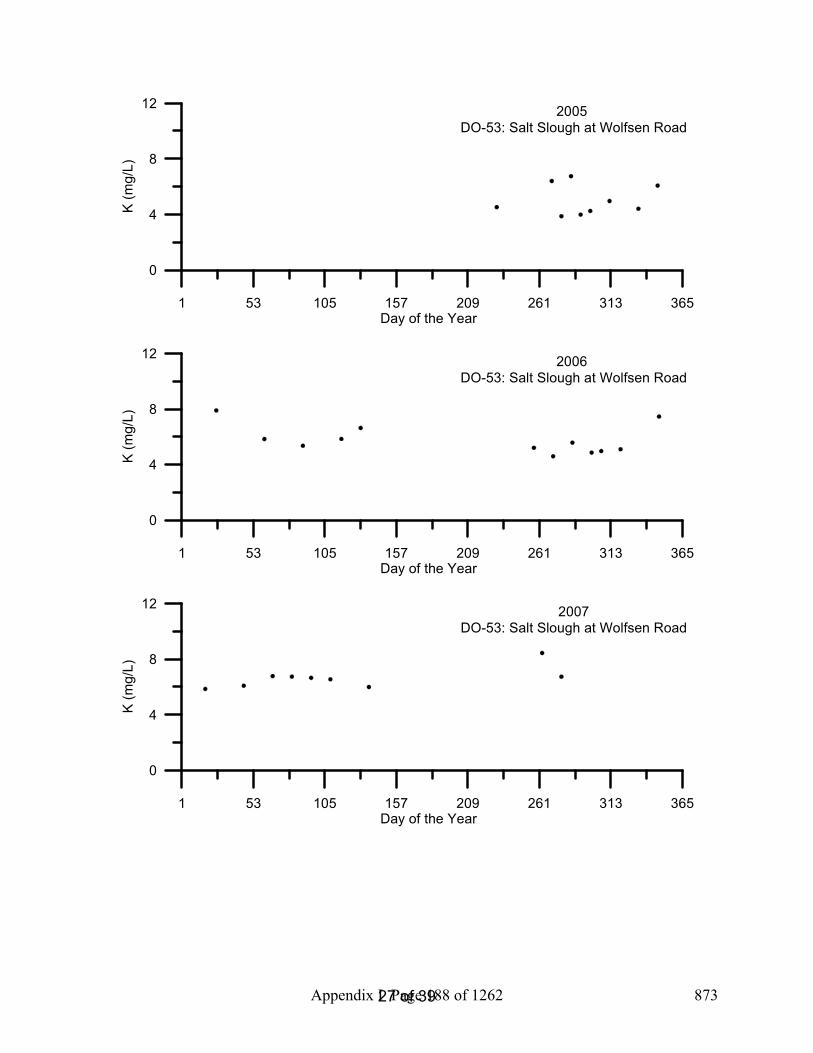
27 of 39
1 53 105 157 209 261 313 365Day of the Year
0
4
8
12
K (m
g/L)
2005 DO-53: Salt Slough at Wolfsen Road
1 53 105 157 209 261 313 365Day of the Year
0
4
8
12
K (m
g/L)
2006 DO-53: Salt Slough at Wolfsen Road
1 53 105 157 209 261 313 365Day of the Year
0
4
8
12
K (m
g/L)
2007DO-53: Salt Slough at Wolfsen Road
Appendix I Page 188 of 1262 873
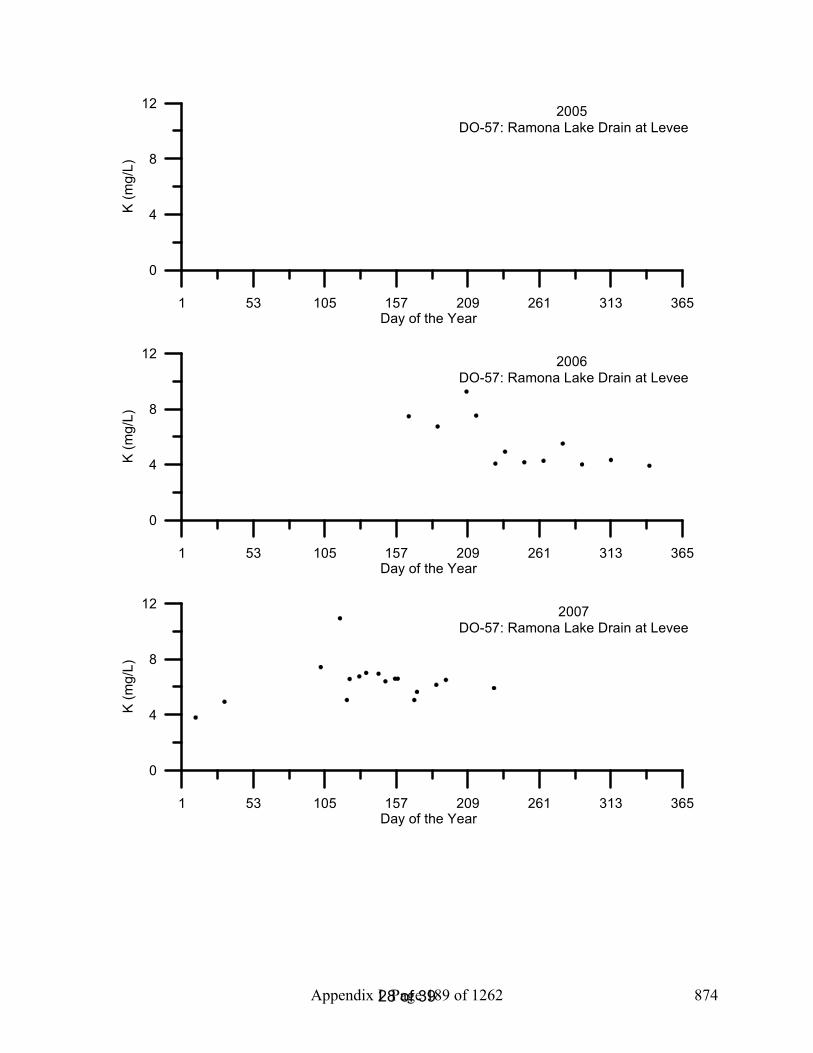
28 of 39
1 53 105 157 209 261 313 365Day of the Year
0
4
8
12
K (m
g/L)
2005 DO-57: Ramona Lake Drain at Levee
1 53 105 157 209 261 313 365Day of the Year
0
4
8
12
K (m
g/L)
2006 DO-57: Ramona Lake Drain at Levee
1 53 105 157 209 261 313 365Day of the Year
0
4
8
12
K (m
g/L)
2007DO-57: Ramona Lake Drain at Levee
Appendix I Page 189 of 1262 874

29 of 39
1 53 105 157 209 261 313 365Day of the Year
0
4
8
12K
(mg/
L)2005
DO-59: SJR Laird Park
1 53 105 157 209 261 313 365Day of the Year
0
4
8
12
K (m
g/L)
2006 DO-59: SJR Laird Park
1 53 105 157 209 261 313 365Day of the Year
0
4
8
12
Na
(mg/
L)
2007DO-59: SJR Laird Park
Appendix I Page 190 of 1262 875
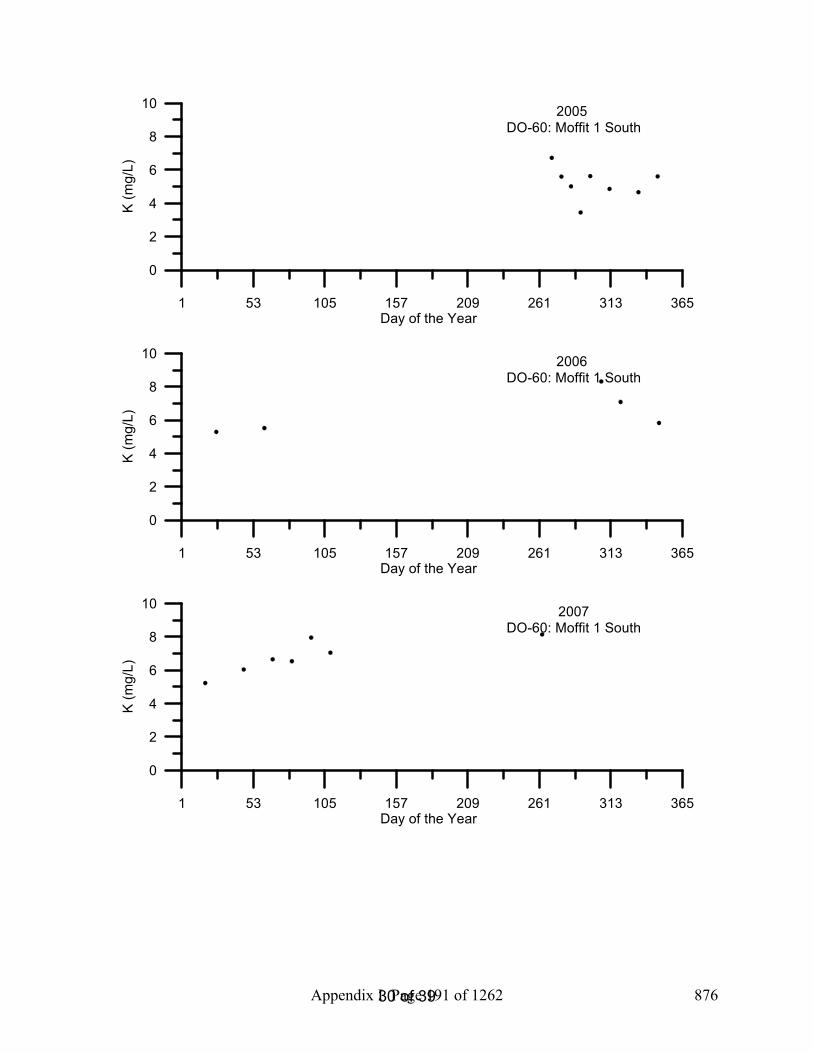
30 of 39
1 53 105 157 209 261 313 365Day of the Year
0
2
4
6
8
10
K (m
g/L)
2005 DO-60: Moffit 1 South
1 53 105 157 209 261 313 365Day of the Year
0
2
4
6
8
10
K (m
g/L)
2006 DO-60: Moffit 1 South
1 53 105 157 209 261 313 365Day of the Year
0
2
4
6
8
10
K (m
g/L)
2007DO-60: Moffit 1 South
Appendix I Page 191 of 1262 876

31 of 39
1 53 105 157 209 261 313 365Day of the Year
0
4
8
12
16
K (m
g/L)
2005 DO-61: Deadman's Slough
1 53 105 157 209 261 313 365Day of the Year
0
4
8
12
16
K (m
g/L)
2006 DO-61: Deadman's Slough
1 53 105 157 209 261 313 365Day of the Year
0
4
8
12
16
K (m
g/L)
2007DO-61: Deadman's Slough
Appendix I Page 192 of 1262 877
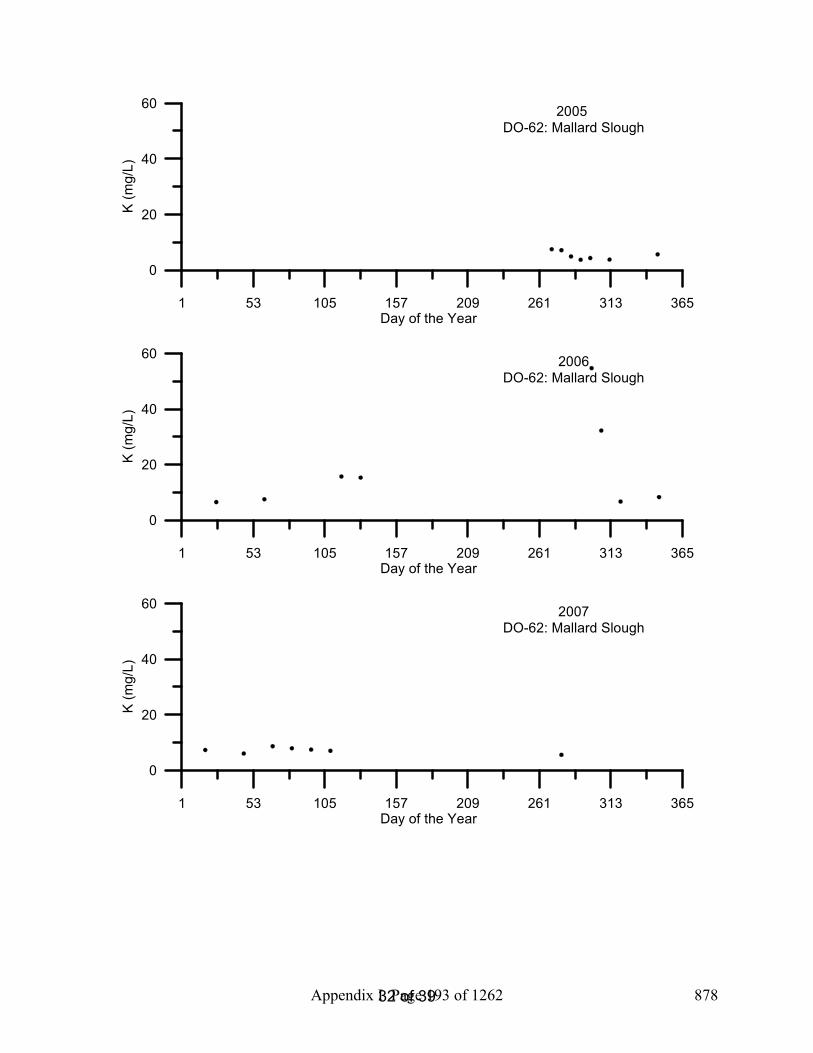
32 of 39
1 53 105 157 209 261 313 365Day of the Year
0
20
40
60
K (m
g/L)
2005 DO-62: Mallard Slough
1 53 105 157 209 261 313 365Day of the Year
0
20
40
60
K (m
g/L)
2006DO-62: Mallard Slough
1 53 105 157 209 261 313 365Day of the Year
0
20
40
60
K (m
g/L)
2007DO-62: Mallard Slough
Appendix I Page 193 of 1262 878

33 of 39
1 53 105 157 209 261 313 365Day of the Year
0
2
4
6
8K
(mg/
L)2005
DO-63: Inlet C Canal
1 53 105 157 209 261 313 365Day of the Year
0
2
4
6
8
K (m
g/L)
2006DO-63: Inlet C Canal
1 53 105 157 209 261 313 365Day of the Year
0
2
4
6
8
K (m
g/L)
2007DO-63: Inlet C Canal
Appendix I Page 194 of 1262 879

34 of 39
1 53 105 157 209 261 313 365Day of the Year
0
2
4
6
8K
(mg/
L)2005
DO-80: South Marsh 1 Inlet
1 53 105 157 209 261 313 365Day of the Year
0
2
4
6
8
K (m
g/L)
2006DO-80: South Marsh 1 Inlet
1 53 105 157 209 261 313 365Day of the Year
0
2
4
6
8
K (m
g/L)
2007DO-80: South Marsh 1 Inlet
Appendix I Page 195 of 1262 880

35 of 39
1 53 105 157 209 261 313 365Day of the Year
0
2
4
6
8
10
K (m
g/L)
2005 DO-81: South Marsh 1 Outlet
1 53 105 157 209 261 313 365Day of the Year
0
2
4
6
8
10
K (m
g/L)
2006DO-81: South Marsh 1 Outlet
1 53 105 157 209 261 313 365Day of the Year
0
2
4
6
8
10
K (m
g/L)
2007DO-81: South Marsh 1 Outlet
Appendix I Page 196 of 1262 881

36 of 39
1 53 105 157 209 261 313 365Day of the Year
0
4
8
12
16
K (m
g/L)
2005 DO-82: South Marsh 3 Inlet
1 53 105 157 209 261 313 365Day of the Year
0
4
8
12
16
K (m
g/L)
2006DO-82: South Marsh 3 Inlet
1 53 105 157 209 261 313 365Day of the Year
0
4
8
12
16
K (m
g/L)
2007DO-82: South Marsh 3 Inlet
Appendix I Page 197 of 1262 882

37 of 39
1 53 105 157 209 261 313 365Day of the Year
0
4
8
12K
(mg/
L)2005
DO-83: South Marsh 3 Outlet
1 53 105 157 209 261 313 365Day of the Year
0
4
8
12
K (m
g/L)
2006DO-83: South Marsh 3 Outlet
1 53 105 157 209 261 313 365Day of the Year
0
4
8
12
K (m
g/L)
2007DO-83: South Marsh 3 Outlet
Appendix I Page 198 of 1262 883

38 of 39
1 53 105 157 209 261 313 365Day of the Year
0
2
4
6
8
10
K (m
g/L)
2005 DO-95: Ramona Lake Entrance
1 53 105 157 209 261 313 365Day of the Year
0
2
4
6
8
10
K (m
g/L)
2006DO-95: Ramona Lake Entrance
1 53 105 157 209 261 313 365Day of the Year
0
2
4
6
8
10
K (m
g/L)
2007DO-95: Ramona Lake Entrance
Appendix I Page 199 of 1262 884

Temporal Plots of 2005-2007 Nitrate Data from the Upstream San Joaquin River
Chelsea Spier1
Remie Burks1
Sharon Borglin1
Randy Dahlgren2
Jeremy Hanlon1
Justin Graham1
William Stringfellow1
February 2008
1Environmental Engineering Research Program School of Engineering & Computer Sciences
University of the Pacific 3601 Pacific Avenue, Sears Hall
Stockton, CA 95211 2UC Davis, Davis, CA
Appendix I Page 200 of 1262 885
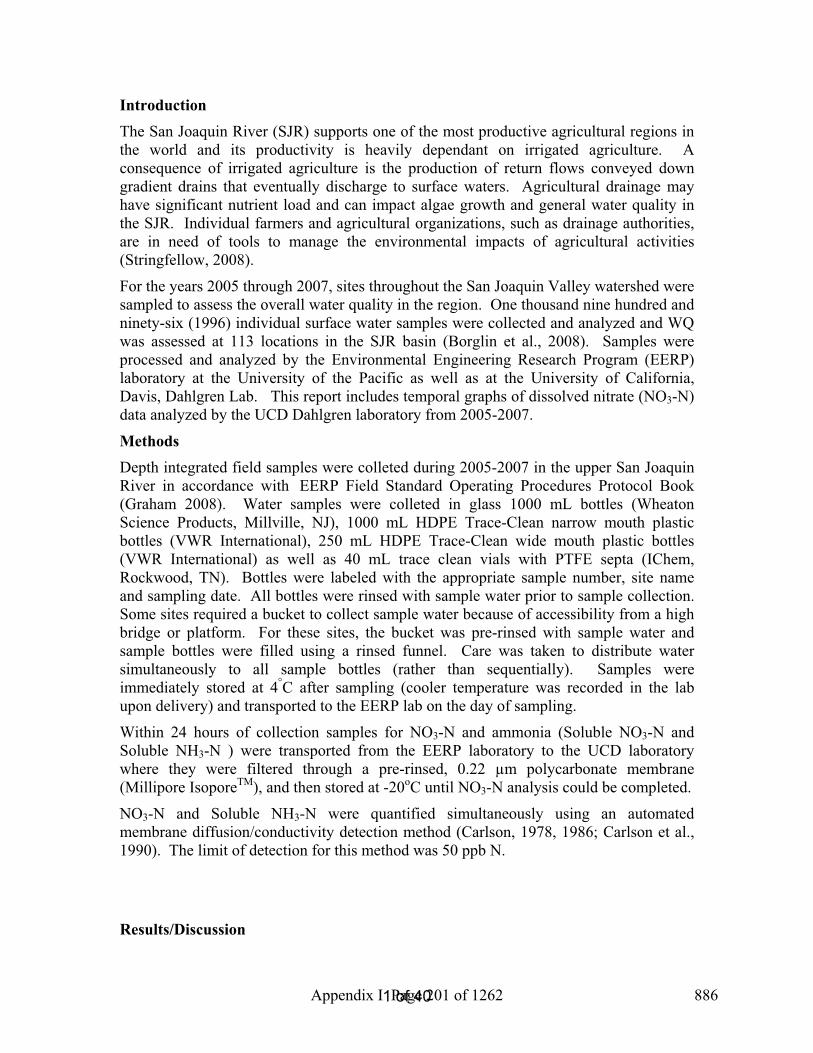
1 of 40
Introduction The San Joaquin River (SJR) supports one of the most productive agricultural regions in the world and its productivity is heavily dependant on irrigated agriculture. A consequence of irrigated agriculture is the production of return flows conveyed down gradient drains that eventually discharge to surface waters. Agricultural drainage may have significant nutrient load and can impact algae growth and general water quality in the SJR. Individual farmers and agricultural organizations, such as drainage authorities, are in need of tools to manage the environmental impacts of agricultural activities (Stringfellow, 2008).
For the years 2005 through 2007, sites throughout the San Joaquin Valley watershed were sampled to assess the overall water quality in the region. One thousand nine hundred and ninety-six (1996) individual surface water samples were collected and analyzed and WQ was assessed at 113 locations in the SJR basin (Borglin et al., 2008). Samples were processed and analyzed by the Environmental Engineering Research Program (EERP) laboratory at the University of the Pacific as well as at the University of California, Davis, Dahlgren Lab. This report includes temporal graphs of dissolved nitrate (NO3-N)data analyzed by the UCD Dahlgren laboratory from 2005-2007.
MethodsDepth integrated field samples were colleted during 2005-2007 in the upper San Joaquin River in accordance with EERP Field Standard Operating Procedures Protocol Book (Graham 2008). Water samples were colleted in glass 1000 mL bottles (Wheaton Science Products, Millville, NJ), 1000 mL HDPE Trace-Clean narrow mouth plastic bottles (VWR International), 250 mL HDPE Trace-Clean wide mouth plastic bottles (VWR International) as well as 40 mL trace clean vials with PTFE septa (IChem, Rockwood, TN). Bottles were labeled with the appropriate sample number, site name and sampling date. All bottles were rinsed with sample water prior to sample collection. Some sites required a bucket to collect sample water because of accessibility from a high bridge or platform. For these sites, the bucket was pre-rinsed with sample water and sample bottles were filled using a rinsed funnel. Care was taken to distribute water simultaneously to all sample bottles (rather than sequentially). Samples were immediately stored at 4°C after sampling (cooler temperature was recorded in the lab upon delivery) and transported to the EERP lab on the day of sampling.
Within 24 hours of collection samples for NO3-N and ammonia (Soluble NO3-N and Soluble NH3-N ) were transported from the EERP laboratory to the UCD laboratory where they were filtered through a pre-rinsed, 0.22 µm polycarbonate membrane (Millipore IsoporeTM), and then stored at -20oC until NO3-N analysis could be completed.
NO3-N and Soluble NH3-N were quantified simultaneously using an automated membrane diffusion/conductivity detection method (Carlson, 1978, 1986; Carlson et al., 1990). The limit of detection for this method was 50 ppb N.
Results/Discussion
Appendix I Page 201 of 1262 886

2 of 40
With each set of NO3-N field samples analyzed in the UCD laboratory, quality assurance samples including a field duplicate, a trip blank, and lab blanks were also analyzed. 100% of all quality assurance samples were within a passing range (Borglin et al, 2008). Proficiency check samples, standards with unknown concentration to the laboratory analyst, were run approximately twice a year. Five proficiency check samples were analyzed for NO3-N in the EERP laboratory during 2007, and all of these samples were found to be within the acceptable range. Samples were measured ranging from 0.0-36.4 mg/L NO3-N. The average concentration of NO3-N in water samples collected was 3.55 mg/L NO3-N. NO3-N was also analyzed by the EERP laboratory on the same water samples starting in the summer of 2007, and has a high correlation to values measured by EERP. When all data points measured by the two labs are compared they have r2=0.983(Spier et al, 2008). NO3-N samples measured by EERP have about 89.3% as much NO3-N as the same samples measured by UCD (Figure 2).
References American Public Health Association (APHA). 2005. Standard Methods for the Examination of
Water and Wastewater, 21st Edition. American Public Health Association, Washington, DC.
Borglin, S., W. Stringfellow, J. Hanlon. 2005. Standard Operating Procedures for the Up-Stream Dissolved Oxygen TMDL Project. LBNL/Pub-937.
Borglin, S., Burks, R., Hanlon, J., Graham, J., Spier, C., Stringfellow, W., and Dahlgren, R., (2008) Methods overview, quality assurance, and quality control, University of the Pacific, Stockton, CA
Borglin, S.E., Burks, R.D., Hanlon, J.S., Stringfellow, W.T. (2008) EERP Lab Protocol Book, University of the Pacific, Stockton, CA.
Carlson, R.M., R. Cabrera, J. Paul, J. Quick and R.Y. Evans. 1990. Rapid direct determination of ammonium and nitrate in soil and plant tissue extracts. Comm. Soil Sci. Plant Anal. 21:1519-1530.
Graham, J., Hanlon, J.S., Stringfellow, W.T., (2008) EERP Field Protocol Book, University of the Pacific, Stockton, CA.
Spier, C., Burks, R., Borglin, S.E. (2008) Comparison of Methods for Analyzing Ammonia, Nitrate and Total Nitrogen, University of the Pacific, Stockton, CA.
Stringfellow, W.T., et al., (2008) Evaluation of Vegitated Ditches, Ponds, and Wetlands as BMPs for Mitigating the Water Quality Impact of Irrigated Agriculture in the San Joaquin Valley, University of the Pacific, Stockton, CA
YSI Environmental Operations Manual (2005) 6-Series Environmental Monitoring Systems, Yellow Springs, OH.
Appendix I Page 202 of 1262 887

3 of 40
Table 1: EERP Sampling Site List DO Number
Site Name Type
4 SJR at Mossdale Core sites 5 SJR at Vernalis-McCune Station (River Club) Core sites, BMP 6 SJR at Maze Core sites, BMP 7 SJR at Patterson Core sites, BMP 8 SJR at Crows Landing Core sites, BMP
10 SJR at Lander Avenue Core sites 12 Stanislaus River at Caswell Park Core sites 14 Tuolumne River at Shiloh Bridge Core sites 16 Merced River at River Road Core sites 18 Mud Slough near Gustine Core sites, Wetland 19 Salt Slough at Lander Avenue Core sites, Wetland 20 Los Banos Creek Flow Station Core sites, Wetland 21 Orestimba Creek at River Road Core sites, BMP 23 Modesto ID Lateral 5 to Tuolumne Core sites 25 Modesto ID Main Drain to Stan. R. via Miller Lake Core sites 28 Turlock ID Westport Drain Flow station Core sites 29 Turlock ID Harding Drain Core sites 30 Turlock ID Lateral 6 & 7 at Levee Core sites 33 Hospital Creek Intermittent, BMP 34 Ingram Creek Core sites, BMP 36 Del Puerto Creek Flow Station Core sites, BMP 44 San Luis Drain End Core sites 53 Salt Slough at Wolfsen Road Wetland 57 Ramona Lake Drain Core sites, BMP 59 SJR Laird Park Core sites 60 Moffit 1 South Wetland 61 Deadman's Slough Wetland 62 Mallard Slough Wetland 63 Inlet C Canal Wetland 80 South Marsh-1-Inlet Wetland 81 South Marsh-1-Outlet Wetland 82 South Marsh-3-Inlet Wetland 83 South Marsh-3-Outlet Wetland 95 Ramona drain at Ramona Lake BMP, Intermittent
Appendix I Page 203 of 1262 888

4 of 40
Figure 1: EERP Sampling Site Map of SJR Watershed and Tributaries
Appendix I Page 204 of 1262 889

5 of 40
Figure 2: UCD vs EERP Timberline Plot of NO3-N.
0 5 10 15 20 25UC Davis N-NO3 (mg/L)
0
4
8
12
16
20E
ER
P N
-NO
3 (m
g/L)
Y = 0.8928* XNumber of data points used = 150r2 = 0.9832
Appendix I Page 205 of 1262 890

6 of 40
Figures 2 -103: Temporal Plots of Dissolved NO3-N By Site ID
1 53 105 157 209 261 313 365Day of the Year
0
1
2
3N
itrat
e (m
g/L
N-N
O3)
2005 DO-04: SJR at Mossdale
1 53 105 157 209 261 313 365Day of the Year
0
1
2
3
Nitr
ate
(mg/
L N
-NO
3)
2006 DO-04: SJR at Mossdale
1 53 105 157 209 261 313 365Day of the Year
0
1
2
3
Nitr
ate
(mg/
L N
-NO
3)
2007 DO-04: SJR at Mossdale
Appendix I Page 206 of 1262 891

7 of 40
1 53 105 157 209 261 313 365Day of the Year
0
1
2
3
4
Nitr
ate
(mg/
L N
-NO
3)2005
DO-05: SJR at Vernalis-McCune Station
1 53 105 157 209 261 313 365Day of the Year
0
1
2
3
4
Nitr
ate
(mg/
L N
-NO
3)
2006 DO-05: SJR at Vernalis-McCune Station
1 53 105 157 209 261 313 365Day of the Year
0
1
2
3
4
Nitr
ate
(mg/
L N
-NO
3)
2007 DO-05: SJR at Vernalis-McCune Station
Appendix I Page 207 of 1262 892
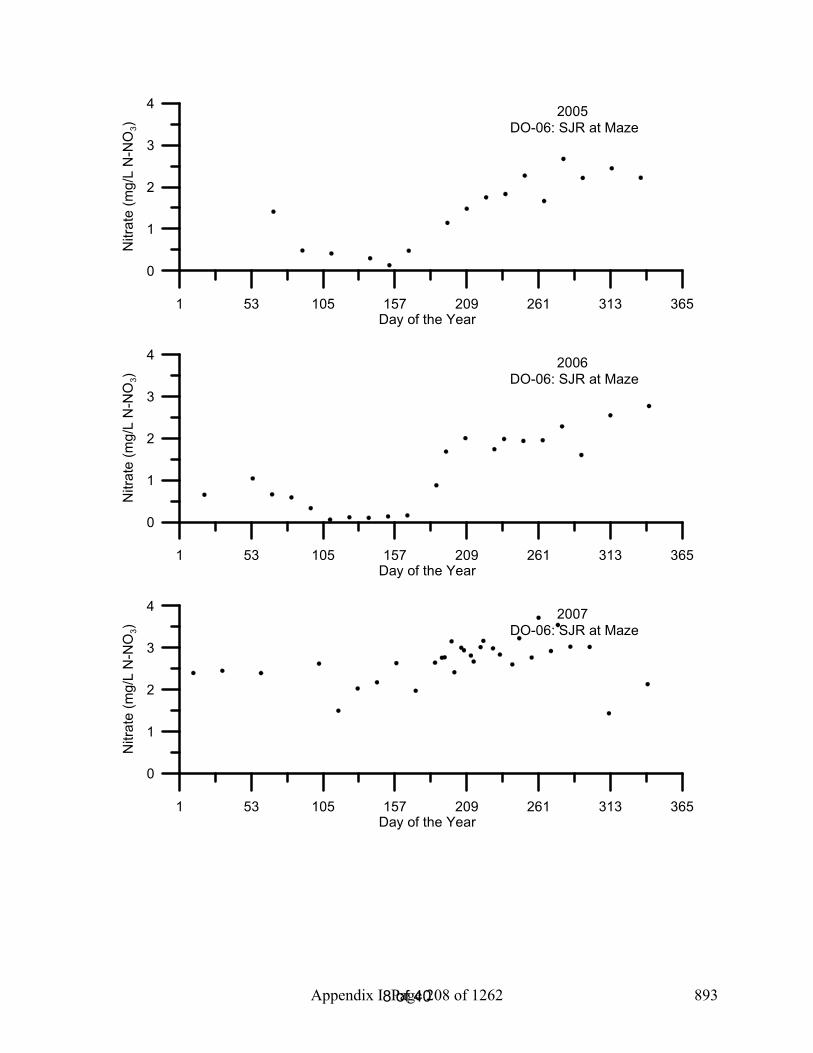
8 of 40
1 53 105 157 209 261 313 365Day of the Year
0
1
2
3
4
Nitr
ate
(mg/
L N
-NO
3)2005
DO-06: SJR at Maze
1 53 105 157 209 261 313 365Day of the Year
0
1
2
3
4
Nitr
ate
(mg/
L N
-NO
3)
2006 DO-06: SJR at Maze
1 53 105 157 209 261 313 365Day of the Year
0
1
2
3
4
Nitr
ate
(mg/
L N
-NO
3)
2007 DO-06: SJR at Maze
Appendix I Page 208 of 1262 893

9 of 40
1 53 105 157 209 261 313 365Day of the Year
0
2
4
6
8
Nitr
ate
(mg/
L N
-NO
3)2005
DO-07: SJR at Patterson
1 53 105 157 209 261 313 365Day of the Year
0
2
4
6
8
Nitr
ate
(mg/
L N
-NO
3)
2006 DO-07: SJR at Patterson
1 53 105 157 209 261 313 365Day of the Year
0
2
4
6
8
Nitr
ate
(mg/
L N
-NO
3)
2007 DO-07: SJR at Patterson
Appendix I Page 209 of 1262 894

10 of 40
1 53 105 157 209 261 313 365Day of the Year
0
2
4
6
8
Nitr
ate
(mg/
L N
-NO
3)2005
DO-08: SJR at Crows Landing
1 53 105 157 209 261 313 365Day of the Year
0
2
4
6
8
Nitr
ate
(mg/
L N
-NO
3)
2006 DO-08: SJR at Crows Landing
1 53 105 157 209 261 313 365Day of the Year
0
2
4
6
8
Nitr
ate
(mg/
L N
-NO
3)
2007 DO-08: SJR at Crows Landing
Appendix I Page 210 of 1262 895

11 of 40
1 53 105 157 209 261 313 365Day of the Year
0
2
4
6
8
Nitr
ate
(mg/
L N
-NO
3)2005
DO-10: SJR at Lander Avenue
1 53 105 157 209 261 313 365Day of the Year
0
2
4
6
8
Nitr
ate
(mg/
L N
-NO
3)
2006 DO-10: SJR at Lander Avenue
1 53 105 157 209 261 313 365Day of the Year
0
2
4
6
8
Nitr
ate
(mg/
L N
-NO
3)
2007DO-10: SJR at Lander Avenue
Appendix I Page 211 of 1262 896

12 of 40
1 53 105 157 209 261 313 365Day of the Year
0
0.2
0.4
0.6
0.8
Nitr
ate
(mg/
L N
-NO
3)2005
DO-12: Stanislaus River at Caswell Park
1 53 105 157 209 261 313 365Day of the Year
0
0.2
0.4
0.6
0.8
Nitr
ate
(mg/
L N
-NO
3)
2006 DO-12: Stanislaus River at Caswell Park
1 53 105 157 209 261 313 365Day of the Year
0
0.2
0.4
0.6
0.8
Nitr
ate
(mg/
L N
-NO
3)
2007DO-12: Stanislaus River at Caswell Park
Appendix I Page 212 of 1262 897

13 of 40
1 53 105 157 209 261 313 365Day of the Year
0
1
2
3
Nitr
ate
(mg/
L N
-NO
3)2005
DO-14: Tuolumne River at Shiloh Bridge
1 53 105 157 209 261 313 365Day of the Year
0
1
2
3
Nitr
ate
(mg/
L N
-NO
3)
2006 DO-14: Tuolumne River at Shiloh Bridge
1 53 105 157 209 261 313 365Day of the Year
0
1
2
3
Nitr
ate
(mg/
L N
-NO
3)
2007DO-14: Tuolumne River at Shiloh Bridge
Appendix I Page 213 of 1262 898

14 of 40
1 53 105 157 209 261 313 365Day of the Year
0
1
2
3
4
Nitr
ate
(mg/
L N
-NO
3)
2005 DO-16: Merced River at River Road
1 53 105 157 209 261 313 365Day of the Year
0
1
2
3
4
Nitr
ate
(mg/
L N
-NO
3)
2006 DO-16: Merced River at River Road
1 53 105 157 209 261 313 365Day of the Year
0
4
8
12
16
Nitr
ate
(mg/
L N
-NO
3)
2007DO-16: Merced River at River Road
Appendix I Page 214 of 1262 899

15 of 40
1 53 105 157 209 261 313 365Day of the Year
0
4
8
12
16
Nitr
ate
(mg/
L N
-NO
3)2005
DO-18: Mud Slough near Gustine
1 53 105 157 209 261 313 365Day of the Year
0
4
8
12
16
Nitr
ate
(mg/
L N
-NO
3)
2006 DO-18: Mud Slough near Gustine
1 53 105 157 209 261 313 365Day of the Year
0
4
8
12
16
Nitr
ate
(mg/
L N
-NO
3)
2007DO-18: Mud Slough near Gustine
Appendix I Page 215 of 1262 900

16 of 40
1 53 105 157 209 261 313 365Day of the Year
0
1
2
3
4
5
Nitr
ate
(mg/
L N
-NO
3)2005
DO-19: Salt Slough at Lander Avenue
1 53 105 157 209 261 313 365Day of the Year
0
1
2
3
4
5
Nitr
ate
(mg/
L N
-NO
3)
2006 DO-19: Salt Slough at Lander Avenue
1 53 105 157 209 261 313 365Day of the Year
0
1
2
3
4
5
Nitr
ate
(mg/
L N
-NO
3)
2007DO-19: Salt Slough at Lander Avenue
Appendix I Page 216 of 1262 901
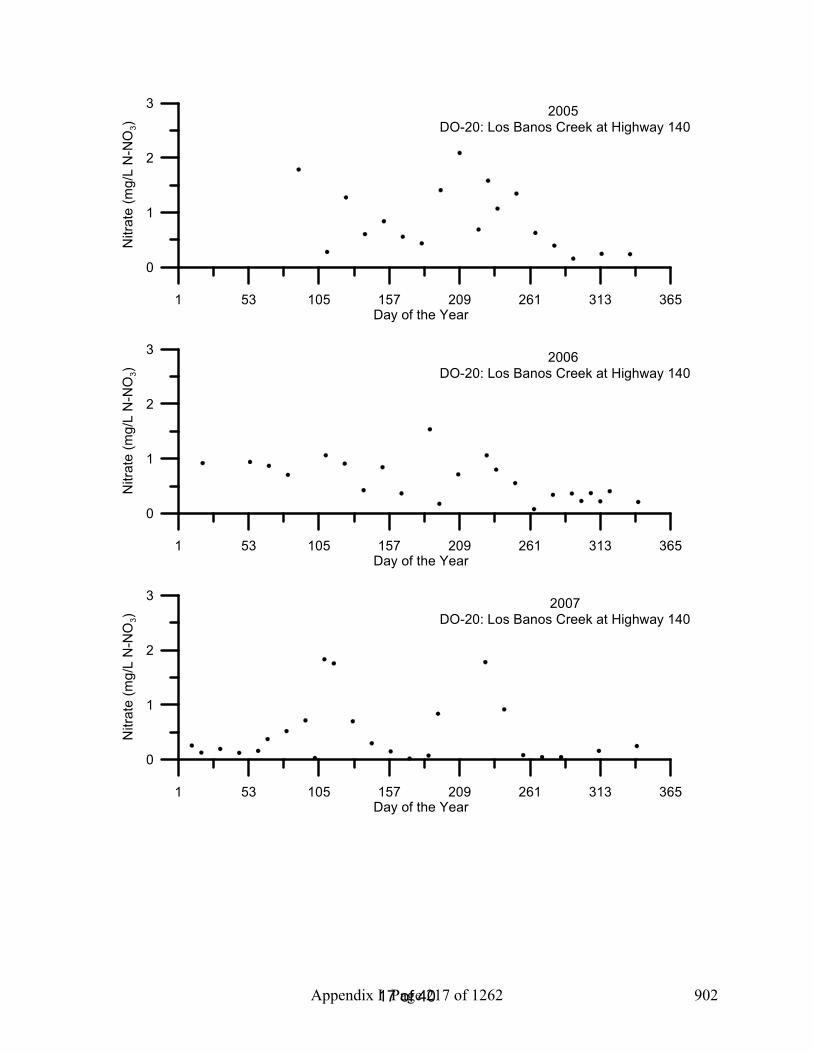
17 of 40
1 53 105 157 209 261 313 365Day of the Year
0
1
2
3
Nitr
ate
(mg/
L N
-NO
3)2005
DO-20: Los Banos Creek at Highway 140
1 53 105 157 209 261 313 365Day of the Year
0
1
2
3
Nitr
ate
(mg/
L N
-NO
3)
2006 DO-20: Los Banos Creek at Highway 140
1 53 105 157 209 261 313 365Day of the Year
0
1
2
3
Nitr
ate
(mg/
L N
-NO
3)
2007DO-20: Los Banos Creek at Highway 140
Appendix I Page 217 of 1262 902

18 of 40
1 53 105 157 209 261 313 365Day of the Year
0
4
8
12
16
Nitr
ate
(mg/
L N
-NO
3)2005
DO-21: Orestimba Creek at River Road
1 53 105 157 209 261 313 365Day of the Year
0
4
8
12
16
Nitr
ate
(mg/
L N
-NO
3)
2006 DO-21: Orestimba Creek at River Road
1 53 105 157 209 261 313 365Day of the Year
0
4
8
12
16
Nitr
ate
(mg/
L N
-NO
3)
2007DO-21: Orestimba Creek at River Road
Appendix I Page 218 of 1262 903

19 of 40
1 53 105 157 209 261 313 365Day of the Year
0
1
2
3
4
5
Nitr
ate
(mg/
L N
-NO
3)
2005 DO-23: Modesto ID Lateral 5 to Tuolumne
1 53 105 157 209 261 313 365Day of the Year
0
4
8
12
16
20
Nitr
ate
(mg/
L N
-NO
3)
2006 DO-23: Modesto ID Lateral 5 to Tuolumne
1 53 105 157 209 261 313 365Day of the Year
0
1
2
3
4
5
Nitr
ate
(mg/
L N
-NO
3)
2007DO-23: Modesto ID Lateral 5 to Tuolumne
Appendix I Page 219 of 1262 904

20 of 40
1 53 105 157 209 261 313 365Day of the Year
0
2
4
6
Nitr
ate
(mg/
L N
-NO
3)2005
DO-25: MID Main Drain to Stan. R. via Miller Lake
1 53 105 157 209 261 313 365Day of the Year
0
2
4
6
Nitr
ate
(mg/
L N
-NO
3)
2006 DO-25: MID Main Drain to Stan. R. via Miller Lake
1 53 105 157 209 261 313 365Day of the Year
0
2
4
6
Nitr
ate
(mg/
L N
-NO
3)
2007DO-25: MID Main Drain to Stan. R. via Miller Lake
Appendix I Page 220 of 1262 905

21 of 40
1 53 105 157 209 261 313 365Day of the Year
0
10
20
30N
itrat
e (m
g/L
N-N
O3) 2005
DO-28: Turlock ID Westport Drain Flow Station
1 53 105 157 209 261 313 365Day of the Year
0
10
20
30
Nitr
ate
(mg/
L N
-NO
3) 2006 DO-28: Turlock ID Westport Drain Flow Station
1 53 105 157 209 261 313 365Day of the Year
0
10
20
30
Nitr
ate
(mg/
L N
-NO
3) 2007DO-28: Turlock ID Westport Drain Flow Station
Appendix I Page 221 of 1262 906

22 of 40
1 53 105 157 209 261 313 365Day of the Year
0
10
20
30
Nitr
ate
(mg/
L N
-NO
3)2005
DO-29: Turlock ID Harding Drain
1 53 105 157 209 261 313 365Day of the Year
0
10
20
30
Nitr
ate
(mg/
L N
-NO
3)
2006 DO-29: Turlock ID Harding Drain
1 53 105 157 209 261 313 365Day of the Year
0
10
20
30
Nitr
ate
(mg/
L N
-NO
3)
2007DO-29: Turlock ID Harding Drain
Appendix I Page 222 of 1262 907

23 of 40
1 53 105 157 209 261 313 365Day of the Year
0
10
20
30
40
Nitr
ate
(mg/
L N
-NO
3)2005
DO-30: TID Lat 6 & 7 at River Rd.
1 53 105 157 209 261 313 365Day of the Year
0
10
20
30
40
Nitr
ate
(mg/
L N
-NO
3)
2006 DO-30: TID Lat 6 & 7 at River Rd.
1 53 105 157 209 261 313 365Day of the Year
0
10
20
30
40
Nitr
ate
(mg/
L N
-NO
3)
2007DO-30: TID Lat 6 & 7 at River Rd.
Appendix I Page 223 of 1262 908

24 of 40
1 53 105 157 209 261 313 365Day of the Year
0
1
2
3
4
Nitr
ate
(mg/
L N
-NO
3)2005
DO-33: Hospital Creek
1 53 105 157 209 261 313 365Day of the Year
0
1
2
3
4
Nitr
ate
(mg/
L N
-NO
3)
2006 DO-33: Hospital Creek
1 53 105 157 209 261 313 365Day of the Year
0
1
2
3
4
Nitr
ate
(mg/
L N
-NO
3)
2007DO-33: Hospital Creek
Appendix I Page 224 of 1262 909

25 of 40
1 53 105 157 209 261 313 365Day of the Year
0
4
8
12
16
20
Nitr
ate
(mg/
L N
-NO
3)2005
DO-34: Ingram Creek Flow Station
1 53 105 157 209 261 313 365Day of the Year
0
4
8
12
16
20
Nitr
ate
(mg/
L N
-NO
3)
2006 DO-34: Ingram Creek Flow Station
1 53 105 157 209 261 313 365Day of the Year
0
4
8
12
16
20
Nitr
ate
(mg/
L N
-NO
3)
2007DO-34: Ingram Creek Flow Station
Appendix I Page 225 of 1262 910

26 of 40
1 53 105 157 209 261 313 365Day of the Year
0
4
8
12N
itrat
e (m
g/L
N-N
O3) 2005
DO-36: Del Puerto Creek Flow Station
1 53 105 157 209 261 313 365Day of the Year
0
4
8
12
Nitr
ate
(mg/
L N
-NO
3) 2006 DO-36: Del Puerto Creek Flow Station
1 53 105 157 209 261 313 365Day of the Year
0
4
8
12
Nitr
ate
(mg/
L N
-NO
3) 2007DO-36: Del Puerto Creek Flow Station
Appendix I Page 226 of 1262 911

27 of 40
1 53 105 157 209 261 313 365Day of the Year
0
10
20
30
Nitr
ate
(mg/
L N
-NO
3)2005
DO-44: San Luis Drain End
1 53 105 157 209 261 313 365Day of the Year
0
10
20
30
Nitr
ate
(mg/
L N
-NO
3)
2006 DO-44: San Luis Drain End
1 53 105 157 209 261 313 365Day of the Year
0
10
20
30
Nitr
ate
(mg/
L N
-NO
3)
2007DO-44: San Luis Drain End
Appendix I Page 227 of 1262 912

28 of 40
1 53 105 157 209 261 313 365Day of the Year
0
1
2
3
4
Nitr
ate
(mg/
L N
-NO
3)2005
DO-53: Salt Slough at Wolfsen Road
1 53 105 157 209 261 313 365Day of the Year
0
1
2
3
4
Nitr
ate
(mg/
L N
-NO
3)
2006 DO-53: Salt Slough at Wolfsen Road
1 53 105 157 209 261 313 365Day of the Year
0
1
2
3
4
Nitr
ate
(mg/
L N
-NO
3)
2007DO-53: Salt Slough at Wolfsen Road
Appendix I Page 228 of 1262 913
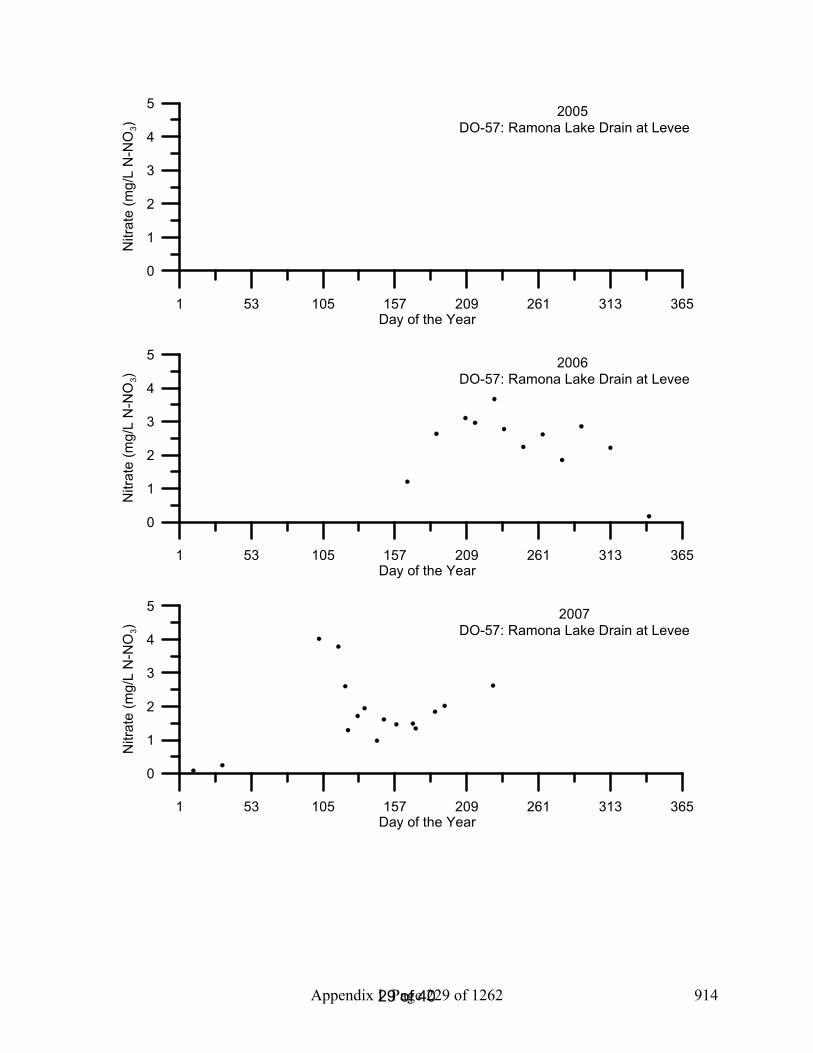
29 of 40
1 53 105 157 209 261 313 365Day of the Year
0
1
2
3
4
5
Nitr
ate
(mg/
L N
-NO
3)2005
DO-57: Ramona Lake Drain at Levee
1 53 105 157 209 261 313 365Day of the Year
0
1
2
3
4
5
Nitr
ate
(mg/
L N
-NO
3)
2006 DO-57: Ramona Lake Drain at Levee
1 53 105 157 209 261 313 365Day of the Year
0
1
2
3
4
5
Nitr
ate
(mg/
L N
-NO
3)
2007DO-57: Ramona Lake Drain at Levee
Appendix I Page 229 of 1262 914

30 of 40
1 53 105 157 209 261 313 365Day of the Year
0
2
4
6
8N
itrat
e (m
g/L
N-N
O3) 2005
DO-59: SJR Laird Park
1 53 105 157 209 261 313 365Day of the Year
0
2
4
6
8
Nitr
ate
(mg/
L N
-NO
3) 2006 DO-59: SJR Laird Park
1 53 105 157 209 261 313 365Day of the Year
0
2
4
6
8
Nitr
ate
(mg/
L N
-NO
3) 2007DO-59: SJR Laird Park
Appendix I Page 230 of 1262 915

31 of 40
1 53 105 157 209 261 313 365Day of the Year
0
0.2
0.4
0.6
0.8
Nitr
ate
(mg/
L N
-NO
3)2005
DO-60: Moffit 1 South
1 53 105 157 209 261 313 365Day of the Year
0
0.2
0.4
0.6
0.8
Nitr
ate
(mg/
L N
-NO
3)
2006 DO-60: Moffit 1 South
1 53 105 157 209 261 313 365Day of the Year
0
0.2
0.4
0.6
0.8
Nitr
ate
(mg/
L N
-NO
3)
2007DO-60: Moffit 1 South
Appendix I Page 231 of 1262 916

32 of 40
1 53 105 157 209 261 313 365Day of the Year
0
1
2
3
4
Nitr
ate
(mg/
L N
-NO
3)2005
DO-61: Deadman's Slough
1 53 105 157 209 261 313 365Day of the Year
0
1
2
3
4
Nitr
ate
(mg/
L N
-NO
3)
2006 DO-61: Deadman's Slough
1 53 105 157 209 261 313 365Day of the Year
0
1
2
3
4
Nitr
ate
(mg/
L N
-NO
3)
2007DO-61: Deadman's Slough
Appendix I Page 232 of 1262 917

33 of 40
1 53 105 157 209 261 313 365Day of the Year
0
0.1
0.2
0.3
0.4
0.5
Nitr
ate
(mg/
L N
-NO
3)2005
DO-62: Mallard Slough
1 53 105 157 209 261 313 365Day of the Year
0
0.1
0.2
0.3
0.4
0.5
Nitr
ate
(mg/
L N
-NO
3)
2006DO-62: Mallard Slough
1 53 105 157 209 261 313 365Day of the Year
0
0.1
0.2
0.3
0.4
0.5
Nitr
ate
(mg/
L N
-NO
3)
2007DO-62: Mallard Slough
Appendix I Page 233 of 1262 918

34 of 40
1 53 105 157 209 261 313 365Day of the Year
0
1
2
3
4
5
Nitr
ate
(mg/
L N
-NO
3)2005
DO-63: Inlet C Canal
1 53 105 157 209 261 313 365Day of the Year
0
1
2
3
4
5
Nitr
ate
(mg/
L N
-NO
3)
2006DO-63: Inlet C Canal
1 53 105 157 209 261 313 365Day of the Year
0
1
2
3
4
5
Nitr
ate
(mg/
L N
-NO
3)
2007DO-63: Inlet C Canal
Appendix I Page 234 of 1262 919
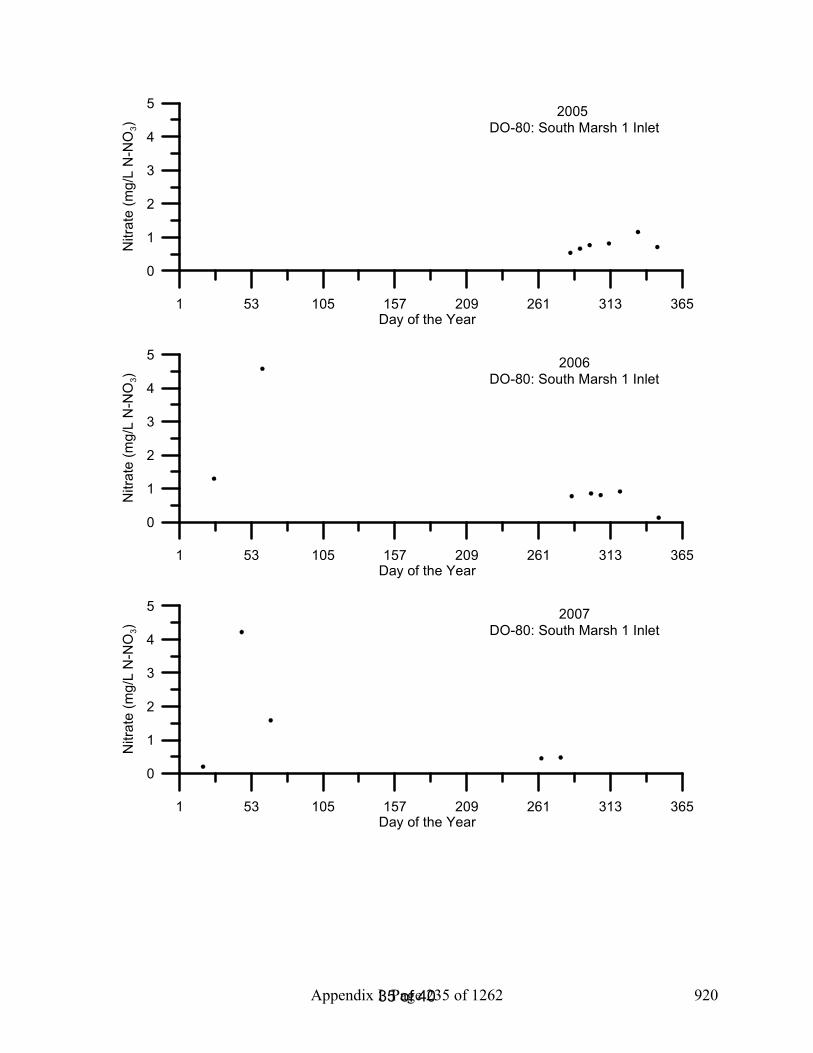
35 of 40
1 53 105 157 209 261 313 365Day of the Year
0
1
2
3
4
5
Nitr
ate
(mg/
L N
-NO
3)2005
DO-80: South Marsh 1 Inlet
1 53 105 157 209 261 313 365Day of the Year
0
1
2
3
4
5
Nitr
ate
(mg/
L N
-NO
3)
2006DO-80: South Marsh 1 Inlet
1 53 105 157 209 261 313 365Day of the Year
0
1
2
3
4
5
Nitr
ate
(mg/
L N
-NO
3)
2007DO-80: South Marsh 1 Inlet
Appendix I Page 235 of 1262 920

36 of 40
1 53 105 157 209 261 313 365Day of the Year
0
1
2
3
Nitr
ate
(mg/
L N
-NO
3)2005
DO-81: South Marsh 1 Outlet
1 53 105 157 209 261 313 365Day of the Year
0
1
2
3
Nitr
ate
(mg/
L N
-NO
3)
2006DO-81: South Marsh 1 Outlet
1 53 105 157 209 261 313 365Day of the Year
0
1
2
3
Nitr
ate
(mg/
L N
-NO
3)
2007DO-81: South Marsh 1 Outlet
Appendix I Page 236 of 1262 921

37 of 40
1 53 105 157 209 261 313 365Day of the Year
0
0.2
0.4
0.6
0.8
Nitr
ate
(mg/
L N
-NO
3)2005
DO-82: South Marsh 3 Inlet
1 53 105 157 209 261 313 365Day of the Year
0
0.2
0.4
0.6
0.8
Nitr
ate
(mg/
L N
-NO
3)
2006DO-82: South Marsh 3 Inlet
1 53 105 157 209 261 313 365Day of the Year
0
0.2
0.4
0.6
0.8
Nitr
ate
(mg/
L N
-NO
3)
2007DO-82: South Marsh 3 Inlet
Appendix I Page 237 of 1262 922

38 of 40
1 53 105 157 209 261 313 365Day of the Year
0
0.1
0.2
0.3
0.4
Nitr
ate
(mg/
L N
-NO
3)2005
DO-83: South Marsh 3 Outlet
1 53 105 157 209 261 313 365Day of the Year
0
0.1
0.2
0.3
0.4
Nitr
ate
(mg/
L N
-NO
3)
2006DO-83: South Marsh 3 Outlet
1 53 105 157 209 261 313 365Day of the Year
0
0.1
0.2
0.3
0.4
Nitr
ate
(mg/
L N
-NO
3)
2007DO-83: South Marsh 3 Outlet
Appendix I Page 238 of 1262 923

39 of 40
1 53 105 157 209 261 313 365Day of the Year
0
2
4
6
8
Nitr
ate
(mg/
L N
-NO
3)2005
DO-95: Ramona Lake Entrance
1 53 105 157 209 261 313 365Day of the Year
0
2
4
6
8
Nitr
ate
(mg/
L N
-NO
3)
2006DO-95: Ramona Lake Entrance
1 53 105 157 209 261 313 365Day of the Year
0
2
4
6
8
Nitr
ate
(mg/
L N
-NO
3)
2007DO-95: Ramona Lake Entrance
Appendix I Page 239 of 1262 924

Temporal Plots of 2005-2007 Magnesium Data from the Upstream San Joaquin River
Chelsea Spier1
Remie Burks1
Sharon Borglin1
Randy Dahlgren2
Jeremy Hanlon1
Justin Graham1
William Stringfellow1
February 2008
1Environmental Engineering Research Program School of Engineering & Computer Sciences
University of the Pacific 3601 Pacific Avenue, Sears Hall
Stockton, CA 95211 2UC Davis, Davis, CA
Appendix I Page 240 of 1262 925
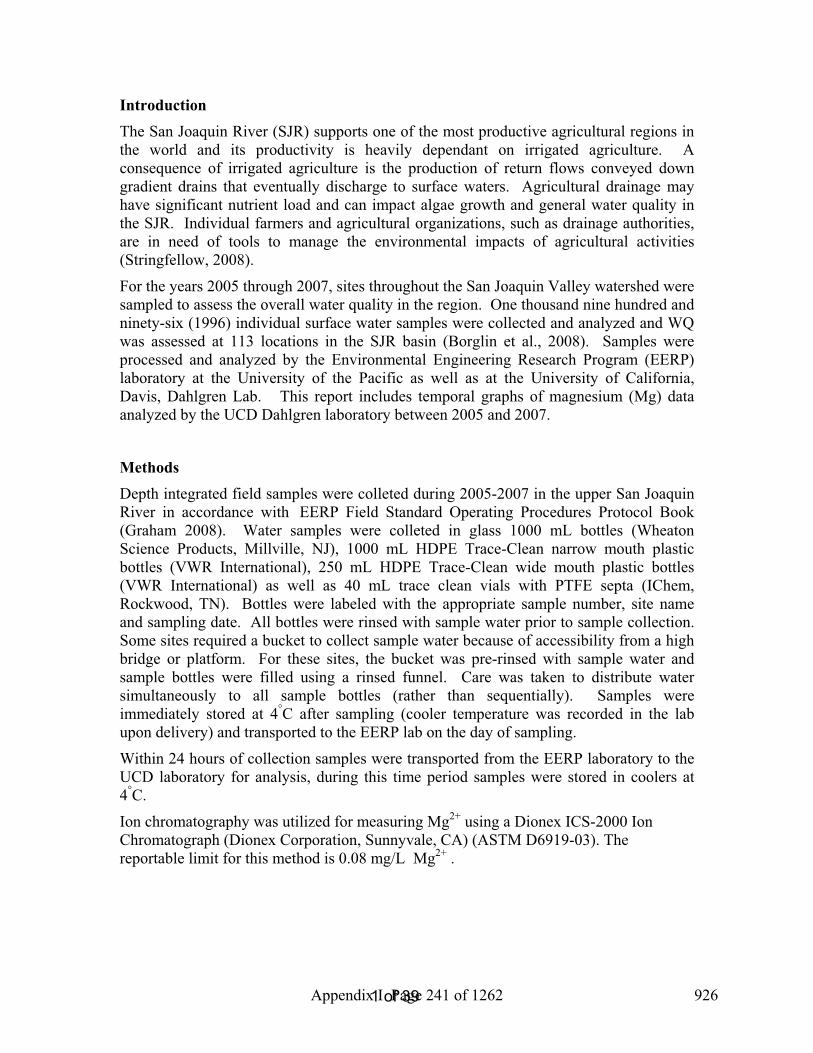
1 of 39
Introduction The San Joaquin River (SJR) supports one of the most productive agricultural regions in the world and its productivity is heavily dependant on irrigated agriculture. A consequence of irrigated agriculture is the production of return flows conveyed down gradient drains that eventually discharge to surface waters. Agricultural drainage may have significant nutrient load and can impact algae growth and general water quality in the SJR. Individual farmers and agricultural organizations, such as drainage authorities, are in need of tools to manage the environmental impacts of agricultural activities (Stringfellow, 2008).
For the years 2005 through 2007, sites throughout the San Joaquin Valley watershed were sampled to assess the overall water quality in the region. One thousand nine hundred and ninety-six (1996) individual surface water samples were collected and analyzed and WQ was assessed at 113 locations in the SJR basin (Borglin et al., 2008). Samples were processed and analyzed by the Environmental Engineering Research Program (EERP) laboratory at the University of the Pacific as well as at the University of California, Davis, Dahlgren Lab. This report includes temporal graphs of magnesium (Mg) data analyzed by the UCD Dahlgren laboratory between 2005 and 2007.
MethodsDepth integrated field samples were colleted during 2005-2007 in the upper San Joaquin River in accordance with EERP Field Standard Operating Procedures Protocol Book (Graham 2008). Water samples were colleted in glass 1000 mL bottles (Wheaton Science Products, Millville, NJ), 1000 mL HDPE Trace-Clean narrow mouth plastic bottles (VWR International), 250 mL HDPE Trace-Clean wide mouth plastic bottles (VWR International) as well as 40 mL trace clean vials with PTFE septa (IChem, Rockwood, TN). Bottles were labeled with the appropriate sample number, site name and sampling date. All bottles were rinsed with sample water prior to sample collection. Some sites required a bucket to collect sample water because of accessibility from a high bridge or platform. For these sites, the bucket was pre-rinsed with sample water and sample bottles were filled using a rinsed funnel. Care was taken to distribute water simultaneously to all sample bottles (rather than sequentially). Samples were immediately stored at 4°C after sampling (cooler temperature was recorded in the lab upon delivery) and transported to the EERP lab on the day of sampling.
Within 24 hours of collection samples were transported from the EERP laboratory to the UCD laboratory for analysis, during this time period samples were stored in coolers at 4°C.
Ion chromatography was utilized for measuring Mg2+ using a Dionex ICS-2000 Ion Chromatograph (Dionex Corporation, Sunnyvale, CA) (ASTM D6919-03). The reportable limit for this method is 0.08 mg/L Mg2+ .
Appendix I Page 241 of 1262 926

2 of 39
Results/DiscussionSamples were measured ranging from 0.0-957.3 mg/L Mg. The average concentration of Mg in samples collected was 29.7 mg/L Mg. These temporal plots (Figures 3-104) created an easy visual way to find outliers and double check data entry for possible mistakes.
References American Public Health Association (APHA). 2005. Standard Methods for the Examination of
Water and Wastewater, 21st Edition. American Public Health Association, Washington, DC.
Borglin, S., W. Stringfellow, J. Hanlon. 2005. Standard Operating Procedures for the Up-Stream Dissolved Oxygen TMDL Project. LBNL/Pub-937.
Borglin, S., Burks, R., Hanlon, J., Graham, J., Spier, C., Stringfellow, W., and Dahlgren, R., (2008) Methods overview, quality assurance, and quality control, University of the Pacific, Stockton, CA
Borglin, S.E., Burks, R.D., Hanlon, J.S., Stringfellow, W.T. (2008) EERP Lab Protocol Book, University of the Pacific, Stockton, CA.
Graham, J., Hanlon, J.S., Stringfellow, W.T., (2008) EERP Field Protocol Book, University of the Pacific, Stockton, CA.
Stringfellow, W.T., et al., (2008) Evaluation of Vegitated Ditches, Ponds, and Wetlands as BMPs for Mitigating the Water Quality Impact of Irrigated Agriculture in the San Joaquin Valley, University of the Pacific, Stockton, CA
YSI Environmental Operations Manual (2005) 6-Series Environmental Monitoring Systems, Yellow Springs, OH.
Appendix I Page 242 of 1262 927

3 of 39
Table 1: EERP Sampling Site List DO Number
Site Name Type
4 SJR at Mossdale Core sites 5 SJR at Vernalis-McCune Station (River Club) Core sites, BMP 6 SJR at Maze Core sites, BMP 7 SJR at Patterson Core sites, BMP 8 SJR at Crows Landing Core sites, BMP
10 SJR at Lander Avenue Core sites 12 Stanislaus River at Caswell Park Core sites 14 Tuolumne River at Shiloh Bridge Core sites 16 Merced River at River Road Core sites 18 Mud Slough near Gustine Core sites, Wetland 19 Salt Slough at Lander Avenue Core sites, Wetland 20 Los Banos Creek Flow Station Core sites, Wetland 21 Orestimba Creek at River Road Core sites, BMP 23 Modesto ID Lateral 5 to Tuolumne Core sites 25 Modesto ID Main Drain to Stan. R. via Miller Lake Core sites 28 Turlock ID Westport Drain Flow station Core sites 29 Turlock ID Harding Drain Core sites 30 Turlock ID Lateral 6 & 7 at Levee Core sites 33 Hospital Creek Intermittent, BMP 34 Ingram Creek Core sites, BMP 36 Del Puerto Creek Flow Station Core sites, BMP 44 San Luis Drain End Core sites 53 Salt Slough at Wolfsen Road Wetland 57 Ramona Lake Drain Core sites, BMP 59 SJR Laird Park Core sites 60 Moffit 1 South Wetland 61 Deadman's Slough Wetland 62 Mallard Slough Wetland 63 Inlet C Canal Wetland 80 South Marsh-1-Inlet Wetland 81 South Marsh-1-Outlet Wetland 82 South Marsh-3-Inlet Wetland 83 South Marsh-3-Outlet Wetland 95 Ramona drain at Ramona Lake BMP, Intermittent
Appendix I Page 243 of 1262 928
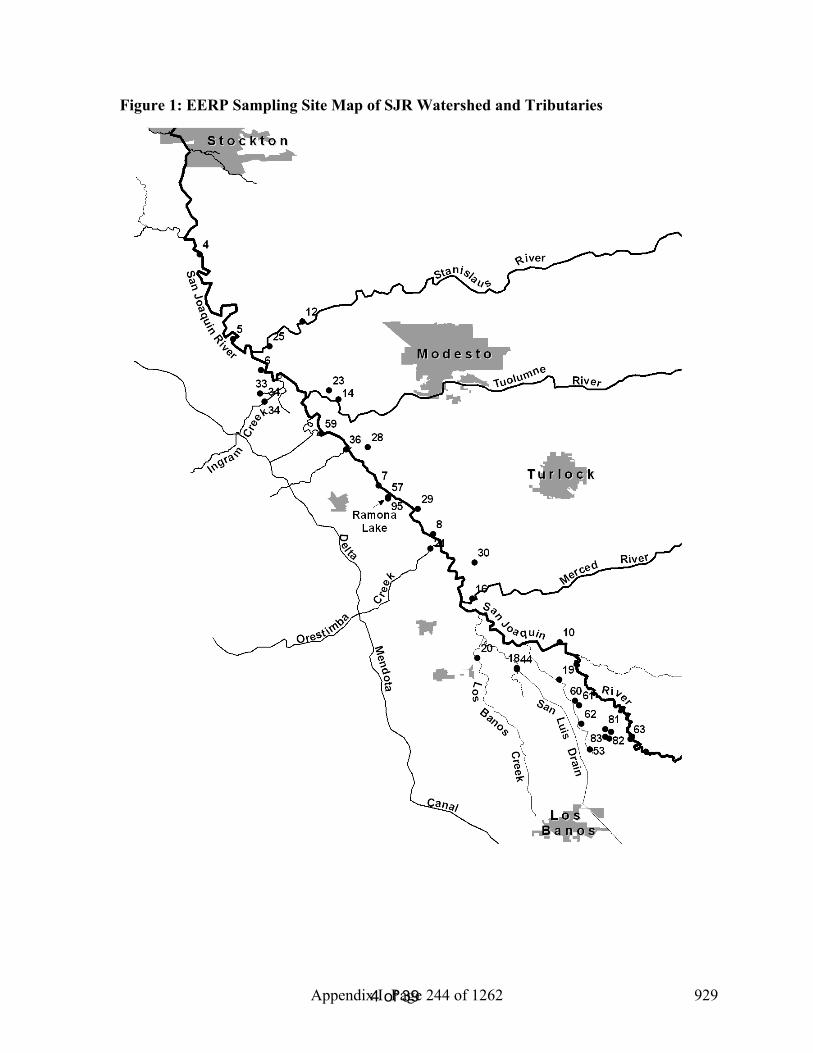
4 of 39
Figure 1: EERP Sampling Site Map of SJR Watershed and Tributaries
Appendix I Page 244 of 1262 929
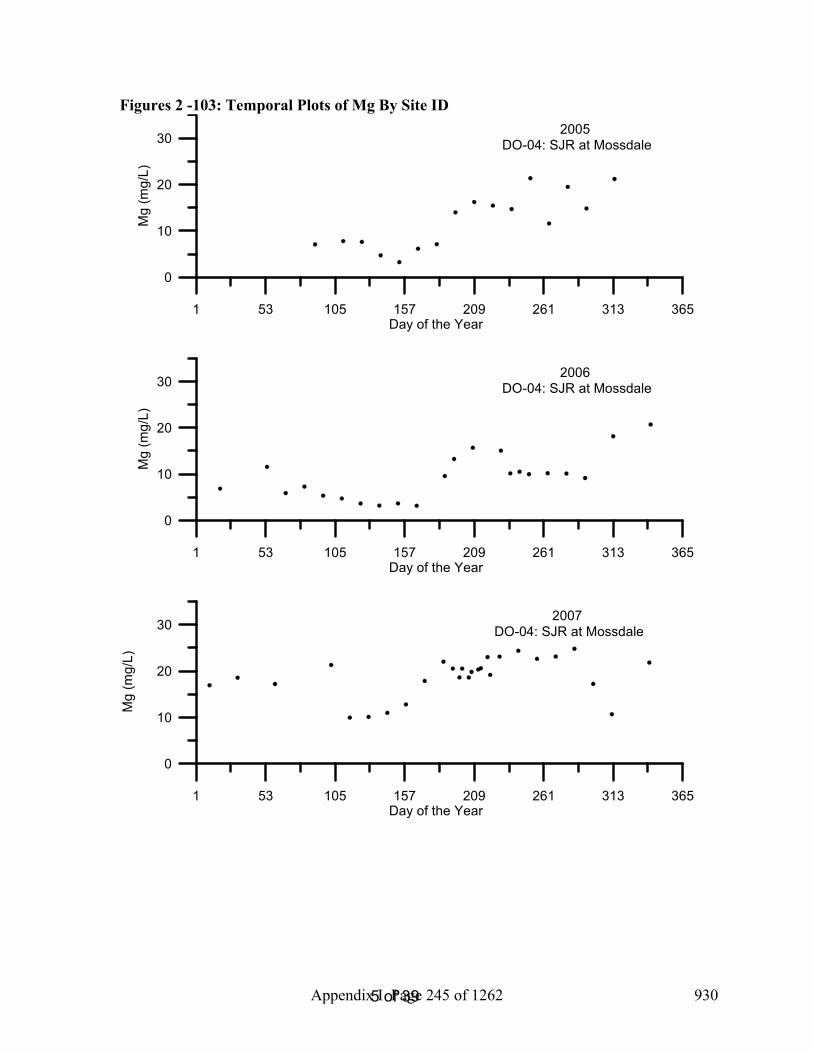
5 of 39
Figures 2 -103: Temporal Plots of Mg By Site ID
1 53 105 157 209 261 313 365Day of the Year
0
10
20
30M
g (m
g/L)
2005 DO-04: SJR at Mossdale
1 53 105 157 209 261 313 365Day of the Year
0
10
20
30
Mg
(mg/
L)
2006 DO-04: SJR at Mossdale
1 53 105 157 209 261 313 365Day of the Year
0
10
20
30
Mg
(mg/
L)
2007 DO-04: SJR at Mossdale
Appendix I Page 245 of 1262 930

6 of 39
1 53 105 157 209 261 313 365Day of the Year
0
10
20
30
Mg
(mg/
L)2005
DO-05: SJR at Vernalis-McCune Station
1 53 105 157 209 261 313 365Day of the Year
0
10
20
30
Mg
(mg/
L)
2006 DO-05: SJR at Vernalis-McCune Station
1 53 105 157 209 261 313 365Day of the Year
0
10
20
30
Mg
(mg/
L)
2007 DO-05: SJR at Vernalis-McCune Station
Appendix I Page 246 of 1262 931

7 of 39
1 53 105 157 209 261 313 365Day of the Year
0
10
20
30
40
Mg
(mg/
L)2005
DO-06: SJR at Maze
1 53 105 157 209 261 313 365Day of the Year
0
10
20
30
40
Mg
(mg/
L)
2006 DO-06: SJR at Maze
1 53 105 157 209 261 313 365Day of the Year
0
10
20
30
40
Mg
(mg/
L)
2007 DO-06: SJR at Maze
Appendix I Page 247 of 1262 932

8 of 39
1 53 105 157 209 261 313 365Day of the Year
0
10
20
30
40
50
Mg
(mg/
L)2005
DO-07: SJR at Patterson
1 53 105 157 209 261 313 365Day of the Year
0
10
20
30
40
50
Mg
(mg/
L)
2006 DO-07: SJR at Patterson
1 53 105 157 209 261 313 365Day of the Year
0
10
20
30
40
50
Mg
(mg/
L)
2007 DO-07: SJR at Patterson
Appendix I Page 248 of 1262 933

9 of 39
1 53 105 157 209 261 313 365Day of the Year
0
10
20
30
40
50
Mg
(mg/
L)2005
DO-08: SJR at Crows Landing
1 53 105 157 209 261 313 365Day of the Year
0
10
20
30
40
50
Mg
(mg/
L)
2006 DO-08: SJR at Crows Landing
1 53 105 157 209 261 313 365Day of the Year
0
10
20
30
40
50
Mg
(mg/
L)
2007DO-08: SJR at Crows Landing
Appendix I Page 249 of 1262 934

10 of 39
1 53 105 157 209 261 313 365Day of the Year
0
10
20
30
40
50
Mg
(mg/
L)2005
DO-10: SJR at Lander Avenue
1 53 105 157 209 261 313 365Day of the Year
0
10
20
30
40
50
Mg
(mg/
L)
2006 DO-10: SJR at Lander Avenue
1 53 105 157 209 261 313 365Day of the Year
0
10
20
30
40
50
Mg
(mg/
L)
2007DO-10: SJR at Lander Avenue
Appendix I Page 250 of 1262 935

11 of 39
1 53 105 157 209 261 313 365Day of the Year
0
2
4
6
8
10
Mg
(mg/
L)2005
DO-12: Stanislaus River at Caswell Park
1 53 105 157 209 261 313 365Day of the Year
0
2
4
6
8
10
Mg
(mg/
L)
2006 DO-12: Stanislaus River at Caswell Park
1 53 105 157 209 261 313 365Day of the Year
0
2
4
6
8
10
Mg
(mg/
L)
2007DO-12: Stanislaus River at Caswell Park
Appendix I Page 251 of 1262 936
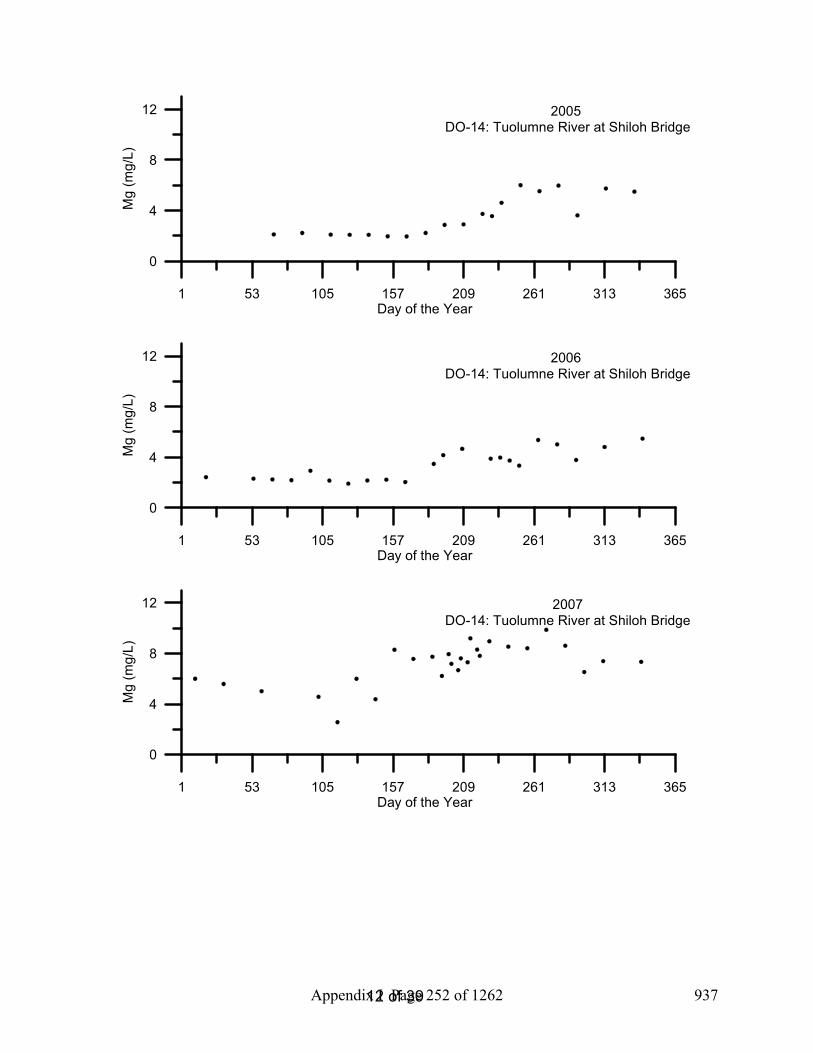
12 of 39
1 53 105 157 209 261 313 365Day of the Year
0
4
8
12M
g (m
g/L)
2005 DO-14: Tuolumne River at Shiloh Bridge
1 53 105 157 209 261 313 365Day of the Year
0
4
8
12
Mg
(mg/
L)
2006 DO-14: Tuolumne River at Shiloh Bridge
1 53 105 157 209 261 313 365Day of the Year
0
4
8
12
Mg
(mg/
L)
2007DO-14: Tuolumne River at Shiloh Bridge
Appendix I Page 252 of 1262 937

13 of 39
1 53 105 157 209 261 313 365Day of the Year
0
4
8
12
16
Mg
(mg/
L)2005
DO-16: Merced River at River Road
1 53 105 157 209 261 313 365Day of the Year
0
4
8
12
16
Mg
(mg/
L)
2006 DO-16: Merced River at River Road
1 53 105 157 209 261 313 365Day of the Year
0
4
8
12
16
Mg
(mg/
L)
2007DO-16: Merced River at River Road
Appendix I Page 253 of 1262 938

14 of 39
1 53 105 157 209 261 313 365Day of the Year
0
40
80
120M
g (m
g/L)
2005 DO-18: Mud Slough near Gustine
1 53 105 157 209 261 313 365Day of the Year
0
40
80
120
Mg
(mg/
L)
2006 DO-18: Mud Slough near Gustine
1 53 105 157 209 261 313 365Day of the Year
0
40
80
120
Mg
(mg/
L)
2007DO-18: Mud Slough near Gustine
Appendix I Page 254 of 1262 939

15 of 39
1 53 105 157 209 261 313 365Day of the Year
0
20
40
60
80
Mg
(mg/
L)2005
DO-19: Salt Slough at Lander Avenue
1 53 105 157 209 261 313 365Day of the Year
0
20
40
60
80
Mg
(mg/
L)
2006 DO-19: Salt Slough at Lander Avenue
1 53 105 157 209 261 313 365Day of the Year
0
20
40
60
80
Mg
(mg/
L)
2007DO-19: Salt Slough at Lander Avenue
Appendix I Page 255 of 1262 940

16 of 39
1 53 105 157 209 261 313 365Day of the Year
0
40
80
120
Mg
(mg/
L)2005
DO-20: Los Banos Creek at Highway 140
1 53 105 157 209 261 313 365Day of the Year
0
40
80
120
Mg
(mg/
L)
2006 DO-20: Los Banos Creek at Highway 140
1 53 105 157 209 261 313 365Day of the Year
0
40
80
120
Mg
(mg/
L)
2007DO-20: Los Banos Creek at Highway 140
Appendix I Page 256 of 1262 941

17 of 39
1 53 105 157 209 261 313 365Day of the Year
0
20
40
60
Mg
(mg/
L)2005
DO-21: Orestimba Creek at River Road
1 53 105 157 209 261 313 365Day of the Year
0
20
40
60
Mg
(mg/
L)
2006DO-21: Orestimba Creek at River Road
1 53 105 157 209 261 313 365Day of the Year
0
20
40
60
Mg
(mg/
L)
2007DO-21: Orestimba Creek at River Road
Appendix I Page 257 of 1262 942

18 of 39
1 53 105 157 209 261 313 365Day of the Year
0
5
10
15
20
25
Mg
(mg/
L)2005
DO-23: Modesto ID Lateral 5 to Tuolumne
1 53 105 157 209 261 313 365Day of the Year
0
5
10
15
20
25
Mg
(mg/
L)
2006 DO-23: Modesto ID Lateral 5 to Tuolumne
1 53 105 157 209 261 313 365Day of the Year
0
5
10
15
20
25
Mg
(mg/
L)
2007DO-23: Modesto ID Lateral 5 to Tuolumne
Appendix I Page 258 of 1262 943

19 of 39
1 53 105 157 209 261 313 365Day of the Year
0
10
20
30
40
50
Mg
(mg/
L)2005
DO-25: MID Main Drain to Stan. R. via Miller Lake
1 53 105 157 209 261 313 365Day of the Year
0
10
20
30
40
50
Mg
(mg/
L)
2006 DO-25: MID Main Drain to Stan. R. via Miller Lake
1 53 105 157 209 261 313 365Day of the Year
0
10
20
30
40
50
Mg
(mg/
L)
2007DO-25: MID Main Drain to Stan. R. via Miller Lake
Appendix I Page 259 of 1262 944

20 of 39
1 53 105 157 209 261 313 365Day of the Year
0
10
20
30
40
Mg
(mg/
L)2005
DO-28: Turlock ID Westport Drain Flow Station
1 53 105 157 209 261 313 365Day of the Year
0
10
20
30
40
Mg
(mg/
L)
2006 DO-28: Turlock ID Westport Drain Flow Station
1 53 105 157 209 261 313 365Day of the Year
0
10
20
30
40
Mg
(mg/
L)
2007DO-28: Turlock ID Westport Drain Flow Station
Appendix I Page 260 of 1262 945

21 of 39
1 53 105 157 209 261 313 365Day of the Year
0
5
10
15
20
25
Mg
(mg/
L)2005
DO-29: Turlock ID Harding Drain
1 53 105 157 209 261 313 365Day of the Year
0
5
10
15
20
25
Mg
(mg/
L)
2006 DO-29: Turlock ID Harding Drain
1 53 105 157 209 261 313 365Day of the Year
0
5
10
15
20
25
Mg
(mg/
L)
2007DO-29: Turlock ID Harding Drain
Appendix I Page 261 of 1262 946

22 of 39
1 53 105 157 209 261 313 365Day of the Year
0
10
20
30
40
Mg
(mg/
L)2005
DO-30: TID Lat 6 & 7 at River Rd.
1 53 105 157 209 261 313 365Day of the Year
0
10
20
30
40
Mg
(mg/
L)
2006 DO-30: TID Lat 6 & 7 at River Rd.
1 53 105 157 209 261 313 365Day of the Year
0
10
20
30
40
Mg
(mg/
L)
2007DO-30: TID Lat 6 & 7 at River Rd.
Appendix I Page 262 of 1262 947

23 of 39
1 53 105 157 209 261 313 365Day of the Year
0
5
10
15
20
25
Mg
(mg/
L)2005
DO-33: Hospital Creek
1 53 105 157 209 261 313 365Day of the Year
0
5
10
15
20
25
Mg
(mg/
L)
2006 DO-33: Hospital Creek
1 53 105 157 209 261 313 365Day of the Year
0
5
10
15
20
25
Mg
(mg/
L)
2007DO-33: Hospital Creek
Appendix I Page 263 of 1262 948

24 of 39
1 53 105 157 209 261 313 365Day of the Year
0
20
40
60
80
Mg
(mg/
L)2005
DO-34: Ingram Creek Flow Station
1 53 105 157 209 261 313 365Day of the Year
0
20
40
60
80
Mg
(mg/
L)
2006 DO-34: Ingram Creek Flow Station
1 53 105 157 209 261 313 365Day of the Year
0
20
40
60
80
Mg
(mg/
L)
2007DO-34: Ingram Creek Flow Station
Appendix I Page 264 of 1262 949

25 of 39
1 53 105 157 209 261 313 365Day of the Year
0
20
40
60
80
Mg
(mg/
L)2005
DO-36: Del Puerto Creek Flow Station
1 53 105 157 209 261 313 365Day of the Year
0
20
40
60
80
Mg
(mg/
L)
2006 DO-36: Del Puerto Creek Flow Station
1 53 105 157 209 261 313 365Day of the Year
0
20
40
60
80
Mg
(mg/
L)
2007DO-36: Del Puerto Creek Flow Station
Appendix I Page 265 of 1262 950

26 of 39
1 53 105 157 209 261 313 365Day of the Year
0
40
80
120
160
Mg
(mg/
L)
2005 DO-44: San Luis Drain End
1 53 105 157 209 261 313 365Day of the Year
0
40
80
120
160
Mg
(mg/
L)
2006 DO-44: San Luis Drain End
1 53 105 157 209 261 313 365Day of the Year
0
200
400
600
800
1000
Mg
(mg/
L)
2007DO-44: San Luis Drain End
Appendix I Page 266 of 1262 951
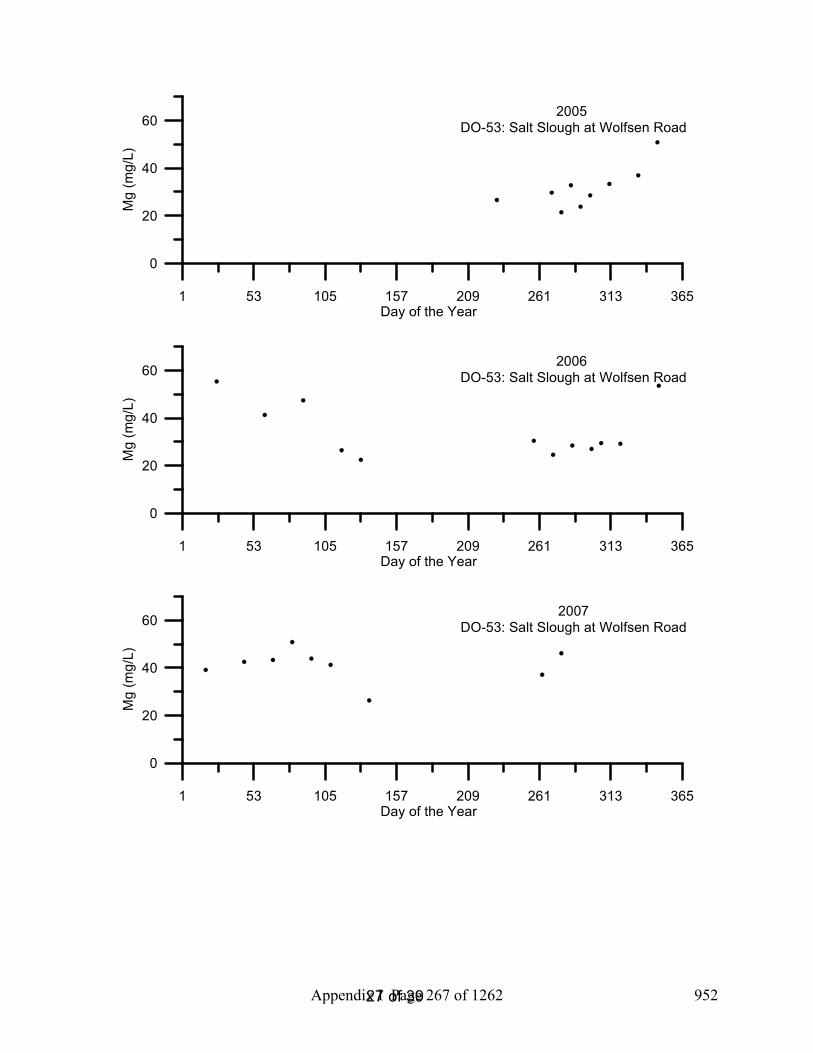
27 of 39
1 53 105 157 209 261 313 365Day of the Year
0
20
40
60M
g (m
g/L)
2005 DO-53: Salt Slough at Wolfsen Road
1 53 105 157 209 261 313 365Day of the Year
0
20
40
60
Mg
(mg/
L)
2006 DO-53: Salt Slough at Wolfsen Road
1 53 105 157 209 261 313 365Day of the Year
0
20
40
60
Mg
(mg/
L)
2007DO-53: Salt Slough at Wolfsen Road
Appendix I Page 267 of 1262 952

28 of 39
1 53 105 157 209 261 313 365Day of the Year
0
20
40
60M
g (m
g/L)
2005 DO-57: Ramona Lake Drain at Levee
1 53 105 157 209 261 313 365Day of the Year
0
20
40
60
Mg
(mg/
L)
2006 DO-57: Ramona Lake Drain at Levee
1 53 105 157 209 261 313 365Day of the Year
0
20
40
60
Mg
(mg/
L)
2007DO-57: Ramona Lake Drain at Levee
Appendix I Page 268 of 1262 953
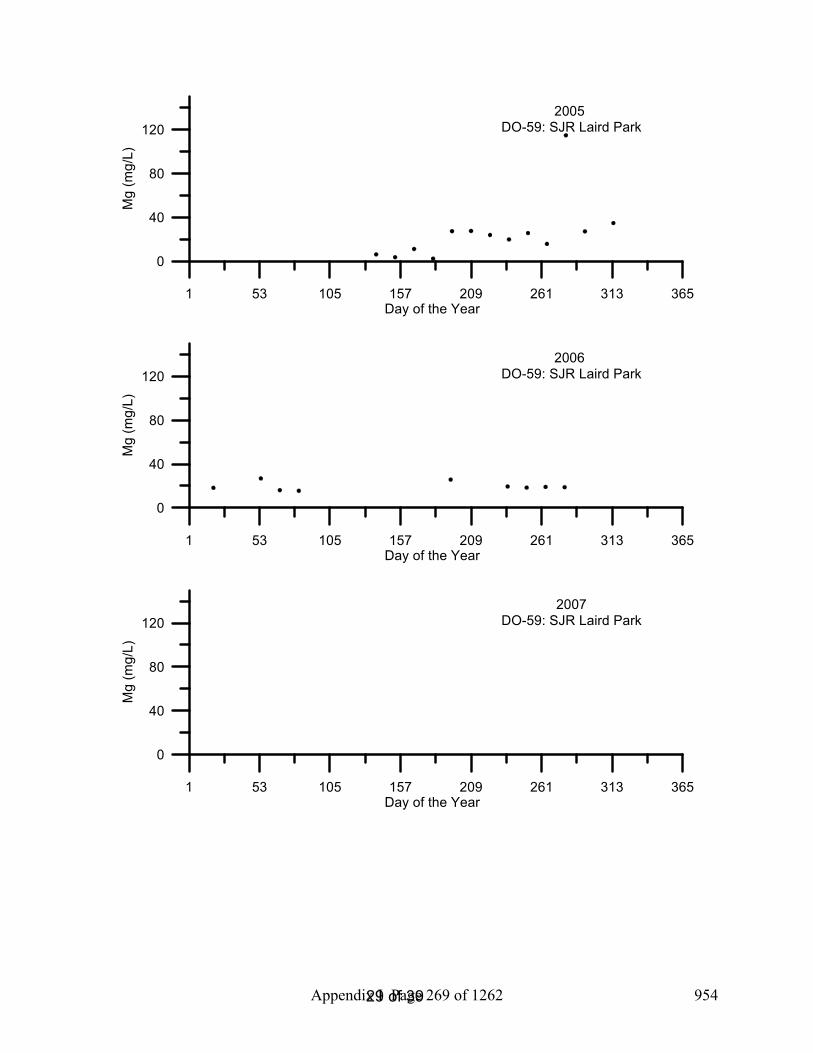
29 of 39
1 53 105 157 209 261 313 365Day of the Year
0
40
80
120M
g (m
g/L)
2005 DO-59: SJR Laird Park
1 53 105 157 209 261 313 365Day of the Year
0
40
80
120
Mg
(mg/
L)
2006 DO-59: SJR Laird Park
1 53 105 157 209 261 313 365Day of the Year
0
40
80
120
Mg
(mg/
L)
2007DO-59: SJR Laird Park
Appendix I Page 269 of 1262 954

30 of 39
1 53 105 157 209 261 313 365Day of the Year
0
10
20
30
40
Mg
(mg/
L)2005
DO-60: Moffit 1 South
1 53 105 157 209 261 313 365Day of the Year
0
10
20
30
40
Mg
(mg/
L)
2006 DO-60: Moffit 1 South
1 53 105 157 209 261 313 365Day of the Year
0
10
20
30
40
50
Mg
(mg/
L)
2007DO-60: Moffit 1 South
Appendix I Page 270 of 1262 955

31 of 39
1 53 105 157 209 261 313 365Day of the Year
0
20
40
60
Mg
(mg/
L)2005
DO-61: Deadman's Slough
1 53 105 157 209 261 313 365Day of the Year
0
20
40
60
Mg
(mg/
L)
2006 DO-61: Deadman's Slough
1 53 105 157 209 261 313 365Day of the Year
0
20
40
60
Mg
(mg/
L)
2007DO-61: Deadman's Slough
Appendix I Page 271 of 1262 956

32 of 39
1 53 105 157 209 261 313 365Day of the Year
0
40
80
120
160
200
Mg
(mg/
L)2005
DO-62: Mallard Slough
1 53 105 157 209 261 313 365Day of the Year
0
40
80
120
160
200
Mg
(mg/
L)
2006DO-62: Mallard Slough
1 53 105 157 209 261 313 365Day of the Year
0
40
80
120
160
200
Mg
(mg/
L)
2007DO-62: Mallard Slough
Appendix I Page 272 of 1262 957
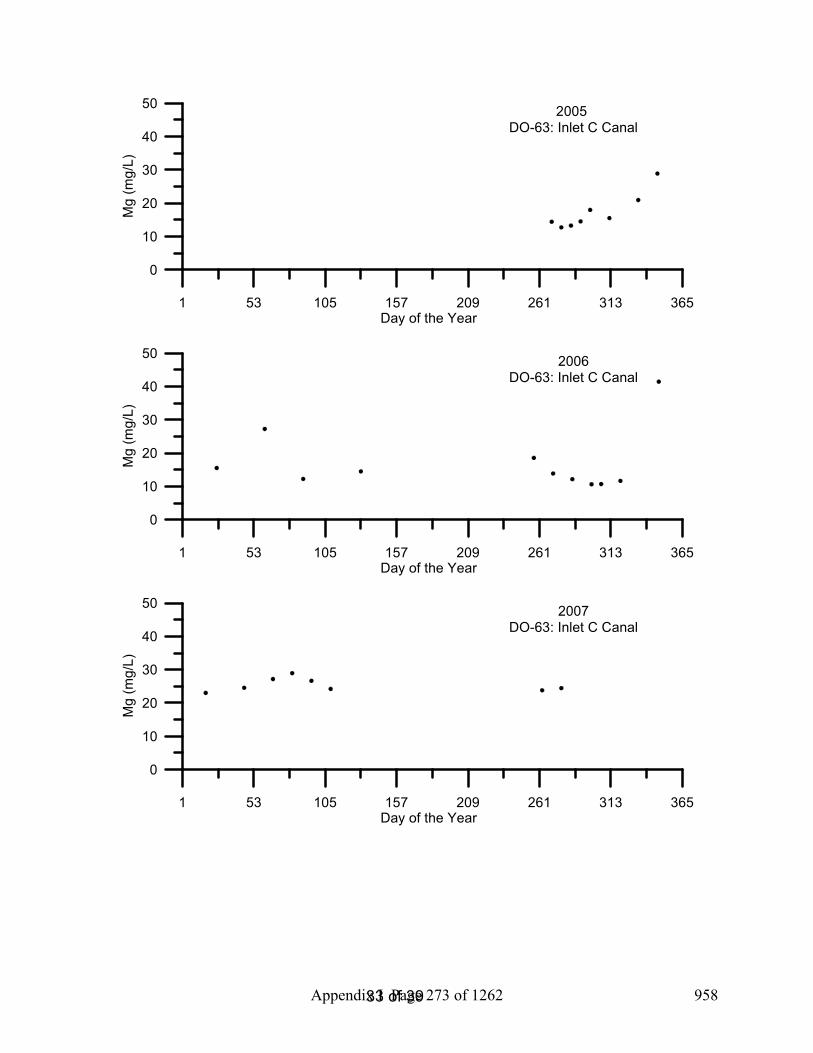
33 of 39
1 53 105 157 209 261 313 365Day of the Year
0
10
20
30
40
50
Mg
(mg/
L)2005
DO-63: Inlet C Canal
1 53 105 157 209 261 313 365Day of the Year
0
10
20
30
40
50
Mg
(mg/
L)
2006DO-63: Inlet C Canal
1 53 105 157 209 261 313 365Day of the Year
0
10
20
30
40
50
Mg
(mg/
L)
2007DO-63: Inlet C Canal
Appendix I Page 273 of 1262 958

34 of 39
1 53 105 157 209 261 313 365Day of the Year
0
10
20
30
Mg
(mg/
L)2005
DO-80: South Marsh 1 Inlet
1 53 105 157 209 261 313 365Day of the Year
0
10
20
30
Mg
(mg/
L)
2006DO-80: South Marsh 1 Inlet
1 53 105 157 209 261 313 365Day of the Year
0
10
20
30
Mg
(mg/
L)
2007DO-80: South Marsh 1 Inlet
Appendix I Page 274 of 1262 959

35 of 39
1 53 105 157 209 261 313 365Day of the Year
0
10
20
30M
g (m
g/L)
2005 DO-81: South Marsh 1 Outlet
1 53 105 157 209 261 313 365Day of the Year
0
10
20
30
Mg
(mg/
L)
2006DO-81: South Marsh 1 Outlet
1 53 105 157 209 261 313 365Day of the Year
0
10
20
30
Mg
(mg/
L)
2007DO-81: South Marsh 1 Outlet
Appendix I Page 275 of 1262 960

36 of 39
1 53 105 157 209 261 313 365Day of the Year
0
10
20
30
40
50
Mg
(mg/
L)2005
DO-82: South Marsh 3 Inlet
1 53 105 157 209 261 313 365Day of the Year
0
10
20
30
40
50
Mg
(mg/
L)
2006DO-82: South Marsh 3 Inlet
1 53 105 157 209 261 313 365Day of the Year
0
10
20
30
40
50
Mg
(mg/
L)
2007DO-82: South Marsh 3 Inlet
Appendix I Page 276 of 1262 961

37 of 39
1 53 105 157 209 261 313 365Day of the Year
0
10
20
30M
g (m
g/L)
2005 DO-83: South Marsh 3 Outlet
1 53 105 157 209 261 313 365Day of the Year
0
10
20
30
Mg
(mg/
L)
2006DO-83: South Marsh 3 Outlet
1 53 105 157 209 261 313 365Day of the Year
0
10
20
30
Mg
(mg/
L)
2007DO-83: South Marsh 3 Outlet
Appendix I Page 277 of 1262 962

38 of 39
1 53 105 157 209 261 313 365Day of the Year
0
20
40
60
Mg
(mg/
L)2005
DO-95: Ramona Lake Entrance
1 53 105 157 209 261 313 365Day of the Year
0
20
40
60
Mg
(mg/
L)
2006DO-95: Ramona Lake Entrance
1 53 105 157 209 261 313 365Day of the Year
0
20
40
60
Mg
(mg/
L)
2007DO-95: Ramona Lake Entrance
Appendix I Page 278 of 1262 963
0 of 40
Temporal Plots of 2005-2007 Dissolved Phosphate Data from the Upstream San Joaquin River
Chelsea Spier1
Remie Burks1
Sharon Borglin1
Randy Dahlgren2
Jeremy Hanlon1
Justin Graham1
William Stringfellow1
February 2008
1Environmental Engineering Research Program School of Engineering & Computer Sciences
University of the Pacific 3601 Pacific Avenue, Sears Hall
Stockton, CA 95211 2UC Davis, Davis, CA
Appendix I Page 279 of 1262 964
1 of 40
Introduction The San Joaquin River (SJR) supports one of the most productive agricultural regions in the world and its productivity is heavily dependant on irrigated agriculture. A consequence of irrigated agriculture is the production of return flows conveyed down gradient drains that eventually discharge to surface waters. Agricultural drainage may have significant nutrient load and can impact algae growth and general water quality in the SJR. Individual farmers and agricultural organizations, such as drainage authorities, are in need of tools to manage the environmental impacts of agricultural activities (Stringfellow, 2008).
For the years 2005 through 2007, sites throughout the San Joaquin Valley watershed were sampled to assess the overall water quality in the region. One thousand nine hundred and ninety-six (1996) individual surface water samples were collected and analyzed and WQ was assessed at 113 locations in the SJR basin (Borglin et al., 2008). Samples were processed and analyzed by the Environmental Engineering Research Program (EERP) laboratory at the University of the Pacific as well as at the University of California, Davis, Dahlgren Lab. This report presents temporal plots of dissolved ortho-phosphate-phosphorus (PO4-P) for data analyzed by the UCD Dahlgren laboratory between 2005 and 2007.
MethodsDepth integrated field samples were colleted during 2005-2007 in the upper San Joaquin River in accordance with EERP Field Standard Operating Procedures Protocol Book (Graham 2008). Water samples were colleted in glass 1000 mL bottles (Wheaton Science Products, Millville, NJ), 1000 mL HDPE Trace-Clean narrow mouth plastic bottles (VWR International), 250 mL HDPE Trace-Clean wide mouth plastic bottles (VWR International) as well as 40 mL trace clean vials with PTFE septa (IChem, Rockwood, TN). Bottles were labeled with the appropriate sample number, site name and sampling date. All bottles were rinsed with sample water prior to sample collection. Some sites required a bucket to collect sample water because of accessibility from a high bridge or platform. For these sites, the bucket was pre-rinsed with sample water and sample bottles were filled using a rinsed funnel. Care was taken to distribute water simultaneously to all sample bottles (rather than sequentially). Samples were immediately stored at 4°C after sampling (cooler temperature was recorded in the lab upon delivery) and transported to the EERP lab on the day of sampling.
Within 24 hours of collection samples for PO4-P were transported from the EERP laboratory to the UCD laboraroty where they were filtered through a pre-rinsed, 0.22 µm polycarbonate membrane (Millipore IsoporeTM), and then stored at -20oC until ammonia analysis could be completed.
PO4-P was determined on the filtrate using the stannous chloride method. SM 4500-P.D (APHA,2005). The limit of detection for this method is approximately 3 ppb PO4-P in clean water using a 1 cm cell for measurement.
Appendix I Page 280 of 1262 965

2 of 40
Results/DiscussionWith each set of PO4-P field samples analyzed in the UCD laboratory, quality assurance samples including a field duplicate, a trip blank, and lab blanks were also analyzed. Between 2005 and 2007, 93.5% of all quality assurance samples were within a passing range (Borglin et al, 2008). Proficiency check samples, standards with unknown concentration to the laboratory analyst, were run approximately twice a year. Four out of five proficiency check samples analyzed for PO4-P in the UCD laboratory during 2006 and 2007 were found to be within the acceptable range. Samples were measured ranging from 0.0-5.31 mg/L PO4-P. The average concentration of PO4-P in samples collected was 0.21 mg/L PO4-P. PO4-P was also analyzed by the EERP laboratory on all of the same water samples, and has a high correlation to values measured by UCD. When all data points measured by the two labs are compared they have r2=0.849, and both labs have almost the same recovery rate, EERP measured 99.94% of PO4-P as UCD (Figure 2). In general PO4-P was lowest during the summer months and peaks were found most often during the wet season.
References American Public Health Association (APHA). 2005. Standard Methods for the Examination of
Water and Wastewater, 21st Edition. American Public Health Association, Washington, DC.
Borglin, S., W. Stringfellow, J. Hanlon. 2005. Standard Operating Procedures for the Up-Stream Dissolved Oxygen TMDL Project. LBNL/Pub-937.
Borglin, S., Burks, R., Hanlon, J., Graham, J., Spier, C., Stringfellow, W., and Dahlgren, R., (2008) Methods overview, quality assurance, and quality control, University of the Pacific, Stockton, CA
Borglin, S.E., Burks, R.D., Hanlon, J.S., Stringfellow, W.T. (2008) EERP Lab Protocol Book, University of the Pacific, Stockton, CA.
Graham, J., Hanlon, J.S., Stringfellow, W.T., (2008) EERP Field Protocol Book, University of the Pacific, Stockton, CA.
Stringfellow, W.T., et al., (2008) Evaluation of Vegitated Ditches, Ponds, and Wetlands as BMPs for Mitigating the Water Quality Impact of Irrigated Agriculture in the San Joaquin Valley, University of the Pacific, Stockton, CA
YSI Environmental Operations Manual (2005) 6-Series Environmental Monitoring Systems, Yellow Springs, OH.
Appendix I Page 281 of 1262 966

3 of 40
Table 1: EERP Sampling Site List DO Number
Site Name Type
4 SJR at Mossdale Core sites 5 SJR at Vernalis-McCune Station (River Club) Core sites, BMP 6 SJR at Maze Core sites, BMP 7 SJR at Patterson Core sites, BMP 8 SJR at Crows Landing Core sites, BMP
10 SJR at Lander Avenue Core sites 12 Stanislaus River at Caswell Park Core sites 14 Tuolumne River at Shiloh Bridge Core sites 16 Merced River at River Road Core sites 18 Mud Slough near Gustine Core sites, Wetland 19 Salt Slough at Lander Avenue Core sites, Wetland 20 Los Banos Creek Flow Station Core sites, Wetland 21 Orestimba Creek at River Road Core sites, BMP 23 Modesto ID Lateral 5 to Tuolumne Core sites 25 Modesto ID Main Drain to Stan. R. via Miller Lake Core sites 28 Turlock ID Westport Drain Flow station Core sites 29 Turlock ID Harding Drain Core sites 30 Turlock ID Lateral 6 & 7 at Levee Core sites 33 Hospital Creek Intermittent, BMP 34 Ingram Creek Core sites, BMP 36 Del Puerto Creek Flow Station Core sites, BMP 44 San Luis Drain End Core sites 53 Salt Slough at Wolfsen Road Wetland 57 Ramona Lake Drain Core sites, BMP 59 SJR Laird Park Core sites 60 Moffit 1 South Wetland 61 Deadman's Slough Wetland 62 Mallard Slough Wetland 63 Inlet C Canal Wetland 80 South Marsh-1-Inlet Wetland 81 South Marsh-1-Outlet Wetland 82 South Marsh-3-Inlet Wetland 83 South Marsh-3-Outlet Wetland 95 Ramona drain at Ramona Lake BMP, Intermittent
Appendix I Page 282 of 1262 967

4 of 40
Figure 1: EERP Sampling Site Map of SJR Watershed and Tributaries
Appendix I Page 283 of 1262 968

5 of 40
Figure 2: EERP vs UCD PO4-P Data from 2005-2007.
1UCD P-PO4 (mg/L)
0
2
4
6
8E
ERP
P-PO
4 (m
g/L)
Y = 0.9994 * XNumber of data points used = 1832r2 = 0.8491
Appendix I Page 284 of 1262 969

6 of 40
Figures 3 -104: Temporal Plots of Dissolved PO4-P By Site ID
1 53 105 157 209 261 313 365Day of the Year
0
0.05
0.1
0.15
0.2
0.25D
isso
lved
PO
4-P
(mg/
L) 2005 DO-04: SJR at Mossdale
1 53 105 157 209 261 313 365Day of the Year
0
0.05
0.1
0.15
0.2
0.25
Dis
solv
ed P
O4-
P (m
g/L)
2006 DO-04: SJR at Mossdale
1 53 105 157 209 261 313 365Day of the Year
0
0.05
0.1
0.15
0.2
0.25
Dis
solv
ed P
O4-
P (m
g/L) 2007
DO-04: SJR at Mossdale
Appendix I Page 285 of 1262 970
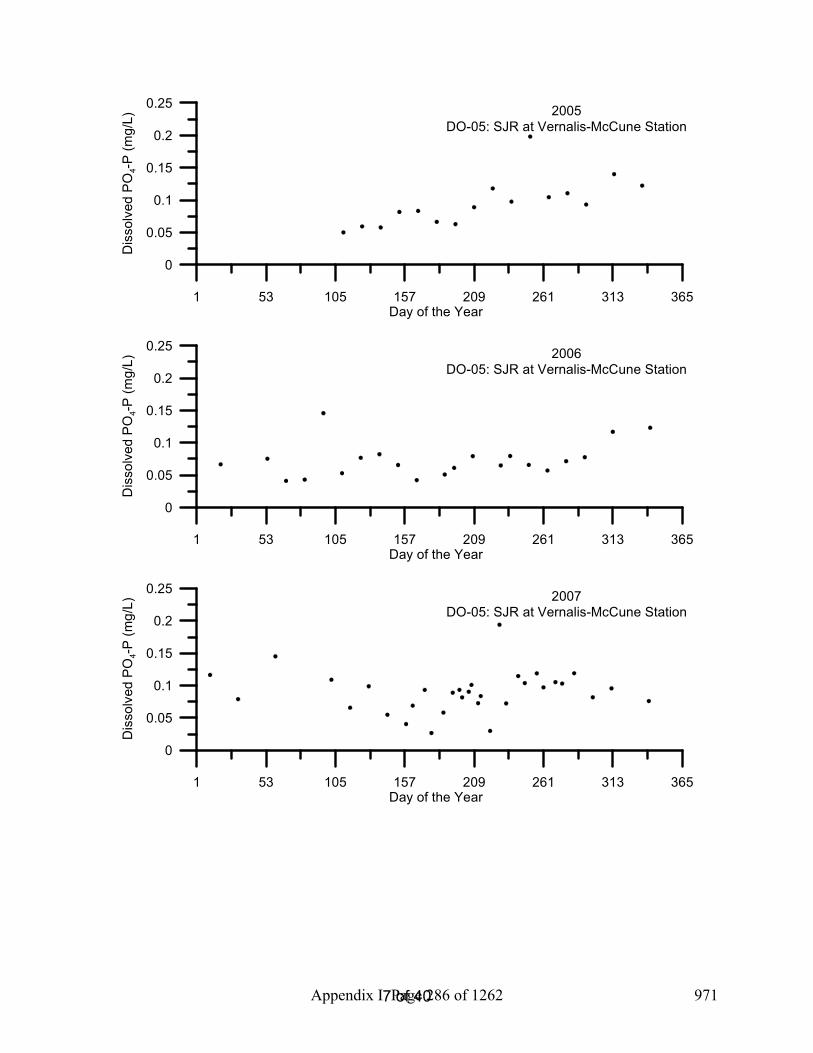
7 of 40
1 53 105 157 209 261 313 365Day of the Year
0
0.05
0.1
0.15
0.2
0.25
Dis
solv
ed P
O4-
P (m
g/L)
2005 DO-05: SJR at Vernalis-McCune Station
1 53 105 157 209 261 313 365Day of the Year
0
0.05
0.1
0.15
0.2
0.25
Dis
solv
ed P
O4-P
(mg/
L)
2006 DO-05: SJR at Vernalis-McCune Station
1 53 105 157 209 261 313 365Day of the Year
0
0.05
0.1
0.15
0.2
0.25
Dis
solv
ed P
O4-
P (m
g/L) 2007 DO-05: SJR at Vernalis-McCune Station
Appendix I Page 286 of 1262 971
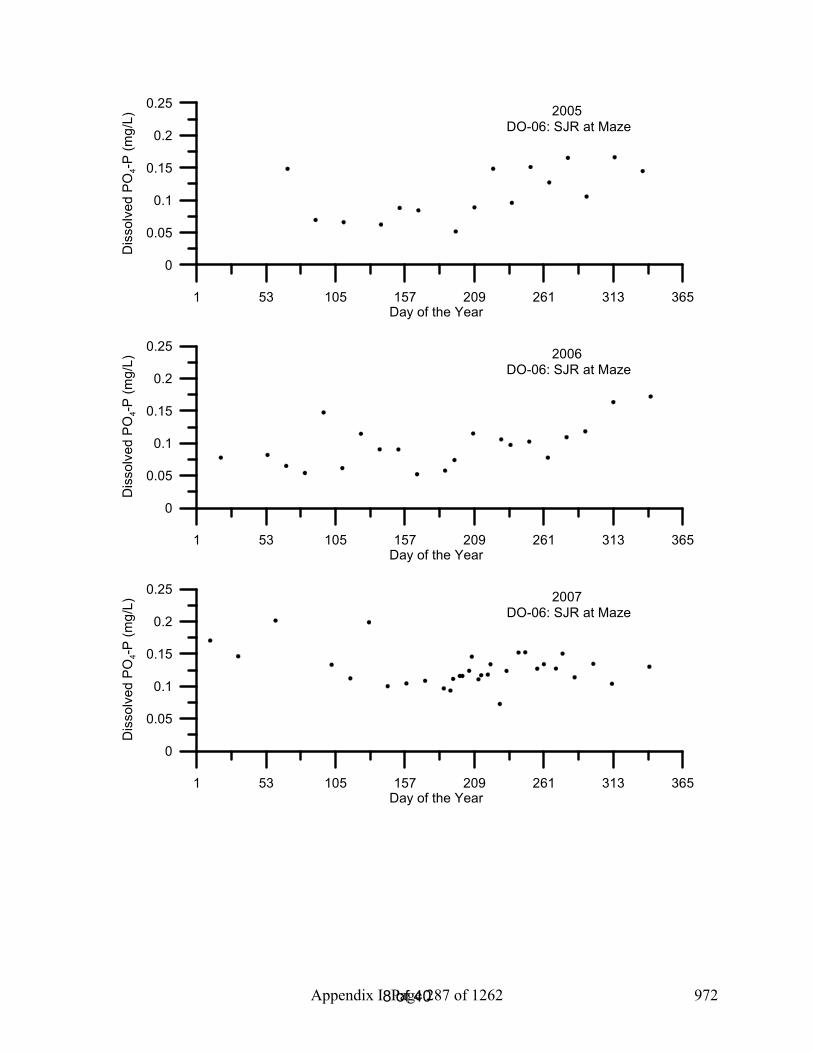
8 of 40
1 53 105 157 209 261 313 365Day of the Year
0
0.05
0.1
0.15
0.2
0.25
Dis
solv
ed P
O4-
P (m
g/L) 2005
DO-06: SJR at Maze
1 53 105 157 209 261 313 365Day of the Year
0
0.05
0.1
0.15
0.2
0.25
Dis
solv
ed P
O4-P
(mg/
L)
2006 DO-06: SJR at Maze
1 53 105 157 209 261 313 365Day of the Year
0
0.05
0.1
0.15
0.2
0.25
Dis
solv
ed P
O4-
P (m
g/L) 2007
DO-06: SJR at Maze
Appendix I Page 287 of 1262 972

9 of 40
1 53 105 157 209 261 313 365Day of the Year
0
0.2
0.4
0.6
Dis
solv
ed P
O4-
P (m
g/L)
2005 DO-07: SJR at Patterson
1 53 105 157 209 261 313 365Day of the Year
0
0.2
0.4
0.6
Dis
solv
ed P
O4-
P (m
g/L)
2006 DO-07: SJR at Patterson
1 53 105 157 209 261 313 365Day of the Year
0
0.2
0.4
0.6
Dis
solv
ed P
O4-
P (m
g/L) 2007
DO-07: SJR at Patterson
Appendix I Page 288 of 1262 973
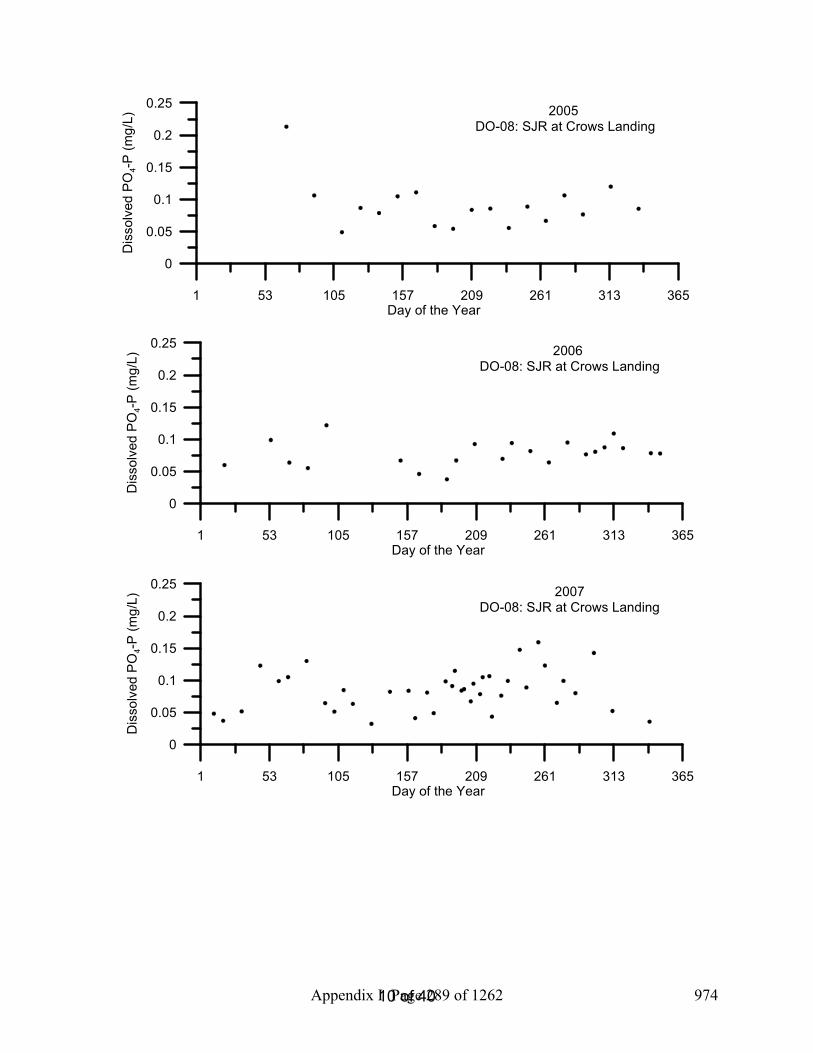
10 of 40
1 53 105 157 209 261 313 365Day of the Year
0
0.05
0.1
0.15
0.2
0.25
Dis
solv
ed P
O4-
P (m
g/L) 2005
DO-08: SJR at Crows Landing
1 53 105 157 209 261 313 365Day of the Year
0
0.05
0.1
0.15
0.2
0.25
Dis
solv
ed P
O4-
P (m
g/L)
2006 DO-08: SJR at Crows Landing
1 53 105 157 209 261 313 365Day of the Year
0
0.05
0.1
0.15
0.2
0.25
Dis
solv
ed P
O4-
P (m
g/L) 2007
DO-08: SJR at Crows Landing
Appendix I Page 289 of 1262 974

11 of 40
1 53 105 157 209 261 313 365Day of the Year
0
0.1
0.2
0.3
0.4
0.5
Dis
solv
ed P
O4-
P (m
g/L)
2005 DO-10: SJR at Lander Avenue
1 53 105 157 209 261 313 365Day of the Year
0
0.1
0.2
0.3
0.4
0.5
Dis
solv
ed P
O4-
P (m
g/L)
2006 DO-10: SJR at Lander Avenue
1 53 105 157 209 261 313 365Day of the Year
0
0.1
0.2
0.3
0.4
0.5
Dis
solv
ed P
O4-
P (m
g/L) 2007
DO-10: SJR at Lander Avenue
Appendix I Page 290 of 1262 975

12 of 40
1 53 105 157 209 261 313 365Day of the Year
0
0.05
0.1
0.15
0.2D
isso
lved
PO
4-P (m
g/L) 2005
DO-12: Stanislaus River at Caswell Park
1 53 105 157 209 261 313 365Day of the Year
0
0.04
0.08
0.12
0.16
0.2
0.24
Dis
solv
ed P
O4-
P (m
g/L)
2006DO-12: Stanislaus River at Caswell Park
1 53 105 157 209 261 313 365Day of the Year
0
0.05
0.1
0.15
0.2
Dis
solv
ed P
O4-
P (m
g/L) 2007DO-12: Stanislaus River at Caswell Park
Appendix I Page 291 of 1262 976

13 of 40
1 53 105 157 209 261 313 365Day of the Year
0
0.05
0.1
0.15
0.2
0.25
Dis
solv
ed P
O4-
P (m
g/L) 2005
DO-14: Tuolumne River at Shiloh Bridge
1 53 105 157 209 261 313 365Day of the Year
0
0.05
0.1
0.15
0.2
0.25
Dis
solv
ed P
O4-P
(mg/
L)
2006 DO-14: Tuolumne River at Shiloh Bridge
1 53 105 157 209 261 313 365Day of the Year
0
0.05
0.1
0.15
0.2
0.25
Dis
solv
ed P
O4-
P (m
g/L) 2007DO-14: Tuolumne River at Shiloh Bridge
Appendix I Page 292 of 1262 977

14 of 40
1 53 105 157 209 261 313 365Day of the Year
0
0.04
0.08
0.12
0.16
Dis
solv
ed P
O4-
P (m
g/L) 2005
DO-16: Merced River at River Road
1 53 105 157 209 261 313 365Day of the Year
0
0.04
0.08
0.12
0.16
Dis
solv
ed P
O4-P
(mg/
L)
2006 DO-16: Merced River at River Road
1 53 105 157 209 261 313 365Day of the Year
0
0.1
0.2
0.3
0.4
Dis
solv
ed P
O4-
P (m
g/L) 2007
DO-16: Merced River at River Road
Appendix I Page 293 of 1262 978
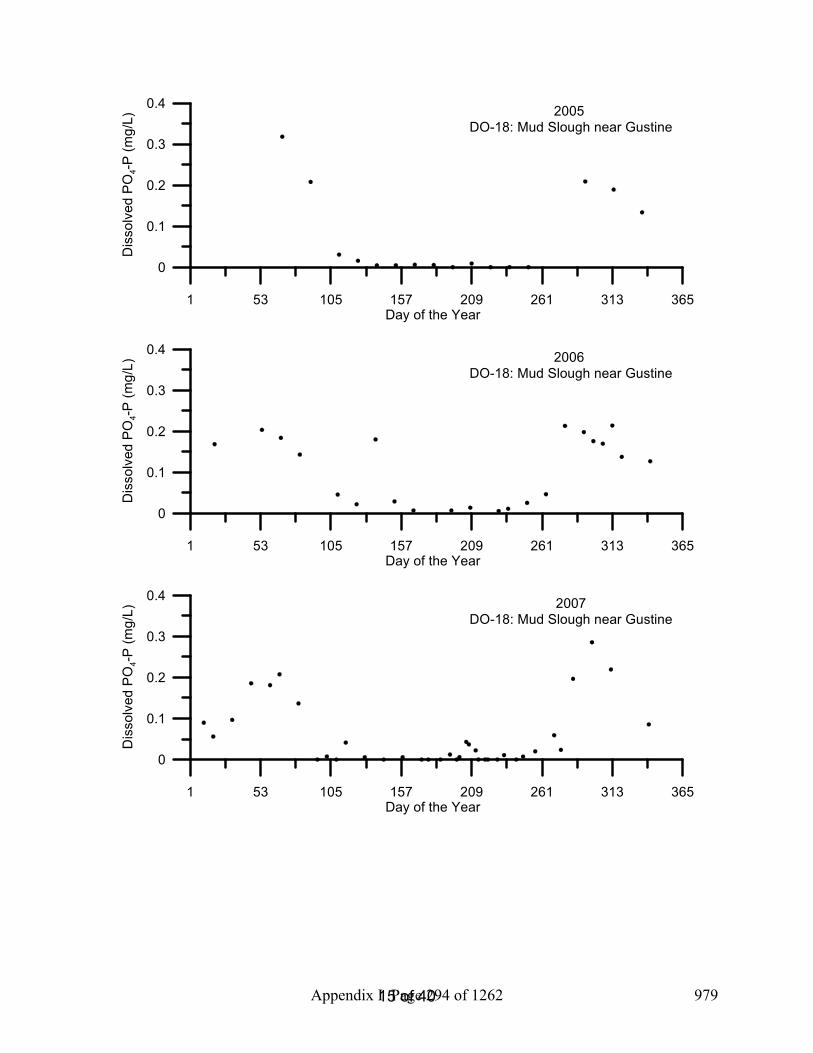
15 of 40
1 53 105 157 209 261 313 365Day of the Year
0
0.1
0.2
0.3
0.4
Dis
solv
ed P
O4-
P (m
g/L)
2005 DO-18: Mud Slough near Gustine
1 53 105 157 209 261 313 365Day of the Year
0
0.1
0.2
0.3
0.4
Dis
solv
ed P
O4-
P (m
g/L)
2006 DO-18: Mud Slough near Gustine
1 53 105 157 209 261 313 365Day of the Year
0
0.1
0.2
0.3
0.4
Dis
solv
ed P
O4-
P (m
g/L) 2007
DO-18: Mud Slough near Gustine
Appendix I Page 294 of 1262 979

16 of 40
1 53 105 157 209 261 313 365Day of the Year
0
0.2
0.4
0.6
0.8
Dis
solv
ed P
O4-
P (m
g/L)
2005 DO-19: Salt Slough at Lander Avenue
1 53 105 157 209 261 313 365Day of the Year
0
0.2
0.4
0.6
0.8
Dis
solv
ed P
O4-
P (m
g/L)
2006 DO-19: Salt Slough at Lander Avenue
1 53 105 157 209 261 313 365Day of the Year
0
0.2
0.4
0.6
0.8
Dis
solv
ed P
O4-
P (m
g/L) 2007
DO-19: Salt Slough at Lander Avenue
Appendix I Page 295 of 1262 980

17 of 40
1 53 105 157 209 261 313 365Day of the Year
0
0.4
0.8
1.2
Dis
solv
ed P
O4-
P (m
g/L)
2005 DO-20: Los Banos Creek at Highway 140
1 53 105 157 209 261 313 365Day of the Year
0
0.4
0.8
1.2
Dis
solv
ed P
O4-
P (m
g/L)
2006 DO-20: Los Banos Creek at Highway 140
1 53 105 157 209 261 313 365Day of the Year
0
0.4
0.8
1.2
Dis
solv
ed P
O4-
P (m
g/L)
2007DO-20: Los Banos Creek at Highway 140
Appendix I Page 296 of 1262 981

18 of 40
1 53 105 157 209 261 313 365Day of the Year
0
0.1
0.2
0.3
0.4
Dis
solv
ed P
O4-
P (m
g/L)
2005 DO-21: Orestimba Creek at River Road
1 53 105 157 209 261 313 365Day of the Year
0
0.1
0.2
0.3
0.4
Dis
solv
ed P
O4-
P (m
g/L)
2006 DO-21: Orestimba Creek at River Road
1 53 105 157 209 261 313 365Day of the Year
0
0.1
0.2
0.3
0.4
Dis
solv
ed P
O4-
P (m
g/L) 2007
DO-21: Orestimba Creek at River Road
Appendix I Page 297 of 1262 982
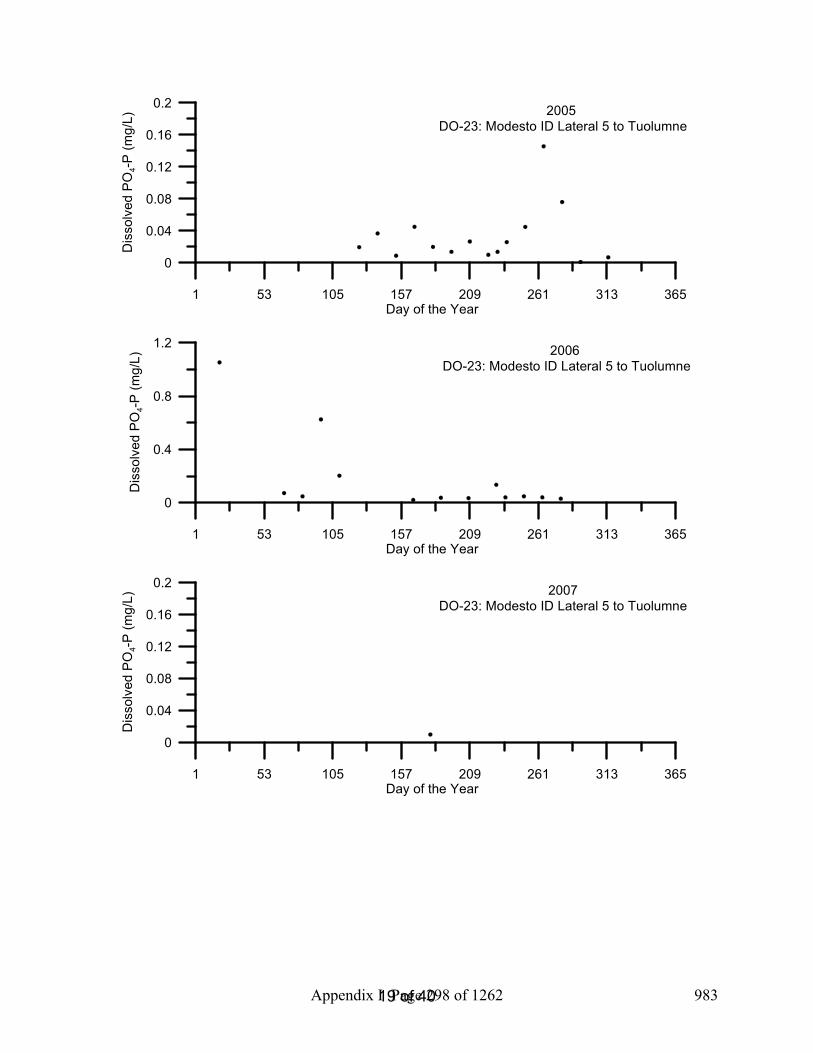
19 of 40
1 53 105 157 209 261 313 365Day of the Year
0
0.04
0.08
0.12
0.16
0.2
Dis
solv
ed P
O4-
P (m
g/L)
2005 DO-23: Modesto ID Lateral 5 to Tuolumne
1 53 105 157 209 261 313 365Day of the Year
0
0.4
0.8
1.2
Dis
solv
ed P
O4-
P (m
g/L)
2006 DO-23: Modesto ID Lateral 5 to Tuolumne
1 53 105 157 209 261 313 365Day of the Year
0
0.04
0.08
0.12
0.16
0.2
Dis
solv
ed P
O4-
P (m
g/L) 2007
DO-23: Modesto ID Lateral 5 to Tuolumne
Appendix I Page 298 of 1262 983

20 of 40
1 53 105 157 209 261 313 365Day of the Year
0
0.4
0.8
1.2
1.6
Dis
solv
ed P
O4-
P (m
g/L)
2005 DO-25: MID Main Drain to Stan. R. via Miller Lake
1 53 105 157 209 261 313 365Day of the Year
0
2
4
6
Dis
solv
ed P
O4-
P (m
g/L)
2006 DO-25: MID Main Drain to Stan. R. via Miller Lake
1 53 105 157 209 261 313 365Day of the Year
0
0.1
0.2
0.3
0.4
Dis
solv
ed P
O4-
P (m
g/L) 2007
DO-25: MID Main Drain to Stan. R. via Miller Lake
Appendix I Page 299 of 1262 984

21 of 40
1 53 105 157 209 261 313 365Day of the Year
0
0.2
0.4
0.6
0.8
1
Dis
solv
ed P
O4-
P (m
g/L)
2005 DO-28: Turlock ID Westport Drain Flow Station
1 53 105 157 209 261 313 365Day of the Year
0
0.2
0.4
0.6
0.8
1
Dis
solv
ed P
O4-
P (m
g/L)
2006 DO-28: Turlock ID Westport Drain Flow Station
1 53 105 157 209 261 313 365Day of the Year
0
0.2
0.4
0.6
0.8
1
Dis
solv
ed P
O4-
P (m
g/L) 2007
DO-28: Turlock ID Westport Drain Flow Station
Appendix I Page 300 of 1262 985
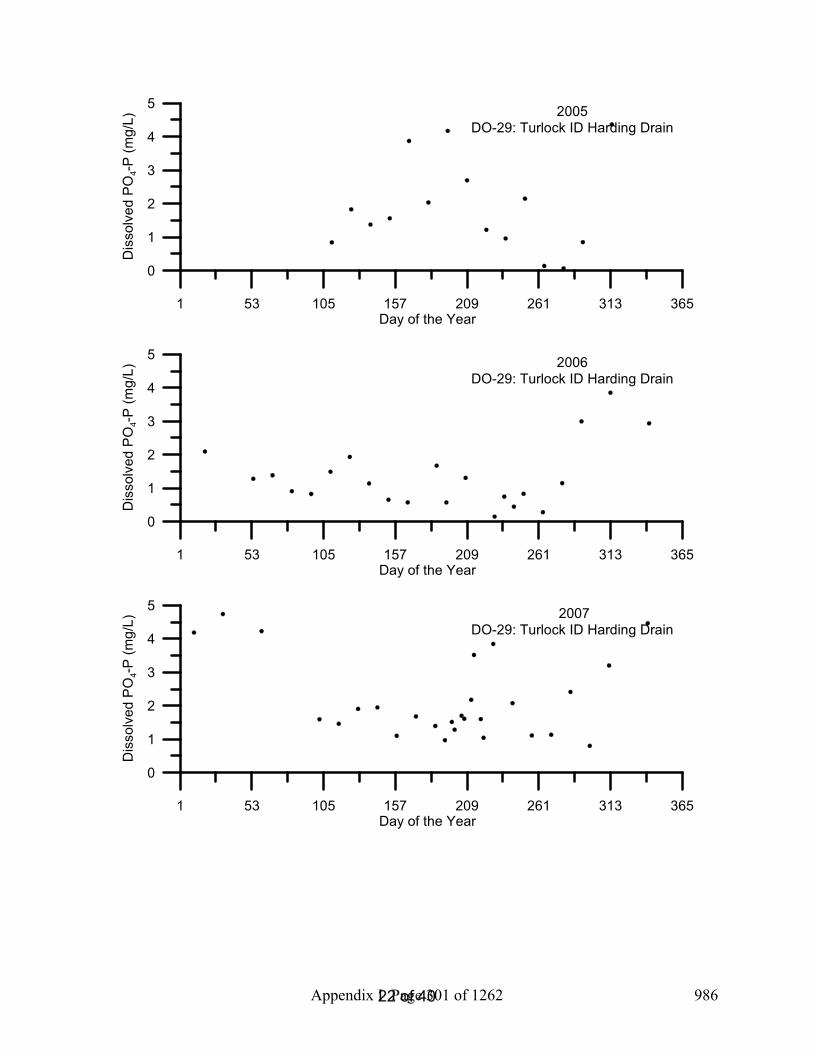
22 of 40
1 53 105 157 209 261 313 365Day of the Year
0
1
2
3
4
5
Dis
solv
ed P
O4-
P (m
g/L)
2005 DO-29: Turlock ID Harding Drain
1 53 105 157 209 261 313 365Day of the Year
0
1
2
3
4
5
Dis
solv
ed P
O4-
P (m
g/L)
2006 DO-29: Turlock ID Harding Drain
1 53 105 157 209 261 313 365Day of the Year
0
1
2
3
4
5
Dis
solv
ed P
O4-
P (m
g/L)
2007DO-29: Turlock ID Harding Drain
Appendix I Page 301 of 1262 986

23 of 40
1 53 105 157 209 261 313 365Day of the Year
0
0.4
0.8
1.2
1.6
Dis
solv
ed P
O4-
P (m
g/L)
2005 DO-30: TID Lat 6 & 7 at River Rd.
1 53 105 157 209 261 313 365Day of the Year
0
0.4
0.8
1.2
1.6
Dis
solv
ed P
O4-
P (m
g/L)
2006 DO-30: TID Lat 6 & 7 at River Rd.
1 53 105 157 209 261 313 365Day of the Year
0
0.4
0.8
1.2
1.6
Dis
solv
ed P
O4-
P (m
g/L) 2007
DO-30: TID Lat 6 & 7 at River Rd.
Appendix I Page 302 of 1262 987

24 of 40
1 53 105 157 209 261 313 365Day of the Year
0
0.2
0.4
0.6
0.8
Dis
solv
ed P
O4-
P (m
g/L)
2005 DO-33: Hospital Creek
1 53 105 157 209 261 313 365Day of the Year
0
0.2
0.4
0.6
0.8
Dis
solv
ed P
O4-
P (m
g/L)
2006 DO-33: Hospital Creek
1 53 105 157 209 261 313 365Day of the Year
0
0.2
0.4
0.6
0.8
Dis
solv
ed P
O4-
P (m
g/L) 2007
DO-33: Hospital Creek
Appendix I Page 303 of 1262 988

25 of 40
1 53 105 157 209 261 313 365Day of the Year
0
0.1
0.2
0.3
0.4
Dis
solv
ed P
O4-
P (m
g/L)
2005 DO-34: Ingram Creek Flow Station
1 53 105 157 209 261 313 365Day of the Year
0
0.1
0.2
0.3
0.4
Dis
solv
ed P
O4-
P (m
g/L)
2006 DO-34: Ingram Creek Flow Station
1 53 105 157 209 261 313 365Day of the Year
0
0.1
0.2
0.3
0.4
Dis
solv
ed P
O4-
P (m
g/L) 2007
DO-34: Ingram Creek Flow Station
Appendix I Page 304 of 1262 989
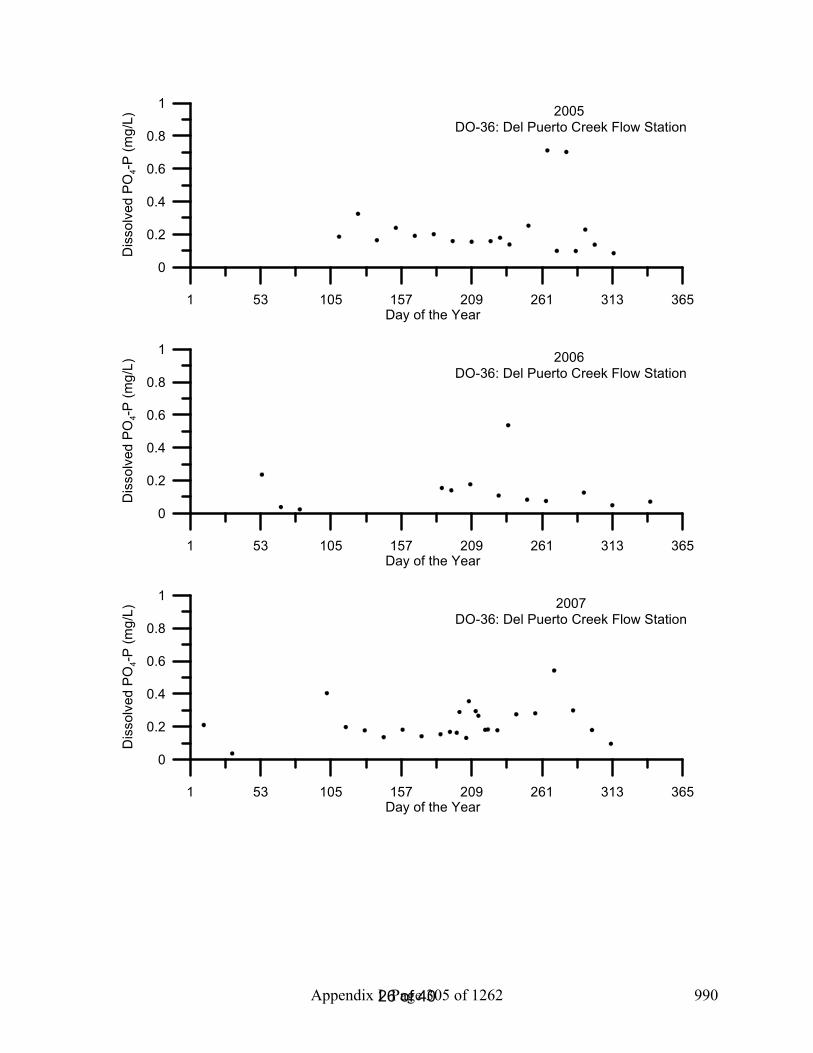
26 of 40
1 53 105 157 209 261 313 365Day of the Year
0
0.2
0.4
0.6
0.8
1
Dis
solv
ed P
O4-
P (m
g/L)
2005 DO-36: Del Puerto Creek Flow Station
1 53 105 157 209 261 313 365Day of the Year
0
0.2
0.4
0.6
0.8
1
Dis
solv
ed P
O4-
P (m
g/L)
2006 DO-36: Del Puerto Creek Flow Station
1 53 105 157 209 261 313 365Day of the Year
0
0.2
0.4
0.6
0.8
1
Dis
solv
ed P
O4-
P (m
g/L) 2007
DO-36: Del Puerto Creek Flow Station
Appendix I Page 305 of 1262 990

27 of 40
1 53 105 157 209 261 313 365Day of the Year
0
0.04
0.08
0.12D
isso
lved
PO
4-P (m
g/L) 2005
DO-44: San Luis Drain End
1 53 105 157 209 261 313 365Day of the Year
0
0.04
0.08
0.12
Dis
solv
ed P
O4-
P (m
g/L) 2006
DO-44: San Luis Drain End
1 53 105 157 209 261 313 365Day of the Year
0
0.04
0.08
0.12
Dis
solv
ed P
O4-
P (m
g/L) 2007
DO-44: San Luis Drain End
Appendix I Page 306 of 1262 991

28 of 40
1 53 105 157 209 261 313 365Day of the Year
0
0.2
0.4
0.6
0.8
Dis
solv
ed P
O4-
P (m
g/L)
2005 DO-53: Salt Slough at Wolfsen Road
1 53 105 157 209 261 313 365Day of the Year
0
0.2
0.4
0.6
0.8
Dis
solv
ed P
O4-
P (m
g/L)
2006 DO-53: Salt Slough at Wolfsen Road
1 53 105 157 209 261 313 365Day of the Year
0
0.2
0.4
0.6
0.8
Dis
solv
ed P
O4-
P (m
g/L) 2007
DO-53: Salt Slough at Wolfsen Road
Appendix I Page 307 of 1262 992

29 of 40
1 53 105 157 209 261 313 365Day of the Year
0
0.1
0.2
0.3
0.4
0.5
Dis
solv
ed P
O4-
P (m
g/L)
2005 DO-57: Ramona Lake Drain at Levee
1 53 105 157 209 261 313 365Day of the Year
0
0.1
0.2
0.3
0.4
0.5
Dis
solv
ed P
O4-
P (m
g/L)
2006 DO-57: Ramona Lake Drain at Levee
1 53 105 157 209 261 313 365Day of the Year
0
0.1
0.2
0.3
0.4
0.5
Dis
solv
ed P
O4-
P (m
g/L) 2007
DO-57: Ramona Lake Drain at Levee
Appendix I Page 308 of 1262 993
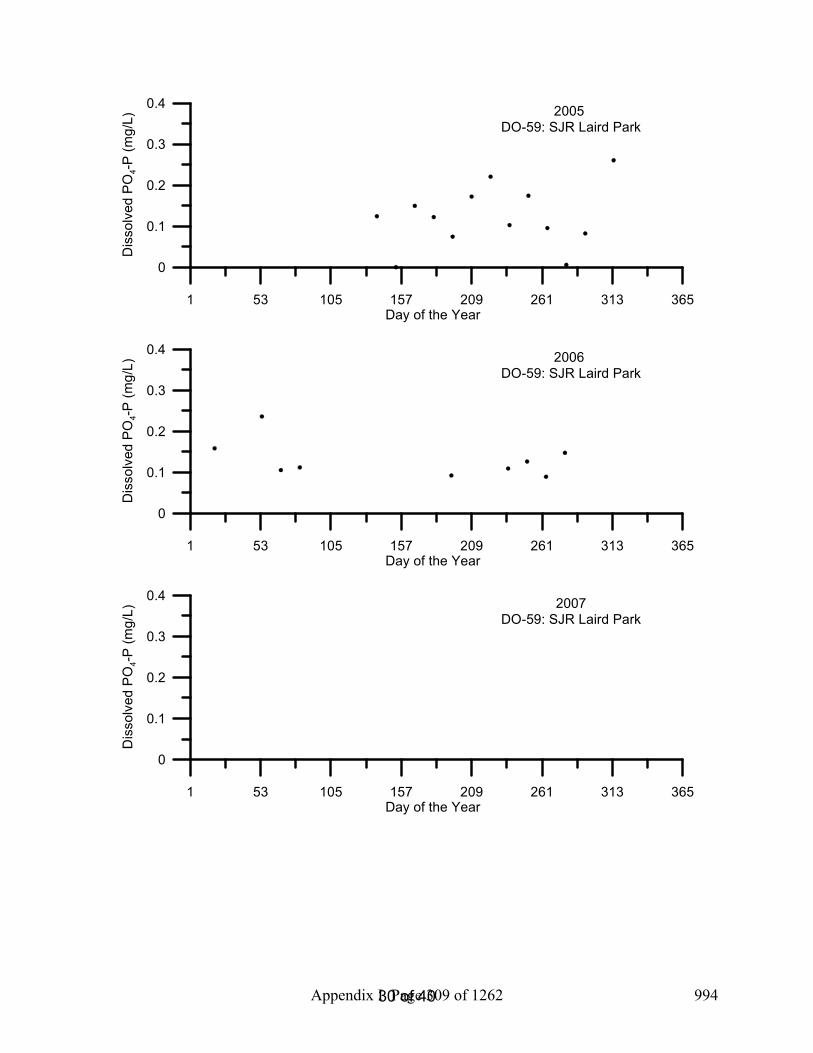
30 of 40
1 53 105 157 209 261 313 365Day of the Year
0
0.1
0.2
0.3
0.4
Dis
solv
ed P
O4-
P (m
g/L)
2005 DO-59: SJR Laird Park
1 53 105 157 209 261 313 365Day of the Year
0
0.1
0.2
0.3
0.4
Dis
solv
ed P
O4-
P (m
g/L)
2006 DO-59: SJR Laird Park
1 53 105 157 209 261 313 365Day of the Year
0
0.1
0.2
0.3
0.4
Dis
solv
ed P
O4-
P (m
g/L) 2007
DO-59: SJR Laird Park
Appendix I Page 309 of 1262 994
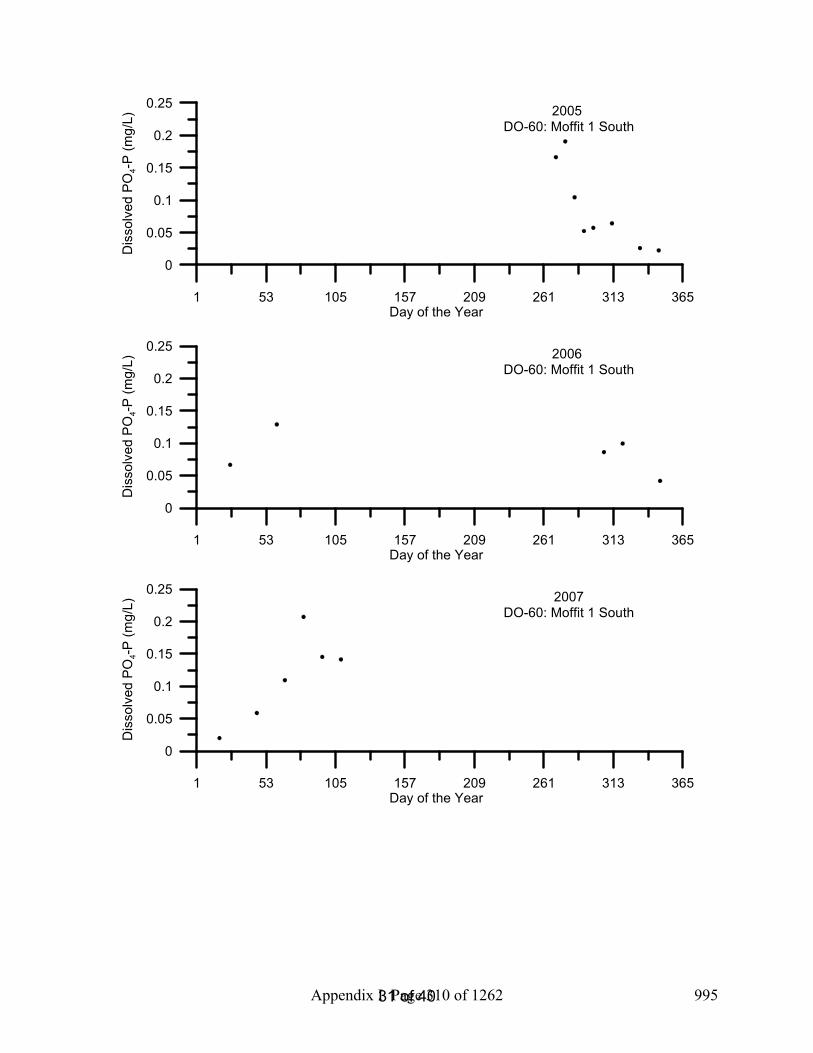
31 of 40
1 53 105 157 209 261 313 365Day of the Year
0
0.05
0.1
0.15
0.2
0.25
Dis
solv
ed P
O4-
P (m
g/L) 2005
DO-60: Moffit 1 South
1 53 105 157 209 261 313 365Day of the Year
0
0.05
0.1
0.15
0.2
0.25
Dis
solv
ed P
O4-P
(mg/
L)
2006 DO-60: Moffit 1 South
1 53 105 157 209 261 313 365Day of the Year
0
0.05
0.1
0.15
0.2
0.25
Dis
solv
ed P
O4-
P (m
g/L) 2007
DO-60: Moffit 1 South
Appendix I Page 310 of 1262 995

32 of 40
1 53 105 157 209 261 313 365Day of the Year
0
0.2
0.4
0.6
Dis
solv
ed P
O4-
P (m
g/L)
2005 DO-61: Deadman's Slough
1 53 105 157 209 261 313 365Day of the Year
0
0.2
0.4
0.6
Dis
solv
ed P
O4-
P (m
g/L)
2006 DO-61: Deadman's Slough
1 53 105 157 209 261 313 365Day of the Year
0
0.2
0.4
0.6
Dis
solv
ed P
O4-
P (m
g/L) 2007
DO-61: Deadman's Slough
Appendix I Page 311 of 1262 996

33 of 40
1 53 105 157 209 261 313 365Day of the Year
0
1
2
3D
isso
lved
PO
4-P
(mg/
L) 2005 DO-62: Mallard Slough
1 53 105 157 209 261 313 365Day of the Year
0
1
2
3
Dis
solv
ed P
O4-
P (m
g/L) 2006
DO-62: Mallard Slough
1 53 105 157 209 261 313 365Day of the Year
0
1
2
3
Dis
solv
ed P
O4-
P (m
g/L) 2007
DO-62: Mallard Slough
Appendix I Page 312 of 1262 997

34 of 40
1 53 105 157 209 261 313 365Day of the Year
0
0.4
0.8
1.2
Dis
solv
ed P
O4-
P (m
g/L)
2005 DO-63: Inlet C Canal
1 53 105 157 209 261 313 365Day of the Year
0
0.4
0.8
1.2
Dis
solv
ed P
O4-
P (m
g/L)
2006DO-63: Inlet C Canal
1 53 105 157 209 261 313 365Day of the Year
0
0.4
0.8
1.2
Dis
solv
ed P
O4-
P (m
g/L) 2007
DO-63: Inlet C Canal
Appendix I Page 313 of 1262 998

35 of 40
1 53 105 157 209 261 313 365Day of the Year
0
0.05
0.1
0.15
0.2
0.25
Dis
solv
ed P
O4-
P (m
g/L) 2005
DO-80: South Marsh 1 Inlet
1 53 105 157 209 261 313 365Day of the Year
0
0.05
0.1
0.15
0.2
0.25
Dis
solv
ed P
O4-P
(mg/
L)
2006DO-80: South Marsh 1 Inlet
1 53 105 157 209 261 313 365Day of the Year
0
0.05
0.1
0.15
0.2
0.25
Dis
solv
ed P
O4-
P (m
g/L) 2007
DO-80: South Marsh 1 Inlet
Appendix I Page 314 of 1262 999

36 of 40
1 53 105 157 209 261 313 365Day of the Year
0
0.2
0.4
0.6
0.8
Dis
solv
ed P
O4-
P (m
g/L)
2005 DO-81: South Marsh 1 Outlet
1 53 105 157 209 261 313 365Day of the Year
0
0.2
0.4
0.6
0.8
Dis
solv
ed P
O4-
P (m
g/L)
2006DO-81: South Marsh 1 Outlet
1 53 105 157 209 261 313 365Day of the Year
0
0.2
0.4
0.6
0.8
Dis
solv
ed P
O4-
P (m
g/L) 2007
DO-81: South Marsh 1 Outlet
Appendix I Page 315 of 1262 1000

37 of 40
1 53 105 157 209 261 313 365Day of the Year
0
0.4
0.8
1.2
1.6
Dis
solv
ed P
O4-
P (m
g/L)
2005 DO-82: South Marsh 3 Inlet
1 53 105 157 209 261 313 365Day of the Year
0
0.4
0.8
1.2
1.6
Dis
solv
ed P
O4-
P (m
g/L)
2006DO-82: South Marsh 3 Inlet
1 53 105 157 209 261 313 365Day of the Year
0
0.4
0.8
1.2
1.6
Dis
solv
ed P
O4-
P (m
g/L) 2007
DO-82: South Marsh 3 Inlet
Appendix I Page 316 of 1262 1001

38 of 40
1 53 105 157 209 261 313 365Day of the Year
0
0.4
0.8
1.2
1.6
Dis
solv
ed P
O4-
P (m
g/L)
2005 DO-83: South Marsh 3 Outlet
1 53 105 157 209 261 313 365Day of the Year
0
0.4
0.8
1.2
1.6
Dis
solv
ed P
O4-
P (m
g/L)
2006DO-83: South Marsh 3 Outlet
1 53 105 157 209 261 313 365Day of the Year
0
0.4
0.8
1.2
1.6
Dis
solv
ed P
O4-
P (m
g/L) 2007
DO-83: South Marsh 3 Outlet
Appendix I Page 317 of 1262 1002
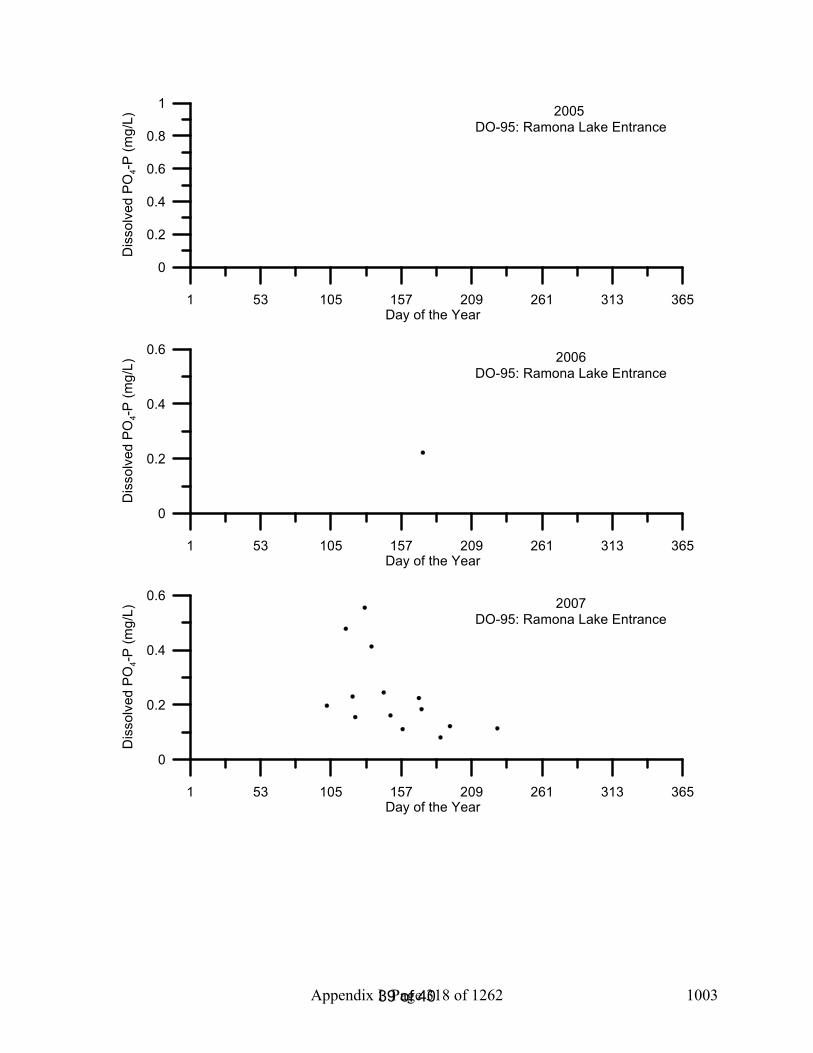
39 of 40
1 53 105 157 209 261 313 365Day of the Year
0
0.2
0.4
0.6
0.8
1
Dis
solv
ed P
O4-
P (m
g/L)
2005 DO-95: Ramona Lake Entrance
1 53 105 157 209 261 313 365Day of the Year
0
0.2
0.4
0.6
Dis
solv
ed P
O4-
P (m
g/L)
2006DO-95: Ramona Lake Entrance
1 53 105 157 209 261 313 365Day of the Year
0
0.2
0.4
0.6
Dis
solv
ed P
O4-
P (m
g/L) 2007
DO-95: Ramona Lake Entrance
Appendix I Page 318 of 1262 1003

Temporal Plots of 2005-2007 Dissolved Ammonia Data from the Upstream San Joaquin River
Chelsea Spier1
Remie Burks1
Sharon Borglin1
Randy Dahlgren2
Jeremy Hanlon1
Justin Graham1
William Stringfellow1
February 2008
1Environmental Engineering Research Program School of Engineering & Computer Sciences
University of the Pacific 3601 Pacific Avenue, Sears Hall
Stockton, CA 95211 2UC Davis, Davis, CA
Appendix I Page 319 of 1262 1004

1 of 40
Introduction The San Joaquin River (SJR) supports one of the most productive agricultural regions in the world and its productivity is heavily dependant on irrigated agriculture. A consequence of irrigated agriculture is the production of return flows conveyed down gradient drains that eventually discharge to surface waters. Agricultural drainage may have significant nutrient load and can impact algae growth and general water quality in the SJR. Individual farmers and agricultural organizations, such as drainage authorities, are in need of tools to manage the environmental impacts of agricultural activities (Stringfellow, 2008).
For the years 2005 through 2007, sites throughout the San Joaquin Valley watershed were sampled to assess the overall water quality in the region. One thousand nine hundred and ninety-six (1996) individual surface water samples were collected and analyzed and WQ was assessed at 113 locations in the SJR basin (Borglin et al., 2008). Samples were processed and analyzed by the Environmental Engineering Research Program (EERP) laboratory at the University of the Pacific as well as at the University of California, Davis, Dahlgren Lab. This report presents temporal plots of dissolved ammonia-nitrogen (NH3-N) for data analyzed by the UCD Dahlgren laboratory between 2005-2007.
MethodsDepth integrated field samples were colleted during 2005-2007 in the upper San Joaquin River in accordance with EERP Field Standard Operating Procedures Protocol Book (Graham 2008). Water samples were colleted in glass 1000 mL bottles (Wheaton Science Products, Millville, NJ), 1000 mL HDPE Trace-Clean narrow mouth plastic bottles (VWR International), 250 mL HDPE Trace-Clean wide mouth plastic bottles (VWR International) as well as 40 mL trace clean vials with PTFE septa (IChem, Rockwood, TN). Bottles were labeled with the appropriate sample number, site name and sampling date. All bottles were rinsed with sample water prior to sample collection. Some sites required a bucket to collect sample water because of accessibility from a high bridge or platform. For these sites, the bucket was pre-rinsed with sample water and sample bottles were filled using a rinsed funnel. Care was taken to distribute water simultaneously to all sample bottles (rather than sequentially). Samples were immediately stored at 4°C after sampling (cooler temperature was recorded in the lab upon delivery) and transported to the EERP lab on the day of sampling.
Within 24 hours of collection samples for NO3-N and NH3-N were transported from the EERP laboratory to the UCD laboratory, where they were filtered through a pre-rinsed, 0.22 µm polycarbonate membrane (Millipore IsoporeTM), and then stored at -20oC until NH3-N analysis could be completed.
NO3-N and Soluble NH3-N were quantified simultaneously using an automated membrane diffusion/conductivity detection method (Carlson, 1978, 1986; Carlson et al., 1990). The limit of detection for this method was 50 ppb N.
Appendix I Page 320 of 1262 1005

2 of 40
Results/DiscussionWith each set of NH3-N field samples analyzed in the UCD laboratory, quality assurance samples including a field duplicate, a trip blank, and lab blanks were also analyzed. 95.02% of all quality assurance samples were within a passing range (Borglin et al, 2008). Proficiency check samples, standards with unknown concentration to the laboratory analyst, were run approximately twice a year. Four proficiency check samples were analyzed for NH3-N in the UCD laboratory during 2005-2007, and all of these samples were found to be within the acceptable range. Samples were measured ranging from 0.0-21.76 mg/L NH3-N. The average concentration of NH3-N in samples collected was 0.17 mg/L NH3-N. NH3-N was also analyzed at EERP starting in the summer of 2007, on the same water samples and has a high correlation to values measured by EERP. When all data points measured by the two labs are compared they have r2=0.956 (Spier et al, 2008). NH3-N samples measured by EERP have about 91.1% as much NH3-N as the same samples measured by UCD (Figure 2). NH3-N was had low concentrations for most of the year with spikes appearing in the summer months for several sites.
References American Public Health Association (APHA). 2005. Standard Methods for the Examination of
Water and Wastewater, 21st Edition. American Public Health Association, Washington, DC.
Borglin, S., W. Stringfellow, J. Hanlon. 2005. Standard Operating Procedures for the Up-Stream Dissolved Oxygen TMDL Project. LBNL/Pub-937.
Borglin, S., Burks, R., Hanlon, J., Graham, J., Spier, C., Stringfellow, W., and Dahlgren, R., (2008) Methods overview, quality assurance, and quality control, University of the Pacific, Stockton, CA
Borglin, S.E., Burks, R.D., Hanlon, J.S., Stringfellow, W.T. (2008) EERP Lab Protocol Book, University of the Pacific, Stockton, CA.
Carlson, R.M., R. Cabrera, J. Paul, J. Quick and R.Y. Evans. 1990. Rapid direct determination of ammonium and nitrate in soil and plant tissue extracts. Comm. Soil Sci. Plant Anal. 21:1519-1530.
Graham, J., Hanlon, J.S., Stringfellow, W.T., (2008) EERP Field Protocol Book, University of the Pacific, Stockton, CA.
Spier, C., Burks, R., Borglin, S.E. (2008) Comparison of Methods for Analyzing Ammonia, Nitrate and Total Nitrogen, University of the Pacific, Stockton, CA.
Stringfellow, W.T., et al., (2008) Evaluation of Vegitated Ditches, Ponds, and Wetlands as BMPs for Mitigating the Water Quality Impact of Irrigated Agriculture in the San Joaquin Valley, University of the Pacific, Stockton, CA
YSI Environmental Operations Manual (2005) 6-Series Environmental Monitoring Systems, Yellow Springs, OH.
Appendix I Page 321 of 1262 1006
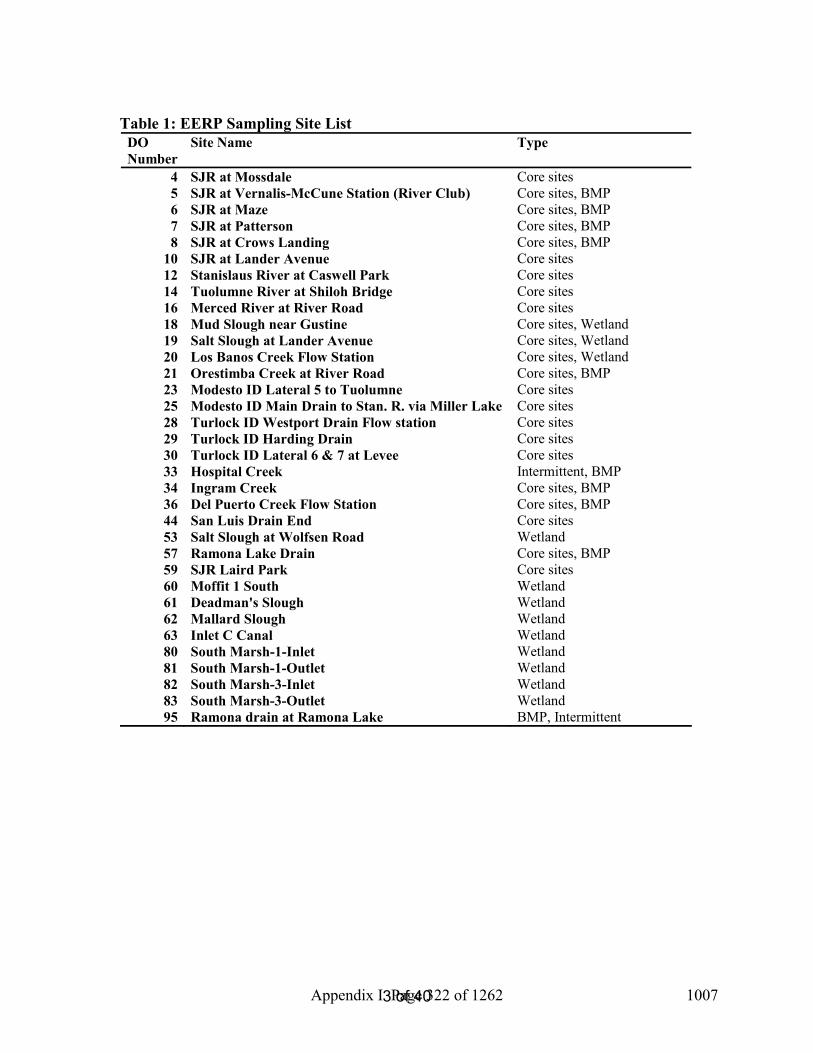
3 of 40
Table 1: EERP Sampling Site List DO Number
Site Name Type
4 SJR at Mossdale Core sites 5 SJR at Vernalis-McCune Station (River Club) Core sites, BMP 6 SJR at Maze Core sites, BMP 7 SJR at Patterson Core sites, BMP 8 SJR at Crows Landing Core sites, BMP
10 SJR at Lander Avenue Core sites 12 Stanislaus River at Caswell Park Core sites 14 Tuolumne River at Shiloh Bridge Core sites 16 Merced River at River Road Core sites 18 Mud Slough near Gustine Core sites, Wetland 19 Salt Slough at Lander Avenue Core sites, Wetland 20 Los Banos Creek Flow Station Core sites, Wetland 21 Orestimba Creek at River Road Core sites, BMP 23 Modesto ID Lateral 5 to Tuolumne Core sites 25 Modesto ID Main Drain to Stan. R. via Miller Lake Core sites 28 Turlock ID Westport Drain Flow station Core sites 29 Turlock ID Harding Drain Core sites 30 Turlock ID Lateral 6 & 7 at Levee Core sites 33 Hospital Creek Intermittent, BMP 34 Ingram Creek Core sites, BMP 36 Del Puerto Creek Flow Station Core sites, BMP 44 San Luis Drain End Core sites 53 Salt Slough at Wolfsen Road Wetland 57 Ramona Lake Drain Core sites, BMP 59 SJR Laird Park Core sites 60 Moffit 1 South Wetland 61 Deadman's Slough Wetland 62 Mallard Slough Wetland 63 Inlet C Canal Wetland 80 South Marsh-1-Inlet Wetland 81 South Marsh-1-Outlet Wetland 82 South Marsh-3-Inlet Wetland 83 South Marsh-3-Outlet Wetland 95 Ramona drain at Ramona Lake BMP, Intermittent
Appendix I Page 322 of 1262 1007

4 of 40
Figure 1: EERP Sampling Site Map of SJR Watershed and Tributaries
Appendix I Page 323 of 1262 1008

5 of 40
Figure 2: UCD vs EERP Timberline Plot of NH3-N .
0 1 2 3 4 5UC Davis N-NH3 (mg/L)
-1
0
1
2
3
4
5
EE
RP
N-N
H3 (
mg/
L)
Y = 0.9108 * XNumber of data points used = 519r2 = 0.9556
Appendix I Page 324 of 1262 1009

6 of 40
Figures 3 -104: Temporal Plots of Dissolved NH3-N By Site ID
1 53 105 157 209 261 313 365Day of the Year
0
0.02
0.04
0.06
0.08
0.1D
isso
lved
NH
3-N
(mg/
L) 2005DO-04: SJR at Mossdale
1 53 105 157 209 261 313 365Day of the Year
0
0.02
0.04
0.06
0.08
0.1
Dis
solv
ed N
H3-
N (m
g/L) 2006
DO-04: SJR at Mossdale
1 53 105 157 209 261 313 365Day of the Year
0
0.02
0.04
0.06
0.08
0.1
Dis
solv
ed N
H3-
N (m
g/L) 2007
DO-04: SJR at Mossdale
Appendix I Page 325 of 1262 1010

7 of 40
1 53 105 157 209 261 313 365Day of the Year
0
0.04
0.08
0.12
0.16
Dis
solv
ed N
H3-
N (m
g/L) 2005
DO-05: SJR at Vernalis-McCune Station
1 53 105 157 209 261 313 365Day of the Year
0
0.04
0.08
0.12
0.16
Dis
solv
ed N
H3-N
(mg/
L) 2006 DO-05: SJR at Vernalis-McCune Station
1 53 105 157 209 261 313 365Day of the Year
0
0.04
0.08
0.12
0.16
Dis
solv
ed N
H3-
N (m
g/L) 2007 DO-05: SJR at Vernalis-McCune Station
Appendix I Page 326 of 1262 1011
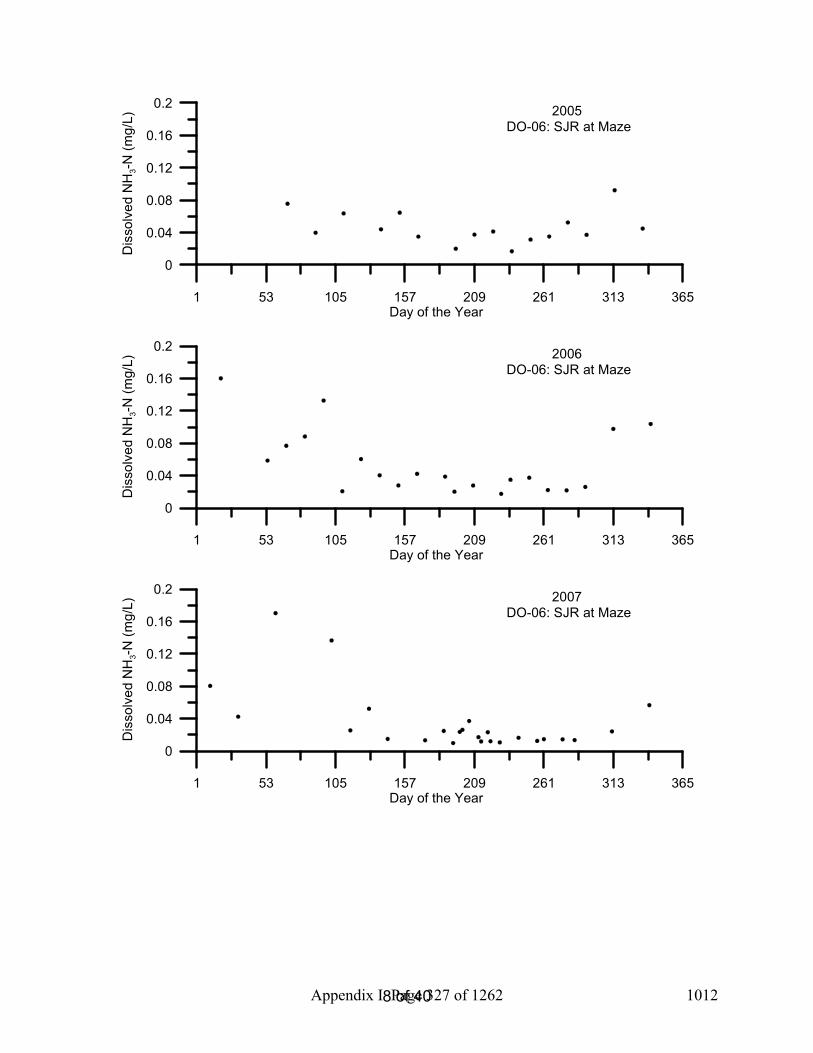
8 of 40
1 53 105 157 209 261 313 365Day of the Year
0
0.04
0.08
0.12
0.16
0.2
Dis
solv
ed N
H3-
N (m
g/L) 2005
DO-06: SJR at Maze
1 53 105 157 209 261 313 365Day of the Year
0
0.04
0.08
0.12
0.16
0.2
Dis
solv
ed N
H3-
N (m
g/L) 2006
DO-06: SJR at Maze
1 53 105 157 209 261 313 365Day of the Year
0
0.04
0.08
0.12
0.16
0.2
Dis
solv
ed N
H3-
N (m
g/L) 2007
DO-06: SJR at Maze
Appendix I Page 327 of 1262 1012
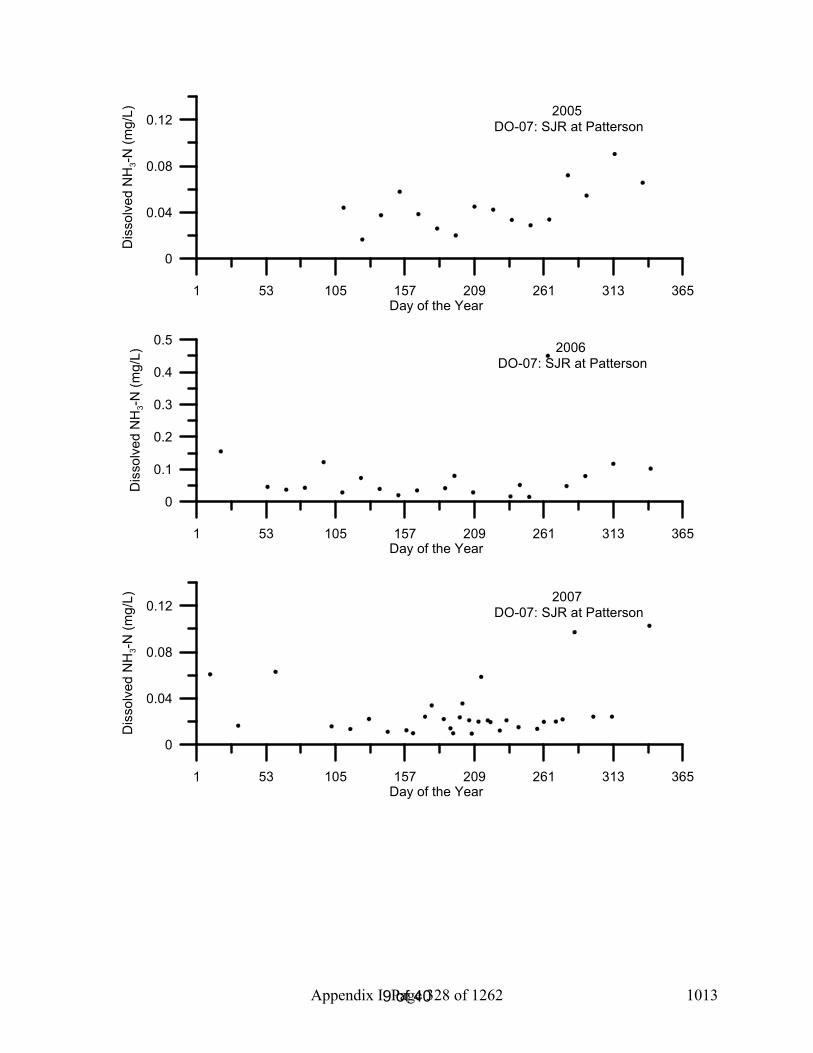
9 of 40
1 53 105 157 209 261 313 365Day of the Year
0
0.04
0.08
0.12D
isso
lved
NH
3-N (m
g/L) 2005
DO-07: SJR at Patterson
1 53 105 157 209 261 313 365Day of the Year
0
0.1
0.2
0.3
0.4
0.5
Dis
solv
ed N
H3-
N (m
g/L) 2006
DO-07: SJR at Patterson
1 53 105 157 209 261 313 365Day of the Year
0
0.04
0.08
0.12
Dis
solv
ed N
H3-
N (m
g/L) 2007
DO-07: SJR at Patterson
Appendix I Page 328 of 1262 1013

10 of 40
1 53 105 157 209 261 313 365Day of the Year
0
0.05
0.1
0.15
0.2
0.25
Dis
solv
ed N
H3-
N (m
g/L) 2005
DO-08: SJR at Crows Landing
1 53 105 157 209 261 313 365Day of the Year
0
0.05
0.1
0.15
0.2
0.25
Dis
solv
ed N
H3-
N (m
g/L) 2006
DO-08: SJR at Crows Landing
1 53 105 157 209 261 313 365Day of the Year
0
0.05
0.1
0.15
0.2
0.25
Dis
solv
ed N
H3-
N (m
g/L) 2007
DO-08: SJR at Crows Landing
Appendix I Page 329 of 1262 1014
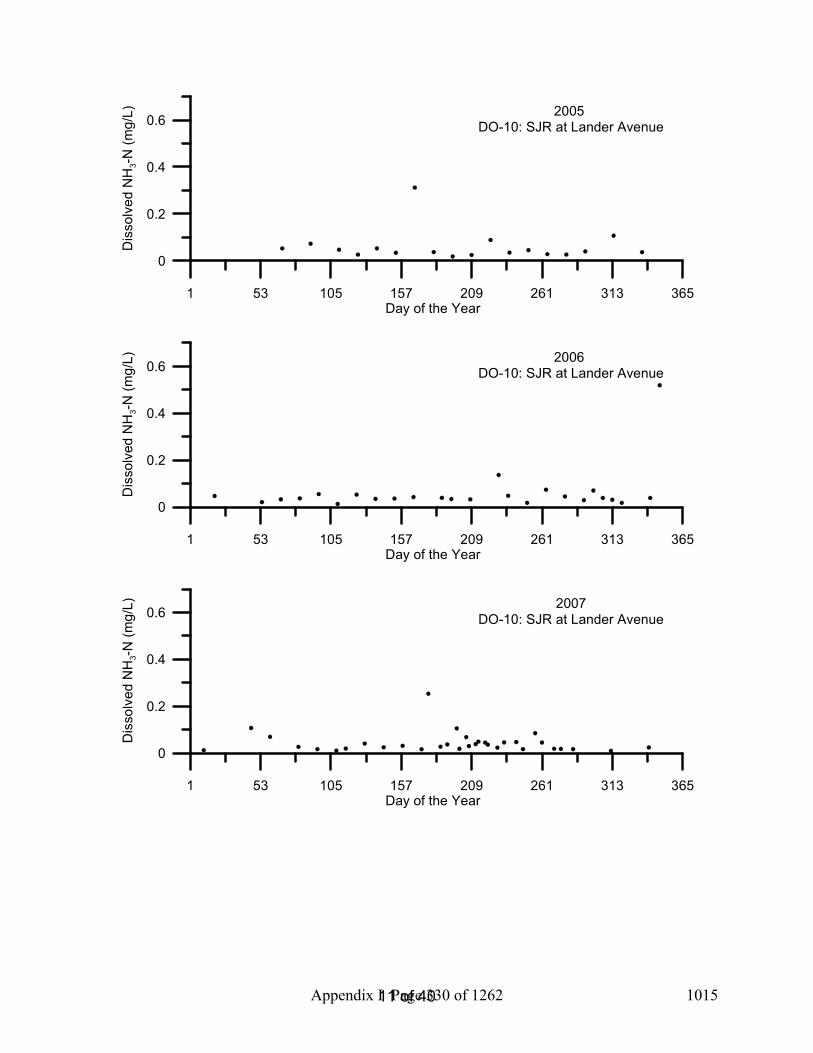
11 of 40
1 53 105 157 209 261 313 365Day of the Year
0
0.2
0.4
0.6D
isso
lved
NH
3-N
(mg/
L) 2005 DO-10: SJR at Lander Avenue
1 53 105 157 209 261 313 365Day of the Year
0
0.2
0.4
0.6
Dis
solv
ed N
H3-
N (m
g/L) 2006
DO-10: SJR at Lander Avenue
1 53 105 157 209 261 313 365Day of the Year
0
0.2
0.4
0.6
Dis
solv
ed N
H3-
N (m
g/L) 2007
DO-10: SJR at Lander Avenue
Appendix I Page 330 of 1262 1015

12 of 40
1 53 105 157 209 261 313 365Day of the Year
0
0.04
0.08
0.12
0.16
0.2
Dis
solv
ed N
H3-
N (m
g/L) 2005
DO-12: Stanislaus River at Caswell Park
1 53 105 157 209 261 313 365Day of the Year
0
0.04
0.08
0.12
0.16
0.2
Dis
solv
ed N
H3-
N (m
g/L) 2006
DO-12: Stanislaus River at Caswell Park
1 53 105 157 209 261 313 365Day of the Year
0
0.04
0.08
0.12
0.16
0.2
Dis
solv
ed N
H3-
N (m
g/L) 2007DO-12: Stanislaus River at Caswell Park
Appendix I Page 331 of 1262 1016
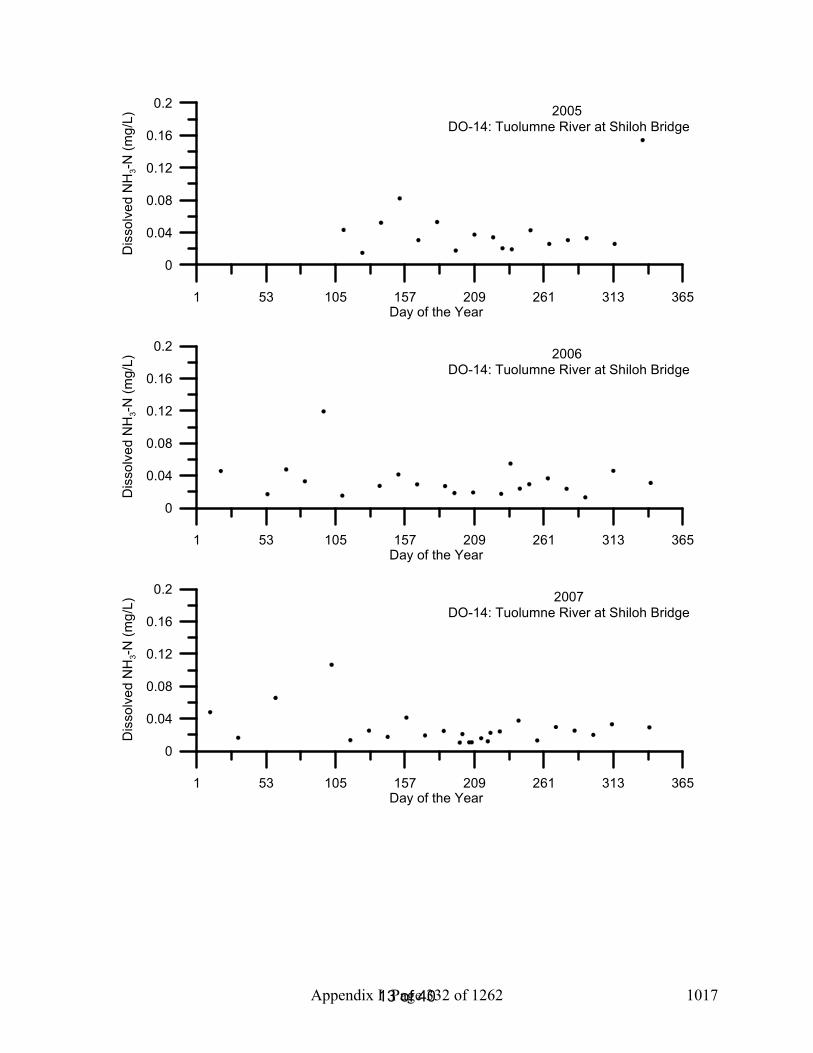
13 of 40
1 53 105 157 209 261 313 365Day of the Year
0
0.04
0.08
0.12
0.16
0.2
Dis
solv
ed N
H3-
N (m
g/L) 2005
DO-14: Tuolumne River at Shiloh Bridge
1 53 105 157 209 261 313 365Day of the Year
0
0.04
0.08
0.12
0.16
0.2
Dis
solv
ed N
H3-
N (m
g/L) 2006
DO-14: Tuolumne River at Shiloh Bridge
1 53 105 157 209 261 313 365Day of the Year
0
0.04
0.08
0.12
0.16
0.2
Dis
solv
ed N
H3-
N (m
g/L) 2007DO-14: Tuolumne River at Shiloh Bridge
Appendix I Page 332 of 1262 1017

14 of 40
1 53 105 157 209 261 313 365Day of the Year
0
0.04
0.08
0.12
0.16D
isso
lved
NH
3-N (m
g/L) 2005
DO-16: Merced River at River Road
1 53 105 157 209 261 313 365Day of the Year
0
0.04
0.08
0.12
0.16
Dis
solv
ed N
H3-
N (m
g/L) 2006
DO-16: Merced River at River Road
1 53 105 157 209 261 313 365Day of the Year
0
0.04
0.08
0.12
0.16
Dis
solv
ed N
H3-
N (m
g/L) 2007
DO-16: Merced River at River Road
Appendix I Page 333 of 1262 1018
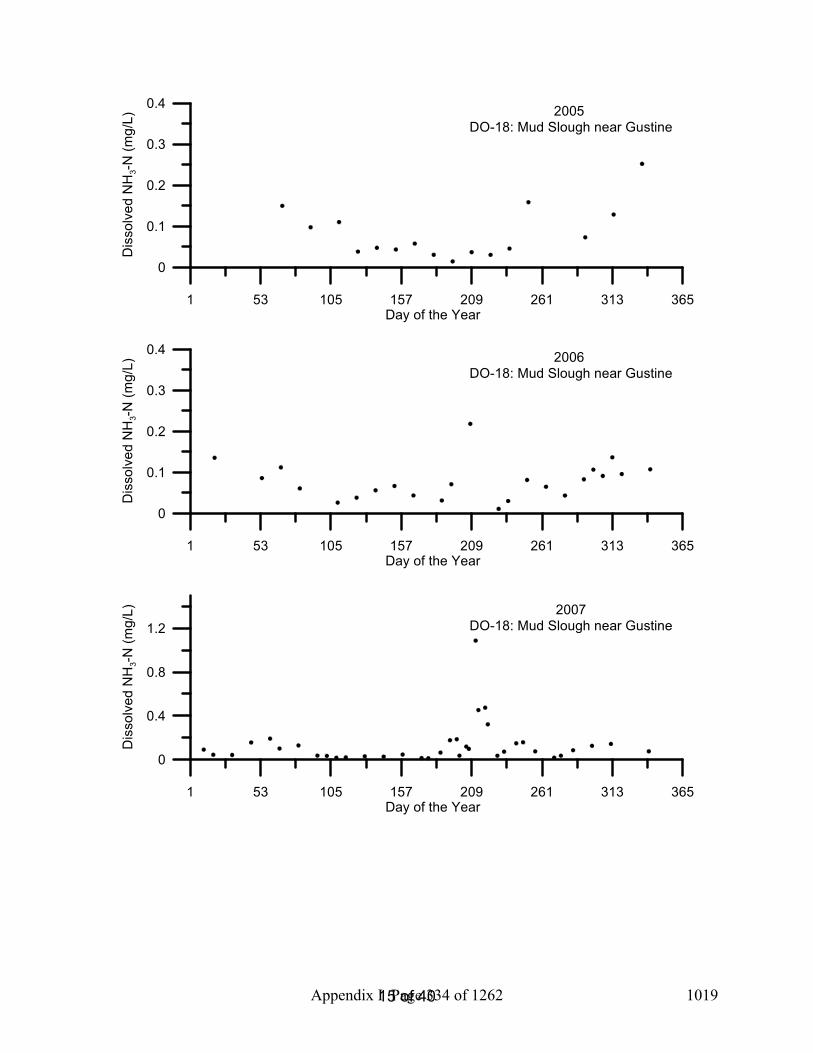
15 of 40
1 53 105 157 209 261 313 365Day of the Year
0
0.1
0.2
0.3
0.4
Dis
solv
ed N
H3-
N (m
g/L) 2005
DO-18: Mud Slough near Gustine
1 53 105 157 209 261 313 365Day of the Year
0
0.1
0.2
0.3
0.4
Dis
solv
ed N
H3-N
(mg/
L) 2006 DO-18: Mud Slough near Gustine
1 53 105 157 209 261 313 365Day of the Year
0
0.4
0.8
1.2
Dis
solv
ed N
H3-
N (m
g/L) 2007
DO-18: Mud Slough near Gustine
Appendix I Page 334 of 1262 1019

16 of 40
1 53 105 157 209 261 313 365Day of the Year
0
0.1
0.2
0.3
0.4
Dis
solv
ed N
H3-
N (m
g/L) 2005
DO-19: Salt Slough at Lander Avenue
1 53 105 157 209 261 313 365Day of the Year
0
0.1
0.2
0.3
0.4
Dis
solv
ed N
H3-N
(mg/
L) 2006 DO-19: Salt Slough at Lander Avenue
1 53 105 157 209 261 313 365Day of the Year
0
0.4
0.8
1.2
1.6
Dis
solv
ed N
H3-
N (m
g/L) 2007
DO-19: Salt Slough at Lander Avenue
Appendix I Page 335 of 1262 1020

17 of 40
1 53 105 157 209 261 313 365Day of the Year
0
1
2
3
4
Dis
solv
ed N
H3-
N (m
g/L) 2005
DO-20: Los Banos Creek at Highway 140
1 53 105 157 209 261 313 365Day of the Year
0
0.2
0.4
0.6
0.8
1
Dis
solv
ed N
H3-
N (m
g/L) 2006
DO-20: Los Banos Creek at Highway 140
1 53 105 157 209 261 313 365Day of the Year
0
0.2
0.4
0.6
0.8
1
Dis
solv
ed N
H3-
N (m
g/L) 2007
DO-20: Los Banos Creek at Highway 140
Appendix I Page 336 of 1262 1021

18 of 40
1 53 105 157 209 261 313 365Day of the Year
0
0.4
0.8
1.2D
isso
lved
NH
3-N
(mg/
L) 2005 DO-21: Orestimba Creek at River Road
1 53 105 157 209 261 313 365Day of the Year
0
0.4
0.8
1.2
Dis
solv
ed N
H3-
N (m
g/L) 2006
DO-21: Orestimba Creek at River Road
1 53 105 157 209 261 313 365Day of the Year
0
2
4
6
Dis
solv
ed N
H3-
N (m
g/L) 2007DO-21: Orestimba Creek at River Road
Appendix I Page 337 of 1262 1022

19 of 40
1 53 105 157 209 261 313 365Day of the Year
0
0.4
0.8
1.2
Dis
solv
ed N
H3-
N (m
g/L) 2005
DO-23: Modesto ID Lateral 5 to Tuolumne
1 53 105 157 209 261 313 365Day of the Year
0
0.4
0.8
1.2
Dis
solv
ed N
H3-N
(mg/
L) 2006 DO-23: Modesto ID Lateral 5 to Tuolumne
1 53 105 157 209 261 313 365Day of the Year
0
0.4
0.8
1.2
Dis
solv
ed N
H3-
N (m
g/L) 2007
DO-23: Modesto ID Lateral 5 to Tuolumne
Appendix I Page 338 of 1262 1023

20 of 40
1 53 105 157 209 261 313 365Day of the Year
0
1
2
3
Dis
solv
ed N
H3-
N (m
g/L) 2005
DO-25: MID Main Drain to Stan. R. via Miller Lake
1 53 105 157 209 261 313 365Day of the Year
0
5
10
15
20
25
Dis
solv
ed N
H3-
N (m
g/L) 2006
DO-25: MID Main Drain to Stan. R. via Miller Lake
1 53 105 157 209 261 313 365Day of the Year
0
1
2
3
Dis
solv
ed N
H3-N
(mg/
L) 2007DO-25: MID Main Drain to Stan. R. via Miller Lake
Appendix I Page 339 of 1262 1024

21 of 40
1 53 105 157 209 261 313 365Day of the Year
0
0.4
0.8
1.2
1.6
2
Dis
solv
ed N
H3-
N (m
g/L) 2005
DO-28: Turlock ID Westport Drain Flow Station
1 53 105 157 209 261 313 365Day of the Year
0
0.4
0.8
1.2
1.6
2
Dis
solv
ed N
H3-N
(mg/
L) 2006 DO-28: Turlock ID Westport Drain Flow Station
1 53 105 157 209 261 313 365Day of the Year
0
0.4
0.8
1.2
1.6
2
Dis
solv
ed N
H3-
N (m
g/L) 2007
DO-28: Turlock ID Westport Drain Flow Station
Appendix I Page 340 of 1262 1025

22 of 40
1 53 105 157 209 261 313 365Day of the Year
0
1
2
3
Dis
solv
ed N
H3-N
(mg/
L) 2005 DO-29: Turlock ID Harding Drain
1 53 105 157 209 261 313 365Day of the Year
0
1
2
3
Dis
solv
ed N
H3-
N (m
g/L) 2006
DO-29: Turlock ID Harding Drain
1 53 105 157 209 261 313 365Day of the Year
0
1
2
3
Dis
solv
ed N
H3-
N (m
g/L) 2007
DO-29: Turlock ID Harding Drain
Appendix I Page 341 of 1262 1026

23 of 40
1 53 105 157 209 261 313 365Day of the Year
0
0.2
0.4
0.6
0.8
1
Dis
solv
ed N
H3-
N (m
g/L) 2005
DO-30: TID Lat 6 & 7 at River Rd.
1 53 105 157 209 261 313 365Day of the Year
0
0.2
0.4
0.6
0.8
1
Dis
solv
ed N
H3-N
(mg/
L) 2006 DO-30: TID Lat 6 & 7 at River Rd.
1 53 105 157 209 261 313 365Day of the Year
0
0.2
0.4
0.6
0.8
1
Dis
solv
ed N
H3-
N (m
g/L) 2007
DO-30: TID Lat 6 & 7 at River Rd.
Appendix I Page 342 of 1262 1027

24 of 40
1 53 105 157 209 261 313 365Day of the Year
0
0.2
0.4
0.6
0.8
Dis
solv
ed N
H3-
N (m
g/L) 2005
DO-33: Hospital Creek
1 53 105 157 209 261 313 365Day of the Year
0
0.2
0.4
0.6
0.8
Dis
solv
ed N
H3-N
(mg/
L) 2006 DO-33: Hospital Creek
1 53 105 157 209 261 313 365Day of the Year
0
0.2
0.4
0.6
0.8
Dis
solv
ed N
H3-
N (m
g/L) 2007
DO-33: Hospital Creek
Appendix I Page 343 of 1262 1028

25 of 40
1 53 105 157 209 261 313 365Day of the Year
0
1
2
3
Dis
solv
ed N
H3-N
(mg/
L) 2005 DO-34: Ingram Creek Flow Station
1 53 105 157 209 261 313 365Day of the Year
0
1
2
3
Dis
solv
ed N
H3-
N (m
g/L) 2006
DO-34: Ingram Creek Flow Station
1 53 105 157 209 261 313 365Day of the Year
0
1
2
3
Dis
solv
ed N
H3-
N (m
g/L) 2007
DO-34: Ingram Creek Flow Station
Appendix I Page 344 of 1262 1029

26 of 40
1 53 105 157 209 261 313 365Day of the Year
0
1
2
3
4
5
Dis
solv
ed N
H3-
N (m
g/L) 2005
DO-36: Del Puerto Creek Flow Station
1 53 105 157 209 261 313 365Day of the Year
0
1
2
3
4
5
Dis
solv
ed N
H3-
N (m
g/L) 2006
DO-36: Del Puerto Creek Flow Station
1 53 105 157 209 261 313 365Day of the Year
0
1
2
3
4
5
Dis
solv
ed N
H3-
N (m
g/L) 2007
DO-36: Del Puerto Creek Flow Station
Appendix I Page 345 of 1262 1030

27 of 40
1 53 105 157 209 261 313 365Day of the Year
0
0.2
0.4
0.6
Dis
solv
ed N
H3-
N (m
g/L) 2005
DO-44: San Luis Drain End
1 53 105 157 209 261 313 365Day of the Year
0
0.2
0.4
0.6
Dis
solv
ed N
H3-N
(mg/
L) 2006 DO-44: San Luis Drain End
1 53 105 157 209 261 313 365Day of the Year
0
0.2
0.4
0.6
Dis
solv
ed N
H3-
N (m
g/L) 2007
DO-44: San Luis Drain End
Appendix I Page 346 of 1262 1031

28 of 40
1 53 105 157 209 261 313 365Day of the Year
0
0.1
0.2
0.3
0.4
Dis
solv
ed N
H3-
N (m
g/L) 2005
DO-53: Salt Slough at Wolfsen Road
1 53 105 157 209 261 313 365Day of the Year
0
0.1
0.2
0.3
0.4
Dis
solv
ed N
H3-N
(mg/
L) 2006 DO-53: Salt Slough at Wolfsen Road
1 53 105 157 209 261 313 365Day of the Year
0
0.1
0.2
0.3
0.4
Dis
solv
ed N
H3-
N (m
g/L) 2007
DO-53: Salt Slough at Wolfsen Road
Appendix I Page 347 of 1262 1032

29 of 40
1 53 105 157 209 261 313 365Day of the Year
0
0.4
0.8
1.2
1.6
Dis
solv
ed N
H3-
N (m
g/L) 2005
DO-57: Ramona Lake Drain at Levee
1 53 105 157 209 261 313 365Day of the Year
0
0.4
0.8
1.2
1.6
Dis
solv
ed N
H3-N
(mg/
L) 2006 DO-57: Ramona Lake Drain at Levee
1 53 105 157 209 261 313 365Day of the Year
0
0.4
0.8
1.2
1.6
Dis
solv
ed N
H3-
N (m
g/L) 2007
DO-57: Ramona Lake Drain at Levee
Appendix I Page 348 of 1262 1033

30 of 40
1 53 105 157 209 261 313 365Day of the Year
0
0.1
0.2
0.3
0.4
Dis
solv
ed N
H3-
N (m
g/L) 2005
DO-59: SJR Laird Park
1 53 105 157 209 261 313 365Day of the Year
0
0.1
0.2
0.3
0.4
Dis
solv
ed N
H3-N
(mg/
L) 2006 DO-59: SJR Laird Park
1 53 105 157 209 261 313 365Day of the Year
0
0.1
0.2
0.3
0.4
Dis
solv
ed N
H3-
N (m
g/L) 2007
DO-59: SJR Laird Park
Appendix I Page 349 of 1262 1034
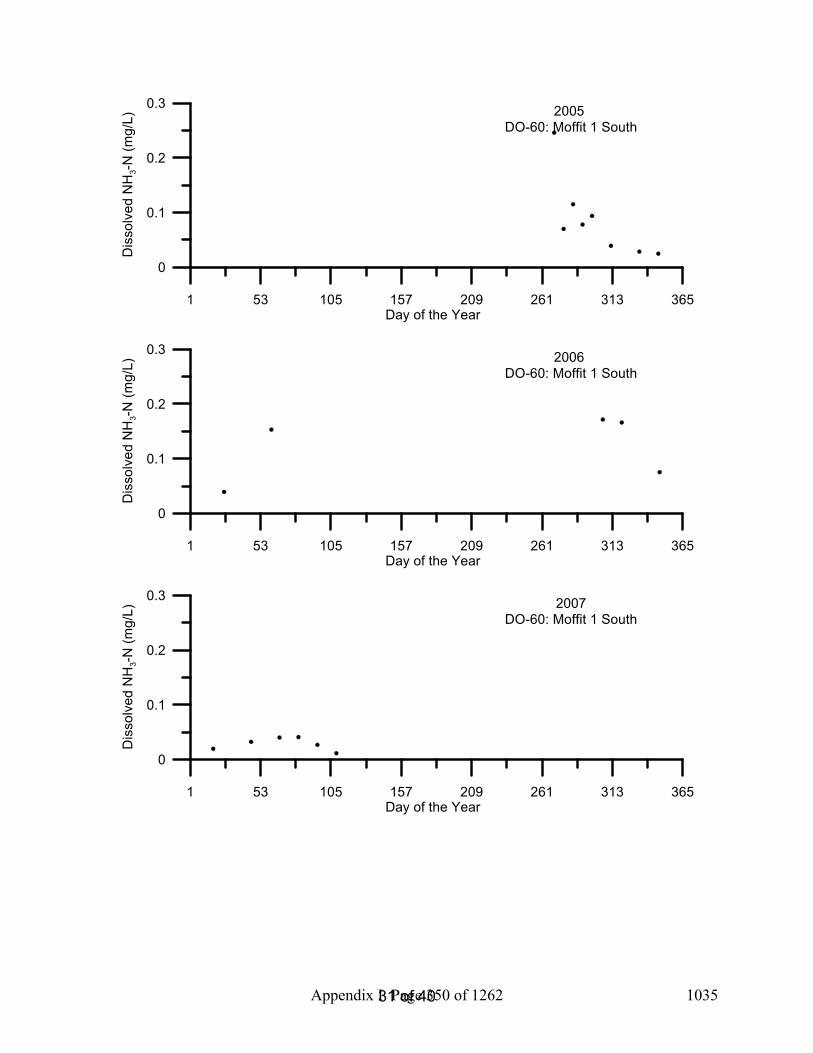
31 of 40
1 53 105 157 209 261 313 365Day of the Year
0
0.1
0.2
0.3
Dis
solv
ed N
H3-
N (m
g/L) 2005
DO-60: Moffit 1 South
1 53 105 157 209 261 313 365Day of the Year
0
0.1
0.2
0.3
Dis
solv
ed N
H3-N
(mg/
L) 2006 DO-60: Moffit 1 South
1 53 105 157 209 261 313 365Day of the Year
0
0.1
0.2
0.3
Dis
solv
ed N
H3-
N (m
g/L) 2007
DO-60: Moffit 1 South
Appendix I Page 350 of 1262 1035

32 of 40
1 53 105 157 209 261 313 365Day of the Year
0
0.2
0.4
0.6
0.8
Dis
solv
ed N
H3-
N (m
g/L) 2005
DO-61: Deadman's Slough
1 53 105 157 209 261 313 365Day of the Year
0
0.2
0.4
0.6
0.8
Dis
solv
ed N
H3-N
(mg/
L) 2006 DO-61: Deadman's Slough
1 53 105 157 209 261 313 365Day of the Year
0
0.2
0.4
0.6
0.8
Dis
solv
ed N
H3-
N (m
g/L) 2007
DO-61: Deadman's Slough
Appendix I Page 351 of 1262 1036

33 of 40
1 53 105 157 209 261 313 365Day of the Year
0
0.1
0.2
0.3
0.4
Dis
solv
ed N
H3-
N (m
g/L) 2005
DO-62: Mallard Slough
1 53 105 157 209 261 313 365Day of the Year
0
0.1
0.2
0.3
0.4
Dis
solv
ed N
H3-N
(mg/
L) 2006DO-62: Mallard Slough
1 53 105 157 209 261 313 365Day of the Year
0
0.1
0.2
0.3
0.4
Dis
solv
ed N
H3-
N (m
g/L) 2007
DO-62: Mallard Slough
Appendix I Page 352 of 1262 1037

34 of 40
1 53 105 157 209 261 313 365Day of the Year
0
0.2
0.4
0.6
0.8
Dis
solv
ed N
H3-
N (m
g/L) 2005
DO-63: Inlet C Canal
1 53 105 157 209 261 313 365Day of the Year
0
0.2
0.4
0.6
0.8
Dis
solv
ed N
H3-N
(mg/
L) 2006DO-63: Inlet C Canal
1 53 105 157 209 261 313 365Day of the Year
0
0.2
0.4
0.6
0.8
Dis
solv
ed N
H3-
N (m
g/L) 2007
DO-63: Inlet C Canal
Appendix I Page 353 of 1262 1038

35 of 40
1 53 105 157 209 261 313 365Day of the Year
0
0.1
0.2
0.3
Dis
solv
ed N
H3-
N (m
g/L) 2005
DO-80: South Marsh 1 Inlet
1 53 105 157 209 261 313 365Day of the Year
0
0.1
0.2
0.3
Dis
solv
ed N
H3-N
(mg/
L) 2006DO-80: South Marsh 1 Inlet
1 53 105 157 209 261 313 365Day of the Year
0
0.1
0.2
0.3
Dis
solv
ed N
H3-
N (m
g/L) 2007
DO-80: South Marsh 1 Inlet
Appendix I Page 354 of 1262 1039

36 of 40
1 53 105 157 209 261 313 365Day of the Year
0
1
2
3
Dis
solv
ed N
H3-N
(mg/
L) 2005 DO-81: South Marsh 1 Outlet
1 53 105 157 209 261 313 365Day of the Year
0
1
2
3
Dis
solv
ed N
H3-
N (m
g/L) 2006
DO-81: South Marsh 1 Outlet
1 53 105 157 209 261 313 365Day of the Year
0
1
2
3
Dis
solv
ed N
H3-
N (m
g/L) 2007
DO-81: South Marsh 1 Outlet
Appendix I Page 355 of 1262 1040

37 of 40
1 53 105 157 209 261 313 365Day of the Year
0
0.2
0.4
0.6
0.8
Dis
solv
ed N
H3-
N (m
g/L) 2005
DO-82: South Marsh 3 Inlet
1 53 105 157 209 261 313 365Day of the Year
0
0.2
0.4
0.6
0.8
Dis
solv
ed N
H3-N
(mg/
L) 2006DO-82: South Marsh 3 Inlet
1 53 105 157 209 261 313 365Day of the Year
0
0.2
0.4
0.6
0.8
Dis
solv
ed N
H3-
N (m
g/L) 2007
DO-82: South Marsh 3 Inlet
Appendix I Page 356 of 1262 1041

38 of 40
1 53 105 157 209 261 313 365Day of the Year
0
0.04
0.08
0.12
0.16
0.2
Dis
solv
ed N
H3-
N (m
g/L) 2005
DO-83: South Marsh 3 Outlet
1 53 105 157 209 261 313 365Day of the Year
0
0.04
0.08
0.12
0.16
0.2
Dis
solv
ed N
H3-
N (m
g/L) 2006
DO-83: South Marsh 3 Outlet
1 53 105 157 209 261 313 365Day of the Year
0
0.04
0.08
0.12
0.16
0.2
Dis
solv
ed N
H3-
N (m
g/L) 2007
DO-83: South Marsh 3 Outlet
Appendix I Page 357 of 1262 1042

39 of 40
1 53 105 157 209 261 313 365Day of the Year
0
0.4
0.8
1.2
1.6
2
Dis
solv
ed N
H3-
N (m
g/L) 2005
DO-95: Ramona Lake Entrance
1 53 105 157 209 261 313 365Day of the Year
0
0.4
0.8
1.2
1.6
2
Dis
solv
ed N
H3-N
(mg/
L) 2006DO-95: Ramona Lake Entrance
1 53 105 157 209 261 313 365Day of the Year
0
0.4
0.8
1.2
1.6
2
Dis
solv
ed N
H3-
N (m
g/L) 2007
DO-95: Ramona Lake Entrance
Appendix I Page 358 of 1262 1043

Temporal Plots of 2005-2007 Chlorine Data from the Upstream San Joaquin River
Chelsea Spier1
Remie Burks1
Sharon Borglin1
Randy Dahlgren2
Jeremy Hanlon1
Justin Graham1
William Stringfellow1
February 2008
1Environmental Engineering Research Program School of Engineering & Computer Sciences
University of the Pacific 3601 Pacific Avenue, Sears Hall
Stockton, CA 95211 2UC Davis, Davis, CA
Appendix I Page 359 of 1262 1044
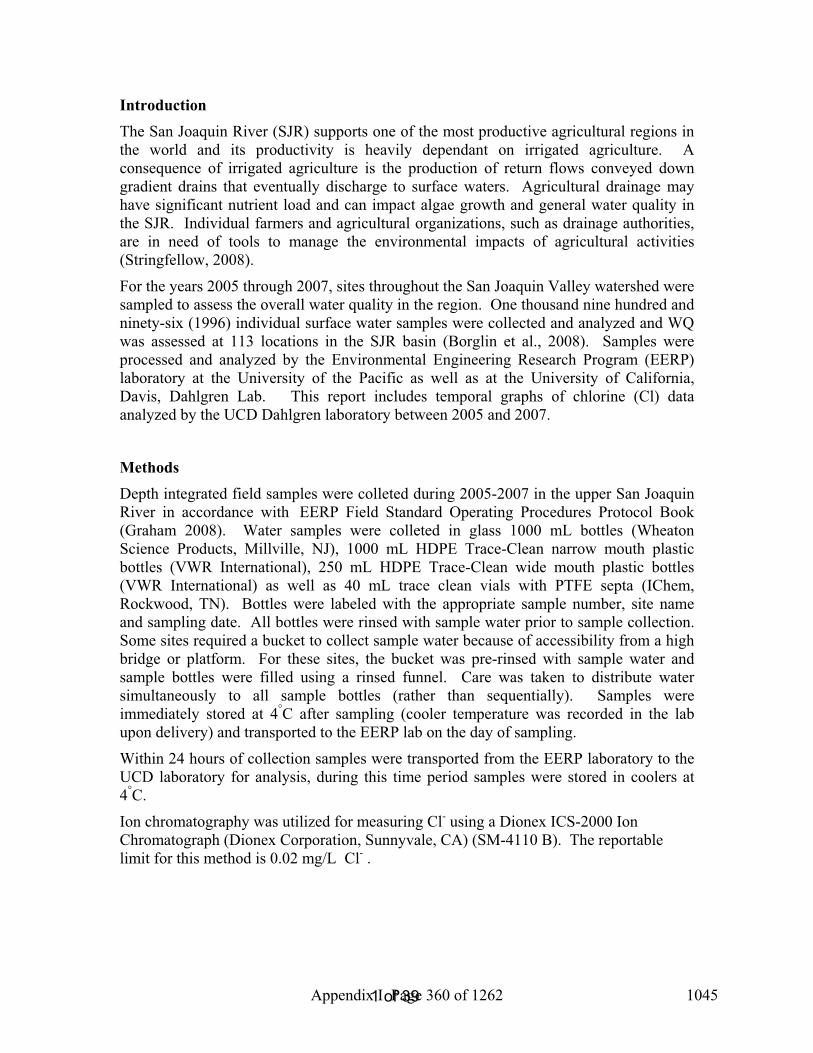
1 of 39
Introduction The San Joaquin River (SJR) supports one of the most productive agricultural regions in the world and its productivity is heavily dependant on irrigated agriculture. A consequence of irrigated agriculture is the production of return flows conveyed down gradient drains that eventually discharge to surface waters. Agricultural drainage may have significant nutrient load and can impact algae growth and general water quality in the SJR. Individual farmers and agricultural organizations, such as drainage authorities, are in need of tools to manage the environmental impacts of agricultural activities (Stringfellow, 2008).
For the years 2005 through 2007, sites throughout the San Joaquin Valley watershed were sampled to assess the overall water quality in the region. One thousand nine hundred and ninety-six (1996) individual surface water samples were collected and analyzed and WQ was assessed at 113 locations in the SJR basin (Borglin et al., 2008). Samples were processed and analyzed by the Environmental Engineering Research Program (EERP) laboratory at the University of the Pacific as well as at the University of California, Davis, Dahlgren Lab. This report includes temporal graphs of chlorine (Cl) data analyzed by the UCD Dahlgren laboratory between 2005 and 2007.
MethodsDepth integrated field samples were colleted during 2005-2007 in the upper San Joaquin River in accordance with EERP Field Standard Operating Procedures Protocol Book (Graham 2008). Water samples were colleted in glass 1000 mL bottles (Wheaton Science Products, Millville, NJ), 1000 mL HDPE Trace-Clean narrow mouth plastic bottles (VWR International), 250 mL HDPE Trace-Clean wide mouth plastic bottles (VWR International) as well as 40 mL trace clean vials with PTFE septa (IChem, Rockwood, TN). Bottles were labeled with the appropriate sample number, site name and sampling date. All bottles were rinsed with sample water prior to sample collection. Some sites required a bucket to collect sample water because of accessibility from a high bridge or platform. For these sites, the bucket was pre-rinsed with sample water and sample bottles were filled using a rinsed funnel. Care was taken to distribute water simultaneously to all sample bottles (rather than sequentially). Samples were immediately stored at 4°C after sampling (cooler temperature was recorded in the lab upon delivery) and transported to the EERP lab on the day of sampling.
Within 24 hours of collection samples were transported from the EERP laboratory to the UCD laboratory for analysis, during this time period samples were stored in coolers at 4°C.
Ion chromatography was utilized for measuring Cl- using a Dionex ICS-2000 Ion Chromatograph (Dionex Corporation, Sunnyvale, CA) (SM-4110 B). The reportable limit for this method is 0.02 mg/L Cl- .
Appendix I Page 360 of 1262 1045
2 of 39
Results/DiscussionSamples were measured ranging from 0.0-966.0 mg/L Cl. The average concentration of Cl in samples collected was 143.7 mg/L Cl. These temporal plots (Figures 3-104) created an easy visual way to find outliers and double check data entry for possible mistakes.
References American Public Health Association (APHA). 2005. Standard Methods for the Examination of
Water and Wastewater, 21st Edition. American Public Health Association, Washington, DC.
Borglin, S., W. Stringfellow, J. Hanlon. 2005. Standard Operating Procedures for the Up-Stream Dissolved Oxygen TMDL Project. LBNL/Pub-937.
Borglin, S., Burks, R., Hanlon, J., Graham, J., Spier, C., Stringfellow, W., and Dahlgren, R., (2008) Methods overview, quality assurance, and quality control, University of the Pacific, Stockton, CA.
Borglin, S.E., Burks, R.D., Hanlon, J.S., Stringfellow, W.T. (2008) EERP Lab Protocol Book, University of the Pacific, Stockton, CA.
Graham, J., Hanlon, J.S., Stringfellow, W.T., (2008) EERP Field Protocol Book, University of the Pacific, Stockton, CA.
Stringfellow, W.T., et al., (2008) Evaluation of Vegitated Ditches, Ponds, and Wetlands as BMPs for Mitigating the Water Quality Impact of Irrigated Agriculture in the San Joaquin Valley, University of the Pacific, Stockton, CA.
YSI Environmental Operations Manual (2005) 6-Series Environmental Monitoring Systems, Yellow Springs, OH.
Appendix I Page 361 of 1262 1046

3 of 39
Table 1: EERP Sampling Site List DO Number
Site Name Type
4 SJR at Mossdale Core sites 5 SJR at Vernalis-McCune Station (River Club) Core sites, BMP 6 SJR at Maze Core sites, BMP 7 SJR at Patterson Core sites, BMP 8 SJR at Crows Landing Core sites, BMP
10 SJR at Lander Avenue Core sites 12 Stanislaus River at Caswell Park Core sites 14 Tuolumne River at Shiloh Bridge Core sites 16 Merced River at River Road Core sites 18 Mud Slough near Gustine Core sites, Wetland 19 Salt Slough at Lander Avenue Core sites, Wetland 20 Los Banos Creek Flow Station Core sites, Wetland 21 Orestimba Creek at River Road Core sites, BMP 23 Modesto ID Lateral 5 to Tuolumne Core sites 25 Modesto ID Main Drain to Stan. R. via Miller Lake Core sites 28 Turlock ID Westport Drain Flow station Core sites 29 Turlock ID Harding Drain Core sites 30 Turlock ID Lateral 6 & 7 at Levee Core sites 33 Hospital Creek Intermittent, BMP 34 Ingram Creek Core sites, BMP 36 Del Puerto Creek Flow Station Core sites, BMP 44 San Luis Drain End Core sites 53 Salt Slough at Wolfsen Road Wetland 57 Ramona Lake Drain Core sites, BMP 59 SJR Laird Park Core sites 60 Moffit 1 South Wetland 61 Deadman's Slough Wetland 62 Mallard Slough Wetland 63 Inlet C Canal Wetland 80 South Marsh-1-Inlet Wetland 81 South Marsh-1-Outlet Wetland 82 South Marsh-3-Inlet Wetland 83 South Marsh-3-Outlet Wetland 95 Ramona drain at Ramona Lake BMP, Intermittent
Appendix I Page 362 of 1262 1047

4 of 39
Figure 1: EERP Sampling Site Map of SJR Watershed and Tributaries
Appendix I Page 363 of 1262 1048

5 of 39
Figures 2 -103: Temporal Plots of Cl By Site ID
1 53 105 157 209 261 313 365Day of the Year
0
40
80
120
160C
l (m
g/L)
2005 DO-04: SJR at Mossdale
1 53 105 157 209 261 313 365Day of the Year
0
40
80
120
160
Cl (
mg/
L)
2006 DO-04: SJR at Mossdale
1 53 105 157 209 261 313 365Day of the Year
0
40
80
120
160
Cl (
mg/
L)
2007DO-04: SJR at Mossdale
Appendix I Page 364 of 1262 1049

6 of 39
1 53 105 157 209 261 313 365Day of the Year
0
40
80
120C
l (m
g/L)
2005 DO-05: SJR at Vernalis-McCune Station
1 53 105 157 209 261 313 365Day of the Year
0
40
80
120
Cl (
mg/
L)
2006 DO-05: SJR at Vernalis-McCune Station
1 53 105 157 209 261 313 365Day of the Year
0
40
80
120
Cl (
mg/
L)
2007 DO-05: SJR at Vernalis-McCune Station
Appendix I Page 365 of 1262 1050

7 of 39
1 53 105 157 209 261 313 365Day of the Year
0
40
80
120
160
200
Cl (
mg/
L)2005
DO-06: SJR at Maze
1 53 105 157 209 261 313 365Day of the Year
0
40
80
120
160
200
Cl (
mg/
L)
2006 DO-06: SJR at Maze
1 53 105 157 209 261 313 365Day of the Year
0
40
80
120
160
200
Cl (
mg/
L)
2007 DO-06: SJR at Maze
Appendix I Page 366 of 1262 1051

8 of 39
1 53 105 157 209 261 313 365Day of the Year
0
50
100
150
200
250
Cl (
mg/
L)2005
DO-07: SJR at Patterson
1 53 105 157 209 261 313 365Day of the Year
0
50
100
150
200
250
Cl (
mg/
L)
2006 DO-07: SJR at Patterson
1 53 105 157 209 261 313 365Day of the Year
0
50
100
150
200
250
Cl (
mg/
L)
2007 DO-07: SJR at Patterson
Appendix I Page 367 of 1262 1052
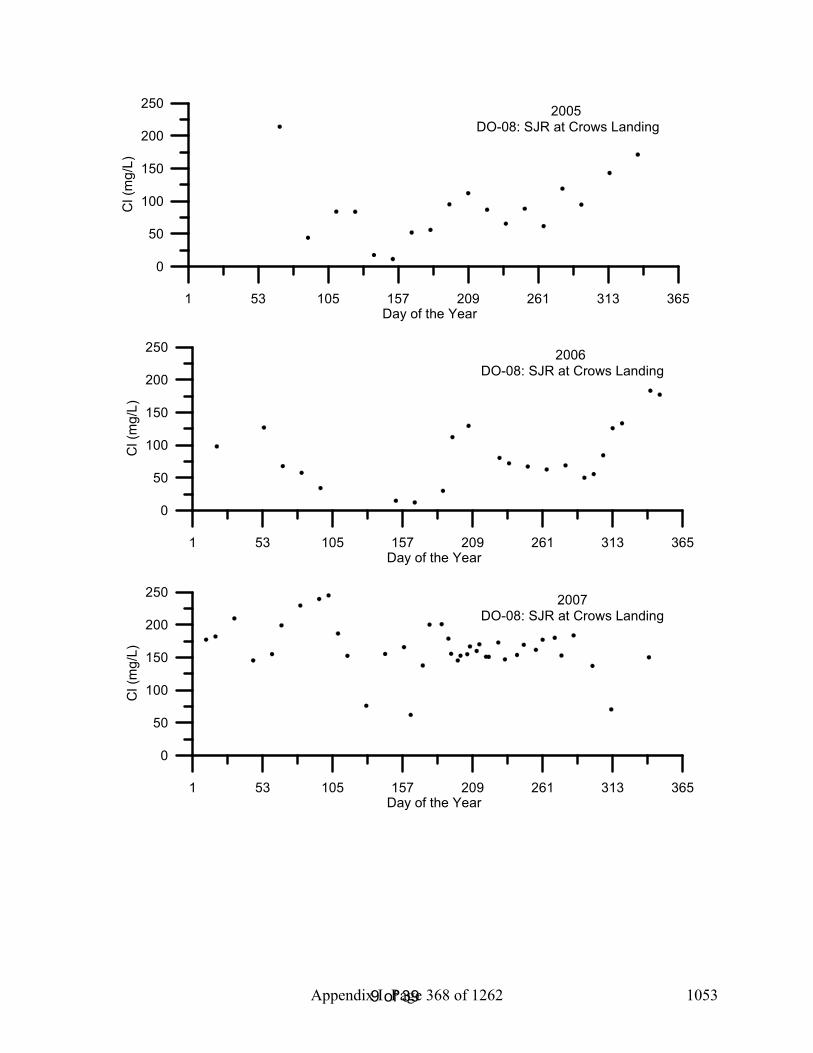
9 of 39
1 53 105 157 209 261 313 365Day of the Year
0
50
100
150
200
250
Cl (
mg/
L)2005
DO-08: SJR at Crows Landing
1 53 105 157 209 261 313 365Day of the Year
0
50
100
150
200
250
Cl (
mg/
L)
2006 DO-08: SJR at Crows Landing
1 53 105 157 209 261 313 365Day of the Year
0
50
100
150
200
250
Cl (
mg/
L)
2007DO-08: SJR at Crows Landing
Appendix I Page 368 of 1262 1053
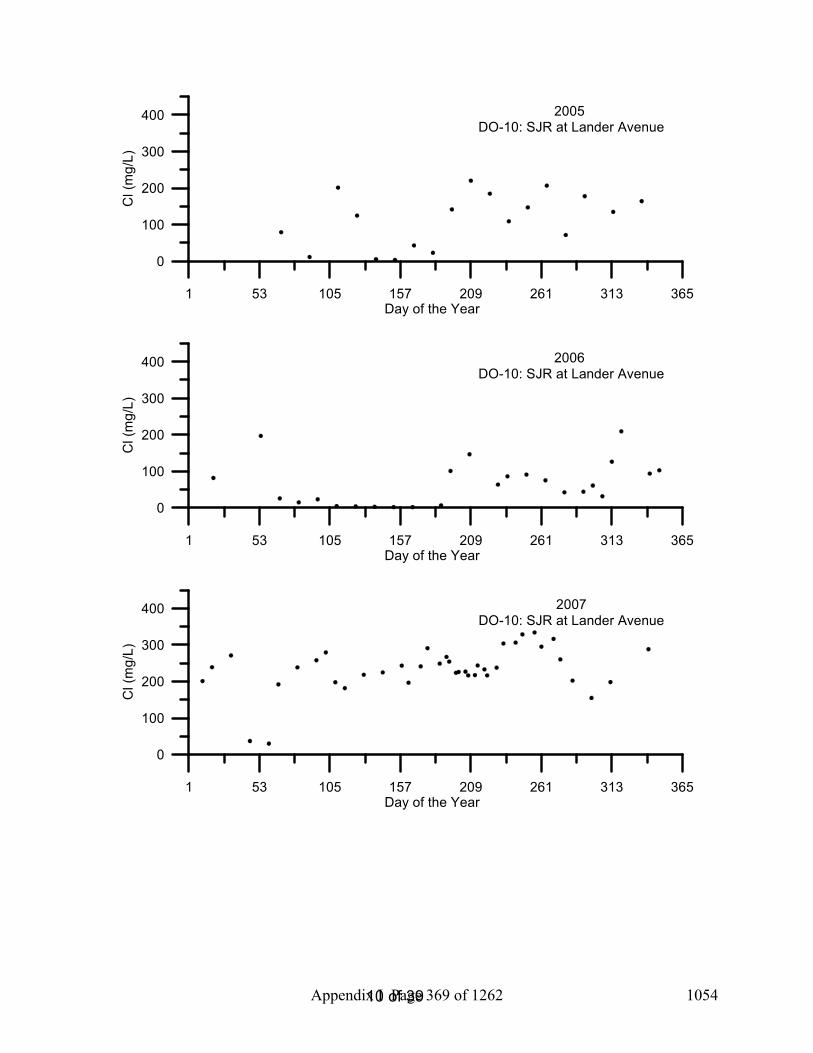
10 of 39
1 53 105 157 209 261 313 365Day of the Year
0
100
200
300
400C
l (m
g/L)
2005 DO-10: SJR at Lander Avenue
1 53 105 157 209 261 313 365Day of the Year
0
100
200
300
400
Cl (
mg/
L)
2006 DO-10: SJR at Lander Avenue
1 53 105 157 209 261 313 365Day of the Year
0
100
200
300
400
Cl (
mg/
L)
2007DO-10: SJR at Lander Avenue
Appendix I Page 369 of 1262 1054

11 of 39
1 53 105 157 209 261 313 365Day of the Year
0
2
4
6
8
10
Cl (
mg/
L)2005
DO-12: Stanislaus River at Caswell Park
1 53 105 157 209 261 313 365Day of the Year
0
2
4
6
8
10
Cl (
mg/
L)
2006 DO-12: Stanislaus River at Caswell Park
1 53 105 157 209 261 313 365Day of the Year
0
2
4
6
8
10
Cl (
mg/
L)
2007DO-12: Stanislaus River at Caswell Park
Appendix I Page 370 of 1262 1055
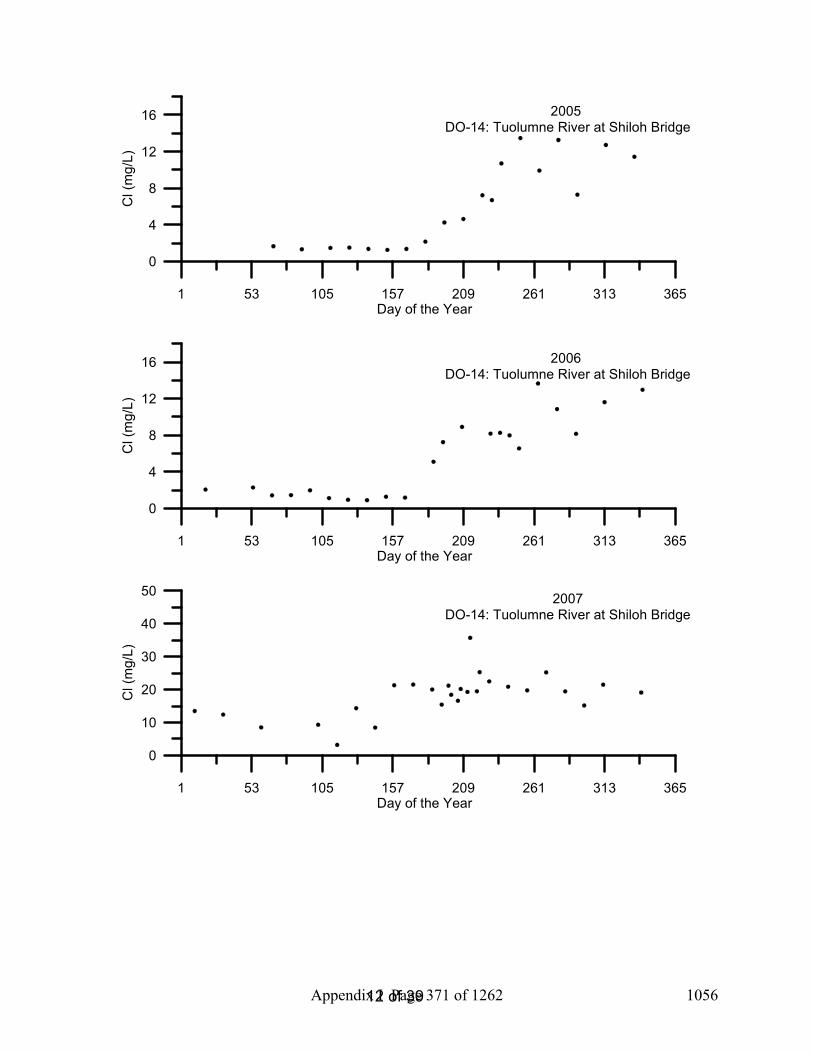
12 of 39
1 53 105 157 209 261 313 365Day of the Year
0
4
8
12
16C
l (m
g/L)
2005 DO-14: Tuolumne River at Shiloh Bridge
1 53 105 157 209 261 313 365Day of the Year
0
4
8
12
16
Cl (
mg/
L)
2006 DO-14: Tuolumne River at Shiloh Bridge
1 53 105 157 209 261 313 365Day of the Year
0
10
20
30
40
50
Cl (
mg/
L)
2007DO-14: Tuolumne River at Shiloh Bridge
Appendix I Page 371 of 1262 1056

13 of 39
1 53 105 157 209 261 313 365Day of the Year
0
10
20
30
40
50
Cl (
mg/
L)2005
DO-16: Merced River at River Road
1 53 105 157 209 261 313 365Day of the Year
0
10
20
30
40
50
Cl (
mg/
L)
2006 DO-16: Merced River at River Road
1 53 105 157 209 261 313 365Day of the Year
0
10
20
30
40
50
Cl (
mg/
L)
2007DO-16: Merced River at River Road
Appendix I Page 372 of 1262 1057
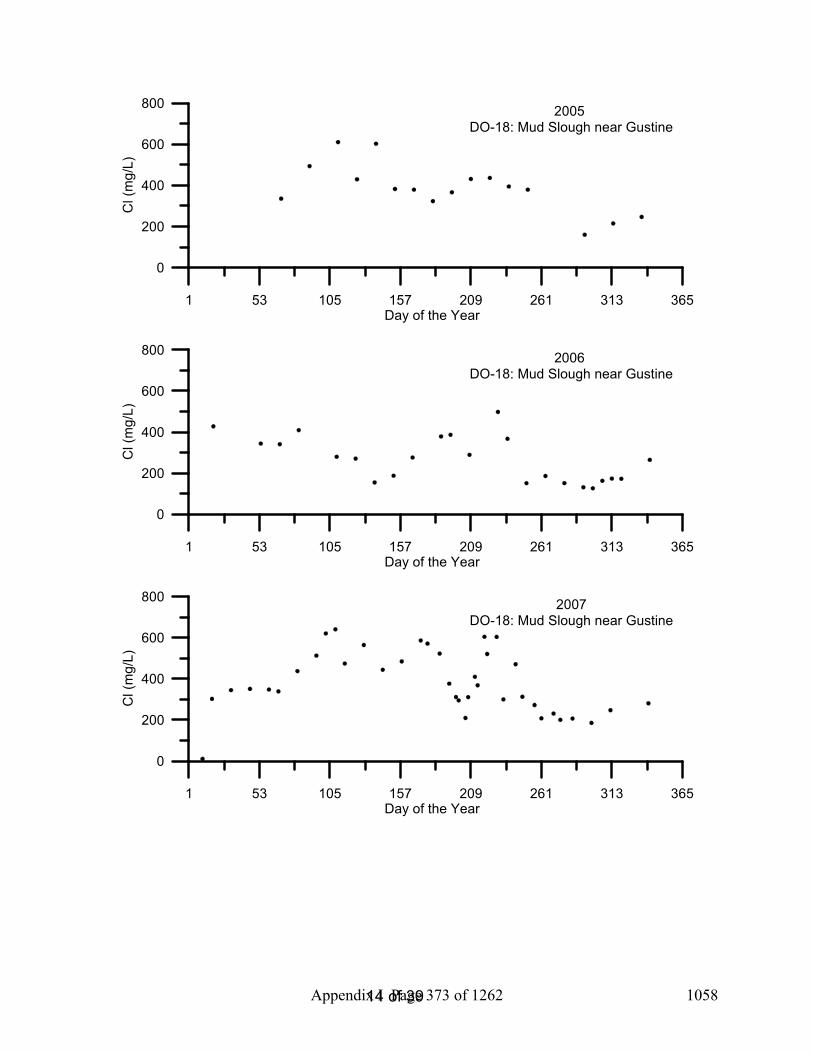
14 of 39
1 53 105 157 209 261 313 365Day of the Year
0
200
400
600
800
Cl (
mg/
L)2005
DO-18: Mud Slough near Gustine
1 53 105 157 209 261 313 365Day of the Year
0
200
400
600
800
Cl (
mg/
L)
2006 DO-18: Mud Slough near Gustine
1 53 105 157 209 261 313 365Day of the Year
0
200
400
600
800
Cl (
mg/
L)
2007DO-18: Mud Slough near Gustine
Appendix I Page 373 of 1262 1058
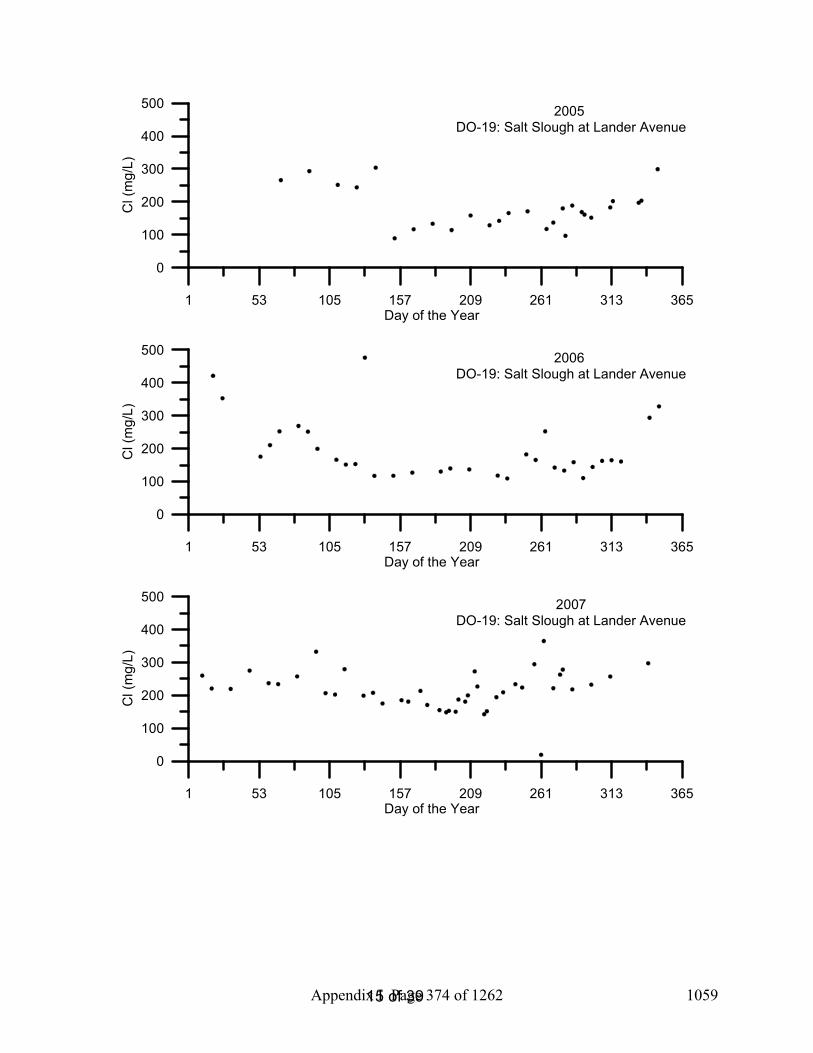
15 of 39
1 53 105 157 209 261 313 365Day of the Year
0
100
200
300
400
500
Cl (
mg/
L)2005
DO-19: Salt Slough at Lander Avenue
1 53 105 157 209 261 313 365Day of the Year
0
100
200
300
400
500
Cl (
mg/
L)
2006 DO-19: Salt Slough at Lander Avenue
1 53 105 157 209 261 313 365Day of the Year
0
100
200
300
400
500
Cl (
mg/
L)
2007DO-19: Salt Slough at Lander Avenue
Appendix I Page 374 of 1262 1059

16 of 39
1 53 105 157 209 261 313 365Day of the Year
0
100
200
300
400
500
Cl (
mg/
L)2005
DO-20: Los Banos Creek at Highway 140
1 53 105 157 209 261 313 365Day of the Year
0
100
200
300
400
500
Cl (
mg/
L)
2006 DO-20: Los Banos Creek at Highway 140
1 53 105 157 209 261 313 365Day of the Year
0
100
200
300
400
500
Cl (
mg/
L)
2007DO-20: Los Banos Creek at Highway 140
Appendix I Page 375 of 1262 1060
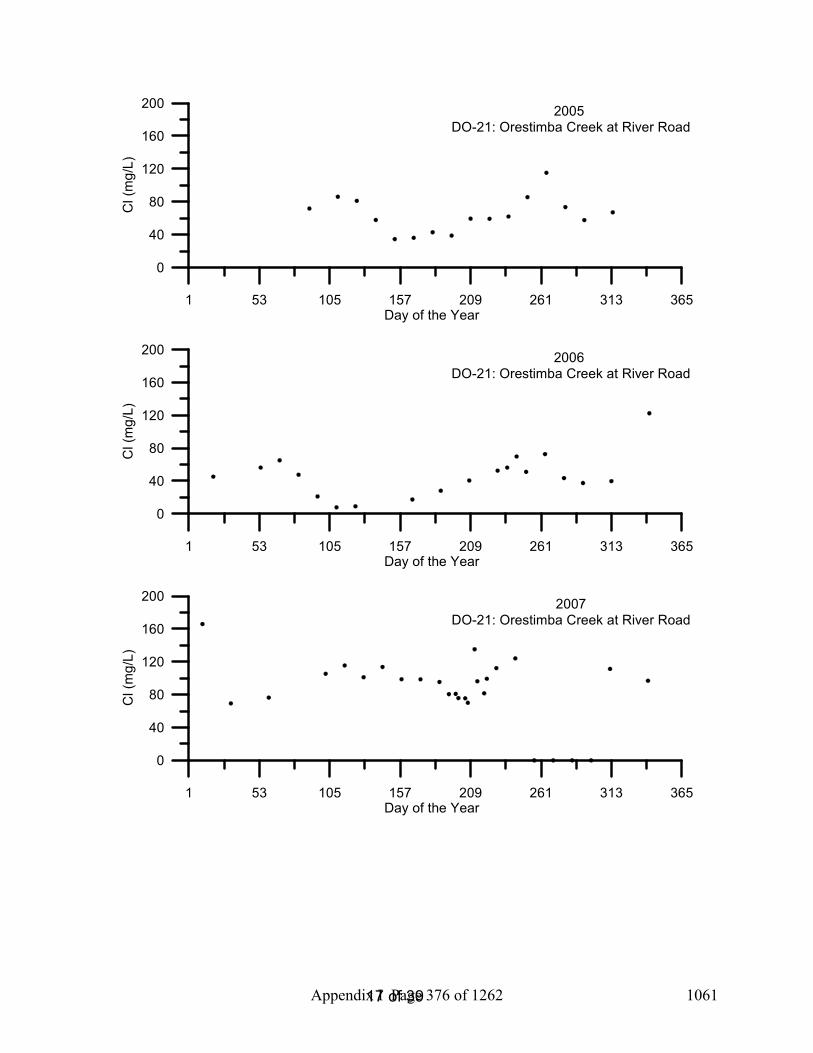
17 of 39
1 53 105 157 209 261 313 365Day of the Year
0
40
80
120
160
200
Cl (
mg/
L)2005
DO-21: Orestimba Creek at River Road
1 53 105 157 209 261 313 365Day of the Year
0
40
80
120
160
200
Cl (
mg/
L)
2006 DO-21: Orestimba Creek at River Road
1 53 105 157 209 261 313 365Day of the Year
0
40
80
120
160
200
Cl (
mg/
L)
2007DO-21: Orestimba Creek at River Road
Appendix I Page 376 of 1262 1061
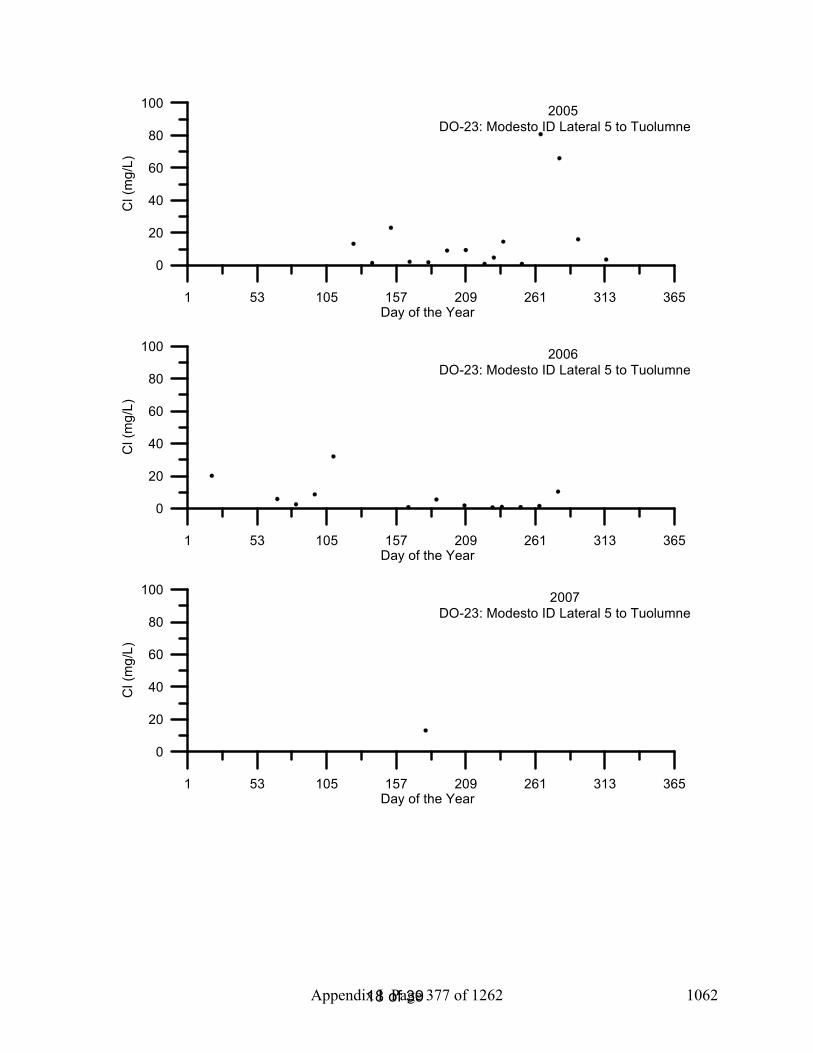
18 of 39
1 53 105 157 209 261 313 365Day of the Year
0
20
40
60
80
100
Cl (
mg/
L)2005
DO-23: Modesto ID Lateral 5 to Tuolumne
1 53 105 157 209 261 313 365Day of the Year
0
20
40
60
80
100
Cl (
mg/
L)
2006 DO-23: Modesto ID Lateral 5 to Tuolumne
1 53 105 157 209 261 313 365Day of the Year
0
20
40
60
80
100
Cl (
mg/
L)
2007DO-23: Modesto ID Lateral 5 to Tuolumne
Appendix I Page 377 of 1262 1062
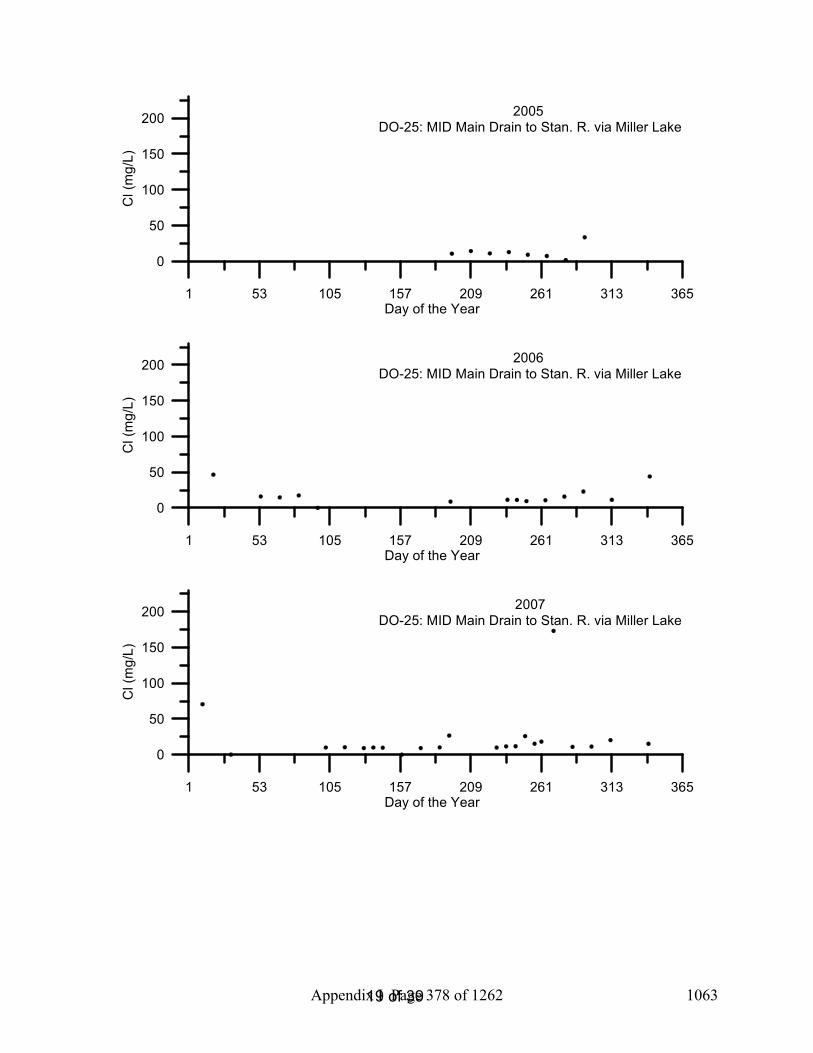
19 of 39
1 53 105 157 209 261 313 365Day of the Year
0
50
100
150
200C
l (m
g/L)
2005 DO-25: MID Main Drain to Stan. R. via Miller Lake
1 53 105 157 209 261 313 365Day of the Year
0
50
100
150
200
Cl (
mg/
L)
2006 DO-25: MID Main Drain to Stan. R. via Miller Lake
1 53 105 157 209 261 313 365Day of the Year
0
50
100
150
200
Cl (
mg/
L)
2007DO-25: MID Main Drain to Stan. R. via Miller Lake
Appendix I Page 378 of 1262 1063

20 of 39
1 53 105 157 209 261 313 365Day of the Year
0
40
80
120
160C
l (m
g/L)
2005 DO-28: Turlock ID Westport Drain Flow Station
1 53 105 157 209 261 313 365Day of the Year
0
40
80
120
160
Cl (
mg/
L)
2006 DO-28: Turlock ID Westport Drain Flow Station
1 53 105 157 209 261 313 365Day of the Year
0
40
80
120
160
Cl (
mg/
L)
2007DO-28: Turlock ID Westport Drain Flow Station
Appendix I Page 379 of 1262 1064
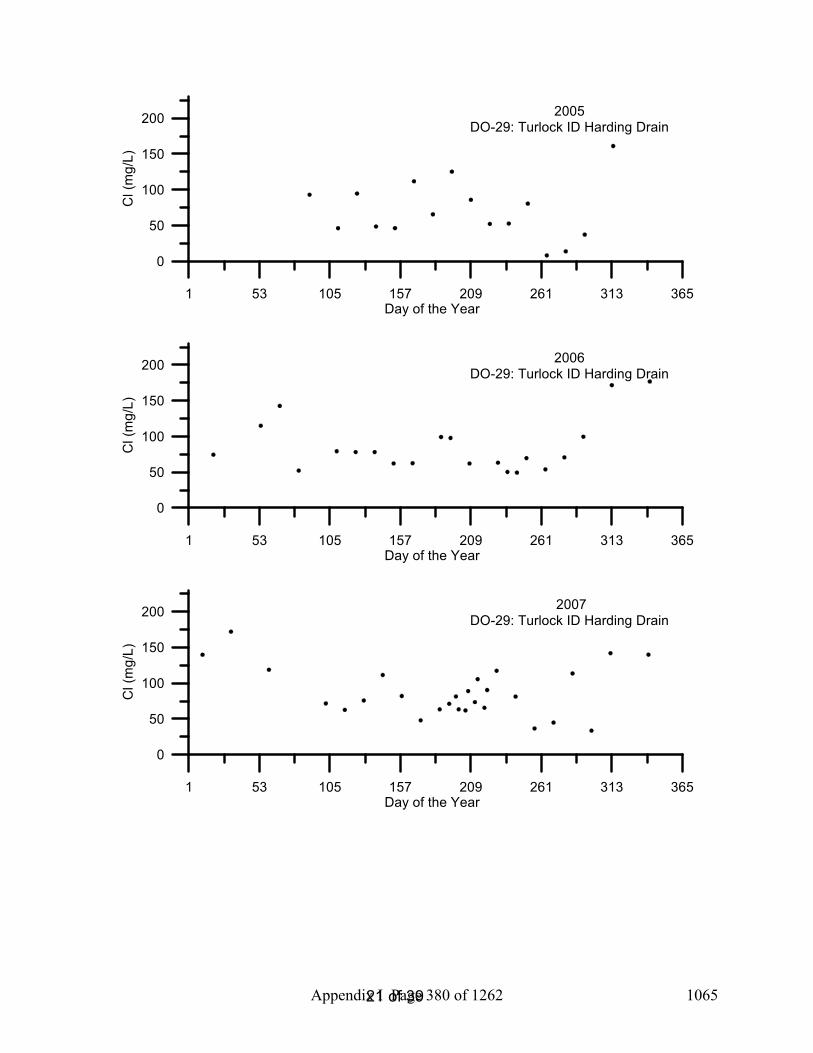
21 of 39
1 53 105 157 209 261 313 365Day of the Year
0
50
100
150
200C
l (m
g/L)
2005 DO-29: Turlock ID Harding Drain
1 53 105 157 209 261 313 365Day of the Year
0
50
100
150
200
Cl (
mg/
L)
2006 DO-29: Turlock ID Harding Drain
1 53 105 157 209 261 313 365Day of the Year
0
50
100
150
200
Cl (
mg/
L)
2007DO-29: Turlock ID Harding Drain
Appendix I Page 380 of 1262 1065
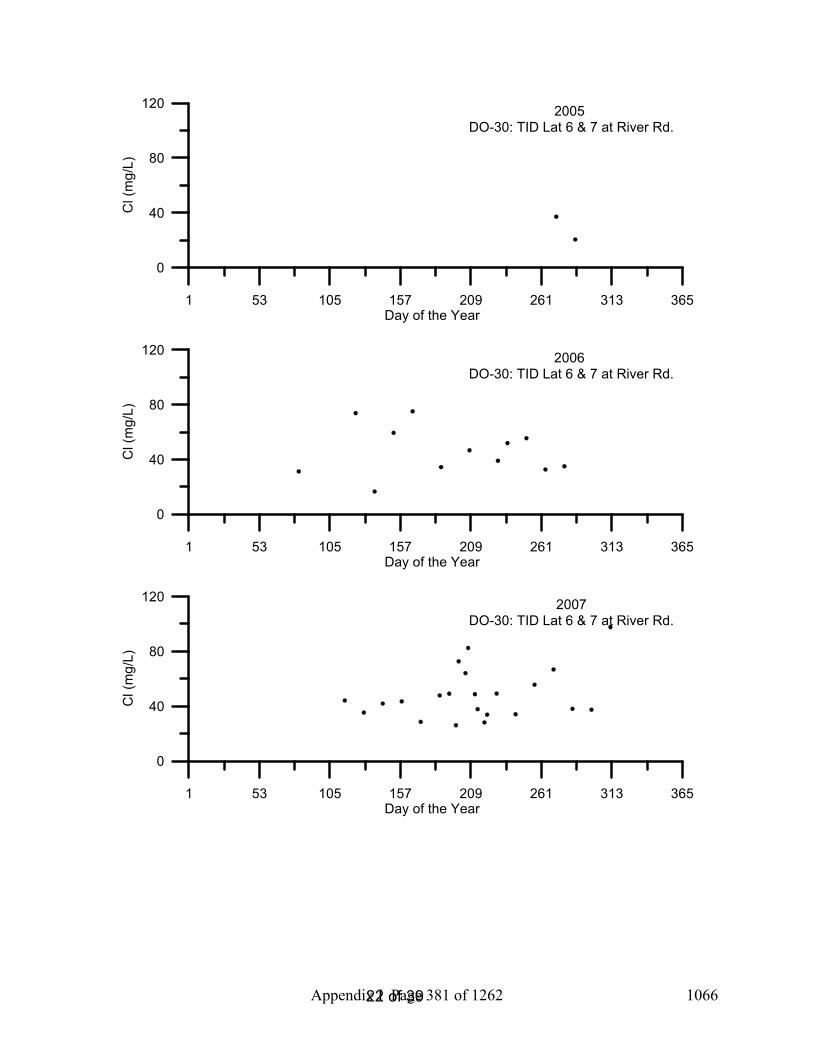
22 of 39
1 53 105 157 209 261 313 365Day of the Year
0
40
80
120
Cl (
mg/
L)2005
DO-30: TID Lat 6 & 7 at River Rd.
1 53 105 157 209 261 313 365Day of the Year
0
40
80
120
Cl (
mg/
L)
2006 DO-30: TID Lat 6 & 7 at River Rd.
1 53 105 157 209 261 313 365Day of the Year
0
40
80
120
Cl (
mg/
L)
2007DO-30: TID Lat 6 & 7 at River Rd.
Appendix I Page 381 of 1262 1066

23 of 39
1 53 105 157 209 261 313 365Day of the Year
0
40
80
120
160
Cl (
mg/
L)2005
DO-33: Hospital Creek
1 53 105 157 209 261 313 365Day of the Year
0
40
80
120
160
Cl (
mg/
L)
2006 DO-33: Hospital Creek
1 53 105 157 209 261 313 365Day of the Year
0
40
80
120
160
Cl (
mg/
L)
2007DO-33: Hospital Creek
Appendix I Page 382 of 1262 1067

24 of 39
1 53 105 157 209 261 313 365Day of the Year
0
100
200
300
400
Cl (
mg/
L)2005
DO-34: Ingram Creek Flow Station
1 53 105 157 209 261 313 365Day of the Year
0
100
200
300
400
Cl (
mg/
L)
2006 DO-34: Ingram Creek Flow Station
1 53 105 157 209 261 313 365Day of the Year
0
100
200
300
400
Cl (
mg/
L)
2007DO-34: Ingram Creek Flow Station
Appendix I Page 383 of 1262 1068

25 of 39
1 53 105 157 209 261 313 365Day of the Year
0
50
100
150
200
250
Cl (
mg/
L)2005
DO-36: Del Puerto Creek Flow Station
1 53 105 157 209 261 313 365Day of the Year
0
50
100
150
200
250
Cl (
mg/
L)
2006 DO-36: Del Puerto Creek Flow Station
1 53 105 157 209 261 313 365Day of the Year
0
50
100
150
200
250
Cl (
mg/
L)
2007DO-36: Del Puerto Creek Flow Station
Appendix I Page 384 of 1262 1069
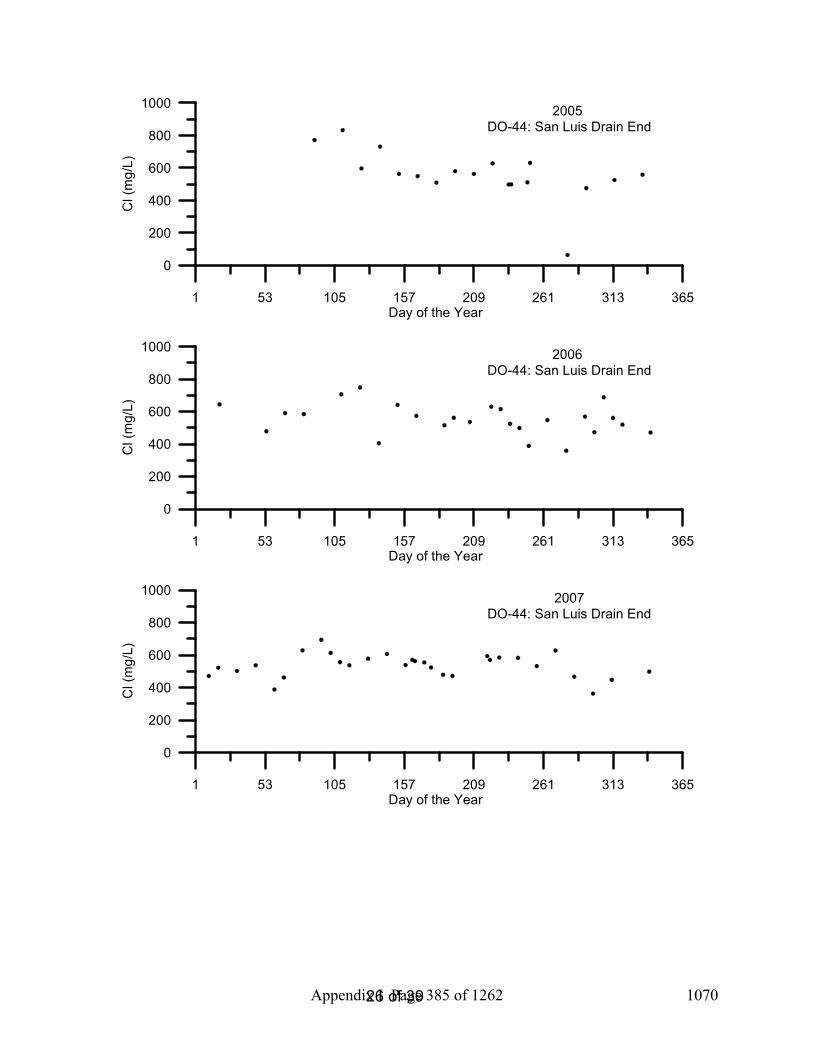
26 of 39
1 53 105 157 209 261 313 365Day of the Year
0
200
400
600
800
1000
Cl (
mg/
L)2005
DO-44: San Luis Drain End
1 53 105 157 209 261 313 365Day of the Year
0
200
400
600
800
1000
Cl (
mg/
L)
2006 DO-44: San Luis Drain End
1 53 105 157 209 261 313 365Day of the Year
0
200
400
600
800
1000
Cl (
mg/
L)
2007DO-44: San Luis Drain End
Appendix I Page 385 of 1262 1070

27 of 39
1 53 105 157 209 261 313 365Day of the Year
0
100
200
300
400
Cl (
mg/
L)2005
DO-53: Salt Slough at Wolfsen Road
1 53 105 157 209 261 313 365Day of the Year
0
100
200
300
400
Cl (
mg/
L)
2006 DO-53: Salt Slough at Wolfsen Road
1 53 105 157 209 261 313 365Day of the Year
0
100
200
300
400
Cl (
mg/
L)
2007DO-53: Salt Slough at Wolfsen Road
Appendix I Page 386 of 1262 1071

28 of 39
1 53 105 157 209 261 313 365Day of the Year
0
100
200
300
Cl (
mg/
L)2005
DO-57: Ramona Lake Drain at Levee
1 53 105 157 209 261 313 365Day of the Year
0
100
200
300
Cl (
mg/
L)
2006 DO-57: Ramona Lake Drain at Levee
1 53 105 157 209 261 313 365Day of the Year
0
100
200
300
Cl (
mg/
L)
2007DO-57: Ramona Lake Drain at Levee
Appendix I Page 387 of 1262 1072

29 of 39
1 53 105 157 209 261 313 365Day of the Year
0
200
400
600
800
Cl (
mg/
L)2005
DO-59: SJR Laird Park
1 53 105 157 209 261 313 365Day of the Year
0
200
400
600
800
Cl (
mg/
L)
2006 DO-59: SJR Laird Park
1 53 105 157 209 261 313 365Day of the Year
0
200
400
600
800
Cl (
mg/
L)
2007DO-59: SJR Laird Park
Appendix I Page 388 of 1262 1073

30 of 39
1 53 105 157 209 261 313 365Day of the Year
0
100
200
300
Cl (
mg/
L)2005
DO-60: Moffit 1 South
1 53 105 157 209 261 313 365Day of the Year
0
100
200
300
Cl (
mg/
L)
2006 DO-60: Moffit 1 South
1 53 105 157 209 261 313 365Day of the Year
0
100
200
300
Cl (
mg/
L)
2007DO-60: Moffit 1 South
Appendix I Page 389 of 1262 1074

31 of 39
1 53 105 157 209 261 313 365Day of the Year
0
100
200
300
400
Cl (
mg/
L)2005
DO-61: Deadman's Slough
1 53 105 157 209 261 313 365Day of the Year
0
100
200
300
400
Cl (
mg/
L)
2006 DO-61: Deadman's Slough
1 53 105 157 209 261 313 365Day of the Year
0
100
200
300
400
Cl (
mg/
L)
2007DO-61: Deadman's Slough
Appendix I Page 390 of 1262 1075

32 of 39
1 53 105 157 209 261 313 365Day of the Year
0
200
400
600
800
Cl (
mg/
L)2005
DO-62: Mallard Slough
1 53 105 157 209 261 313 365Day of the Year
0
200
400
600
800
Cl (
mg/
L)
2006DO-62: Mallard Slough
1 53 105 157 209 261 313 365Day of the Year
0
200
400
600
800
Cl (
mg/
L)
2007DO-62: Mallard Slough
Appendix I Page 391 of 1262 1076

33 of 39
1 53 105 157 209 261 313 365Day of the Year
0
50
100
150
200
250
Cl (
mg/
L)2005
DO-63: Inlet C Canal
1 53 105 157 209 261 313 365Day of the Year
0
50
100
150
200
250
Cl (
mg/
L)
2006DO-63: Inlet C Canal
1 53 105 157 209 261 313 365Day of the Year
0
50
100
150
200
250
Cl (
mg/
L)
2007DO-63: Inlet C Canal
Appendix I Page 392 of 1262 1077

34 of 39
1 53 105 157 209 261 313 365Day of the Year
0
40
80
120
160
200
Cl (
mg/
L)2005
DO-80: South Marsh 1 Inlet
1 53 105 157 209 261 313 365Day of the Year
0
40
80
120
160
200
Cl (
mg/
L)
2006DO-80: South Marsh 1 Inlet
1 53 105 157 209 261 313 365Day of the Year
0
40
80
120
160
200
Cl (
mg/
L)
2007DO-80: South Marsh 1 Inlet
Appendix I Page 393 of 1262 1078

35 of 39
1 53 105 157 209 261 313 365Day of the Year
0
50
100
150
200C
l (m
g/L)
2005 DO-81: South Marsh 1 Outlet
1 53 105 157 209 261 313 365Day of the Year
0
50
100
150
200
Cl (
mg/
L)
2006DO-81: South Marsh 1 Outlet
1 53 105 157 209 261 313 365Day of the Year
0
50
100
150
200
Cl (
mg/
L)
2007DO-81: South Marsh 1 Outlet
Appendix I Page 394 of 1262 1079
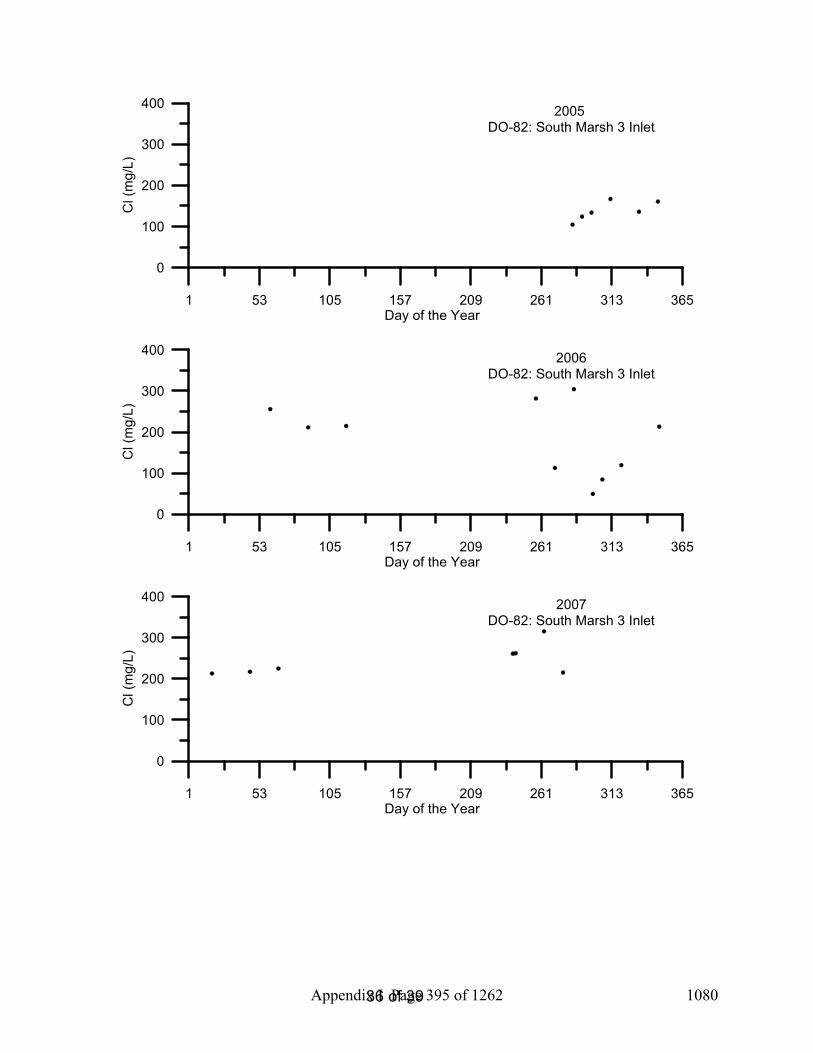
36 of 39
1 53 105 157 209 261 313 365Day of the Year
0
100
200
300
400
Cl (
mg/
L)2005
DO-82: South Marsh 3 Inlet
1 53 105 157 209 261 313 365Day of the Year
0
100
200
300
400
Cl (
mg/
L)
2006DO-82: South Marsh 3 Inlet
1 53 105 157 209 261 313 365Day of the Year
0
100
200
300
400
Cl (
mg/
L)
2007DO-82: South Marsh 3 Inlet
Appendix I Page 395 of 1262 1080

37 of 39
1 53 105 157 209 261 313 365Day of the Year
0
100
200
300
400
500
Cl (
mg/
L)2005
DO-83: South Marsh 3 Outlet
1 53 105 157 209 261 313 365Day of the Year
0
100
200
300
400
500
Cl (
mg/
L)
2006DO-83: South Marsh 3 Outlet
1 53 105 157 209 261 313 365Day of the Year
0
100
200
300
400
500
Cl (
mg/
L)
2007DO-83: South Marsh 3 Outlet
Appendix I Page 396 of 1262 1081
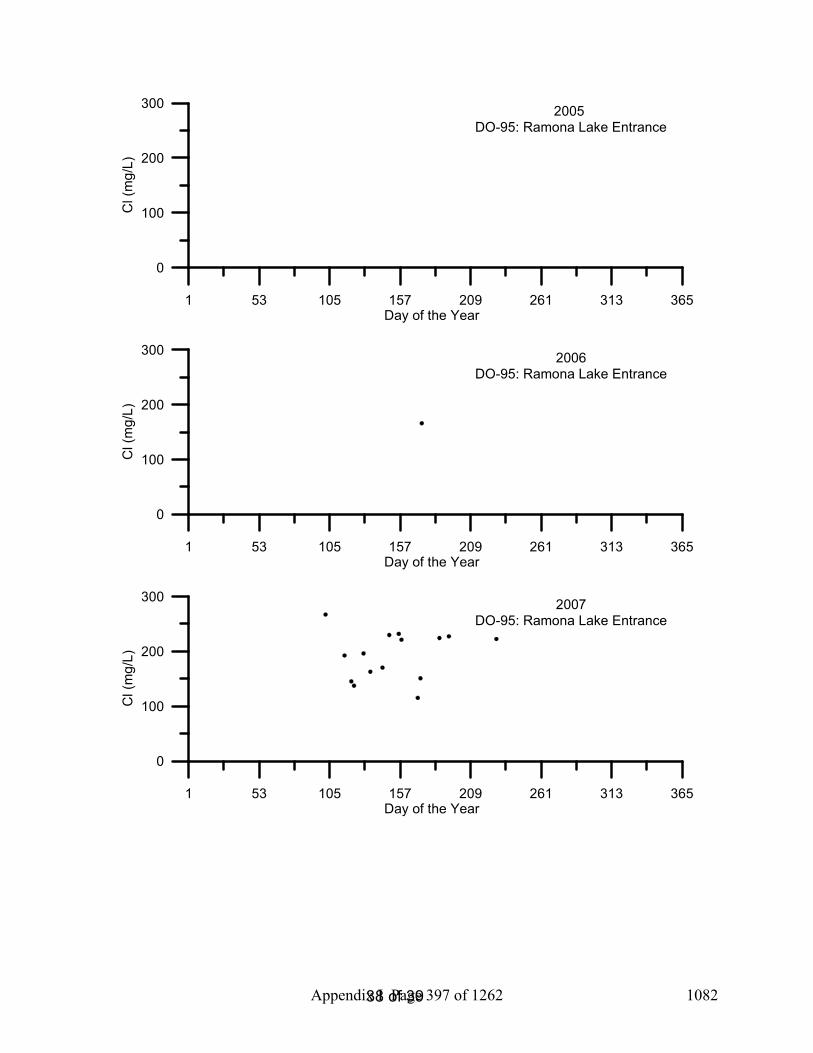
38 of 39
1 53 105 157 209 261 313 365Day of the Year
0
100
200
300
Cl (
mg/
L)2005
DO-95: Ramona Lake Entrance
1 53 105 157 209 261 313 365Day of the Year
0
100
200
300
Cl (
mg/
L)
2006DO-95: Ramona Lake Entrance
1 53 105 157 209 261 313 365Day of the Year
0
100
200
300
Cl (
mg/
L)
2007DO-95: Ramona Lake Entrance
Appendix I Page 397 of 1262 1082

Temporal Plots of 2005-2007 Calcium Data from the Upstream San Joaquin River
Chelsea Spier1
Remie Burks1
Sharon Borglin1
Randy Dahlgren2
Jeremy Hanlon1
Justin Graham1
William Stringfellow1
February 2008
1Environmental Engineering Research Program School of Engineering & Computer Sciences
University of the Pacific 3601 Pacific Avenue, Sears Hall
Stockton, CA 95211 2UC Davis, Davis, CA
Appendix I Page 398 of 1262 1083
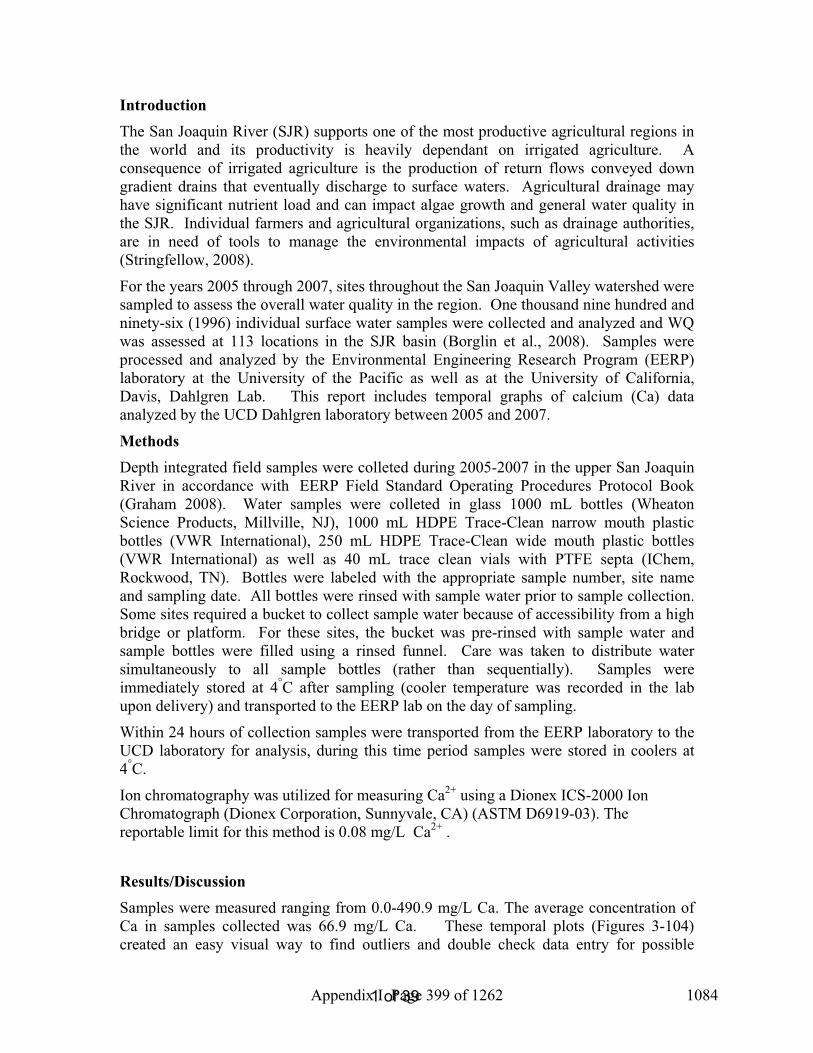
1 of 39
Introduction The San Joaquin River (SJR) supports one of the most productive agricultural regions in the world and its productivity is heavily dependant on irrigated agriculture. A consequence of irrigated agriculture is the production of return flows conveyed down gradient drains that eventually discharge to surface waters. Agricultural drainage may have significant nutrient load and can impact algae growth and general water quality in the SJR. Individual farmers and agricultural organizations, such as drainage authorities, are in need of tools to manage the environmental impacts of agricultural activities (Stringfellow, 2008).
For the years 2005 through 2007, sites throughout the San Joaquin Valley watershed were sampled to assess the overall water quality in the region. One thousand nine hundred and ninety-six (1996) individual surface water samples were collected and analyzed and WQ was assessed at 113 locations in the SJR basin (Borglin et al., 2008). Samples were processed and analyzed by the Environmental Engineering Research Program (EERP) laboratory at the University of the Pacific as well as at the University of California, Davis, Dahlgren Lab. This report includes temporal graphs of calcium (Ca) data analyzed by the UCD Dahlgren laboratory between 2005 and 2007.
MethodsDepth integrated field samples were colleted during 2005-2007 in the upper San Joaquin River in accordance with EERP Field Standard Operating Procedures Protocol Book (Graham 2008). Water samples were colleted in glass 1000 mL bottles (Wheaton Science Products, Millville, NJ), 1000 mL HDPE Trace-Clean narrow mouth plastic bottles (VWR International), 250 mL HDPE Trace-Clean wide mouth plastic bottles (VWR International) as well as 40 mL trace clean vials with PTFE septa (IChem, Rockwood, TN). Bottles were labeled with the appropriate sample number, site name and sampling date. All bottles were rinsed with sample water prior to sample collection. Some sites required a bucket to collect sample water because of accessibility from a high bridge or platform. For these sites, the bucket was pre-rinsed with sample water and sample bottles were filled using a rinsed funnel. Care was taken to distribute water simultaneously to all sample bottles (rather than sequentially). Samples were immediately stored at 4°C after sampling (cooler temperature was recorded in the lab upon delivery) and transported to the EERP lab on the day of sampling.
Within 24 hours of collection samples were transported from the EERP laboratory to the UCD laboratory for analysis, during this time period samples were stored in coolers at 4°C.
Ion chromatography was utilized for measuring Ca2+ using a Dionex ICS-2000 Ion Chromatograph (Dionex Corporation, Sunnyvale, CA) (ASTM D6919-03). The reportable limit for this method is 0.08 mg/L Ca2+ .
Results/DiscussionSamples were measured ranging from 0.0-490.9 mg/L Ca. The average concentration of Ca in samples collected was 66.9 mg/L Ca. These temporal plots (Figures 3-104) created an easy visual way to find outliers and double check data entry for possible
Appendix I Page 399 of 1262 1084

2 of 39
mistakes.
References American Public Health Association (APHA). 2005. Standard Methods for the Examination of
Water and Wastewater, 21st Edition. American Public Health Association, Washington, DC.
Borglin, S., W. Stringfellow, J. Hanlon. 2005. Standard Operating Procedures for the Up-Stream Dissolved Oxygen TMDL Project. LBNL/Pub-937.
Borglin, S., Burks, R., Hanlon, J., Graham, J., Spier, C., Stringfellow, W., and Dahlgren, R., (2008) Methods overview, quality assurance, and quality control, University of the Pacific, Stockton, CA
Borglin, S.E., Burks, R.D., Hanlon, J.S., Stringfellow, W.T. (2008) EERP Lab Protocol Book, University of the Pacific, Stockton, CA.
Graham, J., Hanlon, J.S., Stringfellow, W.T., (2008) EERP Field Protocol Book, University of the Pacific, Stockton, CA.
Stringfellow, W.T., et al., (2008) Evaluation of Vegitated Ditches, Ponds, and Wetlands as BMPs for Mitigating the Water Quality Impact of Irrigated Agriculture in the San Joaquin Valley, University of the Pacific, Stockton, CA
YSI Environmental Operations Manual (2005) 6-Series Environmental Monitoring Systems, Yellow Springs, OH.
Appendix I Page 400 of 1262 1085

3 of 39
Table 1: EERP Sampling Site List DO Number
Site Name Type
4 SJR at Mossdale Core sites 5 SJR at Vernalis-McCune Station (River Club) Core sites, BMP 6 SJR at Maze Core sites, BMP 7 SJR at Patterson Core sites, BMP 8 SJR at Crows Landing Core sites, BMP
10 SJR at Lander Avenue Core sites 12 Stanislaus River at Caswell Park Core sites 14 Tuolumne River at Shiloh Bridge Core sites 16 Merced River at River Road Core sites 18 Mud Slough near Gustine Core sites, Wetland 19 Salt Slough at Lander Avenue Core sites, Wetland 20 Los Banos Creek Flow Station Core sites, Wetland 21 Orestimba Creek at River Road Core sites, BMP 23 Modesto ID Lateral 5 to Tuolumne Core sites 25 Modesto ID Main Drain to Stan. R. via Miller Lake Core sites 28 Turlock ID Westport Drain Flow station Core sites 29 Turlock ID Harding Drain Core sites 30 Turlock ID Lateral 6 & 7 at Levee Core sites 33 Hospital Creek Intermittent, BMP 34 Ingram Creek Core sites, BMP 36 Del Puerto Creek Flow Station Core sites, BMP 44 San Luis Drain End Core sites 53 Salt Slough at Wolfsen Road Wetland 57 Ramona Lake Drain Core sites, BMP 59 SJR Laird Park Core sites 60 Moffit 1 South Wetland 61 Deadman's Slough Wetland 62 Mallard Slough Wetland 63 Inlet C Canal Wetland 80 South Marsh-1-Inlet Wetland 81 South Marsh-1-Outlet Wetland 82 South Marsh-3-Inlet Wetland 83 South Marsh-3-Outlet Wetland 95 Ramona drain at Ramona Lake BMP, Intermittent
Appendix I Page 401 of 1262 1086

4 of 39
Figure 1: EERP Sampling Site Map of SJR Watershed and Tributaries
Appendix I Page 402 of 1262 1087

5 of 39
Figures 2 -103: Temporal Plots of Ca By Site ID
1 53 105 157 209 261 313 365Day of the Year
0
40
80
120C
a (m
g/L)
2005 DO-04: SJR at Mossdale
1 53 105 157 209 261 313 365Day of the Year
0
40
80
120
Ca
(mg/
L)
2006 DO-04: SJR at Mossdale
1 53 105 157 209 261 313 365Day of the Year
0
40
80
120
Ca
(mg/
L)
2007 DO-04: SJR at Mossdale
Appendix I Page 403 of 1262 1088

6 of 39
1 53 105 157 209 261 313 365Day of the Year
0
20
40
60
80
Ca
(mg/
L)2005
DO-05: SJR at Vernalis-McCune Station
1 53 105 157 209 261 313 365Day of the Year
0
20
40
60
80
Ca
(mg/
L)
2006 DO-05: SJR at Vernalis-McCune Station
1 53 105 157 209 261 313 365Day of the Year
0
20
40
60
80
Ca
(mg/
L)
2007 DO-05: SJR at Vernalis-McCune Station
Appendix I Page 404 of 1262 1089

7 of 39
1 53 105 157 209 261 313 365Day of the Year
0
20
40
60
80
Ca
(mg/
L)2005
DO-06: SJR at Maze
1 53 105 157 209 261 313 365Day of the Year
0
20
40
60
80
Ca
(mg/
L)
2006 DO-06: SJR at Maze
1 53 105 157 209 261 313 365Day of the Year
0
20
40
60
80
Ca
(mg/
L)
2007 DO-06: SJR at Maze
Appendix I Page 405 of 1262 1090

8 of 39
1 53 105 157 209 261 313 365Day of the Year
0
40
80
120
Ca
(mg/
L)2005
DO-07: SJR at Patterson
1 53 105 157 209 261 313 365Day of the Year
0
40
80
120
Ca
(mg/
L)
2006 DO-07: SJR at Patterson
1 53 105 157 209 261 313 365Day of the Year
0
40
80
120
Ca
(mg/
L)
2007 DO-07: SJR at Patterson
Appendix I Page 406 of 1262 1091

9 of 39
1 53 105 157 209 261 313 365Day of the Year
0
20
40
60
80
100
Ca
(mg/
L)2005
DO-08: SJR at Crows Landing
1 53 105 157 209 261 313 365Day of the Year
0
20
40
60
80
100
Ca
(mg/
L)
2006 DO-08: SJR at Crows Landing
1 53 105 157 209 261 313 365Day of the Year
0
20
40
60
80
100
Ca
(mg/
L)
2007DO-08: SJR at Crows Landing
Appendix I Page 407 of 1262 1092

10 of 39
1 53 105 157 209 261 313 365Day of the Year
0
40
80
120
Ca
(mg/
L)2005
DO-10: SJR at Lander Avenue
1 53 105 157 209 261 313 365Day of the Year
0
40
80
120
Ca
(mg/
L)
2006 DO-10: SJR at Lander Avenue
1 53 105 157 209 261 313 365Day of the Year
0
40
80
120
Ca
(mg/
L)
2007DO-10: SJR at Lander Avenue
Appendix I Page 408 of 1262 1093
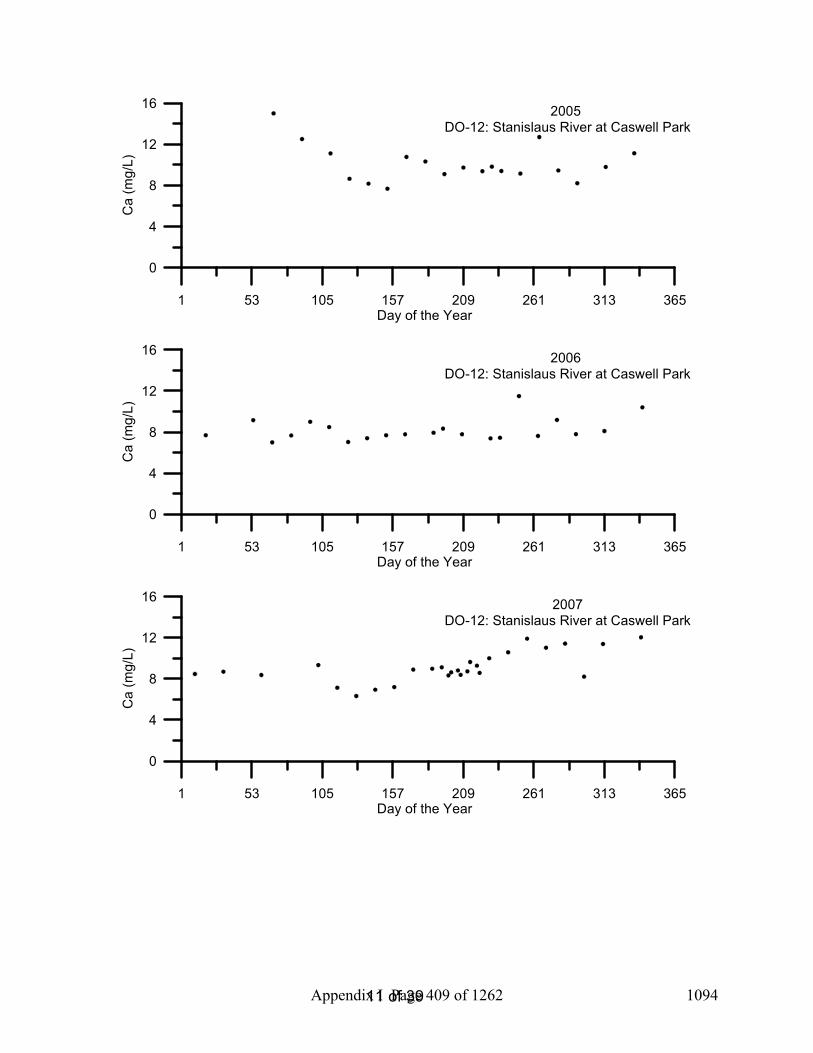
11 of 39
1 53 105 157 209 261 313 365Day of the Year
0
4
8
12
16
Ca
(mg/
L)2005
DO-12: Stanislaus River at Caswell Park
1 53 105 157 209 261 313 365Day of the Year
0
4
8
12
16
Ca
(mg/
L)
2006 DO-12: Stanislaus River at Caswell Park
1 53 105 157 209 261 313 365Day of the Year
0
4
8
12
16
Ca
(mg/
L)
2007DO-12: Stanislaus River at Caswell Park
Appendix I Page 409 of 1262 1094

12 of 39
1 53 105 157 209 261 313 365Day of the Year
0
10
20
30
Ca
(mg/
L)2005
DO-14: Tuolumne River at Shiloh Bridge
1 53 105 157 209 261 313 365Day of the Year
0
10
20
30
Ca
(mg/
L)
2006 DO-14: Tuolumne River at Shiloh Bridge
1 53 105 157 209 261 313 365Day of the Year
0
10
20
30
Ca
(mg/
L)
2007DO-14: Tuolumne River at Shiloh Bridge
Appendix I Page 410 of 1262 1095

13 of 39
1 53 105 157 209 261 313 365Day of the Year
0
10
20
30
40
50
Ca
(mg/
L)2005
DO-16: Merced River at River Road
1 53 105 157 209 261 313 365Day of the Year
0
10
20
30
40
50
Ca
(mg/
L)
2006 DO-16: Merced River at River Road
1 53 105 157 209 261 313 365Day of the Year
0
10
20
30
40
50
Ca
(mg/
L)
2007DO-16: Merced River at River Road
Appendix I Page 411 of 1262 1096

14 of 39
1 53 105 157 209 261 313 365Day of the Year
0
100
200
300C
a (m
g/L)
2005 DO-18: Mud Slough near Gustine
1 53 105 157 209 261 313 365Day of the Year
0
100
200
300
Ca
(mg/
L)
2006 DO-18: Mud Slough near Gustine
1 53 105 157 209 261 313 365Day of the Year
0
100
200
300
Ca
(mg/
L)
2007DO-18: Mud Slough near Gustine
Appendix I Page 412 of 1262 1097
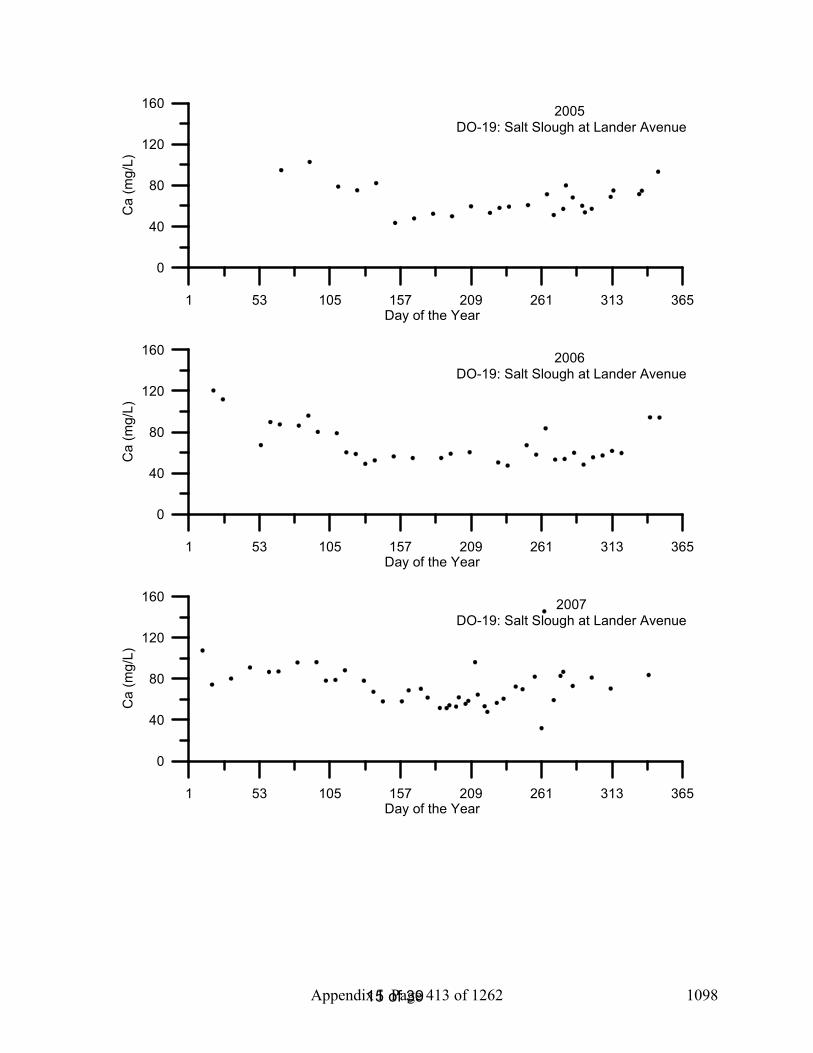
15 of 39
1 53 105 157 209 261 313 365Day of the Year
0
40
80
120
160
Ca
(mg/
L)2005
DO-19: Salt Slough at Lander Avenue
1 53 105 157 209 261 313 365Day of the Year
0
40
80
120
160
Ca
(mg/
L)
2006 DO-19: Salt Slough at Lander Avenue
1 53 105 157 209 261 313 365Day of the Year
0
40
80
120
160
Ca
(mg/
L)
2007DO-19: Salt Slough at Lander Avenue
Appendix I Page 413 of 1262 1098

16 of 39
1 53 105 157 209 261 313 365Day of the Year
0
40
80
120
160
Ca
(mg/
L)2005
DO-20: Los Banos Creek at Highway 140
1 53 105 157 209 261 313 365Day of the Year
0
40
80
120
160
Ca
(mg/
L)
2006 DO-20: Los Banos Creek at Highway 140
1 53 105 157 209 261 313 365Day of the Year
0
40
80
120
160
Ca
(mg/
L)
2007DO-20: Los Banos Creek at Highway 140
Appendix I Page 414 of 1262 1099

17 of 39
1 53 105 157 209 261 313 365Day of the Year
0
40
80
120
Ca
(mg/
L)2005
DO-21: Orestimba Creek at River Road
1 53 105 157 209 261 313 365Day of the Year
0
40
80
120
Ca
(mg/
L)
2006 DO-21: Orestimba Creek at River Road
1 53 105 157 209 261 313 365Day of the Year
0
40
80
120
Ca
(mg/
L)
2007DO-21: Orestimba Creek at River Road
Appendix I Page 415 of 1262 1100

18 of 39
1 53 105 157 209 261 313 365Day of the Year
0
10
20
30
40
50
Ca
(mg/
L)2005
DO-23: Modesto ID Lateral 5 to Tuolumne
1 53 105 157 209 261 313 365Day of the Year
0
10
20
30
40
50
Ca
(mg/
L)
2006 DO-23: Modesto ID Lateral 5 to Tuolumne
1 53 105 157 209 261 313 365Day of the Year
0
10
20
30
40
50
Ca
(mg/
L)
2007DO-23: Modesto ID Lateral 5 to Tuolumne
Appendix I Page 416 of 1262 1101

19 of 39
1 53 105 157 209 261 313 365Day of the Year
0
20
40
60
80C
a (m
g/L)
2005 DO-25: MID Main Drain to Stan. R. via Miller Lake
1 53 105 157 209 261 313 365Day of the Year
0
20
40
60
80
Ca
(mg/
L)
2006 DO-25: MID Main Drain to Stan. R. via Miller Lake
1 53 105 157 209 261 313 365Day of the Year
0
20
40
60
80
Ca
(mg/
L)
2007DO-25: MID Main Drain to Stan. R. via Miller Lake
Appendix I Page 417 of 1262 1102

20 of 39
1 53 105 157 209 261 313 365Day of the Year
0
40
80
120C
a (m
g/L)
2005 DO-28: Turlock ID Westport Drain Flow Station
1 53 105 157 209 261 313 365Day of the Year
0
40
80
120
Ca
(mg/
L)
2006 DO-28: Turlock ID Westport Drain Flow Station
1 53 105 157 209 261 313 365Day of the Year
0
40
80
120
Ca
(mg/
L)
2007DO-28: Turlock ID Westport Drain Flow Station
Appendix I Page 418 of 1262 1103

21 of 39
1 53 105 157 209 261 313 365Day of the Year
0
40
80
120
Ca
(mg/
L)2005
DO-29: Turlock ID Harding Drain
1 53 105 157 209 261 313 365Day of the Year
0
40
80
120
Ca
(mg/
L)
2006 DO-29: Turlock ID Harding Drain
1 53 105 157 209 261 313 365Day of the Year
0
40
80
120
Ca
(mg/
L)
2007DO-29: Turlock ID Harding Drain
Appendix I Page 419 of 1262 1104
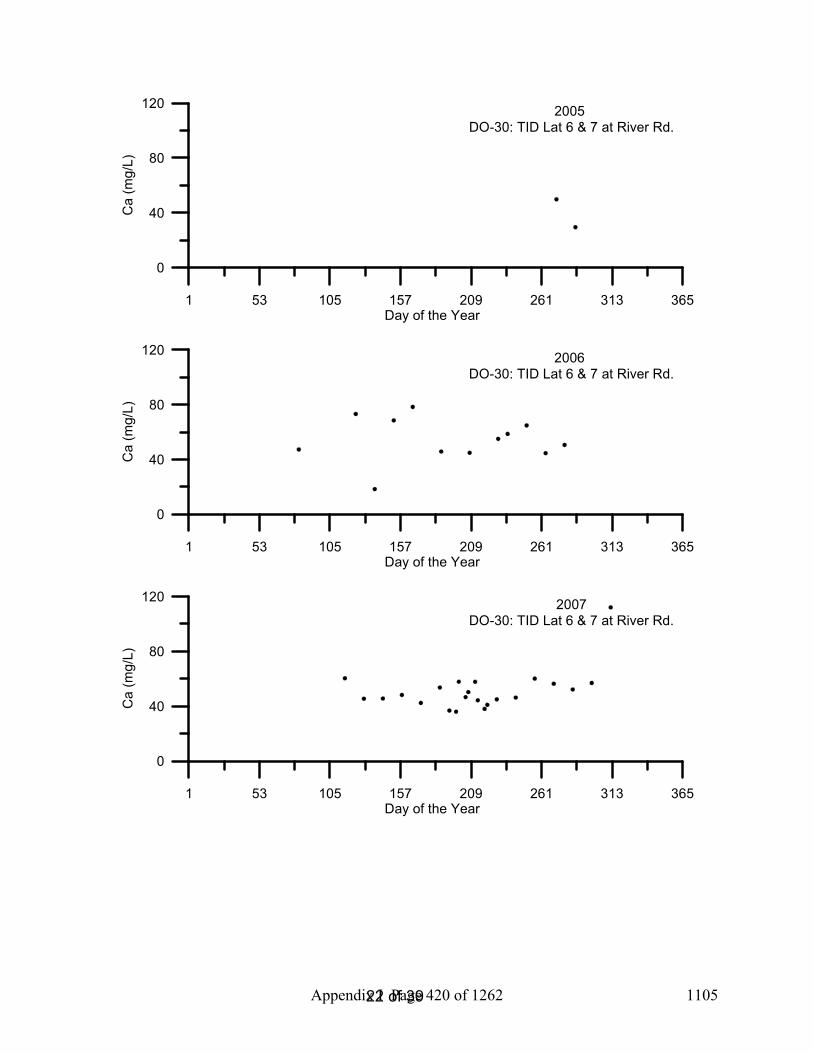
22 of 39
1 53 105 157 209 261 313 365Day of the Year
0
40
80
120
Ca
(mg/
L)2005
DO-30: TID Lat 6 & 7 at River Rd.
1 53 105 157 209 261 313 365Day of the Year
0
40
80
120
Ca
(mg/
L)
2006 DO-30: TID Lat 6 & 7 at River Rd.
1 53 105 157 209 261 313 365Day of the Year
0
40
80
120
Ca
(mg/
L)
2007DO-30: TID Lat 6 & 7 at River Rd.
Appendix I Page 420 of 1262 1105

23 of 39
1 53 105 157 209 261 313 365Day of the Year
0
20
40
60
Ca
(mg/
L)2005
DO-33: Hospital Creek
1 53 105 157 209 261 313 365Day of the Year
0
20
40
60
Ca
(mg/
L)
2006 DO-33: Hospital Creek
1 53 105 157 209 261 313 365Day of the Year
0
20
40
60
Ca
(mg/
L)
2007DO-33: Hospital Creek
Appendix I Page 421 of 1262 1106