appendix g pyrolysis report - university of utahrepository.icse.utah.edu/dspace/bitstream/... ·...
TRANSCRIPT

G-1
APPENDIX G
Detailed Study of Shale Pyrolysis for Oil Production
A Subpart of Project
Oil Shale Pyrolysis and In Situ Modeling
Final Project Report Reporting period: June 21, 2006 to October 21, 2009
Milind Deo, Eric Eddings and Pankaj Tiwari Department of Chemical Engineering
University of Utah
April 21, 2009
DOE Award Number: DE-FC26-06NT15569
Submitted by: Institute for Clean & Secure Energy
155 South 1452 East Room 380 Salt Lake City, UT 84112

G-2
Project Objectives
1. Conduct comprehensive analysis of oil shale pyrolysis data and kinetic models
found in the literature.
2. Obtain data on the pyrolysis of Green River shale from Utah, including detailed
compositional information.
3. Compare the data generated for shale with Asphalt Ridge oil sands data. We used
Asphalt Ridge rather than the Sunnyside oil sands in the original proposal because
of the activity on this deposit and because the samples were readily available.
4. Perform GC-MS analyses to identify compounds that may have high water
solubility and may pose environmental concerns.
5. Examine different options for describing the pyrolysis process and make
recommendations concerning the level of detail necessary in compositional data
to describe the complex reactions that are occurring.
Summary of Project Outcomes
Studies significant to the kinetic analyses of oil shale are compiled and discussed in this
report. Methods and experiments relating to the pyrolysis and combustion of Green
River oil shale samples from Utah are then presented. Kinetic analysis of both pyrolysis
and combustion data was performed using conventional and isoconversion (Friedman)
methods. A reasonable match of the data was obtained by considering activation energy
as a function of heating rate. For decomposition of complex materials such as kerogen,
isoconversion methods are recommended. Based on the data collected, a distribution of
activation energies (with conversion) was established. While obtaining comprehensive
combustion kinetic information was not one of the original project objectives, other
research activities indicated that in situ combustion could be one of the processes used to
generate sufficient energy for the pyrolysis process. Pyrolysis yield information was
generated using inch core samples. Yields generally increased slightly with
temperature in the narrow temperature window examined in this work. The highest yield
was obtained in the experiment with a slow heating rate. Compositional information of
the samples revealed that higher temperature processes yielded oil with higher residue.

G-3
No significant difference in yield or composition was observed in experiments performed
by soaking cores in water for short durations (1-10 days). Selected GC-MS analyses of
the products revealed the alkene-alkane pairs typical of shale oils. Significant amounts of
aromatics were also present in the oils. In general, these compounds have higher water
solubilities than the paraffinic and naphthenic species in the oil. The GC-MS analyses
revealed the necessity of detailed compositional analyses. Thermogravimetric analyses
of the pyrolysis of Asphalt Ridge oil sands were performed and the signatures were found
to be very different from oil shale pyrolysis. Detailed study of the oil sands pyrolysis
kinetics was deferred because the process was thought to be significantly different from
oil shale pyrolysis.
Presentations and papers
The work covered in this report had been presented in two conferences
1- 28th
Oil Shale Symposium, Colorado School of Mines, “Isothermal and Non-
isothermal Kinetic Analyses of Mahogany Oil Shale with TGA”, Pankaj Tiwari,
Kyeongsok Oh and Milind Deo, 2008.
2- 2008 AIChE Annual Meeting, Philadelphia, “Kinetic of Oil Shale Pyrolysis and
Oil Composition”, Pankaj Tiwari and Milind Deo, 2008.

G-4
Introduction
The oil shale industry is going through a revolution of sorts. After the oil crisis in
the 1970s, a great deal of effort was spent on research and development and on pilot scale
technologies. Extensive research was conducted with on-surface and in-situ production
methods. Even though some large pilot underground retorting operations were performed,
the on-surface (mining and processing) methods were closest to full-scale (~10,000
barrels/day) commercial implementation. The oil price collapse in the early and mid-
1980s led to the total discontinuation of oil shale research and development programs. In
recent years, in-situ production methods have seen a significant revival due to
technological advances. With these methods, the slow thermal pyrolysis of the organic
matter in shale leads to a light oil product that does not require additional thermal
upgrading.
Good kinetic data are essential for accurate mathematical modeling of various on-
surface and in-situ oil shale processes. The purpose of this project was to develop a more
detailed kinetic understanding of the pyrolysis of oil shale. Progress toward this goal is
summarized in this report, including isothermal and non-isothermal kinetics of the
pyrolysis of the Green River oil shale using thermo gravimetric analyses (TGA). Detailed
compositions of the shale oil obtained under various conditions are also presented.
Literature Survey
Oil shale can be a viable alternative source for fast-depleting natural sources of
petroleum. The term oil shale covers a wide variety of compact, laminated, sedimentary
rocks containing organic material embodied in an inorganic material matrix. The organic
portion of the shale, also known as kerogen, undergoes chemical decomposition on
thermal heating or pyrolysis to produce a liquid substance (shale oil). Because of the
chemical composition of the oil produced, moderate to significant upgrading (nitrogen
removal, hydrogen addition) may be required to convert the oil into a refinery feedstock.
However, due to the very complex nature of the organic matter, the unraveling of the
kinetics has not been straightforward. The yield and quality of the pyrolysis products
depend on the source material (geological variability), the temperature-time history,
pressure and presence of other reactants such as water, hydrogen, etc.

G-5
The main constituent of the organic part of the shale is kerogen which, in some
publications, is approximated as C200H300SN5O11. Rich oil shale contains about 10 wt %p
kerogen. The kerogen portion of the organic matter is insoluble in ordinary solvents for
petroleum and, upon the application of heat, may yield some or all of the following
products: gas, oil, bitumen and organic residue (fixed carbon). Oil shales also contain a
small percentage of bitumen, which is the benzene-soluble organic material naturally
present in the oil shale. Although pure kerogen has not been isolated, it is not considered
to be a chemical compound of fixed composition and properties. Rather, it is a
heterogeneous mixture of organic matter derived from material such as spore exines,
algae, resins, cuticles and woody fragments.
Liquid condensed from the gases evolved during thermal treatment, uncondensed
gases and carbonaceous coke are the primary products of kerogen decomposition. Extent
of this decomposition, product yields, and the kinetics of the reaction depend on the
heating rate and the temperature. Pyrolysis, which is carried out in an inert atmosphere,
is likely to exhibit different characteristics than combustion, which is carried out in the
presence of air. Some investigations have led to the conclusion that the kerogen exhibits
properties of pyrobitumen and, upon heating, decomposes by a consecutive reaction into
bitumen. Upon subsequent heating, this bitumen decomposes or cracks into the
decomposition products of oil, gas, and a carbonaceous residue (benzene insoluble
portion of the kerogen remaining in the spent shale). Further, the reaction rate has
generally been treated as first order with respect to the concentration (weight fraction) of
kerogen in the formation of bitumen and also first order with respect to pyrolysis of
bitumen in the subsequent formation of oil and gas.
The reported literature on oil shale retorting is extensive and covers different
approaches used in the compositional analysis of materials (raw shale, products formed,
and spent shale), the development of mechanisms and kinetic parameters for retorting of
oil shale in different environments, and the effects of retorting conditions on oil yield and
compositions. Hubbard and Robinson (1950) [1]
studied three Colorado oil shale
samples at different temperatures (350o-525
oC) at atmospheric pressure in the absence of
oxygen. The samples were extracted (removal of naturally present bitumen) and only
insoluble organic material in the oil shale was studied. It was reported that kerogen

G-6
decomposition to bitumen is a first order reaction; formation of bitumen is proportional to
the amount of kerogen present. George et al. (1966) [2]
reported data from the pyrolysis
of oil shale (Piceance Creek Basin in the Green River formation, marlstone) at different
temperatures (331o-500
oC), pressures (atmospheric and 1000 psig) and reaction duration
(13-550 hours) using natural gas as the heating medium. The crude oil produced was
found to have a low pour point and high specific gravity. They concluded that evidence
of H2S formation during the experiment was an indicator of initial kerogen
decomposition as well as complete conversion of organic matter. Decomposition of
organic matter to products was determined to be a two-step process; the heat of reaction
for initial product evolution was 26.7 kcal, while for the long-term, slower, continuing
product formation, an activation energy of 20.5 kcal/mol was calculated. Allred (1966) [3]
critically re-examined Hubbard and Robinson data for Colorado oil shale and proposed a
new mechanism to explain the production of fluid hydrocarbon from insoluble organic
matter in oil shale. Allred anticipated that the rate determining reaction was a logistic or
autocatalytic function. He divided the conversion versus temperature curve into three
regions and explained the different rate controlling steps at different temperature
segments. Braun and Rothman (1975) [4]
analyzed the Hubbard and Robinson data more
accurately by taking into account an initial thermal induction period. It was reported that
the decomposition of kerogen is the rate-controlling step at temperatures above 760K
(487oC), while the decomposition of bitumen is the rate-controlling step below 760K.
The activation energy of 44.56 kJ/mol for the first step indicates that the decomposition
of kerogen involves the breaking of relatively weak chemical bonds, while the activation
energy of 177.6 kJ/mol for the consecutive reaction indicates that the decomposition of
bitumen involves the breaking of much stronger chemical bonds.
Campbell (1978) [5]
used isothermal and non-isothermal methods to investigate
the kinetics of oil generation during decomposition of Colorado oil shale by TGA. The
non-isothermal method gave an apparent activation energy of 219.4 kJ/mol and a
frequency factor of 2.81x10¹³
s-1
, and the process was found to be first order. Burnham
et al. (1982) [6]
reviewed oil yield and kinetic results for western (Colorado Mahogany
zone) and eastern (Sunbury and Ohio) oil shales for conditions ranging from those
encountered during in-situ processing to those in fluidized bed retorting. They concluded

G-7
that oil yields from eastern shale are much more sensitive to pyrolysis conditions than
western shale. The hydrocarbon generation from eastern oil shale was roughly twice as
fast as that from the Colorado oil shale. Thakur and Nuttall (1987) [7]
considered
Moroccan oil shale for a kinetics study of thermal decomposition by isothermal (325o-
475oC) and non-isothermal (1, 2, 5 10, 20, 50
oC/min) TGA. They analyzed the non-
isothermal weight loss data by using three models: the Chen and Nuttall model (integral
method), the Coast and Redfern model (graphical method) and the Anthony and Howard
model (Gaussian distribution). The first two methods assume a single first order rate
equation to describe the decomposition reaction while the third method assumes multiple
parallel first order reactions. They also analyzed the isothermal TGA data using the
integral method. Analyzing non-isothermal and isothermal TGA measurements together,
they noted that the thermal decomposition of Moroccan oil shale involves two
consecutive reactions with bitumen as an intermediate. Further, Galan and Smith
(1983)[8]
determined the influence of transport effects (heat and mass) on the observed
rate of thermal decomposition of Colorado oil shale kerogen (Anvil Point mine) in a
TGA-type apparatus. They concluded that if the particle size was greater than about 0.4
x10-3
m and if more than two to three layers of particles were present, transport of heat
and mass through intra-particle, particle to bulk fluid, and inter-particle interactions all
influenced the rate.
A number of researchers have derived a relatively simple but effective kinetic
expression for oil evolution during pyrolysis of Green River and other oil shales: single
first order kinetics for slow and moderate heating rates and consecutive first order or
single pseudo nth order kinetics for rapid isothermal pyrolysis (Leavitt et al., 1987).
However, it is desirable to derive kinetic models that are more fundamental and are
transferable to different kerogens over a wider range of pyrolysis conditions. To
determine detailed kinetics of oil evolution, to maximize the oil yield, and to minimize
the coking and cracking, it is necessary to understand the entire process mechanism and
to account for the shift of the rate controlling step during the process with changes in
retorting conditions. To accomplish this objective, Burnham and Happe (1984) [9]
reported NMR analyses of five Green River shale oil (liquid) samples generated under
widely different pyrolysis conditions and qualitatively proposed a kerogen

G-8
decomposition mechanism with possibilities for secondary reactions (explained below).
The proposed mechanism predicted aromaticity and yield of liquid product during
pyrolysis. Chalesworth (1985, published two papers on the dependence of oil products
on time/temperature history [10]
and proposed a set of mechanisms [11]
to explain oil
quality as a function of time/temperature history during pyrolysis. Gas chromatographic
analyses with a flame ionization detector for pyrolyzed products were reported as alkene
and alkane ratios; the shift in hydrocarbon compositions was explained with the
proposed mechanism. The types of temperature-dependent mechanisms that occur
during pyrolysis were classified as: 1-Diffusion controlled reactions, 2-Phase boundary
controlled processes, 3-Nucleation controlled processes, 4-Reaction with nucleation and
linear growth of nuclei, and 5-Processes governed by nucleation and bulk growth of
nuclei.
Scaling up and extrapolation from laboratory experiments to commercial scales
generally requires a kinetic model that can properly describe the effects of temperature
(heating rate), pressure, residence time, and gas composition on oil yield and
composition. A kinetic model that can accurately calculate yields, compositions and rate
of evolution must account for the effect of pressure on shale oil evolution and
evaporation and its relationship to oil cracking and coking, also known as secondary
pyrolysis reactions. Secondary reactions are very important and depend not only on
pressure but also on temperature and flow rate of sweep gas (residence time of liquid
products). Cracking and coking have a direct impact on oil yield and compositions and on
the quality of the liquid and gas products distribution. Burnham and Singleton (1983)[12]
reported oil yield, compositions, and rate of evolution from Green River oil shale (Anvil
Point mine) for heating rates from 1o-100
oC/h and pressures of 1.5 and 27 atm. They
concluded that higher pressure and lower heating rates during pyrolysis cause a decrease
in oil yield.
Pyrolysis of shale in fixed bed and fluidized bed reactors, postulation of oil
formation mechanisms and explanations of the dependency of yield on decomposition
conditions and on kinetic parameters are also reported in the literature. For example, the
operation of a fluidized bed reactor for Colorado oil shale pyrolysis and the derivation of
subsequent kinetic parameters were reported by Braun and Burnham (1986) [13]
.

G-9
Kerogen is classified on the basis of H/C and O/C atomic ratios (Van Krevelen
diagram). The Mahogany oil shale is rich in H/C atomic ratio and falls in the type I
category. A global model for the generation of oil and gas from petroleum source rocks
was presented by Braun and Burnham (1993) [14]
. This model consists of 13 chemical
species and 10 reactions and incorporates alternative mechanistic pathways for type I and
type II kerogens. Pyrolysis was proposed and simulated for typical geological conditions.
Commercialization of oil shale pyrolysis will not occur based only on the
knowledge of kinetic parameters and of a mechanism/model of product formation. Other
physical (permeability, porosity, density, etc.) and chemical properties (pour point,
composition distribution, heat of reaction) of raw shale, products, and spent shale are also
needed to accurately predict and control both the product distribution yields and the mass
and energy balances. Muehlbaur and Burnham (1984) [15]
derived simple equations for
estimating the heat of combustion of raw shale using thermo-chemical estimates and
linear regression of experimental data. They found that the heat of combustion can be
reasonably estimated with an exothermic term that accounts for the combustion of
organic matter and a constant that accounts for pyrite combustion, carbonate
decomposition, and glass formation. They reported a mean value of 5209 kJ/kg for the
heat of combustion of raw Green River oil shale.
Because oil shales have differing origins and geological environments, resulting
in differing compositions (H/C ratio, organic content, and mineral matter composition), it
is not surprising that they behave differently when subjected to pyrolysis conditions.
Torrente and Galan (2001) [16]
pyrolyzed Spanish oil shale (Puetrollano) using different
particle size distributions. They did not observe significant effects of heat and mass
transport on the kinetic parameters. The activation energies reported for isothermal and
non-isothermal kinetic analyses were 150 kJ/mol and 167 kJ/mol respectively. Similarly,
Shyuan and Changtao (2003)[17-18]
and Qian et al. (2007) [19]
performed pyrolysis
experiments with different Chinese oil shales and concluded that the rate of thermal
decomposition could be one or two stages depending on the type of oil shale. Similar
conclusions were reported for a Pakistani oil shale by Williams and Ahmad (1999) [20]
and for a Jordanian oil shale by Jaber and Probert (2000) [21]
.

G-10
In this study, kinetic data from Mahogany oil shale are obtained using TGA. We
report isothermal (300o-600
oC) and non-isothermal (0.5
o- 50
oC/min) decompositions of
crushed Mahogany Oil Shale (crushed to 100 mesh) with TGA in N2 (pyrolysis) and air
(combustion) environments. Data obtained from TGA experiments are analyzed in detail.
Different mathematical approaches for both isothermal and non-isothermal cases are used
to determine the kinetic parameters (activation energy, Ea and the pre-exponential factor,
A) with the assumption of first order reaction. For isothermal experiments, the data are fit
using the integral method; for non-isothermal analyses, kinetic data are derived using
four different methods, namely, a direct Arrhenius plot, the integral method, the
Friedman approach and the maximum rate method. The quality of the fit when using the
first order assumption and values of the kinetic parameters differ depending on the
mathematical method employed. In this report, results from several samples are covered
in detail. The tradeoff between Ea and A is also considered. To analyze the product
compositions at different temperatures, experiments were performed with cylindrical
cores with N2 as sweep gas. The liquid product (condensed vapor) obtained was analyzed
using gas chromatography to identify the oil compositions and concentrations.
This study differs from the earlier Mahogany oil shale work of Burnham and
various collaborators in several important ways. First, these earlier researchers did not
obtain TGA data over such a wide range of operating conditions. Second, specific
Mahogany oil shale data is generated in this study with the intent of using it for scaleup
in the next phase of the project. Data on the kinetics of combustion over a wide range of
operating conditions is also a new contribution from this work.
Experimental Procedure
Thermo Gravimetric Analysis (TGA)
Mahogany oil shale was crushed and screened to 100 mesh-size particles and then
dried for four hours to remove any moisture (there was no significant weight loss during
drying). To study the reaction kinetics, a TGA instrument (TA Instruments Q-500) was
used for the entire temperature range of kerogen decomposition in both N2 (pyrolysis)
and air (combustion) environments. TGA experiments for both isothermal (300o-600
oC)
and non-isothermal (0.5o - 50
oC/min) decomposition of the crushed and dried oil shale
G-11
samples (20-30 mg) were performed. For the pyrolysis experiments, the flow rate of N2
was kept constant at 60 ml/min as was the purging time. For the combustion
experiments, the TGA setup was identical with the exception that the purge gas was
switched from N2 to air. The size of the particles used along with other conditions
employed were specifically designed to eliminate heat and mass transfer effects during
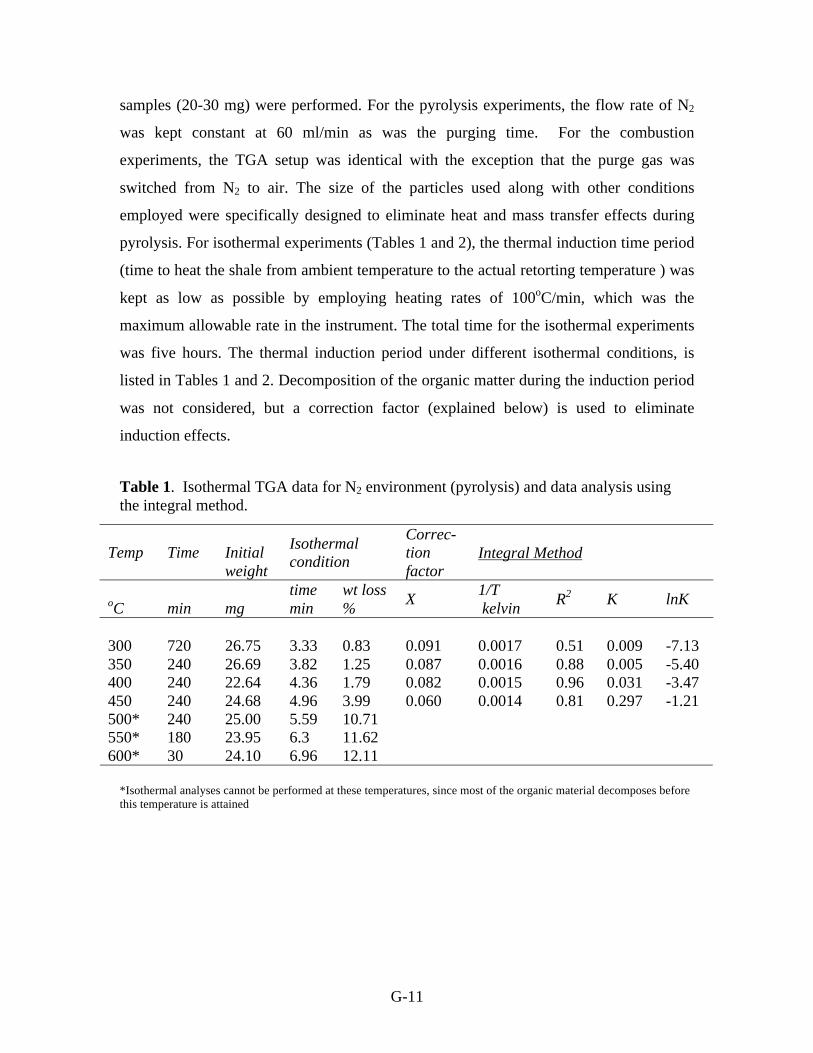
pyrolysis. For isothermal experiments (Tables 1 and 2), the thermal induction time period
(time to heat the shale from ambient temperature to the actual retorting temperature ) was
kept as low as possible by employing heating rates of 100oC/min, which was the
maximum allowable rate in the instrument. The total time for the isothermal experiments
was five hours. The thermal induction period under different isothermal conditions, is
listed in Tables 1 and 2. Decomposition of the organic matter during the induction period
was not considered, but a correction factor (explained below) is used to eliminate
induction effects.
Table 1. Isothermal TGA data for N2 environment (pyrolysis) and data analysis using
the integral method.
*Isothermal analyses cannot be performed at these temperatures, since most of the organic material decomposes before
this temperature is attained
Temp
Time
Initial
weight
Isothermal
condition
Correc-
tion
factor
Integral Method
oC
min
mg
time
min
wt loss
% X
1/T
kelvin R
2 K lnK
300
720
26.75
3.33 0.83
0.091
0.0017
0.51
0.009
-7.13
350 240 26.69 3.82 1.25 0.087 0.0016 0.88 0.005 -5.40
400 240 22.64 4.36 1.79 0.082 0.0015 0.96 0.031 -3.47
450 240 24.68 4.96 3.99 0.060 0.0014 0.81 0.297 -1.21
500* 240 25.00 5.59 10.71
550* 180 23.95 6.3 11.62
600* 30 24.10 6.96 12.11

G-12
Table 2. Isothermal TGA data for air environment (combustion) and data analysis using
the integral method.
The non-isothermal experiments (Tables 3 and 4) were performed to 1000oC, the
highest temperature possible in the instrument. The mass and temperature measurements
in the instrument were calibrated. Excellent reproducibility was observed in the mass
loss curves as shown in Figure 1. The combustion experiments were performed with the
same TGA set up with N2 as purge gas for the first five minutes followed by air for the
rest of the experiment.
Figure - 1: Thermogravimetric analysis (TGA) of Green River oil shale. This analysis
was performed to ensure reproducibility.
Temp Total
time
Initial
weight
Isothermal
condition
Corre-
ction
factor
Integral Method
oC min mg
time
min
wt
loss
%
X 1/T
kelvin R
2 K lnK
300 240 23.64 2.70 0.093 0.0017 0.87 0.036 -3.31
350 240 23.39 3.82 0.081 0.0016 0.87 0.191 -1.65
400 240 23.24 4.31 0.068 0.0015 0.84 0.873 -0.14
450 180 32.16 4.88 0.043 0.0014 0.86 2.801 1.03
Organic Mineral

G-13
Table 3. Analysis of the non-isothermal TGA pyrolysis data using the differential
method.
Table 4. Non-isothermal TGA data for air environment (combustion) - Two peaks.
Pyrolysis of Cylindrical Oil Shale Core Samples
The production of oil from shale by thermal decomposition is a complex process.
The numerous chemical compounds in the kerogen and the sequence of pyrolysis
reactions (parallel and series reactions) that occur during decomposition are unknown.
Hence, the formulation of a set of equations for the rate of decomposition that covers all
Analysis Criteria Heating
rate
Initial
wt Start End Maximum Differential Method
mg T
oC
wt
%
Loss
T oC
wt %
Loss
Tmax, oC
wt
%
Loss
R2 slope Intercept
Ea
kJ/mol
A
min-1
0.5 22.64 255.6 1.32 421.6 8.02 392.7 6.48 0.96 9351 10.8 77.74 24510
1 28.64 269.6 1.16 437.6 7.48 398.3 5.79 0.95 9002 10.07 74.84 23624
2 26.90 280.0 1.33 456.4 8.43 414.1 6.52 0.96 10379 11.8 86.29 266505
5 25.97 348.9 2.17 474 9.41 432.2 7.17 0.97 14873 17.93 123.65 3E+08
10 38.45 349.7 1.74 490 9.67 445.6 7.26 0.97 14905 17.54 123.92 4E+08
20 29.49 371.6 1.58 504 10.68 460.1 7.92 0.97 17757 21.00 147.63 3E+10
50 22.37 377.3 1.43 530.6 11.13 477.0 7.89 0.96 17218 19.56 143.15 2E+10
First Peak Second Peak Heating
rate
Initial
weight Start End Maximum End Maximum weight
loss
mg T
oC
wt
%
Loss
T oC
wt
%
Loss
Tmax oC
wt
%
Loss
T oC
wt %
Loss
Tmax oC
wt %
Loss %
0.5 18.68 179 0.67 311.3 8.16 279.9 5.20 396.4 12.91 340.2 10.80 12.91
1 20.26 199.1 0.59 323.8 7.95 294.1 5.29 400.3 13.02 354.4 10.74 13.02
2 19.98 201.9 0.49 339.1 7.56 305.9 4.80 421.5 12.29 367.1 9.93 12.29
5 30.56 211.4 0.44 358.5 7.46 323.8 4.68 459.6 12.72 392.2 10.13 12.72
10 34.98 216.5 0.02 374.9 7.69 337.1 4.82 499.4 13.13 409.5 10.18 13.13
20 21.69 215.5 0.38 389.2 7.58 341.1 4.10 504.6 13.07 425.9 10.13 13.07
50 30.22 227.7 0.42 395.3 6.81 351.4 4.03 522.9 13.03 450.4 10.20 13.03
G-14
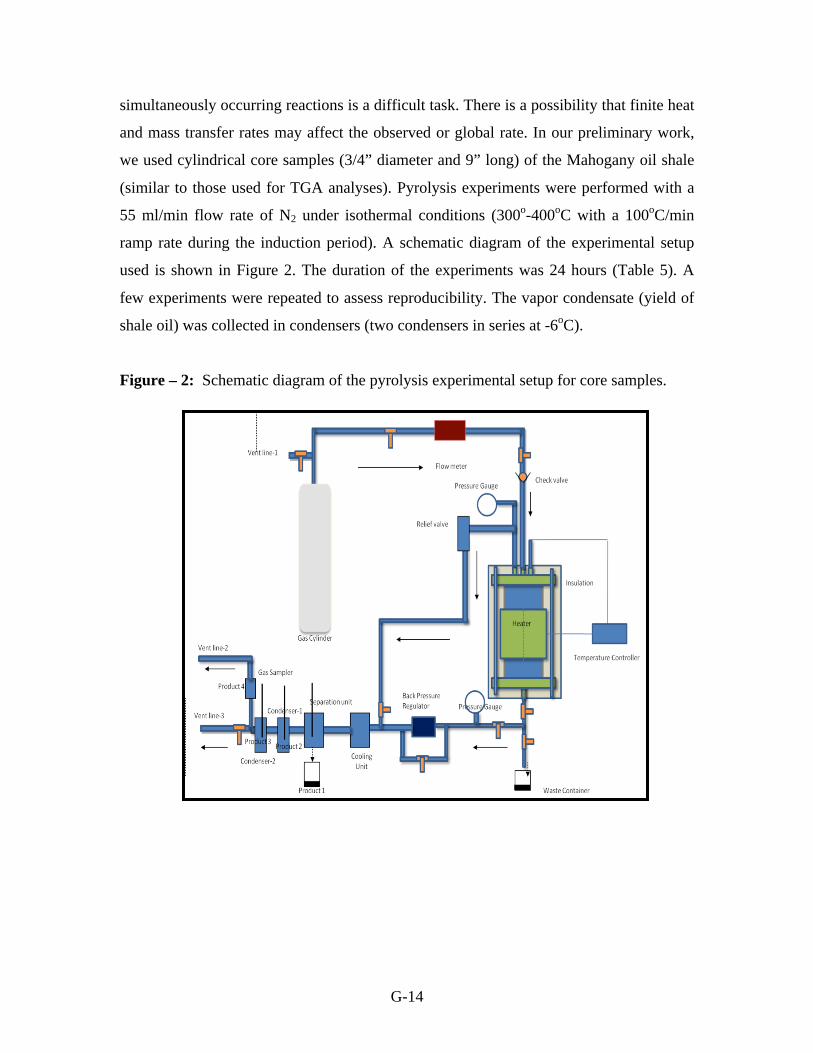
simultaneously occurring reactions is a difficult task. There is a possibility that finite heat
and mass transfer rates may affect the observed or global rate. In our preliminary work,
we used cylindrical core samples (3/4” diameter and 9” long) of the Mahogany oil shale
(similar to those used for TGA analyses). Pyrolysis experiments were performed with a
55 ml/min flow rate of N2 under isothermal conditions (300o-400
oC with a 100
oC/min
ramp rate during the induction period). A schematic diagram of the experimental setup
used is shown in Figure 2. The duration of the experiments was 24 hours (Table 5). A
few experiments were repeated to assess reproducibility. The vapor condensate (yield of
shale oil) was collected in condensers (two condensers in series at -6oC).
Figure – 2: Schematic diagram of the pyrolysis experimental setup for core samples.

G-15
Table 5. Experimental conditions and yield information for core samples pyrolysis.
*Equilibrate at 130oC then used 1
oC/min ramp rate to reach 400
oC and hold for 24 hr at 400
oC
§Other identity used for this sample is -4th Expt- (chunk big pieces of oil shale were used)
Table 6. Gas chromatography (Agilent GC -6890) operating conditions (ASTM -5307).
Oven 40
oC
Initial temp
10oC/min ramp
rate
410oC
Final temp 10 min hold
Column 1ml/min He
flow rate Inlet - Tracked oven typed 10 Psia
Cool on
Column
GC-6890
Detector FID 40 ml/min H2
flow rate
450 ml/min
Air flow
rate
350oC
Detector temp
Photographs of the reactor, the raw sample, the shale oil, and the spent shale are
seen in Figure 3. The shale oil product was analyzed by gas chromatography (GC-6890
Agilent) to quantify the hydrocarbon compositions. The ASTM-5307 procedure with
minor modifications was followed. The operating conditions of the GC (cool on-column
injection) are shown in Table 6. The ASTM standard of normal alkanes (C12- C60) was
used to perform the simulation distillation analysis (SIMDIS).
Expt
no
Temperature
oC
Oil Shale
weight
gm
Spent shale
weight
gm
Weight
loss
%
Shale oil
(Yield) %
Experiment with Swagelok Reactor
1 300oC 51.36 46.17 10.11 6.56
2 350oC 47.44 40.8 14.00 6.74
3 400oC 58.12 45.38 21.92 10.28
4 300oC 57.76 53.65 7.12 5.67
5 350oC 55.41 48.42 12.62 4.83
6 400oC 52.47 44.71 14.79 6.97
7* 400oC 31.5322 26.04 17.42 11.91
8 200oC 33.57 33.60 No oil generation (7 days)
Experiment with Tube Reactor
9§ 450
oC 250.08 205.00 18.02 8.31

G-16
Figure – 3: Images of the small reactor section, raw sample and products.
Kinetic Expression- Mathematical Models
There are two modes where kinetic parameters can be conveniently derived,
isothermal (constant temperature), and linear heating (constant heating rate, non-
isothermal). Since the chemical structure of kerogen is complex and not well established,
rates of thermal decomposition have been interpreted by simple overall reactions. It was
noted in the earlier literature survey that kerogen is a cross-linked, high molecular weight
solid. During pyrolysis, bonds are broken, leading to bitumen formation; this bitumen
subsequently decomposes to products. However, in this TGA study, only one peak was
observed in the organic decomposition temperature range for the N2 environment in both
isothermal and non-isothermal cases (Figures 4 and 5). Consequently, a single stage
decomposition was assumed in deriving kinetic rate expressions.

G-17
Figure -4: Isothermal TGA curves in the N2 environment (pyrolysis). Weight loss
increases and the maximum rate shifts to higher temperatures as temperatures increase.
Figure - 5: Non-isothermal TGA pyrolysis curves. Rates go from 0.5oC/min to 50
oC/min.
Mineral decomposition
300C
600C

G-18
In contrast, for TGA experiments conducted in the air environment, two peaks
were detected in organic decomposition temperature regions for all isothermal and non-
isothermal experiments, (Figures 6 and 7). Thus, both the single stage and two stage
decomposition mechanisms were examined in deriving the combustion kinetic
parameters.
Figure -6: Isothermal TGA curves in air environment (combustion).

G-19
Figure -7: Non-isothermal TGA combustion curves. Rates go from 0.5oC/min to
50oC/min.
The simple mechanism for the organic decomposition of kerogen to oil shale is
Kerogen Products
For the pyrolysis data, a single step mechanism with a first order reaction model was used
in the analysis. For the combustion (air) data, a reaction model consisting of two
successive first order (series) reactions was used to analyze the data. The reaction was
assumed to be of the form
Kerogen Bitumen Products
with bitumen representing all the intermediate products.
As some earlier test experiments with TGA (up to 1000oC) indicated, 10-12 wt %
of the oil shale was organic. Thus, all the isothermal data were normalized on the basis of
Two peaks in
organic section
1st Peak
2nd
Peak
G-20
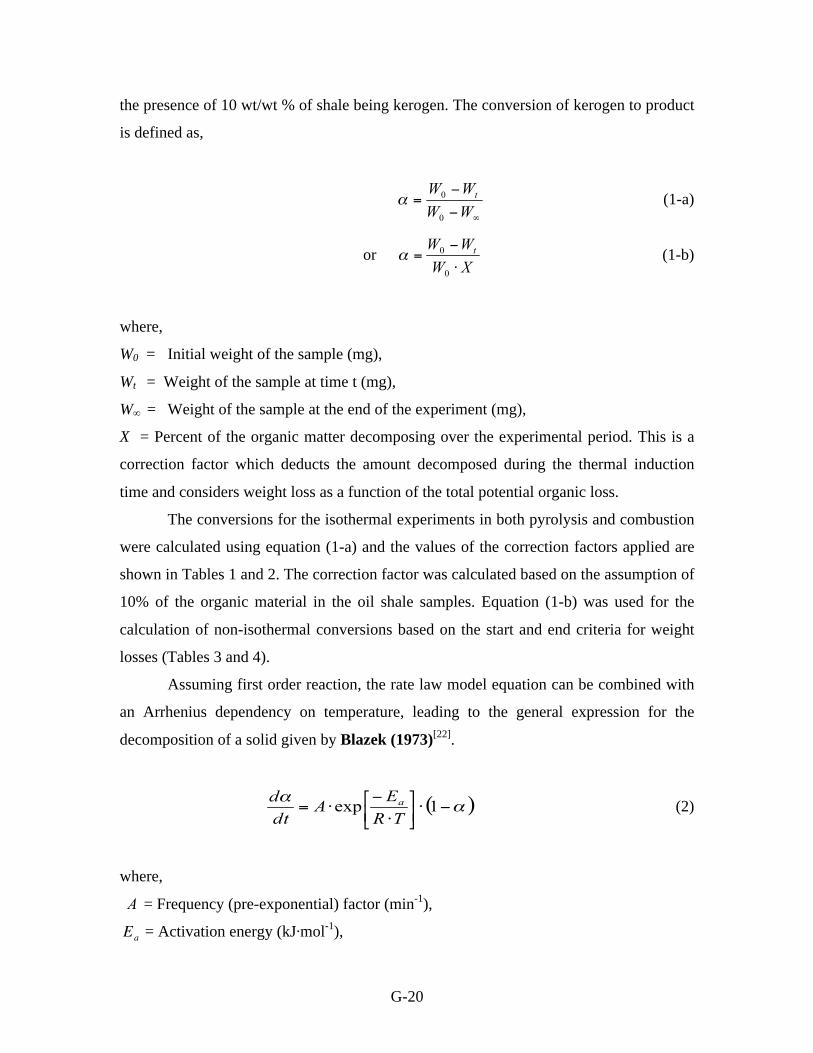
the presence of 10 wt/wt % of shale being kerogen. The conversion of kerogen to product
is defined as,
(1-a)
or (1-b)
where,
W0 = Initial weight of the sample (mg),
Wt = Weight of the sample at time t (mg),
W = Weight of the sample at the end of the experiment (mg),
X = Percent of the organic matter decomposing over the experimental period. This is a
correction factor which deducts the amount decomposed during the thermal induction
time and considers weight loss as a function of the total potential organic loss.
The conversions for the isothermal experiments in both pyrolysis and combustion
were calculated using equation (1-a) and the values of the correction factors applied are
shown in Tables 1 and 2. The correction factor was calculated based on the assumption of
10% of the organic material in the oil shale samples. Equation (1-b) was used for the
calculation of non-isothermal conversions based on the start and end criteria for weight
losses (Tables 3 and 4).
Assuming first order reaction, the rate law model equation can be combined with
an Arrhenius dependency on temperature, leading to the general expression for the
decomposition of a solid given by Blazek (1973)[22]
.
(2)
where,
= Frequency (pre-exponential) factor (min-1
),
Ea = Activation energy (kJ mol-1
),

G-21
R = Gas constant (8.314 kJ mol -1.
K-1
),
T = Temperature (K).
In the analysis of the data from the isothermal experiments, the value of X, the
correction factor for thermal induction, is not fixed. Non-isothermal TGA offers certain
advantages over the classical isothermal method because it eliminates the errors
introduced by the thermal induction period. Non-isothermal analysis also permits a rapid
scan of the whole temperature range of interest.
Isothermal Analysis
- Integral method
The integral form of equation (2) can be written as
(3)
where k is the specific rate constant and to is the time at the start of the constant-
temperature period (when the isothermal condition reached). In this study, the thermal
induction period is eliminated from the kinetic analysis. Correspondingly, the W is
corrected by X. The normalized conversions versus time curves are shown in Figures 8
and 9.
Figure - 8: Normalized conversion in isothermal TGA experiments for N2 environment
(pyrolysis).

G-22
Figure - 9: Normalized conversion in isothermal TGA experiments for air environment
(combustion).
Application of the integral method to the isothermal data (Figures 10 and 11) and
the corresponding Arrhenius plots (Figures 12 and 13) can be used to obtain frequency
factors and activation energies. The plots shown are for both the pyrolysis (N2), and
combustion (air) experiments.
0
0.2
0.4
0.6
0.8
1
1.2
0 20 40 60 80 100 120
Conevrs
ion
Time, min
Conversion - Isothermal - Air
AIR_450C
AIR_400C
AIR_350C
AIR_300C

G-23
Figure - 10: Analysis of kinetic data using the integral method for 1st order isothermal
TGA pyrolysis experiments.
Figure - 11: Analysis of kinetic data using the integral method for 1st order isothermal
TGA combustion experiments.
-7
-6
-5
-4
-3
-2
-1
0
0 20 40 60 80 100 120
ln(1
-)
Time (t-t0,) min
Isothermal -1st order - N2
N2_450C
N2_400C
N2_350C
N2_300C
-6
-5
-4
-3
-2
-1
0
0 5 10 15 20 25 30
ln(1
-)
Time (t-t0), min
Isothermal - 1st order - Air
AIR_450C
AIR_400C
AIR_350C
AIR_300C

G-24
Figure- 12: Arrhenius plot for 1st order isothermal TGA pyrolysis experiments:
(Ea = 134.77 kJ/mol and A = 1.2E+09 min-1
).
Figure - 13: Arrhenius plot for 1st order isothermal TGA combustion experiments:
(Ea = 100.47 kJ/mol and A = 5.1E+07 min-1
).
y = -16211x + 20.881
R = 0.9834
-8
-7
-6
-5
-4
-3
-2
-1
0
0 0.0002 0.0004 0.0006 0.0008 0.001 0.0012 0.0014 0.0016 0.0018 0.002
lnK
1/T, kelvin
Arrhenious plot -N2
y = -12085x + 17.757
R = 0.99962
-4
-3.5
-3
-2.5
-2
-1.5
-1
-0.5
0
0.5
1
1.5
0 0.0005 0.001 0.0015 0.002
ln K
1/T, kelvin
Arrhenious plot -Air

G-25
Non-isothermal Analysis
The non-isothermal TGA curves for N2 and air environments are shown in
Figures 5 and 7. The experimental conditions and analysis criteria to obtain kinetic
parameters such as start time, maximum point, and end point are summarized in Tables 3
and 4. On the basis of criteria chosen for the analysis, the conversion data were
normalized from zero to one with respect to temperature (Figures 14 and 15). A single
step mechanism is applied to the pyrolysis data while both single step and two step
mechanisms are evaluated for the kinetics of combustion.
Figure - 14: Normalized conversion for non-isothermal TGA pyrolysis data.
0
0.2
0.4
0.6
0.8
1
1.2
0 100 200 300 400 500 600
Convers
ion
Temperatuire oC
Normalized conversion - Non-isothermal- N2
N2_0.5C N2_1C
N2_2C N2_5C
N2-10C N2_20C
N2_50C
G-26
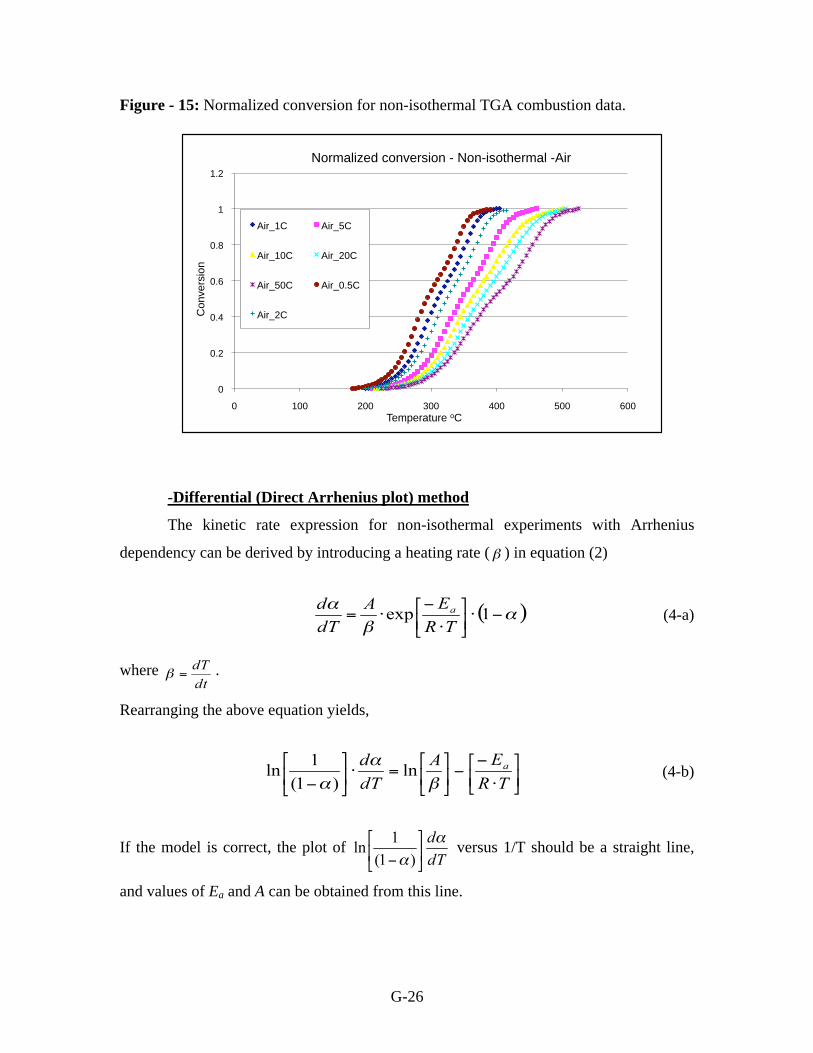
Figure - 15: Normalized conversion for non-isothermal TGA combustion data.
-Differential (Direct Arrhenius plot) method
The kinetic rate expression for non-isothermal experiments with Arrhenius
dependency can be derived by introducing a heating rate ( ) in equation (2)
(4-a)
where .
Rearranging the above equation yields,
(4-b)
If the model is correct, the plot of versus 1/T should be a straight line,
and values of Ea and A can be obtained from this line.
0
0.2
0.4
0.6
0.8
1
1.2
0 100 200 300 400 500 600
Convers
ion
Temperature oC
Normalized conversion - Non-isothermal -Air
Air_1C Air_5C
Air_10C Air_20C
Air_50C Air_0.5C
Air_2C
G-27
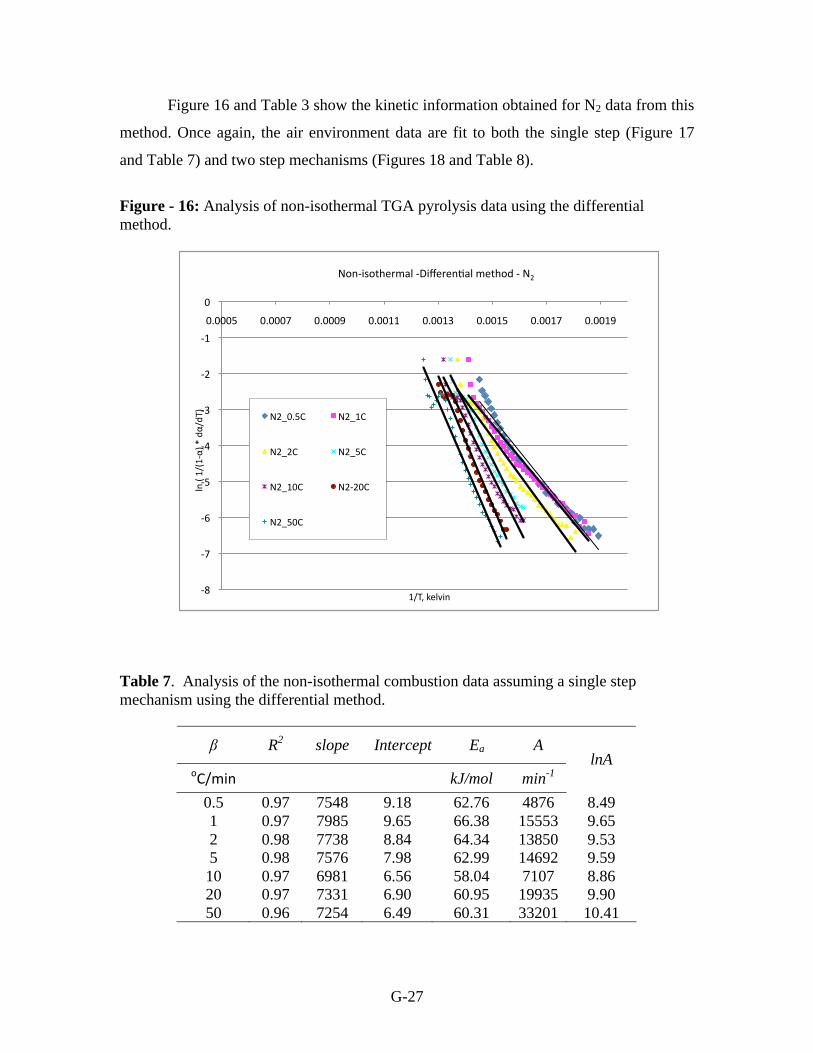
Figure 16 and Table 3 show the kinetic information obtained for N2 data from this
method. Once again, the air environment data are fit to both the single step (Figure 17
and Table 7) and two step mechanisms (Figures 18 and Table 8).
Figure - 16: Analysis of non-isothermal TGA pyrolysis data using the differential
method.
Table 7. Analysis of the non-isothermal combustion data assuming a single step
mechanism using the differential method.
R2 slope Intercept Ea A
kJ/mol min-1
lnA
0.5 0.97 7548 9.18 62.76 4876 8.49
1 0.97 7985 9.65 66.38 15553 9.65
2 0.98 7738 8.84 64.34 13850 9.53
5 0.98 7576 7.98 62.99 14692 9.59
10 0.97 6981 6.56 58.04 7107 8.86
20 0.97 7331 6.90 60.95 19935 9.90
50 0.96 7254 6.49 60.31 33201 10.41

G-28
Figure - 17: Analysis of non-isothermal TGA combustion data (single-step) using the
differential method.
Table 8. Analysis of the non-isothermal combustion data assuming a two-step
mechanism using the differential method.
* I - intercept
-10
-8
-6
-4
-2
0
0 0.0005 0.001 0.0015 0.002 0.0025 ln
((1/(
1-
))*d
/dT
1/T, kelvin
Non-isothermal -Differential method - Air - single step
AIR_1C AIR_5C
AIR 10C AIR_ 20C
AIR_ 50C AIR_0.5C
AIR_2C
First peak area Second peak area
R2 slope I* Ea A R
2 slope I* Ea A
oC/min kJ/mol min
-1 kJ/mol min
-1
0.5 0.96 7762 9.62 64.53 7581 0.87 9639 12.48 80.14 1E+05
1 0.96 7690 9.10 63.93 8997 0.97 12220 17.11 101.6 3E+07
2 0.97 7641 8.67 63.52 11668 0.93 10835 13.35 90.08 1E+06
5 0.97 7875 8.55 65.46 25958 0.9 9617 10.92 79.95 3E+05
10 0.96 7797 8.06 64.82 31958 0.85 7842 7.69 65.19 22064
20 0.96 7695 7.58 63.97 39353 0.79 9615 10.66 79.94 9E+05
50 0.94 7525 7.02 62.56 56107 0.95 11607 12.37 96.50 1E+07

G-29
Figure - 18: Analysis of non-isothermal TGA combustion data (two-step) using the
differential method.
- Integral method
The non-isothermal kinetic equation (Equation 2) can be separated in terms of
overall conversion and temperature for a specific constant heating rate ( ) and constant
frequency (pre-exponential) factor.
(5)
Equation 5 can be rearranged as,
(6-a)
This approach was developed by Chen and Nuttall (1979).[23]
The value of Ea
and A can be obtained by repeated least square fits of the equation to the experimental
data. First, by using an approximate value of Ea on left hand side of the equation as a
linear function of 1/T, –Ea/R and A/Ea are calculated using the slope and intercept of the
-10
-8
-6
-4
-2
0
0 0.0005 0.001 0.0015 0.002 0.0025 ln
((1/(
1-
))*d
/dT
1/T, kelvin
Non-isothermal- Differential method - Air - Two steps
AIR_1C_1 AIR_5C_1
AIR 10C_1 AIR_ 20C_1
AIR_ 50C_1 AIR_ 1C_2
AIR _5C_2 AIR_10C_2
AIR_20C_2 AIR_50C_2
AIR_0.5C_1 AIR_0.5C_2
AIR_2C_1 AIR_2C_2

G-30
resulting line. The value of Ea thus obtained is used successively on the left hand side
until no more improvement in the value of Ea is achieved. A simpler form of the integral
method, known as the Coats and Redfern (1964) [24]
method, can be used for the same
equation but does not require any iteration.
(6-b)
If the model is correct, fitting the conversion data along with temperature versus
1/T, as shown in the left hand side function of the above equation, results in a straight
line from which Ea and A can be obtained for different heating rates.
The Coats and Redfern method was adapted to analyze the TGA data in both
environments. Non-isothermal kinetic data for N2 are shown in Figure 19 and Table 9. A
single step mechanism (Figure 20 and Table 10) and a two step mechanism (Figure 21
and Table 11) are used to fit the air data.
Table 9. Kinetic parameters using the integral method for the analysis of the pyrolysis
data.
R
2 slope Intercept Ea kJ/mol A ,min
-1
0.5 0.98 10837 3.71 90.09 222253.59
1 0.97 10708 3.30 89.02 290903.36
2 0.98 11818 4.46 98.25 2044218.8
5 0.99 18441 13.2 153.31 4.982E+10
10 0.99 17276 11.08 143.63 1.121E+10
20 0.99 22780 18.02 189.39 3.052E+13
50 0.99 21283 15.15 176.94 4.042E+12

G-31
Figure - 19: Analysis of non-isothermal TGA pyrolysis data using the integral method.
Table 10. Kinetic parameters for the non-isothermal single-stage combustion.
R2 slope Intercept Ea, kJ/mol A, min
-1
0.5 0.97 9109.9 2.75 75.73 71408.3
1 0.97 9606.4 3.17 79.86 228658
2 0.97 9311.3 2.28 77.41 182669
5 0.97 9008.3 1.10 74.89 136058
10 0.96 8463.0 -0.23 70.36 66892.6
20 0.97 8529.3 -0.39 70.91 115150
50 0.95 8514.5 -0.75 70.79 199596

G-32
Figure - 20: Analysis of non-isothermal TGA combustion data using the integral method
with a single-step mechanism.
Table 11. Kinetic parameters for the non-isothermal two-stage combustion.
* I - intercept
-25
-20
-15
-10
-5
0
0 0.0005 0.001 0.0015 0.002 0.0025
ln(-
ln(1
-)/
T2)
1/T,kelvin
Non-isothermal- Integral method -Air - Single step
AIR_1C
AIR_5C
AIR 10C
AIR_ 20C
AIR_ 50C
Air_0.5C
Air_2C
First peak Second peak
slope I* R
2 Ea A slope I* R
2 Ea A
0.5 10762 6.03 0.97 89.48 2E+06 8536.6 1.68 0.99 70.97 22955
1 11251 6.327 0.96 93.54 6E+06 9357.3 2.62 0.98 77.8 1E+05
2 10623 4.782 0.97 88.32 3E+06 10354 3.73 0.90 86.08 9E+05
5 10714 4.25 0.96 89.08 4E+06 7703.2 -0.95 0.99 64.04 14891
10 10612 3.65 0.97 88.23 4E+06 6410.4 -3.26 0.99 53.30 2441
20 10110 2.45 0.98 84.05 2E+06 7101.9 -2.04 0.99 59.05 18305
50 10688 3.10 0.95 88.86 1E+07 7674.0 -2.06 0.97 63.80 48544

G-33
Figure - 21: Analysis of non-isothermal TGA combustion data using the integral method
with a two-step mechanism.
-Friedman method
The Friedman (1964) [25]
procedure assumes successive first order reactions and
is based on the conversion data rather than on heating rates.
(7)
Non-isothermal data can be analyzed at a specific conversion point ( ) for all
heating rates. Then, if the data agrees with the model, the plot for versus 1/T will
give a straight line. The slope and intercept will give Ea and A respectively. The
Friedman approach for TGA data is summarized in Figure 22 and Table 12 for pyrolysis
and in Figure 23 and Table 13 for the combustion data.
-25
-20
-15
-10
-5
0
0 0.0005 0.001 0.0015 0.002 0.0025 ln
(-ln
(1-
)/T
2)
1/T, kelvin
Non-isothermal- Integral method - Air- Two steps
AIR_1C_1 AIR_5C_1
AIR 10C_1 AIR_ 20C_1
AIR_ 50C_1 AIR_ 1C_2
AIR _5C_2 AIR_10C_2
AIR_20C_2 AIR_50C_2
AIR_0.5C_1 AIR_0.5C_2
AIR_2C_1 AIR_2C_2

G-34
Table 12. Kinetic parameters – distribution of activation energies as a function of
conversion obtained using the Friedman approach for the pyrolysis of oil shale.
Figure - 22: An isoconversion approach (Friedman method) for the analysis of non-
isothermal pyrolysis of oil shale.
-7
-6
-5
-4
-3
-2
-1
0
0 0.0005 0.001 0.0015 0.002
ln(d
/dt)
1/T, kelvin
Non-iosthemal - Friedman approach- N2
x =0.05 x =0.1
x=0.2 x = 0.3
x=0.4 x=0.5
x=0.6 x=0.7
x=0.8 x=0.9
x=0.95
Conversion
Slope Intercept R
2
Ea,
kJ/mol A, min
-1 lnA
0.05 12767 16.49 0.98 106.14 15283636 16.54
0.1 14197 18.57 0.98 118.03 1.3E+08 18.68
0.2 16912 22.46 0.98 140.60 7.1E+09 22.68
0.3 19417 25.93 0.98 161.43 2.62E+11 26.29
0.4 21671 28.99 0.98 180.17 6.55E+12 29.50
0.5 24326 32.55 0.99 202.24 2.75E+14 33.248
0.6 26110 34.82 0.99 217.08 3.34E+15 35.74
0.7 28020 37.10 0.99 232.95 4.33E+16 38.31
0.8 27740 36.16 0.99 230.63 2.53E+16 37.77
0.9 25843 32.356 0.98 214.85 1.13E+15 34.66
0.95 27102 33.17 0.99 225.32 5.09E+15 36.17

G-35
Table 13. Kinetic parameters – distribution of activation energies as a function of
conversion obtained using the Friedman approach for the combustion of oil shale.
Figure - 23: An isoconversion approach (Friedman method) for the analysis of non-
isothermal combustion of oil shale.
-7
-6
-5
-4
-3
-2
-1
0
0 0.0005 0.001 0.0015 0.002 0.0025
ln(d
/dt)
1/T, kelvin
Non-iosthermal - Friedman approach- Air
x=0.05 x=0.1
x=0.2 x=0.3
x=0.4 x=0.5
x=0.6 x=0.7
x=0.8 x=0.9
x=0.95
Conversion
Slope Intercept R
2
Ea,
kJ/mol A, min
-1 lnA
0.05 19458 31.84 0.97 161.77 7.1E+13 31.89
0.1 18585 29.60 0.97 154.52 8E+12 29.70
0.2 19177 29.91 0.98 159.44 1.2E+13 30.13
0.3 16911 25.40 0.98 140.6 1.5E+11 25.76
0.4 14820 21.27 0.99 123.21 2.9E+09 21.78
0.5 15384 21.39 0.99 127.90 3.9E+09 22.08
0.6 15753 21.24 0.99 130.97 4.2E+09 22.15
0.7 15833 20.85 0.99 131.64 3.8E+09 22.06
0.8 15789 20.25 0.98 131.27 3.1E+09 21.86
0.9 14615 17.65 0.968 121.51 4.7E+08 19.96
0.95 14447 16.36 0.88 120.11 2.5E+08 19.35

G-36
-Maximum rate method
The maximum rate method is a mathematical tool that uses the maximum rate of
the reaction (decomposition) at a point (temperature). The maximum rate is obtained by
ensuring that the following condition is satisfied.
(8)
Thus, for a first order reaction (n = 1), equation (4) will lead to the following form,
(9)
Here, is the temperature at the maximum reaction rate and is the conversion at
that condition. These values can be obtained from weight loss curves for the same sample
at different constant heating rates. The apparent Ea and apparent A can be determined by
linear slope and intercept, respectively. Using the derivatives of percent weight loss data
obtained from TGA (normalized conversions) to apply this method, kinetic parameters
are derived from results for pyrolysis (Figure 24) and for the two peaks in air (Figures 25
and 26).
G-37
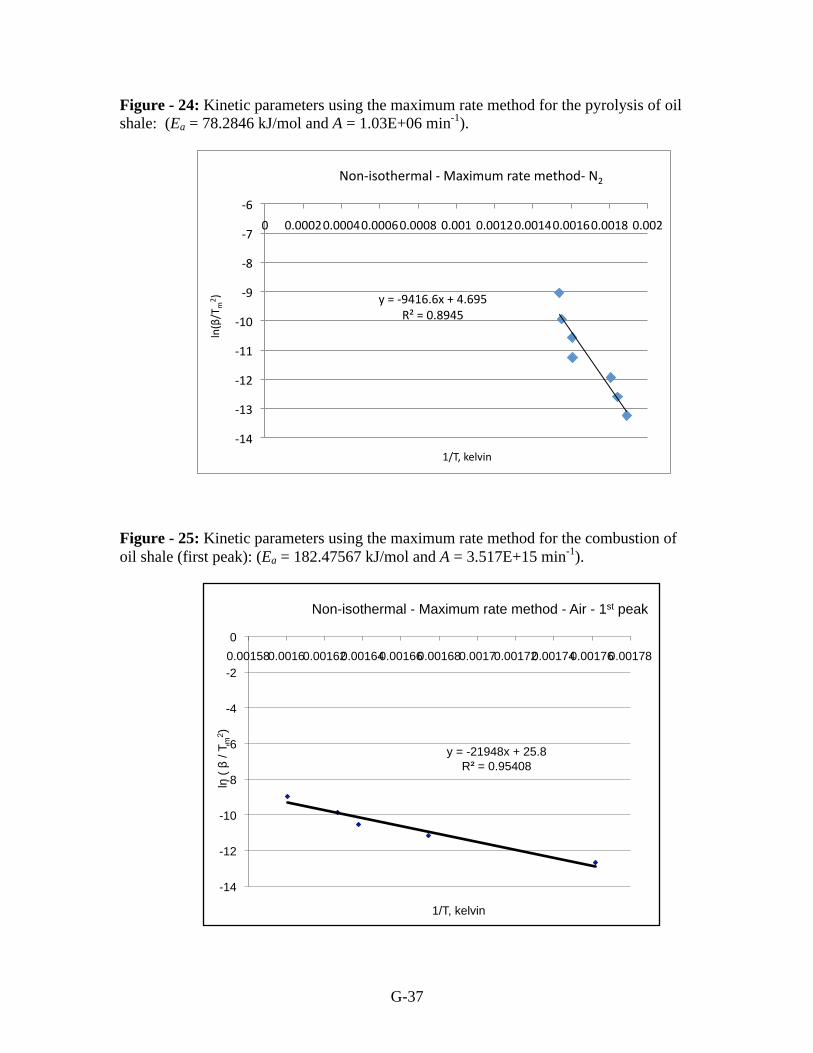
Figure - 24: Kinetic parameters using the maximum rate method for the pyrolysis of oil
shale: (Ea = 78.2846 kJ/mol and A = 1.03E+06 min-1
).
Figure - 25: Kinetic parameters using the maximum rate method for the combustion of
oil shale (first peak): (Ea = 182.47567 kJ/mol and A = 3.517E+15 min-1
).
y = -21948x + 25.8
R = 0.95408
-14
-12
-10
-8
-6
-4
-2
0
0.00158 0.0016 0.00162 0.00164 0.00166 0.00168 0.0017 0.00172 0.00174 0.00176 0.00178
ln (
/
Tm
2)
1/T, kelvin
Non-isothermal - Maximum rate method - Air - 1st peak

G-38
Figure - 26: Kinetic parameters using the maximum rate method for the combustion of
oil shale (second peak): (Ea = 142.842834 kJ/mol and A = 3.23E+10min-1
).
Results and Discussion
TGA Curve- Crushed Samples
The total extractable kerogen content in Mahogany oil shale was about 10-12 %
of the total weight. There was no significant weight loss observed during preheating,
confirming the absence of moisture content in the sample. This result was confirmed in
TGA experiments, where there was neither peak detection nor weight loss below 150oC.
Reproducibility was confirmed through several experiments, an example of which was
shown in Figure 1. There were two derivative peaks in all non-isothermal experiments,
corresponding to organic and carbonate decompositions. The carbonate decomposition
commenced at 525oC or above, depending upon the heating rate, and resulted in a total
weight loss of about 25-30%. We also observed that the maximum rate shifts to higher
temperatures as the heating rate increases from 0.5 to 50oC/min. This difference is due to
shorter exposure time to a particular temperature at faster heating rates (Figures 5 and 7).
In the N2 environment, only one peak was present in the 300o-550
oC temperature
range, indicating that only one significant reaction or process occurs in this range. In the
y = -17181x + 14.446
R = 0.99935
-14
-12
-10
-8
-6
-4
-2
0
0.00135 0.0014 0.00145 0.0015 0.00155 0.0016 0.00165 ln
( /
Tm
2)
1/T, kelvin
Non-isothermal - Maximum rate method - Air - 2nd peak

G-39
air environment, there were two peaks in the same temperature range, indicating that
there may be two reactions occurring simultaneously. The mechanism of the formation of
intermediates may be significantly different in the two environments, with the pyrolysis
intermediate forming relatively quickly.
As a result of these findings, two possible mechanisms were examined.
1. A single step mechanism involving Kerogen Products. (N2 environment )
2. A two step mechanism represented as Kerogen Bitumen Products. (Air
environment)
-Isothermal experiments
For isothermal experiments, the data were fit for the integral method. The kinetic
data obtained were summarized in Tables 1 and 2 .The values for Ea and A in the N2
environment were 134.78 kJ/mol and 1.2E+09 min-1
respectively, while in the air
environment these values were 100.47 kJ/mol and 5.1E+07 min-1
.
-Non-isothermal experiments
TGA data were analyzed in the range of organic weight loss (10-12%) and
conversion profiles were normalized from zero to one. The temperature at which the
weight derivative starts to rise was chosen as the zero conversion point, and the
temperature at which the weight derivative returned to the base line was the end point
(complete conversion of the organic part). Four different methods were used to derive
the kinetic parameters. For the same sample, the goodness of the fit and the values of the
kinetic parameters differ depending on the mathematical method used. For example, the
activation energies derived from four different methods in the N2 environment were: 74-
147 kJ/mol for the differential method, 89-189 kJ/mol for the integral method, 106-233
kJ/mol for the Friedman approach, and 78 kJ/mol for the maximum rate method.
The air data were analyzed with all non-isothermal methods for both the single
step and two step mechanisms. The choice of the mechanism depends on the method of
analysis employed. For example, the differential method produced a better fit than the
integral method for the two step concept, while the opposite trend was observed for the
single step mechanism. The maximum rate method was applied to air data for both peaks

G-40
separately, and the resultant analysis indicates that the activation energy is greater for the
first reaction (182.5 kJ/mol) than the second reaction (143 kJ/mol).
In the air environment, observation of two peaks in the TGA data is not enough
information to propose a mechanism. It is also necessary to identify the composition of
the intermediates and their series and parallel reaction combinations. Thus, in the next
phase of the project, the air data will be re-analyzed after performing additional core
sample experiments and composition analysis of intermediates and products at different
temperatures.
The pyrolysis kinetic parameters determined using the non-isothermal analysis
vary depending on the method used. The activation energies at different heating rates
from differential and integral methods (Figure 27) increase with heating rate from
0.5oC/min to 20
oC/min with a slight decrease at 50
oC/min. It has been argued in the
literature that these conventional approaches are not appropriate for finalizing the
activation energies for the intrinsic decomposition of complex materials such as
kerogen[26-28]
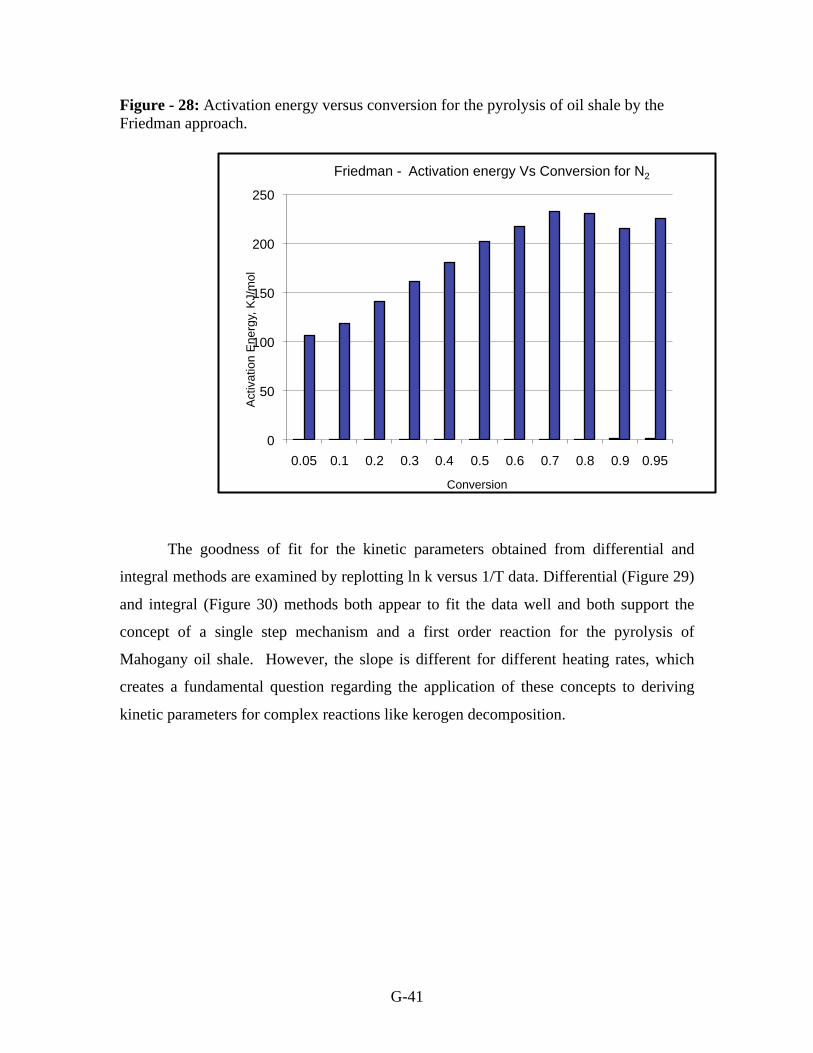
. The conversion-based Friedman approach for pyrolysis, which falls within
the general category of isoconversion methods, shows an increase in activation energy
with conversion followed by a decrease after 70 % conversion (Figure-28).
Figure - 27: Activation energies for the pyrolysis of oil shale using conventional
methods.
Activation E
nerg
y, K
J/m
ol
Heating rate oC/min
Activation energy Vs Heating rate - N2
G-41
Figure - 28: Activation energy versus conversion for the pyrolysis of oil shale by the
Friedman approach.
The goodness of fit for the kinetic parameters obtained from differential and
integral methods are examined by replotting ln k versus 1/T data. Differential (Figure 29)
and integral (Figure 30) methods both appear to fit the data well and both support the
concept of a single step mechanism and a first order reaction for the pyrolysis of
Mahogany oil shale. However, the slope is different for different heating rates, which
creates a fundamental question regarding the application of these concepts to deriving
kinetic parameters for complex reactions like kerogen decomposition.
0
50
100
150
200
250
0.05 0.1 0.2 0.3 0.4 0.5 0.6 0.7 0.8 0.9 0.95
Activation E
nerg
y, K
J/m
ol
Conversion
Friedman - Activation energy Vs Conversion for N2

G-42
Figure - 29: Goodness of the fit using the differential method – pyrolysis.
Figure - 30: Goodness of the fit using the integral method – pyrolysis.
The isoconversion methods are specifically designed to address deficiencies in
variable heating rate analyses. The kinetic parameters derived in this work are consistent
lnK
1/T, kelvin
lnK vs 1/T fitness test for differential method - N2
lnK
1/T, kelvin
lnK vs 1/T fitness test for integral method - N2

G-43
with those observed by others for Green River oil shale. In these types of distributions,
there is typically a linear relationship between logarithm of A and Ea. The Friedman
distribution provides a relationship with the best linear fit (Figure 31).
Figure - 31: Tradeoff between activation energy and pre-exponential factor for the
pyrolysis kinetic data obtained by the Friedman approach.
Comparison of the Kinetics Data with Previously Published Studies
A wide range of activation energies have been reported for the pyrolysis of Green
River oil shale from Colorado and Utah. Published values for kinetic parameters values
are based on both the single and two step mechanisms. Reported activation energies for
pyrolysis with the single step assumption are 85.69 kJ/mol[2]
, 219.4 kJ/mol [5]
and 213.18
kJ/mol.[29]
When a two-step mechanism was used, the reported activation energy for the
first step is 44.6 kJ/mol and for the second step is 177.7 kJ/mol.[4]
Leavitt et al. (1987)
[30] proposed the two parallel reactions theory of the kerogen decomposition and obtained
activation energies of 191.02 kJ/mol (above 350oC) and 86.94 kJ/mol (below 350
oC). The
activation energies using single step isothermal or nonisothermal conventional kinetic
analyses obtained in this study range from about 80-200 kJ/mol. These values are
consistent with those reported earlier.
y = 0.1683x - 1.0901
R = 0.99832
0
5
10
15
20
25
30
35
40
45
0 50 100 150 200 250
ln(
A)
Aactivation energy (Ea)
ln(A )= a +b(Ea) (Friedman - N2)

G-44
In a series of papers, Burnham et al. established that for a material as complex as
kerogen, distribution of activation energy models (isoconversion methods) are most
logical, both physically and from the point of view of mathematical fits (see [26]). For
Kuskerite shales, considered a “standard” because of reproducibility, the activation
energies ranged from 210-234 kJ/mol. The values of activation energies reported in this
work of about 110-233 kJ/**mol are slightly lower at lower conversions. The data are
reproducible and the models fit the data well.
Core Sample Pyrolysis
The experimental conditions and oil yields obtained during pyrolysis experiments
of cylindrical oil shale core samples (3/4” diameter and 9” long) were summarized in
Table 5. The amount of the vapor condensate (yield of shale oil) in the condensers and
the total weight loss increased with increasing temperature. Experiment 8, carried out at
200oC for 7 days, produced no observable shale oil in the condensers. Experiment 7, with
a low heating rate (1oC/min) and a final temperature of 400
oC, produced the maximum
amount of recoverable oil (11.91% of total oil shale).
Chromatograms of the shale oils, produced at different isothermal temperatures
and collected without further treatment, are shown in Figures 32 and 33. It is seen that oil
compositions shift toward lighter carbon numbers as the isothermal pyrolysis temperature
increases. The ASTM standard sample was used to obtain the retention time for the
normal alkanes (SIMDIS analysis). Based on this information, chromatograms were
classified and quantified in terms of normal alkanes, non-normal alkanes and residue.

G-45
Figure – 32: Chromatographs for produced oil from pyrolysis of core samples at
different temperatures.
Figure – 33: Comparison of the chromatographs for produced oil from pyrolysis of core
samples at different temperatures (shift towards lighter components at higher
temperature). The ‘4th
Exp’ in the legend stands for the experiment conducted with the
tube reactor (Number 9 in Table 5).

G-46
The percentages of both types of alkanes and of residues for different shale oils
are shown in the Figures 34 and 35 and Table 14. Figure 36 shows the chromatogram and
SIMDIS analysis for experiment 7.
Table 14. Percents of n-alkane, non-n-alkane and residue in oil samples.
Figure – 34: Normal alkanes, non-normal alkanes and residue % in the oil samples –
Set_1.
Expt no Temperature oC Residue% non_n_alkane % n_alkane% Total
1 300 oC 7.85 41.22 51.01 100.09
2 350 oC 30.43 33.35 35.61 99.40
3 400 oC 21.69 35.80 42.54 100.04
4 300 oC 13.87 36.65 49.51 100.05
5 350 oC 14.15 39.56 46.38 100.10
6 400 oC 18.07 39.88 42.14 100.11
4th
Expt 450 oC 36.02 33.39 30.76 100.17
7 400
oC
(1oC/min)
11.77 39.24 48.99 99.90

G-47
Figure – 35: Normal alkanes, non-normal alkanes and residue % in the oil samples –
Set_2.
Figure – 36: Chromatogram and normal alkanes, non-normal alkanes and residue % in
the oil sample from pyrolysis of core at 1oC/min.

G-48
Two data sets with compositional comparisons are plotted in Figure 37. The
second data set shows that more residue (C60+) was observed at higher temperatures
(13.87%@300oC, 18.07%@400
oC). In addition, the second data set shows alkane to non-
alkane ratios decrease as temperature increases. No clear trend is present in the first set.
We believe the second set is more representative of the trends that are expected
compositionally. The analyses are being repeated to verify the trends.
Figure - 37: Percents of n-alkane, non-n-alkane and residue in shale oil samples
produced at different temperatures.
One of the objectives of this project was to determine if the products of pyrolysis
are significantly different when the shale has been in contact with water for several days.
An expanded chromatogram of the products from hydrous pyrolysis is shown in Figure
38. In this experiment, the core was soaked in water for 24 hours prior to the pyrolysis
run (conducted at 400°C). The figure shows alkene-alkane pairs starting at carbon
number 10. Alkenes are not present in crude oils. A similar chromatogram of the non-
hydrous pyrolysis sample is shown in Figure 39. There is no discernible difference in the
composition of the two samples.

G-49
Figure - 38: Expanded chromatogram of a product from hydrous (24 hours water
soaked) pyrolysis.
Figure – 39: Expanded chromatogram of a product from non- hydrous pyrolysis.

G-50
Further GC-MS analysis revealed the presence of a number of aromatic
homologous series in the oils (Figure 40). These aromatic species are likely to have
higher solubilities in water. We are following up on the implications of these findings in
our examination of the pyrolysis process on water compositions of surrounding aquifers.
Figure – 40: GC-MS chromatogram (TIC) of a product from hydrous pyrolysis (24
hours water soaked).
The non-isothermal TGA curves for Asphalt Ridge oil sand pyrolysis at 10oC/min
(31.474 mg of original sample) and 20oC/min (31.478 mg of original sample) are shown
in Figure 41. There is a continuous weight loss with temperature increase from 100oC to
650oC. The weight derivative data show four significant peaks over the 1000
oC
temperature range. The first peak may correspond to the presence of water in the sample
(however, this peak starts at near 1000C and spreads to 350
oC). The curves indicate that
the nature of pyrolysis with oil sands is different from oil shale. More detailed
comparison of these two feedstocks was deferred to the next phase of the project.

G-51
Figure – 41: Non-isothermal TGA curves for Asphalt Ridge oil sand pyrolysis at
10oC/min (31.474 mg) and 20
oC/min (31.478 mg) heating rates.
Summary
In this work, TGA data on the Mahogany oil shale from Utah and yields and
compositions of oils obtained by pyrolyzing oil shale cores at various temperatures were
reported. The TGA data was reported for both pyrolysis and combustion processes. The
pyrolysis processes were characterized by single-stage decomposition of kerogen while
the combustion processes were interpreted to consist of two stages. As the heating rate
increased, the maximum decomposition rate for pyrolysis shifted to higher temperatures.
Total organic weight loss was in the 10-12% range. There was no appreciable moisture
in the samples. Kinetic parameters were derived using isothermal experiments and non-
isothermal experiments conducted over a range of heating rates. The parameters were
calculated using a variety of techniques and were found to be in the range reported for
Green River shales from Colorado and for other shales around the world. In the

G-52
interpretation of non-isothermal data, different conventional techniques yielded activation
energies that increased with heating rate. An isoconversion method (Friedman) was used
to obtain a distribution of activation energies with conversion. The distribution obtained
was similar to those reported for other complex materials and for oil shale. In the core
pyrolysis experiments, the yields increased slightly with temperature but more residue
was produced. The alkane/non-alkane ratio also decreased at higher temperatures,
indicating possible secondary cracking and polymerization. Highest yields were obtained
at low heating rates. The pyrolysis behavior of oil sands was observed to be different
from oil shale based on TGA analyses.
In the next phase of this project, simulated distillation analyses of the oils will be
used to create compositional representation of the product. The TGA kinetic model will
be integrated with this information and combined with a heat and mass transfer model to
create a model for pyrolysis in the core. This work will provide a methodology for
scaling up kinetic and compositional data for practical applications (retort modeling or
reservoir modeling).
References
1. “A Thermal Decomposition Study of Colorado Oil Shale”, Hubbard A. B. and
Robinson W. E., Bureau of Mines, Report of Investigations 4744, 1950.
2. “The Direct Production of Low Pour Point and High Gravity Shale Oil”, George R.
H., Duane J. J., Lowell M. and Dougan J. L., Symposium on Pyrolysis Reaction of
Fossil Fuels. 1966.
3. “Shale Oil Development: Kinetics of Oil Shale Pyrolysis”, Allred V. D., Chemical
Engineering Progress, Vol. 62, N0. 8. 1966.
4. “Oil Shale Pyrolysis: Kinetics and Mechanism of Oil Production”, Braun R. L. and
Rothman A. J., Fuel, Vol.54, 1975.
5. “Kinetics of Oil Generation from Colorado Oil Shale”, Campbell J. H., George H.K.,
and Stout N.D, Fuel, 1978.
6. “Pyrolysis Kinetics for Western and Eastern Oil Shale”, Burnham A. K., Richardson
J. H., and Coburn T. T., Lawrence Livermore National Laboratory, 1982.

G-53
7. “Kinetics of Pyrolysis of Moroccan Oil Shale by Thermogravimetry”, Thakur D. S.,
and Nuttall H. E. Jr., Ind. Eng. Chem. Process Des. Dev., 26, 1987.
8. “Pyrolysis of Oil Shale: Experimental Study or Transport Effects”, Galan M. A. and
Smith J. M., AIChE Journal, Vol. 29, No. 4, 1983.
9. “On the Mechanism of Kerogen Pyrolysis”, Burnham A. K., and Happe J. A., Fuel,
Vol. 63, Issue 10, 1984.
10. “Oil Shale Pyrolysis. 1. Time and Temperature Dependence of Product
Composition”, Charlesworth J. M., Ind. Eng. Process Des. Dev., Vol. 24, No.4, 1985.
11. “Oil Shale Pyrolysis. 2. Kinetics and Mechanism of Hydrocarbon Evolution”,
Charlesworth J. M., Ind. Eng. Process Des. Dev., Vol. 24, No.4, 1985.
12. “High Pressure Pyrolysis of Green River Oil Shale”, Burnham A.K. and Singleton M.
F., Geochemistry and Chemistry of Oil Shale, ACS Symposium, 1983.
13. “Kinetics of Colorado Oil Shale Pyrolysis in a Fluidized-bed Reactor”, Braun R. L.
and Burnham A. K., Fuel, Vol. 65, 1986.
14. “Chemical Reaction Model for Oil and Gas Generation from Type I and Type II
Kerogen”, Braun R. L. and Burnham A. K., Lawrence Livermore National Laboratory,
1993.
15. “Heat of Combustion of Green River Oil Shale”, Muehlbauer M. J. and Burnham
A. K., Ind. Eng. Chem. Process Des. Dev., Vol. 23, 1984.
16. “Kinetics of the Thermal Decomposition of Oil Shale from Puertollano (Spain)”,
Torrente M. C. and Galan M. A., Fuel, 80, 2001.
17. “Study of Different Kinetic Models for Oil Shale Pyrolysis”, Shuyuan L. and
Changtao Y., Fuel Processing Technology, 85, 2003.
18. “Study of Pyrolysis of Oil Shale”, Shuyuan L. and Changtao Y., Fuel, 82, 2003.
19. “Oil Shale Development in China”, Qian J., Wang J. and Shuyuan L.,. Oil Shale,
Vol. 20, No. 3, 2003.
20. “Influence of Process Conditions on the Pyrolysis of Pakistan Oil Shales”,
Williams P. T. and Ahmad N., Fuel, Vol. 78, No. 6. 1999.
21. “Non-isothermal Thermogravimetry and Decomposition Kinetics of two Jordanian
Oil Shales under Different Processing Conditions, Jaber J. O. and Probert S. D, Fuel
Process. Technol., Vol. 63, No. 1, 2000.

G-54
22. “Thermal Analysis” Blazek A., Nostrand Reinhold, London, 1973.
23. Chen W. J. and Nuttall H. E., Paper presented at the 86th
AICHE National Meeting,
Houston, Texas, 1979.
24. “Kinetic Parameters from Thermogravimetric Data”, Coast A. W. and, Redfern J. P,
Nature (London), 201, 1964.
25. Friedman H. L., J. Polym. Sci. Part C, 6, 183, 1964.
26. “Computational Aspects of Kinetic Analysis. Part D: The ICTAC Kinetic Projects –
Multi Thermal-History Model-fitting Methods and their Relation to Isoconversional
Methods “, Burnham A. K., Therochemica Acta., 355, 2000.
27. “The Determination of Activation Energy from Linear Heating Rate Experiments: A
Comparison of the Accuracy of Isoconversion Methods”, Starink M. J.,
Thermochemica Acta., 404, 2003.
28. “A Comparison of Isoconversion and Model-Fitting Approaches to Kinetic
Parameter Estimation and Application Predictions”, Burnham A.K. and. Dinh L.N,
Journal of Thermal Analysis and Calorimetry, 89, 2, 2007.
29. “Comparison of Methods for Measuring Kerogen Pyrolysis Rates and Fitting
Kinetic Parameters”, Burnham A. K., Braun R. L. and Gregg, H. R., Energy & Fuels,
1, 452-458, 1987.
30. “Kerogen Decomposition Kinetics of Selected Green River and eastern U.S. Oil
Shales from Thermal Solution Experiments”, Leavitt D. R., Tyler A. L. and Kafesjian
A. S., Energy & Fuels, 1, 530-525, 1987.