appendix e load testng - bureau of engineeringeng2.lacity.org/whitepoint/ground anchor...
TRANSCRIPT

51-1-10079-034
APPENDIX E
LOAD TESTNG
51-1-10079-034 R01-AE/wp/ADY 51-1-10079-034 E-i
APPENDIX E
LOAD TESTING
TABLE OF CONTENTS
Shannon & Wilson, Inc., Ground Anchor Performance Testing Report, White Point Slope Stabilization, Los Angeles, CA, December 26, 2013.
Shannon & Wilson, Inc., Recommendations for Upper Row Ground Anchor Re-stressing, White Point Slope Stabilization, Los Angeles, CA, June 24, 2014.
Shannon & Wilson, Inc., Ground Anchor Load Testing Report, White Point Slope Stabilization, Los Angeles, CA, June27, 2014.

ALASKA CALIFORNIA COLORADO
FLORIDA MISSOURI OREGON
WASHINGTON
664 WEST BROADWAY GLENDALE, CALIFORNIA 91204-1008818-543-4560 FAX: 818-543-4565 TDD 1-800-833-6388 www.shannonwilson.com 51-1-10079-033
December 26, 2013
Mr. Gene Edwards Geotechnical Engineering Group Department of Public Works, City of Los Angeles 1149 S. Broadway, Suite 120 Los Angeles, CA 90015
RE: GROUND ANCHOR PERFORMANCE TESTING REPORT FOR WHITE POINT SLOPE STABILIZATION, PASEO DEL MAR,SAN PEDRO DISTRICT, LOS ANGELES, CALIFORNIA
Dear Mr. Edwards:
This letter summarizes the performance testing for the ground anchors constructed for slope stabilization at the above-referenced site. This letter refers to our previous conclusions and recommendations described in the following White Point Landslide correspondence with the City of Los Angeles Bureau of Engineering:
Final Addendum Geotechnical Report No. 2, April 17, 2013 (Add-2 Report)
Ground Anchors Plan prepared by Wagner Engineering & Survey, Inc. dated June 7, 2013 (Project Plans)
Field Activity Reports (FARs) 11 to 32 (Anchor FARs)
The work had been performed in accordance with our Add-2 Report and Project Plans. We prepared this letter report to summarize our findings and recommendations for the remaining production ground anchors for the project. The contractor installing the ground anchors is Hayward Baker, Inc. (HBI).
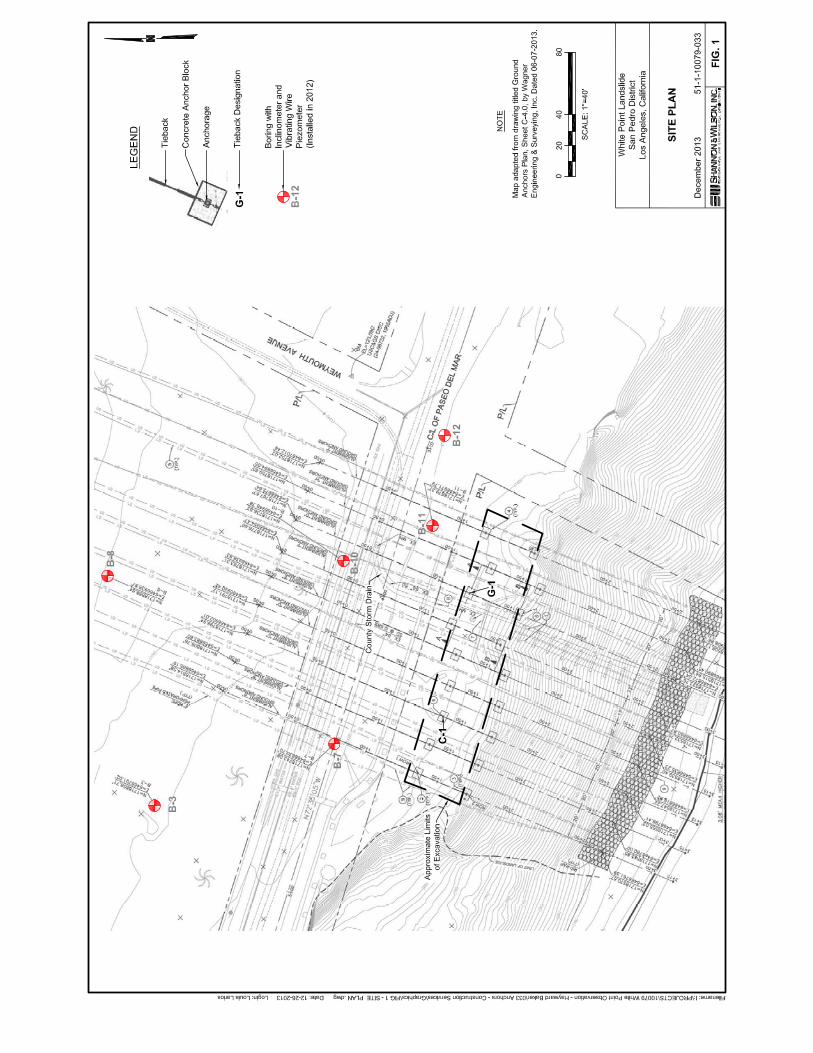
HBI installed two ground anchors, identified as C-1 and G-1, in November and December of 2013. The location of the two ground anchors is shown on the Site Plan, Figure 1. The design load on the anchor is 210 kips. Each anchor consists of 6 seven-wire strands designed in accordance with ASTM International (ASTM) A416 (Standard Specification for Steel Strand, Uncoated Seven-Wire, Stress-Relieved Strand for Prestressed Concrete). Each anchor incorporates the PTI Class I double corrosion protection (highest protection). The wedge plates

Mr. Gene Edwards Department of Public Works December 26, 2013 Page 2 of 3
51-1-10079-033 L05/wp/lkn 51-1-10079-033
are electro-zinc coated per ASTM B633. The bearing plates, trumpets, and steel end caps are hot dip galvanized per ASTM A153. The diameter of the grout hole is approximately 6 inches. The anchor inclination is approximately 45 degrees from horizontal. The total anchor lengths are approximately 165 feet, with a bonded length of approximately 35 feet into the Altamira Shale bedrock. Details of the ground anchor construction are provided in the Anchor FARs.
HBI completed the ground anchor performance test program on December 19, 2013. Testing was performed in accordance with the plans and specifications. Test loads were measured with the pressure gauge, the load cell and the uppermost Dyna Force sensor installed on the strand 40 feet below the anchorage in the free stressing (unbonded) zone. The anchor elongations were measured by dial gauges to the nearest 0.001 inch.
A summary of the ground anchor performance testing results are presented in the enclosed figures:
Figure 2 – Relationship between Loads vs. Elastic Elongations, Ground Anchor G-1 Figure 3 – Relationship between Loads vs. Elastic Elongations, Ground Anchor C-1 Figure 4 – Relationship between Creep Movements vs. Time
The tests were successful. The ground anchors held the required test loads without failure. The measured elastic elongations at the maximum test load exceeded 80 percent of the theoretical elastic elongations of the strand unbonded length. The creep movements at the maximum test load were within acceptable tolerance of 0.04 inch in 10 minutes. Therefore, it is our opinion that the anchor configurations (e.g., bonded length, grout diameter, strands, etc.) shown in the Project Plans are adequate.


ALASKA CALIFORNIA
COLORADO FLORIDA
MISSOURI OREGON
WASHINGTON WISCONSIN
664 WEST BROADWAY GLENDALE, CALIFORNIA 91204-1008818-543-4560 FAX: 818-543-4565 TDD 1-800-833-6388 www.shannonwilson.com 51-1-10079-033
June 24, 2014
City of Los Angeles Bureau of Engineering 1149 South Broadway Street, Suite 120 Los Angeles, California 90015
Attn: Mr. Gene Edwards
RE: RECOMMENDATIONS FOR UPPER ROW GROUND ANCHOR RE-STRESSING, GROUND ANCHOR CONSTRUCTION, WHITE POINT SLOPE STABILIZATION, PASEO DEL MAR, SAN PEDRO DISTRICT, LOS ANGELES, CALIFORNIA
This letter summarizes our review of field instrumentation data and recommendations for re-stressing of the ground anchor in the upper row (designated anchors A-1 through I-1) as shown in Figure 1. Tensioning of the ground anchors in the lower row (designated anchors A-2 through I-2), completed between June 11 and 17, 2014, could result in redistribution of stresses in the upper row of ground anchors. We used our field instrumentation to monitor the potential for stress redistribution, which consists of the following:
Monitoring of tension forces in anchors C-1 and G-1 with Dyna Force sensors between December 19, 2013 and June 23, 2014;
Monitoring of slope movements with inclinometers at Borings B-7, B-10, B-11 and B-12 between April 29, 2013 and June 23, 2014;
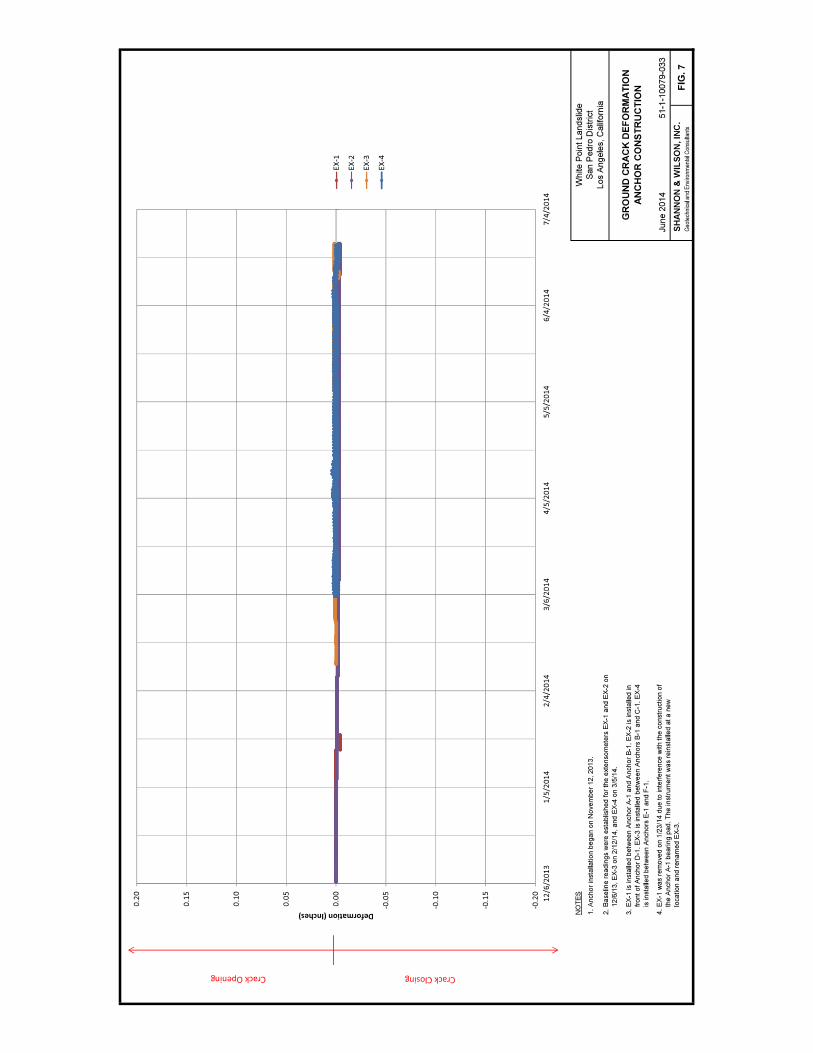
Monitoring of ground crack deformations with extensometers EX-1 thru EX-4 between December 6, 2013 and June 23, 2014.
Dyna Force Sensors
A detail and results of Dyna Force sensor readings are shown in Figure 2 and Table 1, respectively. From our baseline reading, the losses of tension force in the anchors C-1 and G-1 are 8 percent and 2 percent, respectively. The plan and specifications has specified the lock-off load to be typically 10 percent greater than the design load of 210 kips to account for seating loss and long-term relaxation of anchor. The tension forces have been measured from Dyna Force sensors installed in one of six strands in each anchor. We assumed the load distributed equally on each strands and the total anchor load was equal to six times of the measured values in one
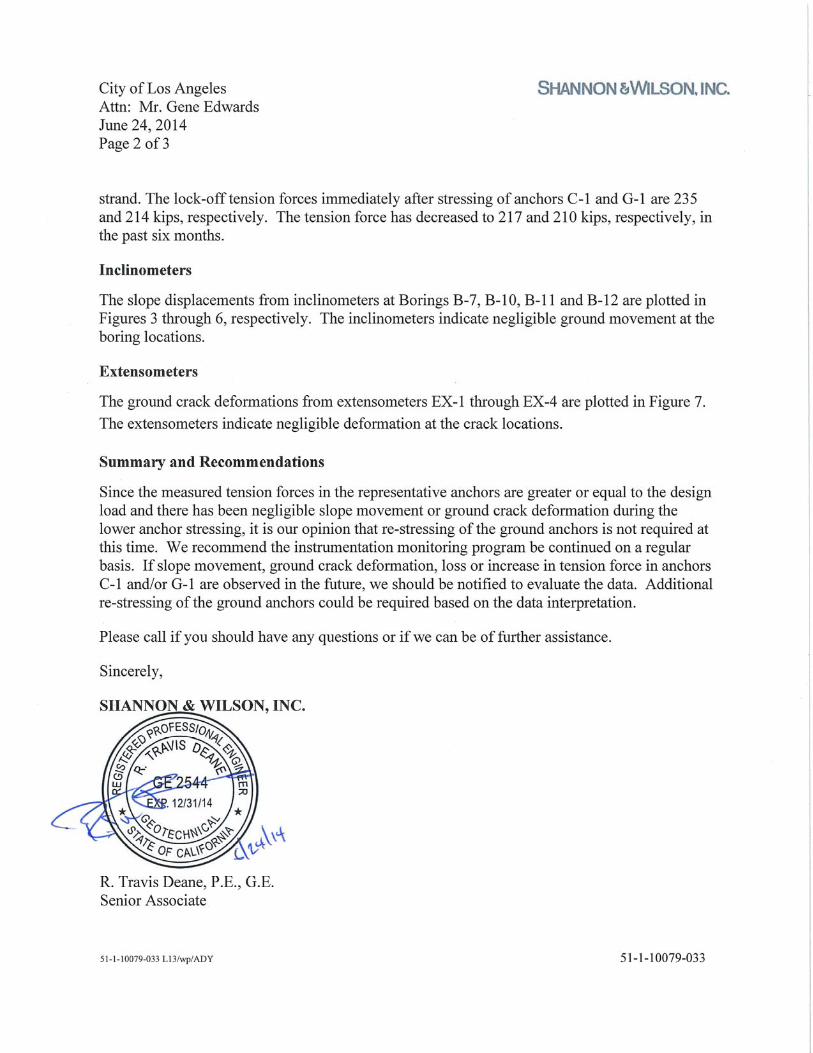

City of Los Angeles Attn: Mr. Gene Edwards June 24, 2014 Page 3 of 3
51-1-10079-033 L13/wp/ADY 51-1-10079-033
NXN:RTD:TMG/nxn
Enc: Table 1 – Dyna Force Sensor Readings Figure 1 – Site Plan Figure 2 – Dyna Force Sensor Details Figure 3 – Cumulative Displacement at Boring B-7 Figure 4 – Cumulative Displacement at Boring B-10 Figure 5 – Cumulative Displacement at Boring B-11 Figure 6 – Cumulative Displacement at Boring B-12 Figure 7 – Ground Crack Deformations

White Point LandslideCity of Los Angeles
Table 1 DynaForce Sensor Readings Shannon & Wilson, Inc.
Sensor IDCable No.
kips Temp. °F kips Temp. °F kips Temp. °F kips Temp. °F kips Temp. °F kips Temp. °F kips Temp. °F12/19/2013 39.6 NR 39.2 NR 39.1 NR 38.8 NR 2.3 NR 0.0 NR 0.0 NR
1/20/2014 35.4 NR 36.3 NR 37.8 NR 37.1 NR 5.2 NR 0.0 NR 0.2 NR1/29/2014 35.5 NR 36.3 NR 37.8 NR 37.1 NR 5.2 NR 0.0 NR 0.1 NR2/24/2014 35.1 73 36.1 73 37.8 73 37.1 74 5.3 74 0.0 75 0.0 742/25/2014 35.1 73 36.0 73 37.7 73 37.1 74 5.4 74 0.1 75 0.1 742/26/2014 34.9 73 36.0 72 37.7 72 37.2 74 5.3 73 0.1 74 0.1 732/27/2014 34.9 73 35.9 73 37.8 73 37.2 74 5.4 74 0.1 75 0.2 75
3/3/2014 34.8 NR 35.7 NR 37.6 NR 37.0 NR 5.3 NR 0.0 NR 0.0 NR3/5/2014 34.8 73 35.7 72 37.7 73 37.2 73 5.3 73 0.0 73 0.1 74
3/21/2014 34.7 73 35.5 72 37.7 73 37.1 73 5.3 73 0.9 87 0.1 743/25/2014 34.8 73 35.7 72 37.7 72 36.8 73 5.7 73 3.3 90 0.8 74
4/3/2014 34.7 73 35.6 72 37.6 72 36.8 73 5.4 73 2.1 84 0.4 744/10/2014 34.7 73 35.7 72 37.8 73 37.0 73 5.4 73 2.3 88 0.3 744/18/2014 34.7 73 35.7 72 37.8 72 36.9 73 5.4 73 1.4 78 0.1 744/25/2014 34.7 73 35.6 73 37.7 72 36.9 73 1.0 73 1.6 82 0.1 744/28/2014 34.7 73 35.6 72 37.7 72 36.9 73 5.4 73 1.7 83 0.1 74
5/1/2014 34.6 73 35.5 72 37.5 72 36.8 73 5.3 73 1.3 80 0.0 745/6/2014 34.7 73 35.5 72 37.8 72 36.8 73 5.3 73 1.2 77 0.0 74
5/16/2014 34.8 73 35.4 72 37.6 72 36.9 73 5.3 73 1.1 76 0.0 746/12/2014 34.7 73 35.5 72 37.6 72 36.9 73 5.3 73 1.5 82 0.0 746/17/2014 34.5 73 35.4 72 37.6 72 36.9 73 5.3 73 1.0 76 0.0 746/23/2014 34.5 73 35.3 72 37.6 72 36.9 73 5.3 73 0.9 74 0.1 74
Sensor IDCable No.
kips Temp. °F kips Temp. °F kips Temp. °F kips Temp. °F kips Temp. °F kips Temp. °F kips Temp. °F12/19/2013 34.5 NR 35.3 NR 36.2 NR 36.6 NR 20.2 NR 0.0 NR 0.0 NR
1/20/2014 34.4 NR 35.3 NR 36.1 NR 36.6 NR 20.3 NR 0.2 NR 0.0 NR1/29/2014 34.3 NR 35.4 NR 36.2 NR 36.5 NR 20.3 NR 0.3 NR 0.0 NR2/24/2014 33.9 71 35.3 71 36.1 72 36.3 73 20.3 73 0.3 73 0.0 732/25/2014 33.9 71 35.4 71 36.1 72 36.4 73 20.3 73 0.3 73 0.0 732/26/2014 33.8 71 35.4 71 36.1 72 36.4 73 20.3 73 0.3 73 0.1 732/27/2014 33.8 71 35.4 71 36.1 72 36.3 73 20.3 73 0.3 73 0.0 73
3/3/2014 37.4 NR 31.4 NR 36.1 NR 36.2 NR 20.3 NR 0.2 NR 0.0 NR3/5/2014 33.6 71 35.0 71 36.1 72 36.3 73 20.3 73 0.2 73 0.0 73
3/21/2014 33.4 70 35.0 71 36.1 72 36.2 73 20.3 73 0.3 73 0.0 733/25/2014 33.5 70 35.0 71 36.1 72 36.4 73 20.7 73 0.6 73 0.1 73
4/3/2014 33.4 70 34.9 71 36.1 72 36.3 72 20.5 73 0.5 73 0.2 734/10/2014 33.5 70 34.8 71 36.1 72 36.3 73 20.5 73 0.5 73 0.2 734/18/2014 33.4 70 34.8 71 36.1 72 36.4 73 20.6 73 0.5 73 0.1 734/25/2014 33.4 70 34.8 71 36.0 72 36.4 72 20.5 73 0.4 73 0.1 73
5/1/2014 33.3 70 34.8 71 35.9 72 36.3 72 20.4 73 0.3 73 0.0 735/6/2014 33.4 70 34.8 71 36.0 72 36.4 73 20.4 73 0.3 73 0.0 73
5/16/2014 33.2 70 34.6 71 35.9 72 36.4 73 20.3 73 0.3 73 0.0 736/12/2014 33.2 70 34.7 71 36.0 72 36.3 72 20.3 73 0.3 73 0.0 736/17/2014 33.2 70 34.7 71 36.1 72 36.5 73 20.4 73 0.3 73 0.1 736/23/2014 33.1 70 34.6 71 36.0 72 36.3 72 20.3 73 0.3 73 0.0 73
Notes: NR=Not Recorded
G15
D12
E13
F14
A9
B10
C11
Anchor C 1Tension Force in Anchor Strand (kips)
Anchor G 1Tension Force in Anchor Strand (kips)
A1
B2
C3
D4
E5
F6
G7
Dyna Force Table updated 06 23 14 6/24/2014 51 1 10079 033
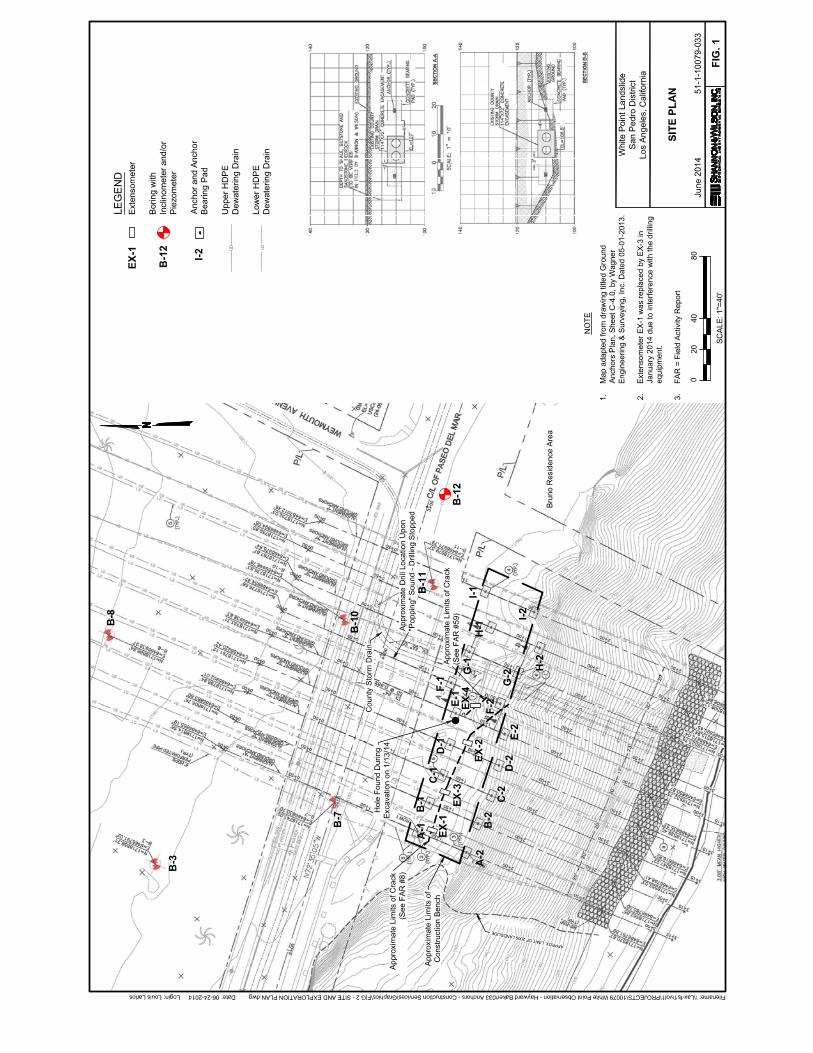

FIG. 2
DYNA FORCE SENSOR DETAILS
51-1-10079-033
White Point LandslideSan Pedro District
Los Angeles, California
June 2014
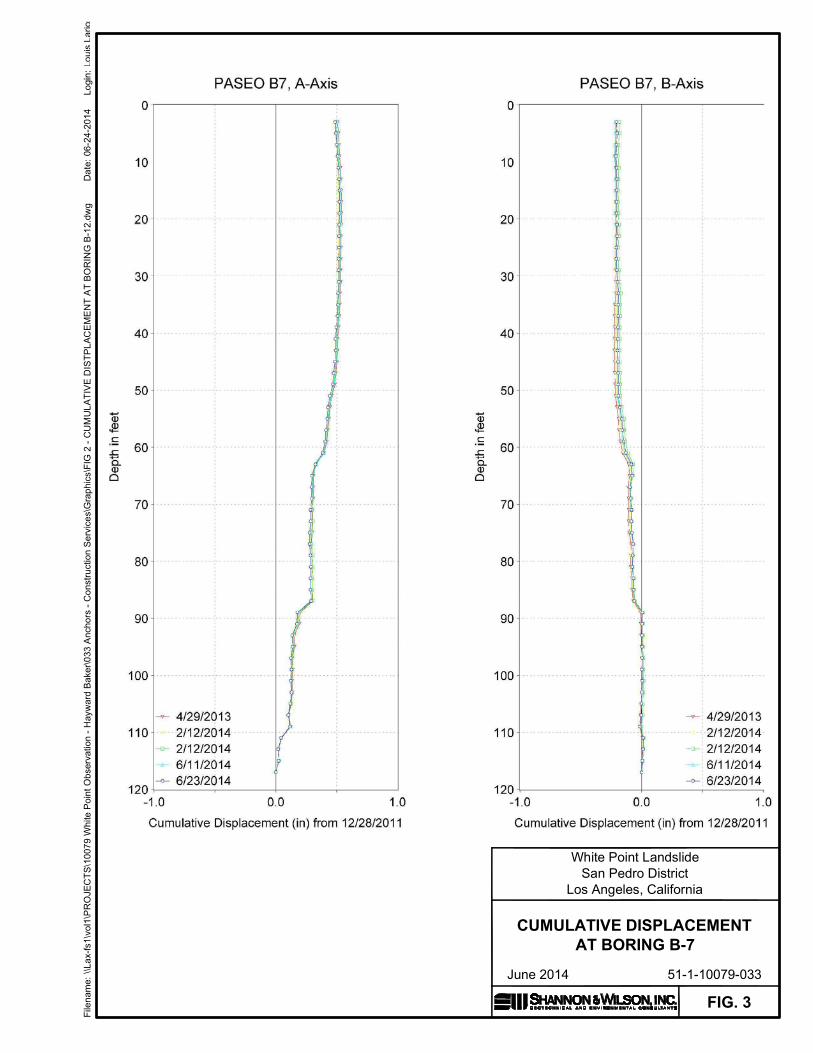
FIG. 3
CUMULATIVE DISPLACEMENTAT BORING B-7
51-1-10079-033
White Point LandslideSan Pedro District
Los Angeles, California
June 2014

FIG. 4
CUMULATIVE DISPLACEMENTAT BORING B-10
51-1-10079-033
White Point LandslideSan Pedro District
Los Angeles, California
June 2014

FIG. 5
CUMULATIVE DISPLACEMENTAT BORING B-11
51-1-10079-033
White Point LandslideSan Pedro District
Los Angeles, California
June 2014

FIG. 6
CUMULATIVE DISPLACEMENTAT BORING B-12
51-1-10079-033
White Point LandslideSan Pedro District
Los Angeles, California
June 2014

ALASKA CALIFORNIA COLORADO
FLORIDA MISSOURI OREGON
WASHINGTON WISCONSIN
664 WEST BROADWAY GLENDALE, CALIFORNIA 91204-1008818-543-4560 FAX: 818-543-4565 TDD 1-800-833-6388 www.shannonwilson.com 51-1-10079-033
June 27, 2014
Mr. Gene Edwards Geotechnical Engineering Group Department of Public Works, City of Los Angeles 1149 S. Broadway, Suite 120 Los Angeles, CA 90015
RE: GROUND ANCHOR LOAD TESTING REPORT FOR WHITE POINT SLOPE STABILIZATION, PASEO DEL MAR, SAN PEDRO DISTRICT, LOS ANGELES, CALIFORNIA
Dear Mr. Edwards:
This letter summarizes load testing for the ground anchors constructed for slope stabilization at the above-referenced site. This letter refers to our previous conclusions and recommendations described in the following White Point Landslide correspondence with the City of Los Angeles Bureau of Engineering:
Final Addendum Geotechnical Report No. 2, April 17, 2013 (Add-2 Report);
Ground Anchors Plan prepared by Wagner Engineering & Survey, Inc., dated June 7, 2013 (Project Plans);
Ground Anchor Performance Test Report, dated December 26, 2013;
Field Activity Reports (FARs) 11 to 113 (Anchor FARs), November 2013 through June 2014.
Our services have been performed in general accordance with our Add-2 Report and Project Plans. We prepared this letter report to summarize our findings for the ground anchor testing. The contractor, Hayward Baker, Inc. (HBI), installed the ground anchors.
HBI installed 18 ground anchors, in two rows from November 12, 2013 to June 17, 2014. The anchors are identified by column with letters A through I and then row placement is denoted by numbers 1 (upper row) and 2 (lower row). The locations of the ground anchors are shown on the Site Plan, Figure 1. The design load on each anchor is 210 kips. Each anchor consists of 6 seven-wire strands designed in accordance with ASTM International (ASTM) A416 (Standard

Mr. Gene Edwards Department of Public Works June 27, 2014 Page 2 of 3
51-1-10079-033 L14/wp/nxn 51-1-10079-033
Specification for Steel Strand, Uncoated Seven-Wire, Stress-Relieved Strand for Prestressed Concrete). Each anchor incorporates the PTI Class I double corrosion protection (highest protection). The wedge plates are electro-zinc coated per ASTM B633. The bearing plates, trumpets, and steel end caps are hot dip galvanized per ASTM A153. The diameter of the grout hole is approximately 6 inches. The anchor inclination is approximately 45 degrees from horizontal. The total anchor lengths are approximately 165 and 160 feet, for the upper and lower row anchors, respectively. The bonded length is approximately 35 feet into the Altamira Shale bedrock. Details of the ground anchor construction are provided in the Anchor FARs.
HBI conducted the ground anchor proof testing program between February 24 and 27, 2014 for the upper anchor row and between June 11 and 17, 2014 for the lower anchor row. Testing was performed in accordance with the plans and specifications. Two performance tests for the pre-production anchors were completed at Anchors C-1 and G-1 on December 19, 2013. Test loads were measured with the pressure gauge and a load cell. In addition, Dyna Force sensors were installed in Anchor C-1 and G-1 to monitor the test loads in the anchors. The anchor elongations were measured by dial gauges to the nearest 0.001 inch. The displacements of the reinforced concrete bearing pad were measured by a digital gauge to the nearest 0.001 inch.
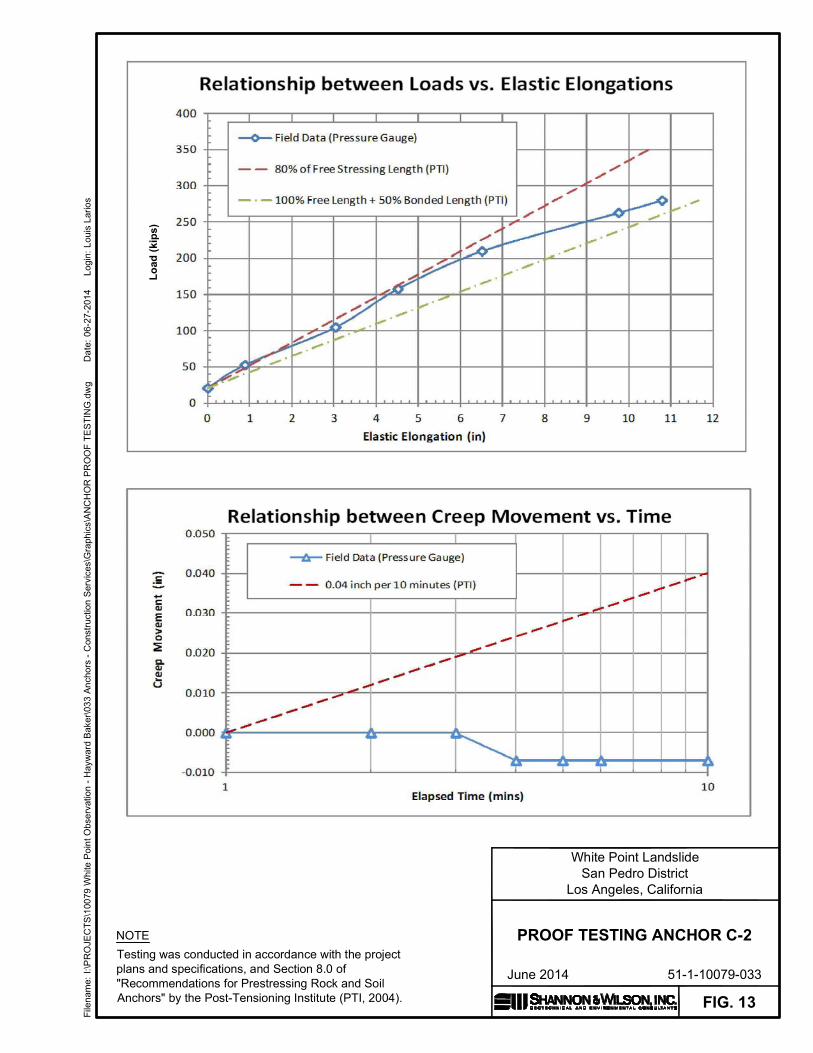
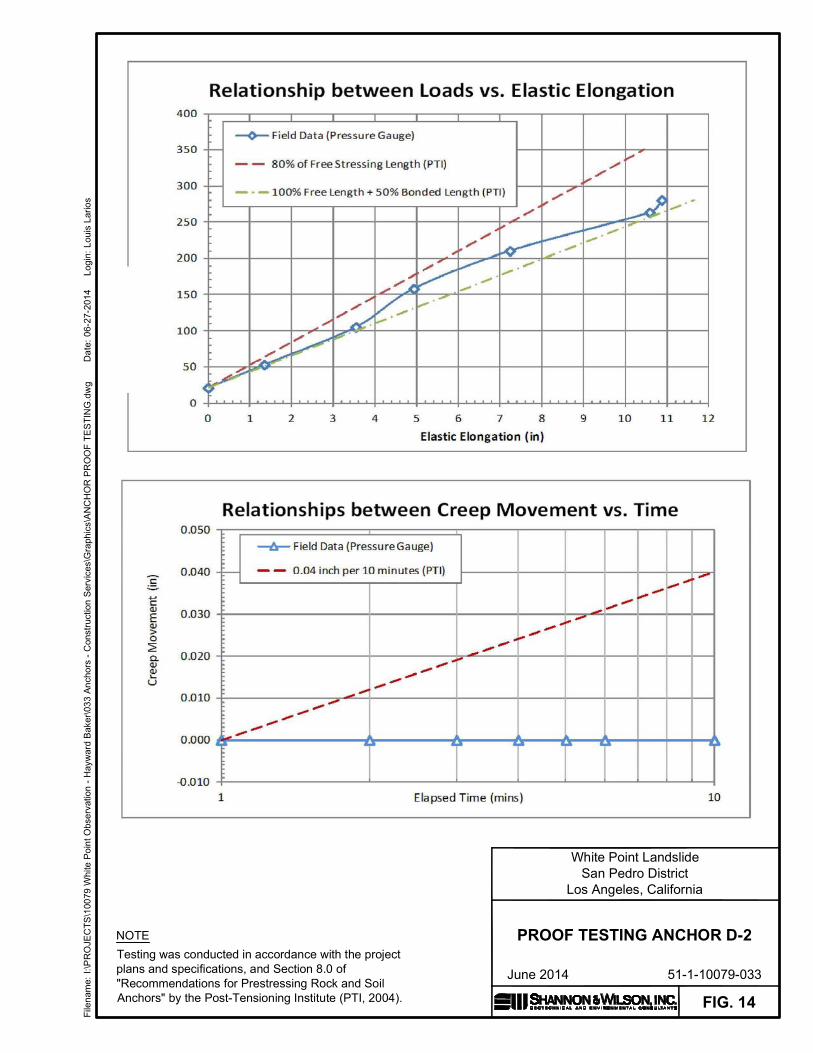
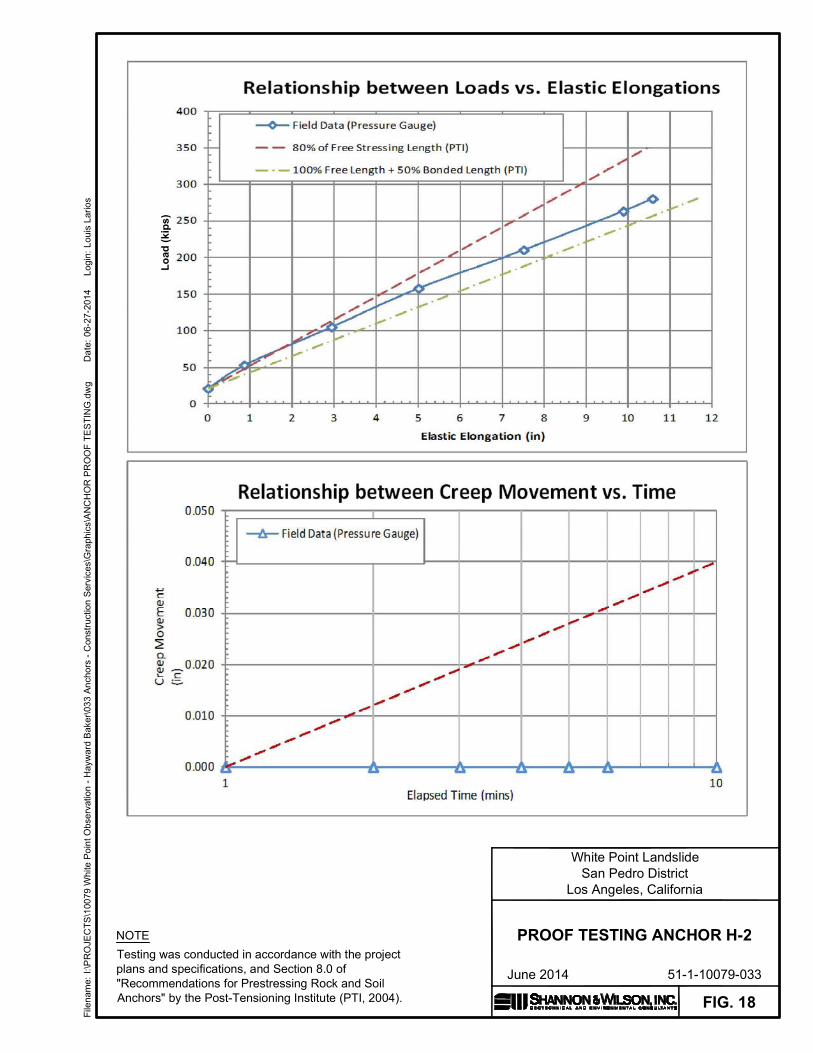
A summary of the 18 ground anchor load testing results are presented in Figures 2 through 19.The ground anchors held the required test loads without excessive deformation per the Plans and Specifications. The measured elastic elongations at the maximum test load exceeded 80 percent of the theoretical elastic elongations of the strand unbonded length (lower limit). The measured elastic elongations at maximum test load did not exceed 100 percent of the theoretical elastic elongations of strand unbonded length plus 50 percent of the theoretical elastic elongations of strand bonded length (upper limit). These limits are given in Section 3.04-E of the Plans and Specifications.
The creep movements at the maximum test load were within acceptable tolerance of 0.04 inch in 10-minute holding duration per Section 3.04-E of the Plans and Specifications. A positive value of creep indicated elongation of anchor and the negative value indicated shortening of anchor. A second proof test was performed on Anchor D-1 since the maximum test load was not maintained for the load hold duration of 10 minutes due to equipment malfunction (jack pressure loss). The creep movements at the maximum test load for Anchor D-1 retesting were within acceptable tolerance of 0.04 inch in 10 minutes. Therefore, it is our opinion that the anchors were installed in accordance with the Project Plans and Specifications.


Testing was conducted in accordance with the projectplans and specifications, and Section 8.0 of"Recommendations for Prestressing Rock and SoilAnchors" by the Post-Tensioning Institute (PTI, 2004).
NOTE
FIG. 2
PROOF TESTING ANCHOR A-1
51-1-10079-033June 2014
White Point LandslideSan Pedro District
Los Angeles, California

Testing was conducted in accordance with the projectplans and specifications, and Section 8.0 of"Recommendations for Prestressing Rock and SoilAnchors" by the Post-Tensioning Institute (PTI, 2004).
NOTE
FIG. 3
PROOF TESTING ANCHOR B-1
51-1-10079-033June 2014
White Point LandslideSan Pedro District
Los Angeles, California

Testing was conducted in accordance with the projectplans and specifications, and Section 8.0 of"Recommendations for Prestressing Rock and SoilAnchors" by the Post-Tensioning Institute (PTI, 2004).
NOTE
FIG. 4
PERFORMANCE TESTINGANCHOR C-1
51-1-10079-033June 2014
White Point LandslideSan Pedro District
Los Angeles, California

Testing was conducted in accordance with the projectplans and specifications, and Section 8.0 of"Recommendations for Prestressing Rock and SoilAnchors" by the Post-Tensioning Institute (PTI, 2004).
NOTE
FIG. 5
PROOF TESTING ANCHOR D-1
51-1-10079-033June 2014
White Point LandslideSan Pedro District
Los Angeles, California

Testing was conducted in accordance with the projectplans and specifications, and Section 8.0 of"Recommendations for Prestressing Rock and SoilAnchors" by the Post-Tensioning Institute (PTI, 2004).
NOTE
FIG. 6
PROOF TESTING ANCHOR E-1
51-1-10079-033June 2014
White Point LandslideSan Pedro District
Los Angeles, California

Testing was conducted in accordance with the projectplans and specifications, and Section 8.0 of"Recommendations for Prestressing Rock and SoilAnchors" by the Post-Tensioning Institute (PTI, 2004).
NOTE
FIG. 7
PROOF TESTING ANCHOR F-1
51-1-10079-033June 2014
White Point LandslideSan Pedro District
Los Angeles, California

Testing was conducted in accordance with the projectplans and specifications, and Section 8.0 of"Recommendations for Prestressing Rock and SoilAnchors" by the Post-Tensioning Institute (PTI, 2004).
NOTE
FIG. 8
PERFORMANCE TESTINGANCHOR G-1
51-1-10079-033June 2014
White Point LandslideSan Pedro District
Los Angeles, California

Testing was conducted in accordance with the projectplans and specifications, and Section 8.0 of"Recommendations for Prestressing Rock and SoilAnchors" by the Post-Tensioning Institute (PTI, 2004).
NOTE
FIG. 9
PROOF TESTING ANCHOR H-1
51-1-10079-033June 2014
White Point LandslideSan Pedro District
Los Angeles, California

Testing was conducted in accordance with the projectplans and specifications, and Section 8.0 of"Recommendations for Prestressing Rock and SoilAnchors" by the Post-Tensioning Institute (PTI, 2004).
NOTE
FIG. 10
PROOF TESTING ANCHOR I-1
51-1-10079-033June 2014
White Point LandslideSan Pedro District
Los Angeles, California

Testing was conducted in accordance with the projectplans and specifications, and Section 8.0 of"Recommendations for Prestressing Rock and SoilAnchors" by the Post-Tensioning Institute (PTI, 2004).
NOTE
FIG. 11
PROOF TESTING ANCHOR A-2
51-1-10079-033June 2014
White Point LandslideSan Pedro District
Los Angeles, California

Testing was conducted in accordance with the projectplans and specifications, and Section 8.0 of"Recommendations for Prestressing Rock and SoilAnchors" by the Post-Tensioning Institute (PTI, 2004).
NOTE
FIG. 12
PROOF TESTING ANCHOR B-2
51-1-10079-033June 2014
White Point LandslideSan Pedro District
Los Angeles, California
Testing was conducted in accordance with the projectplans and specifications, and Section 8.0 of"Recommendations for Prestressing Rock and SoilAnchors" by the Post-Tensioning Institute (PTI, 2004).
NOTE
FIG. 13
PROOF TESTING ANCHOR C-2
51-1-10079-033June 2014
White Point LandslideSan Pedro District
Los Angeles, California
Testing was conducted in accordance with the projectplans and specifications, and Section 8.0 of"Recommendations for Prestressing Rock and SoilAnchors" by the Post-Tensioning Institute (PTI, 2004).
NOTE
FIG. 14
PROOF TESTING ANCHOR D-2
51-1-10079-033June 2014
White Point LandslideSan Pedro District
Los Angeles, California

Testing was conducted in accordance with the projectplans and specifications, and Section 8.0 of"Recommendations for Prestressing Rock and SoilAnchors" by the Post-Tensioning Institute (PTI, 2004).
NOTE
FIG. 15
PROOF TESTING ANCHOR E-2
51-1-10079-033June 2014
White Point LandslideSan Pedro District
Los Angeles, California

Testing was conducted in accordance with the projectplans and specifications, and Section 8.0 of"Recommendations for Prestressing Rock and SoilAnchors" by the Post-Tensioning Institute (PTI, 2004).
NOTE
FIG. 16
PROOF TESTING ANCHOR F-2
51-1-10079-033June 2014
White Point LandslideSan Pedro District
Los Angeles, California

Testing was conducted in accordance with the projectplans and specifications, and Section 8.0 of"Recommendations for Prestressing Rock and SoilAnchors" by the Post-Tensioning Institute (PTI, 2004).
NOTE
FIG. 17
PROOF TESTING ANCHOR G-2
51-1-10079-033June 2014
White Point LandslideSan Pedro District
Los Angeles, California
Testing was conducted in accordance with the projectplans and specifications, and Section 8.0 of"Recommendations for Prestressing Rock and SoilAnchors" by the Post-Tensioning Institute (PTI, 2004).
NOTE
FIG. 18
PROOF TESTING ANCHOR H-2
51-1-10079-033June 2014
White Point LandslideSan Pedro District
Los Angeles, California

Testing was conducted in accordance with the projectplans and specifications, and Section 8.0 of"Recommendations for Prestressing Rock and SoilAnchors" by the Post-Tensioning Institute (PTI, 2004).
NOTE
FIG. 19
PROOF TESTING ANCHOR I-2
51-1-10079-033June 2014
White Point LandslideSan Pedro District
Los Angeles, California