appendix c – trillium line ea addendum supplementary
TRANSCRIPT

Appendix C – Trillium Line EA Addendum Supplementary Terrestrial Information (Ellwood Diamond, Walkley Yard, Bowesville and Limebank) Air Quality Report

TRI_EA-Ax-B-Terrestrial-Supplementary-NE-and-SAR_Rev0 April 5, 2018
Ottawa, Ontario
REPORT
NATURAL ENVIRONMENT & SPECIES AT RISK REPORT – TERRESTRIAL
Ottawa Light Rail Transit Project (Stage 2)
Trillium Line EA Addendum Supplementary Information (Ellwood Diamond, Walkley Yard, Bowesville and Limebank)
Presented to:
City of Ottawa 160 Elgin Street Ottawa, ON K2P P27
Work Package ID: 2.2.3.2
TRI_EA-Ax-B-Terrestrial-Supplementary-NE-and-SAR_Rev0 April 5, 2018

REVISION INDEX
Revision No. Description Issue Date
0 Final April 5, 2018
Prepared by: Bettina Henkelman Date: 02/01/18
Reviewed by: Casey Little Date: 02/09/2018
Approved by: Kelly Roberts Date: 04/05/2018

TRI_EA-Ax-B-Terrestrial-Supplementary-NE-and-SAR_Rev0 April 5, 2018
TABLE OF CONTENTS
1. INTRODUCTION 1
2. TERRESTRIAL HABITAT EXISTING CONDITIONS 22.1 Methodology 22.2 Background 22.3 Field Investigations 8
3. RESULTS OF SPECIES AT RISK SURVEYS 123.1 Ellwood Diamond 123.2 Walkley Yard 163.3 Bowesville Station 183.4 Limebank Extension 24
4. REFERENCES 28
LIST OF TABLES AND FIGURES Table 1: Species at Risk Likely to Occur within the project area ........................................... 3
Figure 1: Butternuts and Potential Cavity Tree within the Ellwood Diamond Project Area ...15
Figure 2: Potential Cavity Trees within the Walkley Yard Project Area ................................17
Figure 3: Potential Cavity Tree Locations and SAR Grassland Bird Habitat within the Bowesville Extension Project Area ......................................................................................22
Figure 4: Potential Cavity Tree Locations and SAR Grassland Bird Habitat within the Bowesville Extension Project Area ......................................................................................23
Figure 5: Terrestrial Features within the Limebank Extension Project Area .........................27
LIST OF ATTACHMENTS Attachment A: Ministry of Natural Resources and Forestry Info Request Response

1
TRI_EA-Ax-B-Terrestrial-Supplementary-NE-and-SAR_Rev0 April 5, 2018
1. INTRODUCTION This report provides background information to the Terrestrial Natural Environment and Species at Risk (SAR) information presented in the Trillium Addendum to the Environmental Project Report (EPR). This addendum is for the following areas:
• Elwood Diamond
• Walkley Yard Maintenance and Storage Facility
• Bowesville Station and Park and Ride
• Limebank Extension
As part of the Ottawa Light Rail Transit (OLRT) Stage 2 project, Capital Transit Partners 2 (CTP2) Morrison Hershfield Limited (MH) was retained by the City of Ottawa to complete a terrestrial Species at Risk impact assessment. The project area falls within the Ministry of Natural Resources and Forestry (MNRF) Kemptville District, as well as the jurisdictional boundaries of the Rideau Valley Conservation Authority (RVCA).
This technical memorandum provides an outline of the terrestrial SAR and SAR habitat existing conditions based on background information and field investigations, as well as an assessment of the potential impacts that could result from the proposed project addendums. It also recommends mitigation measures to protect SAR within and adjacent to the project area. This memorandum was prepared at a 30% level of detail design for the proposed works, therefore, all potential environmental permitting and approvals required for this undertaking will be carried out based on existing design plans. As a result, a final assessment of impacts will be required to ensure that any design changes that may result in new impacts beyond what was assessed at the 30% design are addressed.

2
TRI_EA-Ax-B-Terrestrial-Supplementary-NE-and-SAR_Rev0 April 5, 2018
2. TERRESTRIAL HABITAT EXISTING CONDITIONS
2.1 Methodology
In order to determine the species to consider for the present analysis, background information from a variety of sources and the results of previous studies were reviewed for occurrence records of SAR within 10 km of the project area. The detailed outline of the methodology used for background data collection can be found in Section 2 of the Natural Environment & Species at Risk Report – Terrestrial - Ottawa Light Rail Transit Project (Stage 2) - Confederation Lines West and East and Trillium Line (CTP2, 2017). As well, information related to Environmentally Sensitive Areas (ESA), provincially rare and regionally significant species, provincially Significant Wildlife Habitats, and Natural Heritage Features was gathered from a variety of background resources, and is also documented in Section 2 of the same document.
2.2 Background
Upon review of background sources, a number of SAR were identified as having the potential to occur within or adjacent to the project area. Government documents were then reviewed for detailed information on the habitat requirements of these SAR. These documents included Status Reports, Recovery Strategies, and Management Plans published by the Committee on the Status of Endangered Wildlife in Canada (COSEWIC), the Committee on the Status of Species At Risk in Ontario (COSSARO), Environment and Climate Change Canada (ECCC), and the MNRF. A natural areas and features information request was sent to the MNRF – Kemptville District office on February 24th, 2017 and a response was received on July 18th, 2017. Another Information Request specific to the Bowesville Station and Limebank Extension was sent on November 15th, 2017, and a response was received on January 31st, 2018. These are included in Attachment A.
Once the habitat requirements of these species were identified, the presence of habitat which met these requirements within the project area was verified using a combination of desktop review of aerial imagery and field investigations. Only those species that had suitable habitat present within the vicinity of the project area were considered for 2017 field investigations. A total of 14 species met the habitat availability criteria and are listed in Table 1 (below) together with their federal (under the Species at Risk Act; SARA) and provincial (under the Endangered Species Act, 2007; ESA 2007) statuses, where END – Endangered, *NAR – Not at Risk, **NS – No Status, THR – Threatened, and SC – Special Concern. Other SAR such as Chimney Swift (Chaetura pelagica) and Common Nighthawk (Chordeiles minor) may occur incidentally in the area, however no nesting habitat was observed within the study area, therefore impacts to these species are not expected as a result of this project.

3
TRI_EA-Ax-B-Terrestrial-Supplementary-NE-and-SAR_Rev0 April 5, 2018
• •
•
•
Table 1: Species at Risk Likely to Occur within the project area
Species Name
SAR A
Stat us
ESA 2007
Status Habitat Requirements Background Source
PLANTS Butternut (Juglans cinerea)
END END Grows best on rich, moist, well-drained loams often found on stream bank sites but may be found on well-drained gravelly sites, especially those of limestone origin (COSEWIC, 2003)
Habitat verified during 2017 field surveys
INVERTEBRATES Monarch (Danaus plexippus)
SC SC • Breeding - farmlands, along roadsides and in ditches, open wetlands, dry sandy areas, short and tall grass prairie, river banks, irrigation ditches, arid valleys, south-facing hillsides, and gardens – where Milkweed (Asclepias sp.) grows
• Nectaring (pre-migration) – spatially may overlap with breeding habitat but needs to contain nectar sources such as Goldenrods (Solidago spp.), asters (Doellingeria, Eurybia, Oclemena, and Symphyotrichum spp.), and various clovers (Trifolium spp.) (COSEWIC, 2010a)
Ontario Butterfly Atlas – square 18VR42
HERPETOFAUNA Blanding’s Turtle (Emydoidea blandingii)
THR THR • Primarily shallow water - adults generally found in open or partially vegetated sites, whereas juveniles prefer areas that contain thick aquatic vegetation including sphagnum, water lilies and algae
• Nest in loose substrates - sand, organic soil, gravel and cobblestone
• Overwinter in permanent pools about 1 m deep, or slow flowing streams (COSEWIC, 2005)
Ontario Reptile and Amphibian Atlas - square 18VR42

4
TRI_EA-Ax-B-Terrestrial-Supplementary-NE-and-SAR_Rev0 April 5, 2018
Species Name
SARA
Status
ESA 2007
Status Habitat Requirements Background Source
•
•
• •
• •
•
Eastern Milksnake (Lampropeltis triangulum)
SC *NAR • Open habitats, including rock outcrops and meadows
• Barns, sheds and houses in rural landscapes
• Regions where forest cover is relatively high (COSEWIC, 2014)
Ontario Reptile and Amphibian Atlas - square 18VR42
Eastern Musk Turtle (Sternotherus odoratus)
THR SC • Aquatic except when laying eggs • Shallow, slow-moving water • Diet consists of molluscs and
insects • Hibernates underwater, burying
themselves in mud when the water temperature dips below 100C
• Nests typically in rotting vegetation in sun, but nesting sites are variable (COSEWIC, 2012a)
Ontario Reptile and Amphibian Atlas - square 18VR42
Snapping Turtle (Chelydra serpentina)
SC SC Slow-moving water with soft mud bottom & dense aquatic vegetation - ponds, sloughs, shallow bays or river edges and slow streams, or areas combining several of these wetland habitats (COSEWIC, 2008a)
Ontario Reptile and Amphibian Atlas - square 18VR42
Western Chorus Frog (Pseudacris triseriata)
THR NAR Terrestrial (humid prairie, moist woods, or meadows) and aquatic habitats (seasonally dry, temporary ponds, devoid of predators such as fish) in close proximity (COSEWIC, 2008b)
Presence of habitat verified during 2017 field surveys
AVIFAUNA Bank Swallow (Riparia riparia)
THR THR • Breeds in a wide variety of natural
and artificial sites with vertical banks • Sand-silt substrates are preferred
for excavating nest burrows • Often situated near open terrestrial
habitat used for aerial foraging
Ontario Breeding Bird Atlas - square 18VR41, 18VR42, 18VR51

5
TRI_EA-Ax-B-Terrestrial-Supplementary-NE-and-SAR_Rev0 April 5, 2018
Species Name
SARA
Status
ESA 2007
Status Habitat Requirements Background Source
•
•
•
• Large wetlands used as communal nocturnal roost sites during post-breeding, migration, and wintering periods (COSEWIC 2013a)
Barn Swallow (Hirundo rustica)
THR THR • In and on artificial structures, including barns and other outbuildings, bridges, and road culverts
• Prefer various types of open habitats for foraging, including grassy fields, pastures, various agricultural crops, lake and river shorelines, cleared rights-of-way, farmyards and wetlands (COSEWIC, 2011a)
Ontario Breeding Bird Atlas - square 18VR41, 18VR42, 18VR51
Bobolink (Dolichonyx oryzivorus)
THR THR • Nests in fields of forage crops (e.g., hayfields and pastures dominated by a variety of species such as Clover (Melilotus spp.), Timothy grass (Phleum pratense), Kentucky bluegrass (Poa pratensis), and broad-leaved plants
• Also in various grassland habitats incl. wet prairie, graminoid peatlands, and abandoned fields dominated by tall grasses, remnants of uncultivated, no-till cropland, small-grain fields, restored surface mining sites, and irrigated fields in arid regions (COSEWIC, 2010b)
Ontario Breeding Bird Atlas - square 18VR41, 18VR42, 18VR51
Canada Warbler (Cardellina canadensis)
THR SC • Deciduous, coniferous and mixed forests, with well-developed shrub layer and a structurally complex forest floor; most abundant in moist, mixed forests
• Also occurs in riparian shrub forest on slopes and in ravines, regenerating forest and in old-growth forests with canopy openings
Habitat verified during 2017 field surveys

6
TRI_EA-Ax-B-Terrestrial-Supplementary-NE-and-SAR_Rev0 April 5, 2018
Species Name
SARA
Status
ESA 2007
Status Habitat Requirements Background Source
• •
•
•
and well-developed shrub layer (COSEWIC, 2008c)
Eastern Meadowlark (Sturnella magna)
THR THR Grassland habitats - native prairies and savannas, non-native pastures, hayfields, weedy meadows, herbaceous fencerows and airfields (COSEWIC, 2011b)
Ontario Breeding Bird Atlas - square 18VR41, 18VR42, 18VR51
Eastern Whip-poor-will (Antrostomus vociferus)
THR THR Nesting (summer) - semi-open forests or patchy forests with clearings, such as barrens; regenerating forests following major disturbances; areas with little ground cover; avoids wide-open spaces and closed canopy forests (COSEWIC, 2009)
• Ontario Breeding Bird Atlas - square 18VR51
• Habitat verified during 2017 field surveys
Eastern Wood-pewee (Contopus virens)
SC SC • Mid-canopy layer of forest clearings and edges of deciduous and mixed forests
• Most abundant in intermediate-aged and mature forest stands with little understory vegetation (COSEWIC, 2012b)
Ontario Breeding Bird Atlas - square 18VR41, 18VR42, 18VR51
Grasshopper Sparrow (Ammodramus savannarum pratensis)
SC SC • Open relatively short grassland habitat with relatively sparse cover in areas of poor soils, including alvars, moraines and sand plains; does not favour moist tall grass meadows
• Also human-created hayfields and cereal fields (COSEWIC, 2013c)
• Presence of habitat verified during 2017 field surveys
• Ontario Breeding Bird Atlas - square 18VR41, 18VR51
Short-eared Owl (Asio flammeus)
SC SC • Breeding – large number of open habitats including grasslands, arctic tundra, taiga, bogs, marshes, old pastures, and sand-sage with availability of preferred nesting sites
• Preferred nesting sites – areas of dense grassland, as well as tundra
• eBird – 2013 observation in general area
• Ontario Breeding Bird Atlas - square 18VR41

7
TRI_EA-Ax-B-Terrestrial-Supplementary-NE-and-SAR_Rev0 April 5, 2018
Species Name
SARA
Status
ESA 2007
Status Habitat Requirements Background Source
• •
•
•
•
with areas of small willows; proximity to reliable source of small mammal prey (COSEWIC, 2008d)
Wood Thrush (Hylocichla mustelina)
THR SC Nesting - second-growth and mature deciduous and mixed forests, with saplings and well-developed understory layers; prefers large forest mosaics, but also uses small forest fragments (COSEWIC, 2012c)
Ontario Breeding Bird Atlas - square 18VR41, 18VR42, 18VR51
MAMMALS Eastern Small-footed Bat (Myotis leibii)
**NS END • Spring and summer - roost in or under rocks, in rock outcrops, in buildings, under bridges, or in caves, mines, or hollow trees
• Winter – hibernate in caves and abandoned mines; colder and drier sites than similar bats; high fidelity to hibernacula (Humphrey, 2017)
Ontario Mammal Atlas, 1900-1993
Little Brown Myotis (Myotis lucifugus)
END END • Breeding - summer maternity colonies in buildings or large-diameter trees
• Foraging - over water, along waterways, and forest edges; large open fields or clearcuts generally avoided
• Overwintering - cold and humid hibernacula (caves/mines) (COSEWIC, 2013b)
Ontario Mammal Atlas, 1900-1993
Northern Myotis (Myotis septentrionalis)
END END • Breeding - summer maternity colonies in large-diameter trees; sometimes buildings
• Foraging - gaps in forest; along waterways, forest edges, over
Ontario Mammal Atlas, 1900-1993

8
TRI_EA-Ax-B-Terrestrial-Supplementary-NE-and-SAR_Rev0 April 5, 2018
Species Name
SARA
Status
ESA 2007
Status Habitat Requirements Background Source
•
water; large open fields/clearcuts generally avoided
• Overwintering - cold and humid hibernacula (caves/mines) (COSEWIC, 2013b)
Tri-colored Bat (Perimyotis subflavus)
END END • Breeding - summer maternity colonies in large-diameter trees; sometimes buildings
• Foraging - gaps in forest; along waterways, forest edges, over water; large open fields/clearcuts generally avoided
• Overwintering - cold and humid hibernacula (caves/mines) (COSEWIC, 2013b)
Ontario Mammal Atlas, 1900-1993
*NAR - Not at Risk: A species that has been evaluated and found to be not at risk of extinction given the current circumstances
It is likely that some species that are not currently listed as SAR may be added to federal and/or provincial SAR lists at/by the time of pre-construction considerations. These newly-added SAR will need to be considered for the determination of permitting requirements. As well, the status of some currently listed species may change, along with associated changes to their protection.
2.3 Field Investigations
MH conducted spring/summer field investigations in order to ground-truth the background information collected as well as to improve upon the knowledge of terrestrial SAR and SAR habitat existing conditions within and adjacent to the project area. The environmental study area was defined as lands within the project limits, and includes adjacent lands as noted below.
Field surveys of terrestrial communities and SAR habitat within the proposed Ellwood Diamond study area were completed on May 11th, June 7th, June 8th, October 23rd and November 8th 2017. Field surveys for Walkley Station were completed in 2016, on June 12th, 21st, 25th, and July 7th, 14th, 27th and 28th. Field surveys for the proposed Bowesville Station and Limebank Extension were carried out on August 11th, 21st, 24th, and October 11th, 2017. It should be noted that only habitat assessments were completed at the proposed Bowesville Station and Limebank Extension study areas due to the timing of

9
TRI_EA-Ax-B-Terrestrial-Supplementary-NE-and-SAR_Rev0 April 5, 2018
the work approvals for the biophysical assessments and in order to provide SAR screening information to conduct geotechnical work. Wildlife observations for all study areas were based on visual confirmation, auditory confirmation, or by way of indicators (e.g. tracks, scat) during field investigations. The methodology employed for each SAR is described below, according to taxon.
PLANTS – One (1) provincially and federally END plant – Butternut had habitat availability within the project areas. Surveys consisted of a complete census of the all areas proposed for disturbance with a 50 m buffer applied based on the interim provincial permitting policy for Butternut (correspondence with MNRF- Kemptville District, 2016). Any Butternuts that were found were flagged with brightly-coloured flagging tape, and their global positioning system (GPS) locations recorded.
In order to assess the health characteristics of all Butternuts located on provincial lands within 50 m of the project areas (one tree near the proposed Ellwood Diamond project area), a Butternut health assessment (BHA) was completed on September 20, 2017. This process is pursuant to O.Reg. 242/08, s. 23.7, made under the ESA 2007. The BHA was carried out because the proposed activity is likely to result in the killing or harming of Butternut trees.
INVERTEBRATES – The only SAR invertebrate likely to occur within the project areas is Monarch (Danaus plexippus), which is listed both provincially and federally as SC. This species is critically dependent on its host plant – milkweed (Asclepias spp.) – for breeding. Therefore, any large patches of milkweed were noted during field investigations, along with incidental observations of Monarch adults and caterpillars.
HERPETOFAUNA – Based on information received from the MNRF following the completion of the approved EPR, Blanding’s Turtle observations have been recorded within 2 km of the proposed Ellwood Diamond project area. Accordingly, two (2) daytime surveys were completed in May and June 2017, to confirm the potentialpresence of SAR turtles - Blanding’s Turtle and/or Snapping Turtle (Chelydra serpentina) – or their habitat at Sawmill Creek within the proposed Ellwood Diamond project area. All potential basking surfaces were scanned using binoculars from various vantage points. Any observed basking turtles were counted and identified to species. Any incidental observations of Eastern Milksnakes were documented during the turtle basking surveys. Targeted surveys were not completed at Walkley Yard due to the lack of suitable habitat. Targeted surveys were not carried out at the proposed Bowesville Station or Limebank Extension, due to the timing of work approvals.
AVIFAUNA – Due to the impending listing of several bird species under SARA, two (2) surveys were conducted following the standard breeding bird survey protocol (OBBA, 2001) in May and June, in search of SAR birds that are known to be forest specialists at the proposed Ellwood Diamond project area and Walkley Yard project area; these included Canada Warbler, Eastern Wood-pewee, and Wood Thrush. Survey stations were located 250 m apart, within wooded areas adjacent to the Sawmill Creek crossing study area (Figure 2). At each survey station, the surveyor spent 10 minutes listening for the calls of each target species. Surveys were completed on fair weather days,

10
TRI_EA-Ax-B-Terrestrial-Supplementary-NE-and-SAR_Rev0 April 5, 2018
ending no later than 11:00 am. Targeted surveys were not carried out at the proposed Bowesville Station or Limebank Extension, due to the timing of work approvals.
Another breeding bird survey was conducted on two (2) evenings of June 2016 and 2017, at the proposed Walkley Yard and Ellwood Diamond study areas, targeting Eastern Whip-poor-will, following the provincial protocol (MNRF, 2014a). The surveys were initiated at a half hour before moonrise, on a night when the moon was at a minimum of 50%. Survey stations were placed at 500-m intervals and consisted of 10 minutes of listening for the calls at each station. If the target species was heard, the location of the call was recorded in terms of compass direction and approximate distance (in metres) from the survey station. Targeted surveys were not carried out at the proposed Bowesville Station or Limebank Extension, due to the timing of work approvals.
Additionally, all structures located within the study areas with adequate nesting habitat within which Barn Swallow might nest were searched for the presence of nests. This species, along with Bank Swallow were also recorded incidentally if observed during the course of any other daytime survey.
Targeted surveys were not carried out for Bank Swallow as the design team identified the need for work on structures which might be used for nesting after the breeding bird window had passed.
Habitat assessments were carried out to identify suitable habitat for Grassland SAR birds, including Bobolink, Eastern Meadowlark, Grasshopper Sparrow, and Short-eared Owl, at the proposed Bowesville Station and Limebank Extension study areas.
MAMMALS – Four (4) species of bats – Eastern Small-footed Bat (Myotis leibii), Little Brown Myotis (Myotis lucifugus), Northern Myotis (Myotis septentrionalis), and Tri-colored Bat (Perimyotis subflavus) – comprise the suite of SAR mammals that are likely to occur within the project areas. As these species were recently listed as endangered under SARA and the ESA 2007, surveys were carried out. Surveys were common to all species, and consisted of (i) surveys for bat roost trees in order to ascertain availability of potential maternity roosting habitat and (ii) acoustic surveys to determine whether these SAR bats occur.
In order to identify potential maternity roosting habitat for SAR bats, thorough searches of all wooded areas proposed for disturbance (e.g., staging areas) with a 50 m buffer applied were undertaken during leaf-off within the proposed Ellwood Diamond and Walkley Yard project areas. Surveys to identify potential maternity roosting habitat for SAR bats within the proposed Bowesville Station and Limebank Extension were completed during leaf-on conditions, due to the timing of work approvals, and in order to provide SAR screening information to conduct geotechnical work. This 50-m search distance was selected because the limited literature on bat responses to noise/vibrations arising from linear transportation corridors (roads and trains) suggests that, although responses vary between species, as well as according to the volume and type of noise, in general, impacts begin to decline significantly at around 50-60 m from the source

11
TRI_EA-Ax-B-Terrestrial-Supplementary-NE-and-SAR_Rev0 April 5, 2018
(e.g., Schaub et al. 2008, Siemers & Schaub 2011). According to MNRF (2011), any tree that is equal to or greater than 25 cm in Diameter at Breast Height (DBH), and has a cavity deep enough to accommodate a roosting bat could serve as a roost tree. All trees that met these basic criteria were recorded, and mapped using a GPS, as trees with the potential to provide roosting sites for bats (both maternity roosts as well as day roosts for male and non-breeding female bats).
In order to determine whether SAR bats occurred within the project area, surveyors walked the length of the Walkley Yard study area and near the proposed Ellwood Diamond study area, using a handheld device (Echo Meter Touch, ™ Wildlife Acoustics, Maynard, MA, U.S.A.), that auto-identifies species of echolocating bats using Kaleidoscope 3.1.5 software (™ Wildlife Acoustics Inc., Maynard, MA, U.S.A.). The surveys began after dusk on June 7th and 8th, 2017, and ended before midnight. The device recorded bat vocalizations while also providing a tentative identification of the species that were the most likely to have emitted the vocalization. No acoustic surveys to determine whether SAR bats occur within the proposed Bowesville Station and Limebank Extension project areas have been completed to date.

12
TRI_EA-Ax-B-Terrestrial-Supplementary-NE-and-SAR_Rev0 April 5, 2018
3. RESULTS OF SPECIES AT RISK SURVEYS Below is an overview of the observations documented during the field investigations within each project area.
3.1 Ellwood Diamond
NATURAL HERITAGE SYSTEM - Identified by the City of Ottawa – Significant Valleylands and Significant Woodlands are present immediately west of the proposed Ellwood Diamond.
SIGNIFICANT WILDLIFE HABITAT - may be present within or immediately adjacent to boundaries of the proposed Ellwood Diamond.
• Reptile Hibernaculum – may be located in stone retaining walls along Sawmill Creek.
• Special Concern and Rare Wildlife Species – the forested area northeast of Ellwood Diamond may provide habitat for Eastern Wood-pewee or Wood Thrush. The stone retaining walls along Sawmill Creek may also provide habitat for Milksnake.
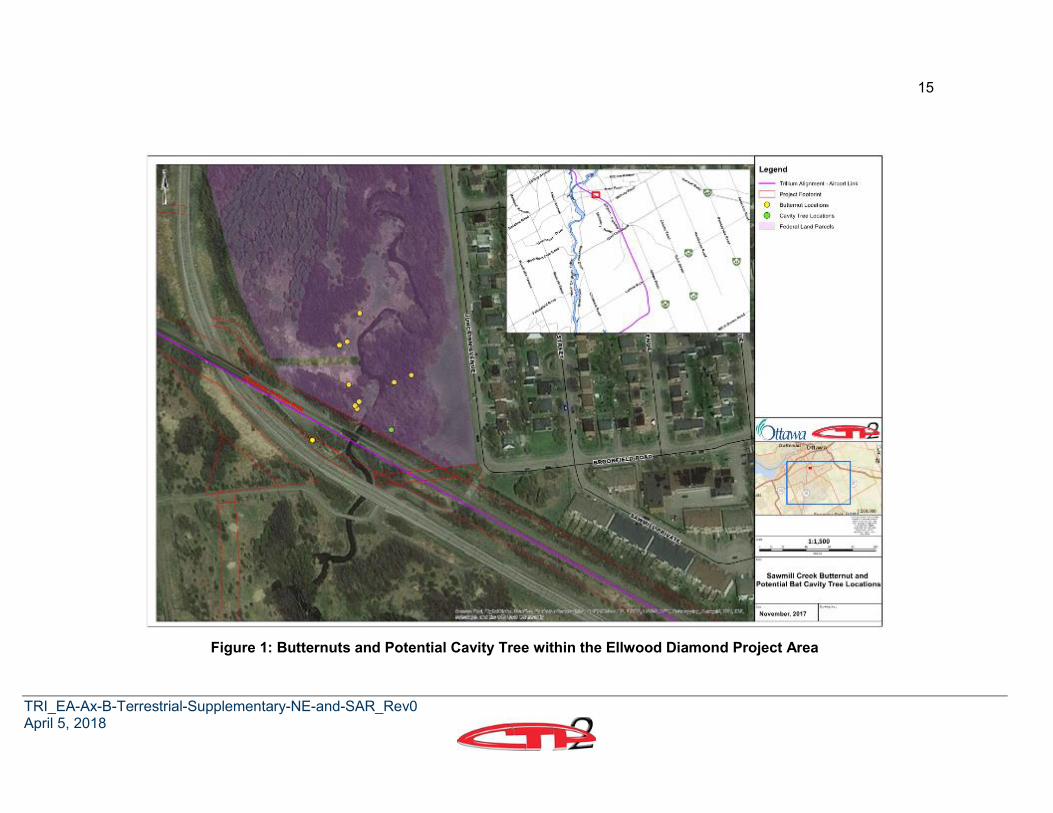
PLANTS – A total of ten (10) Butternuts were found within the project area (Figure 1) during the 2016 surveys. These Butternuts were not observed during the studies conducted for the approved EPR. One (1) Butternut was found within the project impact area. A BHA was conducted for this 3 cm DBH individual located on lands under provincial jurisdiction; it was classified as Category 1. The results were submitted to the MNRF for review on September 26th, 2017, and the BHA was accepted by the MNRF on November 16th, 2017. Due to this individual being assessed and approved as a Category 1, it may be removed without any further consultation or compensation requirements.
The remaining nine (9) Butternuts are located on federal lands and are located 7 to 81 m from the project footprint. Three (3) individuals are located > 50 m away, and are unlikely to be impacted by construction or operations. The other six (6) Butternuts are located <50 m from the project area and may experience minor and temporary indirect impacts during construction if protection measures are not in place. Therefore, the installation of protection fencing will be required around the Critical Root Zone1 (CRZ) of these individuals prior to and during construction to avoid impacts. If the CRZ of these trees
1 Critical Root Zone is the zone that needs to be protected during construction to avoid impacts to the tree. The International Society of Arboriculture defines the CRZ as an area equal to a 12 cm radius from the base of the tree’s trunk for each 1 cm of the tree’s diameter measured at 1.3 m above grade (referred to as diameter at breast height)

13
TRI_EA-Ax-B-Terrestrial-Supplementary-NE-and-SAR_Rev0 April 5, 2018
cannot be protected a permit may be required in order to harm and/or remove these individuals.
INVERTEBRATES – No Monarch caterpillars or adults were observed during 2017 field investigations. However, the host plant for Monarch caterpillars – Common Milkweed (Asclepias syriaca) – was observed within and adjacent to the proposed project areas. Best management practices should be implemented in order to protect the breeding habitat of this species. As well, ECCC may require further habitat studies should they be up-listed in the future.
HERPETOFAUNA – No herpetofauna were observed within the vicinity of project area during the 2017 field investigations. Although no suitable turtle overwintering, basking, or foraging habitat was found within the project area, marginal nesting habitat (in the form of loose substrate) is present adjacent to portions of Sawmill Creek. The creek may also be used as a migratory passage way.
There is a possibility of Blanding’s, Musk, and Snapping Turtles entering the project area, therefore suitable mitigation and best management practices will be required to protect any individuals that could be impacted by construction.
AVIFAUNA – No SAR woodland birds were heard during targeted surveys within the vicinity of the project area. Habitat is present for woodland SAR birds within the treed areas east of the project area within federal lands.
A site near Ottawa (Oxford Mills, ON), with a known Eastern Whip-poor-will population, was used as a proxy site to identify suitable survey conditions. Eastern Whip-poor-will was heard calling at this proxy site on the evenings the crepuscular bird surveys were conducted within the project area. Therefore, it was concluded that although suitable habitat for this species is present, there are no breeding individuals within the vicinity of the project area.
Further, there was no evidence of Barn Swallow or Bank Swallow nesting within the project area. However, the Sawmill bridge does provide suitable habitat for Barn Swallow in the form of horizontal ledges or rough vertical surfaces with a sheltered overhang. Therefore, it is possible that this species might nest within the project area in coming years, and pre-construction surveys will be required to ensure that nesting habitat for this species is not compromised.
There was no habitat for grassland SAR birds, including Bobolink, Eastern Meadowlark, Grasshopper Sparrow, and Short-eared Owl within or adjacent to the project area.
MAMMALS – A total of 1 suitable bat roost tree (cavity tree) was found within 50 m of the project area (Figure 1). Analysis of acoustic recordings made on the hand-held recorder did not record SAR bats within the project area. However, due to the presence of SAR bats within a few kilometers of the study area (documented during the 2016 and 2017 field investigations), additional acoustic surveys using a stationary monitor are recommended, following the provincial protocol, prior to construction. If tree removal is

14
TRI_EA-Ax-B-Terrestrial-Supplementary-NE-and-SAR_Rev0 April 5, 2018
expected within the area of impact, appropriate mitigation and compensation will be required to protect SAR bat habitat that may be impacted by construction.
15
TRI_EA-Ax-B-Terrestrial-Supplementary-NE-and-SAR_Rev0 April 5, 2018
Figure 1: Butternuts and Potential Cavity Tree within the Ellwood Diamond Project Area

16
TRI_EA-Ax-B-Terrestrial-Supplementary-NE-and-SAR_Rev0 April 5, 2018
3.2 Walkley Yard
NATURAL HERITAGE SYSTEM - Identified by the City of Ottawa – An Urban Natural Feature (Figure 3 of City of Ottawa’s Urban Natural Areas Report, 2005) is documented to be present immediately south of the proposed Walkley Yard, but it has since been disturbed and is no longer present. A floodplain is shown to be within the west side of project footprint according to Annex 14 of the City of Ottawa’s Official Plan.
SIGNIFICANT WILDLIFE HABITAT – Significant Wildlife Habitat may be present within or immediately adjacent to boundaries of the proposed Walkley Yard.
• Bat Maternity Colonies – may be present within treed area north of the site.
• Shrub/Early Successional Bird Breeding Habitat – may be located immediately north of the proposed project footprint, and approximately 60 m south of the site.
PLANTS – No SAR plants have been reported by any previous studies from the vicinity of the Walkley Yard project area. As well, no SAR plants were observed within 50 m of the Walkley Yard project area.
INVERTEBRATES – No SAR invertebrates have been reported by any previous studies from the vicinity of the project area. No Monarch caterpillars or adults were observed during 2016 field investigations. However, the host plant for Monarch caterpillars – Common Milkweed – was observed within and adjacent to the proposed project area. Best management practices should be implemented in order to protect the breeding habitat of this species. As well, ECCC may require further habitat studies should they be up-listed in the future.
HERPETOFAUNA – No herpetofauna were observed within the vicinity of project area during the 2016 field investigations. No suitable turtle nesting, overwintering, basking, or foraging habitat was found within the project area. The creek on-site may be used as a migratory passage way as it is hydrologically connected to Sawmill Creek. There is a possibility of Blanding’s, Musk, and Snapping Turtles entering the project area, therefore suitable mitigation and best management practices will be required to protect any individuals that could be impacted by construction.
Suitable habitat for Milksnake was identified within 50 m of the boundaries of the proposed Walkley Yard during the 2016 field investigations.
AVIFAUNA – No SAR woodland birds were heard during targeted surveys within the vicinity of the project area. Habitat is present for woodland SAR birds within the treed areas adjacent the project area.
A site near Ottawa (Oxford Mills, ON), with a known Eastern Whip-poor-will population, was used as a proxy site to identify suitable survey conditions. Eastern Whip-poor-will was heard calling at this proxy site on the evenings the crepuscular bird surveys were conducted within the project area. Therefore, it was concluded that although suitable

17
TRI_EA-Ax-B-Terrestrial-Supplementary-NE-and-SAR_Rev0 April 5, 2018
habitat for this species is present, there are no breeding individuals within the vicinity of the project area.
There was evidence of previous Barn Swallow nesting within the project area. Two (2) inactive Barn Swallow nests were observed in a box culvert approximately 130 m west of Bank Street.
There was no habitat for grassland SAR birds, including Bobolink, Eastern Meadowlark, Grasshopper Sparrow, and Short-eared Owl.
MAMMALS – A total of 24 potential SAR bat roost trees were found within 50 m of the proposed Walkley Yard (Figure 2). Analysis of acoustic recordings made on the hand-held recorder did not record SAR bats within the project area. However, due to the presence of SAR bats within a few kilometers of the study area (documented during the 2016 and 2017 field investigations), additional acoustic surveys using a stationary monitor, are recommended, following the provincial protocol, prior to construction. If tree removal is expected within the area of impact, appropriate mitigation and compensation will be required to protect SAR bat habitat that may be impacted by construction.
Figure 2: Potential Cavity Trees within the Walkley Yard Project Area

18
TRI_EA-Ax-B-Terrestrial-Supplementary-NE-and-SAR_Rev0 April 5, 2018
3.3 Bowesville Station
Where the proposed alignment connects with the original Trillium alignment on the northernmost portion, the habitat adjacent the alignment contains mixed and deciduous forest as well as a corner of the Leitrim (also known as Albion) Provincially Significant Wetlands (PSW) which contains swamp near the alignment. The alignment does not directly impact the PSW, but is within 5 m. The area north of Earl Armstrong Road up to the forests is characterized by hedgerows adjacent the alignment, bordered by large meadows. South of Earl Armstrong Road, where the alignment curves west and meets with Bowesville Road, the habitat consists of hedgerows immediately south of Earl Armstrong Road, then primarily agricultural lands which are currently used for annual crops as the alignment curves to the west. A large 0.6 ha pond is located immediately west of where the alignment is recommended to curve to the west. The alignment crosses one (1) drainage ditch south of a 0.1 ha constructed pond, and north of swamp wetlands on the federal property bordering to the south.
NATURAL HERITAGE SYSTEM - IDENTIFIED BY THE CITY OF OTTAWA - The alignment passes immediately north of swamp wetlands adjacent to federal property. These wetlands are designated as Significant Woodlands on the City of Ottawa’s Annex 14 mapping. They are also noted to contain organic soils as mapped on the Official Plan Schedule K. These swamp wetlands, as well as the regenerating woodlands partially encircling them to the east, south, and west, are mapped as ‘Contributing’ natural lands on the City of Ottawa’s Greenspace Master Plan, Map 1.
SIGNIFICANT WILDLIFE HABITAT – Based on a review of background information, the following Significant Wildlife Habitats are potentially present:
• Waterfowl Stopover and Staging Areas (Terrestrial) – within agricultural fields south of Earl Armstrong Road and east of Bowesville, as well as within meadows to the east and west of the alignment north of Earl Armstrong Road.
• Waterfowl Stopover and Staging Areas (Aquatic) – within the constructed 0.1 ha pond north of the alignment and in the 0.6 ha pond 60 m the east of the proposed station.
• Raptor Wintering Areas – confirmed to be present in 2006 within areas overlapping of Earl Armstrong Road and mainly west of Bowesville Road, but partially within the alignment area.
• Bat Maternity Colonies – potentially within the wooded areas immediately north of this alignment, and within the swamp woodlands south of the alignment on federal lands.
• Turtle Wintering Areas - within the constructed 0.1 ha pond north of the alignment and in the 0.6 ha pond 60 m the east of the proposed station.
• Deer Yarding Areas – within swamp woodlands south of the alignment on federal lands.

•
19
TRI_EA-Ax-B-Terrestrial-Supplementary-NE-and-SAR_Rev0 April 5, 2018
• Deer Winter Congregation Area – within wooded areas immediately north of this alignment.
• Specialized Habitat for Wildlife:
• Waterfowl Nesting Areas - within the constructed 0.1 ha pond north of the alignment and in the 0.6 ha pond 60 m the east of the proposed station.
• Woodland Raptor Nesting Habitat - within wooded areas immediately north of this alignment.
• Turtle Nesting Areas – adjacent the constructed 0.1 ha pond north of the alignment and in the 0.6 ha pond 60 m the east of the proposed station.
• Seeps and Springs - within swamp woodlands south of the alignment on federal lands.
• Amphibian Breeding Habitat (Woodland) - within swamp woodlands south of the alignment on federal lands.
• Amphibian Breeding Habitat (Wetlands) - within the constructed 0.1 ha pond north of the alignment and in the 0.6 ha pond 60 m the east of the proposed station.
• Habitat for Species of Conservation Concern (not including Endangered and Threatened species):
• Woodland Area-Sensitive Bird Breeding Habitat - within wooded areas immediately north of this alignment.
• Open Country Bird Breeding Habitat – large meadows north of Earl Armstrong on both sides of the alignment.
• Shrub/Early Successional Bird Breeding Habitat – on federal property south of the alignment, west of the swamp woodland, and east of Bowesville Road.
• Animal Movement Corridors:
Amphibian Movement Corridors – between the constructed 0.1 ha pond north of the alignment and the swamp wetland on the federal lands to the south, and between the 0.6 ha pond 35 m the east of the proposed alignment and the swamp wetland on the federal lands to the south.
Targeted surveys for these Significant Wildlife Habitats were not carried out due to the required project schedule. Further targeted surveys are required during a seasonally appropriate period using approved protocols to confirm the presence of these habitats.
PLANTS – No SAR plants were observed within 50 m of the proposed Bowesville Station or extension.

20
TRI_EA-Ax-B-Terrestrial-Supplementary-NE-and-SAR_Rev0 April 5, 2018
INVERTEBRATES – No Monarch caterpillars or adults were observed during 2017 field investigations. However, the host plant for Monarch caterpillars – Common Milkweed – was observed within and adjacent to the proposed project area. Best Management Practices should be implemented in order to protect the breeding habitat of this species. As well, ECCC may require further habitat studies should they be up-listed in the future.
HERPETOFAUNA – Suitable turtle nesting, overwintering, basking, and foraging habitat was found adjacent to the project area and south of Earl Armstrong Road, within the 0.1 ha constructed pond immediately north of the alignment within the farmland, and within the larger 0.6 ha pond located 35 m to the east. There is a possibility of Blanding’s Turtles and Snapping Turtles entering the project area to seek out nesting sites and to migrate, therefore suitable mitigation and best management practices will be required to protect any individuals that could be impacted by construction.
Suitable habitat for Western Chorus Frog is present within the swamp south of the alignment on federal land, within the ditch that connects the swamp to the 0.1 ha constructed pond within the farmland, and within the 0.1 ha constructed pond, both of which are located on provincial lands.
Suitable habitat for Milksnake was identified within 50 m of the boundaries of the proposed Bowesville Station and alignment during the 2017 field investigations.
Targeted surveys are required during a seasonally appropriate period using approved protocols to confirm the presence of these habitats and SAR.
AVIFAUNA – Habitat is present for woodland SAR birds within the treed areas south of the project area and at the northern extent of the proposed Bowesville extension, where it connects to the Trillium alignment.
Multiple Barn Swallow were observed flying over the project area during the August 2017 surveys. Nesting evidence could not be verified on the adjacent farm buildings, however no nests were observed within the alignment.
Suitable nesting habitat for Bank Swallows was not present within the proposed work areas.
Suitable habitat was present for grassland SAR birds, including Bobolink, Eastern Meadowlark, Grasshopper Sparrow, and Short-eared Owl within the proposed park and ride and southern portion of the Bowesville extension, as well as adjacent to the Osgoode Pathway north of Earl Armstrong Road (Figure 3 and Figure 4).
Targeted surveys are required during a seasonally appropriate period using approved protocols to confirm the presence of these habitats and SAR.
MAMMALS – A total of 26 trees with a DBH of 25 cm or greater were observed within 50 m of the project area (Figure 3 and Figure 4). The presence of cavities could not be verified due to the timing of the surveys being conducted during the leaf-on period (conducted at this time to accommodate the project timelines). Due to the presence of SAR bats within a few kilometers of the study area (documented during the 2016 field investigations), additional acoustic surveys are recommended, following the provincial

21
TRI_EA-Ax-B-Terrestrial-Supplementary-NE-and-SAR_Rev0 April 5, 2018
protocol, prior to construction. If tree removal is expected within the area of impact, appropriate mitigation and compensation will be required to protect SAR bat habitat that may be impacted by construction.

22
TRI_EA-Ax-B-Terrestrial-Supplementary-NE-and-SAR_Rev0 April 5, 2018
Figure 3: Potential Cavity Tree Locations and SAR Grassland Bird Habitat within the Bowesville Extension Project Area

23
TRI_EA-Ax-B-Terrestrial-Supplementary-NE-and-SAR_Rev0 April 5, 2018
Figure 4: Potential Cavity Tree Locations and SAR Grassland Bird Habitat within the Bowesville Extension Project Area

24
TRI_EA-Ax-B-Terrestrial-Supplementary-NE-and-SAR_Rev0 April 5, 2018
3.4 Limebank Extension
The proposed Limebank alignment passes through agricultural lands. During the 2017 field investigations, a majority of the fields were planted with annual row crops. Some fields, however, were fallow and contained short-lived annual weedy species, and some portions contained hayfields and meadows. The agricultural lands were interspersed with occasional hedgerows along fencelines, mainly consisting of buckthorn, and regenerating elm and ash, but also occasionally containing mature trees. Mosquito Creek passes through the proposed alignment within a well-defined lowland floodplain, which contains small groves of trees, willow thickets, and meadow marshes. At the westernmost extent, the proposed alignment is adjacent a large deciduous forest.
NATURAL HERITAGE SYSTEM - IDENTIFIED BY THE CITY OF OTTAWA - Mosquito Creek is designated as Significant Valleyland on the City of Ottawa’s Annex 14 mapping and as Unstable Slopes on Schedule K. Woodlands to the west end of the alignment are designated as Significant Woodland. Mosquito Creek is also designated as City of Ottawa’s Primary Natural Environment on Greenspace Mater Plan Map 1, and Natural Heritage System overlay on Schedule L3. Armstrong Road Woods are displayed on the mapping for Urban Natural Areas, and are noted to require ecological analysis to determine environmental rating.
SIGNIFICANT WILDLIFE HABITAT – Based on a review of background information, the following Significant Wildlife Habitats are potentially present:
• Waterfowl Stopover and Staging Areas (Terrestrial) – within agricultural fields west of Bowesville through which the proposed alignment passes.
• Raptor Wintering Areas – confirmed to be present in 2006 within areas overlapping of Earl Armstrong Road and mainly west of Bowesville Road; the LRT alignment is proposed for the southern boundary of the area (McCormick Rankin Corporation & Hatch Mott McDonald, 2006).
• Turtle Wintering Areas - within Mosquito Creek.
• Habitat for Species of Conservation Concern (not including END and THR species):
• Open Country Bird Breeding Habitat – large meadows on both sides of the alignment (partially shown as Grassland SAR bird habitat on Figure 5).
• Turtle habitat – within Mosquito Creek and along the banks and floodplain of this creek.
• Snake habitat – within meadows and near potential hibernaculum created by old stone building foundation (Figure 5).
• Animal Movement Corridors:

25
TRI_EA-Ax-B-Terrestrial-Supplementary-NE-and-SAR_Rev0 April 5, 2018
• Amphibian Movement Corridors – along watercourses and between wetlands and ponds within the study area.
Although no deer wintering areas were noted to be present, there was evidence of use of the area by deer. It is expected that they move between habitats to the north and south across the proposed alignment.
Targeted surveys for these Significant Wildlife Habitats were not carried out due to the required project schedule. Further targeted surveys are required during a seasonally appropriate period using approved protocols to confirm the presence of these habitats.
PLANTS – No SAR plants were observed within 50 m of the proposed Limebank Extension.
INVERTEBRATES – One (1) adult Monarch was observed during 2017 field investigations. The host plant for Monarch caterpillars – Common Milkweed – was observed within and adjacent to the proposed project area. Best management practices should be implemented in order to protect the breeding habitat of this species. As well, ECCC may require further habitat studies should they be up-listed in the future.
HERPETOFAUNA – Suitable turtle nesting, overwintering, basking, and foraging habitat was found within Mosquito Creek (Figure 5). There is a possibility of Blanding’s Turtle and Snapping Turtles entering the project area to seek out nesting sites and to migrate. Therefore suitable mitigation and best management practices will be required to protect any individuals that could be impacted by construction. If habitat within Mosquito Creek and its shorelines are impacted, further surveys should be carried out to determine the potential impacts, and consultation with the MNRF should be carried out.
Suitable habitat for Western Chorus Frog is present within the ditches and watercourses in the project area located on provincial lands (Figure 5).
Suitable foraging and overwintering habitat (an old stone foundation) for Milksnake was identified within 50 m of the boundaries of the proposed Limebank Extension during the 2017 field investigations (Figure 5).
Targeted surveys are required during a seasonally appropriate period using approved protocols to confirm the presence of these habitats and SAR.
AVIFAUNA – Habitat is present for woodland SAR birds within the woodlot east of Limebank Road at the end of the proposed Limebank Extension., No suitable Barn Swallow or Bank Swallow nesting habitat is present.
Suitable habitat was present for grassland SAR birds, including Bobolink, Eastern Meadowlark, Grasshopper Sparrow, and Short-eared Owl within and adjacent to the proposed project area. Targeted surveys are required during a seasonally appropriate period using approved protocols to confirm the presence of these habitats and SAR (Figure 5).

26
TRI_EA-Ax-B-Terrestrial-Supplementary-NE-and-SAR_Rev0 April 5, 2018
MAMMALS – No suitable maternity roosting habitat was observed during the surveys, however forgaing habitat is present within treed areas, open meadows, and near Mosquito Creek.

27
TRI_EA-Ax-B-Terrestrial-Supplementary-NE-and-SAR_Rev0 April 5, 2018
Figure 5: Terrestrial Features within the Limebank Extension Project Area

28
TRI_EA-Ax-B-Terrestrial-Supplementary-NE-and-SAR_Rev0 April 5, 2018
4. REFERENCES
COSEWIC. 2003. COSEWIC assessment and status report on the butternut Juglans cinerea in Canada. Committee on the Status of Endangered Wildlife in Canada. Ottawa. vii + 32 pp. (www.sararegistry.gc.ca/status/status_e.cfm)
COSEWIC. 2005. COSEWIC assessment and update status report on the Blanding's Turtle Emydoidea blandingii in Canada. Committee on the Status of Endangered Wildlife in Canada. Ottawa. viii + 40 pp. (www.sararegistry.gc.ca/status/status_e.cfm).
COSEWIC. 2008a. COSEWIC assessment and status report on the Snapping Turtle Chelydra serpentina in Canada. Committee on the Status of Endangered Wildlife in Canada. Ottawa. vii + 47 pp. (www.sararegistry.gc.ca/status/status_e.cfm).
COSEWIC. 2008b. COSEWIC assessment and update status report on the Western Chorus Frog Pseudacris triseriata Carolinian population and Great Lakes/St. Lawrence – Canadian Shield population in Canada. Committee on the Status of Endangered Wildlife in Canada. Ottawa. vii + 47 pp. (www.sararegistry.gc.ca/status/status_e.cfm).
COSEWIC. 2008c. COSEWIC assessment and status report on the Canada Warbler Wilsonia canadensis in Canada. Committee on the Status of Endangered Wildlife in Canada. Ottawa. vi + 35 pp. (www.sararegistry.gc.ca/status/status_e.cfm).
COSEWIC. 2008d. COSEWIC assessment and update status report on the Short-eared Owl Asio flammeus in Canada. Committee on the Status of Endangered Wildlife in Canada. Ottawa. vi + 24 pp.
COSEWIC. 2009. COSEWIC assessment and status report on the Whip-poor-will Caprimulgus vociferous in Canada. Committee on the Status of Endangered Wildlife in Canada. Ottawa. vi + 28 pp. (www.sararegistry.gc.ca/status/status_e.cfm).
COSEWIC. 2010a. COSEWIC assessment and status report on the Monarch Danaus plexippus in Canada. Committee on the Status of Endangered Wildlife in Canada. Ottawa. vii + 43 pp.
COSEWIC. 2010b. COSEWIC assessment and status report on the Bobolink Dolichonyx oryzivorus in Canada. Committee on the Status of Endangered Wildlife in Canada. Ottawa. vi + 43 pp.
COSEWIC. 2011a. COSEWIC assessment and status report on the Barn Swallow Hirundo rustica in Canada. Committee on the Status of Endangered Wildlife in Canada. Ottawa. ix + 37 pp.
COSEWIC. 2011b. COSEWIC assessment and status report on the Eastern Meadowlark Sturnella magna in Canada. Committee on the Status of Endangered Wildlife in Canada. Ottawa. x + 40 pp.
29
TRI_EA-Ax-B-Terrestrial-Supplementary-NE-and-SAR_Rev0 April 5, 2018
COSEWIC. 2012a. COSEWIC assessment and status report on the Eastern Musk Turtle Sternotherus odoratus in Canada. Committee on the Status of Endangered Wildlife in Canada. Ottawa. xiii + 68 pp. (www.registrelep-sararegistry.gc.ca/default_e.cfm).
COSEWIC. 2012b. COSEWIC assessment and status report on the Eastern Wood-pewee in Canada. Committee on the Status of Endangered Wildlife in Canada. Ottawa. x + 39 pp. (Species at Risk Public Registry).
COSEWIC. 2012c. COSEWIC assessment and status report on the Wood Thrush Hylocichla mustelina in Canada. Committee on the Status of Endangered Wildlife in Canada. Ottawa. ix + 46 pp. (www.registrelep-sararegistry.gc.ca/default_e.cfm).
COSEWIC. 2013a. COSEWIC assessment and status report on the Bank Swallow Riparia riparia in Canada. Committee on the Status of Endangered Wildlife in Canada. Ottawa. ix + 48 pp. (www.registrelep-sararegistry.gc.ca/default_e.cfm).
COSEWIC. 2013b. COSEWIC assessment and status report on the Little Brown Myotis lucifugus, Northern Myotis septentrionalis and Tri-colored Bat Perimyotis subflavus in Canada. Committee on the Status of Endangered Wildlife in Canada. Ottawa. xxiv + 93 pp. (www.registrelep-sararegistry.gc.ca/default_e.cfm).
COSEWIC. 2013c. COSEWIC assessment and status report on the Grasshopper Sparrow pratensis subspecies Ammodramus savannarum pratensis in Canada. Committee on the Status of Endangered Wildlife in Canada. Ottawa. ix + 36 pp. (www.registrelep-sararegistry.gc.ca/default_e.cfm).
COSEWIC. 2014. COSEWIC assessment and status report on the Eastern Milksnake Lampropeltis triangulum in Canada. Committee on the Status of Endangered Wildlife in Canada. Ottawa. x + 61 pp. (www.registrelep-sararegistry.gc.ca/default_e.cfm).
CTP2. 2017. Natural Environment & Species at Risk Report – Terrestrial – Ottawa Light Rail Transit (Stage 2) – Confederation Lines East and West and Trillium Extension. Prepared for City of Ottawa. 2440 Don Reid Drive, Ottawa, ON.
Humphrey, C. 2017. Recovery Strategy for the Eastern Small-footed Myotis (Myotis leibii) in Ontario. Ontario Recovery Strategy Series. Prepared for the Ontario Ministry of Natural Resources and Forestry, Peterborough, Ontario. vii + 76 pp.
Jones, C., R. Layberry, and A. Macnaughton. Ontario Butterfly Atlas Online. (Accessed on June 6, 2017). Toronto Entomologists’ Association: http://www.ontarioinsects.org/atlas_online.htm
McCormick Rankin Corporation & Hatch Mott McDonald. 2006. North-South Corridor LRT Project (Rideau Centre to Barrhaven Town Centre), Environmental Impact Report. Prepared for the City of Ottawa.
MNRF. 2011. Bats and Bat Habitats: Guidelines for Wind Power Projects. Ontario Ministry of Natural Resources & Forestry, Peterborough, ON.

30
TRI_EA-Ax-B-Terrestrial-Supplementary-NE-and-SAR_Rev0 April 5, 2018
MNRF. 2014a. Survey Protocol for Eastern Whip-poor-will (Caprimulgus vociferus) in Ontario. Ontario Ministry of Natural Resources and Forestry, Species at Risk Branch, Peterborough. iii + 10 pp.
OBBA. 2001. Guide for Participants. Ontario Breeding Bird Atlas, Guelph, ON.
Schaub, A., Ostwald, J. & B. M. Siemers. 2008. Foraging bats avoid noise. Journal of Experimental Biology. 211, 3174–3180.
Siemers, B.M. and Schaub, A., 2011. Hunting at the highway: traffic noise reduces foraging efficiency in acoustic predators. Proceedings of the Royal Society of London B: Biological Sciences. 278(1712): 1646-1652.

31
TRI_EA-Ax-B-Terrestrial-Supplementary-NE-and-SAR_Rev0 April 5, 2018
Attachment A – Ministry of Natural Resources and Forestry Info Request Response
32
TRI_EA-Ax-B-Terrestrial-Supplementary-NE-and-SAR_Rev0 April 5, 2018
Ministry of Natural Resources and Forestry
Kemptville District
10-1 Campus Drive Kemptville ON K0G 1J0 Tel: 613 258-8204 Fax: 613 258-3920
Wed. Jan 31, 2019
Bettina Henkelman Morrison Hershfield 2440 Don Reid Drive Ottawa, Ontario K1H 1E1 (613) 739-2910 ext 2470 [email protected]
Attention: Bettina Henkelman
Subject: Information Request - Developments Project Name: OLRT Stage 2 – Limebank Extension Site Address: Our File No. 2018_GLO-4393
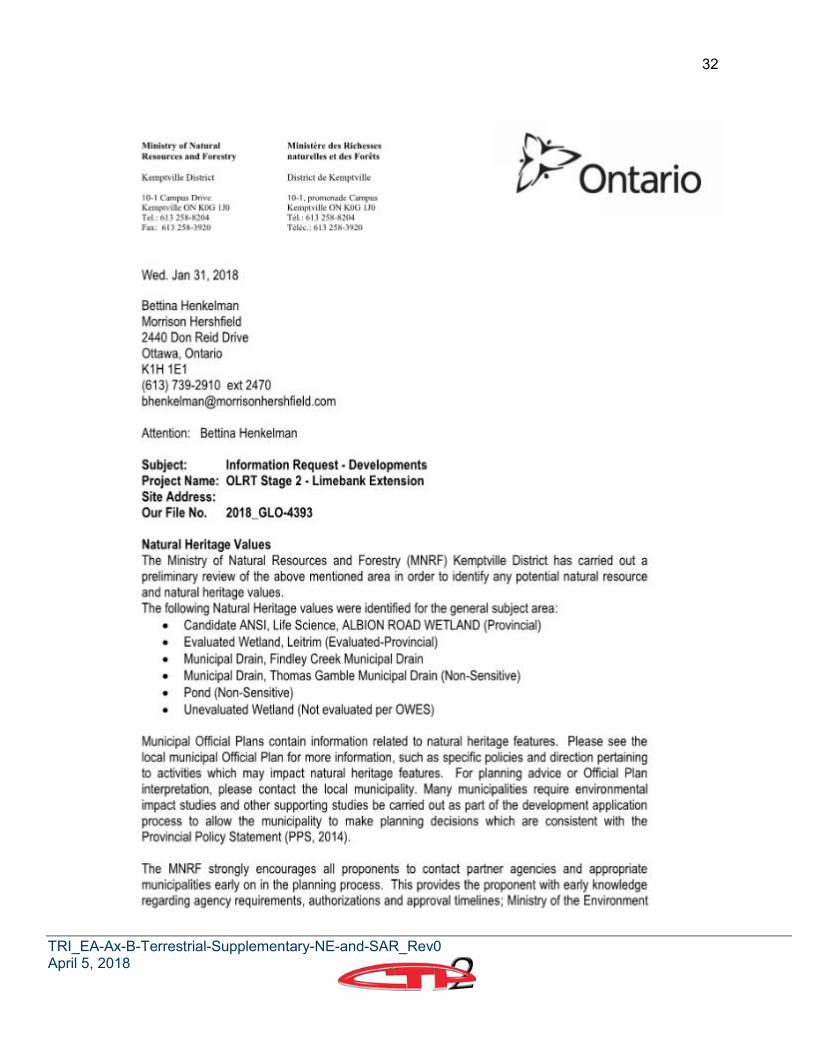
Natural Heritage Values The Ministry of Natural Resources and Forestry (MNRF) Kemptville District has carried out a preliminary review of the above mentioned area in order to identify any potential natural resource and natural heritage values. The following Natural Heritage values were identified for the general subject area:
Candidate ANSI, Life Science, ALBION ROAD WETLAND (Provincial) Evaluated Wetland, Leitrim (Evaluated-Provincial) Municipal Drain, Findley Creek Municipal Drain Municipal Drain, Thomas Gamble Municipal Drain (Non-Sensitive) Pond (Non-Sensitive) Unevaluated Wetland (Not evaluated per OWES)
Municipal Official Plans contain information related to natural heritage features. Please see the local municipal Official Plan for more information, such as specific policies and direction pertaining to activities which may impact natural heritage features. For planning advice or Official Plan interpretation, please contact the local municipality. Many municipalities require environmental impact studies and other supporting studies be carried out as part of the development application process to allow the municipality to make planning decisions which are consistent with the Provincial Policy Statement (PPS, 2014).
The MNRF strongly encourages all proponents to contact partner agencies and appropriate municipalities early on in the planning process. The provides the proponent with early knowledge regarding agency requirements, authorizations and approval timelines; Ministry of the Environment

33
TRI_EA-Ax-B-Terrestrial-Supplementary-NE-and-SAR_Rev0 April 5, 2018
and Climate Change (MOECC) and the local Conservation Authority may require approvals and permitting where natural values and natural hazards (e.g., floodplains) exist.
As per the Natural Heritage Reference Manual (NHRM, 2010) the MNRF strongly recommends that an ecological site assessment be carried out to determine the presence of natural heritage features and species at risk and their habitat on site. The MNRF can provide survey methodology for particular species at risk and their habitats.
The NHRM also recommends that cumulative effects of development projects on the integrity of natural heritage features and areas be given due consideration. This includes the evaluation of the past, present and possible future impacts of development in the surrounding area that may occur as a result of demand created by the presently proposed project.
In Addition, the following Fish species were identified: blacknose shiner, bluntnose minnow, brook stickleback, central mudminnow, creek chub, fathead minnow, logperch, longnose dace, northern redbelly dace, rock bass, spottail shiner, white sucker.
See table (2018_GL0-4393-LimebankExt-Fisheries_Site_Table) for specific information related to fisheries for provided UTM’s.
Wildland Fire MNRF woodland data shows that the site contains woodlands. The lands should be assessed for the risk of wildland fire as per PPS 2014, Section 3.1.8 “Development shall generally be directed to areas outside of lands that are unsafe for development due to the presence of hazardous forest types for wild/and fire. Development may however be permitted in lands with hazardous forest types for wildland fire where the risk is mitigated in accordance with wildland fire assessment and mitigation standards". Further discussion with the local municipality should be carried out to address how the risks associated with wildland fire will be covered for such a development proposal. Please see the Wildland Fire Risk Assessment and Mitigation Guidebook (2016) for more information.
Significant Woodlands Section 2.1.5 b) of the PPS states: Development and site alteration shall not be permitted in significant woodlands unless it has been demonstrated that there will be no negative impacts on the natural features or their ecological functions. The 2014 PPS directs that significant woodlands must be identified following criteria established by the Ontario Ministry of Natural Resources and Forestry, i.e. the Natural Heritage Reference Manual (NHRM), 2010. Where the local or County Official Plan has not yet updated significant woodland mapping to reflect the 2014 PPS, all wooded areas should be reviewed on a site specific basis for significance. The MNRF Kemptville District modelled locations of significant woodlands in 2011 based on NHRM criteria. The presence or significant woodland on site or within 120 metres should trigger an assessment of the impacts to the feature and its function from the proposed development.
Significant Wildlife Habitat Section 2.1.5 d) of the PPS states: Development and site alteration shall not be permitted in significant wildlife habitat unless it has been demonstrated that there will be no negative impacts on the natural features or their ecological functions. It is the responsibility of the approval authority to
34
TRI_EA-Ax-B-Terrestrial-Supplementary-NE-and-SAR_Rev0 April 5, 2018
identify significant wildlife habitat or require its identification. The MNRF has several guiding documents which may be useful in identification of significant wildlife habitat and characterization of impacts and mitigation options:
• Significant Wildlife Habitat Technical Guide, 2000 • The Natural Heritage Reference Manual, 2010 • Significant Wildlife Habitat Mitigation Support Tool, 2014 • Significant Wildlife Habitat Criteria Schedule for Ecoregion 5E and 6E, 2015
The habitat of special concern species (as identified by the Species at Risk in Ontario list) and Natural Heritage Information Centre tracked species with a conservation status rank of S1, S2 and S3 may be significant wildlife habitat and should be assessed accordingly.
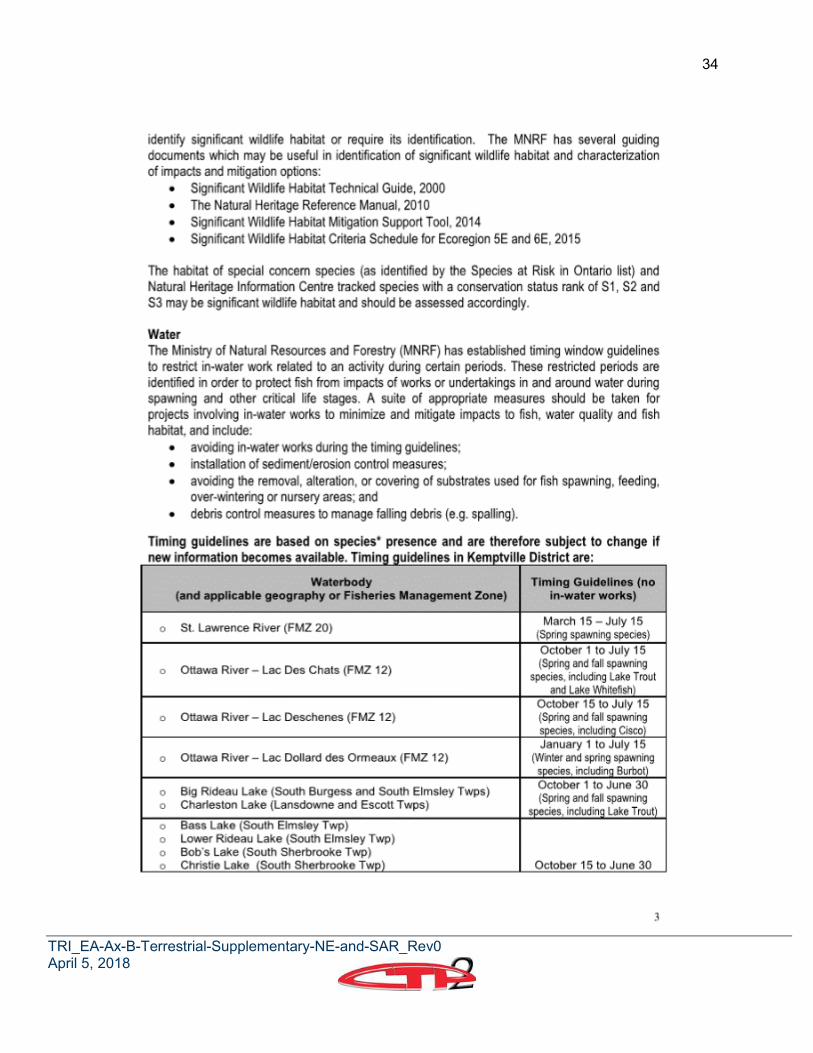
Water The Ministry of Natural Resources and Forestry (MNRF) has established timing window guidelines to restrict in-water work related to an activity during certain periods. These restricted periods are identified in order to protect fish from impacts of works or undertakings in and around water during spawning and other critical life stages. A suite of appropriate measures should be taken for projects involving in-water works to minimize and mitigate impacts to fish, water quality and fish habitat, and include:
• avoiding in-waterworks during the timing guidelines; • installation of sediment/erosion control measures; • avoiding the removal, alteration, or covering of substrates used for fish spawning, feeding, over-wintering or nursery areas; and • debris control measures to manage falling debris (e.g. spalling).
Timing guidelines are based on species* presence and are therefore subject to change if new information becomes available. Timing guidelines in Kemptville District are:
Waterbody (and applicable geography or Fisheries Management Zone)
Timing Guidelines (no in-water works)
St. Lawrence River (FMZ 20) March 15-July 15 (Spring spawning species
Ottawa River-Lac Des Chats (FMZ 12) October 1 to July 15 (Spring and fall spawning species, including Lake Trout and Lake Whitefish)
Ottawa River-Lac Deschenes (FMZ 12) October 15 to July 15 (Spring and fall spawning species, including Cisco
Ottawa River-Lac Dollard des Ormeaux (FMZ 12) January 1 to July 15 (Winter and spring spawning Species, including Burbot)
Big Rideau Lake (South Burgess and South Elmsley Twps) Charleston Lake (Lansdowne and Escott Twps)
October 1 to June 30 (Spring and fall spawning species, including lake Trout
Bass Lake (South Elmsley Twp) Lower Rideau Lake (South Elmsley Twp) Bob’s Lake (South Sherbrooke Twp) Christie Lake (South Sherbrooke Twp) October 15 to June 30

35
TRI_EA-Ax-B-Terrestrial-Supplementary-NE-and-SAR_Rev0 April 5, 2018
*Please note: Additional timing restrictions may apply as they relate to endangered and threatened species for works in both water and wetland areas. Timing restrictions are subject to change, depending on species found in a given waterbody.
Crow Lake (South Crosby Twp) Dalhousie Lake (Dalhousie Twp) Davern Lake (South Sherbrooke Twp) Farren lake (South Sherbrooke Twp) Grippen Lake (Leeds Twp) Indian Lake (South Crosby Twp) Little Long Lake (Lansdowne Twp) Millpond Lake (South Burgess) Otter Lake (South Elmsley, South Burgess and Bastard Twps) Otty Lake (North Burgess and North Elmsley Twps) Pike Lake (North Burgess Twp) Silver Lake (South Sherbrooke Twp) Redhorse Lake (Lansdowne Twp) Tay River (South Sherbrooke, Bathurst Drummond and North Elmsley Twps) Wolfe Lake (North Crosby Twp)
(Spring and Fall spawning species, including Lake Whitefish and Cisco)
Bennett Lake (Bathurst Twp) Crosby Lake (North Crosby Twp) Big Rideau Lake (South Burgess, Bastard and South Elmsley Twps) Gananoque River (Leeds Twp) Lac Georges (Plantagenet and Alfred Twps) Gillies Lake (Lanark Twp) Little Crosby Lake (North Crosby Twp) McLaren Lake (North Burgess Twp) Mississippi Lake (Drummond, Beckwith and Ramsay Twps) Mississippi River (Beckwith, Ramsay, Pakenham and Fitzroy Twps) Raisin River below Martintown dam (Charlottenburgh Twp) Rideau River (Wolford, Oxford, Montague, Marlborough, South Gower, North Gower, Osgood, Nepean and Gloucester Twps) South Lake (Leeds Twp) South Nation River below Plantagenet weir (Plantagenet Twp) Upper Rideau Lake (North Crosby Twp) Westport Sand Lake (North Crosby Twp)
January 1 - June 30 (Winter and spring spawning species, including Burbot)
Small rivers and streams (denoted on 1:50,000 National Topographic System maps as being one lined) All other waterbodies in FMZ 18
March 15 to June 30 (Spring spawning species)
In addition to adhering to the above timing guidelines, a work permit from the MNRF may be required depending on the nature and scope of work. No encroachment on the bed or banks of a waterbody/watercourse (e.g. abutments, embankments, etc.) is permitted without MNRF approval. Additional information regarding work permits may be found online at https://www.ontario.ca/page/crown-land-work-permits#section-2.
The MNRF does not have any water quality or quantity data available. We recommend that the Ministry of the Environment and Climate Change be contacted for such data along with the local Conservation Authority. For further information regarding fish habitat and protocols, please refer to the following interagency, document, Fish Habitat Referral Protocol for Ontario at: http://www.web2.mnr.gov.on.ca/mnr/ebr/fish_hab_referral/protocol_en.pdf.

36
TRI_EA-Ax-B-Terrestrial-Supplementary-NE-and-SAR_Rev0 April 5, 2018
Additional approvals and permits may be required under the Fisheries Act and the Species at Risk Act; please contact Fisheries and Oceans Canada to determine requirements and next steps. There may also be approvals required by the local Conservation Authority or Transport Canada, and these agencies should be contacted directly to determine requirements. As the MNRF is responsible for the management of provincial fish populations, we request ongoing involvement in such discussions in order to ensure population conservation.
Species at Risk A review or the Natural Heritage Information Centre (NHIC) and internal records indicate that there is a potential for the following threatened (THR) and/or endangered (END) species on the site or in proximity to it:
• Bank Swallow (THR) • Barn Swallow (THR) • Blanding's Turtle (THR) • Bobolink (THR) • Butternut (END) • Eastern Meadowlark (THR) • Loggerhead Shrike (END) • Whip poor will (THR) • Chimney Swift (THR) • Eastern Small-footed Myotis (END) • Little Brown Bat (END) • Northern Long-eared Bat (END) • Tri-Colored Bat (END)
All endangered and threatened species receive individual protection under section 9 of the ESA and receive general habitat protection under Section 10 of the ESA, 2007. Thus any potential works should consider disturbance to the individuals as well as their habitat (e.g. nesting sites). General habitat protection applies to au threatened and endangered species. Note some species in Kemptville District receive regulated habitat protection. The habitat of these listed species is protected from damage and destruction and certain activities may require authorization(s) under the ESA. For more on how species at risk and their habitat is protected, please see: http://www.ontario.ca/page/how-species-risk-are-protected.
If the proposed activity is known to have an impact on any endangered or threatened species at risk (SAR), or their habitat, an authorization under the ESA may be required. It is recommended that MNRF Kemptville be contacted prior to any activities being carried out to discuss potential survey protocols to follow during the early planning stages of a project, as well as mitigation measures to avoid contravention of the ESA. Where there is potential for species at risk or their habitat on the property, an Information Gathering Form should be submitted to Kemptville MNRF at [email protected].
The Information Gathering Form may be found here: http://www.forms.ssb.gov.on.ca/mbs/ssb/forms/ssbforms.nsf/FormDetail?OpenForm&ACT=RDR&TAB=PROFILE&ENV=WWE&NO=018-0180E

37
TRI_EA-Ax-B-Terrestrial-Supplementary-NE-and-SAR_Rev0 April 5, 2018
For more information on the ESA authorization process, please see: https://www.ontario.ca/page/how-get-endangered-species-act-permit-or-authorization
One or more special concern species has been documented to occur either on the site or nearby. Species listed as special concern are not protected under the ESA, 2007. However, please note that some of these species may be protected under the Fish and Wildlife Conservation Act and/or Migratory Birds Convention Act. Again, the habitat of special concern species may be significant wildlife habitat and should be assessed accordingly. Species of special concern for consideration:
• Eastern Wood-Pewee (SC) • Peregrine Falcon (SC) • Red-headed Woodpecker (SC) • Short-eared Owl (SC) • Snapping Turtle (SC) • Wood Thrush (SC) • Monarch (SC)
If any of these or any other species at risk are discovered throughout the course of the work, and/or should any species at risk or their habitat be potentially impacted by on site activities, MNRF should be contacted and operations be modified to avoid any negative impacts to species at risk or their habitat until further direction is provided by MNRF.
Please note that information regarding species at risk is based largely on documented occurrences and does not necessarily include an interpretation of potential habitat within or in proximity to the site in question. Although this data represents the MNRF's best current available information, it is important to note that a lack of information for a site does not mean that additional features and values are not present. It is the responsibility of the proponent to ensure that species at risk are not killed, harmed, or harassed, and that their habitat is not damaged or destroyed through the activities carried out on the site.
The MNRF continues to strongly encourage ecological site assessments to determine the potential for SAR habitat and occurrences. When a SAR or potential habitat for a SAR does occur on a site, it is recommended that the proponent contact the MNRF for technical advice and to discuss what activities can occur without contravention of the Act. For specific questions regarding the Endangered Species Act (2007) or SAR, please contact MNRF Kemptville District at [email protected].
The approvals processes for a number of activities that have the potential to impact SAR or their habitat have recently changed. For information regarding regulatory exemptions and associated online registration of certain activities. please refer to the following website: https://www.ontario.ca/page/how-get-endangered-species-act-permit-or-authorization.
Please note: The advice in this letter may become invalid if: • The Committee on the Status of Species at Risk in Ontario (COSSARO) re-assesses the status of the above-named species OR adds a species to the SARO List such that the section 9 and/or 10 protection provisions apply to those species; or • Additional occurrences of species are discovered on or in proximity to the site.

38
This letter is valid until: Thu. Jan 31, 2019
The MNRF would like to request that we continue to be circulated on information with regards
to this project. If you have any questions or require clarification please do not hesitate to contact
me. Sincerely,
Carolyn Hann Management Biologist [email protected]
Encl.\ -ESA Infosheet -NHIC/LIO Infosheet
TRI_EA-Ax-B-Terrestrial-Supplementary-NE-and-SAR_Rev0 April 5, 2018

TRILLIUM_Limebank to Bowesville AQ Report_Rev1 September 6, 2018
Air Quality Assessment
Ottawa Light Rail Transit (Stage 2) Ottawa, Ontario
Presented to:
City of Ottawa 180 Elgin Street Ottawa, ON K2P 2K3
Work Package ID:
TRILLIUM_Limebank to Bowesville AQ Report_Rev1.docx
September 6, 2018

REVISION INDEX
Revision No. Description Issue Date
0 Draft for Review August 24, 2018
1 Final Draft September 6, 2018
Prepared by: Jennifer Routhier Date: September 4, 2018
Reviewed by: Danielle Arsenault Date: September 5, 2018
Approved by: Kelly Roberts Date:
Page
TRILLIUM_Limebank to Bowesville AQ Report_Rev1 September 6, 2018
TABLE OF CONTENTS
1. INTRODUCTION 3
1.1 Approach 3
1.2 Applicable Guidelines and Standards for Air Quality Assessment 4
1.3 Existing Ambient Air Quality 6
2. METHODOLOGY 10
2.1 Study Area & Zoning 10
2.2 Receptor Selection 11
2.3 Emissions Sources 13
2.4 Emission Factors 13
2.4.1 OC Transpo Buses & Passenger Vehicles 13
2.4.2 Locomotives 15
2.4.3 AERMOD Emission Factors 17
2.5 Dispersion Modelling 20
2.5.1 Source Parameters 21
2.5.2 Metorology 22
2.5.3 Terrain 23
3. ASSESSMENT OF CUMULATIVE IMPACTS 23
3.1 NO2 Assessment using Ozone Limiting Method (OLM) 24
3.2 Cumulative Maximum Receptor Impacts 25
3.3 Frequency Analysis 26
3.3.1 1-Hour Average NO2 26
3.3.2 24-Hour Average Benzo(a)pyrene 27
3.4 Regional Air Quality and Greenhouse Gas Impacts 28
4. MITIGATION MEASURES 31
4.1 During Operation 31

TABLE OF CONTENTS (Continued) Page
TRILLIUM_Limebank to Bowesville AQ Report_Rev1 September 6, 2018 :
4.2 During Construction Activity 31
5. REFERENCES 33
APPENDICES APPENDIX A FIGURESAPPENDIX B ZONING MAPSAPPENDIX C STADLER TRAIN SPECIFICATIONSAPPENDIX D CALCULATIONSAPPENDIX E BACKGROUND AMBIENT AIR DATAAPPENDIX F INDIVIDUAL RECEPTOR IMPACTS
- 3 -
TRILLIUM_Limebank to Bowesville AQ Report_Rev1 September 6, 2018 :
•
1. INTRODUCTION As part of the Ottawa LRT Stage 2 project, the Trillium Line South (TLS) Light Rail Transit (LRT) Extension will include a rail extension south past the Ottawa Macdonald-Cartier International Airport to Earl Armstrong Road at Bowesville Road and further along to Limebank Road. The rail line operates with diesel multiple unit (DMU) trains.
An Environmental Project Report (EPR) was submitted to the Ministry of the Environment, Conservation and Parks (MECP), formerly the Ministry of Environment and Climate Change (MOECC), on January 22, 2016 for the TLS LRT project in accordance with the Transit Project Assessment Process (TPAP) detailed in the Environmental Assessment Act, Ontario Regulation (O.Reg.) 231/08.
As outlined in the 2016 EPR, the TLS Extension will add 12 km of rail to the City’s overall transit network and seven new LRT stations at Gladstone, Walkley, South Keys, Uplands, Airport, Leitrim and Bowesville. To provide the required capacity, the TLS LRT plan includes 77 m station platforms at all existing and new stations on all segments of the line. New passing tracks will provide 12-minute service along the main line and the Airport Rail Link.
Since the 2016 EPR submission, further discussion has resulted in changes to the preliminary design, including a change of location for the Bowesville transit station, the addition of a Park and Ride parking lot at the Bowesville transit station design, and the addition of a new terminal station at Limebank road with associated rail extension to this station.
An air quality impact assessment has been undertaken to determine the potential impact from construction and operation of the two new transit stations and the diesel rail line extension. The relevant assessment guidelines and methodologies are outlined in this report, along with the predicted air quality impacts and preliminary discussion on requirements for mitigation during construction of the new transit stations and the rail line extension.
1.1 Approach
The air quality study for the proposed extension involves the assessment of air emissions and impacts for one scenario:
Future Build-Out conditions (2031), ten years after the estimated date of construction completion for the proposed extension.
The Future Build-Out conditions include the addition of approximately 4.6 kilometres of track for diesel powered light rail extending south from the previously approved location of Bowesville Station, south of the Ottawa Macdonald-Cartier International Airport, to Earl Armstrong Road, and west from Bowesville Road to Limebank Road. These conditions also include the addition of two new transit stations at Bowesville Road and Limebank Road. Emissions from diesel trains, transit buses, and passenger vehicles are anticipated at each of these stations. Figures of the proposed rail alignment, and transit station layouts are provided in Appendix A.

- 4 -
TRILLIUM_Limebank to Bowesville AQ Report_Rev1 September 6, 2018 :
The air quality study for the proposed project was assessed in two stages:
• Assessment of mobile vehicular emissions using the U.S. EPA mobile emissions modelling software MOVES; and
• Assessment of local impacts from diesel train operation, OC Transit buses, and passenger vehicles using the U.S. EPA developed dispersion modelling software, AERMOD (software platform developed by Lakes Environmental).
Using the AERMOD model, hourly concentrations were predicted based on estimated worst-case hourly emission data and five years (1996–2000) of monitored hourly meteorological data, pre-processed for use in AERMOD by the MECP. The data set consists of surface data collected at the Ottawa airport, and the closest upper-air station, located in Maniwaki, Quebec.
Local air quality impacts were assessed at existing sensitive receptors and possible future representative sensitive receptors present within the Study Area. No critical receptors (i.e. hospitals, schools, extended care homes, etc.) were identified within the Study Area. In addition, a grid of receptors was placed throughout the Study Area at a resolution of 200 metres x 200 metres in order to determine the area most impacted by the modeled sources of emission. The modelled concentrations were combined with the measured ambient air concentrations of pollutants of interest. The total concentrations were then compared to the applicable Provincial and Federal air quality standards to determine if any impacts may be expected from the project.
1.2 Applicable Guidelines and Standards for Air Quality Assessment
The Ministry of Transportation (MTO) “Environmental Guide for Air Quality Impacts and Greenhouse Gas Emissions” (June 2012), Appendix 3: Assessment of Local Air Quality indicates the following pollutants as most relevant to traffic air quality assessments. The MECP indicates that certain polycyclic aromatic compounds (PAHs), specifically benzo(a)pyrene, are emitted in significant quantities from diesel train operations and should also be considered as a contaminant of interest in air quality studies.
1. carbon monoxide (CO); 2. nitrogen dioxide (NO2); 3. particulate matter with diameter less than 10 micron (PM10); 4. particulate matter with diameter less than 2.5 micron (PM2.5); 5. five (5) volatile air toxins (benzene, 1,3-butadiene, formaldehyde, acetaldehyde, and
acrolein); and 6. benzo(a)pyrene (BaP).
Benzo(a)pyrene is also significantly present within the background air quality across Ontario, and was therefore estimated in the emissions of passenger vehicles, trucks and diesel train operations for this assessment.

- 5 -
TRILLIUM_Limebank to Bowesville AQ Report_Rev1 September 6, 2018 :
The applicable standards for these pollutants are regulated by the following jurisdictions:
• MECP: Ambient Air Quality Criteria (AAQC); and • Environment Canada and Climate Change (ECCC): Canadian Ambient Air Quality
Standards (CAAQS).
A summary of the assessed pollutants and their applicable standards can be found in Table 1.1. The CAAQS denotes separate standards for 2015, 2020, and 2025, to encourage lower pollutant emissions in the future. The MECP interim 24-hour reference level for PM10 was included as a guide for decision making.
Table 1.1: Summary of Applicable Guidelines and Standards
Contaminant Source of Standard
Averaging Period
(hr)
Air Quality Threshold
Value (µg/m3 )
CO AAQC 1 36,200 AAQC 8 15,700
NO2
AAQC 1 400 AAQC 24 200
CAAQS 1 (2020) 113 CAAQS 1 (2025) 79
CAAQS Annual (2020) 32
CAAQS Annual (2025) 23
PM10 AAQC 24 50
PM2.5
CAAQS 24 (2015) 28 CAAQS 24 (2020) 27
CAAQS Annual (2015) 10
CAAQS Annual (2020) 8.8
Acetaldehyde AAQC 24 500
Acrolein AAQC 1 4.5 AAQC 24 0.4
Benzene AAQC 24 2.3 AAQC Annual 0.45
Benzo(a)pyrene AAQC 24 0.00005 AAQC Annual 0.00001
1,3-Butadiene AAQC 24 10 AAQC Annual 2
Formaldehyde AAQC 24 65
Notes: (1) µg/m3 stands for "microgram per cubic metre"

- 6 -
TRILLIUM_Limebank to Bowesville AQ Report_Rev1 September 6, 2018 :
(2) Grey standards indicate standards not used for comparison with this assessment due to the year of the future build-out scenario (2031)
(3) The CAAQS standards developed for NO2 are published as parts per billion (ppb) and are shown here converted to µg/m3 for consistency
(4) The PM 50 µg/m3 10 24-hour standard represents an interim AAQC adopted in 1997
(5) The PM2.5 µg/m3 annual and 24-hr standards are reflective of current CAAQS, updated from the previous Canada-Wide Standards (CWS).
The AAQCs were developed by the MECP and are a list of desirable concentrations of a contaminant in air, based on protection against adverse effects on health or the environment. Limits are set based on “limiting effects” (i.e. adverse effects) which are provided alongside a contaminant’s AAQC value and averaging time, reflecting the lowest concentration at which an adverse effect may be expected to occur. Applicable limiting effects may include health, odour, vegetation, visibility, particulate, corrosion, or others. The concentrations noted in the AAQCs are based on averaging period, indicating various time periods at which adverse effects may be experienced. Ambient air quality studies, such as traffic studies, may use these AAQC limits to assess a project’s adverse effect on the local population and environment.
The CAAQS are health-based air quality objectives for pollutant concentrations in air. Under the Air Quality Management System, ECCC and Health Canada have established air quality standards for fine particulate matter and nitrous oxides. Ambient air quality studies, such as traffic studies, may use these CAAQS limits to assess a project’s health-based impact to the local population for fine particulates. More stringent limits are projected for future particulate levels (post-2020) and future NO2 levels (post-2020 and -2025) to encourage reduction in emissions from all sectors (transportation, industrial, etc.).
1.3 Existing Ambient Air Quality
A study of existing ambient air quality for the pollutants of interest was completed using publically available air quality data from ambient air quality monitoring stations within Ontario and Quebec. The monitoring stations selected for this study are owned and operated by the MECP and ECCC under the National Air Pollution Surveillance (NAPS) program, and are listed below in Table 1.2 alongside their respective monitored contaminants.

- 7 -
TRILLIUM_Limebank to Bowesville AQ Report_Rev1 September 6, 2018 :
Table 1.2: Summary of Monitoring Stations and Ambient Air Data
NAPS Monitoring Stations
Station Name Ottawa Central
Ottawa Downtown
Gatineau-Hull
Saint Anciet, QC
Montréal Riviére des Pariries, QC
NAPS Number 60106 60104 50204 54401 50129
Address 960 Carling Ave.
Rideau St. & Wurtemburg
St.
255 St-Redempteur,
Hull 1128 de la
Geurre 12400 Wilgrid-
Ouellette
Latitude 45.382528 45.43433 45.435987 45.120627 45.651691 Longitude -75.714194 -75.676 -75.723429 -74.288475 -73.573825
Station Type Urban Urban Urban Rural Rural Height of Air
Intake 5 m 4 m N/A N/A N/A
Elevation ASL 84 m 72 m 62 m 50 m 29 m
Pollutants Measured
O3, NO2, PM2.5
O3, CO, NO2, PM2.5,
Benzene, 1,3-
Butadiene
O3, CO, NO2, PM2.5
CO, PM2.5, Benzene,
1,3-Butadiene, Formaldehyde, Acetaldehyde,
Acrolein
CO, PM2.5, Benzene,
1,3-Butadiene, Formaldehyde, Acetaldehyde,
Acrolein, Benzo(a)pyrene
Notes: ASL – Above Sea Level
For each contaminant, the highest of all applicable monitoring station’s average 90th percentile values for the most recent three (3) years of complete data was taken as the representative background level. For most contaminants, the most recent and complete three-year data set was taken from the years 2014 to 2016. Table 1.3 below shows a summary of the maximum 90th percentile values for each contaminant for all respective averaging periods.
PM10 is not a monitored contaminant by either the MECP or ECCC, therefore ambient concentrations were estimated using the measured PM2.5 ambient concentrations and a ratio of PM2.5 / PM10 of 0.54, measured in an air quality study on ambient fine particulate concentrations published in the journal, Atmospheric Environment, issue 38 (2004), called "Estimation of historical annual PM2.5 exposures for health effects assessment" (Lall et. al, 2004). This ratio is an MECP approved methodology for predicting PM10 background air quality levels.

- 8 -
TRILLIUM_Limebank to Bowesville AQ Report_Rev1 September 6, 2018 :
( )
))
)
))
( (
(
( (
Table 1.3: Background Ambient Air Quality Concentrations
Contaminant Averaging
Period (hr)
Station Name 1 Station ID 2014 2015 2016 Maximum Average
NO2 1 Ottawa 060104 30.10 30.10 28.41 30.10 29.54 24 Ottawa 060104 26.34 28.22 26.15 28.22 26.90
Annual 2 Ottawa 060104 13.17 13.17 12.98 13.17 13.11
CO 1 Ottawa 060104 343.68 343.68 343.68 343.68 343.68 8 Ottawa 060104 343.68 343.68 343.68 343.68 343.68
PM10 4 24 Saint-Anicet 054401 24.07 24.07 20.37 24.07 22.84
PM2.5 24 Saint-Anicet 054401 13.00 13.00 11.00 13.00 12.33 Annual 2 Ottawa 060104 9.00 7.00 7.00 9.00 7.67
Acetaldehyde 24 Saint-Anicet 054401 1.70 3.38 Incomplete5 3.38 2.54
Acrolein 1 3 Saint-Anicet 054401 0.02 2.73 Incomplete5 2.73 1.37 24 Saint-Anicet 054401 0.02 0.04 Incomplete5 0.04 0.03
Benzene6 24 Ottawa 060104 0.75 0.80 0.59 0.80 0.71 Annual 2 St-Anciet 054401 0.43 0.46 0.42 0.46 0.44
Benzo(a)pyrene 24 Montreal 050129 2.27E-04 1.74E-04 5.73E-05 2.27E-04 1.53E-04 Annual 2 Montreal 050129 8.92E-05 1.05E-04 3.42E-05 1.05E-04 7.62E-05
1,3-Butadiene 24 Ottawa 060104 0.06 0.07 0.04 0.07 0.06 Annual 2 Ottawa 060104 0.03 0.03 0.03 0.03 0.03
Formaldehyde 24 Saint-Anicet 054401 2.40 0.04 Incomplete5 2.40 1.22 Notes:
1 The station with the highest recorded value for each contaminant is shown from a selection of six separate stations in the Ottawa region.
2 Annual averaging period shows the calculated Annual Average for each study year. 3 VOC recorded data was provided as a daily average for the years 2014-2016, therefore hourly 90th
percentile values were assumed to be equal to the daily 90th percentile measurements. 4 PM2.5 / PM10 = 0.54, as per Lall et. al, "Estimation of historical annual PM2.5 exposures for health effects
assessment", Atmospheric Environment 38 (2004) 5 Only 9 months of measured data is available. 6 2016 annual maximum benzene level is recorded at Saint-Anicet Station.
The background concentrations for each contaminant were compared to the applicable Provincial and Federal concentration limits for all time averaging periods. All contaminants were found to be below the applicable limits, with the exception of benzo(a)pyrene which exceeded the 24-hr and Annual AAQC limit by 306% and 762%, respectively, as shown in Table 1.4.

- 9 -
TRILLIUM_Limebank to Bowesville AQ Report_Rev1 September 6, 2018 :
Table 1.4: Comparison of Background Concentrations to Air Guidelines/Standards
Contaminant Averaging Period (hr)
Background Concentration
(µg/m3 )
AAQC Standard (µg/m3 )
% of AAQC/ CAAQS Standard
NO2 1 (2025) 30 79 37%
24 27 200 13% Annual (2025) 13 23 58%
CO 1 344 36,200 1% 8 344 15,700 2%
PM10 24 23 50 46%
PM2.5 24 (2023) 12 27 46%
Annual (2023) 7.67 8.8 87% Acetaldehyde 24 2.54 500 1%
Acrolein 1 1.37 4.5 31%
24 0.031 0.4 8%
Benzene 24 0.71 2.3 31%
Annual 0.437 0.45 97%
Benzo(a)pyrene 24 0.0002 0.00005 306%
Annual 0.0001 0.00001 762%
1,3-Butadiene 24 0.057 10 1%
Annual 0.031 2 2% Formaldehyde 24 1.22 65 2%
Notes: (1) Exceedances to air quality thresholds are shown in red
It was assumed that the historic ambient air quality background will be representative of Future Build-Out (2031) background air quality conditions. This is a conservative estimate as there are numerous Provincial and Federal initiatives in place to reduce levels of ambient air pollutants. It is also anticipated that increasingly stringent vehicle emission limits will lower on-road traffic emissions despite the anticipated rise in traffic volume.

- 10 -
TRILLIUM_Limebank to Bowesville AQ Report_Rev1 September 6, 2018 :
2. METHODOLOGY
2.1 Study Area & Zoning
The study area includes the rail corridor extension from the previously proposed Bowesville transit station location (assessed in the existing EA submission for the Trillium Line) to the revised location of Bowesville transit station and further west to the new Limebank transit station. The study area includes all sources and receptors within a one (1) kilometre radius around each transit station, and within a 300 metre radius from the proposed rail extension.
There is an existing residential development to the north and north-west of the proposed Limebank transit station, and the remaining land uses are non-residential in nature with the exception of some houses on select plots of land zoned for agricultural use. The City of Ottawa has indicated that future residential development is anticipated in the future as better transit opportunities become available to the area. For conservative purposes, this assessment has assumed the entire study area will be treated as residentially zoned land use. A selection of ‘possible future receptors’ has been included in the model for assessment where no existing receptors currently exist.
The study area for this assessment is presented in Figure 2.1, showing the location of the rail corridor and transit stations included in the assessment.

- 11 -
TRILLIUM_Limebank to Bowesville AQ Report_Rev1 September 6, 2018 :
Figure 2.1: Study Area
2.2 Receptor Selection
Within the study area, ninteen (19) sensitive receptor locations as listed in Table 2.1, were selected to determine the potential worst-case impact from the rail corridor extension. They were selected due to their proximity to the emission sources present within the study area.
In addition to these discrete receptors, a grid of 200 metre x 200 metre resolution was created within the study area, and along the study area boundary, to determine the predicted areas of highest impact.

- 12 -
TRILLIUM_Limebank to Bowesville AQ Report_Rev1 September 6, 2018 :
( )
Table 2.1: Representative Air Quality Sensitive Receptor Locations Receptor
ID 1 UTM-X UTM-Y Receptor Type Receptor Description
R1 447999.74 5014724.13 Residence Existing house located at 948 Wildcarrot Crescent R2 447636.40 5014718.92 Residence Existing house located at 622 Whitecliffs Ave. R3 447418.66 5014465.51 Residence Existing house located at 554 Dusty Miller Crescent R4 447328.69 5014246.79 Residence Existing house located at 222 Eye Bright Crescent
R5 447903.51 5013835.51 Residence Existing house located at 500 m south of Bowesville transit station on Bowesville Road
R6 450346.39 5015084.27 Residence Existing house located at 230 m south of Limebank transit station on Limebank Road
R7 448249.99 5014851.44 Future Residence
Possible future house to the north-west of Limebank transit station
R8 447511.25 5013663.04 Future Residence
Possible future house to the south of Limebank transit station
R9 448317.14 5014071.83 Future Residence
Possible future house to the south-west of Limebank transit station
R10 449175.27 5014727.87 Future Residence
Possible future house to the south of Limebank extension
R11 448587.82 5014894.26 Future Residence
Possible future house to the north of Limebank extension
R12 449415.02 5015228.10 Future Residence
Possible future house to the north of Limebank extension
R13 449698.25 5014985.75 Future Residence
Possible future house to the south of Limebank extension
R14 450013.60 5015826.68 Future Residence
Possible future house to the north of Bowesville station
R15 450241.35 5015333.22 Future Residence
Possible future house to the south of Bowesville station
R16 450407.78 5016074.87 Future Residence
Possible future house to the north of Bowesville station
R17 450661.81 5015534.69 Future Residence
Possible future house to the south of Bowesville station
R19 450904.57 5016669.74 Future Residence
Possible future house east of Bowesville north extension
R20 450519.35 5016853.81 Future Residence
Possible future house west of Bowesville north extension
Notes: 1 R18 was originally included in the modelling of the study area, however was removed due to the future
expropriation of the lot. Figure A1 in Appendix A shows the location of this receptor, which was removed from the modelling results assessment.
Figure A1 in Appendix A shows the locations of the representative sensitive receptors in addition to the other modelled grid receptors within study area.
Zoning maps within the Study Area are included in Appendix B. Land use within the study area includes residentially zoned areas, agriculturally zoned areas, and parks or open space zones.

- 13 -
TRILLIUM_Limebank to Bowesville AQ Report_Rev1 September 6, 2018 :
2.3 Emissions Sources
The following sources were assessed:
• Mobile Trillium Line diesel locomotives (Stadler FLIRT); • Idling Trillium Line diesel locomotives (Stadler FLIRT) at the Bowesville and Limebank
transit stations; • OC Transpo diesel transit buses traveling within the Bowesville and Limebank transit
stations; • OC Transpo diesel transit buses idling within the Bowesville and Limebank transit
stations; • Passenger vehicles idling at the Passenger Pick-up and Drop-off (PPUDO) areas at
Bowesville and Limebank transit stations; and • Passenger vehicles moving, idling, and starting within the Park-n-Ride parking lot
located at Bowesville transit station.
2.4 Emission Factors
2.4.1 OC Transpo Buses & Passenger Vehicles
The air quality assessment included emissions estimation using the U.S. EPA emissions modelling software MOVES2014a. This software provides emission rates for a wide variety of source types (i.e. passenger cars, motorcycles, long-haul trucks, etc.), speed bins, road types, and emission processes (i.e. running emissions, idling emissions, tire wear, brake wear, etc.).
The U.S. EPA emissions modelling software MOVES2014a calculates emissions from mobile sources using a variety of factors: time span, geographic bounds, vehicle type, road type, and emission or process type. The time span calculates emission using default fleet composition and fuel criteria specific to a pre-selected year, month, hour, and weekday/weekend profile. Fleet composition and fuel criteria are also specific to geographic location, with default database data provided for each county in the United States. For Canada, the closest US County to the project Study Area is selected to provide fleet and fuel characteristics as close of a match as possible. For this assessment, the, St. Lawrence County in New York State was selected to represent the Ottawa area.
There are thirteen vehicle types and five fuel types in MOVES2014a. For this assessment two combinations of source type and fuel type were assessed were passenger vehicles operating with gasoline fuel representing the vehicle fleet which will be using the Park-n-Ride parking lot at Bowesville transit station, and transit buses operating with diesel fuel to represent the OC Transpo bus fleet.

- 14 -
TRILLIUM_Limebank to Bowesville AQ Report_Rev1 September 6, 2018 :
Emissions in MOVES2014a are divided into four major categories:
(1) Running emissions; (2) Start emissions; (3) Evaporative emissions; and (4) Particulate emissions from brake wear and tire wear.
Evaporative emissions include the following the sub-categories: evaporative permeation, fuel vapour venting, fuel leaks, refueling displacement vapour loss, refueling spillage loss, vapour loss during running emissions, and vapour loss during idling. All types of evaporative emissions, except idling vapour emissions, are included within the calculated MOVES2014a running emission factor used in the air quality study.
The most recently released version of MOVES2014a (version 2014a) was used to estimate emissions from the study area. The model was used to generate running emission rates in a gram of pollutant per vehicle mile traveled (g/VMT) and idling emission rates in gram of pollutant per vehicle per hour for all pollutants of concern: CO, NOX, PM10, PM2.5, benzo(a)pyrene, and each of the five volatile air toxics. Emission rates were generated for the months with the most extreme temperature conditions, namely January and July. The maximum emission rate of these two months was selected as the “worst-case” emission rate for dispersion modelling. Default MOVES values were used to estimate the average age distribution of the vehicle fleet for 2031.
Idling emission rates were estimated for passenger vehicles and transit buses using the applicable emission rate for the lowest speed bin in MOVES2014a. The product of this emission rate in grams per vehicle kilometer traveled (g/VKT) and the maximum vehicle speed rate of this speed bin (4.02 km/hr) was used for the estimation of vehicle fleet emissions for dispersion modelling. Start emission rates were conservatively assumed to be from a cold engine, namely after 6 to 12 hours of remaining parked.
Table 2.2 shows the applicable emission factors generated by MOVES2014a for the Future Build-Out scenario (2031) for use in the AQ study assessment.

- 15 -
TRILLIUM_Limebank to Bowesville AQ Report_Rev1 September 6, 2018 :
Table 2.2: Summary of MOVES2014a Vehicle Emission Rates
Pollutant
Bus Emissions Passenger Vehicle Emissions Running
(12-20 km/hr) (g/VKT)
Idling
(g/veh-hr)
Running (12-20 km/hr)
(g/VKT)
Idling
(g/veh-hr)
Start (Soak 6-12 hr)
(g/Start) NOX 2.1020 31.6601 0.0162 0.0644 0.6200 CO 0.6269 9.2550 1.2598 9.3469 21.8129
PM10 0.5934 5.5180 0.1116 1.2953 0.0650 PM2.5 0.1214 1.3577 0.0165 0.1874 0.0575
Acetaldehyde 0.0075 0.1183 0.0000 0.0002 0.0579 Acrolein 0.0012 0.0188 0.0000 0.0000 0.0036 Benzene 0.0015 0.0234 0.0003 0.0032 0.1129
Benzo(a)pyrene 0.0000 0.0001 0.0000 0.0000 0.0000 1,3-Butadiene 0.0003 0.0042 0.0000 0.0000 0.0256 Formaldehyde 0.0212 0.3334 0.0001 0.0005 0.0252
2.4.2 Locomotives
The U.S. EPA has established emission standards for oxides of nitrogen (NOx), hydrocarbons (HC), carbon monoxide (CO), and particulate matter (PM) for several different types of locomotives, divided by tiers of emission standard based on year of manufacture, as follows: • Tier 0 standards apply to locomotive engines originally manufactured from 1973 to 1992; • Tier 1 standards apply to locomotives and locomotive engines originally manufactured
from 1993 to 2004; • Tier 2 standards apply to locomotives and locomotive engines originally manufactured
from 2005 to 2011; • Tier 3 standards apply to locomotives and locomotive engines originally manufactured
from 2012 to 2014; and • Tier 4 standards apply to locomotives and locomotive engines originally manufactured
after 2015.
Locomotive emissions were estimated using the U.S. EPA emission standards, assuming the most stringent Tier 4 of standards according to the engine emissions guarantee provided for the model of locomotive proposed for the rail corridor extension: the Stadler FLIRT four-car diesel multiple unit (DMU) train. The emission standards guaranteed by the manufacturer (Stadler) are provided in Appendix C.
This assessment includes emissions from the Stadler FLIRT trains, however elsewhere along the Trillium Line there will be another train model also in operation, the Alstom Coradia LINT train, which will provide service up to the Ottawa Macdonald-Cartier

- 16 -
TRILLIUM_Limebank to Bowesville AQ Report_Rev1 September 6, 2018 :
( (
))
International Airport, but no further south. For this reason, Alstom LINT train emissions were not included within the assessment.
Emissions of carbon monoxide (CO), nitrous oxides (NOx), and particulate matter (PM) were estimated directly from the provided U.S. EPA Tier 4 emission standards, however for other criteria air contaminants, a set of speciation factors were developed using heavy vehicle diesel combustion emissions (source ID 62: long-haul combination trucks) from MOVES2014a. These speciation factors are summarized below in Table 2.3.
Table 2.3: VOC and PM Speciation Factors for Locomotive Emissions
Pollutant VOC Speciation Factor 1
PM Speciation Factor 2
NOX -- -- CO -- --
PM10 -- 1 PM2.5 -- 0.92
Acetaldehyde 0.0384 -- Acrolein 0.0058 -- Benzene 0.0074 --
Benzo(a)pyrene -- 0.000059 1,3-Butadiene 0.0010 -- Formaldehyde 0.1136 --
Notes: 1 VOC speciation factor is applied to the Stadler FLIRT HC emission rate. 2 PM speciation factor is applied to the Stadler FLIRT PM emission rate
Volatile organic compound (VOC) speciation factors were determined by comparison to total gaseous hydrocarbons (HC) emissions. Fine particulate matter (PM2.5) and benzo(a)pyrene (BaP) speciation factors were determined by comparison to total respirable particulate (PM10) emission factors. Benzo(a)pyrene emissions are most often linked to respirable particulate from diesel engine emissions.
The emissions of criteria air contaminants (CACs) from the Stadler FLIRT trains were conservatively quantified by employing two settings of route-specific and engine-specific emission factors and exhaust parameters derived based on engine notch settings and power output, as provided by Stadler. Where information was not readily available from Stadler, published locomotive specific exhaust emission data was used to conservatively estimate missing data values for modelling.
To remain conservative in the assessment of locomotive emissions, it was assumed that trains traveling between stations would be operating at 100% power output and top speed. Trains were determined to have an approximate twelve (12) minute headway between arrival at each station, resulting in an assumed five (5) train per hour estimation. Trains at the Bowesville Station were determined to have an approximate two (2) minute idling period between arrival and departure, and trains at the Limebank Station were determined to have

- 17 -
TRILLIUM_Limebank to Bowesville AQ Report_Rev1 September 6, 2018 :
a worst-case twelve (12) minute idling period between arrival and departure to account for turn-around time at the terminal station of the Trillium Line. Real time estimates for terminal station idling would be lower in actual operation. These estimations were based on scheduling data provided by the City of Ottawa, as shown in Appendix C.
Table 2.4 presents the emission rates derived for the Stadler FLIRT trains from U.S. EPA Tier 4 emission standards and applicable VOC and PM speciation factors. These emission factors are provided for the two conditions assessed within the study area: idling at the transit stations and travel (at top notch) between stations.
Table 2.4: Stadler FLIRT DMU Locomotive Tier 4 Emission Factors
Pollutant
Train Emissions: Stadler
Running
(g/veh-hr)
Idling
(g/veh-hr) NOX 768 273 CO 6,720 2,385
PM10 38.400 13.630 PM2.5 35.328 12.540
Acetaldehyde 14.007 4.972 Acrolein 2.133 0.7571 Benzene 2.699 0.9579
Benzo(a)pyrene 0.0023 0.0008 1,3-Butadiene 0.3499 0.1242 Formaldehyde 41.439 14.709
2.4.3 AERMOD Emission Factors
Emission factors provided by MOVES2014a and U.S. EPA Tier 4 standards for vehicles and locomotives were used in conjunction with source-specific data to determine worst-case gram per second (g/s) emission rates to be applied to the dispersion modelling (AERMOD) source input. Table 2.5 shows the source specific data used to determine emission rates, with assumptions marked and explained within the notes below.

- 18 -
TRILLIUM_Limebank to Bowesville AQ Report_Rev1 September 6, 2018 :
Table 2.5: Source Description & Parameters
Link Description Link Dimensions
Vehicle / peak hour
(vph)
Additional Source Parameters & Assumptions
Trains running between Bowesville and Limebank Stations: Line Volume Source
4.59 km 5 - 480 kW per engine (x4 per train) - 12 minute headway per station - 5 trains per hour
Trains idling at Bowesville Station: Point Source -- 5
- 170 kW per engine (x4 per train) - 12 minute headway - 1 minute of idling at platform
Trains Idling at Limebank Station: Point Source -- 5
- 170 kW per engine (x4 per train) - 12 minute headway - 12 minute of idling at platform (train
turnover time at end of line) OC Transpo buses idling at designated PPUDO area of Bowesville Station: Area Source
2,400 m2 20
- 1 minute of idling per bus - 12 minutes headway - 4 bus platforms - 20 vehicles per hour
OC Transpo buses idling at designated PPUDO area of Limebank Station: Area Source
1,740 m2 45
- 1 minute of idling per bus - 12 minutes headway - 9 bus platforms - 45 vehicles per hour
OC Transpo buses traveling through designated PPUDO area of Bowesville Station: Line Volume Source
0.4027 km 20 - Travel speed of 20 km/hr (0.4 km total) - 12 minutes headway - 4 bus platforms - 20 vehicles per hour
OC Transpo buses traveling through designated PPUDO area of Limebank Station: Line Volume Source
0.2474 km 45
- Travel speed of 20 km/hr (0.24 km total)
- 12 minutes headway - 9 bus platforms - 45 vehicles per hour
Idling/Running/Starts emissions from passenger vehicles at the Bowesville Station Park-n-Go lot: Area Source
66,782 m2 640.8
- Assumed cars idle 0.5 min before engine shut off and after engine start
- Travel speed 15 km/hr (0.225 km total) - 1780 vehicle maximum capacity - AM Period 5 AM – 12 PM - PM Period 1 PM – 8 PM
Idling passenger vehicles at designated PPUDO area of Bowesville Station: Area Source
600 m2 40 - 1 minute of idling per vehicle - 12 minutes headway (matching trains) - 8 PPUDO spots - 40 vehicles per hour
Idling passenger vehicles at designated PPUDO area of Limebank Station: Area Source
322 m2 30
- 1 minute of idling per vehicle - 12 minutes headway (matching trains) - 6 PPUDO spots - 30 vehicles per hour

- 19 -
TRILLIUM_Limebank to Bowesville AQ Report_Rev1 September 6, 2018 :
An example of the methodology used to convert the MOVES or U.S. EPA Tier 4 standard emission factors to a gram per second emission rate is shown in Appendix D, along with sample calculations for each source type. Table 2.6 shows the emission rates calculated for locomotives operating within the study area, while Table 2.7 shows the emission rates calculated for OC Transpo buses operating within the study area, and Table 2.8 shows the emission rates calculated for passenger vehicles operating within the study area.
Table 2.6: Stadler FLIRT Dispersion Model Emission Rates
Pollutant
Running Stadler FLIRT
Trains
(g/s)
Idling Stadler FLIRT Trains at Bowesville
Station (g/s)
Idling Stadler FLIRT Trains at Limebank
Station (g/s)
NOX 1.067 0.0063 0.0757 CO 9.333 0.0552 0.6626
PM10 0.0533 0.0003 0.0038 PM2.5 0.0491 0.0003 0.0035
Acetaldehyde 1.95E-02 1.15E-04 1.38E-03 Acrolein 2.96E-03 1.75E-05 2.10E-04 Benzene 3.75E-03 2.22E-05 2.66E-04
Benzo(a)pyrene 3.14E-06 1.86E-08 2.23E-07 1,3-Butadiene 4.86E-04 2.87E-06 3.45E-05 Formaldehyde 5.76E-02 3.40E-04 4.09E-03
Table 2.7: OC Transpo Bus Dispersion Model Emission Rates
Pollutant
OC Transpo Bus Idling at Bowesville
Station
(g/s)
OC Transpo Bus Idling at
Limebank Station
(g/s)
OC Transpo Bus
Traveling at Bowesville
Station (g/s)
OC Transpo Bus
Traveling at Limebank
Station (g/s)
NOX 0.0029 0.0066 0.0047 0.0065 CO 0.0009 0.0019 0.0014 0.0019
PM10 0.0005 0.0011 0.0013 0.0018 PM2.5 0.0001 0.0003 0.0003 0.0004
Acetaldehyde 1.095E-05 2.465E-05 1.681E-05 2.323E-05 Acrolein 1.737E-06 3.908E-06 2.666E-06 3.685E-06 Benzene 2.167E-06 4.875E-06 3.325E-06 4.596E-06
Benzo(a)pyrene 6.330E-09 1.424E-08 8.587E-09 1.187E-08 1,3-Butadiene 3.892E-07 8.757E-07 5.982E-07 8.269E-07 Formaldehyde 3.087E-05 6.946E-05 4.735E-05 6.546E-05

- 20 -
TRILLIUM_Limebank to Bowesville AQ Report_Rev1 September 6, 2018 :
Table 2.8: Passenger Vehicle Dispersion Model Emission Rates
Pollutant
Passenger Vehicles at
the Bowesville
Station Park-n-Ride
(PEAK AM) (g/s)
Passenger Vehicles at the
Bowesville Station Park-
n-Ride (PEAK PM)
(g/s)
Passenger Vehicles
Idling at the Bowesville
Station PPUDO
(g/s)
Passenger Vehicles Idling
at the Limebank Station PPUDO
(g/s) NOX 0.0007 0.1111 1.193E-05 8.949E-06 CO 0.0643 3.9470 1.731E-03 1.298E-03
PM10 0.0064 0.0180 2.399E-04 1.799E-04 PM2.5 9.400E-04 1.117E-02 3.470E-05 2.603E-05
Acetaldehyde 1.706E-06 1.031E-02 4.143E-08 3.107E-08 Acrolein 2.054E-07 6.392E-04 4.988E-09 3.741E-09 Benzene 1.841E-05 2.011E-02 5.834E-07 4.375E-07
Benzo(a)pyrene 7.733E-08 5.442E-06 2.749E-09 2.061E-09 1,3-Butadiene 0.000E+00 4.552E-03 0.000E+00 0.000E+00 Formaldehyde 3.803E-06 4.492E-03 9.237E-08 6.928E-08
The Park-n-Ride parking lot passenger vehicle emissions at Bowesville station were estimated assuming a different type of operation during AM peak hour and PM peak hour. It was assumed in the morning that the only type of emission occurring would be vehicles entering the parking lot, traveling an average distance to find a parking spot, and idling for 30 seconds prior to shutting off their engines. In the PM peak hour, it was assumed that those same operations would occur, with the addition of emissions from a cold-engine start. To remain realistically conservative, a generic vehicle distribution was applied to each of the AM and PM assumed periods of operation (5 AM – 12 PM, and 1 PM – 8 PM; with a peak AM hour occurring between 7 AM – 8 AM and a peak PM hour occurring between 5 PM – 6 PM). The assumed peak hour vehicle volume was then applied to each hour of the AM and PM periods, respectively. This method is explained in detail within Appendix D.
2.5 Dispersion Modelling
The calculated emissions and road traffic for each pollutant per study area link were modelled using AERMOD, an emission dispersion model developed by the U.S. EPA. The model is capable of predicting impacts from a variety of source types, including stationary sources (e.g. stacks), line-volume sources (e.g. roads), stationary volume sources (e.g. pile unloading), and area sources (e.g. waste water lagoons). This model was used instead of the U.S. EPA mobile source emission model, CAL3HQCR, due to the presence of idling and parking lot emissions from buses and passenger vehicles at both the Bowesville transit station and Limebank transit station. AERMOD predicts contaminant impacts using high level calculations based on the Gaussian dispersion model in conjunction with hourly meteorological data. A five-year meteorological data set of the Ottawa region was pre-processed by the MECP for direct use in AERMOD for the years 1996-2000 using raw meteorological data from surface and upper air meteorological stations close to the study area. For each link and area source, a worst-case hourly profile of emissions and source

- 21 -
TRILLIUM_Limebank to Bowesville AQ Report_Rev1 September 6, 2018 :
( )
)(
data was input into the model. AERMOD source, meteorological, and terrain input data is described in the following sections.
2.5.1 Source Parameters
Three types of sources were used to estimate emissions from the Bowesville and Limebank transit stations and Trillium Line rail extension: point sources (idling Stadler FLIRT trains), Line-Volume sources (vehicle travel within transit stations and Trillium Line moving locomotives), and area sources (vehicle idling and parking lots). The source-specific input data for point sources, line-volume sources, and area sources are presented in Table 2.9, Table 2.10, and Table 2.11, respectively.
Table 2.9: Point Source Input Parameters
Link ID Release Height
(m)
Exit Temp.
(o C)
Stack Inside Diameter
(m)
Exit Flow Rate
(m3 /s)
Exit Velocity
(m/s) Idling Trains at
Bowesville 4.2 139 0.150 0.1699 9.61
Idling Trains at Limebank 4.2 139 0.150 0.1699 9.61
Table 2.10: Line-Volume Source Input Parameters
Link ID Release Height 1
(m)
Plume Height 2
(m)
Plume Width (m)
Initial Sigma Z
(m)
Initial Sigma Y
(m) Running Trains 4.2 4.37 19 2.03 8.84
Running Buses at Bowesville 2.975 5.95 8.59 2.77 4.00
Running Buses at Limebank 2.975 5.95 8.59 2.77 4.00
Notes: 1 Train release height was set to the height of the train cars, as provided by Stadler for the
FLIRT Ottawa Trillium Line trains. 2 Train plume height was calculated using SCREEN3 with accurate exhaust parameters
provided by Stadler for the FLIRT Ottawa Trillium Line trains.

( )
)
)
(
(
- 22 -
TRILLIUM_Limebank to Bowesville AQ Report_Rev1 September 6, 2018 :
Table 2.11: Area Source Input Parameters
Link ID Release Height 1,2
(m)
Length of X Side
(m)
Length of Y Side
(m)
Orientation Angle from North
(m)
Initial Vertical
Dimension 3
(m) Buses Idling at
Bowesville 3.5 30 80 63 1.628
Buses Idling at Limebank 3.5 15 116 62.84 1.628
Park-n-Ride Lot 0.5 ~155 ~138 ~62 0.698 PPUDO at Bowesville 0.5 10 60 62 0.698
PPUDO at Limebank 0.5 14.12 22.80 -24.31 0.698
Notes: 1 Assumed average height of a passenger vehicle is 1.5 m with an exhaust release height
of 0.5 m 2 Assumed average height of an OC Transpo bus is 3.5 m, with an exhaust release at the
same height 3 Initial vertical dimension was calculated using the assumed vehicle height divided by 2.15
2.5.2 Meteorology
Five years of pre-processed regional meteorological data from 1996-2000 for the Ontario Eastern region (Ottawa, Peterborough, Belleville) was obtained from the MECP. This dataset uses raw meteorological data collected from the Ottawa airport surface station (station ID 6101000), and the corresponding upper-air station located in Maniwaki (station ID 7034480).
The data is generally accepted by the MECP for Environmental Assessment and Air Quality Assessment purposes. The wind rose for the five (5) year period showing wind direction (blowing from) and wind speed is presented in Figure 2.2. The prevalent wind direction is blowing from the southwest and northwest.

- 23 -
TRILLIUM_Limebank to Bowesville AQ Report_Rev1 September 6, 2018 :
Figure 2.2: Wind Rose for Eastern Region, Ontario
2.5.3 Terrain
Digital elevation model (DEM) data were obtained from the MECP. The DEM data were used to include effects of terrain in the dispersion modelling source and receptor impacts. The terrain used is from the Ottawa region DEM data set: tiles 1353_4 and 1354_4.
3. ASSESSMENT OF CUMULATIVE IMPACTS A local air quality impact assessment was conducted to determine maximum cumulative contaminant concentrations. The modelled worst-case hourly concentrations due to combined emissions from trains, OC Transpo buses, and passenger vehicles were combined with background concentrations for each contaminant to determine cumulative maximum concentration at sensitive and critical receptors. For any contaminants showing an exceedance of one or more standards, a frequency analysis was conducted to estimate the potential period of exposure.

- 24 -
TRILLIUM_Limebank to Bowesville AQ Report_Rev1 September 6, 2018 :
3.1 NO2 Assessment using Ozone Limiting Method (OLM)
The concentration of nitrogen dioxide (NO2) in the atmosphere is affected by the reaction of nitrous oxide (NO) with ozone (O3), which is a by-product of mobile vehicle fuel combustion. The atmospheric reaction of NO with ozone is demonstrated as follows:
NO + O3 → NO2 + O2
It is assumed that the rate of conversion of NO to NO2 is controlled by the availability of ozone in the ambient atmosphere. This principle is called the “ozone limiting method” (OLM). Using the same principles, given a high enough concentration of ozone in the ambient atmosphere, all of the emitted NO emissions will convert to NO2 and disperse in the same way as other intert combusion products from mobile vehicles.
According to NOX studies done by the U.S. EPA, emissions of NOX from combustion are primarily in the form of NO (U.S. EPA, 1999). Modelled concentrations of NOX were therefore used along with ambient measured concentrations of background ozone levels from nearby MECP and Environment Canada monitoring stations to calculate the concentrations of NO2 at a given sensitive receptor. The Québec Ministry of the Environment published a technical guide for calculating atmospheric concentration of NO2 using the OLM method (Couture, 2008), described as follows:
• If the concentration (part per million, ppm) of NO is lower than that of ozone ([NO] < [O3] or, more precisely, [O3 > 0.9 [NOX]), then we assume that all of NO was converted to NO2 : [NO2] = [NOX]
• If the concentration (ppm) of NO is greater than that of ozone ([NO] > [O3]), then the concentration of NO equal to the concentration (ppm) of ozone is converted to NO2 : [NO2] = [O3] + 0.1*[NOX]
The concentration of ambient ozone was taken as the overall average of the maximum 90 th percentile value of measured ozone concentrations at the NAPS Ottawa Downtown (NAPS ID 060104), Ottawa Central (NAPS ID 060106), and Gatineau-Hull (NAPS ID 050204) for a three-year period from 2013 to 2015 (Table 3.1).
Table 3.1: Local Ambient Ozone Levels
90th Percentile Concentrations (ppb)
Contaminant Averaging
Period (hour)
Data Source 2014 2015 2016 Maximum Average
O3 1 NAPS 41 42 41 42 41 24 NAPS 38 39 37 39 38
Annual NAPS 27 24 23 27 25
The modelled concentration of NOX for the Future Build-Out conditions (2031) and the resulting calculated NO2 concentration using the OLM method are shown in Table 3.2.

- 25 -
TRILLIUM_Limebank to Bowesville AQ Report_Rev1 September 6, 2018 :
Table 3.2: NO2 Calculation Using OLM Method
Scenario Averaging
Period (hour)
Modelled NOx Concentration
(ppb)
Background O3 Concentration
(ppb)
OLM NO2 Concentration
(ppb)
OLM NO2 Concentration
(µg/m3 )
2031 Build-Out
1 48 41 46 86.1 24 14 38 14 25.4
Annual 3 25 3 4.73
3.2 Cumulative Maximum Receptor Impacts
Table 3.3 shows the predicted pollutant concentrations through modelling, including background air quality levels, evaluated at all selected sensitive receptors within the study area. The maximum receptor concentrations are compared to the respective time averaging period air quality threshold from either AAQC or CAAQS standards. The maximum impacts for each receptor are shown in Appendix F for all pollutants.
Table 3.3: Cumulative Concentrations – Future Build-Out Conditions (2031)
Averaging Period Pollutant
Background Level
(µg/m3 ) (3)
Modelled Concentration
(Maximum) (µg/m3 )
Cumulative Concentration
(Maximum) (µg/m3 )
Air Quality Threshold
(µg/m3 )
Maximum Impacted Receptor
1-hour NO2 29.54 71.64 101.18 79 R14 CO 344 1864 2208 36,200 R14 Acrolein 1.374 0.3332 1.707 4.5 R14
8-hour CO 344 687 1031 15,700 R16
24-hour
NO2 26.90 25.41 52.31 200 R12 PM10 22.84 2.115 24.95 50 R16 PM2.5 12.33 1.409 13.74 27 R16 Benzo(a)pyrene 0.00015 0.00038 0.00053 0.00005 R16 Acetaldehyde 2.539 0.8779 3.417 500 R16 Acrolein 0.0311 0.0817 0.1128 0.4 R16 Benzene 0.7127 1.310 2.023 2.3 R16 Formaldehyde 1.225 1.357 2.582 65 R12 1,3-Butadiene 0.0571 0.2922 0.3493 10 R16
Annual
NO2 13.11 4.728 17.84 23 R12 PM2.5 7.667 0.2193 7.886 8.8 R12 Benzo(a)pyrene 0.00008 0.00004 0.0001 0.00001 R16 Benzene 0.4372 0.1316 0.5688 0.45 R16 1,3-Butadiene 0.0306 0.0288 0.0594 2 R16
Notes: (1) NO2 is represented using the MOVES emission rate for NOX; it is converted to NO2 concentration using
the ozone limiting method (OLM). (2) Air Quality Threshold for fine particulate (PM2.5) is based on the 98th percentile ambient measurement
(24-hour), annually averaged over three years. This standard is referenced from the appropriate year of
- 26 -
TRILLIUM_Limebank to Bowesville AQ Report_Rev1 September 6, 2018 :
( ) 3 1 hour, 8 hour, and 24 hour ambient concentrations for the contaminants were obtained from the 90th percentile of hourly measurements from representative air quality monitoring stations. Annual ambient concentrations for the contaminants were obtained from the mean measurements at the representative air quality monitoring stations.
the Canadian Ambient Air Quality Standards (CAAQs): 2020 CAAQs for the 2031 Future No- Build and Build-out year. The CAAQs are voluntary objectives.
(4) Exceedances to air quality thresholds are shown in red.
From the results shown in Table 3.3, it is clear that benzene and benzo(a)pyrene both exceed their respective air quality limits. This is due in part to the existing presence of high level background concentrations in the area, and in part to the modelled contributions from the project. For example, though the background levels of benzo(a) pyrene already exceed the applicable air quality thresholds, the modelled concentrations are also significant exceeding contributors. Nitrogen oxide also exceeds the stringent 2025 air quality limit, which was introduced this year by the CQAAS. The frequency of exceedance for the 24 hour and 1 hour averaging periods is provided in further detail in Section 3.3. Isopleths showing the areas of highest impact for all averaging periods exceeded are provided in Appendix A.
3.3 Frequency Analysis
For the Future Build Scenario (2031) a series of frequency analysis were conducted to estimate the potential period of exposure for contaminants which exceeded their respective time averaging period air quality standards at the most impacted receptor. The impacts from both modelled and background air quality were included in this assessment to show the relative contribution from the project emissions. Each of the following figures shows the percentage of time at which the most impacted receptor is experiencing any given concentration, with the respective air quality standard limits noted for reference.
3.3.1 1-Hour Average NO2
Figure 3.1 shows the frequency analysis curve that represents the percentage of time at which the most impacted receptor is experiencing a given concentration of NO2 averaged over a 1-hour period, in relation to the relevant air quality standard. The contribution from background air quality is shown in blue, while the contribution of the project is shown in green. The figure shows that project emissions are contributing more than 40% of the cumulative concentration only 4% of the time. It also shows that project emissions are contributing less than 10% of the cumulative concentration for 80% of the time.

- 27 -
TRILLIUM_Limebank to Bowesville AQ Report_Rev1 September 6, 2018 :
Figure 3.1: Frequency Analysis at the Most Impacted Receptor: 1-hr NO2
3.3.2 24-Hour Average Benzo(a)pyrene
Figure 3.2 shows the frequency analysis curve that represents the percentage of time at which the most impacted receptor is experiencing a given concentration of benzo(a)pyrene averaged over a 24-hour period, in relation to the relevant air quality standard. The contribution from background air quality is shown in blue, while the contribution of the project is shown in green. The figure shows that project emissions are contributing more than 40% of the cumulative concentration only 5% of the time. It also shows that project emissions are contributing less than 12% of the cumulative concentration for 70% of the time.

- 28 -
TRILLIUM_Limebank to Bowesville AQ Report_Rev1 September 6, 2018 :
Figure 3.2: Frequency Analysis at the Most Impacted Receptor: 24-hr BaP
3.4 Regional Air Quality and Greenhouse Gas Impacts
The annual emissions from the project were estimated for key air quality impact pollutants and greenhouse gases (GHG) in order to determine regional impact. The analysis was conducted by comparing the net emissions from the Bowesville transit station, Limebank transit station, and interconnecting rail line to the transportation (rail) sector annual emissions in both Ontario and Canada. The analysis focused on criteria air contaminants (CAC) NO2, CO, and PM2.5, which are contributors to smog, as well as GHGs. Table 3.4 shows the relative CAC contributions of the project compared to the Ontario and Canada rail transportation sector CAC contributions.

- 29 -
TRILLIUM_Limebank to Bowesville AQ Report_Rev1 September 6, 2018 :
Table 3.4: Regional Emissions Compared to Project Emissions (2031)
Contaminant Future Build-Out (2031) Scenario
(tonnes)
Rail Transportation
Emissions (Ontario: 2031)
(tonnes)
% Project Contribution
Rail Transportation
Emissions (Canada: 2031)
(tonnes)
% Project Contribution
NOX 31.25 24,138 0.13% 110,000 0.03% CO 325.0 3,508 9.26% 16,000 2.03%
PM2.5 1.570 564 0.28% 2,500 0.06%
Notes: (1) Source: Environment Canada, 2018 Air Pollutant Emission Inventory (APEI) for the rail
transportation sector, showing results for the most recent complete year of data (2016). (2) NO2 is expressed as NOx in the APEI.
Mobile vehicles emit the following GHGs in significant amounts:
• Carbon dioxide (CO2); • Methane (CH4); and • Nitrous oxide (N2O).
Total GHG emissions were calculated using a combination of MOVES emission rates and total annual traffic projections. MOVES is capable of calculating atmospheric carbon dioxide (CO2), Methane (CH4), and Nitrous oxide (N2O) emissions varying with vehicle class, speed, and emission process type (i.e. running emissions, starting emissions, etc.). Annual total GHG emissions were calculated by combining the grams per second (g/s) emission rates derived from MOVES County Scale and Project Scale output for each of the GHG pollutants with the projected annual source usage to extrapolate an annual emission.
Individual greenhouse gases have differing abilities to absorb heat in the atmosphere. These varying heat absorption properties are quantified by an individual global warming potential (GWP) factor for each contaminant which converts the mass of a GHG to the representative equivalent mass of CO2 (CO2 eq). The GWPs are calculated based on the amount of heat trapping potential that would result from the emission of 1 kg of a given GHG to the emission of 1 kg of CO2. GWPs for various GHG compounds are defined by Environment Canada in their Technical Guidance on Reporting Greenhouse Gas Emissions (2016) document, summarized for compounds of interest below in Table 3.5.

- 30 -
TRILLIUM_Limebank to Bowesville AQ Report_Rev1 September 6, 2018 :
Table 3.5: Greenhouse Gas 100-year GWP
Greenhouse Gas 100-year GWP
Carbon dioxide (CO2) 1
Methane (CH4) 25
Nitrous oxide (N2O) 298
Currently there are no GHG emission standards in Canada or the United States on a per-1source basis. However, Ontario’s Climate Change Update, published in 2014 , outlines
GHG targets for various industrial sectors, including the Transportation sector. Figure 11 of the 2014 Climate Change Update report shows historical and projected megatons (Mt) of CO2 eq produced by the transportation sector. The Project contributions of GHG in the Air Quality Assessment year (2021) were compared to the projected CO2 eq contributions from the Ontario Transportation sector, shown below in Table 3.6.
1 MECP’s “Ontario’s Climate Change Update 2014” accessed March 24, 2017 https://dr6j45jk9xcmk.cloudfront.net/documents/3618/climate-change-report-2014.pdf
Table 3.6: Greenhouse Gas (GHG) Emissions Compared to Project GHG Emissions (2031)
Contaminants
Future Build-Out (2031) Scenario (tonnes)
Projected Rail Transportation
Emissions (Ontario: 2031)
(Mt)
% Project Contribution
Rail Transportation
Emissions (Canada: 2016)
(Mt)
% Project Contribution
CO2 2348 -- -- -- -- N2O 0.081 -- -- -- -- CH4 0.491 -- -- -- --
CO2,eq 2384 56 0.004% 173 0.001%
Notes: (1) Mt = Megatons (2) CO2,eq was calculated using GWP conversion for N2O and CH4 (3) Ontario GHG projected emissions for 2031 sourced from the MECP’s “Ontario’s Climate
Change Update, 2014” Figure 11, Page 23. (4) Canada GHG emissions for 2016 were sourced from the "National Inventory Report 1990-
2016 GHG Sources and Sinks in Canada, Part 3"

- 31 -
TRILLIUM_Limebank to Bowesville AQ Report_Rev1 September 6, 2018 :
4. MITIGATION MEASURES
4.1 During Operation
The implementation of this Trillium Line rail extension is anticipated to provide an overall net benefit to the Air Quality of the City of Ottawa. Increased accessible public transit options reduce the number of individual passenger vehicles travelling through arterial roads within outlying communities and traveling within the city core. This reduces overall traffic and congestion, especially during high volume periods of travel during the morning and afternoon.
The modelled cumulative results presented in Table 3.3 show an air quality threshold limit exceedance of nitrogen oxide, benzene, and benzo(a)pyrene. The exceedances of benzo(a)pyrene, benzene, and nitrogen oxides are attributed to both of their respective existing background concentrations, and also to the emissions from the project. The frequency of exceedance presented in Figure 3.1 for nitrogen oxides at the most impacted receptor shows that cumulative impacts from both the project contributions and background air quality exceeds the applicable air quality threshold less than 1% of the time.
Reductions in project contribution may be achieved by implementing a “no idling” policy at each station for passenger vehicles, and reducing the idling time of both trains and buses as much as possible. The City of Ottawa already has policies of this nature in place, as described within their Idling Control By-law (No. 2007-266).
4.2 During Construction Activity
Construction activity creates and releases fine particulates and traces of other vapours into the surrounding community. Both construction workers and members of the general public residing near any construction site may be affected by the release of these contaminants. It is therefore recommended to control the creation and release of particulates, especially during hot and dry weather, as typically occurs during the summer months. Construction activities which potentially prove most impactful to the local air quality include, but are not limited to:
• Clearing and grubbing; • Grading and rock blasting; • Road and surface paving; • Storage of granular material; • Structure construction/deconstruction; and • Mobile on-site equipment.
As shown in Figure 2.2 Section 2.5.2, the prevailing winds blow from the southwestern direction and northwest direction. The worst-case impact to the local community and on-site workers during construction activity would occur during periods of low-velocity surface wind characteristics and stable atmospheric conditions, which would promote minimal local dispersion for particulates and other contaminants at ground level. Therefore, the most impacted area by any construction activity would be expected to be located northeast and southeast of the construction site.

- 32 -
TRILLIUM_Limebank to Bowesville AQ Report_Rev1 September 6, 2018 :
Factors that affect the local impacts of construction activity include the proximity of a receptor to the construction site, the hours of operation of the construction site, the number of machines running or activities occurring on a construction site at any given time, and the meteorological conditions at which those activities or operations occur. When considering mitigation strategies and practices, special consideration should be given to predominant wind directions, and operation during early morning and evening hours which typically have lower dispersion and wind activity. Special care should also be taken near areas zoned as Open Space, Conservation.
Exposure to construction related emissions can be mitigated by the following:
• Ensuring all mobile equipment is in good condition, properly and regularly maintained, and compliant with applicable federal and provincial regulations for off-road diesel engines;
• Ensuring all machinery is maintained and operated in accordance to manufacturer’s specification;
• Locating stationary equipment (i.e. generators, compressors, etc.) as far away from sensitive receptors as practical;
• Ensuring stationary and mobile equipment are not operated during early morning (before 6 AM, or sunrise) or evening periods (after 8 PM, or sunset) as often as practical;
• Implementing a Dust Management Plan for the duration of the construction phase, which includes practices to minimize fine particulate release from mobile equipment, materials handling, and wind erosion; and
• Ensuring that the areas most impacted by particulate levels are vegetated to reduce the cumulative particulate impacts.
In addition, the MECP recommends the Cheminfo Services Inc. Best Practices for the Reduction of Air Emissions from Construction and Demolition Activities Environment Canada (March 2005)
Report prepared for for a comprehensive list of fugitive dust prevention and
air emission control measures.
- 33 -
TRILLIUM_Limebank to Bowesville AQ Report_Rev1 September 6, 2018 :
5. REFERENCES AECOM Canada Ltd., (2014), Highway 17 Planning & Class EA Study Air Quality
Assessment Report GWP 5670-10-00.
Canadian Council of Ministers of the Environment (CCME), (2012). Guidance Document on Achievement Determination Canadian Ambient Air Quality Standards for Fine Particulate Matter and Ozone (PN 1483 978-1-896997-91-9 PDF). Winnipeg, MB: Canadian Council of Ministers of the Environment.
Cheminfo Services Inc., (2005), Best Practices for the Reduction of Air Emissions from Construction and Demolition Activities. Markham, ON: Environment Canada
Couture, Y., (2008). Guide d’estimation de la concentration de dioxyde d’azote (NO2) dans l’air ambiant lors de l’application des modèles de dispersion atmosphérique. Québec, ministère du Développement durable, de l’Environnement et des Parcs, Direction du suivi de l’état de l’environnement (ISBN 978-2-550-53731-1 (PDF)), 7 pages.
Eckhoff, P. A. & Braverman, T. N., (1995). Addendum to the User’s Guide to CAL3QHC Version 2.0 (CAL3QHCR User’s Guide). Research Triangle Park, NC: Office of Air Quality Planning and Standards.
Environment Canada, (2015). Facility Greenhouse Gas Emissions Reporting: Technical Guidance on Reporting Greenhouse Gas Emissions (CAT No. En81-6E-PDF). Gatineau, QB: Environment Canada Inquiry Centre.
Lall, R., Kendall, M., Ito, K., Thurston, G. D., (2004). Estimation of historical annual PM2.5 exposures for health effects assessment. Atmospheric Environment. 38 (2004), 5217-5226.
Ontario Ministry of Environment, Conservation, and Parks, (2012). Ambient Air Quality Criteria (PIBS 657001). Toronto, ON: Standards Development Branch.
Ontario Ministry of the Environment and Climate Change, (2014). Ontario’s Climate Change Update. Toronto, ON: Ministry of the Environment and Climate Change.
Ontario Ministry of Transportation, (2012) Environmental Guide for Assessing and Mitigating the Air Quality Impacts and Greenhouse Gas Emissions of Provincial Transportation Projects. St. Catharines, ON: Environmental Policy Office.
United States Environmental Protection Agency, (1995). Paved Roads. In Compilation of Air Pollutant Emission Factors Volume I: Stationary Point and Area Sources (Section 13.2.1). Retrieved from https://www3.epa.gov/ttnchie1/ap42/ch13/final/c13s0201.pdf
United States Environmental Protection Agency, (1995). User’s Guide to CAL3QHC Version 2.0: A Modelling Methodology for Predicting Pollutant Concentrations Near Roadway Intersections (EPA 456/R-92-006). Research Triangle Park, NC: Office of Air Quality Planning and Standards.

- 34 -
TRILLIUM_Limebank to Bowesville AQ Report_Rev1 September 6, 2018 :
United States Environmental Protection Agency, (1999). Technical Bulletin: Nitrogen Oxides (NOx), why and how they are controlled (EPA 456/F-99-006R). Research Triangle Park, NC: Office of Air Quality Planning and Standards.
United States Environmental Protection Agency, (2015). MOVES2014a 2014a User Guide (EPA-420-B-15-095). Washington, DC: Assessment and Standards Division, Office of Transportation and Air Quality.

:
APPENDIX A FIGURES
TRILLIUM_Limebank to Bowesville AQ Report_Rev0 August 24, 2018

PROJECT TITLE:
Figure A1: OLRT Trillium Limebank Extension Receptors
COMMENTS:
Orange grid represents 200 m x 200 m uniform cartesian receptors.
Yellow labeled indicators represent discrete cartesian receptors for both existing residences and potential future developments.
SOURCES:
10
COMPANY NAME:
AECOM Canada Ltd.
RECEPTORS:
793
DATE:
8/24/2018
PROJECT NO.:
60444198 AERMOD View - Lakes Environmental Software C:\Lakes\AERMOD View\2018\OLRT_20_v2\OLRT_20_v2.isc
1 km
1:36,705SCALE:
0

PROJECT TITLE:
Figure A2: OLRT Trillium Limebank Extension NOx 1-hr Isopleth
COMMENTS:
CAAQS Compliance in conjuction with existing background air quality levels for NO2 are approximately shown at the 50 ug/m3 isopleth mark
SOURCES:
10
COMPANY NAME:
AECOM Canada Ltd.
RECEPTORS:
793
OUTPUT TYPE:
Concentration
MAX:
209 ug/m^3
DATE:
8/23/2018
PROJECT NO.:
60444198 C:\Lakes\AERMOD View\2018\OLRT_NOX_v2\OLRT_NOX_v2.isc
SCALE:
0 1 km
1:34,381
AERMOD View - Lakes Environmental Software

PROJECT TITLE:
Figure A3: OLRT Trillium Limebank Extension Benzo(a)pyrene 24-hr isopleth
SOURCES:
10
COMPANY NAME:
AECOM Canada Ltd.
RECEPTORS:
793
OUTPUT TYPE:
Concentration
MAX:
9.3E-04 ug/m^3
DATE:
8/23/2018
PROJECT NO.:
60444198 C:\Lakes\AERMOD View\2018\OLRT_BaP_v2\OLRT_BaP_v2.isc
SCALE:
0 1 km
1:35,507
COMMENTS:
AERMOD View - Lakes Environmental Software

PROJECT TITLE:
Figure A4: OLRT Trillium Limebank Extension Benzo(a)pyrene annual isopleth
SOURCES:
10
COMPANY NAME:
AECOM Canada Ltd.
RECEPTORS:
793
OUTPUT TYPE:
Concentration
MAX:
2.3E-04 ug/m^3
DATE:
8/23/2018
PROJECT NO.:
60444198 C:\Lakes\AERMOD View\2018\OLRT_BaP_v2\OLRT_BaP_v2.isc
SCALE:
0 1 km
1:35,507
AERMOD View - Lakes Environmental Software
COMMENTS:

PROJECT TITLE:
Figure A5: OLRT Trillium Limebank Extension Benzene Annual Isopleth
SOURCES:
10
COMPANY NAME:
AECOM Canada Ltd.
RECEPTORS:
793
OUTPUT TYPE:
Concentration
MAX:
0.776 ug/m^3
DATE:
8/23/2018
PROJECT NO.:
60444198 C:\Lakes\AERMOD View\2018\OLRT_20_v2\OLRT_20_v2.isc
SCALE:
0 1 km
1:33,143
AERMOD View - Lakes Environmental Software
COMMENTS:

TRILLIUM_Limebank to Bowesville AQ Report_Rev0August 24, 2018:
APPENDIX B ZONING MAPS

Figure B1 : Ottawa Zoning Map, OLRT Trillium Line Notes:
[1] Zoning Map from City of Ottawa (http://maps.ottawa.ca/geoOttawa/?layer=Zoning) [2] Zoning Codes as indicated on this map may be found in the following written sections,
provided by the City of Ottawa online zoning map
DR
L2
R5GM
R3
O1
AG
RU

1/3
AG - Agricultural Zone (Sec. 211-212) | 8/23/2018 City of Ottawa
AG Agricultural Zone (Sec. 211-212)
Purpose of the Zone
The purpose of the AG Agricultural Zone is to:
(1) recognize and permit agricultural uses in areas designated Agricultural Resource Area in theOfficial Plan;
(2) restrict the range of permitted uses to agricultural, forestry and related accessory uses in orderto preserve these prime agricultural lands from loss to other uses;
(3) regulate uses in a manner that respects the character of the area and minimizes land useconflicts; and,
(4) identify, through the use of subzones, those existing farm lots having lot area and lot widthminimums that are less than the minimums required in the principal Agricultural zone.
211. In the AG Zone: Permitted Uses
(1) The following uses are permitted subject to the following: (a) the provisions of subsections 211(3) to (5); (b) a maximum of 3 guest bedrooms is permitted in a bed and breakfast ; (Bylaw 2008326) (c) a maximum of 10 persons are permitted in a group home; (Bylaw 2008326)
agricultural use, see Part 2, Section 62 bed and breakfast , see Part 5, Section 121 one detached dwelling envir onmental preserve and educational area equestrian establishment forestry operation group home, see Part 5, Section 125 homebased business, see Part 5, Sections 127 and 128 homebased daycare, see Part 5, Section 129 kennel , see Part 3, Section 84 secondary dwelling unit, see Part 5, Section 133
Conditional Permitted Uses
(2) The following conditional uses are permitted subject to the following: (a) the provisions of subsection 211(3) to (5);
(b) provided that they are located on the same lot and are accessory or ancillary toan agricultural use and the main detached dwelling;
(c) provided that they serve as housing for farm help and the minimum lot size must be 10hectares;
(d) provided that in addition to the main detached dwelling there is a maximum of either: i) one additional detached dwelling and two mobile homes or bunk house dwelling, or, ii) three mobile homes or bunk house dwelling; bunk house dwelling

8/23/2018 DR - Development Reserve Zone (Sec. 237-238) | City of Ottawa
1/2(c) Minimum Front Yard Setback (m)
DR Development Reserve Zone (Sec. 237238)
Purpose of the Zone
The purpose of the DR Development Reserve Zone is to:
(1) recognize lands intended for future urban development in areas designated as General Urban Area and Developing Communities in the Official Plan, and future village development in areas designated as Village in the Official Plan;
(2) limit the range of permitted uses to those which will not preclude future development options; and
(3) impose regulations which ensure a low scale and intensity of development to reflect the characteristics of existing land uses.
(4) permit limited lot creation on existing public streets in villages that will not preclude future development options in the DR3 – Development Reserve Subzone 3. (Bylaw 201358)
237. In the DR Zone, Permitted Uses
(1) The following uses are permitted subject to: (a) the provisions of subsection 237(2); agricultural use emergency service envir onmental preserve and education area forestry operation group home, see Part 5, Section 125 homebased business, see Part 5, Section 127 marine facility one detached dwelling accessory to a permitted use park secondary dwelling unit,see Part 5, Section 133 urban agriculture (Bylaw 2017148)
Zone Provisions
(2) The zone provisions are set out in Table 237 below.
TABLE 237– DR ZONE REGULATIONS
I Zoning Mechanisms
II Zone Provisions
(a) Minimum Lot Width (m) No minimum
(b) Minimum Lot Area (m2)

8/23/2018 GM - General Mixed Use Zone (Sec. 187-188) | City of Ottawa
1/27place of assembly
GM General Mixed Use Zone (Sec. 187188)
Purpose of the Zone
The purpose of the GM – General MixedUse Zone is to:
(1) allow residential, commercial and institutional uses, or mixed use development in the General Urban Area and in the Upper Town, Lowertown and Sandy Hill West Character Areas of the Central Area designations of the Official Plan;
(2) limit commercial uses to individual occupancies or in groupings in well defined areas such that they do not affect the development of the designated Traditional and Arterial Mainstreets as viable mixeduse areas;
(3) permit uses that are often large and serve or draw from broader areas than the surrounding community and which may generate traffic, noise or other impacts provided the anticipated impacts are adequately mitigated or otherwise addressed; and
(4) impose development standards that will ensure that the uses are compatible and complementsurrounding land uses.
187. In the GM Zone, Permitted NonResidential Uses
(1) The following nonresidential uses are permitted subject to: (a) the provisions of subsections 187(3), (4) and (5).
animal care establishment animal hospitalartist studio bank bank machine catering establishmentclick and collect facility (Bylaw 2016289) community centre community health and resour ce centre convenience store day care diplomatic mission, see Part 3, Section 88 drive-through facility emergency service funeral home homebased busines, see Part 5, Section 127 homebased day care, see Part 5, Section 129 instructional facility library medical facility municipal service centre office payday loan establishment (Bylaw 2017302) personal service business

8/23/2018 L2 - Major Leisure Facility Zone (Sec. 175-176) | City of Ottawa
1/6
L2 Major Leisure Facility Zone (Sec. 175176)
Purpose of the Zone
The purpose of the L2Major Leisure Facility Zone is to:
(1) accommodate major, urban Citywide sports, recreational and cultural facilities addressed under the Major Urban Facilities policies of the Official Plan;
(2) permit a broad range and intensity of leisure, recreational, cultural and related uses; and (3) allow a moderate density and scale of development.
175. In the L2 Zone: Permitted Uses
(1) The following uses are permitted subject to: (a) the provisions of subsection 175(2).
amusement park community centre community health and resour ce centre day care fairgr ound golf course library museum park place of assembly recreational and athletic facility retail food store, limited to a farmers’ market (Bylaw 2016134) school sports arena theatr e urban agriculture, see Part 3, Section 82 (Bylaw 2017148)
(b) the following use is permitted only in association with amusement park, library, sports arena and theatre: drive-thr ough facility (OMB Order #PL080959 issued March 18, 2010)
(c) Where an outdoor farmers’ market is located on a lot with another use, the primary or subzone provisions do not apply and the farmers’ market may only by located in a: (i) parking lot; (ii) yard abutting a parking lot; and, (iii) front or corner side yard; associated with the other use. (Bylaw 2016134)
Zone Provisions
(2) The zone provisions are set out in Table 175 below.

8/23/2018 L2 - Major Leisure Facility Zone (Sec. 175-176) | City of Ottawa
2/6
TABLE 175 L2 ZONE REGULATIONS
I Zoning Mechanisms
II Zone Provisions
(a) Minimum Lot Width (m) No minimum (b) Minimum Lot Area (m2) No minimum (c) Minimum Front Yard Setback (m) (d) Minimum Rear Yard Setback (m)
7.5 (e) Minimum Interior Side Yard Setback (m) (f) Minimum Corner Side Yard Setback (m) (g) Maximum Height (m) 11 (h) Maximum Lot Coverage (%) 75
(3) For other applicable provisions, see Part 2 General Provisions, Part 3 Specific Use Provisionsand Part 4Parking, Queuing and Loading Provisions.
L2 SUBZONES
176. In the L2 Zone, the following subzones apply: L2A SUBZONE - NEPEAN SPORTSPLEX
(1) In the L2A Subzone, the provisions set out in Table 176 below apply.
TABLE 176 L2A SUBZONE REGULATIONS
I Zoning Mechanism
II Regulation
(a) Minimum Yard Setbacks (m) 10 (b) Maximum Lot Coverage (%) 35
L2B SUBZONE - CENTRAL AREA FACILITIES
(2) In the L2B Subzone, (a) the following additional uses are permitted:
restaurantretail store
(b) Table 175 does not apply.
L2C SUBZONE - LANSDOWNE
(3) In the L2C Subzone,
(a) The following uses are permitted provided they are located on the

8/23/2018 O1 - Parks and Open Space Zone (Sec. 179-180) | City of Ottawa
1/6
O1 Parks and Open Space Zone (Sec. 179180)
Purpose of the Zone
The purpose of the O1Parks and Open Space Zone is to:
(1) permit parks, open space and related and compatible uses to locate in areas designated as General Urban Area, General Rural Area, Major Open Space, Mixed Use Centre, Village, Greenbelt Rural and Central Area as well as in Major Recreational Pathway areas and along River Corridors as identified in the Official Plan, and
(2) ensure that the range of permitted uses and applicable regulations is in keeping with the low scale, low intensity open space nature of these lands.
179. In the O1 Zone: Permitted Uses
(1) The following uses are permitted subject to: (a) the provisions of subsection 179(2).
envir onmental preserve and education area park urban agriculture, see Part 3, Section 82 (Bylaw 2017148)
(b) a retail food store, limited to a farmer’s market is a permitted use in the O1A, O1B, O1D, O1E, O1F, O1G, O1H subzones, subject to: (i) no building or structure other than one farmer’s market stand is permitted;
the farmer’s market stand is not subject to the primary or subzone provisions, however (ii) the maximum height is 3.5 metres and the maximum size of the farmer’s market stand
is 28 square metres, and;
(iii) a farmer’s market stand may only be located in a parking lot or in a front or corner side yard. (Bylaw 2016135)
Zone Provisions
(2) The zone provisions are set out in Table 179 below.
TABLE 179 O1 ZONE REGULATIONS
I Zoning Mechanisms
II Zone Provisions
(a) Minimum Lot Width (m) No minimum (b) Minimum Lot Area (m2) No minimum (c) Minimum Front Yard Setback (m) (d) Minimum Rear Yard Setback (m)

8/23/2018 R5 - Residential Fifth Density Zone (Sec. 163-164) | City of Ottawa
1/12
R5 Residential Fifth Density Zone (Sec. 163164)
Purpose of the Zone The purpose of the R5 Residential Fifth Density Zone is to:
(1) allow a wide mix of residential building forms ranging from detached to midhigh rise apartment dwellings in areas designated as General Urban Area, Mixed Use Centre or Central Area in the Official Plan;
(2) allow a number of other residential uses to provide additional housing choices within the fifth density residential areas;
(3) permit ancillary uses to the principal residential use to allow residents to work at home and to accommodate convenience retail and service uses of limited size ;
(4) ensure that residential uses predominate in selected areas of the Central Area, while allowing limited commercial uses;
(5) regulate development in a manner that is compatible with existing land use patterns so that the mixed building form, residential character of a neighbourhood is maintained or enhanced; and (Bylaw 2009392)
(6) permit different development standards identified in the Z subzone, primarily for areas designated as Developing Communities, which promote efficient land use and compact form while showcasing newer design approaches.
163. In the R5 Zone: Permitted Uses
(1) The following uses are permitted uses subject to: (a) the provisions of subsection 163 (3) to (18); (b) a maximum of ten guest bedrooms in a bed and breakfast ; (c) a maximum of ten residents are permitted in a group home. (Bylaw 2008341) (d) (Bylaw 2008341) apartment dwelling , low rise
apartment dwelling, midhigh rise (Subject to Bylaw 2014292) bed and breakfast, see Part 5, Section 121 detached dwelling diplomatic mission, see Part 3, Section 88 duplex dwelling, see Part 5, Section 138 (Bylaw 2010307) dwelling unit group home, see Part 5, Section 125 homebased business, see Part 5, Section 127 homebased daycare, see Part 5, Section 129 linkeddetached dwelling, see Part 5, Section 138(Bylaw 2010307) park planned unit development, see Part 5, Section 131 residential care facility retir ement home, converted, see Part 5, Section 122 retir ement home rooming house secondary dwelling unit , see Part 5, Section 133 semidetached dwelling, see Part 5, Section 138(Bylaw 2010307) shelter , see Part 5, Section 134 stacked dwelling, see Part 5, Section 138 (Bylaw 2010307) threeunit dwelling townhouse dwelling, see Part 5, Section 138 (Bylaw 2012334) (Bylaw 2010307) (Bylaw 2014189) urban agriculture, see Part 3, Section 82 (Bylaw 2017148) (Bylaw 2018206)
Conditional Permitted Uses (2) Conditional uses are also permitted in the R5 zone, subject to the following:
(a) they are listed in Column III of Table 164A; and (b) they are subject to additional provisions as identified by the subscript in Column III of Table 164A, which refers to a number in Column I of Table 164B which sets out the additional provision.
Zone Provisions (3) The zone provisions are set out in Table 164A and 164B. (Bylaw 200918)
Where a planned unit development is permitted on a lot in the subzone, the provisions of Section 131 apply, and the associated subzone (4) provisions identified in Table 164 A affecting permission of uses, minimum lot widths and lot areas, as well as minimum required
setbacks apply to the whole of the lot, while the maximum height applies to each permitted dwelling type within the planned unit development.
(5) A diplomatic mission and group home that is not a prohibited use listed in Column II of Table 164A, is subject to the subzone provisions for a detached dwelling if included in Column IV, otherwise it will be subject to the subzone provisions for an apartment dwelling, low rise.
(6)
A retirement home, rooming house, mixed use building and any other permitted nonresidential use that is not a prohibited use listed in Column II of Table 164A, and that is four storeys or less in height, is subject to the subzone provisions for an apartment dwelling, low rise. A retirement home, rooming house, mixed use building and any other permitted nonresidential use that is not a prohibited use listed in Column II of Table 164A and that is more than four storeys in height, is subject to the subzone provisions for

8/23/2018 RU - Rural Countryside Zone (Sec. 227-228) | City of Ottawa
1/3
RU Rural Countryside Zone (Sec. 227228)
Purpose of the Zone
The purpose of the RU – Rural Countryside Zone is to:
(1) accommodate agricultural, forestry, country residential lots created by severance and other land uses characteristic of Ottawa’s countryside, in areas designated as General Rural Area, Rural Natural Features and Greenbelt Rural in the Official Plan;
(2) recognize and permit this range of ruralbased land uses which often have large lot or distance separation requirements; and
(3) regulate various types of development in manners that ensure compatibility with adjacent land uses and respect the rural context.
227. In the RU Zone: Permitted Uses
(1) The following uses are permitted subject to the following: (a) the provisions of subsection 227(2) to (5); (b) a maximum of 10 guest bedrooms is permitted in a bed and breakfast (c) a maximum of 10 persons are permitted in a group home, (d) a maximum of 10 persons are permitted in a retirement home, converted
agricultural use, see Part 2, Section 62 animal care establishment animal hospital artist studio bed and breakfast, see Part 5, Section 121 cemetery detached dwelling equestrian establishment envir onmental preserve and educational area forestry operation group home, see Part 5, Section 125 homebased business, see Part 5, Sections 127 and 128 homebased day care, see Part 5, Section 129 kennel, see Part 3, Section 84 retir ement home, converted, see Part 5, Section 122 secondary dwelling unit, see Part 5, Section 133
Zone Provisions
(2) In the RU Zone, development must comply with the provisions of Table 227:
TABLE 227 - RU ZONE PROVISIONS
PROVISIONS I
ZONING MECHANISMS II AGRICUL TURAL USE, EQUESTRIAN III KENNEL
IV OTHER

TRILLIUM_Limebank to Bowesville AQ Report_Rev0August 24, 2018:
APPENDIX C STADLER TRAIN SPECIFICATIONS

RFVSO Reference: Part 2.2 a (i) Proposal Document No.: 100.145a
Customer: City of Ottawa Tender Name: Ottawa Stage 2 LRT Trillium Line Extension Solicitation Number: 09717-55800-P01 Stadler-Document-No.: 522’617
Fuel Efficiency
Dynamic performance and Fuel consumption
© Stadler Rail AG / Stadler Bussnang AG / Stadler U.S. All rights in connection with this document and all information contained therein remain expressly reserved. Copying, disclosure to unauthorized parties or exploitation (notably by reproduction of the displayed parts) of this document or its content without our express consent is strictly forbidden.

09717-55800-P01 RFVSO Reference: Part 2.2 a (i) 100.145 – Rev. a 522’617522’617 CONFIDENTIAL Page 2 / 6
Table of Contents
1 Introduction ............................................................................................................................... 31.1 Abbreviations ......................................................................................................................... 3
2 Fuel consumption simulation .................................................................................................. 42.1 Vehicle Performance .............................................................................................................. 42.2 Computer Simulation .............................................................................................................. 4
3 Fuel Consumption .................................................................................................................... 5
4 Revision History ....................................................................................................................... 6

09717-55800-P01 RFVSO Reference: Part 2.2 a (i) 100.145 – Rev. a 522’617522’617 CONFIDENTIAL Page 3 / 6
1 Introduction Considering the Trillium Service Plan included at Annex I, we are obliged to provide the estimated annual fuel consumption assuming a continuous passenger load of AW1.
Requirements Considering the Trillium Service Plan included at Annex I, and the alignment data, provide the estimated annual fuel consumption assuming a continuous passenger load of AW1. Provide substantiation of your analysis.
1.1 Abbreviations
AUX Auxiliary operation systems DMU Diesel Multiple Unit ED Electro-Dynamic brake (motor brake) FLIRT Stadler Vehicle Family: Fast Light Innovative Regional Train HVAC Air condition unit

09717-55800-P01 RFVSO Reference: Part 2.2 a (i) 100.145 – Rev. a 522’617522’617 CONFIDENTIAL Page 4 / 6
2 Fuel consumption simulation
2.1 Vehicle Performance See document 100.150 showing accelerating, braking and driving diagrams as well as driving times in different load configurations.
2.2 Computer Simulation
Stadler performed a computer simulation assuming the following conditions:
- Limebank - Bayview – Limebank in neutral (low energy-consumption for HVAC) and winter (high energy-consumption for HVAC) conditions
- Dwell times as requested by the City of Ottawa are used for the calculations. Dwell times are stated in document 100.150.
- Maximal speed according to the sample line data Simulation was done in this example for an AW1 load case. The assumptions for the vehicle are as per the data noted in the document 100.150. The real diesel consumption values might decrease, depending on weather and passenger load conditions.
Note: In the simulation, all acceleration and braking events are performed with maximum traction capability (highest rate of acceleration and deceleration) in order to attain the shortest travel time. This provides the operator with options of decreasing the rate of acceleration to reduce the fuel consumption. The fuel consumption can be further drastically reduced when the vehicle is operated with smooth acceleration and braking and reduced maximum speed but still maintaining the operation schedule.

09717-55800-P01 RFVSO Reference: Part 2.2 a (i) 100.145 – Rev. a 522’617522’617 CONFIDENTIAL Page 5 / 6
3 Fuel Consumption As per the above calculation the maximum fuel consumption in AW1 load condition will be around 4.3 liter/km while the average value will be approximately 3.4 liter/km (including long turn-around-times at Bayview and Limebank and with maximum acceleration/braking).
Expected average Consumption Maximum Consumption
Liter per km 3.4 4.3 Liter per roundtrip 130 164 Liter per day 1’950 2’460 Liter per year 712’000 897’000 Liter per year (whole fleet) 4’271’000 5’382’000

09717-55800-P01 RFVSO Reference: Part 2.2 a (i) 100.145 – Rev. a 522’617522’617 CONFIDENTIAL Page 6 / 6
4 Revision History Rev. Change Date Created Checked Released _ First Edition 30th. Aug. 2017 J. Rauprich B. Schmid K. Roth
a Update 4 Diesel and new Service Plan
th 14 Jun. 2018 J. Rauprich T. Pfeifer K. Roth
b c d

© Stadler Rail AG / Stadler Bussnang AG / Stadler U.S. All rights in connection with this document and all information contained therein remain expressly reserved. Copying, disclosure to unauthorised parties or exploitation (notably by reproduction of the displayed parts) of this document or its content without our express consent is strictly forbidden.
RFVSO Reference: Part 2.2 a (i) Proposal Document No.: 100.150b
Customer: City of Ottawa Tender name: Ottawa Stage 2 LRT Trillium Line Extension Solicitation number: 09717-55800-P01 Stadler document number: 522,618
Propulsion and Braking System

09717-55800-P01 RFVSO Reference: Part 2.2 a (i) 100.150 – Rev. b 522,618 CONFIDENTIAL Page 2 / 24
Table of contents
1 Introduction ............................................................................................................................... 31.1 Requirement .......................................................................................................................... 31.2 Abbreviations ......................................................................................................................... 31.1 Legal regulations, standards and guidelines ........................................................................... 31.2 References ............................................................................................................................. 31.3 Annexes ................................................................................................................................. 3
2 Description of the propulsion system ..................................................................................... 42.1 General data .......................................................................................................................... 42.2 Power generation: engine generator set ................................................................................. 52.3 Power converter ..................................................................................................................... 62.4 Traction motor and gear ......................................................................................................... 82.5 Brake resistor ......................................................................................................................... 82.6 Propulsion control .................................................................................................................. 82.7 Reliability of the propulsion system ........................................................................................ 92.8 Dynamic performance .......................................................................................................... 102.8.1 Tractive effort versus speed chart....................................................................................... 10
3 Friction brake system ............................................................................................................. 113.1 General ................................................................................................................................ 113.2 Operation and indication ...................................................................................................... 153.3 Service brake application ..................................................................................................... 153.4 Mechanical function ............................................................................................................. 153.5 Brake Rates ......................................................................................................................... 16
4 Service Plan ............................................................................................................................ 164.1 Computer simulation ............................................................................................................ 174.2 Results: ................................................................................................................................ 174.2.1 Case 1: ............................................................................................................................... 174.2.2 Case 2: ............................................................................................................................... 214.3 Conclusion ........................................................................................................................... 23
5 Revision history ...................................................................................................................... 24

09717-55800-P01 RFVSO Reference: Part 2.2 a (i) 100.150 – Rev. b 522,618 CONFIDENTIAL Page 3 / 24
1 Introduction This document provides a description of the propulsion and braking system for the Stadler FLIRT³ DMU proposal for the Trillium Line Extension.
1.1 Requirement Describe the proposed propulsion and braking systems. Describe the advantages in maintenance costs, annual fuel consumption and historical reliability offered by the systems proposed, considering the characteristics of the Trillium alignment.
1.2 Abbreviations CAC Charge air cooling CAN Controller Area Network DC Direct current DMU Diesel multiple unit EMU Electric multiple unit ED brake Electro-dynamic brake EP brake Electro-pneumatically controlled friction brake EPA Environmental Protection Act ETV Emergency transfer valve FLIRT Stadler vehicle family: Fast Light Intercity and Regional Train GTW Stadler vehicle family: Gelenktriebwagen (German for: articulated
multiple unit train) LPLV Load-pressure-limiting valve PEBB Power Electronic Building Blocks VCU Vehicle Control Unit
1.1 Legal regulations, standards and guidelines All standards, unless otherwise specified, have been applied in the versions current on the date of Stadler’s offer.
IEC 60349-2:2008 Electric traction – Rotating electrical machines for rail and road vehicles – Part 2: Electronic converter-fed alternating current motors
1.2 References No references.
1.3 Annexes No annexes.
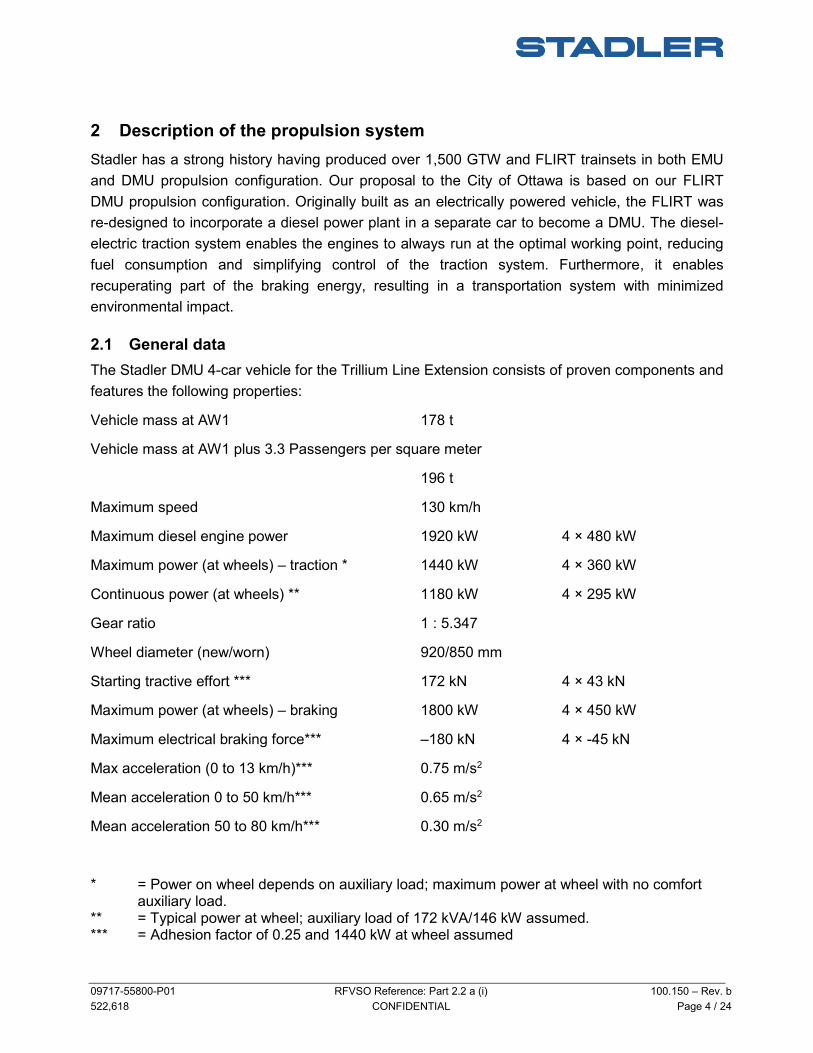
09717-55800-P01 RFVSO Reference: Part 2.2 a (i) 100.150 – Rev. b 522,618 CONFIDENTIAL Page 4 / 24
2 Description of the propulsion system Stadler has a strong history having produced over 1,500 GTW and FLIRT trainsets in both EMU and DMU propulsion configuration. Our proposal to the City of Ottawa is based on our FLIRT DMU propulsion configuration. Originally built as an electrically powered vehicle, the FLIRT was re-designed to incorporate a diesel power plant in a separate car to become a DMU. The diesel-electric traction system enables the engines to always run at the optimal working point, reducing fuel consumption and simplifying control of the traction system. Furthermore, it enables recuperating part of the braking energy, resulting in a transportation system with minimized environmental impact.
2.1 General data The Stadler DMU 4-car vehicle for the Trillium Line Extension consists of proven components and features the following properties:
Vehicle mass at AW1 178 t
Vehicle mass at AW1 plus 3.3 Passengers per square meter
196 t
Maximum speed 130 km/h
Maximum diesel engine power 1920 kW 4 × 480 kW
Maximum power (at wheels) – traction * 1440 kW 4 × 360 kW
Continuous power (at wheels) ** 1180 kW 4 × 295 kW
Gear ratio 1 : 5.347
Wheel diameter (new/worn) 920/850 mm
Starting tractive effort *** 172 kN 4 × 43 kN
Maximum power (at wheels) – braking 1800 kW 4 × 450 kW
Maximum electrical braking force*** –180 kN 4 × -45 kN
Max acceleration (0 to 13 km/h)*** 0.75 m/s2
Mean acceleration 0 to 50 km/h*** 0.65 m/s2
Mean acceleration 50 to 80 km/h*** 0.30 m/s2
* = Power on wheel depends on auxiliary load; maximum power at wheel with no comfort auxiliary load.
** = Typical power at wheel; auxiliary load of 172 kVA/146 kW assumed. *** = Adhesion factor of 0.25 and 1440 kW at wheel assumed

09717-55800-P01 RFVSO Reference: Part 2.2 a (i) 100.150 – Rev. b 522,618 CONFIDENTIAL Page 5 / 24
2.2 Power generation: engine generator set The electrical energy for the offered vehicle is produced by burning fuel in diesel engines and converting the movement into electricity using generators. The engine generator sets are mounted in a separate Power Pack car. A separate car for the power generation keeps noise and vibrations away from the passenger compartments and allows for better accessibility to facilitate maintenance. Large doors in the outer shell and at the aisle allow access to the engines and generators from both sides. For an overview of the diesel engine compartment see Figure 1.
Figure 1: Overview of the Power Pack car
The diesel engines are chosen to minimize the impact on the environment. They are built to achieve high fuel efficiency and are certified to EPA Tier 4f emission standards. This requires exhaust emission after-treatment, which is monitored by sensors during operation. The motors are water-cooled, high-speed engines. They are equipped with a high-pressure injection system (Common Rail System), turbocharging and charge air cooling (CAC). Cold starting is possible down to a temperature of –40 degrees Celsius using cooling water and flame preheating. Without preheating, starting is possible down to –32 degrees Celsius. The engine compartment is protected by a fire suppression system.

09717-55800-P01 RFVSO Reference: Part 2.2 a (i) 100.150 – Rev. b 522,618 CONFIDENTIAL Page 6 / 24
Each diesel engine is connected to a standard design three-phase asynchronous generator. The diesel engine is either cranked via the generator or by means of a battery-powered starter motor. The generator is self-ventilated by an integrated fan rotating with the same speed as the shaft at all times. The generator temperature is measured by two Pt100 sensors. The generator is designed according to the IEC 60349-2 standard, and its isolation class is 220 (R).
2.3 Power converter The electrical energy provided by the engine generator sets is processed in the power converter to be usable for propulsion and auxiliary equipment. There is one power converter in each end car of the vehicle. They are independent and of identical design, each of them powering one of the motor bogies (motor converter). Furthermore, they are equipped with auxiliary converters to power the common auxiliary network. An overview of the propulsion system is shown in Figure 2. Each propulsion system consists of:
• 2 × three-phase motor converters
• 1 × voltage limiter/brake chopper unit
• 1 × sine-filtered 3 × 480 V/60 Hz/220 kVA auxiliary converter
• 1 × controller unit
• 1 × pre-charge unit
• 2 × three-phase generator converters
• 1 × DC voltage link

09717-55800-P01 RFVSO Reference: Part 2.2 a (i) 100.150 – Rev. b 522,618 CONFIDENTIAL Page 7 / 24
Figure 2: Block schematic of the propulsion system

09717-55800-P01 RFVSO Reference: Part 2.2 a (i) 100.150 – Rev. b 522,618 CONFIDENTIAL Page 8 / 24
2.4 Traction motor and gear Four well-proven and highly efficient asynchronous traction motors are used (each motor generates a maximum power of 450 kW and continuous power of 300 kW). They are installed in the motor bogies positioned at the ends of the vehicle. Every traction motor is fed by its own motor converter. The motor temperature is measured by two Pt100 sensors. The motor is designed according to the IEC 60349 standard, and its isolation class is 220 (R).
During braking, the traction motors are used as generators to provide dynamic brake force. The energy gained is fed to the auxiliary systems (on-board network) to reduce total energy consumption. Surplus energy is directed to the brake resistor.
Identical traction motors are installed on other FLIRT DMU vehicles as, for example, on trains in Estonia, which have been in daily operation since the beginning of 2013 (> 1 million kilometres of service across the entire fleet); there, they have proven their reliability and robust design during harsh winter and hot summer conditions.
For power transfer between traction motors and wheels, two-stage spur gear VAR 160 transmissions are used. They are designed as fully suspended drive units and have a constant ratio of 1: 5.347 and no switching elements. The efficiency of the transmissions achieves up to 98%.
2.5 Brake resistor To handle surplus energy, each power converter is joined to an external, roof-mounted brake resistor. The brake resistor is has natural-air-cooling. It is connected to the braking chopper of the power converter and is used to limit overvoltage on the converter DC link, to discharge the DC link capacitors and to dissipate excess energy that is generated during electro-dynamic braking.
A brake resistor with a high power rating is chosen to allow generous use of the ED brake in order to reduce wear of the EP brake.
2.6 Propulsion control The control of the propulsion system is designed with the Vehicle Control Unit (VCU) at the highest level of the control hierarchy. The VCU detects the ground speed of the vehicle, controls the friction (EP) brake, observes the overall machine state and monitors energy consumption.
At a lower level of hierarchy, the diesel engine controller monitors the combustion process and the power generation of the engine.
The controller of the power converter regulates the motor and generator torque/flux, controls slip/slide of the powered wheels, steers the brake chopper and executes energy monitoring and protection functions.
For the communication between the different controllers, a vehicle bus (CAN) is used. It transduces in both directions and transmits different signals:

09717-55800-P01 RFVSO Reference: Part 2.2 a (i) 100.150 – Rev. b 522,618 CONFIDENTIAL Page 9 / 24
• Reference and actual values
• Torque
• Converter status
• Acceleration limits
• Vehicle ground and axle speed
2.7 Reliability of the propulsion system Railway passengers expect a safe, reliable and comfortable ride. To conform to these wishes the proposed railway vehicle is designed in a way that even failures of mayor parts do not lead to a total standstill of the vehicle. This chapter describes the influence of failing of mayor traction components to the vehicles performance.
Redundancy refers to the duplication of critical components with the intention of increasing the reliability of the railway vehicle. On the other hand the duplication of all critical traction components would lead to an excessively heavy and expensive train. To combine redundancy with only modest increase of cost and weight STADLER follows the approach to use duplicate systems with less power. In normal operation all systems are working. If a critical component breaks a part of the traction system is switched off, all other parts are still working. Even though a critical component fails the vehicle will still be able to move under its own power, only the performance is limited.
In case of a failure, there is minimal impact on vehicle functionality. Different failure scenarios are shown in Table 1.
Table 1: Failure scenarios of the propulsion system
Failure scenario Impact on traction chain Impact on auxiliary supply
1 Diesel engine fails Power reduction can occur Traction/ED brake effort still fully available
A minor reduction in power can occur
1 Generator fails Power reduction can occur Traction/ED brake effort still fully available
A minor reduction in power can occur
1 DC link/converter control fails 50 % Traction effort available, ED brake compensated by EP brake
50% installed auxiliary supply available (total load: 180 kVA)
1 Traction motor fails 75% traction and ED brake effort available
No impact
1 Auxiliary supply block fails No impact 75% installed auxiliary supply available (total load: 270 kVA)
1 Braking resistor fails ED brake compensated by EP brake
No impact

09717-55800-P01 RFVSO Reference: Part 2.2 a (i) 100.150 – Rev. b 522,618 CONFIDENTIAL Page 10 / 24
-200.0
-150.0
-100.0
-50.0
0.0
50.0
100.0
150.0
200.0
0.0 10.0 20.0 30.0 40.0 50.0 60.0 70.0 80.0 90.0 100.0 110.0 120.0 130.0
Forc
e [k
N]
v [km/h]
Effort - Chart
Traction motors Eff. drive Traction motors Eff. ED brake
Due to the redundancy of the System a single failure does not prevent the vehicle from moving under own power. None of those failures would cause a rescue operation. The worst case scenario is a failed DC link or converter control. In this case the available electrical power is reduced by 50% (for the propulsion as well as for the auxiliary supply). Dynamic performance would be reduced as well as the power for the HVAC. The vehicle would most likely not be able to meet the service plan and passenger comfort would be decreased. It would be reasonable to remove the train from service.
The other failures do not have such a drastic impact. The consequences would be dependent on different factors. A failure of an Auxiliary supply block for example would propably not cause any problem on a cold day, on a hot day however the performance of the HVAC-System would be downgraded. The reason is that the auxiliary system has to provide energy for the cooling system of the propulsion-system as well as for the HVAC-system.
2.8 Dynamic performance
2.8.1 Tractive effort versus speed chart The power at wheel depends on the load on the auxiliary system. The charts assume a “typical” power of 1180 kW at wheel.
Figure 3: Tractive effort versus speed diagram1
1 Assumptions: four-car DMU with semi-worn wheels (diameter: 885 mm).
On an inverter-controlled vehicle, the tractive effort is independent of wheel diameter.

09717-55800-P01 RFVSO Reference: Part 2.2 a (i) 100.150 – Rev. b 522,618 CONFIDENTIAL Page 11 / 24
0.0000.1000.2000.3000.4000.5000.6000.7000.8000.9001.000
-10.0 10.0 30.0 50.0 70.0 90.0 110.0 130.0
a []m
/s^2
]
v [km/h]
Acceleration level track
acc flat AW0 acc flat AW1 acc flat AW2 acc flat AW3
2.8.2 Acceleration versus speed chart The chart below shows the possible but uncompensated acceleration for the load cases AW0– AW3. Compensation would have to fix the maximum allowed acceleration to the curve of the AW3 case.
The mean acceleration from 0 to 50 km/h is approximately 0.65 m/s2, while the mean acceleration from 50 to 80 km/h is approximately 0.30 m/s2.
Figure 4: Acceleration versus speed diagram (level tangent track) at AW0 – AW3
3 Friction brake system The brake system consists of proven components and includes three different braking methods: an electro-dynamic brake (ED), a pneumatic friction disc brake (EP) and a spring-applied/air release parking brake. Braking commands are initiated from the driver’s desk, utilizing the master controller or the emergency stop buttons, or remotely from the train control system, the Vehicle Control Unit (VCU) or with a train line command.
3.1 General Each bogie has a local EP control system (see Fehler! Verweisquelle konnte nicht gefunden werden. and Fehler! Verweisquelle konnte nicht gefunden werden.). Air for the brake system is supplied by the brake pipe and the main reservoir pipe. Depending on the position of the emergency transfer valve (ETV), the electro-pneumatic (EP) or the automatic braking system is activated.

09717-55800-P01 RFVSO Reference: Part 2.2 a (i) 100.150 – Rev. b 522,618 CONFIDENTIAL Page 12 / 24
The ETV is controlled by the brake pipe pressure. When the brake pipe pressure is high, the ETV switches over and activates the EP braking system. When the brake pipe pressure is low or completely vented (in case of emergency braking), the ETV switches back to basic position and activates the automatic braking system. The direct EP brake is controlled electrically by the VCU with solenoid valves. The EP brake valves are also used for blended braking together with the ED brake. The load-pressure-limiting valve (LPLV) corrects the brake cylinder pressure according to the load of the vehicle in order to achieve a uniform deceleration rate, independent of whether the vehicle is loaded or empty. The load weight correction utilizes a pneumatic signal from the air suspension system. Each axle on the vehicle is protected with a wheel slide protection system consisting of electric protection valves. The vehicle can be towed with the braking system in the de-energized state.

09717-55800-P01 RFVSO Reference: Part 2.2 a (i) 100.150 – Rev. b 522,618 CONFIDENTIAL Page 13 / 24
Figure 5: Concept diagram of the pneumatic equipment

09717-55800-P01 RFVSO Reference: Part 2.2 a (i) 100.150 – Rev. b 522,618 CONFIDENTIAL Page 14 / 24
Figure 6: Layout of the pneumatic equipment and wheel slide protection

09717-55800-P01 RFVSO Reference: Part 2.2 a (i) 100.150 – Rev. b 522,618 CONFIDENTIAL Page 15 / 24
3.2 Operation and indication The driver engages the brake with the master controller or the emergency stop. The pressure in the brake pipe, air reservoir pipe and brake cylinder is indicated on gauges located on the driver’s desk and, in addition, logged on the diagnostics display. The status of the brake can also be read off the visual pressure indicators on the outside of each bogie.
The emergency brake position of the master controller opens the electrical emergency brake loop. The electrical emergency brake loop triggers all the emergency brake valves on the train, emptying the brake pipe from various locations simultaneously. The emergency stop also opens the emergency brake loop and empties the brake pipe directly with a large cross-section valve.
The brake check procedure is performed with the master controller. The brake check procedure has to be completed at least once after initiation of the cab. The driver checks the state of all brakes in the train with indicators on the driver’s desk. The airtight integrity check of the brake pipe is initiated by a button on the diagnostics display and verified with the pressure gauges on the desk.
3.3 Service brake application The service brake application is initiated with the master controller. The full service brake application is reached when the master controller is placed in the full service brake position. The master controller generates EP brake force on the motor axles and complements the brake force on the trailing axles to achieve the required brake force (blending). The VCU distributes the brake force to all axles in order to achieve a balanced thermal load across all brake discs. If the brake on one bogie is isolated, the braking force is redistributed to the other bogies by thermally balancing the load. Both the ED and EP brakes are capable of delivering sufficient braking force for normal operation of the vehicle independently. Braking with the master controller is the preferred method of braking as it is virtually wear-free. The recuperated braking energy is fed into the DC link of the traction converters and can be used to supply the vehicle’s auxiliary power network; excessive energy is passed to the brake resistors. The motor brake force is reciprocal to the speed.
3.4 Mechanical function The friction brake equipment of the vehicle uses two brake discs, which are located close to each wheel.
All trailer bogies have normal, self-adjusting callipers and all motor bogies have callipers, including the spring-loaded accumulators for the parking brake. Without air pressure, the spring applies a constant force, keeping the vehicle stationary. With air pressure applied, the parking brake is released. For maintenance or towing purposes, the parking brakes can be bypassed by pulling a release handle.

09717-55800-P01 RFVSO Reference: Part 2.2 a (i) 100.150 – Rev. b 522,618 CONFIDENTIAL Page 16 / 24
3.5 Brake Rates Even though the brake systems capabilities are not used in everyday use (since the braking is mainly electro-dynamic) it is designed for good performance. With a brake caliper at every wheel the brake systems main limitation is the maximum force that can be transmitted from the wheel to the track.
Under an emergency brake application, the brake system has a nominal net braking rate of approximately 1.1 m/s2. This rate is achieved throughout the speed range from 100 km/h down to zero, at a loading of up to AW3, but a minimum adhesion of 0.15 is required.
The maximum brake rate with bad adhesion is approximately 0.8 to 0.9 m/s² (depending on the actual condition of the track).
All run time simulations are calculated with a maximum brake rade of 0.8 m/s²
The brake system is adjustet to a maximum service brake rate of 0.9 to 1.0 m/s², for comfort reasons the jerk rate is limited to 0.5 to 0.6 m/s³.
4 Service Plan This chapter provides the travel time of the proposed STADLER FLIRT³ DMU vehicles on the railway line between Bayview and Limebank. The data is the result of a computer simulation modeling the dynamic performance of the vehicle.
The intended service of the vehicle is determined to be performed with 7 vehicles and headway of 12 minutes, leading to a desired round trip time of 84 minutes.
The service plan intends the following dwell times:
Table 2: Northbound travel dwell times
Northbound travel AM Peak Midday PM Peak Evening
Limebank - - - - Collector Road ‘D’ 25 25 25 25 Armstrong 25 25 25 25 Bowesville 25 25 25 25 Leitrim 45 36 44 30 South Keys 30 26 29 23 Greenboro 44 35 42 29 Walkley 20 20 20 20 Confederation 23 21 23 20 Carleton 115 85 110 65 Carling 34 28 33 24 Gladstone 21 20 21 20 Bayview (turn around) 720 720 720 720

09717-55800-P01 RFVSO Reference: Part 2.2 a (i) 100.150 – Rev. b 522,618 CONFIDENTIAL Page 17 / 24
Table 3: Southbound travel dwell times
Southbound travel AM Peak Midday PM Peak Evening
Bayview - - - - Gladstone 22 20 22 20 Carling 25 22 25 20 Carleton 90 67 86 52 Confederation 22 20 21 20 Walkley 20 20 20 20 Greenboro 20 20 20 20 South Keys 20 20 20 20 Leitrim 20 20 20 20 Bowesville 20 20 20 20 Armstrong 20 20 20 20 Collector Road ‘D’ 20 20 20 20 Limebank (turn around) 750 750 750 750
4.1 Computer simulation The computer simulation was performed assuming the following conditions:
• Round trip Limebank – Bayview – Limebank • Dwell times at stations according to service plan, only AM Peak times are used for
simulation (worst case). • Fast driving style, remaining time can be used for a more energy efficient driving style. • Two cases with different vehicle load, climatic conditions and adhesion factors are
calculated. • Track Data was provided by the City of Ottawa as a Excel-file
(Trillium Line Track Data w Xovers.xlsx).
4.2 Results:
4.2.1 Case 1: Case 1 is calculated with AW1 passenger load (all seats occupied, no standees) on a day with neutral weather (heating and air-conditioning consumes on a low level) and good adhesion (μ=0.25):
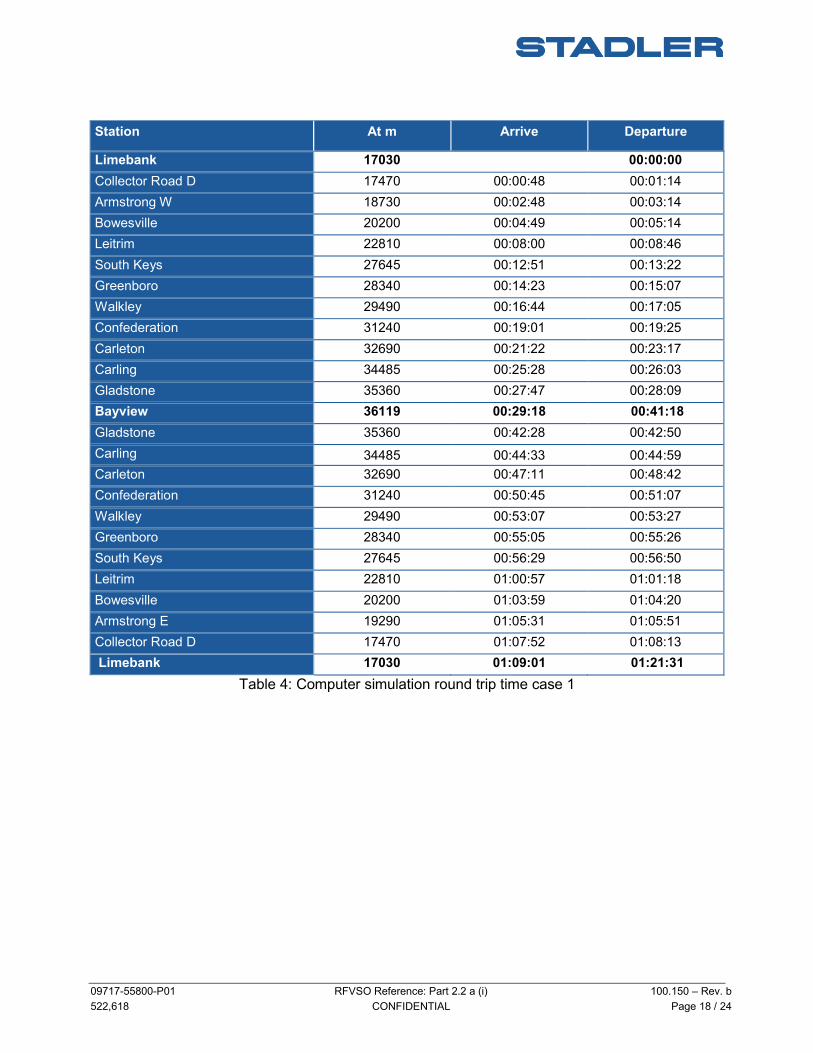
09717-55800-P01 RFVSO Reference: Part 2.2 a (i) 100.150 – Rev. b 522,618 CONFIDENTIAL Page 18 / 24
Table 4: Computer simulation round trip time case 1
Station At m Arrive Departure
Limebank 17030 00:00:00 Collector Road D 17470 00:00:48 00:01:14 Armstrong W 18730 00:02:48 00:03:14 Bowesville 20200 00:04:49 00:05:14 Leitrim 22810 00:08:00 00:08:46 South Keys 27645 00:12:51 00:13:22 Greenboro 28340 00:14:23 00:15:07 Walkley 29490 00:16:44 00:17:05 Confederation 31240 00:19:01 00:19:25 Carleton 32690 00:21:22 00:23:17 Carling 34485 00:25:28 00:26:03 Gladstone 35360 00:27:47 00:28:09 Bayview 36119 00:29:18 00:41:18 Gladstone 35360 00:42:28 00:42:50 Carling 34485 00:44:33 00:44:59 Carleton 32690 00:47:11 00:48:42 Confederation 31240 00:50:45 00:51:07 Walkley 29490 00:53:07 00:53:27 Greenboro 28340 00:55:05 00:55:26 South Keys 27645 00:56:29 00:56:50 Leitrim 22810 01:00:57 01:01:18 Bowesville 20200 01:03:59 01:04:20 Armstrong E 19290 01:05:31 01:05:51 Collector Road D 17470 01:07:52 01:08:13 Limebank 17030 01:09:01 01:21:31

09717-55800-P01 RFVSO Reference: Part 2.2 a (i) 100.150 – Rev. b 522,618 CONFIDENTIAL Page 19 / 24
ZUGLAUF 18.290
8. 5.2018
Figure 7: Time-based Diagrams of round trip case 1
Limebank - Bayview - Limebank
DMU4_4DM AW1 neutral
mue 0.25 fast
0.00
300.
600.
900.
1200
1500
1800
2100
2400
2700
3000
3300
3600
3900
4200
4500
4800
0.0000
32.00
64.00
96.00
128.0
160.0
Limebank Collector Road D
Armstrong W Armstrong E
Bowesville
Leitrim
South Keys
Greenboro Crossing Walkley
Walkley
Confederation
Carleton
Carling
Gladstone
Bayview
Gladstone
Carling
Carleton
Confederation
Walkley
Crossing Walkley Greenboro
South Keys
Leitrim
Bowesville
Armstrong E
Armstrong W
Collector Road D
Limebank
Limebank
Limebank
Vehicle act. Speed [km/h]
Max. Track Speed [km/h]
0.00
300.
600.
900.
1200
1500
1800
2100
2400
2700
3000
3300
3600
3900
4200
4500
4800
-200.0
-100.0
0.0000
100.0
200.0
0:00 0:48 1:14
2:48 3:14
4:49 5:15
8:00 8:46
12:51 13:22 14:23 15:07
16:44 17:05
19:01 19:25
21:22 23:18
25:28 26:03
27:47 28:09 29:18 41:18
42:28 42:51
44:33 44:59
47:11 48:42
50:45 51:07
53:07 53:27
55:05 55:26 56:29 56:50
1:00:57 1:01:18
1:03:59 1:04:20 1:05:31 1:05:52
1:07:52 1:08:13 1:09:01
EP-Brake Eff. [kN]
Tract./ED-Brake Eff. [kN]
Gradient*10 [o/oo]
0.00
300.
600.
900.
1200
1500
1800
2100
2400
2700
3000
3300
3600
3900
4200
4500
4800
-2000
-1000
0.0000
1000
2000
Power_Wheel [kW]
Power_Diesel Eng. [kW]
Power_AUX [kW]
consumed fuel*10 [liter]
[sec]

09717-55800-P01 RFVSO Reference: Part 2.2 a (i) 100.150 – Rev. b 522,618 CONFIDENTIAL Page 20 / 24
Figure 8: Speed-Distance Diagram Case 1
Figure 9: Time-Distance Diagram Case 1

09717-55800-P01 RFVSO Reference: Part 2.2 a (i) 100.150 – Rev. b 522,618 CONFIDENTIAL Page 21 / 24
4.2.2 Case 2: Case 2 is calculated with AW1 passenger load plus standees (3.3 P/m²) on a cold day (heating consumes much energy) and bad adhesion (μ=0.16):
Table 5: Computer simulation round trip time case 2
Station At m Arrive Departure
Limebank 17030 00:00:00 Collector Road D 17470 00:00:49 00:01:15 Armstrong W 18730 00:02:50 00:03:15 Bowesville 20200 00:04:53 00:05:19 Leitrim 22810 00:08:06 00:08:52 South Keys 27645 00:12:59 00:13:30 Greenboro 28340 00:14:32 00:15:16 Walkley 29490 00:16:54 00:17:14 Confederation 31240 00:19:12 00:19:35 Carleton 32690 00:21:34 00:23:29 Carling 34485 00:25:41 00:26:16 Gladstone 35360 00:28:01 00:28:22 Bayview 36119 00:29:32 00:41:33 Gladstone 35360 00:42:43 00:43:06 Carling 34485 00:44:50 00:45:15 Carleton 32690 00:47:29 00:49:00 Confederation 31240 00:51:04 00:51:27 Walkley 29490 00:53:28 00:53:49 Greenboro 28340 00:55:27 00:55:48 South Keys 27645 00:56:53 00:57:13 Leitrim 22810 01:01:22 01:01:43 Bowesville 20200 01:04:27 01:04:48 Armstrong E 19290 01:06:00 01:06:21 Collector Road D 17470 01:08:24 01:08:44 Limebank 17030 01:09:33 01:22:03

09717-55800-P01 RFVSO Reference: Part 2.2 a (i) 100.150 – Rev. b 522,618 CONFIDENTIAL Page 22 / 24
ZUGLAUF 18.290
8. 5.2018
Figure 10: Time-based Diagrams of round trip case 2
Limebank - Bayview - Limebank
DMU4_4DM AW3_3 winter
mue 0.16 fast
0.00
300.
600.
900.
1200
1500
1800
2100
2400
2700
3000
3300
3600
3900
4200
4500
4800
0.0000
32.00
64.00
96.00
128.0
160.0
Limebank Collector Road D
Armstrong W Armstrong E
Bowesville
Leitrim
South Keys
Greenboro Crossing Walkley
Walkley
Confederation
Carleton
Carling
Gladstone
Bayview
Gladstone
Carling
Carleton
Confederation
Walkley
Crossing Walkley Greenboro
South Keys
Leitrim
Bowesville
Armstrong E
Armstrong W
Collector Road D
Limebank
Limebank
Limebank
Vehicle act. Speed [km/h]
Max. Track Speed [km/h]
0.00
300.
600.
900.
1200
1500
1800
2100
2400
2700
3000
3300
3600
3900
4200
4500
4800
-200.0
-100.0
0.0000
100.0
200.0
0:00 0:49 1:15
2:50 3:16
4:53 5:19
8:06 8:52
12:59 13:30 14:32 15:17
16:54 17:14
19:12 19:36
21:34 23:30
25:41 26:16
28:01 28:23 29:32 41:33
42:43 43:06
44:50 45:16
47:29 49:00
51:04 51:27
53:28 53:49
55:27 55:48 56:53 57:14
1:01:22 1:01:43
1:04:27 1:04:48 1:06:00 1:06:21
1:08:23 1:08:44 1:09:33
EP-Brake Eff. [kN]
Tract./ED-Brake Eff. [kN]
Gradient*10 [o/oo]
0.00
300.
600.
900.
1200
1500
1800
2100
2400
2700
3000
3300
3600
3900
4200
4500
4800
-2000
-1000
0.0000
1000
2000
Power_Wheel [kW]
Power_Diesel Eng. [kW]
Power_AUX [kW]
consumed fuel*10 [liter]
[sec]
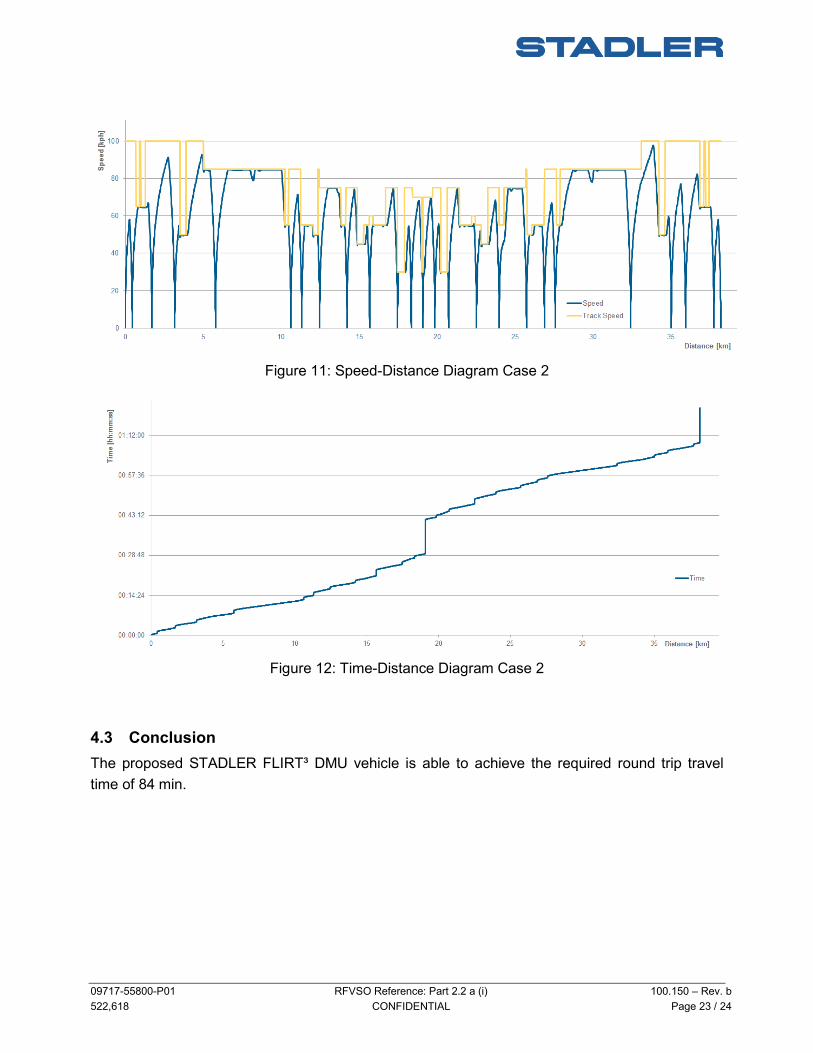
09717-55800-P01 RFVSO Reference: Part 2.2 a (i) 100.150 – Rev. b 522,618 CONFIDENTIAL Page 23 / 24
Figure 11: Speed-Distance Diagram Case 2
Figure 12: Time-Distance Diagram Case 2
4.3 Conclusion The proposed STADLER FLIRT³ DMU vehicle is able to achieve the required round trip travel time of 84 min.

09717-55800-P01 RFVSO Reference: Part 2.2 a (i) 100.150 – Rev. b 522,618 CONFIDENTIAL Page 24 / 24
5 Revision history Rev. Change Date Created by Checked by Released by _ First edition 04.07.2017 A. Solowiewski B. Schmid K. Roth a Update BAFO 07.06.2018 A. Solowiewski J. Rauprich K. Roth b Revision Acceleration 20.07.2018 J. Rauprich K. Roth J. Rauprich c d

© Stadler Rail AG / Stadler Bussnang AG / Stadler U.S. All rights in connection with this document and all information contained therein remain expressly reserved. Copying, disclosure to unauthorized parties or exploitation (notably by reproduction of the displayed parts) of this document or its content without our express consent is strictly forbidden.
RFVSO Reference: Part 2.2 a (i) Proposal Document No.: 100.165_
Customer: City of Ottawa Tender Name: Ottawa Stage 2 LRT Trillium Line Extension Solicitation Number: 09717-55800-P01 Stadler-Document-No.: 522’628
Vehicle Emissions

09717-55800-P01 RFVSO Reference: Part 2.2 a (i) 100.165 – Rev. _ 522’628 CONFIDENTIAL Page 2 / 7
Table of Contents
1 Introduction ............................................................................................................................... 31.1 Abbreviations ......................................................................................................................... 31.2 Legal Regulations, Standards and Guidelines ........................................................................ 31.3 References ............................................................................................................................. 31.4 Annexes ................................................................................................................................. 3
2 Vehicle Emissions Tier 4f (final) .............................................................................................. 42.1 Emission comparison ............................................................................................................. 42.2 System description Tier 4f (final) ............................................................................................ 6
3 Revision History ....................................................................................................................... 7
09717-55800-P01 RFVSO Reference: Part 2.2 a (i) 100.165 – Rev. _ 522’628 CONFIDENTIAL Page 3 / 7
1 Introduction This document describes the vehicle technical specifications.
Requirements State the vehicle emission standard with which the proposed Vehicle will be compliant. Detail the emissions of particulate matter, oxides of nitrogen, non-methane hydrocarbon (either combined or separate) and carbon monoxide for the annual operation of the Trillium Service
1.1 Abbreviations
FLIRT Stadler Vehicle Family: Fast Light Innovative Regional Train GTW Stadler Vehicle Family: Gelenktriebwagen (German for: articulated rail car) EPA United States Environmental Protection Agency SCR Selective Catalytic Reduction
1.2 Legal Regulations, Standards and Guidelines
All standards, if not otherwise specified, have been applied in the versions current on the date of Stadler’s offer.
2012/46/EU Measures against the emission of gaseous and particulate pollutants from internal combustion engines to be installed in non-road mobile machinery
SOR/2005-32 CFR 1039
Canada Off-Road Compression-Ignition Engine Emission Regulations Control of Emissions from new and in-use no road Compression-Ignition Engines
1.3 References
No references.
1.4 Annexes
No annexes.
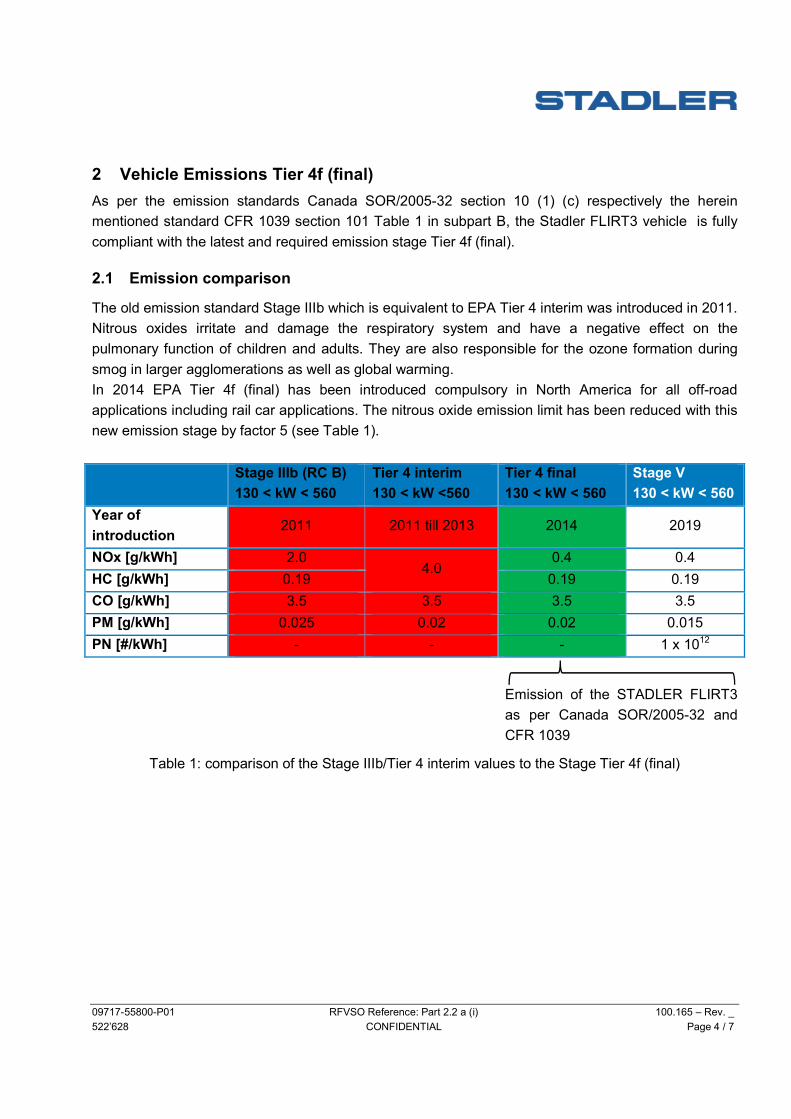
09717-55800-P01 RFVSO Reference: Part 2.2 a (i) 100.165 – Rev. _ 522’628 CONFIDENTIAL Page 4 / 7
2 Vehicle Emissions Tier 4f (final) As per the emission standards Canada SOR/2005-32 section 10 (1) (c) respectively the herein mentioned standard CFR 1039 section 101 Table 1 in subpart B, the Stadler FLIRT3 vehicle is fully compliant with the latest and required emission stage Tier 4f (final).
2.1 Emission comparison
The old emission standard Stage IIIb which is equivalent to EPA Tier 4 interim was introduced in 2011. Nitrous oxides irritate and damage the respiratory system and have a negative effect on the pulmonary function of children and adults. They are also responsible for the ozone formation during smog in larger agglomerations as well as global warming. In 2014 EPA Tier 4f (final) has been introduced compulsory in North America for all off-road applications including rail car applications. The nitrous oxide emission limit has been reduced with this new emission stage by factor 5 (see Table 1).
Table 1: comparison of the Stage IIIb/Tier 4 interim values to the Stage Tier 4f (final)
Stage IIIb (RC B) 130 < kW < 560
Tier 4 interim 130 < kW <560
Tier 4 final 130 < kW < 560
Stage V 130 < kW < 560
Year of introduction 2011 2011 till 2013 2014 2019
NOx [g/kWh] 2.0 4.0
0.4 0.4 HC [g/kWh] 0.19 0.19 0.19 CO [g/kWh] 3.5 3.5 3.5 3.5 PM [g/kWh] 0.025 0.02 0.02 0.015 PN [#/kWh] - - - 1 x 10¹²
Emission of the STADLER FLIRT3 as per Canada SOR/2005-32 and CFR 1039

09717-55800-P01 RFVSO Reference: Part 2.2 a (i) 100.165 – Rev. _ 522’628 CONFIDENTIAL Page 5 / 7
Figure 1: comparison of the different Tier stages
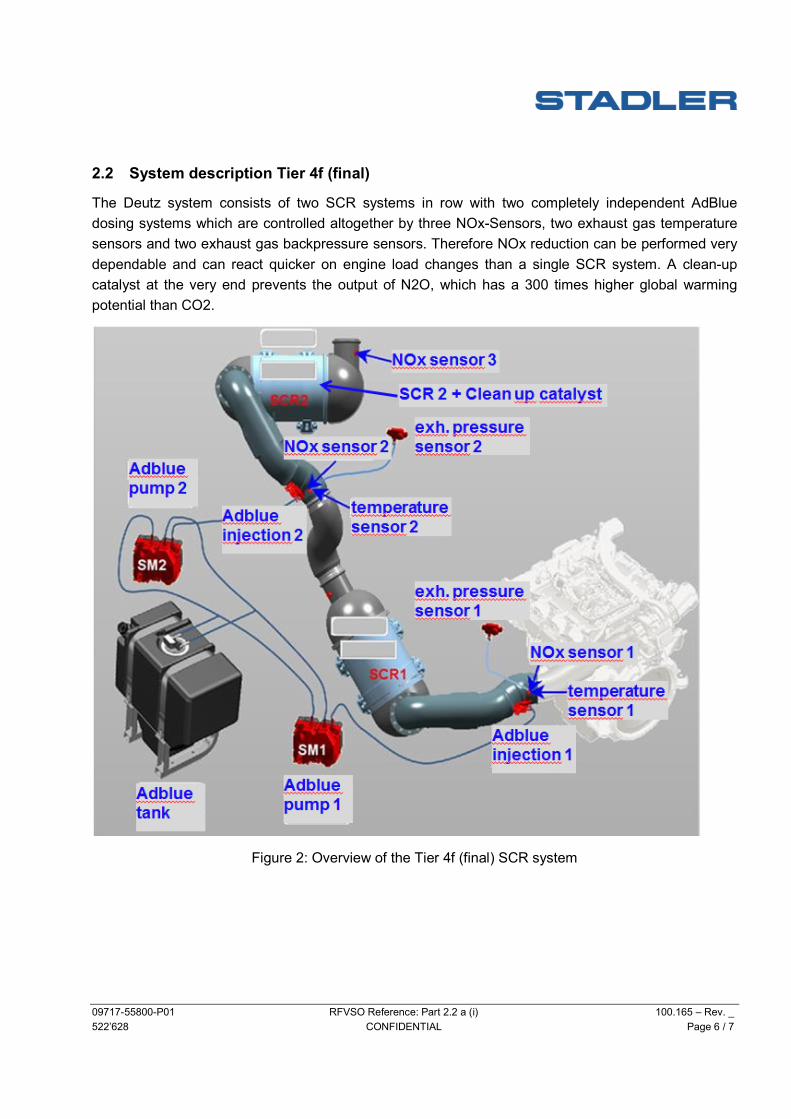
09717-55800-P01 RFVSO Reference: Part 2.2 a (i) 100.165 – Rev. _ 522’628 CONFIDENTIAL Page 6 / 7
2.2 System description Tier 4f (final)
The Deutz system consists of two SCR systems in row with two completely independent AdBlue dosing systems which are controlled altogether by three NOx-Sensors, two exhaust gas temperature sensors and two exhaust gas backpressure sensors. Therefore NOx reduction can be performed very dependable and can react quicker on engine load changes than a single SCR system. A clean-up catalyst at the very end prevents the output of N2O, which has a 300 times higher global warming potential than CO2.
Figure 2: Overview of the Tier 4f (final) SCR system

09717-55800-P01 RFVSO Reference: Part 2.2 a (i) 100.165 – Rev. _ 522’628 CONFIDENTIAL Page 7 / 7
3 Revision History Rev. Change Date Created Checked Released _ First Edition 13. 09. 2017 M. Jauch K. Roth B. Schmid a b c d

TRILLIUM_Limebank to Bowesville AQ Report_Rev0August 24, 2018:
APPENDIX D CALCULATIONS

APPENDIX D TRILLIUM_Limebank to Bowesville AQ Report_Rev0August 24, 2018
OLRT Trillium Line Limebank Extension Air Quality Assessment Sample Emission Rate Calculations
Example No. 1: Running Busses at Bowesville Station (CO Emissions)
CO Emission Rate developed by MOVES2014a: 0.6269 g/VKT Bus headway at Bowesville Station: 12 minutes Bus platforms available at Bowesville Station: 4 Busses per hour arriving at Bowesville Station: 20 bus/hr *Distance traveled by busses within Bowesville Station: 0.403 km
* Busses per hour derived as follows: 60 mins / 12 mins = 5 busses per hour x 4 bus platforms
Sample Calculation for AERMOD Emission Rate:
MOVES2014a emission rate [g/VKT] x Busses per hour arriving at Bowesville Station [veh/hr] x Distance traveled [km] = 0.6269 g/VKT x 20 veh/hr x 0.403 km x 1 hr/3600 s = 0.0047 g/s
Example No. 2: Trains Idling at Limebank Station (CO Emissions)
CO Emission Rate from U.S. EPA Tier 4 Standards: 2385 g/veh-hr Train headway at Limebank Station: 12 minutes Train idling time at Limebank Station: 12 minutes Trains per hour arriving at Limebank Station: 5 trains/hr
Sample Calculation for AERMOD Emission Rate
Tier 4 Emission Rate [g/veh-hr] x No. of trains per hour x Idling time per hour = 2385 g/veh-hr x 5 veh x 12 mins/60 mins x 1 hr/3600 s = 0.6626 g/s
Example No. 3: Cars leaving the Park-n-Ride Parking Lot: PM Peak hour (CO Emissions)
CO Emission Rate (MOVES) for Running Cars: 1.2598 g/VKT CO Emission Rate (MOVES) for Idling Cars: 9.3469 g/veh-hr CO Emission Rate (MOVES) for Starting Cars: 21.8129 g/start Amount of time idling per vehicle following start: 0.5 minutes Number of vehicles leaving during peak PM hour: 641 vehicles *Average distance traveled by a car within the lot: 225 m
* See hourly fraction for determining peak hour lot usage for AM and PM volumes. Note: peak hour emission rates were applied to all AM or PM operational hours to remain conservative
Sample Calculation for AERMOD Emission Rate
Idling emission rate [g/veh-hr] x no. of vehicles x idling time per hour = 9.3469 g/veh-hr x 641 veh x 0.5 min/ 60 min x 1 hr / 3600 s = 0.0139 g/s
Running emission rate [g/VKT] x no. of vehicles x distance traveled [km] = 1.2598 g/VKT x 641 veh x 0.225 km x 1 hr / 3600 s = 0.0505 g/s
Starting emisison rate [g/start] x no. of vehicles starting in an hour = 21.8129 g/start x 641 vehicles/hr x 1 hr / 3600 s = 3.8839 g/s
Total emission rate = 0.0139 g/s + 0.0505 g/s + 3.8839 g/s = 3.947 g/s

APPENDIX D TRILLIUM_Limebank to Bowesville AQ Report_Rev0August 24, 2018
Peak AM and PM hour fraction for the Park-n-Ride Lot (assumed)
AM Peak Hour Fraction
PM Peak Hr Fraction
Notes: [1] Peak AM hour is assumed to be from 7 AM to 8 AM [2] Peak PM hour is assumed to be from 5 PM to 6 PM [3] Total number of available parking spots is 1780 [4] Peak hour fraction of 0.36 is applied to total parking lot capacity to determine peak hour volume
0.36 x 1780 vehicles = 641 vehicles

TRILLIUM_Limebank to Bowesville AQ Report_Rev0August 24, 2018:
APPENDIX E BACKGROUND DATA

2016
NAPS ID City P/T Location Latitude Longitude Elevation Type ID Minimum 10th
Percentile 30th
Percentile 50th
Percentile 70th
Percentile 80th
Percentile 90th
Percentile 95th
Percentile 98th
Percentile 99th
Percentile 99.9th
Percentile Maximum Percent
Completeness Mean Standard Deviation
CO (ppm) 050204 Gatineau QC 255 St-Redempteur, Hull 45.4360 -75.7234 62 PE,LU,P5,R 1HR 0.1 0.1 0.2 0.2 0.2 0.2 0.3 0.4 0.5 0.6 0.9 1.1 95 0.2 0.1 054401 Saint-Anicet QC 1128 De La Guerre 45.1206 -74.2896 50 RB,NU,P2,A 1HR 0.0 0.1 0.1 0.2 0.2 0.2 0.3 0.3 0.3 0.3 0.4 0.8 96 0.2 0.1 060104 Ottawa ON Rideau And Wurtenberg 45.4343 -75.6760 72 PE,LU,P6,R 1HR 0.1 0.1 0.2 0.2 0.2 0.2 0.3 0.4 0.5 0.5 0.7 0.9 98 0.2 0.1
NO2 (ppb) 050204 Gatineau QC 255 St-Redempteur, Hull 45.4360 -75.7234 62 PE,LU,P5,R 1HR 0 1 2 3 6 9 14 21 28 33 45 50 89 6 7 054401 Saint-Anicet QC 1128 De La Guerre 45.1206 -74.2896 50 RB,NU,P2,A 1HR 0 1 1 2 3 3 5 8 12 15 26 37 96 3 3 060104 Ottawa ON Rideau And Wurtenberg 45.4343 -75.6760 72 PE,LU,P6,R 1HR 0 2 3 5 8 10 15 21 28 32 43 48 99 7 7
CO (ppm) 050204 Gatineau QC 255 St-Redempteur, Hull 45.4360 -75.7234 62 PE,LU,P5,R 8HR 0.1 0.1 0.2 0.2 0.2 0.2 0.3 0.4 0.4 0.5 0.7 0.8 99 0.2 0.1 054401 Saint-Anicet QC 1128 De La Guerre 45.1206 -74.2896 50 RB,NU,P2,A 8HR 0.0 0.1 0.1 0.2 0.2 0.2 0.3 0.3 0.3 0.3 0.4 0.4 100 0.2 0.1 060104 Ottawa ON Rideau And Wurtenberg 45.4343 -75.6760 72 PE,LU,P6,R 8HR 0.1 0.1 0.2 0.2 0.2 0.2 0.3 0.4 0.5 0.5 0.6 0.7 98 0.2 0.1
NO2 (ppb) 050204 Gatineau QC 255 St-Redempteur, Hull 45.4360 -75.7234 62 PE,LU,P5,R 8HR 0 1 2 4 7 9 14 18 24 29 37 42 89 6 6 054401 Saint-Anicet QC 1128 De La Guerre 45.1206 -74.2896 50 RB,NU,P2,A 8HR 0 1 1 2 3 4 5 7 11 14 27 30 100 3 3 060104 Ottawa ON Rideau And Wurtenberg 45.4343 -75.6760 72 PE,LU,P6,R 8HR 1 2 3 5 8 10 15 19 24 29 37 40 100 7 6
CO (ppm) 050204 Gatineau QC 255 St-Redempteur, Hull 45.4360 -75.7234 62 PE,LU,P5,R 24HR 0.1 0.1 0.2 0.2 0.2 0.2 0.3 0.3 0.4 0.4 0.6 0.7 98 0.2 0.1 054401 Saint-Anicet QC 1128 De La Guerre 45.1206 -74.2896 50 RB,NU,P2,A 24HR 0.0 0.1 0.1 0.2 0.2 0.2 0.3 0.3 0.3 0.3 0.4 0.4 100 0.2 0.1 060104 Ottawa ON Rideau And Wurtenberg 45.4343 -75.6760 72 PE,LU,P6,R 24HR 0.1 0.1 0.2 0.2 0.2 0.3 0.3 0.4 0.5 0.5 0.6 0.6 98 0.2 0.1
NO2 (ppb) 050204 Gatineau QC 255 St-Redempteur, Hull 45.4360 -75.7234 62 PE,LU,P5,R 24HR 0 2 3 4 7 9 12 15 21 24 29 30 88 6 5 054401 Saint-Anicet QC 1128 De La Guerre 45.1206 -74.2896 50 RB,NU,P2,A 24HR 0 1 1 2 3 3 4 6 9 12 21 23 100 3 2 060104 Ottawa ON Rideau And Wurtenberg 45.4343 -75.6760 72 PE,LU,P6,R 24HR 1 2 4 5 8 10 14 17 21 25 30 31 100 7 5
PM2.5 (µg/m3) 050204 Gatineau QC 255 St-Redempteur, Hull 45.4360 -75.7234 62 PE,LU,P5,R 24HR 1 3 4 6 8 9 11 14 18 22 31 31 91 7 4 054401 Saint-Anicet QC 1128 De La Guerre 45.1206 -74.2896 50 RB,NU,P2,A 24HR 1 2 4 6 8 10 11 13 16 19 26 27 100 6 4 060104 Ottawa ON Rideau And Wurtenberg 45.4343 -75.6760 72 PE,LU,P6,R 24HR 0 2 4 5 7 8 11 13 16 18 29 29 98 6 4
2015
NAPS ID City P/T Location Latitude Longitude Elevation Type ID Minimum 10th
Percentile 30th
Percentile 50th
Percentile 70th
Percentile 80th
Percentile 90th
Percentile 95th
Percentile 98th
Percentile 99th
Percentile 99.9th
Percentile Maximum Percent
Completeness Mean Standard Deviation
CO (ppm) 050204 Gatineau QC 255 St-Redempteur, Hull 45.436 -75.7234 62 Residential 1HR 0.1 0.1 0.2 0.2 0.2 0.2 0.3 0.4 0.5 0.6 0.7 0.9 94 0.2 0.1 054401 Saint-AniceQC 1128 De La Guerre 45.1206 -74.2885 50 Agricultura 1HR 0.1 0.2 0.2 0.2 0.3 0.3 0.3 0.3 0.4 0.4 0.5 0.6 82 060104 Ottawa ON Rideau And Wurtenberg 45.4343 -75.676 72 Commercia1HR 0.1 0.1 0.2 0.2 0.2 0.2 0.3 0.3 0.4 0.5 0.7 0.8 99 0.2 0.1
NO2 (ppb) 050204 Gatineau QC 255 St-Redempteur, Hull 45.436 -75.7234 62 Residential 1HR 0 1 2 3 6 8 14 20 27 30 40 43 98 6 6 054401 Saint-Anice QC 1128 De La Guerre 45.1206 -74.2885 50 Agricultura 1HR 0 1 1 2 3 4 6 9 12 15 38 45 94 3 3 060104 Ottawa ON Rideau And Wurtenberg 45.4343 -75.676 72 Commercia1HR 0 2 3 5 8 11 16 22 30 37 45 51 99 7 7
CO (ppm) 050204 Gatineau QC 255 St-Redempteur, Hull 45.436 -75.7234 62 Residential 8HR 0.1 0.1 0.2 0.2 0.2 0.2 0.3 0.4 0.4 0.5 0.6 0.7 98 0.2 0.1 054401 Saint-Anice QC 1128 De La Guerre 45.1206 -74.2885 50 Agricultura 8HR 0.1 0.2 0.2 0.2 0.3 0.3 0.3 0.3 0.4 0.4 0.5 0.6 85 060104 Ottawa ON Rideau And Wurtenberg 45.4343 -75.676 72 Commercia8HR 0.1 0.1 0.2 0.2 0.2 0.2 0.3 0.3 0.4 0.4 0.6 0.6 100 0.2 0.1
NO2 (ppb) 050204 Gatineau QC 255 St-Redempteur, Hull 45.436 -75.7234 62 Residential 8HR 0 1 2 4 6 9 13 18 23 27 33 36 98 6 5 054401 Saint-Anice QC 1128 De La Guerre 45.1206 -74.2885 50 Agricultura 8HR 0 1 1 2 3 4 6 8 11 13 35 40 98 3 3 060104 Ottawa ON Rideau And Wurtenberg 45.4343 -75.676 72 Commercia8HR 1 2 4 5 8 11 16 21 28 31 39 43 100 7 6
CO (ppm) 050204 Gatineau QC 255 St-Redempteur, Hull 45.436 -75.7234 62 Residential 24HR 0.1 0.1 0.2 0.2 0.2 0.2 0.3 0.3 0.4 0.4 0.6 0.6 97 0.2 0.1 054401 Saint-Anice QC 1128 De La Guerre 45.1206 -74.2885 50 Agricultura 24HR 0.1 0.2 0.2 0.2 0.3 0.3 0.3 0.3 0.4 0.4 0.4 0.5 84 060104 Ottawa ON Rideau And Wurtenberg 45.4343 -75.676 72 Commercia24HR 0.1 0.1 0.2 0.2 0.2 0.2 0.3 0.3 0.4 0.4 0.5 0.6 100 0.2 0.1
NO2 (ppb) 050204 Gatineau QC 255 St-Redempteur, Hull 45.436 -75.7234 62 Residential 24HR 0 2 3 4 6 9 12 15 19 22 29 32 98 6 5 054401 Saint-Anice QC 1128 De La Guerre 45.1206 -74.2885 50 Agricultura 24HR 1 1 2 2 3 4 5 7 10 12 28 30 98 3 2 060104 Ottawa ON Rideau And Wurtenberg 45.4343 -75.676 72 Commercia24HR 1 3 4 6 8 11 15 19 24 27 32 35 100 7 5
PM2.5 (µg/m3) 050204 Gatineau QC 255 St-Redempteur, Hull 45.436 -75.7234 62 Residential 24HR 0 2 4 5 7 9 12 14 18 21 32 36 96 6 4 054401 Saint-Anice QC 1128 De La Guerre 45.1206 -74.2885 50 Agricultura 24HR 0 2 4 6 8 10 13 16 19 22 37 38 85 060104 Ottawa ON Rideau And Wurtenberg 45.4343 -75.676 72 Commercia24HR 0 3 4 6 8 10 13 15 19 23 33 36 99 7 4
2014
NAPS ID City P/T Location Latitude Longitude Elevation Type ID Minimum 10th
Percentile 30th
Percentile 50th
Percentile 70th
Percentile 80th
Percentile 90th
Percentile 95th
Percentile 98th
Percentile 99th
Percentile 99.9th
Percentile Maximum Percent
Completeness Mean Standard Deviation
CO (ppm) 050204 Gatineau QC 255 St-Redempteur, Hull 45.436 -75.7234 62 Residential 1HR 0.1 0.1 0.2 0.2 0.2 0.2 0.3 0.3 0.4 0.5 0.7 0.9 90 0.2 0.1 054401 Saint-Anice QC 1128 De La Guerre 45.1206 -74.2885 50 Agricultura 1HR 0.1 0.1 0.2 0.2 0.2 0.3 0.3 0.3 0.4 0.4 0.4 0.5 95 0.2 0.1 060104 Ottawa ON Rideau And Wurtenberg 45.4343 -75.676 72 Commercia1HR 0 0.1 0.2 0.2 0.2 0.2 0.3 0.3 0.4 0.4 0.6 0.8 98 0.2 0.1
NO2 (ppb) 050204 Gatineau QC 255 St-Redempteur, Hull 45.436 -75.7234 62 Residential 1HR 0 1 2 4 6 9 13 17 24 28 39 46 97 6 6 054401 Saint-Anice QC 1128 De La Guerre 45.1206 -74.2885 50 Agricultura 1HR 0 1 1 2 3 4 5 7 12 18 31 39 95 3 3 060104 Ottawa ON Rideau And Wurtenberg 45.4343 -75.676 72 Commercia1HR 0 2 3 5 8 11 16 20 28 32 43 47 99 7 6
CO (ppm) 050204 Gatineau QC 255 St-Redempteur, Hull 45.436 -75.7234 62 Residential 8HR 0.1 0.1 0.2 0.2 0.2 0.2 0.3 0.3 0.4 0.4 0.5 0.7 94 0.2 0.1 054401 Saint-Anice QC 1128 De La Guerre 45.1206 -74.2885 50 Agricultura 8HR 0.1 0.1 0.2 0.2 0.2 0.3 0.3 0.3 0.4 0.4 0.4 0.4 98 0.2 0.1 060104 Ottawa ON Rideau And Wurtenberg 45.4343 -75.676 72 Commercia8HR 0 0.1 0.2 0.2 0.2 0.2 0.3 0.3 0.4 0.4 0.5 0.6 98 0.2 0.1
NO2 (ppb) 050204 Gatineau QC 255 St-Redempteur, Hull 45.436 -75.7234 62 Residential 8HR 0 2 3 4 6 8 12 15 20 23 29 37 97 6 5 054401 Saint-Anice QC 1128 De La Guerre 45.1206 -74.2885 50 Agricultura 8HR 0 1 1 2 3 4 5 7 12 17 28 31 99 3 3 060104 Ottawa ON Rideau And Wurtenberg 45.4343 -75.676 72 Commercia8HR 1 2 4 6 8 11 15 19 24 28 33 41 100 7 6
CO (ppm) 050204 Gatineau QC 255 St-Redempteur, Hull 45.436 -75.7234 62 Residential 24HR 0.1 0.1 0.2 0.2 0.2 0.2 0.3 0.3 0.3 0.4 0.4 0.4 93 0.2 0.1 054401 Saint-Anice QC 1128 De La Guerre 45.1206 -74.2885 50 Agricultura 24HR 0.1 0.1 0.2 0.2 0.2 0.3 0.3 0.3 0.3 0.4 0.4 0.4 98 0.2 0.1 060104 Ottawa ON Rideau And Wurtenberg 45.4343 -75.676 72 Commercia24HR 0.1 0.1 0.2 0.2 0.2 0.2 0.3 0.3 0.3 0.4 0.4 0.4 98 0.2 0
NO2 (ppb) 050204 Gatineau QC 255 St-Redempteur, Hull 45.436 -75.7234 62 Residential 24HR 1 2 3 5 7 8 11 13 16 19 22 23 96 6 4 054401 Saint-Anice QC 1128 De La Guerre 45.1206 -74.2885 50 Agricultura 24HR 1 1 2 2 3 4 5 7 11 14 18 19 99 3 2 060104 Ottawa ON Rideau And Wurtenberg 45.4343 -75.676 72 Commercia24HR 1 3 4 6 9 11 14 17 21 24 27 28 100 7 5
PM2.5 (µg/m3) 050204 Gatineau QC 255 St-Redempteur, Hull 45.436 -75.7234 62 Residential 24HR 1 3 5 7 9 10 13 15 19 20 23 23 94 7 4 054401 Saint-Anice QC 1128 De La Guerre 45.1206 -74.2885 50 Agricultura 24HR 1 3 5 6 9 10 13 15 19 21 29 31 98 7 4 060104 Ottawa ON Rideau And Wurtenberg 45.4343 -75.676 72 Commercia24HR 0 3 5 6 8 10 12 15 20 22 27 28 98 7 4
t ll
t ll
t ll
t ll
t ll
t ll
t ll
t ll
t ll
t ll
t ll
t ll
t ll
t ll

Concentrations (ug/m3) at St. Anicet NAPS 54401 - Raw Data
Day of the
Year
Formaldehyde ug/m3
Acetaldehyde ug/m3 Acrolein ug/m3
1/6/2015 6 0.4247 0.0000 0.0448 1/12/2015 12 1.0395 0.0000 0.0404 1/18/2015 18 0.5631 0.7527 0.0570 1/24/2015 24 0.9996 0.8608 0.0447 1/30/2015 30 0.4757 0.0000 0.0406 2/5/2015 36 0.3505 0.0016 0.0000 2/11/2015 42 0.9653 1.1456 0.0000 2/17/2015 48 0.7263 0.7403 0.0000 2/23/2015 54 0.3609 0.8025 0.0000 3/1/2015 60 1.0002 0.6007 0.0000 3/7/2015 66 1.0002 0.1059 0.0000 3/13/2015 72 0.6238 0.0000 0.0000 3/19/2015 78 1.0038 1.3285 0.0000 3/25/2015 84 1.1224 0.4139 0.0000 3/31/2015 90 0.5926 0.1783 0.0000 4/6/2015 96 0.8866 0.7617 0.0000 4/12/2015 102 0.9791 0.6006 0.0507 4/18/2015 108 1.1236 0.5648 0.0000 4/24/2015 114 0.4609 0.5924 0.0000 4/30/2015 120 0.8063 0.4213 0.0084 5/6/2015 126 1.2777 1.2492 0.0000 5/18/2015 138 4.4334 4.1820 0.0210 5/30/2015 150 3.5200 2.1683 0.0118 6/5/2015 156 2.5018 1.2651 0.0165 6/17/2015 168 1.8815 1.1970 0.0000 6/23/2015 174 2.3256 2.7171 0.0000 7/11/2015 192 -999.0000 -999.0000 -999.0000 7/17/2015 198 -999.0000 -999.0000 -999.0000 7/23/2015 204 -999.0000 -999.0000 -999.0000 7/29/2015 210 4.8108 3.2829 0.0315 8/4/2015 216 1.4545 1.7279 0.0000 8/10/2015 222 3.3404 2.9772 0.0000 8/16/2015 228 2.4809 1.4686 0.0000 8/22/2015 234 1.3479 0.9203 0.0000 8/28/2015 240 1.7795 0.0000 0.0000 10/3/2015 276 18.4097 2.7861 0.1066 10/9/2015 282 1.8450 1.4084 0.0271
10/15/2015 288 -999.0000 -999.0000 -999.0000 10/21/2015 294 -999.0000 -999.0000 -999.0000 10/27/2015 300 -999.0000 -999.0000 -999.0000 11/2/2015 306 -999.0000 -999.0000 -999.0000 11/8/2015 312 -999.0000 -999.0000 -999.0000
11/14/2015 318 -999.0000 -999.0000 -999.0000 11/20/2015 324 -999.0000 -999.0000 -999.0000 11/26/2015 330 -999.0000 -999.0000 -999.0000 12/2/2015 336 -999.0000 -999.0000 -999.0000 12/8/2015 342 0.3832 1.1135 0.0236
12/14/2015 348 0.2615 0.4834 0.0129 12/20/2015 354 0.0000 0.1573 0.0000 12/26/2015 360 0.0592 0.3275 0.0216

2015 VOC Concentrations (ug/m3) NAPS Station: 60104 (Ottawa)
Sampling Date
Day of the
Year
1,3-
Butadiene
(ug/m3)
Benzene
(ug/m3)
2015/01/06 6 0.099 1.051 2015/01/12 12 0.045 0.734 2015/01/18 18 0.094 1.290 2015/01/24 24 0.027 0.574 2015/01/30 30 0.023 0.500 2015/02/05 36 0.039 0.641 2015/02/11 42 0.033 0.693 2015/02/17 48 0.106 1.378 2015/02/23 54 0.028 0.702 2015/03/01 60 0.040 0.911 2015/03/07 66 0.023 0.634 2015/03/13 72 0.054 0.780 2015/03/19 78 0.032 0.534 2015/03/25 84 0.035 0.680 2015/03/31 90 0.011 0.355 2015/04/06 96 0.021 0.457 2015/04/12 102 0.013 0.322 2015/04/18 108 0.009 0.308 2015/04/24 114 0.016 0.331 2015/04/30 120 0.014 0.229 2015/05/06 126 0.026 0.352 2015/05/12 132 0.022 0.338 2015/05/18 138 0.032 0.384 2015/05/24 144 0.018 0.274 2015/05/30 150 0.018 0.304 2015/06/05 156 0.017 0.233 2015/06/11 162 0.019 0.449 2015/06/17 168 0.017 0.163 2015/06/23 174 0.012 0.146 2015/06/29 180 0.014 0.145 2015/07/05 186 0.020 0.350 2015/07/11 192 0.021 0.287 2015/07/17 198 0.033 0.325 2015/07/23 204 0.019 0.199 2015/07/29 210 0.023 0.315 2015/08/04 216 0.020 0.188 2015/08/10 222 0.021 0.279 2015/08/16 228 0.045 0.409 2015/08/22 234 0.042 0.291 2015/08/28 240 0.027 0.279 2015/09/03 246 0.018 0.411 2015/09/09 252 0.023 0.323 2015/09/15 258 0.017 0.252 2015/09/21 264 0.042 0.366 2015/09/27 270 0.048 0.490 2015/10/03 276 0.011 0.143 2015/10/09 282 0.024 0.235 2015/10/15 288 0.025 0.279 2015/10/21 294 0.020 0.262 2015/10/27 300 0.119 0.795 2015/11/02 306 0.043 0.388 2015/11/08 312 0.000 0.000 2015/11/14 318 0.016 0.279 2015/11/20 324 0.017 0.305 2015/11/26 330 0.038 0.578 2015/12/02 336 0.077 0.812 2015/12/08 342 0.069 0.692 2015/12/14 348 0.036 0.474 2015/12/20 354 0.023 0.359 2015/12/26 360 0.039 0.476

TRILLIUM_Limebank to Bowesville AQ Report_Rev0August 24, 2018:
APPENDIX F INDIVIDUAL RECEPTOR IMPACTS

APPENDIX F TRILLIUM_Limebank to Bowesville AQ Report_Rev1 September 6, 2018
Table F1: Predicted Maximum Concentration at Discrete Receptors - Carbon Monoixde (CO)
Receptors 1-hr Background
Level
3 (µg/m )
Modelled 1-Hr Concentration
(Maximum) 3 (µg/m )
1-Hr Cumulative Concentration
(Maximum) 3 (µg/m )
8-hr Background Level
3 (µg/m )
Modelled 8_Hr Concentration
(Maximum) 3 (µg/m )
8-Hr Cumulative Concentration
(Maximum) 3 (µg/m )
Air Quality Threshold
3 (µg/m ) (1-Hr/8-Hr)
R1 376 404 779 376 198 574 36,200/15,700 R2 376 343 719 376 137 513 36,200/15,700 R3 376 317 693 376 149 525 36,200/15,700 R4 376 350 726 376 175 551 36,200/15,700 R5 376 473 848 376 289 664 36,200/15,700 R6 376 711 1086 376 203 579 36,200/15,700 R7 376 450 826 376 204 580 36,200/15,700 R8 376 551 927 376 303 678 36,200/15,700 R9 376 540 916 376 208 584 36,200/15,700
R10 376 922 1298 376 306 682 36,200/15,700 R11 376 604 980 376 288 664 36,200/15,700 R12 376 1135 1511 376 412 787 36,200/15,700 R13 376 908 1284 376 312 688 36,200/15,700 R14 376 1864 2240 376 656 1031 36,200/15,700 R15 376 1101 1476 376 360 736 36,200/15,700 R16 376 1428 1804 376 687 1063 36,200/15,700 R17 376 919 1295 376 355 731 36,200/15,700 R19 376 1058 1434 376 461 836 36,200/15,700 R20 376 530 905 376 215 591 36,200/15,700

APPENDIX F TRILLIUM_Limebank to Bowesville AQ Report_Rev1September 6, 2018
Table F2: Predicted Maximum Concentration at Discrete Receptors - NOx
Receptors
1-hr Background
Level
3 (µg/m )
Modelled 1-Hr Concentration
(Maximum)
3 (µg/m )
1-Hr Cumulative
Concentration (Maximum)
3 (µg/m )
24-hr Background
Level
3 (µg/m )
Modelled 24-Hr Concentration
(Maximum)
3 (µg/m )
24-Hr Cumulative
Concentration (Maximum)
3 (µg/m )
Annual Background
Level
3 (µg/m )
Modelled Annual
Concentration (Maximum)
3 (µg/m )
Annual Cumulative
Concentration (Maximum)
Air Quality Threshold
3 (µg/m )
(1-Hr/24-Hr)
Air Quality Threshold CAAQS (2025)
1-hr/Annual 3 (µg/m )
R1 32.3 28.1 60.4 29.4 10.3 39.7 7.0 1.6 8.5 400/200 79/23 R2 32.3 26.5 58.8 29.4 8.9 38.3 7.0 1.0 7.9 400/200 79/23 R3 32.3 33.3 65.6 29.4 8.8 38.2 7.0 0.9 7.9 400/200 79/23 R4 32.3 41.4 73.7 29.4 10.7 40.1 7.0 1.0 8.0 400/200 79/23 R5 32.3 56.6 88.9 29.4 20.9 50.3 7.0 2.4 9.3 400/200 79/23 R6 32.3 39.9 72.2 29.4 8.1 37.5 7.0 1.2 8.1 400/200 79/23 R7 32.3 26.2 58.5 29.4 12.3 41.8 7.0 1.8 8.7 400/200 79/23 R8 32.3 55.3 87.6 29.4 17.0 46.4 7.0 1.0 8.0 400/200 79/23 R9 32.3 44.0 76.3 29.4 13.6 43.0 7.0 2.3 9.2 400/200 79/23
R10 32.3 65.1 97.4 29.4 17.8 47.2 7.0 3.0 10.0 400/200 79/23 R11 32.3 44.6 76.9 29.4 18.8 48.3 7.0 3.1 10.0 400/200 79/23 R12 32.3 65.0 97.3 29.4 25.4 54.8 7.0 4.4 11.4 400/200 79/23 R13 32.3 53.5 85.7 29.4 14.5 43.9 7.0 2.5 9.5 400/200 79/23 R14 32.3 71.6 103.9 29.4 18.4 47.8 7.0 2.9 9.8 400/200 79/23 R15 32.3 61.5 93.8 29.4 14.2 43.6 7.0 2.9 9.8 400/200 79/23 R16 32.3 62.2 94.5 29.4 23.5 52.9 7.0 3.4 10.3 400/200 79/23 R17 32.3 50.2 82.5 29.4 14.5 43.9 7.0 2.0 8.9 400/200 79/23 R19 32.3 68.5 100.8 29.4 18.4 47.8 7.0 3.0 10.0 400/200 79/23 R20 32.3 36.2 68.5 29.4 11.6 41.0 7.0 1.3 8.2 400/200 79/23

APPENDIX F TRILLIUM_Limebank to Bowesville AQ Report_Rev1September 6, 2018
Table F3: Predicted Maximum Concentration at Discrete Receptors -PM10
Receptors 24-hr Background
Level
3 (µg/m )
Modelled 24-Hr Concentration
(Maximum) 3 (µg/m )
24-Hr Cumulative Concentration
(Maximum) 3 (µg/m )
Air Quality Threshold
3 (µg/m )
R1 22.8 0.599 23.4 50.0 R2 22.8 0.515 23.4 50.0 R3 22.8 0.581 23.4 50.0 R4 22.8 0.667 23.5 50.0 R5 22.8 1.46 24.3 50.0 R6 22.8 0.598 23.4 50.0 R7 22.8 0.672 23.5 50.0 R8 22.8 1.07 23.9 50.0 R9 22.8 0.692 23.5 50.0
R10 22.8 0.975 23.8 50.0 R11 22.8 0.982 23.8 50.0 R12 22.8 1.37 24.2 50.0 R13 22.8 1.01 23.9 50.0 R14 22.8 1.80 24.6 50.0 R15 22.8 1.09 23.9 50.0 R16 22.8 2.12 25.0 50.0 R17 22.8 1.34 24.2 50.0 R19 22.8 1.18 24.0 50.0 R20 22.8 0.664 23.5 50.0

APPENDIX F TRILLIUM_Limebank to Bowesville AQ Report_Rev1September 6, 2018
Table F4: Predicted Maximum Concentration at Discrete Receptors - PM2.5
Receptors 24-hr Background
Level
3 (µg/m )
Modelled 24-Hr Concentration
(Maximum) 3 (µg/m )
24-Hr Cumulative Concentration
(Maximum) 3 (µg/m )
Annual Background Level
3 (µg/m )
Modelled Annual Concentration
(Maximum) 3 (µg/m )
Annual Cumulative
Concentration (Maximum)
3 (µg/m )
Air Quality Threshold
3 (µg/m ) (24-Hr/Annual)
R1 12.3 0.498 12.8 7.67 0.073 7.74 27/8.8 R2 12.3 0.410 12.7 7.67 0.046 7.71 27/8.8 R3 12.3 0.409 12.7 7.67 0.044 7.71 27/8.8 R4 12.3 0.509 12.8 7.67 0.047 7.71 27/8.8 R5 12.3 0.972 13.3 7.67 0.110 7.78 27/8.8 R6 12.3 0.427 12.8 7.67 0.056 7.72 27/8.8 R7 12.3 0.569 12.9 7.67 0.082 7.75 27/8.8 R8 12.3 0.788 13.1 7.67 0.048 7.71 27/8.8 R9 12.3 0.627 13.0 7.67 0.104 7.77 27/8.8
R10 12.3 0.823 13.2 7.67 0.140 7.81 27/8.8 R11 12.3 0.870 13.2 7.67 0.141 7.81 27/8.8 R12 12.3 1.205 13.5 7.67 0.205 7.87 27/8.8 R13 12.3 0.756 13.1 7.67 0.117 7.78 27/8.8 R14 12.3 1.212 13.5 7.67 0.149 7.82 27/8.8 R15 12.3 0.809 13.1 7.67 0.103 7.77 27/8.8 R16 12.3 1.409 13.7 7.67 0.192 7.86 27/8.8 R17 12.3 0.880 13.2 7.67 0.098 7.76 27/8.8 R19 12.3 0.937 13.3 7.67 0.144 7.81 27/8.8 R20 12.3 0.544 12.9 7.67 0.061 7.73 27/8.8

APPENDIX F TRILLIUM_Limebank to Bowesville AQ Report_Rev1September 6, 2018
Table F5: Predicted Maximum Concentration at Discrete Receptors - Benenze
Receptors 24-hr Background
Level
3 (µg/m )
Modelled 24-Hr Concentration
(Maximum) 3 (µg/m )
24-Hr Cumulative Concentration
(Maximum) 3 (µg/m )
Annual Background Level
3 (µg/m )
Modelled Annual Concentration
(Maximum) 3 (µg/m )
Annual Cumulative
Concentration (Maximum)
3 (µg/m )
Air Quality Threshold
3 (µg/m ) (24-Hr/Annual)
R1 0.713 0.129 0.842 0.437 0.007 0.445 2.3/0.45 R2 0.713 0.081 0.793 0.437 0.005 0.442 2.3/0.45 R3 0.713 0.093 0.806 0.437 0.005 0.442 2.3/0.45 R4 0.713 0.097 0.810 0.437 0.005 0.442 2.3/0.45 R5 0.713 0.081 0.794 0.437 0.009 0.446 2.3/0.45 R6 0.713 0.188 0.901 0.437 0.008 0.446 2.3/0.45 R7 0.713 0.146 0.859 0.437 0.008 0.446 2.3/0.45 R8 0.713 0.088 0.800 0.437 0.004 0.441 2.3/0.45 R9 0.713 0.095 0.808 0.437 0.009 0.446 2.3/0.45
R10 0.713 0.180 0.893 0.437 0.013 0.450 2.3/0.45 R11 0.713 0.187 0.900 0.437 0.013 0.451 2.3/0.45 R12 0.713 0.322 1.04 0.437 0.021 0.458 2.3/0.45 R13 0.713 0.296 1.01 0.437 0.012 0.449 2.3/0.45 R14 0.713 1.240 1.95 0.437 0.060 0.498 2.3/0.45 R15 0.713 0.543 1.26 0.437 0.016 0.453 2.3/0.45 R16 0.713 1.310 2.02 0.437 0.118 0.555 2.3/0.45 R17 0.713 0.689 1.40 0.437 0.029 0.466 2.3/0.45 R19 0.713 0.419 1.13 0.437 0.023 0.460 2.3/0.45 R20 0.713 0.337 1.05 0.437 0.014 0.451 2.3/0.45

APPENDIX F TRILLIUM_Limebank to Bowesville AQ Report_Rev1September 6, 2018
Table F6: Predicted Maximum Concentration at Discrete Receptors -1,3-Butadiene
Receptors 24-hr Background
Level
3 (µg/m )
Modelled 24-Hr Concentration
(Maximum) 3 (µg/m )
24-Hr Cumulative Concentration
(Maximum) 3 (µg/m )
Annual Background Level
3 (µg/m )
Modelled Annual Concentration
(Maximum) 3 (µg/m )
Annualr Cumulative
Concentration (Maximum)
3 (µg/m )
Air Quality Threshold
3 (µg/m ) (24-Hr/Annual)
R1 0.057 0.028 0.085 0.031 0.001 0.032 10.0/2.0 R2 0.057 0.017 0.074 0.031 0.001 0.031 10.0/2.0 R3 0.057 0.020 0.077 0.031 0.001 0.031 10.0/2.0 R4 0.057 0.021 0.078 0.031 0.001 0.031 10.0/2.0 R5 0.057 0.015 0.072 0.031 0.001 0.032 10.0/2.0 R6 0.057 0.041 0.098 0.031 0.002 0.032 10.0/2.0 R7 0.057 0.031 0.088 0.031 0.001 0.032 10.0/2.0 R8 0.057 0.016 0.073 0.031 0.001 0.031 10.0/2.0 R9 0.057 0.019 0.076 0.031 0.001 0.032 10.0/2.0
R10 0.057 0.036 0.093 0.031 0.002 0.032 10.0/2.0 R11 0.057 0.040 0.097 0.031 0.002 0.033 10.0/2.0 R12 0.057 0.069 0.126 0.031 0.003 0.034 10.0/2.0 R13 0.057 0.062 0.120 0.031 0.002 0.032 10.0/2.0 R14 0.057 0.277 0.334 0.031 0.013 0.043 10.0/2.0 R15 0.057 0.119 0.176 0.031 0.003 0.033 10.0/2.0

APPENDIX F TRILLIUM_Limebank to Bowesville AQ Report_Rev1September 6, 2018
Table F7: Predicted Maximum Concentration at Discrete Receptors - Formaldehyde
Receptors 24-hr Background
Level
3 (µg/m )
Modelled 24-Hr Concentration
(Maximum) 3 (µg/m )
24-Hr Cumulative Concentration
(Maximum) 3 (µg/m )
Air Quality Threshold
3 (µg/m )
R1 1.22 0.542 1.77 65.0 R2 1.22 0.461 1.69 65.0 R3 1.22 0.441 1.67 65.0 R4 1.22 0.551 1.78 65.0 R5 1.22 1.03 2.25 65.0 R6 1.22 0.417 1.64 65.0 R7 1.22 0.654 1.88 65.0 R8 1.22 0.865 2.09 65.0 R9 1.22 0.730 1.95 65.0
R10 1.22 0.958 2.18 65.0 R11 1.22 1.01 2.24 65.0 R12 1.22 1.36 2.58 65.0 R13 1.22 0.761 1.99 65.0 R14 1.22 0.948 2.17 65.0 R15 1.22 0.717 1.94 65.0 R16 1.22 1.17 2.40 65.0 R17 1.22 0.705 1.93 65.0 R19 1.22 0.964 2.19 65.0 R20 1.22 0.624 1.85 65.0

APPENDIX F TRILLIUM_Limebank to Bowesville AQ Report_Rev1September 6, 2018
Table F8: Predicted Maximum Concentration at Discrete Receptors - Acetaldehyde
Receptors 24-hr Background
Level
3 (µg/m )
Modelled 24-Hr Concentration
(Maximum) 3 (µg/m )
24-Hr Cumulative Concentration
(Maximum) 3 (µg/m )
Air Quality Threshold
3 (µg/m )
R1 2.54 0.217 2.76 500.0 R2 2.54 0.156 2.69 500.0 R3 2.54 0.155 2.69 500.0 R4 2.54 0.205 2.74 500.0 R5 2.54 0.347 2.89 500.0 R6 2.54 0.205 2.74 500.0 R7 2.54 0.231 2.77 500.0 R8 2.54 0.293 2.83 500.0 R9 2.54 0.250 2.79 500.0
R10 2.54 0.345 2.88 500.0 R11 2.54 0.351 2.89 500.0 R12 2.54 0.509 3.05 500.0 R13 2.54 0.364 2.90 500.0 R14 2.54 0.820 3.36 500.0 R15 2.54 0.462 3.00 500.0 R16 2.54 0.878 3.42 500.0 R17 2.54 0.524 3.06 500.0 R19 2.54 0.452 2.99 500.0 R20 2.54 0.262 2.80 500.0

APPENDIX F TRILLIUM_Limebank to Bowesville AQ Report_Rev1September 6, 2018
Table F9: Predicted Maximum Concentration at Discrete Receptors - Acrolein
Receptors 24-hr Background
Level
3 (µg/m )
Modelled 24-Hr Concentration
(Maximum) 3 (µg/m )
24-Hr Cumulative Concentration
(Maximum) 3 (µg/m )
Annual Background Level
3 (µg/m )
Modelled Annual Concentration
(Maximum) 3 (µg/m )
Annual Cumulative
Concentration (Maximum)
3 (µg/m )
Air Quality Threshold
3 (µg/m ) (24-Hr/Annual)
R1 1.37 0.085 1.46 0.031 0.029 0.061 4.5/0.4 R2 1.37 0.071 1.45 0.031 0.024 0.055 4.5/0.4 R3 1.37 0.084 1.46 0.031 0.023 0.054 4.5/0.4 R4 1.37 0.103 1.48 0.031 0.029 0.060 4.5/0.4 R5 1.37 0.141 1.52 0.031 0.053 0.084 4.5/0.4 R6 1.37 0.151 1.53 0.031 0.024 0.056 4.5/0.4 R7 1.37 0.095 1.47 0.031 0.034 0.065 4.5/0.4 R8 1.37 0.145 1.52 0.031 0.045 0.076 4.5/0.4 R9 1.37 0.130 1.50 0.031 0.038 0.069 4.5/0.4
R10 1.37 0.219 1.59 0.031 0.049 0.081 4.5/0.4 R11 1.37 0.127 1.50 0.031 0.052 0.083 4.5/0.4 R12 1.37 0.238 1.61 0.031 0.072 0.103 4.5/0.4 R13 1.37 0.196 1.57 0.031 0.044 0.075 4.5/0.4 R14 1.37 0.333 1.71 0.031 0.069 0.100 4.5/0.4 R15 1.37 0.232 1.61 0.031 0.047 0.078 4.5/0.4 R16 1.37 0.264 1.64 0.031 0.082 0.113 4.5/0.4 R17 1.37 0.183 1.56 0.031 0.050 0.081 4.5/0.4 R19 1.37 0.240 1.61 0.031 0.055 0.086 4.5/0.4 R20 1.37 0.102 1.48 0.031 0.032 0.063 4.5/0.4

APPENDIX F TRILLIUM_Limebank to Bowesville AQ Report_Rev1September 6, 2018
Table F10: Predicted Maximum Concentration at Discrete Receptors - Benzo(a)pyrene
Receptors 24-hr Background
Level
3 (µg/m )
Modelled 24-Hr Concentration
(Maximum) 3 (µg/m )
24-Hr Cumulative Concentration
(Maximum) 3 (µg/m )
Annual Background Level
3 (µg/m )
Modelled Annual Concentration
(Maximum) 3 (µg/m )
Annual Cumulative
Concentration (Maximum)
3 (µg/m )
Air Quality Threshold
3 (µg/m ) (24-Hr/Annual)
R1 1.53E-04 5.00E-05 2.03E-04 7.62E-05 1.00E-05 8.62E-05 0.00005/0.00001 R2 1.53E-04 3.00E-05 1.83E-04 7.62E-05 0.00E+00 7.62E-05 0.00005/0.00001 R3 1.53E-04 4.00E-05 1.93E-04 7.62E-05 0.00E+00 7.62E-05 0.00005/0.00001 R4 1.53E-04 4.00E-05 1.93E-04 7.62E-05 0.00E+00 7.62E-05 0.00005/0.00001 R5 1.53E-04 6.00E-05 2.13E-04 7.62E-05 1.00E-05 8.62E-05 0.00005/0.00001 R6 1.53E-04 6.00E-05 2.13E-04 7.62E-05 0.00E+00 7.62E-05 0.00005/0.00001 R7 1.53E-04 5.00E-05 2.03E-04 7.62E-05 1.00E-05 8.62E-05 0.00005/0.00001 R8 1.53E-04 5.00E-05 2.03E-04 7.62E-05 0.00E+00 7.62E-05 0.00005/0.00001 R9 1.53E-04 4.00E-05 1.93E-04 7.62E-05 1.00E-05 8.62E-05 0.00005/0.00001
R10 1.53E-04 8.00E-05 2.33E-04 7.62E-05 1.00E-05 8.62E-05 0.00005/0.00001 R11 1.53E-04 7.00E-05 2.23E-04 7.62E-05 1.00E-05 8.62E-05 0.00005/0.00001 R12 1.53E-04 1.10E-04 2.63E-04 7.62E-05 1.00E-05 8.62E-05 0.00005/0.00001 R13 1.53E-04 1.10E-04 2.63E-04 7.62E-05 1.00E-05 8.62E-05 0.00005/0.00001 R14 1.53E-04 3.60E-04 5.13E-04 7.62E-05 2.00E-05 9.62E-05 0.00005/0.00001 R15 1.53E-04 1.70E-04 3.23E-04 7.62E-05 1.00E-05 8.62E-05 0.00005/0.00001 R16 1.53E-04 3.80E-04 5.33E-04 7.62E-05 4.00E-05 1.16E-04 0.00005/0.00001 R17 1.53E-04 2.10E-04 3.63E-04 7.62E-05 1.00E-05 8.62E-05 0.00005/0.00001 R19 1.53E-04 1.40E-04 2.93E-04 7.62E-05 1.00E-05 8.62E-05 0.00005/0.00001 R20 1.53E-04 1.00E-04 2.53E-04 7.62E-05 1.00E-05 8.62E-05 0.00005/0.00001