appendix c - san francisco state university c.pdfpage 2 of 19. off-road equipment - added a trencher...
TRANSCRIPT
APPENDIX C Air Quality & Greenhouse Gas Emissions
Calculations


CalEEMod Outputs Construction - Annual and
Mitigation Report

Page 1 of 19
CalEEMod Version: CalEEMod.2013.2.2 Date: 8/23/2016 12:41 PM
SFSU - Creative Arts & Holloway - ConstructionSan Francisco County, Annual
1.0 Project Characteristics
1.1 Land Usage
Land Uses Size Metric Lot Acreage Floor Surface Area Population
Junior College (2Yr) 75.00 1000sqft 1.00 75,000.00 0
Junior College (2Yr) 60.00 1000sqft 0.90 60,000.00 0
Enclosed Parking with Elevator 70.00 Space 0.00 28,000.00 0
Apartments Mid Rise 200.00 Dwelling Unit 1.00 111,146.00 550
Strip Mall 25.00 1000sqft 0.30 25,000.00 0
1.2 Other Project Characteristics
Urbanization Urban Wind Speed (m/s) 4.6 Precipitation Freq (Days) 64
Climate Zone 5 Operational Year 2020
Utility Company Pacific Gas & Electric Company
CO2 Intensity (lb/MWhr)
499.66 CH4 Intensity (lb/MWhr)
0.029 N2O Intensity (lb/MWhr)
0.006
1.3 User Entered Comments & Non-Default Data
Project Characteristics - PG&E CO2 Intensity Factor adjusted per 33% RPS by 2020
Land Use - Junior College used to represent University (since University doesn't have 1,000 sqft metric). Dwelling units based on assumption of 2.75 people/beds per unit. Acreages adjusted to match respective blockConstruction Phase - Expanded construction schedule to match Project Description
Grading - Block 1 cut = 12,000 yd3 phase 1 and 5,000 yd3 phase 2. Block 6 cut = 15,600 yd3
Demolition - Debris tonnage based on CalEEMod factor of 0.046 tons/sf for buildings and CalRecycle factor of 2,400 lbs asphalt debris/yd3
Trips and VMT - Default vehicle trips
Architectural Coating - Adusted non-residential interior/exterior area based on minimal surfaces to be coated in parking garage

Page 2 of 19
Off-road Equipment - Added a trencher to account for utility installation
Construction Off-road Equipment Mitigation - Basic fugitive dust control measures included
Table Name Column Name Default Value New Value
tblArchitecturalCoating ConstArea_Nonresidential_Exterior 94,000.00 81,680.00
tblArchitecturalCoating ConstArea_Nonresidential_Interior 282,000.00 240,000.00
tblConstructionPhase NumDays 18.00 22.00
tblConstructionPhase NumDays 230.00 519.00
tblConstructionPhase NumDays 20.00 30.00
tblConstructionPhase NumDays 8.00 30.00
tblConstructionPhase NumDays 18.00 21.00
tblConstructionPhase NumDays 5.00 10.00
tblConstructionPhase PhaseEndDate 11/1/2019 10/31/2019
tblConstructionPhase PhaseEndDate 11/29/2019 11/30/2019
tblConstructionPhase PhaseStartDate 11/7/2017 11/6/2017
tblGrading MaterialExported 0.00 20,600.00
tblGrading MaterialExported 0.00 12,000.00
tblLandUse LandUseSquareFeet 200,000.00 111,146.00
tblLandUse LotAcreage 1.38 0.90
tblLandUse LotAcreage 1.72 1.00
tblLandUse LotAcreage 0.63 0.00
tblLandUse LotAcreage 5.26 1.00
tblLandUse LotAcreage 0.57 0.30
tblLandUse Population 572.00 550.00
tblOffRoadEquipment OffRoadEquipmentType Trenchers
tblProjectCharacteristics CO2IntensityFactor 641.35 499.66
tblProjectCharacteristics OperationalYear 2014 2020
tblVehicleTrips ST_TR 7.16 0.00
tblVehicleTrips ST_TR 11.23 0.00
tblVehicleTrips ST_TR 42.04 0.00
tblVehicleTrips SU_TR 6.07 0.00
tblVehicleTrips SU_TR 1.21 0.00

Page 3 of 19
tblVehicleTrips SU_TR 20.43 0.00
tblVehicleTrips WD_TR 6.59 0.00
tblVehicleTrips WD_TR 27.49 0.00
tblVehicleTrips WD_TR 44.32 0.00

Page 4 of 19
Exhaust PM10
PM10 Total
2.0 Emissions Summary
2.1 Overall Construction
NBio- CO2 Total CO2
Unmitigated Construction
ROG NOx CO SO2 Fugitive PM10
CH4 N2O CO2e
Year tons/yr MT/yr
Fugitive PM2.5
Exhaust PM2.5
PM2.5 Total
Bio- CO2
2017 0.2972 2.7511 2.8037 4.2500e-003
0.3343 0.1261 0.4604 0.1329 0.1171 0.2500 0.0000 374.4246 374.4246 0.0500 0.0000 375.4739
2018 0.5029 3.6991 4.4909 8.4500e-003
0.3038 0.2049 0.5087 0.0817 0.1925 0.2742 0.0000 685.2873 685.2873 0.0885 0.0000 687.1457
2019 2.0179 2.9494 3.7755 7.3700e-003
0.2601 0.1569 0.4169 0.0699 0.1473 0.2172 0.0000 586.4299 586.4299 0.0781 0.0000 588.0689
Total 2.8180 9.3995 11.0700 0.0201 0.2165 0.0000 1,650.6885
0.8982 0.4879 1.3861 0.2845 0.4568 0.7413
SO2 Fugitive PM10
Exhaust PM10
0.0000 1,646.1418
1,646.1418
PM2.5 Total
Bio- CO2 NBio- CO2
Mitigated Construction
ROG NOx CO Total CO2 CH4 N2O CO2e
Year tons/yr MT/yr
PM10 Total
Fugitive PM2.5
Exhaust PM2.5
2017 0.2972 2.7511 2.8037 4.2500e-003
0.1996 0.1261 0.3257 0.0731 0.1171 0.1902 0.0000 374.4244 374.4244 0.0500 0.0000 375.4737
2018 0.5029 3.6991 4.4909 8.4500e-003
0.3038 0.2049 0.5087 0.0817 0.1925 0.2742 0.0000 685.2869 685.2869 0.0885 0.0000 687.1454
2019 2.0179 2.9494 3.7755 7.3700e-003
0.2601 0.1569 0.4169 0.0699 0.1473 0.2172 0.0000 586.4296 586.4296 0.0781 0.0000 588.0685
Total 2.8180 9.3995 11.0700 0.0201 0.7635 0.4879 1.2514 0.2248 0.4568 0.6816 0.0000 1,646.1409
1,646.1409 0.2165 0.0000 1,650.6876
ROG NOx CO SO2 Fugitive PM10
Exhaust PM10
PM10 Total
Fugitive PM2.5
Exhaust PM2.5
PM2.5 Total
Bio- CO2 NBio-CO2 Total CO2 CH4 N20 CO2e
Percent Reduction
0.00 0.00 0.00 0.00 0.00 0.00 0.0015.00 0.00 9.72 21.01 0.00 8.06 0.00 0.00 0.00

Page 5 of 19
3.0 Construction Detail
Construction Phase
Phase Number
Phase Name Phase Type Start Date End Date Num Days Week
Num Days Phase Description
1 Demolition Demolition 8/1/2017 9/11/2017 5 30
2 Site Preparation Site Preparation 9/12/2017 9/25/2017 5 10
3 Grading/Trenching Grading 9/26/2017 11/6/2017 5 30
4 Building Construction Building Construction 11/6/2017 10/31/2019 5 519
5 Paving Paving 11/1/2019 11/30/2019 5 21
6 Architectural Coating Architectural Coating 12/1/2019 12/31/2019 5 22
Acres of Grading (Site Preparation Phase): 0
Acres of Grading (Grading Phase): 0
Acres of Paving: 0
Residential Indoor: 225,071; Residential Outdoor: 75,024; Non-Residential Indoor: 240,000; Non-Residential Outdoor: 81,680
OffRoad Equipment
Phase Name Offroad Equipment Type Amount Usage Hours Horse Power Load Factor
Demolition Concrete/Industrial Saws 1 8.00 81 0.73
Demolition Excavators 3 8.00 162 0.38
Demolition Rubber Tired Dozers 2 8.00 255 0.40
Site Preparation Rubber Tired Dozers 3 8.00 255 0.40
Site Preparation Tractors/Loaders/Backhoes 4 8.00 97 0.37
Grading/Trenching Excavators 1 8.00 162 0.38
Grading/Trenching Graders 1 8.00 174 0.41
Grading/Trenching Rubber Tired Dozers 1 8.00 255 0.40
Paving Cement and Mortar Mixers 2 6.00 9 0.56
Grading/Trenching Tractors/Loaders/Backhoes 3 8.00 97 0.37
Building Construction Cranes 1 7.00 226 0.29
Building Construction Forklifts 3 8.00 89 0.20
Building Construction Generator Sets 1 8.00 84 0.74

Page 6 of 19
Building Construction Tractors/Loaders/Backhoes 3 7.00 97 0.37
Building Construction Welders 1 8.00 46 0.45
Paving Pavers 1 8.00 125 0.42
Paving Paving Equipment 2 6.00 130 0.36
Paving Rollers 2 6.00 80 0.38
Architectural Coating Air Compressors 1 6.00 78 0.48
Paving Tractors/Loaders/Backhoes 1 8.00 97 0.37
Grading/Trenching Trenchers 1 8.00 80 0.50
Trips and VMT
Phase Name Offroad Equipment Count
Worker Trip Number
Vendor Trip Number
Hauling Trip Number
Worker Trip Length
Vendor Trip Length
Hauling Trip Length
Worker Vehicle Class
Vendor Vehicle Class
Hauling Vehicle Class
Demolition 6 15.00 0.00 440.00 12.40 7.30 20.00 LD_Mix HDT_Mix HHDT
Site Preparation 7 18.00 0.00 1,500.00 12.40 7.30 20.00 LD_Mix HDT_Mix HHDT
Grading/Trenching 7 18.00 0.00 2,575.00 12.40 7.30 20.00 LD_Mix HDT_Mix HHDT
Building Construction 9 220.00 52.00 0.00 12.40 7.30 20.00 LD_Mix HDT_Mix HHDT
Paving 8 20.00 0.00 0.00 12.40 7.30 20.00 LD_Mix HDT_Mix HHDT
Architectural Coating 1 44.00 0.00 0.00 12.40 7.30 20.00 LD_Mix HDT_Mix HHDT
3.1 Mitigation Measures Construction
Water Exposed Area
Reduce Vehicle Speed on Unpaved Roads
Clean Paved Roads
3.2 Demolition - 2017Unmitigated Construction On-Site
ROG NOx CO SO2 Fugitive PM10
Exhaust PM10
PM10 Total
Fugitive PM2.5
Exhaust PM2.5
PM2.5 Total
Bio- CO2 NBio- CO2 Total CO2 CH4 N2O CO2e
Category tons/yr MT/yr

Page 7 of 19
Fugitive Dust 0.0515 0.0000 0.0515 7.8000e-003
0.0000 7.8000e-003
0.0000 0.0000 0.0000 0.0000 0.0000 0.0000
Off-Road 0.0607 0.6405 0.5084 6.0000e-004
0.0319 0.0319 0.0297 0.0297 0.0000 54.9273 54.9273 0.0151 0.0000 55.2438
Total 0.0607 0.6405 0.5084 6.0000e-004
0.0515 0.0319 0.0834 7.8000e-003
0.0297 0.0375 0.0000 54.9273 54.9273 0.0151 0.0000 55.2438
Unmitigated Construction Off-Site
ROG NOx CO SO2 Fugitive PM10
Exhaust PM10
PM10 Total
Fugitive PM2.5
Exhaust PM2.5
PM2.5 Total
Bio- CO2 NBio- CO2 Total CO2 CH4 N2O CO2e
Category tons/yr MT/yr
Hauling 5.9000e-003
0.0583 0.0886 1.6000e-004
3.6600e-003
6.9000e-004
4.3400e-003
1.0000e-003
6.3000e-004
1.6300e-003
0.0000 13.8948 13.8948 1.0000e-004
0.0000 13.8968
Vendor 0.0000 0.0000 0.0000 0.0000 0.0000 0.0000 0.0000 0.0000 0.0000 0.0000 0.0000 0.0000 0.0000 0.0000 0.0000 0.0000
Worker 7.3000e-004
1.0100e-003
0.0101 3.0000e-005
2.0400e-003
2.0000e-005
2.0600e-003
5.4000e-004
2.0000e-005
5.6000e-004
0.0000 1.9563 1.9563 1.0000e-004
0.0000 1.9584
Total 6.6300e-003
0.0593 0.0987 1.9000e-004
2.0000e-004
0.0000 15.85535.7000e-003
7.1000e-004
6.4000e-003
1.5400e-003
6.5000e-004
2.1900e-003
SO2 Fugitive PM10
Exhaust PM10
0.0000 15.8511 15.8511
PM2.5 Total
Bio- CO2 NBio- CO2
Mitigated Construction On-Site
ROG NOx CO Total CO2 CH4 N2O CO2e
Category tons/yr MT/yr
PM10 Total
Fugitive PM2.5
Exhaust PM2.5
Fugitive Dust 0.0232 0.0000 0.0232 3.5100e-003
0.0000 3.5100e-003
0.0000 0.0000 0.0000 0.0000 0.0000 0.0000
Off-Road 0.0607 0.6405 0.5084 6.0000e-004
0.0319 0.0319 0.0297 0.0297 0.0000 54.9273 54.9273 0.0151 0.0000 55.2437
Total 0.0607 0.6405 0.5084 6.0000e-004
0.0151 0.0000 55.24370.0232 0.0319 0.0551 3.5100e-003
0.0297 0.0332 0.0000 54.9273 54.9273
Page 8 of 19
SO2 Fugitive PM10
Exhaust PM10
PM2.5 Total
Bio- CO2 NBio- CO2
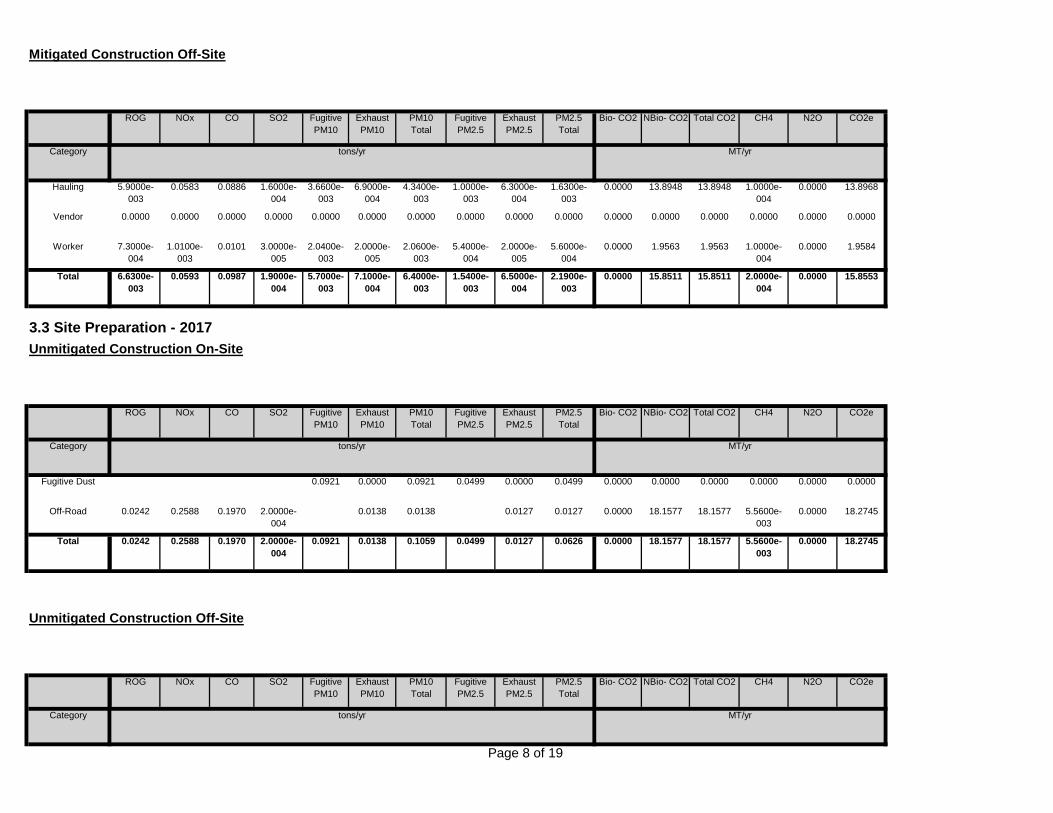
Mitigated Construction Off-Site
ROG NOx CO Total CO2 CH4 N2O CO2e
Category tons/yr MT/yr
PM10 Total
Fugitive PM2.5
Exhaust PM2.5
Hauling 5.9000e-003
0.0583 0.0886 1.6000e-004
3.6600e-003
6.9000e-004
4.3400e-003
1.0000e-003
6.3000e-004
1.6300e-003
0.0000 13.8948 13.8948 1.0000e-004
0.0000 13.8968
Vendor 0.0000 0.0000 0.0000 0.0000 0.0000 0.0000 0.0000 0.0000 0.0000 0.0000 0.0000 0.0000 0.0000 0.0000 0.0000 0.0000
Worker 7.3000e-004
1.0100e-003
0.0101 3.0000e-005
2.0400e-003
2.0000e-005
2.0600e-003
5.4000e-004
2.0000e-005
5.6000e-004
0.0000 1.9563 1.9563 1.0000e-004
0.0000 1.9584
Total 6.6300e-003
0.0593 0.0987 1.9000e-004
2.0000e-004
0.0000 15.85535.7000e-003
7.1000e-004
6.4000e-003
1.5400e-003
6.5000e-004
2.1900e-003
SO2 Fugitive PM10
Exhaust PM10
0.0000 15.8511 15.8511
PM2.5 Total
Bio- CO2 NBio- CO2
3.3 Site Preparation - 2017Unmitigated Construction On-Site
ROG NOx CO Total CO2 CH4 N2O CO2e
Category tons/yr MT/yr
PM10 Total
Fugitive PM2.5
Exhaust PM2.5
Fugitive Dust 0.0921 0.0000 0.0921 0.0499 0.0000 0.0499 0.0000 0.0000 0.0000 0.0000 0.0000 0.0000
Off-Road 0.0242 0.2588 0.1970 2.0000e-004
0.0138 0.0138 0.0127 0.0127 0.0000 18.1577 18.1577 5.5600e-003
0.0000 18.2745
Total 0.0242 0.2588 0.1970 2.0000e-004
5.5600e-003
0.0000 18.27450.0921 0.0138 0.1059 0.0499 0.0127 0.0626
SO2 Fugitive PM10
Exhaust PM10
0.0000 18.1577 18.1577
PM2.5 Total
Bio- CO2 NBio- CO2
Unmitigated Construction Off-Site
ROG NOx CO Total CO2 CH4 N2O CO2e
Category tons/yr MT/yr
PM10 Total
Fugitive PM2.5
Exhaust PM2.5

Page 9 of 19
Hauling 0.0201 0.1989 0.3019 5.3000e-004
0.0125 2.3400e-003
0.0148 3.4200e-003
2.1500e-003
5.5600e-003
0.0000 47.3685 47.3685 3.4000e-004
0.0000 47.3756
Vendor 0.0000 0.0000 0.0000 0.0000 0.0000 0.0000 0.0000 0.0000 0.0000 0.0000 0.0000 0.0000 0.0000 0.0000 0.0000 0.0000
Worker 2.9000e-004
4.0000e-004
4.0400e-003
1.0000e-005
8.2000e-004
1.0000e-005
8.2000e-004
2.2000e-004
1.0000e-005
2.2000e-004
0.0000 0.7825 0.7825 4.0000e-005
0.0000 0.7834
Total 0.0204 0.1993 0.3060 5.4000e-004
3.8000e-004
0.0000 48.15890.0133 2.3500e-003
0.0156 3.6400e-003
2.1600e-003
5.7800e-003
SO2 Fugitive PM10
Exhaust PM10
0.0000 48.1511 48.1511
PM2.5 Total
Bio- CO2 NBio- CO2
Mitigated Construction On-Site
ROG NOx CO Total CO2 CH4 N2O CO2e
Category tons/yr MT/yr
PM10 Total
Fugitive PM2.5
Exhaust PM2.5
Fugitive Dust 0.0415 0.0000 0.0415 0.0225 0.0000 0.0225 0.0000 0.0000 0.0000 0.0000 0.0000 0.0000
Off-Road 0.0242 0.2588 0.1970 2.0000e-004
0.0138 0.0138 0.0127 0.0127 0.0000 18.1577 18.1577 5.5600e-003
0.0000 18.2745
Total 0.0242 0.2588 0.1970 2.0000e-004
5.5600e-003
0.0000 18.27450.0415 0.0138 0.0552 0.0225 0.0127 0.0351
SO2 Fugitive PM10
Exhaust PM10
0.0000 18.1577 18.1577
PM2.5 Total
Bio- CO2 NBio- CO2
Mitigated Construction Off-Site
ROG NOx CO Total CO2 CH4 N2O CO2e
Category tons/yr MT/yr
PM10 Total
Fugitive PM2.5
Exhaust PM2.5
Hauling 0.0201 0.1989 0.3019 5.3000e-004
0.0125 2.3400e-003
0.0148 3.4200e-003
2.1500e-003
5.5600e-003
0.0000 47.3685 47.3685 3.4000e-004
0.0000 47.3756
Vendor 0.0000 0.0000 0.0000 0.0000 0.0000 0.0000 0.0000 0.0000 0.0000 0.0000 0.0000 0.0000 0.0000 0.0000 0.0000 0.0000
Worker 2.9000e-004
4.0000e-004
4.0400e-003
1.0000e-005
8.2000e-004
1.0000e-005
8.2000e-004
2.2000e-004
1.0000e-005
2.2000e-004
0.0000 0.7825 0.7825 4.0000e-005
0.0000 0.7834
Total 0.0204 0.1993 0.3060 5.4000e-004
3.8000e-004
0.0000 48.15890.0133 2.3500e-003
0.0156 3.6400e-003
2.1600e-003
5.7800e-003
0.0000 48.1511 48.1511

Page 10 of 19
SO2 Fugitive PM10
Exhaust PM10
PM2.5 Total
Bio- CO2 NBio- CO2
3.4 Grading/Trenching - 2017Unmitigated Construction On-Site
ROG NOx CO Total CO2 CH4 N2O CO2e
Category tons/yr MT/yr
PM10 Total
Fugitive PM2.5
Exhaust PM2.5
Fugitive Dust 0.1013 0.0000 0.1013 0.0510 0.0000 0.0510 0.0000 0.0000 0.0000 0.0000 0.0000 0.0000
Off-Road 0.0599 0.6104 0.4227 5.0000e-004
0.0361 0.0361 0.0332 0.0332 0.0000 46.2366 46.2366 0.0142 0.0000 46.5341
Total 0.0599 0.6104 0.4227 5.0000e-004
0.0142 0.0000 46.53410.1013 0.0361 0.1374 0.0510 0.0332 0.0842
SO2 Fugitive PM10
Exhaust PM10
0.0000 46.2366 46.2366
PM2.5 Total
Bio- CO2 NBio- CO2
Unmitigated Construction Off-Site
ROG NOx CO Total CO2 CH4 N2O CO2e
Category tons/yr MT/yr
PM10 Total
Fugitive PM2.5
Exhaust PM2.5
Hauling 0.0345 0.3414 0.5183 9.1000e-004
0.0214 4.0100e-003
0.0254 5.8700e-003
3.6800e-003
9.5500e-003
0.0000 81.3160 81.3160 5.8000e-004
0.0000 81.3281
Vendor 0.0000 0.0000 0.0000 0.0000 0.0000 0.0000 0.0000 0.0000 0.0000 0.0000 0.0000 0.0000 0.0000 0.0000 0.0000 0.0000
Worker 8.8000e-004
1.2100e-003
0.0121 3.0000e-005
2.4500e-003
2.0000e-005
2.4700e-003
6.5000e-004
2.0000e-005
6.7000e-004
0.0000 2.3476 2.3476 1.2000e-004
0.0000 2.3501
Total 0.0354 0.3426 0.5304 9.4000e-004
7.0000e-004
0.0000 83.67820.0239 4.0300e-003
0.0279 6.5200e-003
3.7000e-003
0.0102
SO2 Fugitive PM10
Exhaust PM10
0.0000 83.6636 83.6636
PM2.5 Total
Bio- CO2 NBio- CO2
Mitigated Construction On-Site
ROG NOx CO Total CO2 CH4 N2O CO2ePM10 Total
Fugitive PM2.5
Exhaust PM2.5

Page 11 of 19
Category tons/yr MT/yr
Fugitive Dust 0.0456 0.0000 0.0456 0.0229 0.0000 0.0229 0.0000 0.0000 0.0000 0.0000 0.0000 0.0000
Off-Road 0.0599 0.6104 0.4227 5.0000e-004
0.0361 0.0361 0.0332 0.0332 0.0000 46.2366 46.2366 0.0142 0.0000 46.5341
Total 0.0599 0.6104 0.4227 5.0000e-004
0.0142 0.0000 46.53410.0456 0.0361 0.0817 0.0229 0.0332 0.0562
SO2 Fugitive PM10
Exhaust PM10
0.0000 46.2366 46.2366
PM2.5 Total
Bio- CO2 NBio- CO2
Mitigated Construction Off-Site
ROG NOx CO Total CO2 CH4 N2O CO2e
Category tons/yr MT/yr
PM10 Total
Fugitive PM2.5
Exhaust PM2.5
Hauling 0.0345 0.3414 0.5183 9.1000e-004
0.0214 4.0100e-003
0.0254 5.8700e-003
3.6800e-003
9.5500e-003
0.0000 81.3160 81.3160 5.8000e-004
0.0000 81.3281
Vendor 0.0000 0.0000 0.0000 0.0000 0.0000 0.0000 0.0000 0.0000 0.0000 0.0000 0.0000 0.0000 0.0000 0.0000 0.0000 0.0000
Worker 8.8000e-004
1.2100e-003
0.0121 3.0000e-005
2.4500e-003
2.0000e-005
2.4700e-003
6.5000e-004
2.0000e-005
6.7000e-004
0.0000 2.3476 2.3476 1.2000e-004
0.0000 2.3501
Total 0.0354 0.3426 0.5304 9.4000e-004
7.0000e-004
0.0000 83.67820.0239 4.0300e-003
0.0279 6.5200e-003
3.7000e-003
0.0102
SO2 Fugitive PM10
Exhaust PM10
0.0000 83.6636 83.6636
PM2.5 Total
Bio- CO2 NBio- CO2
3.5 Building Construction - 2017Unmitigated Construction On-Site
ROG NOx CO Total CO2 CH4 N2O CO2e
Category tons/yr MT/yr
PM10 Total
Fugitive PM2.5
Exhaust PM2.5
Off-Road 0.0621 0.5281 0.3626 5.4000e-004
0.0356 0.0356 0.0335 0.0335 0.0000 47.8958 47.8958 0.0118 0.0000 48.1434
Total 0.0621 0.5281 0.3626 5.4000e-004
0.0118 0.0000 48.14340.0356 0.0356 0.0335 0.0335 0.0000 47.8958 47.8958

Page 12 of 19
SO2 Fugitive PM10
Exhaust PM10
PM2.5 Total
Bio- CO2 NBio- CO2
Unmitigated Construction Off-Site
ROG NOx CO Total CO2 CH4 N2O CO2e
Category tons/yr MT/yr
PM10 Total
Fugitive PM2.5
Exhaust PM2.5
Hauling 0.0000 0.0000 0.0000 0.0000 0.0000 0.0000 0.0000 0.0000 0.0000 0.0000 0.0000 0.0000 0.0000 0.0000 0.0000 0.0000
Vendor 0.0136 0.0925 0.1806 2.4000e-004
6.6500e-003
1.2800e-003
7.9300e-003
1.9100e-003
1.1800e-003
3.0800e-003
0.0000 21.2841 21.2841 1.6000e-004
0.0000 21.2875
Worker 0.0143 0.0197 0.1973 5.2000e-004
0.0399 3.5000e-004
0.0403 0.0106 3.3000e-004
0.0109 0.0000 38.2573 38.2573 1.9500e-003
0.0000 38.2982
Total 0.0279 0.1122 0.3779 7.6000e-004
2.1100e-003
0.0000 59.58580.0466 1.6300e-003
0.0482 0.0125 1.5100e-003
0.0140
SO2 Fugitive PM10
Exhaust PM10
0.0000 59.5414 59.5414
PM2.5 Total
Bio- CO2 NBio- CO2
Mitigated Construction On-Site
ROG NOx CO Total CO2 CH4 N2O CO2e
Category tons/yr MT/yr
PM10 Total
Fugitive PM2.5
Exhaust PM2.5
Off-Road 0.0621 0.5281 0.3626 5.4000e-004
0.0356 0.0356 0.0335 0.0335 0.0000 47.8958 47.8958 0.0118 0.0000 48.1433
Total 0.0621 0.5281 0.3626 5.4000e-004
0.0118 0.0000 48.14330.0356 0.0356 0.0335 0.0335
SO2 Fugitive PM10
Exhaust PM10
0.0000 47.8958 47.8958
PM2.5 Total
Bio- CO2 NBio- CO2
Mitigated Construction Off-Site
ROG NOx CO Total CO2 CH4 N2O CO2ePM10 Total
Fugitive PM2.5
Exhaust PM2.5

Page 13 of 19
Category tons/yr MT/yr
Hauling 0.0000 0.0000 0.0000 0.0000 0.0000 0.0000 0.0000 0.0000 0.0000 0.0000 0.0000 0.0000 0.0000 0.0000 0.0000 0.0000
Vendor 0.0136 0.0925 0.1806 2.4000e-004
6.6500e-003
1.2800e-003
7.9300e-003
1.9100e-003
1.1800e-003
3.0800e-003
0.0000 21.2841 21.2841 1.6000e-004
0.0000 21.2875
Worker 0.0143 0.0197 0.1973 5.2000e-004
0.0399 3.5000e-004
0.0403 0.0106 3.3000e-004
0.0109 0.0000 38.2573 38.2573 1.9500e-003
0.0000 38.2982
Total 0.0279 0.1122 0.3779 7.6000e-004
2.1100e-003
0.0000 59.58580.0466 1.6300e-003
0.0482 0.0125 1.5100e-003
0.0140
SO2 Fugitive PM10
Exhaust PM10
0.0000 59.5414 59.5414
PM2.5 Total
Bio- CO2 NBio- CO2
3.5 Building Construction - 2018Unmitigated Construction On-Site
ROG NOx CO Total CO2 CH4 N2O CO2e
Category tons/yr MT/yr
PM10 Total
Fugitive PM2.5
Exhaust PM2.5
Off-Road 0.3483 3.0355 2.2880 3.5000e-003
0.1950 0.1950 0.1833 0.1833 0.0000 308.9844 308.9844 0.0756 0.0000 310.5723
Total 0.3483 3.0355 2.2880 3.5000e-003
0.0756 0.0000 310.57230.1950 0.1950 0.1833 0.1833
SO2 Fugitive PM10
Exhaust PM10
0.0000 308.9844 308.9844
PM2.5 Total
Bio- CO2 NBio- CO2
Unmitigated Construction Off-Site
ROG NOx CO Total CO2 CH4 N2O CO2e
Category tons/yr MT/yr
PM10 Total
Fugitive PM2.5
Exhaust PM2.5
Hauling 0.0000 0.0000 0.0000 0.0000 0.0000 0.0000 0.0000 0.0000 0.0000 0.0000 0.0000 0.0000 0.0000 0.0000 0.0000 0.0000
Vendor 0.0693 0.5464 1.0304 1.5500e-003
0.0434 7.6700e-003
0.0510 0.0124 7.0500e-003
0.0195 0.0000 135.9148 135.9148 1.0400e-003
0.0000 135.9366
Worker 0.0853 0.1171 1.1725 3.4000e-003
0.2604 2.2700e-003
0.2627 0.0693 2.1000e-003
0.0714 0.0000 240.3880 240.3880 0.0119 0.0000 240.6368

Page 14 of 19
Total 0.1546 0.6635 2.2029 4.9500e-003
0.0129 0.0000 376.57340.3038 9.9400e-003
0.3137 0.0817 9.1500e-003
0.0908
SO2 Fugitive PM10
Exhaust PM10
0.0000 376.3028 376.3028
PM2.5 Total
Bio- CO2 NBio- CO2
Mitigated Construction On-Site
ROG NOx CO Total CO2 CH4 N2O CO2e
Category tons/yr MT/yr
PM10 Total
Fugitive PM2.5
Exhaust PM2.5
Off-Road 0.3483 3.0355 2.2880 3.5000e-003
0.1950 0.1950 0.1833 0.1833 0.0000 308.9841 308.9841 0.0756 0.0000 310.5720
Total 0.3483 3.0355 2.2880 3.5000e-003
0.0756 0.0000 310.57200.1950 0.1950 0.1833 0.1833
SO2 Fugitive PM10
Exhaust PM10
0.0000 308.9841 308.9841
PM2.5 Total
Bio- CO2 NBio- CO2
Mitigated Construction Off-Site
ROG NOx CO Total CO2 CH4 N2O CO2e
Category tons/yr MT/yr
PM10 Total
Fugitive PM2.5
Exhaust PM2.5
Hauling 0.0000 0.0000 0.0000 0.0000 0.0000 0.0000 0.0000 0.0000 0.0000 0.0000 0.0000 0.0000 0.0000 0.0000 0.0000 0.0000
Vendor 0.0693 0.5464 1.0304 1.5500e-003
0.0434 7.6700e-003
0.0510 0.0124 7.0500e-003
0.0195 0.0000 135.9148 135.9148 1.0400e-003
0.0000 135.9366
Worker 0.0853 0.1171 1.1725 3.4000e-003
0.2604 2.2700e-003
0.2627 0.0693 2.1000e-003
0.0714 0.0000 240.3880 240.3880 0.0119 0.0000 240.6368
Total 0.1546 0.6635 2.2029 4.9500e-003
0.0129 0.0000 376.57340.3038 9.9400e-003
0.3137 0.0817 9.1500e-003
0.0908 0.0000 376.3028 376.3028
3.5 Building Construction - 2019Unmitigated Construction On-Site

Page 15 of 19
SO2 Fugitive PM10
Exhaust PM10
PM2.5 Total
Bio- CO2 NBio- CO2ROG NOx CO Total CO2 CH4 N2O CO2e
Category tons/yr MT/yr
PM10 Total
Fugitive PM2.5
Exhaust PM2.5
Off-Road 0.2563 2.2852 1.8661 2.9200e-003
0.1401 0.1401 0.1317 0.1317 0.0000 255.1938 255.1938 0.0621 0.0000 256.4977
Total 0.2563 2.2852 1.8661 2.9200e-003
0.0621 0.0000 256.49770.1401 0.1401 0.1317 0.1317
SO2 Fugitive PM10
Exhaust PM10
0.0000 255.1938 255.1938
PM2.5 Total
Bio- CO2 NBio- CO2
Unmitigated Construction Off-Site
ROG NOx CO Total CO2 CH4 N2O CO2e
Category tons/yr MT/yr
PM10 Total
Fugitive PM2.5
Exhaust PM2.5
Hauling 0.0000 0.0000 0.0000 0.0000 0.0000 0.0000 0.0000 0.0000 0.0000 0.0000 0.0000 0.0000 0.0000 0.0000 0.0000 0.0000
Vendor 0.0556 0.4195 0.8382 1.3000e-003
0.0362 5.9700e-003
0.0422 0.0104 5.4900e-003
0.0159 0.0000 111.9921 111.9921 8.5000e-004
0.0000 112.0099
Worker 0.0655 0.0897 0.8975 2.8400e-003
0.2175 1.8700e-003
0.2194 0.0579 1.7300e-003
0.0596 0.0000 193.5338 193.5338 9.2800e-003
0.0000 193.7287
Total 0.1211 0.5092 1.7356 4.1400e-003
0.0101 0.0000 305.73860.2538 7.8400e-003
0.2616 0.0682 7.2200e-003
0.0755
SO2 Fugitive PM10
Exhaust PM10
0.0000 305.5259 305.5259
PM2.5 Total
Bio- CO2 NBio- CO2
Mitigated Construction On-Site
ROG NOx CO Total CO2 CH4 N2O CO2e
Category tons/yr MT/yr
PM10 Total
Fugitive PM2.5
Exhaust PM2.5
Off-Road 0.2563 2.2852 1.8661 2.9200e-003
0.1401 0.1401 0.1317 0.1317 0.0000 255.1935 255.1935 0.0621 0.0000 256.4974
Total 0.2563 2.2852 1.8661 2.9200e-003
0.0621 0.0000 256.49740.1401 0.1401 0.1317 0.1317 0.0000 255.1935 255.1935

Page 16 of 19
SO2 Fugitive PM10
Exhaust PM10
PM2.5 Total
Bio- CO2 NBio- CO2
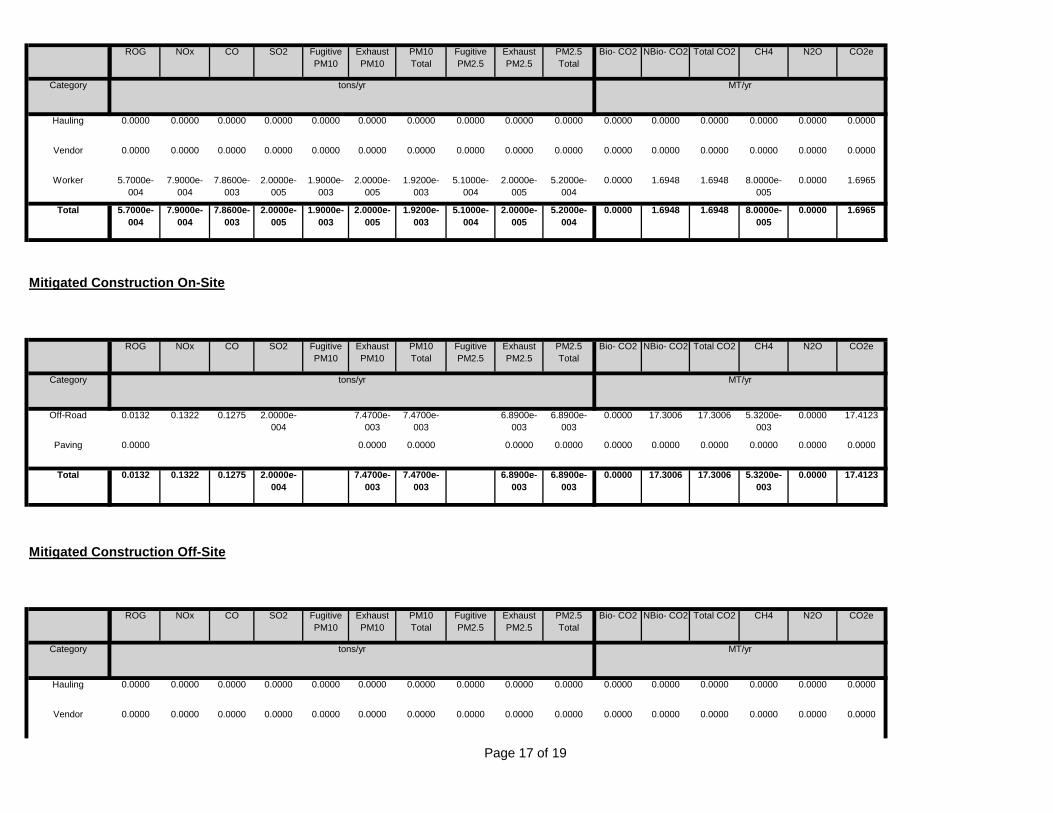
Mitigated Construction Off-Site
ROG NOx CO Total CO2 CH4 N2O CO2e
Category tons/yr MT/yr
PM10 Total
Fugitive PM2.5
Exhaust PM2.5
Hauling 0.0000 0.0000 0.0000 0.0000 0.0000 0.0000 0.0000 0.0000 0.0000 0.0000 0.0000 0.0000 0.0000 0.0000 0.0000 0.0000
Vendor 0.0556 0.4195 0.8382 1.3000e-003
0.0362 5.9700e-003
0.0422 0.0104 5.4900e-003
0.0159 0.0000 111.9921 111.9921 8.5000e-004
0.0000 112.0099
Worker 0.0655 0.0897 0.8975 2.8400e-003
0.2175 1.8700e-003
0.2194 0.0579 1.7300e-003
0.0596 0.0000 193.5338 193.5338 9.2800e-003
0.0000 193.7287
Total 0.1211 0.5092 1.7356 4.1400e-003
0.0101 0.0000 305.73860.2538 7.8400e-003
0.2616 0.0682 7.2200e-003
0.0755
SO2 Fugitive PM10
Exhaust PM10
0.0000 305.5259 305.5259
PM2.5 Total
Bio- CO2 NBio- CO2
3.6 Paving - 2019Unmitigated Construction On-Site
ROG NOx CO Total CO2 CH4 N2O CO2e
Category tons/yr MT/yr
PM10 Total
Fugitive PM2.5
Exhaust PM2.5
Off-Road 0.0132 0.1322 0.1275 2.0000e-004
7.4700e-003
7.4700e-003
6.8900e-003
6.8900e-003
0.0000 17.3006 17.3006 5.3200e-003
0.0000 17.4123
Paving 0.0000 0.0000 0.0000 0.0000 0.0000 0.0000 0.0000 0.0000 0.0000 0.0000 0.0000
Total 0.0132 0.1322 0.1275 2.0000e-004
5.3200e-003
0.0000 17.41237.4700e-003
7.4700e-003
6.8900e-003
6.8900e-003
0.0000 17.3006 17.3006
Unmitigated Construction Off-Site
Page 17 of 19
SO2 Fugitive PM10
Exhaust PM10
PM2.5 Total
Bio- CO2 NBio- CO2ROG NOx CO Total CO2 CH4 N2O CO2e
Category tons/yr MT/yr
PM10 Total
Fugitive PM2.5
Exhaust PM2.5
Hauling 0.0000 0.0000 0.0000 0.0000 0.0000 0.0000 0.0000 0.0000 0.0000 0.0000 0.0000 0.0000 0.0000 0.0000 0.0000 0.0000
Vendor 0.0000 0.0000 0.0000 0.0000 0.0000 0.0000 0.0000 0.0000 0.0000 0.0000 0.0000 0.0000 0.0000 0.0000 0.0000 0.0000
Worker 5.7000e-004
7.9000e-004
7.8600e-003
2.0000e-005
1.9000e-003
2.0000e-005
1.9200e-003
5.1000e-004
2.0000e-005
5.2000e-004
0.0000 1.6948 1.6948 8.0000e-005
0.0000 1.6965
Total 5.7000e-004
7.9000e-004
7.8600e-003
2.0000e-005
8.0000e-005
0.0000 1.69651.9000e-003
2.0000e-005
1.9200e-003
5.1000e-004
2.0000e-005
5.2000e-004
SO2 Fugitive PM10
Exhaust PM10
0.0000 1.6948 1.6948
PM2.5 Total
Bio- CO2 NBio- CO2
Mitigated Construction On-Site
ROG NOx CO Total CO2 CH4 N2O CO2e
Category tons/yr MT/yr
PM10 Total
Fugitive PM2.5
Exhaust PM2.5
Off-Road 0.0132 0.1322 0.1275 2.0000e-004
7.4700e-003
7.4700e-003
6.8900e-003
6.8900e-003
0.0000 17.3006 17.3006 5.3200e-003
0.0000 17.4123
Paving 0.0000 0.0000 0.0000 0.0000 0.0000 0.0000 0.0000 0.0000 0.0000 0.0000 0.0000
Total 0.0132 0.1322 0.1275 2.0000e-004
5.3200e-003
0.0000 17.41237.4700e-003
7.4700e-003
6.8900e-003
6.8900e-003
SO2 Fugitive PM10
Exhaust PM10
0.0000 17.3006 17.3006
PM2.5 Total
Bio- CO2 NBio- CO2
Mitigated Construction Off-Site
ROG NOx CO Total CO2 CH4 N2O CO2e
Category tons/yr MT/yr
PM10 Total
Fugitive PM2.5
Exhaust PM2.5
Hauling 0.0000 0.0000 0.0000 0.0000 0.0000 0.0000 0.0000 0.0000 0.0000 0.0000 0.0000 0.0000 0.0000 0.0000 0.0000 0.0000
Vendor 0.0000 0.0000 0.0000 0.0000 0.0000 0.0000 0.0000 0.0000 0.0000 0.0000 0.0000 0.0000 0.0000 0.0000 0.0000 0.0000
Page 18 of 19
Worker 5.7000e-004
7.9000e-004
7.8600e-003
2.0000e-005
1.9000e-003
2.0000e-005
1.9200e-003
5.1000e-004
2.0000e-005
5.2000e-004
0.0000 1.6948 1.6948 8.0000e-005
0.0000 1.6965
Total 5.7000e-004
7.9000e-004
7.8600e-003
2.0000e-005
8.0000e-005
0.0000 1.69651.9000e-003
2.0000e-005
1.9200e-003
5.1000e-004
2.0000e-005
5.2000e-004
SO2 Fugitive PM10
Exhaust PM10
0.0000 1.6948 1.6948
PM2.5 Total
Bio- CO2 NBio- CO2
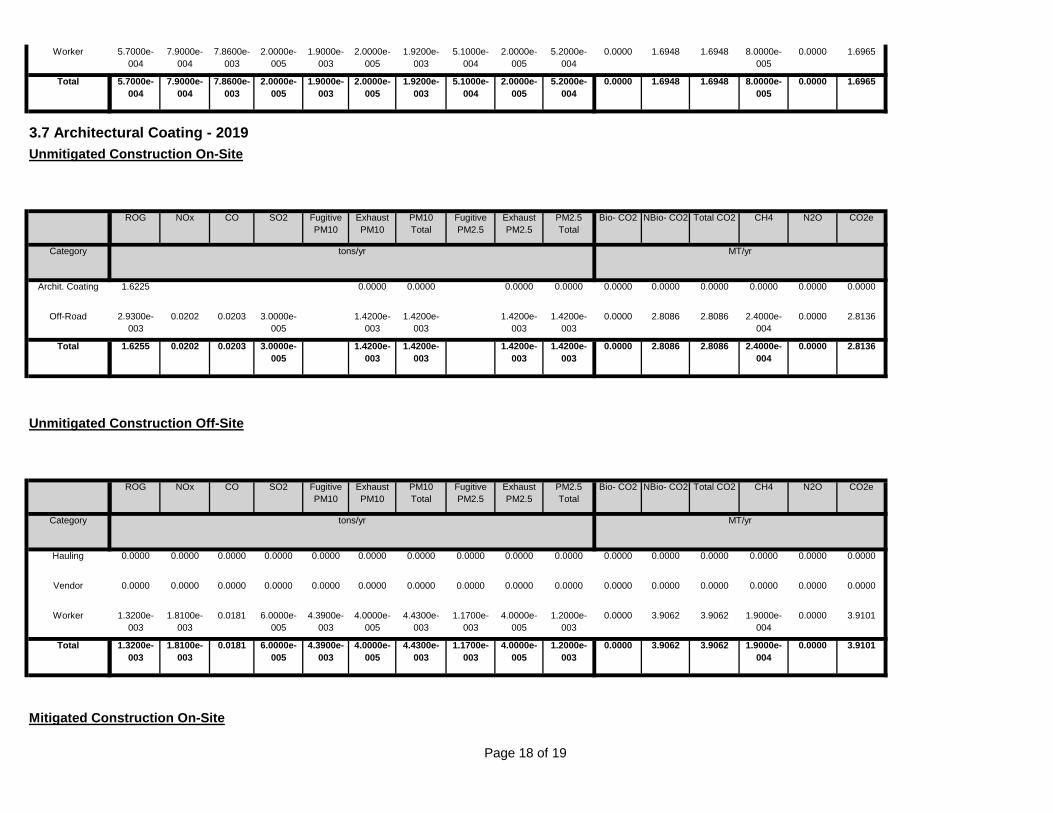
3.7 Architectural Coating - 2019Unmitigated Construction On-Site
ROG NOx CO Total CO2 CH4 N2O CO2e
Category tons/yr MT/yr
PM10 Total
Fugitive PM2.5
Exhaust PM2.5
Archit. Coating 1.6225 0.0000 0.0000 0.0000 0.0000 0.0000 0.0000 0.0000 0.0000 0.0000 0.0000
Off-Road 2.9300e-003
0.0202 0.0203 3.0000e-005
1.4200e-003
1.4200e-003
1.4200e-003
1.4200e-003
0.0000 2.8086 2.8086 2.4000e-004
0.0000 2.8136
Total 1.6255 0.0202 0.0203 3.0000e-005
2.4000e-004
0.0000 2.81361.4200e-003
1.4200e-003
1.4200e-003
1.4200e-003
SO2 Fugitive PM10
Exhaust PM10
0.0000 2.8086 2.8086
PM2.5 Total
Bio- CO2 NBio- CO2
Unmitigated Construction Off-Site
ROG NOx CO Total CO2 CH4 N2O CO2e
Category tons/yr MT/yr
PM10 Total
Fugitive PM2.5
Exhaust PM2.5
Hauling 0.0000 0.0000 0.0000 0.0000 0.0000 0.0000 0.0000 0.0000 0.0000 0.0000 0.0000 0.0000 0.0000 0.0000 0.0000 0.0000
Vendor 0.0000 0.0000 0.0000 0.0000 0.0000 0.0000 0.0000 0.0000 0.0000 0.0000 0.0000 0.0000 0.0000 0.0000 0.0000 0.0000
Worker 1.3200e-003
1.8100e-003
0.0181 6.0000e-005
4.3900e-003
4.0000e-005
4.4300e-003
1.1700e-003
4.0000e-005
1.2000e-003
0.0000 3.9062 3.9062 1.9000e-004
0.0000 3.9101
Total 1.3200e-003
1.8100e-003
0.0181 6.0000e-005
1.9000e-004
0.0000 3.91014.3900e-003
4.0000e-005
4.4300e-003
1.1700e-003
4.0000e-005
1.2000e-003
0.0000 3.9062 3.9062
Mitigated Construction On-Site

Page 19 of 19
SO2 Fugitive PM10
Exhaust PM10
PM2.5 Total
Bio- CO2 NBio- CO2ROG NOx CO Total CO2 CH4 N2O CO2e
Category tons/yr MT/yr
PM10 Total
Fugitive PM2.5
Exhaust PM2.5
Archit. Coating 1.6225 0.0000 0.0000 0.0000 0.0000 0.0000 0.0000 0.0000 0.0000 0.0000 0.0000
Off-Road 2.9300e-003
0.0202 0.0203 3.0000e-005
1.4200e-003
1.4200e-003
1.4200e-003
1.4200e-003
0.0000 2.8086 2.8086 2.4000e-004
0.0000 2.8136
Total 1.6255 0.0202 0.0203 3.0000e-005
2.4000e-004
0.0000 2.81361.4200e-003
1.4200e-003
1.4200e-003
1.4200e-003
SO2 Fugitive PM10
Exhaust PM10
0.0000 2.8086 2.8086
PM2.5 Total
Bio- CO2 NBio- CO2
Mitigated Construction Off-Site
ROG NOx CO Total CO2 CH4 N2O CO2e
Category tons/yr MT/yr
PM10 Total
Fugitive PM2.5
Exhaust PM2.5
Hauling 0.0000 0.0000 0.0000 0.0000 0.0000 0.0000 0.0000 0.0000 0.0000 0.0000 0.0000 0.0000 0.0000 0.0000 0.0000 0.0000
Vendor 0.0000 0.0000 0.0000 0.0000 0.0000 0.0000 0.0000 0.0000 0.0000 0.0000 0.0000 0.0000 0.0000 0.0000 0.0000 0.0000
Worker 1.3200e-003
1.8100e-003
0.0181 6.0000e-005
4.3900e-003
4.0000e-005
4.4300e-003
1.1700e-003
4.0000e-005
1.2000e-003
0.0000 3.9062 3.9062 1.9000e-004
0.0000 3.9101
Total 1.3200e-003
1.8100e-003
0.0181 6.0000e-005
1.9000e-004
0.0000 3.91014.3900e-003
4.0000e-005
4.4300e-003
1.1700e-003
4.0000e-005
1.2000e-003
0.0000 3.9062 3.9062

Page 1 of 5
CalEEMod Version: CalEEMod.2013.2.2
Date: 8/23/2016 12:42 PM
SFSU - Creative Arts & Holloway - ConstructionSan Francisco County, Mitigation Report
Construction Mitigation Summary
Phase ROG NOx CO SO2Exhaust PM10
Exhaust PM2.5 Bio- CO2 NBio- CO2 Total CO2 CH4 N2O CO2e
Percent Reduction
Architectural Coating 0.00 0.00 0.00 0.00 0.00 0.00 0.00 0.00 0.00 0.00 0.00 0.00
Building Construction 0.00 0.00 0.00 0.00 0.00 0.00 0.00 0.00 0.00 0.00 0.00 0.00
Demolition 0.00 0.00 0.00 0.00 0.00 0.00 0.00 0.00 0.00 0.00 0.00 0.00
Grading/Trenching 0.00 0.00 0.00 0.00 0.00 0.00 0.00 0.00 0.00 0.00 0.00 0.00
Paving 0.00 0.00 0.00 0.00 0.00 0.00 0.00 0.00 0.00 0.00 0.00 0.00
Site Preparation 0.00 0.00 0.00 0.00
Number Mitigated Total Number of Equipment DPF Oxidation Catalyst
0.00 0.00 0.00 0.00 0.00 0.00
No Change 0 1 No Change
0.00 0.00
OFFROAD Equipment Mitigation
Equipment Type Fuel Type Tier
0.00
Concrete/Industrial Saws Diesel No Change 0 1 No Change 0.00
Air Compressors Diesel
No Change 0.00
Cranes Diesel No Change 0 1 No Change
No Change 0 3 No Change
0.00
Excavators Diesel No Change 0 4
0.00
Generator Sets Diesel No Change 0 1 No Change 0.00
Forklifts Diesel
No Change 0.00
Graders Diesel No Change 0 1 No Change 0.00
Pavers Diesel No Change 0 1

Page 2 of 5
No Change 0 2 No Change 0.00
Rollers Diesel No Change 0 2 No Change 0.00
Paving Equipment Diesel
No Change 0.00
Rubber Tired Dozers Diesel No Change 0 6 No Change
No Change 0 11 No Change
0.00
Cement and Mortar Mixers Diesel No Change 0 2
0.00
Welders Diesel No Change 0 1 No Change 0.00
Tractors/Loaders/Backhoes Diesel
Trenchers Diesel No Change 0 1 No Change 0.00
Equipment Type ROG NOx CO SO2 Exhaust PM10 Exhaust PM2.5 Bio- CO2 NBio- CO2 Total CO2 CH4 N2O CO2eUnmitigated tons/yr Unmitigated mt/yr
Air Compressors 2.93000E-003 2.01900E-002 2.02500E-002 3.00000E-005 1.42000E-003 1.42000E-003 0.00000E+000 2.80858E+000 2.80858E+000 2.40000E-004 0.00000E+000 2.81356E+000
Cement and Mortar Mixers
9.30000E-004 5.80000E-003 4.86000E-003 1.00000E-005 2.30000E-004 2.30000E-004 0.00000E+000 7.21790E-001 7.21790E-001 7.00000E-005 0.00000E+000 7.23360E-001
Concrete/Industrial Saws
8.71000E-003 6.39200E-002 5.62400E-002 9.00000E-005 4.60000E-003 4.60000E-003 0.00000E+000 8.06484E+000 8.06484E+000 7.10000E-004 0.00000E+000 8.07975E+000
Cranes 1.22130E-001 1.45713E+000 5.43930E-001 1.28000E-003 6.27400E-002 5.77200E-002 0.00000E+000 1.16359E+002 1.16359E+002 3.64200E-002 0.00000E+000 1.17124E+002
Excavators 2.17300E-002 2.41010E-001 2.05260E-001 3.20000E-004 1.18600E-002 1.09100E-002 0.00000E+000 2.94615E+001 2.94615E+001 9.03000E-003 0.00000E+000 2.96510E+001
Forklifts 1.34700E-001 1.19306E+000 9.39640E-001 1.19000E-003 9.44200E-002 8.68600E-002 0.00000E+000 1.08014E+002 1.08014E+002 3.38100E-002 0.00000E+000 1.08724E+002
Generator Sets 1.25750E-001 1.03787E+000 9.70300E-001 1.71000E-003 6.48200E-002 6.48200E-002 0.00000E+000 1.46671E+002 1.46671E+002 1.01400E-002 0.00000E+000 1.46884E+002
Graders 1.42900E-002 1.44620E-001 7.25700E-002 9.00000E-005 8.12000E-003 7.47000E-003 0.00000E+000 8.67633E+000 8.67633E+000 2.66000E-003 0.00000E+000 8.73216E+000
Pavers 2.90000E-003 3.15500E-002 2.93000E-002 5.00000E-005 1.54000E-003 1.42000E-003 0.00000E+000 4.26353E+000 4.26353E+000 1.35000E-003 0.00000E+000 4.29186E+000
Paving Equipment 3.30000E-003 3.50000E-002 3.91400E-002 6.00000E-005 1.74000E-003 1.60000E-003 0.00000E+000 5.67538E+000 5.67538E+000 1.80000E-003 0.00000E+000 5.71309E+000
Rollers 3.57000E-003 3.52900E-002 3.00400E-002 4.00000E-005 2.32000E-003 2.13000E-003 0.00000E+000 3.71040E+000 3.71040E+000 1.17000E-003 0.00000E+000 3.73506E+000
Rubber Tired Dozers
7.14200E-002 7.91560E-001 5.96430E-001 5.30000E-004 3.67700E-002 3.38300E-002 0.00000E+000 4.95328E+001 4.95328E+001 1.51800E-002 0.00000E+000 4.98515E+001
Tractors/Loaders/Backhoes
1.97440E-001 1.95182E+000 1.76478E+000 2.35000E-003 1.37000E-001 1.26040E-001 0.00000E+000 2.13883E+002 2.13883E+002 6.68400E-002 0.00000E+000 2.15287E+002
Trenchers 8.06000E-003 7.06800E-002 4.19900E-002 5.00000E-005 5.54000E-003 5.09000E-003 0.00000E+000 4.81912E+000 4.81912E+000 1.48000E-003 0.00000E+000 4.85013E+000
Welders 1.09650E-001 4.31350E-001 4.77840E-001 6.60000E-004 2.82400E-002 2.82400E-002 0.00000E+000 4.88433E+001 4.88433E+001 8.96000E-003 0.00000E+000 4.90313E+001
Equipment Type ROG NOx CO SO2 Exhaust PM10 Exhaust PM2.5 Bio- CO2 NBio- CO2 Total CO2 CH4 N2O CO2e

Page 3 of 5
Mitigated tons/yr Mitigated mt/yr
Air Compressors 2.93000E-003 2.01900E-002 2.02500E-002 3.00000E-005 1.42000E-003 1.42000E-003 0.00000E+000 2.80858E+000 2.80858E+000 2.40000E-004 0.00000E+000 2.81356E+000
Cement and Mortar Mixers
9.30000E-004 5.80000E-003 4.86000E-003 1.00000E-005 2.30000E-004 2.30000E-004 0.00000E+000 7.21780E-001 7.21780E-001 7.00000E-005 0.00000E+000 7.23360E-001
Concrete/Industrial Saws
8.71000E-003 6.39200E-002 5.62400E-002 9.00000E-005 4.60000E-003 4.60000E-003 0.00000E+000 8.06484E+000 8.06484E+000 7.10000E-004 0.00000E+000 8.07974E+000
Cranes 1.22130E-001 1.45713E+000 5.43930E-001 1.28000E-003 6.27400E-002 5.77200E-002 0.00000E+000 1.16359E+002 1.16359E+002 3.64200E-002 0.00000E+000 1.17124E+002
Excavators 2.17300E-002 2.41010E-001 2.05260E-001 3.20000E-004 1.18600E-002 1.09100E-002 0.00000E+000 2.94614E+001 2.94614E+001 9.03000E-003 0.00000E+000 2.96510E+001
Forklifts 1.34700E-001 1.19306E+000 9.39640E-001 1.19000E-003 9.44200E-002 8.68600E-002 0.00000E+000 1.08014E+002 1.08014E+002 3.38100E-002 0.00000E+000 1.08724E+002
Generator Sets 1.25750E-001 1.03787E+000 9.70300E-001 1.71000E-003 6.48200E-002 6.48200E-002 0.00000E+000 1.46671E+002 1.46671E+002 1.01400E-002 0.00000E+000 1.46884E+002
Graders 1.42900E-002 1.44620E-001 7.25700E-002 9.00000E-005 8.12000E-003 7.47000E-003 0.00000E+000 8.67632E+000 8.67632E+000 2.66000E-003 0.00000E+000 8.73215E+000
Pavers 2.90000E-003 3.15500E-002 2.93000E-002 5.00000E-005 1.54000E-003 1.42000E-003 0.00000E+000 4.26353E+000 4.26353E+000 1.35000E-003 0.00000E+000 4.29186E+000
Paving Equipment 3.30000E-003 3.50000E-002 3.91400E-002 6.00000E-005 1.74000E-003 1.60000E-003 0.00000E+000 5.67537E+000 5.67537E+000 1.80000E-003 0.00000E+000 5.71308E+000
Rollers 3.57000E-003 3.52900E-002 3.00400E-002 4.00000E-005 2.32000E-003 2.13000E-003 0.00000E+000 3.71040E+000 3.71040E+000 1.17000E-003 0.00000E+000 3.73505E+000
Rubber Tired Dozers 7.14200E-002 7.91560E-001 5.96430E-001 5.30000E-004 3.67700E-002 3.38300E-002 0.00000E+000 4.95327E+001 4.95327E+001 1.51800E-002 0.00000E+000 4.98514E+001
Tractors/Loaders/Backhoes
1.97440E-001 1.95182E+000 1.76478E+000 2.35000E-003 1.37000E-001 1.26040E-001 0.00000E+000 2.13883E+002 2.13883E+002 6.68400E-002 0.00000E+000 2.15287E+002
Trenchers 8.06000E-003 7.06800E-002 4.19900E-002 5.00000E-005 5.54000E-003 5.09000E-003 0.00000E+000 4.81911E+000 4.81911E+000 1.48000E-003 0.00000E+000 4.85012E+000
Welders 1.09650E-001 4.31350E-001 4.77840E-001 6.60000E-004 2.82400E-002 2.82400E-002 0.00000E+000 4.88432E+001 4.88432E+001 8.96000E-003 0.00000E+000 4.90313E+001
Equipment Type ROG NOx CO SO2 Exhaust PM10 Exhaust PM2.5 Bio- CO2 NBio- CO2 Total CO2 CH4 N2O CO2ePercent Reduction
Air Compressors 0.00000E+000 0.00000E+000 0.00000E+000 0.00000E+000 0.00000E+000 0.00000E+000 0.00000E+000 0.00000E+000 0.00000E+000 0.00000E+000 0.00000E+000 0.00000E+000
Cement and Mortar Mixers
0.00000E+000 0.00000E+000 0.00000E+000 0.00000E+000 0.00000E+000 0.00000E+000 0.00000E+000 1.38544E-005 1.38544E-005 0.00000E+000 0.00000E+000 0.00000E+000
Concrete/Industrial Saws
0.00000E+000 0.00000E+000 0.00000E+000 0.00000E+000 0.00000E+000 0.00000E+000 0.00000E+000 0.00000E+000 0.00000E+000 0.00000E+000 0.00000E+000 1.23766E-006
Cranes 0.00000E+000 0.00000E+000 0.00000E+000 0.00000E+000 0.00000E+000 0.00000E+000 0.00000E+000 1.20317E-006 1.20317E-006 0.00000E+000 0.00000E+000 1.19532E-006
Excavators 0.00000E+000 0.00000E+000 0.00000E+000 0.00000E+000 0.00000E+000 0.00000E+000 0.00000E+000 1.35771E-006 1.35771E-006 0.00000E+000 0.00000E+000 1.01177E-006
Forklifts 0.00000E+000 0.00000E+000 0.00000E+000 0.00000E+000 0.00000E+000 0.00000E+000 0.00000E+000 1.20355E-006 1.20355E-006 0.00000E+000 0.00000E+000 1.19569E-006
Generator Sets 0.00000E+000 0.00000E+000 0.00000E+000 0.00000E+000 0.00000E+000 0.00000E+000 0.00000E+000 1.15905E-006 1.15905E-006 0.00000E+000 0.00000E+000 1.15737E-006
Graders 0.00000E+000 0.00000E+000 0.00000E+000 0.00000E+000 0.00000E+000 0.00000E+000 0.00000E+000 1.15256E-006 1.15256E-006 0.00000E+000 0.00000E+000 1.14519E-006
Pavers 0.00000E+000 0.00000E+000 0.00000E+000 0.00000E+000 0.00000E+000 0.00000E+000 0.00000E+000 0.00000E+000 0.00000E+000 0.00000E+000 0.00000E+000 0.00000E+000
Page 4 of 5
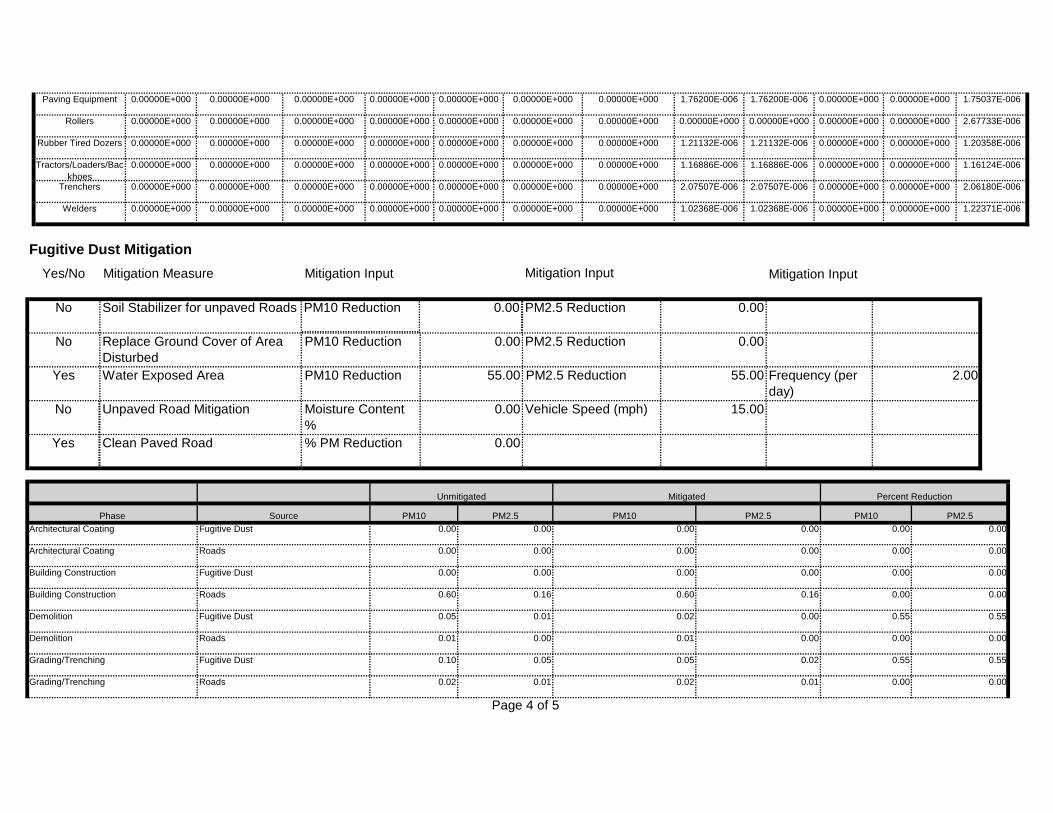
Paving Equipment 0.00000E+000 0.00000E+000 0.00000E+000 0.00000E+000 0.00000E+000 0.00000E+000 0.00000E+000 1.76200E-006 1.76200E-006 0.00000E+000 0.00000E+000 1.75037E-006
Rollers 0.00000E+000 0.00000E+000 0.00000E+000 0.00000E+000 0.00000E+000 0.00000E+000 0.00000E+000 0.00000E+000 0.00000E+000 0.00000E+000 0.00000E+000 2.67733E-006
Rubber Tired Dozers 0.00000E+000 0.00000E+000 0.00000E+000 0.00000E+000 0.00000E+000 0.00000E+000 0.00000E+000 1.21132E-006 1.21132E-006 0.00000E+000 0.00000E+000 1.20358E-006
Tractors/Loaders/Backhoes
0.00000E+000 0.00000E+000 0.00000E+000 0.00000E+000 0.00000E+000 0.00000E+000 0.00000E+000 1.16886E-006 1.16886E-006 0.00000E+000 0.00000E+000 1.16124E-006
Trenchers 0.00000E+000 0.00000E+000 0.00000E+000 0.00000E+000 0.00000E+000 0.00000E+000 0.00000E+000 0.00000E+000 2.06180E-006
Welders 0.00000E+000 0.00000E+000 0.00000E+000 0.00000E+000 0.00000E+000 1.02368E-006 1.02368E-006 0.00000E+000
2.07507E-006 2.07507E-006 0.00000E+000
0.00000E+000 1.22371E-006
Fugitive Dust MitigationMitigation InputYes/No Mitigation Measure Mitigation Input Mitigation Input
0.00000E+000 0.00000E+000
No Soil Stabilizer for unpaved Roads PM10 Reduction 0.00 PM2.5 Reduction 0.00
No Replace Ground Cover of Area Disturbed
PM10 Reduction 0.00 PM2.5 Reduction 0.00
15.00
Yes Water Exposed Area PM10 Reduction 55.00 PM2.5 Reduction 55.00
0.00
Frequency (per day)
2.00
No Unpaved Road Mitigation Moisture Content %
0.00 Vehicle Speed (mph)
Unmitigated Mitigated Percent Reduction
Yes Clean Paved Road % PM Reduction
Phase Source PM10 PM2.5 PM10 PM2.5 PM10 PM2.5Architectural Coating Fugitive Dust 0.00 0.00 0.00 0.00 0.00 0.00
Architectural Coating Roads 0.00 0.00 0.00 0.00 0.00 0.00
Building Construction Fugitive Dust 0.00 0.00 0.00 0.00 0.00 0.00
Building Construction Roads 0.60 0.16 0.60 0.16 0.00 0.00
Demolition Fugitive Dust 0.05 0.01 0.02 0.00 0.55 0.55
Demolition Roads 0.01 0.00 0.01 0.00 0.00 0.00
Grading/Trenching Fugitive Dust 0.10 0.05 0.05 0.02 0.55 0.55
Grading/Trenching Roads 0.02 0.01 0.02 0.01 0.00 0.00

Page 5 of 5
Paving Fugitive Dust 0.00 0.00 0.00 0.00 0.00 0.00
Paving Roads 0.00 0.00 0.00 0.00 0.00 0.00
Site Preparation Fugitive Dust 0.09 0.05 0.04 0.02 0.55 0.55
Site Preparation Roads 0.01 0.00 0.01 0.00 0.00 0.00

CalEEMod Outputs Existing Operations - Winter, Summer,
Annual, and Mitigation

Page 1 of 7
CalEEMod Version: CalEEMod.2013.2.2 Date: 8/24/2016 1:28 PM
SFSU - Creative Arts & Holloway - ExistingSan Francisco County, Winter
1.0 Project Characteristics
1.1 Land Usage
Land Uses Size Metric Lot Acreage Floor Surface Area Population
Apartments Mid Rise 69.00 Dwelling Unit 1.82 38,295.00 190
1.2 Other Project Characteristics
Urbanization Urban Wind Speed (m/s) 4.6 Precipitation Freq (Days) 64
Climate Zone 5 Operational Year 2016
Utility Company Pacific Gas & Electric Company
CO2 Intensity (lb/MWhr)
559.32 CH4 Intensity (lb/MWhr)
0.029 N2O Intensity (lb/MWhr)
0.006
1.3 User Entered Comments & Non-Default Data
Project Characteristics - PG&E CO2 Intensity Factor adjusted per 25% RPS by 2016
Land Use - Dwelling units based on assumption of 2.75 people/beds per unit. SF reduced based on average of 555 SF per unit for Project
Vehicle Trips - Trip rates were adjusted to match the change in vehicle trips for the housing land use for project vs existing (i.e., 145 daily vehicle trips)
Woodstoves - No fireplaces assumed
Energy Use - Using "Historic" energy for Existing uses (based on 2005 factors in model)
Waste Mitigation - 50% waste diversion by 2016 consistent with AB 939 (not mitigation)
Table Name Column Name Default Value New Value
tblFireplaces NumberGas 37.95 0.00
tblFireplaces NumberNoFireplace 21.39 69.00
tblFireplaces NumberWood 9.66 0.00
tblLandUse LandUseSquareFeet 69,000.00 38,295.00

Page 2 of 7
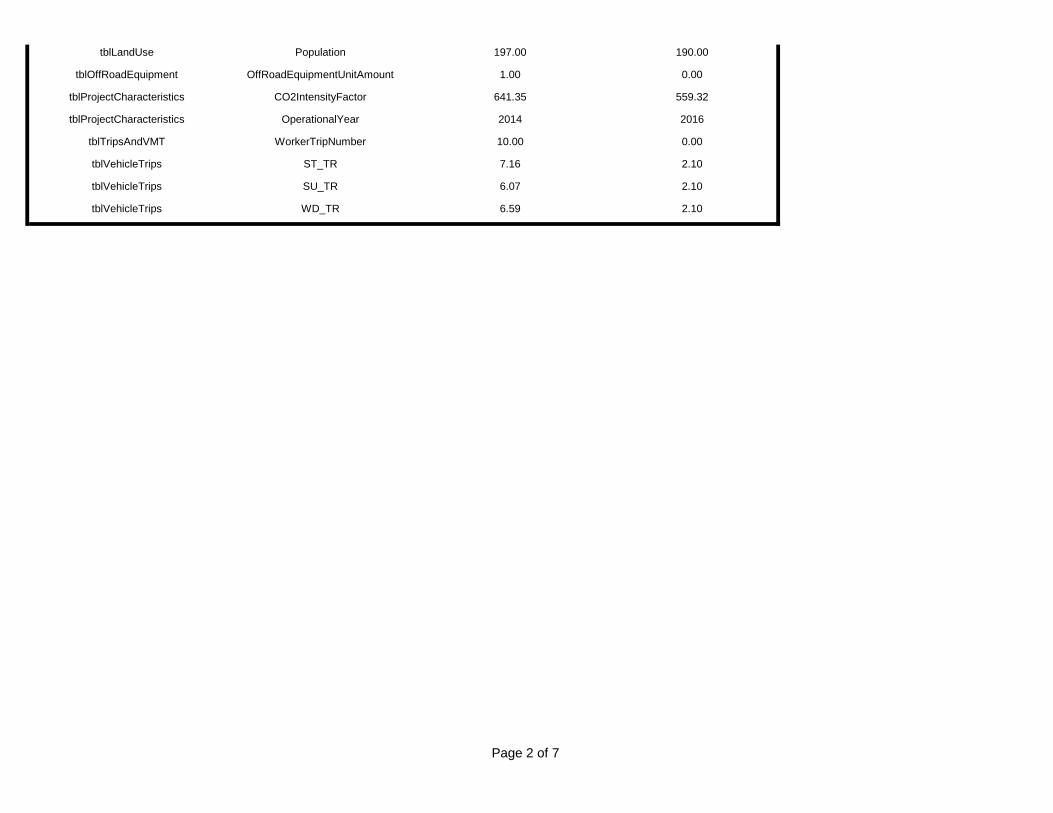
tblLandUse Population 197.00 190.00
tblOffRoadEquipment OffRoadEquipmentUnitAmount 1.00 0.00
tblProjectCharacteristics CO2IntensityFactor 641.35 559.32
tblProjectCharacteristics OperationalYear 2014 2016
tblTripsAndVMT WorkerTripNumber 10.00 0.00
tblVehicleTrips ST_TR 7.16 2.10
6.07 2.10
tblVehicleTrips WD_TR 6.59 2.10
tblVehicleTrips SU_TR

Page 3 of 7
2.0 Emissions Summary
SO2 Fugitive PM10
Exhaust PM10
PM2.5 Total
Bio- CO2 NBio- CO2
2.2 Overall OperationalUnmitigated Operational
ROG NOx CO Total CO2 CH4 N2O CO2e
Category lb/day lb/day
PM10 Total
Fugitive PM2.5
Exhaust PM2.5
Area 1.5660 0.1293 9.5585 0.0127 0.6489 0.6489 0.6489 0.6489 91.1737 10.2501 101.4238 0.4367 0.0000 110.5938
Energy 0.0192 0.1637 0.0697 1.0400e-003
0.0132 0.0132 0.0132 0.0132 208.9453 208.9453 4.0000e-003
3.8300e-003
210.2170
Mobile 0.5291 1.0663 4.9836 9.7100e-003
0.6975 0.0157 0.7132 0.1885 0.0145 0.2029 842.4037 842.4037 0.0367 843.1733
Total 2.1142 1.3593 14.6117 0.0234 0.4773 3.8300e-003
1,163.9840
0.6975 0.6778 1.3753 0.1885 0.6765 0.8650
SO2 Fugitive PM10
Exhaust PM10
91.1737 1,061.5992
1,152.7729
PM2.5 Total
Bio- CO2 NBio- CO2
Mitigated OperationalROG NOx CO Total CO2 CH4 N2O CO2e
Category lb/day lb/day
PM10 Total
Fugitive PM2.5
Exhaust PM2.5
Area 1.5660 0.1293 9.5585 0.0127 0.6489 0.6489 0.6489 0.6489 91.1737 10.2501 101.4238 0.4367 0.0000 110.5938
Energy 0.0192 0.1637 0.0697 1.0400e-003
0.0132 0.0132 0.0132 0.0132 208.9453 208.9453 4.0000e-003
3.8300e-003
210.2170
Mobile 0.5291 1.0663 4.9836 9.7100e-003
0.6975 0.0157 0.7132 0.1885 0.0145 0.2029 842.4037 842.4037 0.0367 843.1733
Total 2.1142 1.3593 14.6117 0.0234 0.6975 0.6778 1.3753 0.1885 0.6765 0.8650 91.1737 1,061.5992
1,152.7729 0.4773 3.8300e-003
1,163.9840
ROG NOx CO SO2 Fugitive PM10
Exhaust PM10
PM10 Total
Fugitive PM2.5
Exhaust PM2.5
PM2.5 Total
Bio- CO2 NBio-CO2 Total CO2 CH4 N20 CO2e
Percent Reduction
0.00 0.00 0.00 0.00 0.00 0.00 0.00 0.00 0.00 0.00 0.00 0.00 0.00 0.00 0.00 0.00
4.0 Operational Detail - Mobile
4.1 Mitigation Measures Mobile

Page 4 of 7
CO SO2 Fugitive PM10
Fugitive PM2.5
Exhaust PM2.5
PM2.5 Total
Bio- CO2ROG NOx NBio- CO2 Total CO2 CH4 N2O CO2e
Category lb/day lb/day
Exhaust PM10
PM10 Total
Mitigated 0.5291 1.0663 4.9836 9.7100e-003
0.6975 0.0157 0.7132 0.1885 0.0145 0.2029 842.4037 842.4037 0.0367 843.1733
Unmitigated 0.5291 1.0663 4.9836 9.7100e-003
0.6975 0.0157 0.7132 0.1885 0.0145 0.2029 842.4037 842.4037 0.0367 843.1733
4.2 Trip Summary Information
Average Daily Trip Rate Unmitigated MitigatedLand Use Weekday Saturday Sunday Annual VMT Annual VMT
Apartments Mid Rise 144.90 144.90 144.90 323,470 323,470Total 144.90 144.90 144.90 323,470 323,470
4.3 Trip Type Information
Miles Trip % Trip Purpose %
Land Use H-W or C-W H-S or C-C H-O or C-NW H-W or C-W
H-S or C-C H-O or C-NW Primary Diverted Pass-by
Apartments Mid Rise 12.40 4.30 5.40 26.10 29.10 44.80 86 11 3
LDA LDT1 LDT2 MDV LHD1 LHD2 MHD HHD OBUS UBUS MCY
0.010157 0.000551 0.000507
5.0 Energy Detail
SBUS MH
0.628026 0.058431 0.149152 0.079214 0.003113 0.0110240.026557 0.003351 0.026114 0.003803
4.4 Fleet MixHistorical Energy Use: Y
5.1 Mitigation Measures Energy

Page 5 of 7
NOx CO SO2 Fugitive PM10
Fugitive PM2.5
Exhaust PM2.5
PM2.5 Total
Bio- CO2ROG NBio- CO2 Total CO2 CH4 N2O CO2e
Category lb/day lb/day
Exhaust PM10
PM10 Total
NaturalGas Mitigated
0.0192 0.1637 0.0697 1.0400e-003
0.0132 0.0132 0.0132 0.0132 208.9453 208.9453 4.0000e-003
3.8300e-003
210.2170
NaturalGas Unmitigated
0.0192 0.1637 0.0697 1.0400e-003
208.9453 4.0000e-003
3.8300e-003
210.21700.0132 0.0132 0.0132 0.0132
CO SO2 Fugitive PM10
Exhaust PM10
208.9453
Exhaust PM2.5
PM2.5 Total
Bio- CO2 NBio- CO2
5.2 Energy by Land Use - NaturalGasUnmitigated
NaturalGas Use
ROG NOx Total CO2 CH4 N2O CO2e
Land Use kBTU/yr lb/day lb/day
PM10 Total
Fugitive PM2.5
Apartments Mid Rise
1776.04 0.0192 0.1637 0.0697 1.0400e-003
0.0132 0.0132 0.0132 0.0132 208.9453 208.9453 4.0000e-003
3.8300e-003
210.2170
Total 0.0192 0.1637 0.0697 1.0400e-003
208.9453 4.0000e-003
3.8300e-003
210.21700.0132 0.0132 0.0132 0.0132
CO SO2 Fugitive PM10
Exhaust PM10
208.9453
Exhaust PM2.5
PM2.5 Total
Bio- CO2 NBio- CO2
Mitigated
NaturalGas Use
ROG NOx Total CO2 CH4 N2O CO2e
Land Use kBTU/yr lb/day lb/day
PM10 Total
Fugitive PM2.5
Apartments Mid Rise
1.77604 0.0192 0.1637 0.0697 1.0400e-003
0.0132 0.0132 0.0132 0.0132 208.9453 208.9453 4.0000e-003
3.8300e-003
210.2170
Total 0.0192 0.1637 0.0697 1.0400e-003
4.0000e-003
3.8300e-003
210.21700.0132 0.0132 0.0132 0.0132 208.9453 208.9453

Page 6 of 7
CO SO2 Fugitive PM10
Fugitive PM2.5
Exhaust PM2.5
PM2.5 Total
Bio- CO2
6.0 Area Detail
6.1 Mitigation Measures Area
ROG NOx NBio- CO2 Total CO2 CH4 N2O CO2e
Category lb/day lb/day
Exhaust PM10
PM10 Total
Mitigated 1.5660 0.1293 9.5585 0.0127 0.6489 0.6489 0.6489 0.6489 91.1737 10.2501 101.4238 0.4367 0.0000 110.5938
Unmitigated 1.5660 0.1293 9.5585 0.0127 0.4367 0.0000 110.59380.6489 0.6489 0.6489 0.6489
SO2 Fugitive PM10
Exhaust PM10
91.1737 10.2501 101.4238
PM2.5 Total
Bio- CO2 NBio- CO2
6.2 Area by SubCategoryUnmitigated
ROG NOx CO Total CO2 CH4 N2O CO2e
SubCategory lb/day lb/day
PM10 Total
Fugitive PM2.5
Exhaust PM2.5
Architectural Coating
0.1477 0.0000 0.0000 0.0000 0.0000 0.0000 0.0000
Consumer Products
0.8195 0.0000 0.0000 0.0000 0.0000 0.0000 0.0000
Hearth 0.4170 0.0618 3.7866 0.0124 0.6177 0.6177 0.6177 0.6177 91.1737 0.0000 91.1737 0.4262 0.0000 100.1243
Landscaping 0.1818 0.0675 5.7719 3.0000e-004
0.0311 0.0311 0.0311 0.0311 10.2501 10.2501 0.0105 10.4695
Total 1.5659 0.1293 9.5585 0.0127 0.4367 0.0000 110.59380.6489 0.6489 0.6489 0.6489 91.1737 10.2501 101.4238

Page 7 of 7
SO2 Fugitive PM10
Exhaust PM10
PM2.5 Total
Bio- CO2 NBio- CO2
Mitigated
ROG NOx CO Total CO2 CH4 N2O CO2e
SubCategory lb/day lb/day
PM10 Total
Fugitive PM2.5
Exhaust PM2.5
Architectural Coating
0.1477 0.0000 0.0000 0.0000 0.0000 0.0000 0.0000
Consumer Products
0.8195 0.0000 0.0000 0.0000 0.0000 0.0000 0.0000
Hearth 0.4170 0.0618 3.7866 0.0124 0.6177 0.6177 0.6177 0.6177 91.1737 0.0000 91.1737 0.4262 0.0000 100.1243
Landscaping 0.1818 0.0675 5.7719 3.0000e-004
0.0311 0.0311 0.0311 0.0311 10.2501 10.2501 0.0105 10.4695
Total 1.5659 0.1293 9.5585 0.0127 0.6489 0.6489 0.6489 0.6489 91.1737 10.2501 101.4238 0.4367 0.0000 110.5938
7.0 Water Detail
7.1 Mitigation Measures Water
8.0 Waste Detail
8.1 Mitigation Measures Waste
Institute Recycling and Composting Services
9.0 Operational Offroad
Fuel Type
10.0 Vegetation
Equipment Type Number Hours/Day Days/Year Horse Power Load Factor

Page 1 of 7
CalEEMod Version: CalEEMod.2013.2.2 Date: 8/24/2016 1:27 PM
SFSU - Creative Arts & Holloway - ExistingSan Francisco County, Summer
1.0 Project Characteristics
1.1 Land Usage
Land Uses Size Metric Lot Acreage Floor Surface Area Population
Apartments Mid Rise 69.00 Dwelling Unit 1.82 38,295.00 190
1.2 Other Project Characteristics
Urbanization Urban Wind Speed (m/s) 4.6 Precipitation Freq (Days) 64
Climate Zone 5 Operational Year 2016
Utility Company Pacific Gas & Electric Company
CO2 Intensity (lb/MWhr)
559.32 CH4 Intensity (lb/MWhr)
0.029 N2O Intensity (lb/MWhr)
0.006
1.3 User Entered Comments & Non-Default Data
Project Characteristics - PG&E CO2 Intensity Factor adjusted per 25% RPS by 2016
Land Use - Dwelling units based on assumption of 2.75 people/beds per unit. SF reduced based on average of 555 SF per unit for Project
Vehicle Trips - Trip rates were adjusted to match the change in vehicle trips for the housing land use for project vs existing (i.e., 145 daily vehicle trips)
Woodstoves - No fireplaces assumed
Energy Use - Using "Historic" energy for Existing uses (based on 2005 factors in model)
Waste Mitigation - 50% waste diversion by 2016 consistent with AB 939 (not mitigation)
Table Name Column Name Default Value New Value
tblFireplaces NumberGas 37.95 0.00
tblFireplaces NumberNoFireplace 21.39 69.00
tblFireplaces NumberWood 9.66 0.00
tblLandUse LandUseSquareFeet 69,000.00 38,295.00
Page 2 of 7
tblLandUse Population 197.00 190.00
tblOffRoadEquipment OffRoadEquipmentUnitAmount 1.00 0.00
tblProjectCharacteristics CO2IntensityFactor 641.35 559.32
tblProjectCharacteristics OperationalYear 2014 2016
tblTripsAndVMT WorkerTripNumber 10.00 0.00
tblVehicleTrips ST_TR 7.16 2.10
6.07 2.10
tblVehicleTrips WD_TR 6.59 2.10
tblVehicleTrips SU_TR

Page 3 of 7
2.0 Emissions Summary
SO2 Fugitive PM10
Exhaust PM10
PM2.5 Total
Bio- CO2 NBio- CO2
2.2 Overall OperationalUnmitigated Operational
ROG NOx CO Total CO2 CH4 N2O CO2e
Category lb/day lb/day
PM10 Total
Fugitive PM2.5
Exhaust PM2.5
Area 1.5660 0.1293 9.5585 0.0127 0.6489 0.6489 0.6489 0.6489 91.1737 10.2501 101.4238 0.4367 0.0000 110.5938
Energy 0.0192 0.1637 0.0697 1.0400e-003
0.0132 0.0132 0.0132 0.0132 208.9453 208.9453 4.0000e-003
3.8300e-003
210.2170
Mobile 0.4995 0.9576 4.5044 0.0102 0.6975 0.0156 0.7131 0.1885 0.0144 0.2028 884.5826 884.5826 0.0366 885.3519
Total 2.0846 1.2505 14.1325 0.0239 0.4773 3.8300e-003
1,206.1626
0.6975 0.6777 1.3752 0.1885 0.6765 0.8649
SO2 Fugitive PM10
Exhaust PM10
91.1737 1,103.7781
1,194.9518
PM2.5 Total
Bio- CO2 NBio- CO2
Mitigated OperationalROG NOx CO Total CO2 CH4 N2O CO2e
Category lb/day lb/day
PM10 Total
Fugitive PM2.5
Exhaust PM2.5
Area 1.5660 0.1293 9.5585 0.0127 0.6489 0.6489 0.6489 0.6489 91.1737 10.2501 101.4238 0.4367 0.0000 110.5938
Energy 0.0192 0.1637 0.0697 1.0400e-003
0.0132 0.0132 0.0132 0.0132 208.9453 208.9453 4.0000e-003
3.8300e-003
210.2170
Mobile 0.4995 0.9576 4.5044 0.0102 0.6975 0.0156 0.7131 0.1885 0.0144 0.2028 884.5826 884.5826 0.0366 885.3519
Total 2.0846 1.2505 14.1325 0.0239 0.6975 0.6777 1.3752 0.1885 0.6765 0.8649 91.1737 1,103.7781
1,194.9518 0.4773 3.8300e-003
1,206.1626
ROG NOx CO SO2 Fugitive PM10
Exhaust PM10
PM10 Total
Fugitive PM2.5
Exhaust PM2.5
PM2.5 Total
Bio- CO2 NBio-CO2 Total CO2 CH4 N20 CO2e
Percent Reduction
0.00 0.00 0.00 0.00 0.00 0.00 0.00 0.00 0.00 0.00 0.00 0.00 0.00 0.00 0.00 0.00
4.0 Operational Detail - Mobile
4.1 Mitigation Measures Mobile

Page 4 of 7
CO SO2 Fugitive PM10
Fugitive PM2.5
Exhaust PM2.5
PM2.5 Total
Bio- CO2ROG NOx NBio- CO2 Total CO2 CH4 N2O CO2e
Category lb/day lb/day
Exhaust PM10
PM10 Total
Mitigated 0.4995 0.9576 4.5044 0.0102 0.6975 0.0156 0.7131 0.1885 0.0144 0.2028 884.5826 884.5826 0.0366 885.3519
Unmitigated 0.4995 0.9576 4.5044 0.0102 0.6975 0.0156 0.7131 0.1885 0.0144 0.2028 884.5826 884.5826 0.0366 885.3519
4.2 Trip Summary Information
Average Daily Trip Rate Unmitigated MitigatedLand Use Weekday Saturday Sunday Annual VMT Annual VMT
Apartments Mid Rise 144.90 144.90 144.90 323,470 323,470Total 144.90 144.90 144.90 323,470 323,470
4.3 Trip Type Information
Miles Trip % Trip Purpose %
Land Use H-W or C-W H-S or C-C H-O or C-NW H-W or C-W
H-S or C-C H-O or C-NW Primary Diverted Pass-by
Apartments Mid Rise 12.40 4.30 5.40 26.10 29.10 44.80 86 11 3
LDA LDT1 LDT2 MDV LHD1 LHD2 MHD HHD OBUS UBUS MCY
0.010157 0.000551 0.000507
5.0 Energy Detail
SBUS MH
0.628026 0.058431 0.149152 0.079214 0.003113 0.0110240.026557 0.003351 0.026114 0.003803
4.4 Fleet MixHistorical Energy Use: Y
5.1 Mitigation Measures Energy

Page 5 of 7
NOx CO SO2 Fugitive PM10
Fugitive PM2.5
Exhaust PM2.5
PM2.5 Total
Bio- CO2ROG NBio- CO2 Total CO2 CH4 N2O CO2e
Category lb/day lb/day
Exhaust PM10
PM10 Total
NaturalGas Mitigated
0.0192 0.1637 0.0697 1.0400e-003
0.0132 0.0132 0.0132 0.0132 208.9453 208.9453 4.0000e-003
3.8300e-003
210.2170
NaturalGas Unmitigated
0.0192 0.1637 0.0697 1.0400e-003
208.9453 4.0000e-003
3.8300e-003
210.21700.0132 0.0132 0.0132 0.0132
CO SO2 Fugitive PM10
Exhaust PM10
208.9453
Exhaust PM2.5
PM2.5 Total
Bio- CO2 NBio- CO2
5.2 Energy by Land Use - NaturalGasUnmitigated
NaturalGas Use
ROG NOx Total CO2 CH4 N2O CO2e
Land Use kBTU/yr lb/day lb/day
PM10 Total
Fugitive PM2.5
Apartments Mid Rise
1776.04 0.0192 0.1637 0.0697 1.0400e-003
0.0132 0.0132 0.0132 0.0132 208.9453 208.9453 4.0000e-003
3.8300e-003
210.2170
Total 0.0192 0.1637 0.0697 1.0400e-003
208.9453 4.0000e-003
3.8300e-003
210.21700.0132 0.0132 0.0132 0.0132
CO SO2 Fugitive PM10
Exhaust PM10
208.9453
Exhaust PM2.5
PM2.5 Total
Bio- CO2 NBio- CO2
Mitigated
NaturalGas Use
ROG NOx Total CO2 CH4 N2O CO2e
Land Use kBTU/yr lb/day lb/day
PM10 Total
Fugitive PM2.5
Apartments Mid Rise
1.77604 0.0192 0.1637 0.0697 1.0400e-003
0.0132 0.0132 0.0132 0.0132 208.9453 208.9453 4.0000e-003
3.8300e-003
210.2170
Total 0.0192 0.1637 0.0697 1.0400e-003
4.0000e-003
3.8300e-003
210.21700.0132 0.0132 0.0132 0.0132 208.9453 208.9453

Page 6 of 7
CO SO2 Fugitive PM10
Fugitive PM2.5
Exhaust PM2.5
PM2.5 Total
Bio- CO2
6.0 Area Detail
6.1 Mitigation Measures Area
ROG NOx NBio- CO2 Total CO2 CH4 N2O CO2e
Category lb/day lb/day
Exhaust PM10
PM10 Total
Mitigated 1.5660 0.1293 9.5585 0.0127 0.6489 0.6489 0.6489 0.6489 91.1737 10.2501 101.4238 0.4367 0.0000 110.5938
Unmitigated 1.5660 0.1293 9.5585 0.0127 0.4367 0.0000 110.59380.6489 0.6489 0.6489 0.6489
SO2 Fugitive PM10
Exhaust PM10
91.1737 10.2501 101.4238
PM2.5 Total
Bio- CO2 NBio- CO2
6.2 Area by SubCategoryUnmitigated
ROG NOx CO Total CO2 CH4 N2O CO2e
SubCategory lb/day lb/day
PM10 Total
Fugitive PM2.5
Exhaust PM2.5
Architectural Coating
0.1477 0.0000 0.0000 0.0000 0.0000 0.0000 0.0000
Consumer Products
0.8195 0.0000 0.0000 0.0000 0.0000 0.0000 0.0000
Hearth 0.4170 0.0618 3.7866 0.0124 0.6177 0.6177 0.6177 0.6177 91.1737 0.0000 91.1737 0.4262 0.0000 100.1243
Landscaping 0.1818 0.0675 5.7719 3.0000e-004
0.0311 0.0311 0.0311 0.0311 10.2501 10.2501 0.0105 10.4695
Total 1.5659 0.1293 9.5585 0.0127 0.4367 0.0000 110.59380.6489 0.6489 0.6489 0.6489 91.1737 10.2501 101.4238

Page 7 of 7
SO2 Fugitive PM10
Exhaust PM10
PM2.5 Total
Bio- CO2 NBio- CO2
Mitigated
ROG NOx CO Total CO2 CH4 N2O CO2e
SubCategory lb/day lb/day
PM10 Total
Fugitive PM2.5
Exhaust PM2.5
Architectural Coating
0.1477 0.0000 0.0000 0.0000 0.0000 0.0000 0.0000
Consumer Products
0.8195 0.0000 0.0000 0.0000 0.0000 0.0000 0.0000
Hearth 0.4170 0.0618 3.7866 0.0124 0.6177 0.6177 0.6177 0.6177 91.1737 0.0000 91.1737 0.4262 0.0000 100.1243
Landscaping 0.1818 0.0675 5.7719 3.0000e-004
0.0311 0.0311 0.0311 0.0311 10.2501 10.2501 0.0105 10.4695
Total 1.5659 0.1293 9.5585 0.0127 0.6489 0.6489 0.6489 0.6489 91.1737 10.2501 101.4238 0.4367 0.0000 110.5938
7.0 Water Detail
7.1 Mitigation Measures Water
8.0 Waste Detail
8.1 Mitigation Measures Waste
Institute Recycling and Composting Services
9.0 Operational Offroad
Fuel Type
10.0 Vegetation
Equipment Type Number Hours/Day Days/Year Horse Power Load Factor

Page 1 of 10
CalEEMod Version: CalEEMod.2013.2.2 Date: 8/24/2016 1:23 PM
SFSU - Creative Arts & Holloway - ExistingSan Francisco County, Annual
1.0 Project Characteristics
1.1 Land Usage
Land Uses Size Metric Lot Acreage Floor Surface Area Population
Apartments Mid Rise 69.00 Dwelling Unit 1.82 38,295.00 190
1.2 Other Project Characteristics
Urbanization Urban Wind Speed (m/s) 4.6 Precipitation Freq (Days)
0.006
64
Climate Zone 5 Operational Year 2016
Utility Company Pacific Gas & Electric Company
Vehicle Trips - Trip rates were adjusted to match the change in vehicle trips for the housing land use for project vs existing (i.e., 145 daily vehicle trips)
1.3 User Entered Comments & Non-Default Data
CO2 Intensity (lb/MWhr)
559.32 CH4 Intensity (lb/MWhr)
0.029 N2O Intensity (lb/MWhr)
Table Name Column Name Default Value New Value
Woodstoves - No fireplaces assumed
tblFireplaces NumberGas 37.95 0.00
tblFireplaces NumberNoFireplace 21.39 69.00
tblFireplaces NumberWood 9.66 0.00
tblLandUse LandUseSquareFeet 69,000.00 38,295.00
tblLandUse Population 197.00 190.00
Project Characteristics - PG&E CO2 Intensity Factor adjusted per 25% RPS by 2016
Land Use - Dwelling units based on assumption of 2.75 people/beds per unit. SF reduced based on average of 555 SF per unit for Project
Energy Use - Using "Historic" energy for Existing uses (based on 2005 factors in model)
Waste Mitigation - 50% waste diversion by 2016 consistent with AB 939 (not mitigation)

Page 2 of 10
tblOffRoadEquipment OffRoadEquipmentUnitAmount 1.00 0.00
tblProjectCharacteristics CO2IntensityFactor 641.35 559.32
tblProjectCharacteristics OperationalYear 2014 2016
tblTripsAndVMT WorkerTripNumber 10.00 0.00
tblVehicleTrips ST_TR 7.16 2.10
6.07 2.10
tblVehicleTrips WD_TR 6.59 2.10
tblVehicleTrips SU_TR

Page 3 of 10
2.0 Emissions Summary
SO2 Fugitive PM10
Exhaust PM10
PM2.5 Total
Bio- CO2 NBio- CO2
2.2 Overall OperationalUnmitigated Operational
ROG NOx CO Total CO2 CH4 N2O CO2e
Category tons/yr MT/yr
PM10 Total
Fugitive PM2.5
Exhaust PM2.5
Area 0.1951 6.4100e-003
0.5400 9.0000e-005
6.1400e-003
6.1400e-003
6.1400e-003
6.1400e-003
0.4475 0.8369 1.2844 2.9400e-003
0.0000 1.3462
Energy 3.5000e-003
0.0299 0.0127 1.9000e-004
2.4200e-003
2.4200e-003
2.4200e-003
2.4200e-003
0.0000 99.2221 99.2221 4.0100e-003
1.3300e-003
99.7179
Mobile 0.0900 0.1874 0.8486 1.7700e-003
0.1223 2.8500e-003
0.1251 0.0332 2.6200e-003
0.0358 0.0000 139.2392 139.2392 6.0400e-003
0.0000 139.3661
Waste 0.0000 0.0000 0.0000 0.0000 6.4429 0.0000 6.4429 0.3808 0.0000 14.4390
Water 0.0000 0.0000 0.0000 0.0000 1.4263 8.6882 10.1145 0.1469 3.5500e-003
14.3014
Total 0.2886 0.2237 1.4013 2.0500e-003
0.5407 4.8800e-003
269.17060.1223 0.0114 0.1337 0.0332 0.0112 0.0443
SO2 Fugitive PM10
Exhaust PM10
8.3167 247.9864 256.3031
PM2.5 Total
Bio- CO2 NBio- CO2
Mitigated OperationalROG NOx CO Total CO2 CH4 N2O CO2e
Category tons/yr MT/yr
PM10 Total
Fugitive PM2.5
Exhaust PM2.5
Area 0.1951 6.4100e-003
0.5400 9.0000e-005
6.1400e-003
6.1400e-003
6.1400e-003
6.1400e-003
0.4475 0.8369 1.2844 2.9400e-003
0.0000 1.3462
Energy 3.5000e-003
0.0299 0.0127 1.9000e-004
2.4200e-003
2.4200e-003
2.4200e-003
2.4200e-003
0.0000 99.2221 99.2221 4.0100e-003
1.3300e-003
99.7179
Mobile 0.0900 0.1874 0.8486 1.7700e-003
0.1223 2.8500e-003
0.1251 0.0332 2.6200e-003
0.0358 0.0000 139.2392 139.2392 6.0400e-003
0.0000 139.3661
Waste 0.0000 0.0000 0.0000 0.0000 3.2215 0.0000 3.2215 0.1904 0.0000 7.2195
Water 0.0000 0.0000 0.0000 0.0000 1.4263 8.6882 10.1145 0.1469 3.5500e-003
14.2991
Total 0.2886 0.2237 1.4013 2.0500e-003
0.1223 0.0114 0.1337 0.0332 0.0112 0.0443 5.0952 247.9864 253.0816 0.3503 4.8800e-003
261.9488
ROG NOx CO SO2 Fugitive PM10
Exhaust PM10
PM10 Total
Fugitive PM2.5
Exhaust PM2.5
PM2.5 Total
Bio- CO2 NBio-CO2 Total CO2 CH4 N20 CO2e

Page 4 of 10
Percent Reduction
0.00 0.00 0.00 0.00 0.00 0.00 0.00 0.00 0.00 0.00 38.74 0.00 1.26 35.22 0.00 2.68
CO SO2 Fugitive PM10
Fugitive PM2.5
Exhaust PM2.5
PM2.5 Total
Bio- CO2
4.0 Operational Detail - Mobile
4.1 Mitigation Measures Mobile
ROG NOx NBio- CO2 Total CO2 CH4 N2O CO2e
Category tons/yr MT/yr
Exhaust PM10
PM10 Total
Mitigated 0.0900 0.1874 0.8486 1.7700e-003
0.1223 2.8500e-003
0.1251 0.0332 2.6200e-003
0.0358 0.0000 139.2392 139.2392 6.0400e-003
0.0000 139.3661
Unmitigated 0.0900 0.1874 0.8486 1.7700e-003
0.1223 2.8500e-003
0.1251 0.0332 2.6200e-003
0.0358 0.0000 139.2392 139.2392 6.0400e-003
0.0000 139.3661
4.2 Trip Summary Information
Average Daily Trip Rate Unmitigated MitigatedLand Use Weekday Saturday Sunday Annual VMT Annual VMT
Apartments Mid Rise 144.90 144.90 144.90 323,470 323,470Total 144.90 144.90 144.90 323,470 323,470
4.3 Trip Type Information
Miles Trip % Trip Purpose %
Land Use H-W or C-W H-S or C-C H-O or C-NW H-W or C-W
H-S or C-C H-O or C-NW Primary Diverted Pass-by
Apartments Mid Rise 12.40 4.30 5.40 26.10 29.10 44.80 86 11 3
LDA LDT1 LDT2 MDV LHD1 LHD2 MHD HHD OBUS UBUS MCY
0.010157 0.000551 0.000507
5.0 Energy Detail
SBUS MH
0.628026 0.058431 0.149152 0.079214 0.003113 0.0110240.026557 0.003351 0.026114 0.003803
4.4 Fleet Mix

Page 5 of 10
NOx CO SO2 Fugitive PM10
Fugitive PM2.5
Exhaust PM2.5
PM2.5 Total
Bio- CO2
Historical Energy Use: Y
5.1 Mitigation Measures Energy
ROG NBio- CO2 Total CO2 CH4 N2O CO2e
Category tons/yr MT/yr
Exhaust PM10
PM10 Total
Electricity Mitigated 0.0000 0.0000 0.0000 0.0000 0.0000 64.6288 64.6288 3.3500e-003
6.9000e-004
64.9141
Electricity Unmitigated
0.0000 0.0000 0.0000 0.0000 0.0000 64.6288 64.6288 3.3500e-003
6.9000e-004
64.9141
NaturalGas Mitigated
3.5000e-003
0.0299 0.0127 1.9000e-004
2.4200e-003
2.4200e-003
2.4200e-003
2.4200e-003
0.0000 34.5933 34.5933 6.6000e-004
6.3000e-004
34.8038
NaturalGas Unmitigated
3.5000e-003
0.0299 0.0127 1.9000e-004
34.5933 34.5933 6.6000e-004
6.3000e-004
34.80382.4200e-003
2.4200e-003
2.4200e-003
ROG NOx CO SO2 Fugitive PM10
0.00002.4200e-003
PM10 Total
Fugitive PM2.5
Exhaust PM2.5
PM2.5 Total
Bio- CO2
5.2 Energy by Land Use - NaturalGasUnmitigated
NaturalGas Use
NBio- CO2 Total CO2 CH4 N2O CO2e
Land Use kBTU/yr tons/yr MT/yr
Exhaust PM10
Apartments Mid Rise
648253 3.5000e-003
0.0299 0.0127 6.6000e-004
6.3000e-004
1.9000e-004
2.4200e-003
2.4200e-003
2.4200e-003
2.4200e-003
2.4200e-003
0.0000 34.5933 34.5933
0.0000 34.5933
34.8038
Total 3.5000e-003
0.0299 0.0127 1.9000e-004
34.5933 6.6000e-004
6.3000e-004
34.8038
Mitigated
2.4200e-003
2.4200e-003
2.4200e-003

Page 6 of 10
NaturalGas Use
ROG NOx CO SO2 Fugitive PM10
Exhaust PM10
PM10 Total
Fugitive PM2.5
Exhaust PM2.5
PM2.5 Total
Bio- CO2 NBio- CO2 Total CO2 CH4 N2O CO2e
Land Use kBTU/yr tons/yr MT/yr
Apartments Mid Rise
648253 3.5000e-003
0.0299 34.5933 6.6000e-004
0.0127 1.9000e-004
2.4200e-003
2.4200e-003
1.9000e-004
2.4200e-003
2.4200e-003
0.0000 34.5933
2.4200e-003
0.0000
6.3000e-004
34.8038
Total 3.5000e-003
0.0299 0.0127 34.5933 34.5933 6.6000e-004
6.3000e-004
34.8038
5.3 Energy by Land Use - Electricity
2.4200e-003
2.4200e-003
2.4200e-003
Unmitigated
Electricity Use
Total CO2 CH4 N2O CO2e
Land Use kWh/yr to
MT/yr
Apartments Mid Rise
254742 64.6288 3.3500e-003
6.9000e-004
64.9141
Total 64.6288 3.3500e-003
6.9000e-004
64.9141
6.9000e-004
Mitigated
Electricity Use
Total CO2 CH4 N2O CO2e
Land Use kWh/yr to
MT/yr
Apartments Mid Rise
254742 64.6288 3.3500e-003
64.9141

Page 7 of 10
64.9141
CO SO2 Fugitive PM10
Total 64.6288 3.3500e-003
6.9000e-004
Fugitive PM2.5
Exhaust PM2.5
PM2.5 Total
Bio- CO2
6.0 Area Detail
6.1 Mitigation Measures Area
ROG NOx NBio- CO2 Total CO2 CH4 N2O CO2e
Category tons/yr MT/yr
Exhaust PM10
PM10 Total
Mitigated 0.1951 6.4100e-003
0.5400 9.0000e-005
6.1400e-003
6.1400e-003
6.1400e-003
6.1400e-003
0.4475 0.8369 1.2844 2.9400e-003
0.0000 1.3462
Unmitigated 0.1951 6.4100e-003
0.5400 9.0000e-005
2.9400e-003
0.0000 1.34626.1400e-003
6.1400e-003
6.1400e-003
6.1400e-003
SO2 Fugitive PM10
Exhaust PM10
0.4475 0.8369 1.2844
PM2.5 Total
Bio- CO2 NBio- CO2
6.2 Area by SubCategoryUnmitigated
ROG NOx CO Total CO2 CH4 N2O CO2e
SubCategory tons/yr MT/yr
PM10 Total
Fugitive PM2.5
Exhaust PM2.5
Architectural Coating
0.0270 0.0000 0.0000 0.0000 0.0000 0.0000 0.0000 0.0000 0.0000 0.0000 0.0000
Consumer Products
0.1496 0.0000 0.0000 0.0000 0.0000 0.0000 0.0000 0.0000 0.0000 0.0000 0.0000
Hearth 2.2600e-003
3.3000e-004
0.0205 7.0000e-005
3.3400e-003
3.3400e-003
3.3400e-003
3.3400e-003
0.4475 0.0000 0.4475 2.0900e-003
0.0000 0.4914
Landscaping 0.0164 6.0800e-003
0.5195 3.0000e-005
2.8000e-003
2.8000e-003
2.8000e-003
2.8000e-003
0.0000 0.8369 0.8369 8.5000e-004
0.0000 0.8548
Total 0.1951 6.4100e-003
0.5400 1.0000e-004
2.9400e-003
0.0000 1.34626.1400e-003
6.1400e-003
6.1400e-003
6.1400e-003
0.4475 0.8369 1.2844

Page 8 of 10
SO2 Fugitive PM10
Exhaust PM10
PM2.5 Total
Bio- CO2 NBio- CO2
Mitigated
ROG NOx CO Total CO2 CH4 N2O CO2e
SubCategory tons/yr MT/yr
PM10 Total
Fugitive PM2.5
Exhaust PM2.5
Architectural Coating
0.0270 0.0000 0.0000 0.0000 0.0000 0.0000 0.0000 0.0000 0.0000 0.0000 0.0000
Consumer Products
0.1496 0.0000 0.0000 0.0000 0.0000 0.0000 0.0000 0.0000 0.0000 0.0000 0.0000
Hearth 2.2600e-003
3.3000e-004
0.0205 7.0000e-005
3.3400e-003
3.3400e-003
3.3400e-003
3.3400e-003
0.4475 0.0000 0.4475 2.0900e-003
0.0000 0.4914
Landscaping 0.0164 6.0800e-003
0.5195 3.0000e-005
2.8000e-003
2.8000e-003
2.8000e-003
2.8000e-003
0.0000 0.8369 0.8369 8.5000e-004
0.0000 0.8548
Total 0.1951 6.4100e-003
0.5400 1.0000e-004
6.1400e-003
6.1400e-003
6.1400e-003
6.1400e-003
0.4475 0.8369 1.2844 2.9400e-003
0.0000 1.3462
7.0 Water Detail
7.1 Mitigation Measures Water
Total CO2 CH4 N2O CO2e
Category ton
MT/yr
Mitigated 10.1145 0.1469 3.5500e-003
14.2991
Unmitigated 10.1145 0.1469 3.5500e-003
14.3014
7.2 Water by Land UseUnmitigated

Page 9 of 10
Indoor/Outdoor Use
Total CO2 CH4 N2O CO2e
Land Use Mgal to
MT/yr
Apartments Mid Rise
4.49563 / 2.8342
10.1145 0.1469 3.5500e-003
14.3014
Total 10.1145 0.1469 3.5500e-003
14.3014
Mitigated
Indoor/Outdoor Use
Total CO2 CH4 N2O CO2e
Land Use Mgal to
MT/yr
Apartments Mid Rise
4.49563 / 2.8342
10.1145 0.1469 3.5500e-003
14.2991
Total 10.1145 0.1469 3.5500e-003
14.2991
8.0 Waste Detail
8.1 Mitigation Measures Waste
Institute Recycling and Composting Services
Category/Year
Total CO2 CH4 N2O CO2e
ton
MT/yr
Page 10 of 10
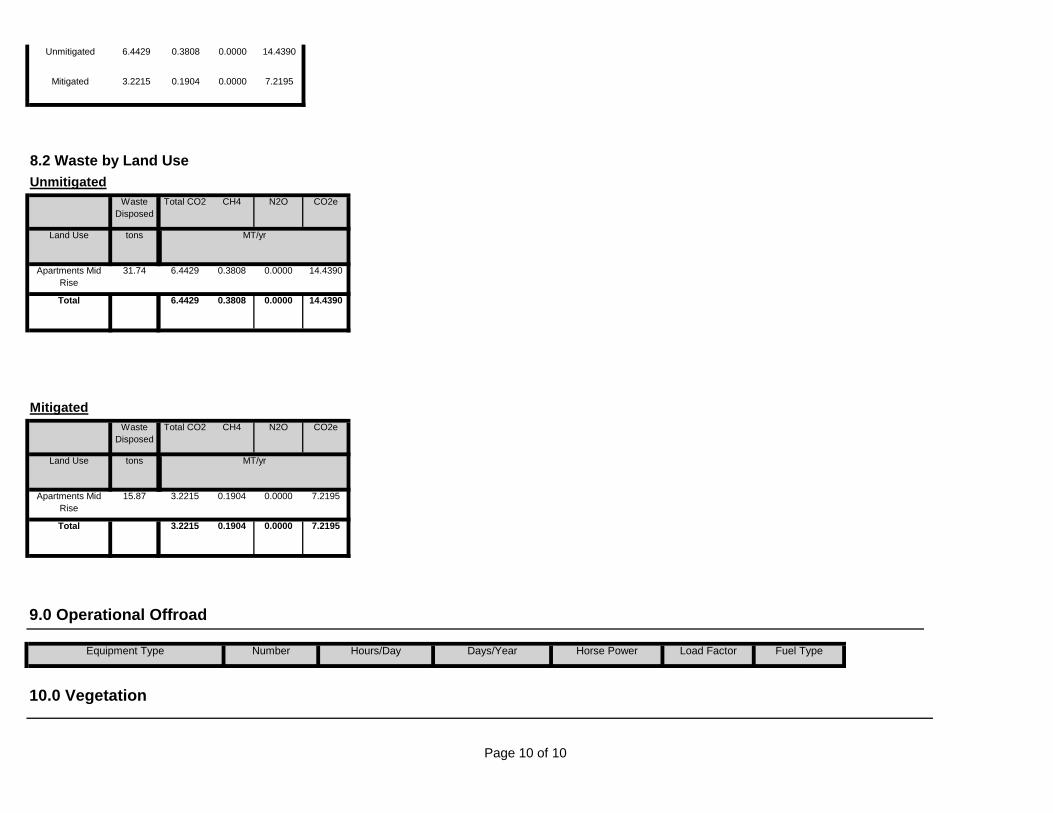
Unmitigated 6.4429 0.3808 0.0000 14.4390
Mitigated 3.2215 0.1904 0.0000 7.2195
8.2 Waste by Land UseUnmitigated
Waste Disposed
Total CO2 CH4 N2O CO2e
Land Use tons to
MT/yr
Apartments Mid Rise
31.74 6.4429 0.3808 0.0000 14.4390
Total 6.4429 0.3808 0.0000 14.4390
MitigatedWaste
DisposedTotal CO2 CH4 N2O CO2e
Land Use tons to
MT/yr
Apartments Mid Rise
15.87 3.2215 0.1904 0.0000 7.2195
Total 3.2215 0.1904 0.0000 7.2195
10.0 Vegetation
9.0 Operational Offroad
Equipment Type Load Factor Fuel TypeNumber Hours/Day Days/Year Horse Power
Page 1 of 4
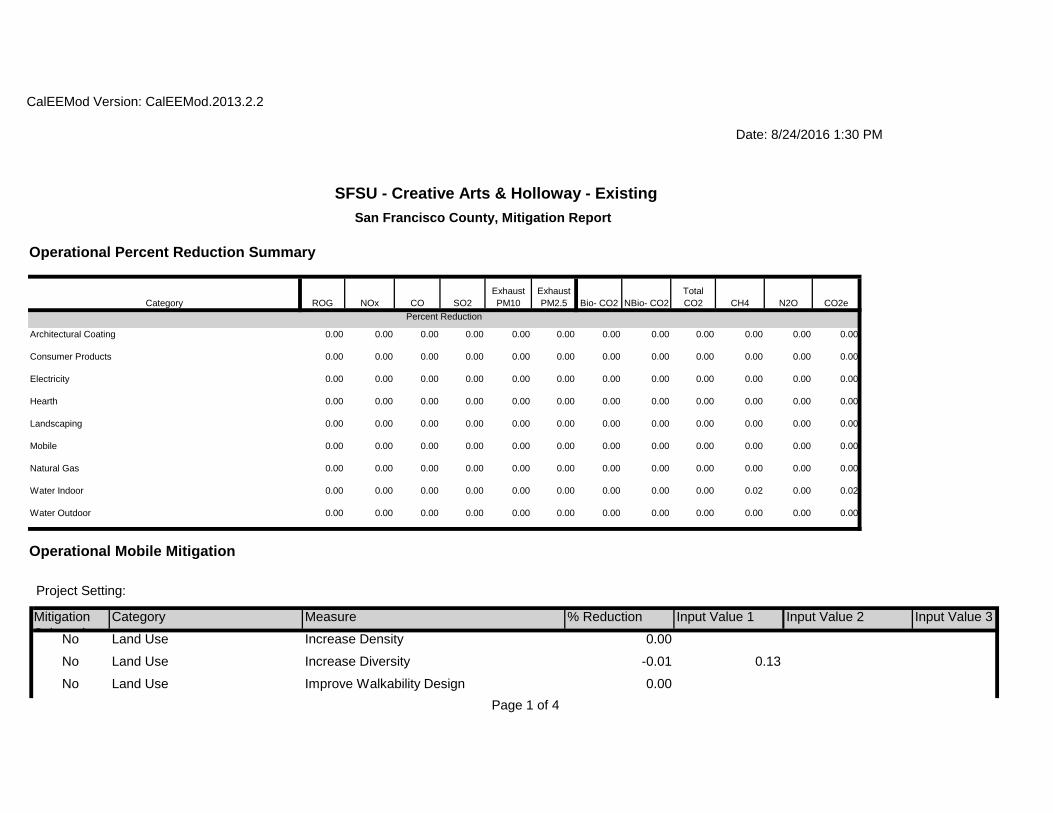
CalEEMod Version: CalEEMod.2013.2.2
Date: 8/24/2016 1:30 PM
SFSU - Creative Arts & Holloway - ExistingSan Francisco County, Mitigation Report
Operational Percent Reduction Summary
Category ROG NOx CO SO2Exhaust PM10
Exhaust PM2.5 Bio- CO2 NBio- CO2
Total CO2 CH4 N2O CO2e
Percent Reduction
Architectural Coating 0.00 0.00 0.00 0.00 0.00 0.00 0.00 0.00 0.00 0.00 0.00 0.00
Consumer Products 0.00 0.00 0.00 0.00 0.00 0.00 0.00 0.00 0.00 0.00 0.00 0.00
Electricity 0.00 0.00 0.00 0.00 0.00 0.00 0.00 0.00 0.00 0.00 0.00 0.00
Hearth 0.00 0.00 0.00 0.00 0.00 0.00 0.00 0.00 0.00 0.00 0.00 0.00
Landscaping 0.00 0.00 0.00 0.00 0.00 0.00 0.00 0.00 0.00 0.00 0.00 0.00
Mobile 0.00 0.00 0.00 0.00 0.00 0.00 0.00 0.00 0.00 0.00 0.00 0.00
Natural Gas 0.00 0.00 0.00 0.00 0.00 0.00 0.00 0.00 0.00 0.00 0.00 0.00
Water Indoor 0.00 0.00 0.00 0.00 0.00 0.00 0.00 0.00 0.00 0.02 0.00 0.02
Water Outdoor 0.00 0.00 0.00 0.00 0.00 0.00 0.00 0.00 0.00 0.00 0.00 0.00
Operational Mobile Mitigation
Project Setting:
Mitigation S l t d
Category Measure % Reduction Input Value 1 Input Value 2
Increase Diversity -0.01 0.13
Input Value 3
No Land Use Increase Density 0.00
No Land Use Improve Walkability Design 0.00
No Land Use

Page 2 of 4
No Land Use Improve Destination Accessibility 0.00
Integrate Below Market Rate Housing 0.00
No Land Use Increase Transit Accessibility 0.25
Land Use Land Use SubTotal 0.00
No Land Use
No Neighborhood Enhancements Improve Pedestrian Network
Implement NEV Network 0.00
No Neighborhood Enhancements Provide Traffic Calming Measures
Neighborhood Enhancements Neighborhood Enhancements Subtotal 0.00
No Neighborhood Enhancements
No Parking Policy Pricing Limit Parking Supply 0.00
On-street Market Pricing 0.00
No Parking Policy Pricing Unbundle Parking Costs 0.00
Parking Policy Pricing Parking Policy Pricing Subtotal 0.00
No Parking Policy Pricing
No Transit Improvements Provide BRT System 0.00
Increase Transit Frequency 0.00
No Transit Improvements Expand Transit Network 0.00
Transit Improvements Transit Improvements Subtotal 0.00
No Transit Improvements
Land Use and Site Enhancement Subtotal 0.00
Transit Subsidy
No Commute Implement Trip Reduction Program
No Commute Implement Employee Parking "Cash Out"
No Commute
No Commute Workplace Parking Charge
Market Commute Trip Reduction Option 0.00
No Commute Encourage Telecommuting and Alternative Work Schedules
0.00
No Commute Employee Vanpool/Shuttle 0.00 2.00
No Commute
No Commute Provide Ride Sharing Program

Page 3 of 4
Implement School Bus Program 0.00
Commute Commute Subtotal 0.00
Total VMT Reduction 0.00
No School Trip
Area Mitigation
Measure Implemented Mitigation Measure Input Value
No Only Natural Gas Hearth
No No Hearth
No Use Low VOC Cleaning Supplies
No Use Low VOC Paint (Residential Interior) 100.00
No Use Low VOC Paint (Residential Exterior) 150.00
No Use Low VOC Paint (Non-residential Interior) 100.00
No Use Low VOC Paint (Non-residential Exterior) 150.00
No % Electric Lawnmower
No % Electric Leafblower
No % Electric Chainsaw
Energy Mitigation Measures
Measure Implemented Mitigation Measure Input Value 1 Input Value 2
No Exceed Title 24
No Install High Efficiency Lighting
No On-site Renewable
Appliance Type Land Use Subtype % Improvement
ClothWasher 30.00
DishWasher 15.00
Fan 50.00

Page 4 of 4
Refrigerator 15.00
Water Mitigation Measures
Measure Implemented Mitigation Measure Input Value 1 Input Value 2
No Apply Water Conservation on Strategy 0.00 0.00
No Use Reclaimed Water 0.00 0.00
No Use Grey Water 0.00
No Install low-flow bathroom faucet 32.00
No Install low-flow Kitchen faucet 18.00
No Install low-flow Toilet 20.00
No Install low-flow Shower 20.00
No Turf Reduction 0.00
No Use Water Efficient Irrigation Systems 6.10
Institute Recycling and Composting ServicesPercent Reduction in Waste Disposed
50.00
No Water Efficient Landscape 0.00 0.00
Solid Waste Mitigation
Mitigation Measures Input Value

CalEEMod Outputs Project Operations Event Days - Winter, Summer,
Annual, and Mitigation

Page 1 of 8
Area Coating - Adusted non-residential interior/exterior area based on minimal surfaces to be coated in parking garage
Energy Use - Default energy
Energy Mitigation - Exceed Title 24: 25% improvement is based on compliance with 2013 Title 24 (versus 2008 Title 24) + project design guidelines note 20% improvement beyond that
Vehicle Trips - For an Event day, trip rates were adjusted to match the increase in vehicle trips with the project creative arts building/concert hall
Woodstoves - No fireplaces assumed
1.3 User Entered Comments & Non-Default Data
Project Characteristics - PG&E CO2 Intensity Factor adjusted per 33% RPS by 2020
Land Use - Junior College used to represent University (since University doesn't have 1,000 sqft metric). Dwelling units based on assumption of 2.75 people/beds per unit. Acreages adjusted to match respective block
CO2 Intensity (lb/MWhr)
499.66 CH4 Intensity (lb/MWhr)
0.029 N2O Intensity (lb/MWhr)
0.006
64
Climate Zone 5 Operational Year 2020
Utility Company Pacific Gas & Electric Company
1.2 Other Project Characteristics
Urbanization Urban Wind Speed (m/s) 4.6 Precipitation Freq (Days)
Strip Mall 25.00 1000sqft 0.30 25,000.00 0
Apartments Mid Rise 200.00 Dwelling Unit 1.00 111,146.00 550
Enclosed Parking with Elevator 70.00 Space 0.00 28,000.00 0
Junior College (2Yr) 60.00 1000sqft 0.90 60,000.00 0
Population
Junior College (2Yr) 75.00 1000sqft 1.00 75,000.00 0
1.1 Land Usage
Land Uses Size Metric Lot Acreage Floor Surface Area
CalEEMod Version: CalEEMod.2013.2.2 Date: 8/24/2016 12:52 PM
SFSU - Creative Arts & Holloway - Event DaySan Francisco County, Winter
1.0 Project Characteristics

Page 2 of 8tblVehicleTrips WD_TR 27.49 1.86
tblVehicleTrips SU_TR 20.43 0.00
tblVehicleTrips WD_TR 6.59 0.00
tblVehicleTrips SU_TR 6.07 0.00
tblVehicleTrips SU_TR 1.21 1.86
tblVehicleTrips ST_TR 11.23 1.86
tblVehicleTrips ST_TR 42.04 0.00
tblTripsAndVMT WorkerTripNumber 44.00 0.00
tblVehicleTrips ST_TR 7.16 0.00
tblProjectCharacteristics CO2IntensityFactor 641.35 499.66
tblProjectCharacteristics OperationalYear 2014 2020
tblLandUse Population 572.00 550.00
tblOffRoadEquipment OffRoadEquipmentUnitAmount 1.00 0.00
tblLandUse LotAcreage 5.26 1.00
tblLandUse LotAcreage 0.57 0.30
tblLandUse LotAcreage 1.72 1.00
tblLandUse LotAcreage 0.63 0.00
tblLandUse LandUseSquareFeet 200,000.00 111,146.00
tblLandUse LotAcreage 1.38 0.90
tblFireplaces NumberNoFireplace 62.00 200.00
tblFireplaces NumberWood 28.00 0.00
tblAreaCoating Area_Nonresidential_Interior 282000 240000
tblFireplaces NumberGas 110.00 0.00
tblArchitecturalCoating ConstArea_Residential_Interior 225,071.00 0.00
tblAreaCoating Area_Nonresidential_Exterior 94000 81680
tblArchitecturalCoating ConstArea_Nonresidential_Interior 282,000.00 0.00
tblArchitecturalCoating ConstArea_Residential_Exterior 75,024.00 0.00
Table Name Column Name Default Value New Value
tblArchitecturalCoating ConstArea_Nonresidential_Exterior 94,000.00 0.00
Waste Mitigation - 75% waste diversion consistent with AB 341 (not mitigation)
Water Mitigation - 20% indoor and 20% outdoor water reduction by 2020

Page 3 of 8
4.0 Operational Detail - Mobile
0.00 22.28 20.79 1.16 37.34 20.710.00 2.55 1.52 0.00 2.55 2.15
NBio-CO2 Total CO2 CH4 N20 CO2e
Percent Reduction
0.75 18.24 1.41 6.15
Exhaust PM10
PM10 Total
Fugitive PM2.5
Exhaust PM2.5
PM2.5 Total
Bio- CO2ROG NOx CO SO2 Fugitive PM10
260.4963 2,830.4980
3,090.9943 1.3273 0.0250 3,126.6101
1.3746 1.9666 3.3412 0.3714 1.9647 2.3361Total 9.8330 2.9890 35.0364 0.0620
1,438.5099
1,438.5099 0.0543 1,439.6510
1.3746 0.0243 1.3989 0.3714 0.0225 0.3938Mobile 0.7197 1.5049 6.8267 0.0190
1,362.2274
1,362.2274 0.0261 0.0250 1,370.5177
0.0863 0.0863 0.0863 0.0863Energy 0.1249 1.1159 0.8123 6.8100e-003
260.4963 29.7608 290.2571 1.2469 0.0000 316.44141.8560 1.8560 1.8560 1.8560Area 8.9884 0.3682 27.3975 0.0362
Total CO2 CH4 N2O CO2e
Category lb/day lb/day
PM10 Total
Fugitive PM2.5
Exhaust PM2.5
Mitigated OperationalROG NOx CO SO2 Fugitive
PM10Exhaust PM10
260.4963 3,641.9964
3,902.4927
PM2.5 Total
Bio- CO2 NBio- CO2
1.3429 0.0399 3,943.0471
1.3746 2.0180 3.3926 0.3714 2.0161 2.3875Total 9.9074 3.6559 35.5365 0.0660
1,438.5099
1,438.5099 0.0543 1,439.6510
1.3746 0.0243 1.3989 0.3714 0.0225 0.3938Mobile 0.7197 1.5049 6.8267 0.0190
2,173.7257
2,173.7257 0.0417 0.0399 2,186.9546
0.1377 0.1377 0.1377 0.1377Energy 0.1993 1.7829 1.3123 0.0109
260.4963 29.7608 290.2571 1.2469 0.0000 316.44141.8560 1.8560 1.8560 1.8560Area 8.9884 0.3682 27.3975 0.0362
Total CO2 CH4 N2O CO2e
Category lb/day lb/day
PM10 Total
Fugitive PM2.5
Exhaust PM2.5
Unmitigated OperationalROG NOx CO SO2 Fugitive
PM10Exhaust PM10
PM2.5 Total
Bio- CO2 NBio- CO2
2.2 Overall Operational2.0 Emissions Summary
tblVehicleTrips WD_TR 44.32 0.00

Page 4 of 8
0.003129 0.010899 0.010305 0.000529 0.000500
SBUS MH
0.631289 0.058518 0.148045 0.077273 0.026007 0.003276 0.026188 0.004043
LHD2 MHD HHD OBUS UBUS MCY
64.40 19.00 45 40 15
LDA LDT1 LDT2 MDV LHD1
88.60 5.00 92 7 1
Strip Mall 9.50 7.30 7.30 16.60
88.60 5.00 92 7 1
Junior College (2Yr) 9.50 7.30 7.30 6.40
0.00 0.00 0 0 0
Junior College (2Yr) 9.50 7.30 7.30 6.40
29.10 44.80 86 11 3
Enclosed Parking with Elevator 9.50 7.30 7.30 0.00
H-S or C-C H-O or C-NW Primary Diverted Pass-by
Apartments Mid Rise 12.40 4.30 5.40 26.10
4.3 Trip Type Information
Miles Trip % Trip Purpose %
Land Use H-W or C-W H-S or C-C H-O or C-NW H-W or C-W
Total 251.10 251.10 251.10 637,678 637,678Strip Mall 0.00 0.00 0.00
Junior College (2Yr) 111.60 111.60 111.60 283,412 283,412Junior College (2Yr) 139.50 139.50 139.50 354,265 354,265
Enclosed Parking with Elevator 0.00 0.00 0.00
Annual VMT
Apartments Mid Rise 0.00 0.00 0.00
4.2 Trip Summary Information
Average Daily Trip Rate Unmitigated MitigatedLand Use Weekday Saturday Sunday Annual VMT
1,438.5099
1,438.5099 0.0543 1,439.6510
1.3746 0.0243 1.3989 0.3714 0.0225 0.3938Unmitigated 0.7197 1.5049 6.8267 0.0190
1,438.5099
1,438.5099 0.0543 1,439.6510
1.3746 0.0243 1.3989 0.3714 0.0225 0.3938Mitigated 0.7197 1.5049 6.8267 0.0190
NBio- CO2 Total CO2 CH4 N2O CO2e
Category lb/day lb/day
Exhaust PM10
PM10 Total
4.1 Mitigation Measures Mobile
ROG NOx CO SO2 Fugitive PM10
Fugitive PM2.5
Exhaust PM2.5
PM2.5 Total
Bio- CO2

Page 5 of 8
38.6785 38.6785 7.4000e-004
7.1000e-004
38.91392.4500e-003
2.4500e-003
2.4500e-003
2.4500e-003
Strip Mall 328.767 3.5500e-003
0.0322 0.0271 1.9000e-004
869.0572 869.0572 0.0167 0.0159 874.34620.0550 0.0550 0.0550 0.0550Junior College (2Yr)
7386.99 0.0797 0.7242 0.6083 4.3500e-003
695.2458 695.2458 0.0133 0.0128 699.47690.0440 0.0440 0.0440 0.0440Junior College (2Yr)
5909.59 0.0637 0.5794 0.4867 3.4800e-003
0.0000 0.0000 0.0000 0.0000 0.00000.0000 0.0000 0.0000 0.0000Enclosed Parking with Elevator
0 0.0000 0.0000 0.0000 0.0000
570.7442 570.7442 0.0109 0.0105 574.21770.0362 0.0362 0.0362 0.0362Apartments Mid Rise
4851.33 0.0523 0.4471 0.1903 2.8500e-003
N2O CO2e
Land Use kBTU/yr lb/day lb/day
Exhaust PM10
PM2.5 Total
Bio- CO2
2,186.9546
5.2 Energy by Land Use - NaturalGasUnmitigated
NaturalGas Use
NBio- CO2 Total CO2 CH4ROG NOx CO SO2 Fugitive PM10
0.13770.1377
PM10 Total
Fugitive PM2.5
Exhaust PM2.5
2,173.7257
2,173.7257 0.0417 0.03990.0109 0.1377 0.1377
1,362.2274
1,362.2274 0.0261 0.0250 1,370.5177
NaturalGas Unmitigated
0.1993 1.7829 1.3123
0.0863 0.0863 0.0863 0.0863
Category lb/day lb/day
NaturalGas Mitigated
0.1249 1.1159 0.8123 6.8100e-003
Bio- CO2 NBio- CO2 Total CO2 CH4 N2O CO2eFugitive PM10
Exhaust PM10
PM10 Total
Fugitive PM2.5
Exhaust PM2.5
PM2.5 Total
4.4 Fleet MixHistorical Energy Use: N
5.1 Mitigation Measures Energy
Exceed Title 24
ROG NOx CO SO2
5.0 Energy Detail

Page 6 of 8
260.4963 29.7608 290.2571 1.2469 0.0000 316.44141.8560 1.8560 1.8560 1.8560Unmitigated 8.9884 0.3682 27.3975 0.0362
260.4963 29.7608 290.2571 1.2469 0.0000 316.44141.8560 1.8560 1.8560 1.8560Mitigated 8.9884 0.3682 27.3975 0.0362
NBio- CO2 Total CO2 CH4 N2O CO2e
Category lb/day lb/day
Exhaust PM10
PM10 Total
6.0 Area Detail
6.1 Mitigation Measures Area
ROG NOx CO SO2 Fugitive PM10
1,362.2274 1,362.2274
Fugitive PM2.5
Exhaust PM2.5
PM2.5 Total
Bio- CO2
0.0261 0.0250 1,370.5177
0.0863 0.0863 0.0863 0.0863Total 0.1249 1.1159 0.8123 6.8100e-003
385.3023 385.3023 7.3800e-003
7.0600e-003
387.64720.0244 0.0244 0.0244 0.0244Apartments Mid Rise
3.27507 0.0353 0.3018 0.1284 1.9300e-003
25.4633 25.4633 4.9000e-004
4.7000e-004
25.61831.6100e-003
1.6100e-003
1.6100e-003
1.6100e-003
Strip Mall 0.216438 2.3300e-003
0.0212 0.0178 1.3000e-004
528.5899 528.5899 0.0101 9.6900e-003
531.80680.0335 0.0335 0.0335 0.0335Junior College (2Yr)
4.49301 0.0485 0.4405 0.3700 2.6400e-003
422.8719 422.8719 8.1100e-003
7.7500e-003
425.44540.0268 0.0268 0.0268 0.0268Junior College (2Yr)
3.59441 0.0388 0.3524 0.2960 2.1100e-003
0.0000 0.0000 0.0000 0.0000 0.00000.0000 0.0000 0.0000 0.0000Enclosed Parking with Elevator
0 0.0000 0.0000 0.0000 0.0000
Total CO2 CH4 N2O CO2e
Land Use kBTU/yr lb/day lb/day
PM10 Total
Fugitive PM2.5
Mitigated
NaturalGas Use
ROG NOx CO SO2 Fugitive PM10
Exhaust PM10
2,173.7257
Exhaust PM2.5
PM2.5 Total
Bio- CO2 NBio- CO2
2,173.7257
0.0417 0.0399 2,186.9546
0.1377 0.1377 0.1377 0.1377Total 0.1993 1.7829 1.3123 0.0109

Page 7 of 8
7.0 Water Detail
7.1 Mitigation Measures Water
260.4963 29.7608 290.2571 1.2469 0.0000 316.44141.8560 1.8560 1.8560 1.8560Total 8.9884 0.3682 27.3975 0.0362
29.7608 29.7608 0.0291 30.37200.0911 0.0911 0.0911 0.0911Landscaping 0.5063 0.1917 16.5787 8.7000e-004
260.4963 0.0000 260.4963 1.2178 0.0000 286.06941.7649 1.7649 1.7649 1.7649Hearth 1.1913 0.1765 10.8187 0.0353
0.0000 0.00000.0000 0.0000 0.0000 0.0000Consumer Products
6.4017
0.0000 0.00000.0000 0.0000 0.0000 0.0000Architectural Coating
0.8891
Total CO2 CH4 N2O CO2e
SubCategory lb/day lb/day
PM10 Total
Fugitive PM2.5
Exhaust PM2.5
Mitigated
ROG NOx CO SO2 Fugitive PM10
Exhaust PM10
260.4963 29.7608 290.2571
PM2.5 Total
Bio- CO2 NBio- CO2
1.2469 0.0000 316.44141.8560 1.8560 1.8560 1.8560Total 8.9884 0.3682 27.3975 0.0362
29.7608 29.7608 0.0291 30.37200.0911 0.0911 0.0911 0.0911Landscaping 0.5063 0.1917 16.5787 8.7000e-004
260.4963 0.0000 260.4963 1.2178 0.0000 286.06941.7649 1.7649 1.7649 1.7649Hearth 1.1913 0.1765 10.8187 0.0353
0.0000 0.00000.0000 0.0000 0.0000 0.0000Consumer Products
6.4017
0.0000 0.00000.0000 0.0000 0.0000 0.0000Architectural Coating
0.8891
Total CO2 CH4 N2O CO2e
SubCategory lb/day lb/day
PM10 Total
Fugitive PM2.5
Exhaust PM2.5
Unmitigated
ROG NOx CO SO2 Fugitive PM10
Exhaust PM10
PM2.5 Total
Bio- CO2 NBio- CO2
6.2 Area by SubCategory

Page 8 of 8
Load Factor Fuel Type
10.0 Vegetation
9.0 Operational Offroad
Equipment Type Number Hours/Day Days/Year Horse Power
Apply Water Conservation Strategy
8.0 Waste Detail
8.1 Mitigation Measures Waste
Institute Recycling and Composting Services

Page 1 of 9
Area Coating - Adusted non-residential interior/exterior area based on minimal surfaces to be coated in parking garage
Energy Use - Default energy
Vehicle Trips - For an Event day, trip rates were adjusted to match the increase in vehicle trips with the project creative arts building/concert hall
Woodstoves - No fireplaces assumed
1.3 User Entered Comments & Non-Default Data
Project Characteristics - PG&E CO2 Intensity Factor adjusted per 33% RPS by 2020
Land Use - Junior College used to represent University (since University doesn't have 1,000 sqft metric). Dwelling units based on assumption of 2.75 people/beds per unit. Acreages adjusted to match respective block
CO2 Intensity (lb/MWhr)
499.66 CH4 Intensity (lb/MWhr)
0.029 N2O Intensity (lb/MWhr)
0.006
64
Climate Zone 5 Operational Year 2020
Utility Company Pacific Gas & Electric Company
1.2 Other Project Characteristics
Urbanization Urban Wind Speed (m/s) 4.6 Precipitation Freq (Days)
Strip Mall 25.00 1000sqft 0.30 25,000.00 0
Apartments Mid Rise 200.00 Dwelling Unit 1.00 111,146.00 550
Enclosed Parking with Elevator 70.00 Space 0.00 28,000.00 0
Junior College (2Yr) 60.00 1000sqft 0.90 60,000.00 0
Population
Junior College (2Yr) 75.00 1000sqft 1.00 75,000.00 0
1.1 Land Usage
Land Uses Size Metric Lot Acreage Floor Surface Area
CalEEMod Version: CalEEMod.2013.2.2 Date: 8/24/2016 12:51 PM
SFSU - Creative Arts & Holloway - Event DaySan Francisco County, Summer
1.0 Project Characteristics

Page 2 of 9
tblVehicleTrips SU_TR 20.43 0.00
tblVehicleTrips SU_TR 6.07 0.00
tblVehicleTrips SU_TR 1.21 1.86
tblVehicleTrips ST_TR 11.23 1.86
tblVehicleTrips ST_TR 42.04 0.00
tblTripsAndVMT WorkerTripNumber 44.00 0.00
tblVehicleTrips ST_TR 7.16 0.00
tblProjectCharacteristics CO2IntensityFactor 641.35 499.66
tblProjectCharacteristics OperationalYear 2014 2020
tblLandUse Population 572.00 550.00
tblOffRoadEquipment OffRoadEquipmentUnitAmount 1.00 0.00
tblLandUse LotAcreage 5.26 1.00
tblLandUse LotAcreage 0.57 0.30
tblLandUse LotAcreage 1.72 1.00
tblLandUse LotAcreage 0.63 0.00
tblLandUse LandUseSquareFeet 200,000.00 111,146.00
tblLandUse LotAcreage 1.38 0.90
tblFireplaces NumberNoFireplace 62.00 200.00
tblFireplaces NumberWood 28.00 0.00
tblAreaCoating Area_Nonresidential_Interior 282000 240000
tblFireplaces NumberGas 110.00 0.00
tblArchitecturalCoating ConstArea_Residential_Interior 225,071.00 0.00
tblAreaCoating Area_Nonresidential_Exterior 94000 81680
tblArchitecturalCoating ConstArea_Nonresidential_Interior 282,000.00 0.00
tblArchitecturalCoating ConstArea_Residential_Exterior 75,024.00 0.00
Table Name Column Name Default Value New Value
tblArchitecturalCoating ConstArea_Nonresidential_Exterior 94,000.00 0.00
Energy Mitigation - Exceed Title 24: 25% improvement is based on compliance with 2013 Title 24 (versus 2008 Title 24) + project design guidelines note 20% improvement beyond thatWaste Mitigation - 75% waste diversion consistent with AB 341 (not mitigation)
Water Mitigation - 20% indoor and 20% outdoor water reduction by 2020

Page 3 of 9
tblVehicleTrips WD_TR 27.49 1.86
tblVehicleTrips WD_TR 44.32 0.00
tblVehicleTrips WD_TR 6.59 0.00

Page 4 of 9
0.00 21.85 20.42 1.16 37.34 20.340.00 2.55 1.52 0.00 2.55 2.15
NBio-CO2 Total CO2 CH4 N20 CO2e
Percent Reduction
0.75 19.05 1.43 6.06
Exhaust PM10
PM10 Total
Fugitive PM2.5
Exhaust PM2.5
PM2.5 Total
Bio- CO2ROG NOx CO SO2 Fugitive PM10
260.4963 2,901.6605
3,162.1568 1.3273 0.0250 3,197.7719
1.3746 1.9665 3.3411 0.3714 1.9646 2.3360Total 9.8042 2.8351 34.5070 0.0630
1,509.6724
1,509.6724 0.0543 1,510.8129
1.3746 0.0242 1.3989 0.3714 0.0224 0.3938Mobile 0.6909 1.3510 6.2973 0.0200
1,362.2274
1,362.2274 0.0261 0.0250 1,370.5177
0.0863 0.0863 0.0863 0.0863Energy 0.1249 1.1159 0.8123 6.8100e-003
260.4963 29.7608 290.2571 1.2469 0.0000 316.44141.8560 1.8560 1.8560 1.8560Area 8.9884 0.3682 27.3975 0.0362
Total CO2 CH4 N2O CO2e
Category lb/day lb/day
PM10 Total
Fugitive PM2.5
Exhaust PM2.5
Mitigated OperationalROG NOx CO SO2 Fugitive
PM10Exhaust PM10
260.4963 3,713.1589
3,973.6551
PM2.5 Total
Bio- CO2 NBio- CO2
1.3428 0.0399 4,014.2089
1.3746 2.0179 3.3925 0.3714 2.0160 2.3874Total 9.8786 3.5021 35.0071 0.0670
1,509.6724
1,509.6724 0.0543 1,510.8129
1.3746 0.0242 1.3989 0.3714 0.0224 0.3938Mobile 0.6909 1.3510 6.2973 0.0200
2,173.7257
2,173.7257 0.0417 0.0399 2,186.9546
0.1377 0.1377 0.1377 0.1377Energy 0.1993 1.7829 1.3123 0.0109
260.4963 29.7608 290.2571 1.2469 0.0000 316.44141.8560 1.8560 1.8560 1.8560Area 8.9884 0.3682 27.3975 0.0362
Total CO2 CH4 N2O CO2e
Category lb/day lb/day
PM10 Total
Fugitive PM2.5
Exhaust PM2.5
Unmitigated OperationalROG NOx CO SO2 Fugitive
PM10Exhaust PM10
PM2.5 Total
Bio- CO2 NBio- CO2
2.2 Overall Operational2.0 Emissions Summary

Page 5 of 9
64.40 19.00 45 40 15
88.60 5.00 92 7 1
Strip Mall 9.50 7.30 7.30 16.60
88.60 5.00 92 7 1
Junior College (2Yr) 9.50 7.30 7.30 6.40
0.00 0.00 0 0 0
Junior College (2Yr) 9.50 7.30 7.30 6.40
29.10 44.80 86 11 3
Enclosed Parking with Elevator 9.50 7.30 7.30 0.00
H-S or C-C H-O or C-NW Primary Diverted Pass-by
Apartments Mid Rise 12.40 4.30 5.40 26.10
4.3 Trip Type Information
Miles Trip % Trip Purpose %
Land Use H-W or C-W H-S or C-C H-O or C-NW H-W or C-W
Total 251.10 251.10 251.10 637,678 637,678Strip Mall 0.00 0.00 0.00
Junior College (2Yr) 111.60 111.60 111.60 283,412 283,412Junior College (2Yr) 139.50 139.50 139.50 354,265 354,265
Enclosed Parking with Elevator 0.00 0.00 0.00
Annual VMT
Apartments Mid Rise 0.00 0.00 0.00
4.2 Trip Summary Information
Average Daily Trip Rate Unmitigated MitigatedLand Use Weekday Saturday Sunday Annual VMT
1,509.6724
1,509.6724 0.0543 1,510.8129
1.3746 0.0242 1.3989 0.3714 0.0224 0.3938Unmitigated 0.6909 1.3510 6.2973 0.0200
1,509.6724
1,509.6724 0.0543 1,510.8129
1.3746 0.0242 1.3989 0.3714 0.0224 0.3938Mitigated 0.6909 1.3510 6.2973 0.0200
NBio- CO2 Total CO2 CH4 N2O CO2e
Category lb/day lb/day
Exhaust PM10
PM10 Total
4.0 Operational Detail - Mobile
4.1 Mitigation Measures Mobile
ROG NOx CO SO2 Fugitive PM10
Fugitive PM2.5
Exhaust PM2.5
PM2.5 Total
Bio- CO2

Page 6 of 9
695.2458 695.2458 0.0133 0.0128 699.47690.0440 0.0440 0.0440 0.0440Junior College (2Yr)
5909.59 0.0637 0.5794 0.4867 3.4800e-003
0.0000 0.0000 0.0000 0.0000 0.00000.0000 0.0000 0.0000 0.0000Enclosed Parking with Elevator
0 0.0000 0.0000 0.0000 0.0000
N2O CO2e
Land Use kBTU/yr lb/day lb/day
Exhaust PM10
PM2.5 Total
Bio- CO2
2,186.9546
5.2 Energy by Land Use - NaturalGasUnmitigated
NaturalGas Use
NBio- CO2 Total CO2 CH4ROG NOx CO SO2 Fugitive PM10
0.13770.1377
PM10 Total
Fugitive PM2.5
Exhaust PM2.5
2,173.7257
2,173.7257 0.0417 0.03990.0109 0.1377 0.1377
1,362.2274
1,362.2274 0.0261 0.0250 1,370.5177
NaturalGas Unmitigated
0.1993 1.7829 1.3123
0.0863 0.0863 0.0863 0.0863
Category lb/day lb/day
NaturalGas Mitigated
0.1249 1.1159 0.8123 6.8100e-003
Bio- CO2 NBio- CO2 Total CO2 CH4 N2O CO2eFugitive PM10
Exhaust PM10
PM10 Total
Fugitive PM2.5
Exhaust PM2.5
PM2.5 Total
4.4 Fleet MixHistorical Energy Use: N
5.1 Mitigation Measures Energy
Exceed Title 24
ROG NOx CO SO2
0.003129 0.010899 0.010305 0.000529 0.000500
5.0 Energy Detail
SBUS MH
0.631289 0.058518 0.148045 0.077273 0.026007 0.003276 0.026188 0.004043
LHD2 MHD HHD OBUS UBUS MCYLDA LDT1 LDT2 MDV LHD1

Page 7 of 9
NBio- CO2 Total CO2 CH4 N2O CO2e
Category lb/day lb/day
Exhaust PM10
PM10 Total
6.0 Area Detail
6.1 Mitigation Measures Area
ROG NOx CO SO2 Fugitive PM10
1,362.2274 1,362.2274
Fugitive PM2.5
Exhaust PM2.5
PM2.5 Total
Bio- CO2
0.0261 0.0250 1,370.5177
0.0863 0.0863 0.0863 0.0863Total 0.1249 1.1159 0.8123 6.8100e-003
385.3023 385.3023 7.3800e-003
7.0600e-003
387.64720.0244 0.0244 0.0244 0.0244Apartments Mid Rise
3.27507 0.0353 0.3018 0.1284 1.9300e-003
25.4633 25.4633 4.9000e-004
4.7000e-004
25.61831.6100e-003
1.6100e-003
1.6100e-003
1.6100e-003
Strip Mall 0.216438 2.3300e-003
0.0212 0.0178 1.3000e-004
528.5899 528.5899 0.0101 9.6900e-003
531.80680.0335 0.0335 0.0335 0.0335Junior College (2Yr)
4.49301 0.0485 0.4405 0.3700 2.6400e-003
422.8719 422.8719 8.1100e-003
7.7500e-003
425.44540.0268 0.0268 0.0268 0.0268Junior College (2Yr)
3.59441 0.0388 0.3524 0.2960 2.1100e-003
0.0000 0.0000 0.0000 0.0000 0.00000.0000 0.0000 0.0000 0.0000Enclosed Parking with Elevator
0 0.0000 0.0000 0.0000 0.0000
Total CO2 CH4 N2O CO2e
Land Use kBTU/yr lb/day lb/day
PM10 Total
Fugitive PM2.5
Mitigated
NaturalGas Use
ROG NOx CO SO2 Fugitive PM10
Exhaust PM10
2,173.7257
Exhaust PM2.5
PM2.5 Total
Bio- CO2 NBio- CO2
2,173.7257
0.0417 0.0399 2,186.9546
0.1377 0.1377 0.1377 0.1377Total 0.1993 1.7829 1.3123 0.0109
570.7442 570.7442 0.0109 0.0105 574.21770.0362 0.0362 0.0362 0.0362Apartments Mid Rise
4851.33 0.0523 0.4471 0.1903 2.8500e-003
38.6785 38.6785 7.4000e-004
7.1000e-004
38.91392.4500e-003
2.4500e-003
2.4500e-003
2.4500e-003
Strip Mall 328.767 3.5500e-003
0.0322 0.0271 1.9000e-004
869.0572 869.0572 0.0167 0.0159 874.34620.0550 0.0550 0.0550 0.0550Junior College (2Yr)
7386.99 0.0797 0.7242 0.6083 4.3500e-003

Page 8 of 9
29.7608 29.7608 0.0291 30.37200.0911 0.0911 0.0911 0.0911Landscaping 0.5063 0.1917 16.5787 8.7000e-004
260.4963 0.0000 260.4963 1.2178 0.0000 286.06941.7649 1.7649 1.7649 1.7649Hearth 1.1913 0.1765 10.8187 0.0353
0.0000 0.00000.0000 0.0000 0.0000 0.0000Consumer Products
6.4017
0.0000 0.00000.0000 0.0000 0.0000 0.0000Architectural Coating
0.8891
Total CO2 CH4 N2O CO2e
SubCategory lb/day lb/day
PM10 Total
Fugitive PM2.5
Exhaust PM2.5
Mitigated
ROG NOx CO SO2 Fugitive PM10
Exhaust PM10
260.4963 29.7608 290.2571
PM2.5 Total
Bio- CO2 NBio- CO2
1.2469 0.0000 316.44141.8560 1.8560 1.8560 1.8560Total 8.9884 0.3682 27.3975 0.0362
29.7608 29.7608 0.0291 30.37200.0911 0.0911 0.0911 0.0911Landscaping 0.5063 0.1917 16.5787 8.7000e-004
260.4963 0.0000 260.4963 1.2178 0.0000 286.06941.7649 1.7649 1.7649 1.7649Hearth 1.1913 0.1765 10.8187 0.0353
0.0000 0.00000.0000 0.0000 0.0000 0.0000Consumer Products
6.4017
0.0000 0.00000.0000 0.0000 0.0000 0.0000Architectural Coating
0.8891
Total CO2 CH4 N2O CO2e
SubCategory lb/day lb/day
PM10 Total
Fugitive PM2.5
Exhaust PM2.5
Unmitigated
ROG NOx CO SO2 Fugitive PM10
Exhaust PM10
260.4963 29.7608 290.2571
PM2.5 Total
Bio- CO2 NBio- CO2
6.2 Area by SubCategory
1.2469 0.0000 316.44141.8560 1.8560 1.8560 1.8560Unmitigated 8.9884 0.3682 27.3975 0.0362
260.4963 29.7608 290.2571 1.2469 0.0000 316.44141.8560 1.8560 1.8560 1.8560Mitigated 8.9884 0.3682 27.3975 0.0362

Page 9 of 9
Load Factor Fuel Type
10.0 Vegetation
9.0 Operational Offroad
Equipment Type Number Hours/Day Days/Year Horse Power
7.0 Water Detail
7.1 Mitigation Measures Water
Apply Water Conservation Strategy
8.0 Waste Detail
8.1 Mitigation Measures Waste
Institute Recycling and Composting Services
260.4963 29.7608 290.2571 1.2469 0.0000 316.44141.8560 1.8560 1.8560 1.8560Total 8.9884 0.3682 27.3975 0.0362
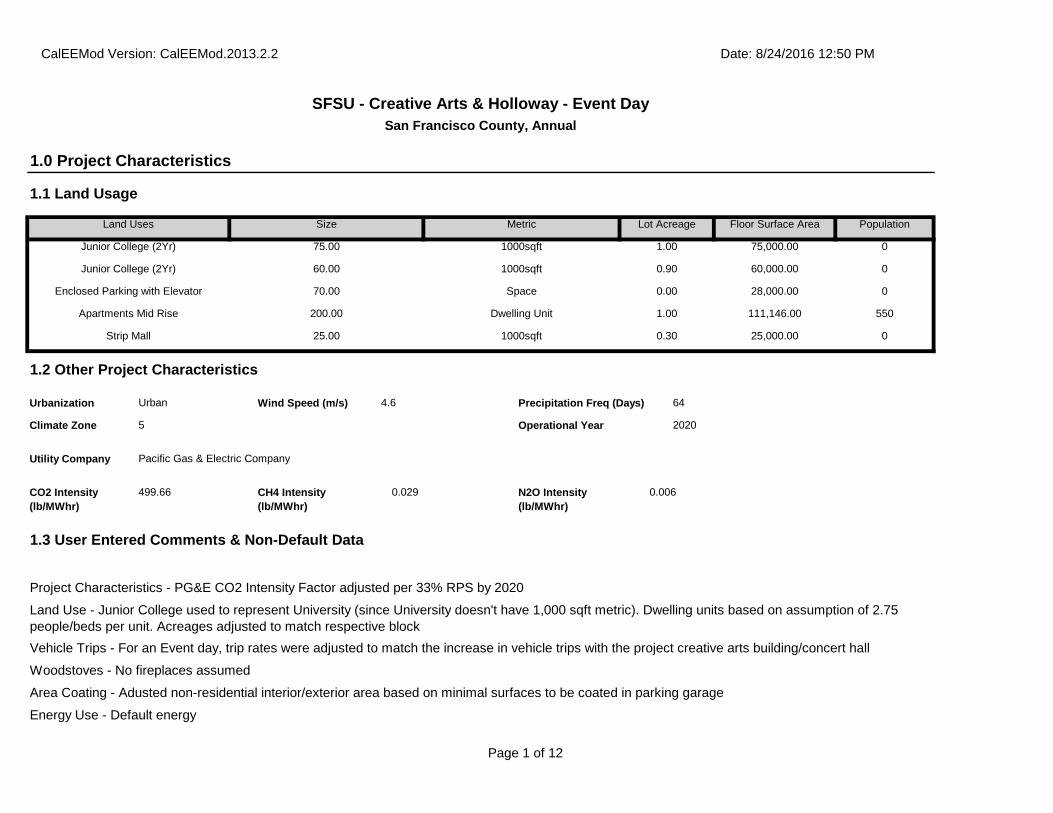
Page 1 of 12
1.3 User Entered Comments & Non-Default Data
Project Characteristics - PG&E CO2 Intensity Factor adjusted per 33% RPS by 2020
Land Use - Junior College used to represent University (since University doesn't have 1,000 sqft metric). Dwelling units based on assumption of 2.75 people/beds per unit. Acreages adjusted to match respective block
Woodstoves - No fireplaces assumed
CO2 Intensity (lb/MWhr)
499.66 CH4 Intensity (lb/MWhr)
0.029 N2O Intensity (lb/MWhr)
0.006
64
Climate Zone 5 Operational Year 2020
Utility Company Pacific Gas & Electric Company
1.2 Other Project Characteristics
Urbanization Urban Wind Speed (m/s) 4.6 Precipitation Freq (Days)
Strip Mall 25.00 1000sqft 0.30 25,000.00 0
Apartments Mid Rise 200.00 Dwelling Unit 1.00 111,146.00 550
Enclosed Parking with Elevator 70.00 Space 0.00 28,000.00 0
Junior College (2Yr) 60.00 1000sqft 0.90 60,000.00 0
Population
Junior College (2Yr) 75.00 1000sqft 1.00 75,000.00 0
1.1 Land Usage
Land Uses Size Metric Lot Acreage Floor Surface Area
CalEEMod Version: CalEEMod.2013.2.2 Date: 8/24/2016 12:50 PM
SFSU - Creative Arts & Holloway - Event DaySan Francisco County, Annual
1.0 Project Characteristics
Vehicle Trips - For an Event day, trip rates were adjusted to match the increase in vehicle trips with the project creative arts building/concert hall
Area Coating - Adusted non-residential interior/exterior area based on minimal surfaces to be coated in parking garage
Energy Use - Default energy

Page 2 of 12
tblVehicleTrips SU_TR 1.21 1.86
tblVehicleTrips SU_TR 20.43 0.00
tblVehicleTrips ST_TR 42.04 0.00
tblVehicleTrips SU_TR 6.07 0.00
tblVehicleTrips ST_TR 7.16 0.00
tblVehicleTrips ST_TR 11.23 1.86
tblProjectCharacteristics OperationalYear 2014 2020
tblTripsAndVMT WorkerTripNumber 44.00 0.00
tblOffRoadEquipment OffRoadEquipmentUnitAmount 1.00 0.00
tblProjectCharacteristics CO2IntensityFactor 641.35 499.66
tblLandUse LotAcreage 0.57 0.30
tblLandUse Population 572.00 550.00
tblLandUse LotAcreage 0.63 0.00
tblLandUse LotAcreage 5.26 1.00
tblLandUse LotAcreage 1.38 0.90
tblLandUse LotAcreage 1.72 1.00
tblFireplaces NumberWood 28.00 0.00
tblLandUse LandUseSquareFeet 200,000.00 111,146.00
tblFireplaces NumberGas 110.00 0.00
tblFireplaces NumberNoFireplace 62.00 200.00
tblAreaCoating Area_Nonresidential_Exterior 94000 81680
tblAreaCoating Area_Nonresidential_Interior 282000 240000
tblArchitecturalCoating ConstArea_Residential_Exterior 75,024.00 0.00
tblArchitecturalCoating ConstArea_Residential_Interior 225,071.00 0.00
tblArchitecturalCoating ConstArea_Nonresidential_Exterior 94,000.00 0.00
tblArchitecturalCoating ConstArea_Nonresidential_Interior 282,000.00 0.00
Energy Mitigation - Exceed Title 24: 25% improvement is based on compliance with 2013 Title 24 (versus 2008 Title 24) + project design guidelines note 20% improvement beyond that
Table Name Column Name Default Value New Value
Waste Mitigation - 75% waste diversion consistent with AB 341 (not mitigation)
Water Mitigation - 20% indoor and 20% outdoor water reduction by 2020

Page 3 of 12
tblVehicleTrips WD_TR 44.32 0.00
tblVehicleTrips WD_TR 6.59 0.00
27.49 1.86tblVehicleTrips WD_TR

Page 4 of 1268.04 17.99 20.53 65.10 22.14 23.340.00 19.82 3.25 0.00 19.96 8.35
NBio-CO2 Total CO2 CH4 N20 CO2e
Percent Reduction
0.88 20.02 3.08 12.96
Exhaust PM10
PM10 Total
Fugitive PM2.5
Exhaust PM2.5
PM2.5 Total
Bio- CO2ROG NOx CO SO2 Fugitive PM10
21.6435 1,040.2520
1,061.8955 1.4965 0.0243 1,100.8466
0.2409 0.0379 0.2789 0.0653 0.0376 0.1029Total 1.5287 0.4863 2.8683 4.9700e-003
5.4578 31.8414 37.2993 0.5624 0.0136 53.33190.0000 0.0000 0.0000 0.0000Water
14.9072 0.0000 14.9072 0.8810 0.0000 33.40790.0000 0.0000 0.0000 0.0000Waste
0.0000 237.7586 237.7586 8.9600e-003
0.0000 237.94680.2409 4.4100e-003
0.2454 0.0653 4.0700e-003
0.0694Mobile 0.1234 0.2644 1.1694 3.4600e-003
0.0000 768.2221 768.2221 0.0358 0.0107 772.27630.0158 0.0158 0.0158 0.0158Energy 0.0228 0.2037 0.1482 1.2400e-003
1.2785 2.4299 3.7084 8.3500e-003
0.0000 3.88380.0178 0.0178 0.0178 0.0178Area 1.3826 0.0182 1.5506 2.7000e-004
Total CO2 CH4 N2O CO2e
Category tons/yr MT/yr
PM10 Total
Fugitive PM2.5
Exhaust PM2.5
Mitigated OperationalROG NOx CO SO2 Fugitive
PM10Exhaust PM10
67.7294 1,268.5137
1,336.2431
PM2.5 Total
Bio- CO2 NBio- CO2
4.2877 0.0312 1,435.9469
0.2409 0.0473 0.2882 0.0653 0.0469 0.1123Total 1.5423 0.6080 2.9595 5.7100e-003
6.8223 42.0044 48.8267 0.7032 0.0171 68.87840.0000 0.0000 0.0000 0.0000Water
59.6286 0.0000 59.6286 3.5240 0.0000 133.63150.0000 0.0000 0.0000 0.0000Waste
0.0000 237.7586 237.7586 8.9600e-003
0.0000 237.94680.2409 4.4100e-003
0.2454 0.0653 4.0700e-003
0.0694Mobile 0.1234 0.2644 1.1694 3.4600e-003
0.0000 986.3208 986.3208 0.0433 0.0141 991.60640.0251 0.0251 0.0251 0.0251Energy 0.0364 0.3254 0.2395 1.9800e-003
1.2785 2.4299 3.7084 8.3500e-003
0.0000 3.88380.0178 0.0178 0.0178 0.0178Area 1.3826 0.0182 1.5506 2.7000e-004
Total CO2 CH4 N2O CO2e
Category tons/yr MT/yr
PM10 Total
Fugitive PM2.5
Exhaust PM2.5
Unmitigated OperationalROG NOx CO SO2 Fugitive
PM10Exhaust PM10
PM2.5 Total
Bio- CO2 NBio- CO2
2.2 Overall Operational2.0 Emissions Summary

Page 5 of 12
64.40 19.00 45 40 15
88.60 5.00 92 7 1
Strip Mall 9.50 7.30 7.30 16.60
88.60 5.00 92 7 1
Junior College (2Yr) 9.50 7.30 7.30 6.40
0.00 0.00 0 0 0
Junior College (2Yr) 9.50 7.30 7.30 6.40
29.10 44.80 86 11 3
Enclosed Parking with Elevator 9.50 7.30 7.30 0.00
H-S or C-C H-O or C-NW Primary Diverted Pass-by
Apartments Mid Rise 12.40 4.30 5.40 26.10
4.3 Trip Type Information
Miles Trip % Trip Purpose %
Land Use H-W or C-W H-S or C-C H-O or C-NW H-W or C-W
Total 251.10 251.10 251.10 637,678 637,678Strip Mall 0.00 0.00 0.00
Junior College (2Yr) 111.60 111.60 111.60 283,412 283,412Junior College (2Yr) 139.50 139.50 139.50 354,265 354,265
Enclosed Parking with Elevator 0.00 0.00 0.00
Annual VMT
Apartments Mid Rise 0.00 0.00 0.00
4.2 Trip Summary Information
Average Daily Trip Rate Unmitigated MitigatedLand Use Weekday Saturday Sunday Annual VMT
0.0000 237.7586 237.7586 8.9600e-003
0.0000 237.94680.2409 4.4100e-003
0.2454 0.0653 4.0700e-003
0.0694Unmitigated 0.1234 0.2644 1.1694 3.4600e-003
0.0000 237.7586 237.7586 8.9600e-003
0.0000 237.94680.2409 4.4100e-003
0.2454 0.0653 4.0700e-003
0.0694Mitigated 0.1234 0.2644 1.1694 3.4600e-003
NBio- CO2 Total CO2 CH4 N2O CO2e
Category tons/yr MT/yr
Exhaust PM10
PM10 Total
4.0 Operational Detail - Mobile
4.1 Mitigation Measures Mobile
ROG NOx CO SO2 Fugitive PM10
Fugitive PM2.5
Exhaust PM2.5
PM2.5 Total
Bio- CO2

Page 6 of 120.00000.0000 0.0000 0.0000 0.0000 0.0000 0.00000.0000 0.0000 0.0000 0.0000Enclosed Parking
with Elevator0 0.0000 0.0000 0.0000
Total CO2 CH4 N2O CO2e
Land Use kBTU/yr tons/yr MT/yr
PM10 Total
Fugitive PM2.5
Unmitigated
NaturalGas Use
ROG NOx CO SO2 Fugitive PM10
Exhaust PM10
359.8847 359.8847
Exhaust PM2.5
PM2.5 Total
Bio- CO2 NBio- CO2
6.9000e-003
6.6000e-003
362.0749
5.2 Energy by Land Use - NaturalGas
0.0251 0.0251 0.0251 0.0251 0.0000
4.3200e-003
4.1300e-003
226.9046
NaturalGas Unmitigated
0.0364 0.3254 0.2395 1.9800e-003
0.0158 0.0158 0.0000 225.5320 225.5320
629.5316
NaturalGas Mitigated
0.0228 0.2037 0.1482 1.2400e-003
0.0158 0.0158
0.0000 0.0000 626.4361 626.4361 0.0364 7.5200e-003
0.0000 0.0000 0.0000
542.6901 542.6901 0.0315 6.5200e-003
545.3717
Electricity Unmitigated
0.0000 0.0000 0.0000 0.0000 0.0000
Category tons/yr MT/yr
Electricity Mitigated
Bio- CO2 NBio- CO2 Total CO2 CH4 N2O CO2eFugitive PM10
Exhaust PM10
PM10 Total
Fugitive PM2.5
Exhaust PM2.5
PM2.5 Total
4.4 Fleet MixHistorical Energy Use: N
5.1 Mitigation Measures Energy
Exceed Title 24
ROG NOx CO SO2
0.003129 0.010899 0.010305 0.000529 0.000500
5.0 Energy Detail
SBUS MH
0.631289 0.058518 0.148045 0.077273 0.026007 0.003276 0.026188 0.004043
LHD2 MHD HHD OBUS UBUS MCYLDA LDT1 LDT2 MDV LHD1

Page 7 of 12
164.6878
Land Use kWh/yr to
MT/yr
Apartments Mid Rise
723070 163.8780 9.5100e-003
1.9700e-003
Unmitigated
Electricity Use
Total CO2 CH4 N2O CO2e
4.3200e-003
4.1300e-003
226.9046
5.3 Energy by Land Use - Electricity
0.0157 0.0157 0.0157
1.1700e-003
64.1793
Total 0.0228 0.2037 0.1482 225.5320 225.53201.2400e-003
4.4500e-003
4.4500e-003
0.0000 63.7911
0.0157 0.0000
63.7911 1.2200e-003
0.0234 3.5000e-004
4.4500e-003
4.4500e-003
4.2157 4.2157 8.0000e-005
8.0000e-005
4.2414
Apartments Mid Rise
1.1954e+006
6.4500e-003
0.0551
2.9000e-004
2.9000e-004
2.9000e-004
2.9000e-004
0.0000
1.6000e-003
88.0466
Strip Mall 79000 4.3000e-004
3.8700e-003
3.2500e-003
2.0000e-005
6.1100e-003
6.1100e-003
0.0000 87.5140 87.5140 1.6800e-003
0.0675 4.8000e-004
6.1100e-003
6.1100e-003
70.0112 70.0112 1.3400e-003
1.2800e-003
70.4373
Junior College (2Yr)
1.63995e+006
8.8400e-003
0.0804
4.8900e-003
4.8900e-003
4.8900e-003
4.8900e-003
0.0000
0.0000 0.0000
Junior College (2Yr)
1.31196e+006
7.0700e-003
0.0643 0.0540 3.9000e-004
0.0000 0.0000 0.0000 0.0000 0.0000 0.00000.0000 0.0000 0.0000 0.0000
CO2e
Land Use kBTU/yr tons/yr MT/yr
Enclosed Parking with Elevator
0 0.0000 0.0000
PM2.5 Total
Bio- CO2 NBio- CO2 Total CO2 CH4 N2OSO2 Fugitive PM10
Exhaust PM10
PM10 Total
Fugitive PM2.5
Exhaust PM2.5
NaturalGas Use
ROG NOx CO
6.6000e-003
362.0749
Mitigated
0.0251 0.0251 0.0251
95.0682
Total 0.0364 0.3254 0.2395 1.9800e-003
359.8847 6.9000e-003
0.0251
6.6000e-003
0.0000 94.4931 94.4931
0.0000 359.8847
1.8100e-003
1.7300e-003
5.2000e-004
6.6000e-003
6.6000e-003
6.6000e-003
6.4037 1.2000e-004
1.2000e-004
6.4426
Apartments Mid Rise
1.77073e+006
9.5500e-003
0.0816 0.0347
4.5000e-004
4.5000e-004
4.5000e-004
0.0000 6.4037
144.7578
Strip Mall 120000 6.5000e-004
5.8800e-003
4.9400e-003
4.0000e-005
4.5000e-004
0.0100 0.0000 143.8822 143.8822 2.7600e-003
2.6400e-003
7.9000e-004
0.0100 0.0100 0.0100
115.1057 2.2100e-003
2.1100e-003
115.8063
Junior College (2Yr)
2.69625e+006
0.0145 0.1322 0.1110
8.0400e-003
8.0400e-003
8.0400e-003
0.0000 115.1057Junior College (2Yr)
2.157e+006
0.0116 0.1057 0.0888 6.3000e-004
8.0400e-003

Page 8 of 12
NBio- CO2 Total CO2 CH4 N2O CO2eExhaust PM10
PM10 Total
Fugitive PM2.5
Exhaust PM2.5
PM2.5 Total
Bio- CO2
6.0 Area Detail
6.1 Mitigation Measures Area
ROG NOx CO SO2 Fugitive PM10
59.8672
Total 542.6901 0.0315 6.5200e-003
545.3717
Strip Mall 262850 59.5728 3.4600e-003
7.2000e-004
130.4529
Junior College (2Yr)
715950 162.2643 9.4200e-003
1.9500e-003
163.0661
Junior College (2Yr)
572760 129.8115 7.5300e-003
1.5600e-003
159.0019
Enclosed Parking with Elevator
144816 32.8214 1.9000e-003
3.9000e-004
32.9836
Land Use kWh/yr to
MT/yr
Apartments Mid Rise
698106 158.2201 9.1800e-003
1.9000e-003
Mitigated
Electricity Use
Total CO2 CH4 N2O CO2e
66.1079
Total 626.4361 0.0364 7.5200e-003
629.5316
Strip Mall 290250 65.7828 3.8200e-003
7.9000e-004
158.1123
197.6404Junior College (2Yr)
867750 196.6686 0.0114 2.3600e-003
Junior College (2Yr)
694200 157.3349 9.1300e-003
1.8900e-003
Enclosed Parking with Elevator
188720 42.7719 2.4800e-003
5.1000e-004
42.9832
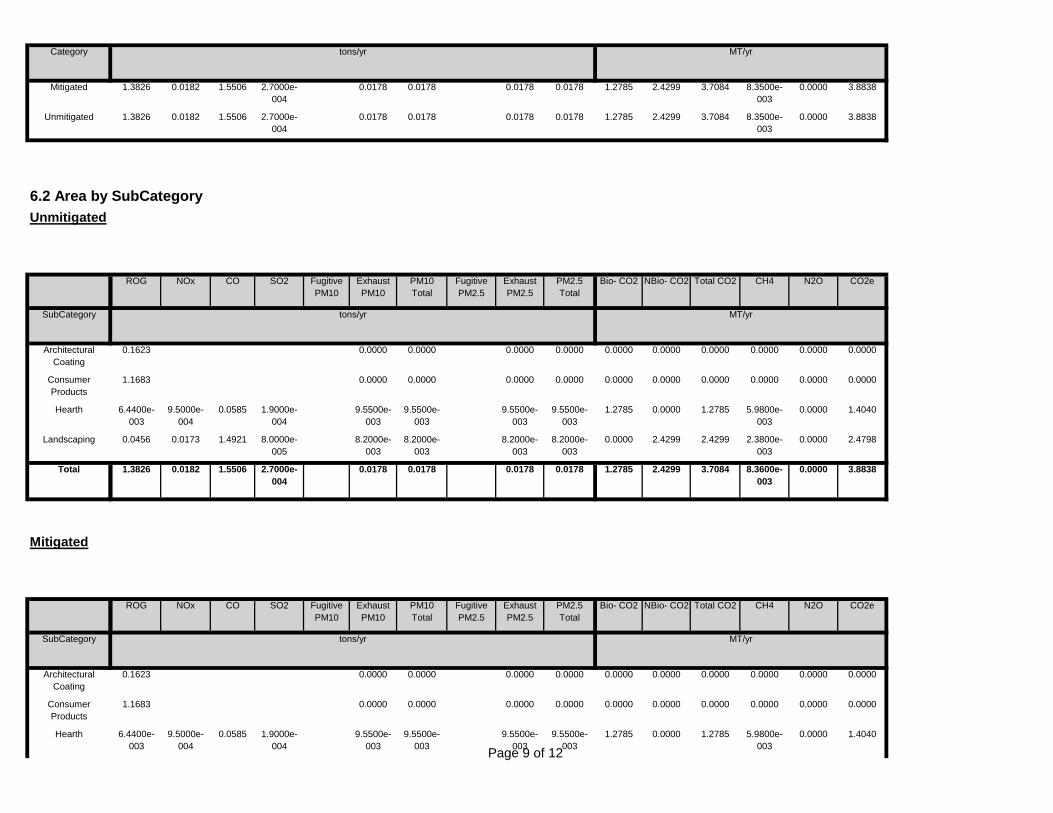
Page 9 of 121.2785 0.0000 1.2785 5.9800e-
0030.0000 1.40409.5500e-
0039.5500e-
0039.5500e-
0039.5500e-
003Hearth 6.4400e-
0039.5000e-
0040.0585 1.9000e-
004
0.0000 0.0000 0.0000 0.0000 0.0000 0.00000.0000 0.0000 0.0000 0.0000Consumer Products
1.1683
0.0000 0.0000 0.0000 0.0000 0.0000 0.00000.0000 0.0000 0.0000 0.0000Architectural Coating
0.1623
Total CO2 CH4 N2O CO2e
SubCategory tons/yr MT/yr
PM10 Total
Fugitive PM2.5
Exhaust PM2.5
Mitigated
ROG NOx CO SO2 Fugitive PM10
Exhaust PM10
1.2785 2.4299 3.7084
PM2.5 Total
Bio- CO2 NBio- CO2
8.3600e-003
0.0000 3.88380.0178 0.0178 0.0178 0.0178Total 1.3826 0.0182 1.5506 2.7000e-004
0.0000 2.4299 2.4299 2.3800e-003
0.0000 2.47988.2000e-003
8.2000e-003
8.2000e-003
8.2000e-003
Landscaping 0.0456 0.0173 1.4921 8.0000e-005
1.2785 0.0000 1.2785 5.9800e-003
0.0000 1.40409.5500e-003
9.5500e-003
9.5500e-003
9.5500e-003
Hearth 6.4400e-003
9.5000e-004
0.0585 1.9000e-004
0.0000 0.0000 0.0000 0.0000 0.0000 0.00000.0000 0.0000 0.0000 0.0000Consumer Products
1.1683
0.0000 0.0000 0.0000 0.0000 0.0000 0.00000.0000 0.0000 0.0000 0.0000Architectural Coating
0.1623
Total CO2 CH4 N2O CO2e
SubCategory tons/yr MT/yr
PM10 Total
Fugitive PM2.5
Exhaust PM2.5
Unmitigated
ROG NOx CO SO2 Fugitive PM10
Exhaust PM10
1.2785 2.4299 3.7084
PM2.5 Total
Bio- CO2 NBio- CO2
6.2 Area by SubCategory
8.3500e-003
0.0000 3.88380.0178 0.0178 0.0178 0.0178Unmitigated 1.3826 0.0182 1.5506 2.7000e-004
1.2785 2.4299 3.7084 8.3500e-003
0.0000 3.88380.0178 0.0178 0.0178 0.0178Mitigated 1.3826 0.0182 1.5506 2.7000e-004
Category tons/yr MT/yr

Page 10 of 12
68.8784Total 48.8267 0.7032 0.0171
24.6280
Strip Mall 1.85181 / 1.13498
3.7588 0.0605 1.4600e-003
5.4833
Junior College (2Yr)
6.62162 / 10.3569
18.4368 0.2167 5.2900e-003
38.7671
Enclosed Parking with Elevator
0 / 0 0.0000 0.0000 0.0000 0.0000
Land Use Mgal to
MT/yr
Apartments Mid Rise
13.0308 / 8.21507
26.6311 0.4259 0.0103
7.2 Water by Land UseUnmitigated
Indoor/Outdoor Use
Total CO2 CH4 N2O CO2e
Unmitigated 48.8267 0.7032 0.0171 68.8784
Category ton
MT/yr
Mitigated 37.2993 0.5624 0.0136 53.3319
7.0 Water Detail
7.1 Mitigation Measures Water
Apply Water Conservation Strategy
Total CO2 CH4 N2O CO2e
1.2785 2.4299 3.7084 8.3600e-003
0.0000 3.88380.0178 0.0178 0.0178 0.0178Total 1.3826 0.0182 1.5506 2.7000e-004
0.0000 2.4299 2.4299 2.3800e-003
0.0000 2.47988.2000e-003
8.2000e-003
8.2000e-003
8.2000e-003
Landscaping 0.0456 0.0173 1.4921 8.0000e-005

Page 11 of 128.2 Waste by Land Use
Mitigated 14.9072 0.8810 0.0000 33.4079
CO2e
ton
MT/yr
Unmitigated 59.6286 3.5240 0.0000 133.6315
53.3319
8.0 Waste Detail
8.1 Mitigation Measures Waste
Institute Recycling and Composting Services
Category/Year
Total CO2 CH4 N2O
Total 37.2993 0.5624 0.0136
19.1571
Strip Mall 1.48145 / 0.907986
2.8553 0.0484 1.1700e-003
4.2342
Junior College (2Yr)
5.2973 / 8.28551
14.2068 0.1733 4.2300e-003
29.9406
Enclosed Parking with Elevator
0 / 0 0.0000 0.0000 0.0000 0.0000
Land Use Mgal to
MT/yr
Apartments Mid Rise
10.4246 / 6.57206
20.2371 0.3407 8.2200e-003
Mitigated
Indoor/Outdoor Use
Total CO2 CH4 N2O CO2e
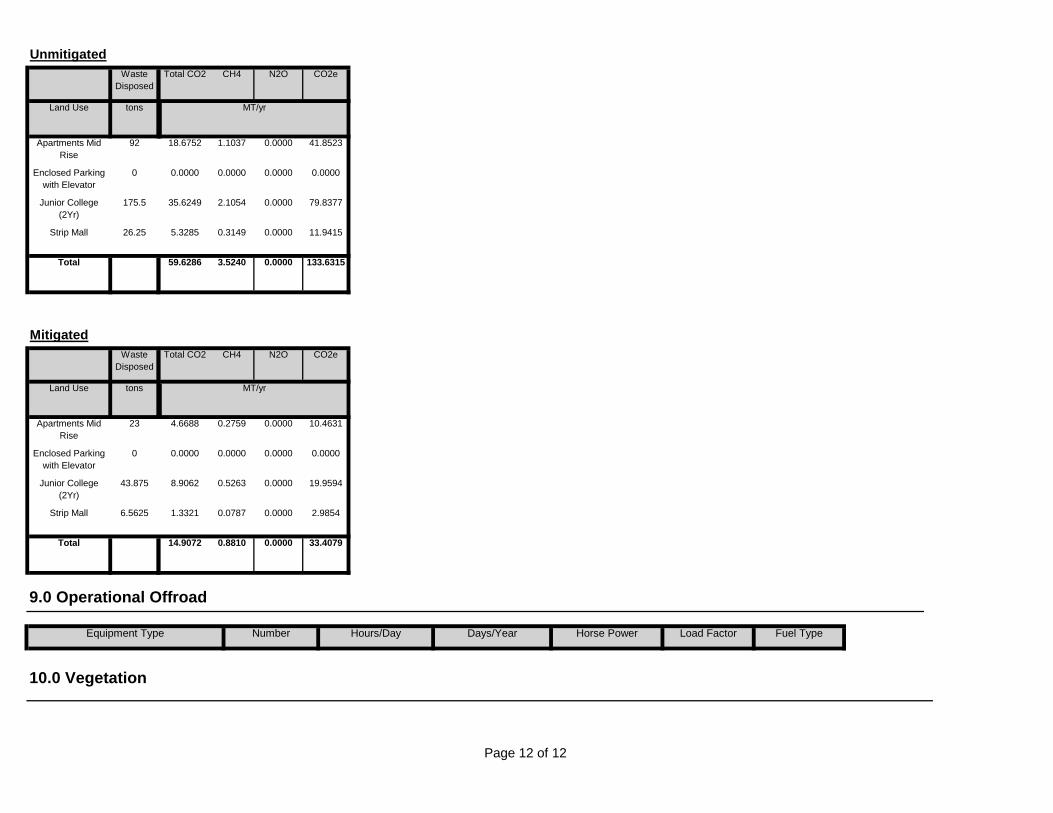
Page 12 of 12
Horse Power Load Factor Fuel Type
10.0 Vegetation
33.4079
9.0 Operational Offroad
Equipment Type Number Hours/Day Days/Year
Total 14.9072 0.8810 0.0000
19.9594
Strip Mall 6.5625 1.3321 0.0787 0.0000 2.9854
Junior College (2Yr)
43.875 8.9062 0.5263 0.0000
10.4631
Enclosed Parking with Elevator
0 0.0000 0.0000 0.0000 0.0000
Land Use tons to
MT/yr
Apartments Mid Rise
23 4.6688 0.2759 0.0000
133.6315
MitigatedWaste
DisposedTotal CO2 CH4 N2O CO2e
Total 59.6286 3.5240 0.0000
79.8377
Strip Mall 26.25 5.3285 0.3149 0.0000 11.9415
Junior College (2Yr)
175.5 35.6249 2.1054 0.0000
41.8523
Enclosed Parking with Elevator
0 0.0000 0.0000 0.0000 0.0000
Land Use tons to
MT/yr
Apartments Mid Rise
92 18.6752 1.1037 0.0000
UnmitigatedWaste
DisposedTotal CO2 CH4 N2O CO2e

Page 1 of 4
CalEEMod Version: CalEEMod.2013.2.2
Date: 8/24/2016 12:56 PM
SFSU - Creative Arts & Holloway - Event DaySan Francisco County, Mitigation Report
Operational Percent Reduction Summary
Category ROG NOx CO SO2Exhaust PM10
Exhaust PM2.5 Bio- CO2 NBio- CO2
Total CO2 CH4 N2O CO2e
Percent Reduction
Architectural Coating 0.00 0.00 0.00 0.00 0.00 0.00 0.00 0.00 0.00 0.00 0.00 0.00
Consumer Products 0.00 0.00 0.00 0.00 0.00 0.00 0.00 0.00 0.00 0.00 0.00 0.00
Electricity 0.00 0.00 0.00 0.00 0.00 0.00 0.00 13.37 13.37 13.37 13.30 13.37
Hearth 0.00 0.00 0.00 0.00 0.00 0.00 0.00 0.00 0.00 0.00 0.00 0.00
Landscaping 0.00 0.00 0.00 0.00 0.00 0.00 0.00 0.00 0.00 0.00 0.00 0.00
Mobile 0.00 0.00 0.00 0.00 0.00 0.00 0.00 0.00 0.00 0.00 0.00 0.00
Natural Gas 37.34 37.41 38.10 37.37 37.37 37.37 0.00 37.33 37.33 37.39 37.42 37.33
Water Indoor 0.00 0.00 0.00 0.00 0.00 0.00 20.00 24.20 23.61 20.01 20.12 22.57
Water Outdoor 0.00 0.00 0.00 0.00 0.00 0.00 0.00 0.00 0.00 0.00 0.00 0.00
Operational Mobile Mitigation
Project Setting:
Mitigation S l t d
Category Measure % Reduction Input Value 1 Input Value 2
Increase Diversity 0.27 0.60
Input Value 3
No Land Use Increase Density 0.00
No Land Use Improve Walkability Design 0.00
No Land Use

Page 2 of 4
No Land Use Improve Destination Accessibility 0.00
Integrate Below Market Rate Housing 0.00
No Land Use Increase Transit Accessibility 0.25
Land Use Land Use SubTotal 0.00
No Land Use
No Neighborhood Enhancements Improve Pedestrian Network
Implement NEV Network 0.00
No Neighborhood Enhancements Provide Traffic Calming Measures
Neighborhood Enhancements Neighborhood Enhancements Subtotal 0.00
No Neighborhood Enhancements
No Parking Policy Pricing Limit Parking Supply 0.00
On-street Market Pricing 0.00
No Parking Policy Pricing Unbundle Parking Costs 0.00
Parking Policy Pricing Parking Policy Pricing Subtotal 0.00
No Parking Policy Pricing
No Transit Improvements Provide BRT System 0.00
Increase Transit Frequency 0.00
No Transit Improvements Expand Transit Network 0.00
Transit Improvements Transit Improvements Subtotal 0.00
No Transit Improvements
Land Use and Site Enhancement Subtotal 0.00
Transit Subsidy
No Commute Implement Trip Reduction Program
No Commute Implement Employee Parking "Cash Out"
No Commute
No Commute Workplace Parking Charge
Market Commute Trip Reduction Option 0.00
No Commute Encourage Telecommuting and Alternative Work Schedules
0.00
No Commute Employee Vanpool/Shuttle 0.00 2.00
No Commute
No Commute Provide Ride Sharing Program

Page 3 of 4
Implement School Bus Program 0.00
Commute Commute Subtotal 0.00
Total VMT Reduction 0.00
No School Trip
Area Mitigation
Measure Implemented Mitigation Measure Input Value
No Only Natural Gas Hearth
No No Hearth
No Use Low VOC Cleaning Supplies
No Use Low VOC Paint (Residential Interior) 100.00
No Use Low VOC Paint (Residential Exterior) 150.00
No Use Low VOC Paint (Non-residential Interior) 100.00
No Use Low VOC Paint (Non-residential Exterior) 150.00
No % Electric Lawnmower
No % Electric Leafblower
No % Electric Chainsaw
Energy Mitigation Measures
Measure Implemented Mitigation Measure Input Value 1 Input Value 2
Yes Exceed Title 24 40.00
No Install High Efficiency Lighting 0.00
No On-site Renewable 0.00 0.00
Appliance Type Land Use Subtype % Improvement
ClothWasher 30.00
DishWasher 15.00
Fan 50.00

Page 4 of 4
Refrigerator 15.00
Water Mitigation Measures
Measure Implemented Mitigation Measure Input Value 1 Input Value 2
Yes Apply Water Conservation on Strategy 20.00 20.00
No Use Reclaimed Water 0.00 0.00
No Use Grey Water 0.00
No Install low-flow bathroom faucet 32.00
No Install low-flow Kitchen faucet 18.00
No Install low-flow Toilet 20.00
No Install low-flow Shower 20.00
No Turf Reduction 0.00
No Use Water Efficient Irrigation Systems 6.10
Institute Recycling and Composting ServicesPercent Reduction in Waste Disposed
75.00
No Water Efficient Landscape 0.00 0.00
Solid Waste Mitigation
Mitigation Measures Input Value

CalEEMod Outputs Project Operations Non-Event Days - Winter, Summer,
Annual, and Mitigation

Page 1 of 9
CalEEMod Version: CalEEMod.2013.2.2 Date: 8/24/2016 1:06 PM
SFSU - Creative Arts & Holloway - Non-Event DaySan Francisco County, Winter
1.0 Project Characteristics
1.1 Land Usage
Land Uses Size Metric Lot Acreage Floor Surface Area Population
Junior College (2Yr) 75.00 1000sqft 1.00 75,000.00 0
Junior College (2Yr) 60.00 1000sqft 0.90 60,000.00 0
Enclosed Parking with Elevator 70.00 Space 0.00 28,000.00 0
Apartments Mid Rise 200.00 Dwelling Unit 1.00 111,146.00 550
Strip Mall 25.00 1000sqft 0.30 25,000.00 0
1.2 Other Project Characteristics
Urbanization Urban Wind Speed (m/s) 4.6 Precipitation Freq (Days) 64
Climate Zone 5 Operational Year 2020
Utility Company Pacific Gas & Electric Company
CO2 Intensity (lb/MWhr)
499.66 CH4 Intensity (lb/MWhr)
0.029 N2O Intensity (lb/MWhr)
0.006
1.3 User Entered Comments & Non-Default Data
Project Characteristics - PG&E CO2 Intensity Factor adjusted per 33% RPS by 2020
Land Use - Junior College used to represent University (since University doesn't have 1,000 sqft metric). Dwelling units based on assumption of 2.75 people/beds per unit. Acreages adjusted to match respective blockOff-road Equipment - Added a trencher to account for utility installation
Vehicle Trips - For a non-event day, trip rates were adjusted to zero trips
Woodstoves - No fireplaces assumed
Area Coating - Adusted non-residential interior/exterior area based on minimal surfaces to be coated in parking garage
Energy Use - Default energy

Page 2 of 9
Construction Off-road Equipment Mitigation -
Energy Mitigation - Exceed Title 24: 25% improvement is based on compliance with 2013 Title 24 (versus 2008 Title 24) + project design guidelines note 20% improvement beyond that
Water Mitigation - 20% indoor and 20% outdoor water reduction by 2020
Waste Mitigation - 75% waste diversion consistent with AB 341 (not mitigation)
Table Name Column Name Default Value New Value
tblArchitecturalCoating ConstArea_Nonresidential_Exterior 94,000.00 0.00
tblArchitecturalCoating ConstArea_Nonresidential_Interior 282,000.00 0.00
tblArchitecturalCoating ConstArea_Residential_Exterior 75,024.00 0.00
tblArchitecturalCoating ConstArea_Residential_Interior 225,071.00 0.00
tblAreaCoating Area_Nonresidential_Exterior 94000 81680
tblAreaCoating Area_Nonresidential_Interior 282000 240000
tblFireplaces NumberGas 110.00 0.00
tblFireplaces NumberNoFireplace 62.00 200.00
tblFireplaces NumberWood 28.00 0.00
tblLandUse LandUseSquareFeet 200,000.00 111,146.00
tblLandUse LotAcreage 1.38 0.90
tblLandUse LotAcreage 1.72 1.00
tblLandUse LotAcreage 0.63 0.00
tblLandUse LotAcreage 5.26 1.00
tblLandUse LotAcreage 0.57 0.30
tblLandUse Population 572.00 550.00
tblOffRoadEquipment OffRoadEquipmentUnitAmount 1.00 0.00
tblProjectCharacteristics CO2IntensityFactor 641.35 499.66
tblProjectCharacteristics OperationalYear 2014 2020
tblTripsAndVMT WorkerTripNumber 44.00 0.00
tblVehicleTrips ST_TR 7.16 0.00
tblVehicleTrips ST_TR 11.23 0.00
tblVehicleTrips ST_TR 42.04 0.00
tblVehicleTrips SU_TR 6.07 0.00
tblVehicleTrips SU_TR 1.21 0.00

Page 3 of 9
tblVehicleTrips SU_TR 20.43 0.00
tblVehicleTrips WD_TR 6.59 0.00
27.49 0.00
tblVehicleTrips WD_TR 44.32 0.00
tblVehicleTrips WD_TR

Page 4 of 9
2.0 Emissions Summary
SO2 Fugitive PM10
Exhaust PM10
PM2.5 Total
Bio- CO2 NBio- CO2
2.2 Overall OperationalUnmitigated Operational
ROG NOx CO Total CO2 CH4 N2O CO2e
Category lb/day lb/day
PM10 Total
Fugitive PM2.5
Exhaust PM2.5
Area 8.9884 0.3682 27.3975 0.0362 1.8560 1.8560 1.8560 1.8560 260.4963 29.7608 290.2571 1.2469 0.0000 316.4414
Energy 0.1993 1.7829 1.3123 0.0109 0.1377 0.1377 0.1377 0.1377 2,173.7257
2,173.7257 0.0417 0.0399 2,186.9546
Mobile 0.0000 0.0000 0.0000 0.0000 0.0000 0.0000 0.0000 0.0000 0.0000 0.0000 0.0000 0.0000 0.0000 0.0000
Total 9.1877 2.1511 28.7098 0.0470 1.2885 0.0399 2,503.3960
0.0000 1.9937 1.9937 0.0000 1.9937 1.9937
SO2 Fugitive PM10
Exhaust PM10
260.4963 2,203.4865
2,463.9828
PM2.5 Total
Bio- CO2 NBio- CO2
Mitigated Operational
ROG NOx CO Total CO2 CH4 N2O CO2e
Category lb/day lb/day
PM10 Total
Fugitive PM2.5
Exhaust PM2.5
Area 8.9884 0.3682 27.3975 0.0362 1.8560 1.8560 1.8560 1.8560 260.4963 29.7608 290.2571 1.2469 0.0000 316.4414
Energy 0.1249 1.1159 0.8123 6.8100e-003
0.0863 0.0863 0.0863 0.0863 1,362.2274
1,362.2274 0.0261 0.0250 1,370.5177
Mobile 0.0000 0.0000 0.0000 0.0000 0.0000 0.0000 0.0000 0.0000 0.0000 0.0000 0.0000 0.0000 0.0000 0.0000
Total 9.1133 1.4841 28.2097 0.0430 0.0000 1.9423 1.9423 0.0000 1.9423 1.9423 260.4963 1,391.9882
1,652.4844 1.2730 0.0250 1,686.9591
ROG NOx CO SO2 Fugitive PM10
Exhaust PM10
PM10 Total
Fugitive PM2.5
Exhaust PM2.5
PM2.5 Total
Bio- CO2 NBio-CO2 Total CO2 CH4 N20 CO2e
Percent Reduction
0.81 31.01 1.74 8.63 0.00 2.58 2.58 0.00 2.58 2.58 0.00 36.83 32.93 1.21 37.34 32.61

Page 5 of 9
CO SO2 Fugitive PM10
Fugitive PM2.5
Exhaust PM2.5
PM2.5 Total
Bio- CO2
4.0 Operational Detail - Mobile
4.1 Mitigation Measures Mobile
ROG NOx NBio- CO2 Total CO2 CH4 N2O CO2e
Category lb/day lb/day
Exhaust PM10
PM10 Total
Mitigated 0.0000 0.0000 0.0000 0.0000 0.0000 0.0000 0.0000 0.0000 0.0000 0.0000 0.0000 0.0000 0.0000 0.0000
Unmitigated 0.0000 0.0000 0.0000 0.0000 0.0000 0.0000 0.0000 0.0000 0.0000 0.0000 0.0000 0.0000 0.0000 0.0000
4.2 Trip Summary Information
Average Daily Trip Rate Unmitigated MitigatedLand Use Weekday Saturday Sunday Annual VMT Annual VMT
Apartments Mid Rise 0.00 0.00 0.00Enclosed Parking with Elevator 0.00 0.00 0.00
Junior College (2Yr) 0.00 0.00 0.00Junior College (2Yr) 0.00 0.00 0.00
Strip Mall 0.00 0.00 0.00Total 0.00 0.00 0.00
4.3 Trip Type Information
Miles Trip % Trip Purpose %
Land Use H-W or C-W H-S or C-C H-O or C-NW H-W or C-W
H-S or C-C H-O or C-NW Primary Diverted Pass-by
Apartments Mid Rise 12.40 4.30 5.40 26.10 29.10 44.80 86 11 3
Enclosed Parking with Elevator 9.50 7.30 7.30 0.00 0.00 0.00 0 0 0
Junior College (2Yr) 9.50 7.30 7.30 6.40 88.60 5.00 92 7 1
Junior College (2Yr) 9.50 7.30 7.30 6.40 88.60 5.00 92 7 1
Strip Mall 9.50 7.30 7.30 16.60 64.40 19.00 45 40 15
LDA LDT1 LDT2 MDV LHD1 LHD2 MHD HHD OBUS UBUS MCY SBUS MH

Page 6 of 9
0.631289 0.058518 0.148045 0.077273 0.026007 0.003276 0.026188 0.004043 0.003129 0.010899 0.010305 0.000529 0.000500
5.0 Energy Detail4.4 Fleet MixHistorical Energy Use: N
5.1 Mitigation Measures Energy
Exceed Title 24
ROG NOx CO SO2 Fugitive PM10
Exhaust PM10
PM10 Total
Fugitive PM2.5
Exhaust PM2.5
PM2.5 Total
Bio- CO2 NBio- CO2 Total CO2 CH4 N2O CO2e
Category lb/day lb/day
NaturalGas Mitigated
0.1249 1.1159 0.8123 6.8100e-003
0.0863 0.0863 0.0863 0.0863 1,362.2274
1,362.2274 0.0261 0.0250 1,370.5177
NaturalGas Unmitigated
0.1993 1.7829 1.3123 2,173.7257
2,173.7257 0.0417 0.03990.0109 0.1377 0.1377
ROG NOx CO SO2 Fugitive PM10
0.13770.1377
PM10 Total
Fugitive PM2.5
Exhaust PM2.5
PM2.5 Total
Bio- CO2
2,186.9546
5.2 Energy by Land Use - NaturalGasUnmitigated
NaturalGas Use
NBio- CO2 Total CO2 CH4 N2O CO2e
Land Use kBTU/yr lb/day lb/day
Exhaust PM10
Apartments Mid Rise
4851.33 0.0523 0.4471 0.1903 2.8500e-003
0.0362 0.0362 0.0362 0.0362 570.7442 570.7442 0.0109 0.0105 574.2177
Enclosed Parking with Elevator
0 0.0000 0.0000 0.0000 0.0000 0.0000 0.0000 0.0000 0.0000 0.0000 0.0000 0.0000 0.0000 0.0000
Junior College (2Yr)
5909.59 0.0637 0.5794 0.4867 3.4800e-003
0.0440 0.0440 0.0440 0.0440 695.2458 695.2458 0.0133 0.0128 699.4769
Junior College (2Yr)
7386.99 0.0797 0.7242 0.6083 4.3500e-003
0.0550 0.0550 0.0550 0.0550 869.0572 869.0572 0.0167 0.0159 874.3462

Page 7 of 9
Strip Mall 328.767 3.5500e-003
0.0322 0.0271 1.9000e-004
2.4500e-003
2.4500e-003
2.4500e-003
2.4500e-003
38.6785 38.6785 7.4000e-004
7.1000e-004
38.9139
Total 0.1993 1.7829 1.3123 0.0109 2,173.7257
0.0417 0.0399 2,186.9546
0.1377 0.1377 0.1377 0.1377
CO SO2 Fugitive PM10
Exhaust PM10
2,173.7257
Exhaust PM2.5
PM2.5 Total
Bio- CO2 NBio- CO2
Mitigated
NaturalGas Use
ROG NOx Total CO2 CH4 N2O CO2e
Land Use kBTU/yr lb/day lb/day
PM10 Total
Fugitive PM2.5
Enclosed Parking with Elevator
0 0.0000 0.0000 0.0000 0.0000 0.0000 0.0000 0.0000 0.0000 0.0000 0.0000 0.0000 0.0000 0.0000
Junior College (2Yr)
3.59441 0.0388 0.3524 0.2960 2.1100e-003
0.0268 0.0268 0.0268 0.0268 422.8719 422.8719 8.1100e-003
7.7500e-003
425.4454
Junior College (2Yr)
4.49301 0.0485 0.4405 0.3700 2.6400e-003
0.0335 0.0335 0.0335 0.0335 528.5899 528.5899 0.0101 9.6900e-003
531.8068
Strip Mall 0.216438 2.3300e-003
0.0212 0.0178 1.3000e-004
1.6100e-003
1.6100e-003
1.6100e-003
1.6100e-003
25.4633 25.4633 4.9000e-004
4.7000e-004
25.6183
Apartments Mid Rise
3.27507 0.0353 0.3018 0.1284 1.9300e-003
0.0244 0.0244 0.0244 0.0244 385.3023 385.3023 7.3800e-003
7.0600e-003
387.6472
Total 0.1249 1.1159 0.8123 6.8100e-003
0.0261 0.0250 1,370.5177
0.0863 0.0863 0.0863 0.0863
CO SO2 Fugitive PM10
1,362.2274 1,362.2274
Fugitive PM2.5
Exhaust PM2.5
PM2.5 Total
Bio- CO2
6.0 Area Detail
6.1 Mitigation Measures Area
ROG NOx NBio- CO2 Total CO2 CH4 N2O CO2e
Category lb/day lb/day
Exhaust PM10
PM10 Total
Mitigated 8.9884 0.3682 27.3975 0.0362 1.8560 1.8560 1.8560 1.8560 260.4963 29.7608 290.2571 1.2469 0.0000 316.4414
Unmitigated 8.9884 0.3682 27.3975 0.0362 1.2469 0.0000 316.44141.8560 1.8560 1.8560 1.8560 260.4963 29.7608 290.2571

Page 8 of 9
SO2 Fugitive PM10
Exhaust PM10
PM2.5 Total
Bio- CO2 NBio- CO2
6.2 Area by SubCategoryUnmitigated
ROG NOx CO Total CO2 CH4 N2O CO2e
SubCategory lb/day lb/day
PM10 Total
Fugitive PM2.5
Exhaust PM2.5
Architectural Coating
0.8891 0.0000 0.0000 0.0000 0.0000 0.0000 0.0000
Consumer Products
6.4017 0.0000 0.0000 0.0000 0.0000 0.0000 0.0000
Hearth 1.1913 0.1765 10.8187 0.0353 1.7649 1.7649 1.7649 1.7649 260.4963 0.0000 260.4963 1.2178 0.0000 286.0694
Landscaping 0.5063 0.1917 16.5787 8.7000e-004
0.0911 0.0911 0.0911 0.0911 29.7608 29.7608 0.0291 30.3720
Total 8.9884 0.3682 27.3975 0.0362 1.2469 0.0000 316.44141.8560 1.8560 1.8560 1.8560
SO2 Fugitive PM10
Exhaust PM10
260.4963 29.7608 290.2571
PM2.5 Total
Bio- CO2 NBio- CO2
Mitigated
ROG NOx CO Total CO2 CH4 N2O CO2e
SubCategory lb/day lb/day
PM10 Total
Fugitive PM2.5
Exhaust PM2.5
Architectural Coating
0.8891 0.0000 0.0000 0.0000 0.0000 0.0000 0.0000
Consumer Products
6.4017 0.0000 0.0000 0.0000 0.0000 0.0000 0.0000
Hearth 1.1913 0.1765 10.8187 0.0353 1.7649 1.7649 1.7649 1.7649 260.4963 0.0000 260.4963 1.2178 0.0000 286.0694
Landscaping 0.5063 0.1917 16.5787 8.7000e-004
0.0911 0.0911 0.0911 0.0911 29.7608 29.7608 0.0291 30.3720
Total 8.9884 0.3682 27.3975 0.0362 1.8560 1.8560 1.8560 1.8560 260.4963 29.7608 290.2571 1.2469 0.0000 316.4414
7.0 Water Detail

Page 9 of 9
7.1 Mitigation Measures Water
Apply Water Conservation Strategy
8.0 Waste Detail
8.1 Mitigation Measures Waste
Institute Recycling and Composting Services
Load Factor Fuel Type
10.0 Vegetation
9.0 Operational Offroad
Equipment Type Number Hours/Day Days/Year Horse Power

Page 1 of 9
CalEEMod Version: CalEEMod.2013.2.2 Date: 8/24/2016 1:05 PM
SFSU - Creative Arts & Holloway - Non-Event DaySan Francisco County, Summer
1.0 Project Characteristics
1.1 Land Usage
Land Uses Size Metric Lot Acreage Floor Surface Area Population
Junior College (2Yr) 75.00 1000sqft 1.00 75,000.00 0
Junior College (2Yr) 60.00 1000sqft 0.90 60,000.00 0
Enclosed Parking with Elevator 70.00 Space 0.00 28,000.00 0
Apartments Mid Rise 200.00 Dwelling Unit 1.00 111,146.00 550
Strip Mall 25.00 1000sqft 0.30 25,000.00 0
1.2 Other Project Characteristics
Urbanization Urban Wind Speed (m/s) 4.6 Precipitation Freq (Days) 64
Climate Zone 5 Operational Year 2020
Utility Company Pacific Gas & Electric Company
CO2 Intensity (lb/MWhr)
499.66 CH4 Intensity (lb/MWhr)
0.029 N2O Intensity (lb/MWhr)
0.006
1.3 User Entered Comments & Non-Default Data
Project Characteristics - PG&E CO2 Intensity Factor adjusted per 33% RPS by 2020
Land Use - Junior College used to represent University (since University doesn't have 1,000 sqft metric). Dwelling units based on assumption of 2.75 people/beds per unit. Acreages adjusted to match respective blockOff-road Equipment - Added a trencher to account for utility installation
Vehicle Trips - For a non-event day, trip rates were adjusted to zero trips
Woodstoves - No fireplaces assumed
Area Coating - Adusted non-residential interior/exterior area based on minimal surfaces to be coated in parking garage
Energy Use - Default energy

Page 2 of 9
Construction Off-road Equipment Mitigation -
Energy Mitigation - Exceed Title 24: 25% improvement is based on compliance with 2013 Title 24 (versus 2008 Title 24) + project design guidelines note 20% improvement beyond that
Water Mitigation - 20% indoor and 20% outdoor water reduction by 2020
Waste Mitigation - 75% waste diversion consistent with AB 341 (not mitigation)
Table Name Column Name Default Value New Value
tblArchitecturalCoating ConstArea_Nonresidential_Exterior 94,000.00 0.00
tblArchitecturalCoating ConstArea_Nonresidential_Interior 282,000.00 0.00
tblArchitecturalCoating ConstArea_Residential_Exterior 75,024.00 0.00
tblArchitecturalCoating ConstArea_Residential_Interior 225,071.00 0.00
tblAreaCoating Area_Nonresidential_Exterior 94000 81680
tblAreaCoating Area_Nonresidential_Interior 282000 240000
tblFireplaces NumberGas 110.00 0.00
tblFireplaces NumberNoFireplace 62.00 200.00
tblFireplaces NumberWood 28.00 0.00
tblLandUse LandUseSquareFeet 200,000.00 111,146.00
tblLandUse LotAcreage 1.38 0.90
tblLandUse LotAcreage 1.72 1.00
tblLandUse LotAcreage 0.63 0.00
tblLandUse LotAcreage 5.26 1.00
tblLandUse LotAcreage 0.57 0.30
tblLandUse Population 572.00 550.00
tblOffRoadEquipment OffRoadEquipmentUnitAmount 1.00 0.00
tblProjectCharacteristics CO2IntensityFactor 641.35 499.66
tblProjectCharacteristics OperationalYear 2014 2020
tblTripsAndVMT WorkerTripNumber 44.00 0.00
tblVehicleTrips ST_TR 7.16 0.00
tblVehicleTrips ST_TR 11.23 0.00
tblVehicleTrips ST_TR 42.04 0.00
tblVehicleTrips SU_TR 6.07 0.00
tblVehicleTrips SU_TR 1.21 0.00

Page 3 of 9
tblVehicleTrips SU_TR 20.43 0.00
tblVehicleTrips WD_TR 6.59 0.00
27.49 0.00
tblVehicleTrips WD_TR 44.32 0.00
tblVehicleTrips WD_TR

Page 4 of 9
2.0 Emissions Summary
SO2 Fugitive PM10
Exhaust PM10
PM2.5 Total
Bio- CO2 NBio- CO2
2.2 Overall OperationalUnmitigated Operational
ROG NOx CO Total CO2 CH4 N2O CO2e
Category lb/day lb/day
PM10 Total
Fugitive PM2.5
Exhaust PM2.5
Area 8.9884 0.3682 27.3975 0.0362 1.8560 1.8560 1.8560 1.8560 260.4963 29.7608 290.2571 1.2469 0.0000 316.4414
Energy 0.1993 1.7829 1.3123 0.0109 0.1377 0.1377 0.1377 0.1377 2,173.7257
2,173.7257 0.0417 0.0399 2,186.9546
Mobile 0.0000 0.0000 0.0000 0.0000 0.0000 0.0000 0.0000 0.0000 0.0000 0.0000 0.0000 0.0000 0.0000 0.0000
Total 9.1877 2.1511 28.7098 0.0470 1.2885 0.0399 2,503.3960
0.0000 1.9937 1.9937 0.0000 1.9937 1.9937
SO2 Fugitive PM10
Exhaust PM10
260.4963 2,203.4865
2,463.9828
PM2.5 Total
Bio- CO2 NBio- CO2
Mitigated Operational
ROG NOx CO Total CO2 CH4 N2O CO2e
Category lb/day lb/day
PM10 Total
Fugitive PM2.5
Exhaust PM2.5
Area 8.9884 0.3682 27.3975 0.0362 1.8560 1.8560 1.8560 1.8560 260.4963 29.7608 290.2571 1.2469 0.0000 316.4414
Energy 0.1249 1.1159 0.8123 6.8100e-003
0.0863 0.0863 0.0863 0.0863 1,362.2274
1,362.2274 0.0261 0.0250 1,370.5177
Mobile 0.0000 0.0000 0.0000 0.0000 0.0000 0.0000 0.0000 0.0000 0.0000 0.0000 0.0000 0.0000 0.0000 0.0000
Total 9.1133 1.4841 28.2097 0.0430 0.0000 1.9423 1.9423 0.0000 1.9423 1.9423 260.4963 1,391.9882
1,652.4844 1.2730 0.0250 1,686.9591
ROG NOx CO SO2 Fugitive PM10
Exhaust PM10
PM10 Total
Fugitive PM2.5
Exhaust PM2.5
PM2.5 Total
Bio- CO2 NBio-CO2 Total CO2 CH4 N20 CO2e
Percent Reduction
0.81 31.01 1.74 8.63 0.00 2.58 2.58 0.00 2.58 2.58 0.00 36.83 32.93 1.21 37.34 32.61

Page 5 of 9
CO SO2 Fugitive PM10
Fugitive PM2.5
Exhaust PM2.5
PM2.5 Total
Bio- CO2
4.0 Operational Detail - Mobile
4.1 Mitigation Measures Mobile
ROG NOx NBio- CO2 Total CO2 CH4 N2O CO2e
Category lb/day lb/day
Exhaust PM10
PM10 Total
Mitigated 0.0000 0.0000 0.0000 0.0000 0.0000 0.0000 0.0000 0.0000 0.0000 0.0000 0.0000 0.0000 0.0000 0.0000
Unmitigated 0.0000 0.0000 0.0000 0.0000 0.0000 0.0000 0.0000 0.0000 0.0000 0.0000 0.0000 0.0000 0.0000 0.0000
4.2 Trip Summary Information
Average Daily Trip Rate Unmitigated MitigatedLand Use Weekday Saturday Sunday Annual VMT Annual VMT
Apartments Mid Rise 0.00 0.00 0.00Enclosed Parking with Elevator 0.00 0.00 0.00
Junior College (2Yr) 0.00 0.00 0.00Junior College (2Yr) 0.00 0.00 0.00
Strip Mall 0.00 0.00 0.00Total 0.00 0.00 0.00
4.3 Trip Type Information
Miles Trip % Trip Purpose %
Land Use H-W or C-W H-S or C-C H-O or C-NW H-W or C-W
H-S or C-C H-O or C-NW Primary Diverted Pass-by
Apartments Mid Rise 12.40 4.30 5.40 26.10 29.10 44.80 86 11 3
Enclosed Parking with Elevator 9.50 7.30 7.30 0.00 0.00 0.00 0 0 0
Junior College (2Yr) 9.50 7.30 7.30 6.40 88.60 5.00 92 7 1
Junior College (2Yr) 9.50 7.30 7.30 6.40 88.60 5.00 92 7 1
Strip Mall 9.50 7.30 7.30 16.60 64.40 19.00 45 40 15
LDA LDT1 LDT2 MDV LHD1 LHD2 MHD HHD OBUS UBUS MCY SBUS MH

Page 6 of 9
0.631289 0.058518 0.148045 0.077273 0.026007 0.003276 0.026188 0.004043 0.003129 0.010899 0.010305 0.000529 0.000500
5.0 Energy Detail4.4 Fleet MixHistorical Energy Use: N
5.1 Mitigation Measures Energy
Exceed Title 24
ROG NOx CO SO2 Fugitive PM10
Exhaust PM10
PM10 Total
Fugitive PM2.5
Exhaust PM2.5
PM2.5 Total
Bio- CO2 NBio- CO2 Total CO2 CH4 N2O CO2e
Category lb/day lb/day
NaturalGas Mitigated
0.1249 1.1159 0.8123 6.8100e-003
0.0863 0.0863 0.0863 0.0863 1,362.2274
1,362.2274 0.0261 0.0250 1,370.5177
NaturalGas Unmitigated
0.1993 1.7829 1.3123 2,173.7257
2,173.7257 0.0417 0.03990.0109 0.1377 0.1377
ROG NOx CO SO2 Fugitive PM10
0.13770.1377
PM10 Total
Fugitive PM2.5
Exhaust PM2.5
PM2.5 Total
Bio- CO2
2,186.9546
5.2 Energy by Land Use - NaturalGasUnmitigated
NaturalGas Use
NBio- CO2 Total CO2 CH4 N2O CO2e
Land Use kBTU/yr lb/day lb/day
Exhaust PM10
Enclosed Parking with Elevator
0 0.0000 0.0000 0.0000 0.0000 0.0000 0.0000 0.0000 0.0000 0.0000 0.0000 0.0000 0.0000 0.0000
Junior College (2Yr)
5909.59 0.0637 0.5794 0.4867 3.4800e-003
0.0440 0.0440 0.0440 0.0440 695.2458 695.2458 0.0133 0.0128 699.4769
Junior College (2Yr)
7386.99 0.0797 0.7242 0.6083 4.3500e-003
0.0550 0.0550 0.0550 0.0550 869.0572 869.0572 0.0167 0.0159 874.3462
Strip Mall 328.767 3.5500e-003
0.0322 0.0271 1.9000e-004
2.4500e-003
2.4500e-003
2.4500e-003
2.4500e-003
38.6785 38.6785 7.4000e-004
7.1000e-004
38.9139

Page 7 of 9
Apartments Mid Rise
4851.33 0.0523 0.4471 0.1903 2.8500e-003
0.0362 0.0362 0.0362 0.0362 570.7442 570.7442 0.0109 0.0105 574.2177
Total 0.1993 1.7829 1.3123 0.0109 2,173.7257
0.0417 0.0399 2,186.9546
0.1377 0.1377 0.1377 0.1377
CO SO2 Fugitive PM10
Exhaust PM10
2,173.7257
Exhaust PM2.5
PM2.5 Total
Bio- CO2 NBio- CO2
Mitigated
NaturalGas Use
ROG NOx Total CO2 CH4 N2O CO2e
Land Use kBTU/yr lb/day lb/day
PM10 Total
Fugitive PM2.5
Enclosed Parking with Elevator
0 0.0000 0.0000 0.0000 0.0000 0.0000 0.0000 0.0000 0.0000 0.0000 0.0000 0.0000 0.0000 0.0000
Junior College (2Yr)
3.59441 0.0388 0.3524 0.2960 2.1100e-003
0.0268 0.0268 0.0268 0.0268 422.8719 422.8719 8.1100e-003
7.7500e-003
425.4454
Junior College (2Yr)
4.49301 0.0485 0.4405 0.3700 2.6400e-003
0.0335 0.0335 0.0335 0.0335 528.5899 528.5899 0.0101 9.6900e-003
531.8068
Strip Mall 0.216438 2.3300e-003
0.0212 0.0178 1.3000e-004
1.6100e-003
1.6100e-003
1.6100e-003
1.6100e-003
25.4633 25.4633 4.9000e-004
4.7000e-004
25.6183
Apartments Mid Rise
3.27507 0.0353 0.3018 0.1284 1.9300e-003
0.0244 0.0244 0.0244 0.0244 385.3023 385.3023 7.3800e-003
7.0600e-003
387.6472
Total 0.1249 1.1159 0.8123 6.8100e-003
0.0261 0.0250 1,370.5177
0.0863 0.0863 0.0863 0.0863
CO SO2 Fugitive PM10
1,362.2274 1,362.2274
Fugitive PM2.5
Exhaust PM2.5
PM2.5 Total
Bio- CO2
6.0 Area Detail
6.1 Mitigation Measures Area
ROG NOx NBio- CO2 Total CO2 CH4 N2O CO2e
Category lb/day lb/day
Exhaust PM10
PM10 Total
Mitigated 8.9884 0.3682 27.3975 0.0362 1.8560 1.8560 1.8560 1.8560 260.4963 29.7608 290.2571 1.2469 0.0000 316.4414
Unmitigated 8.9884 0.3682 27.3975 0.0362 1.2469 0.0000 316.44141.8560 1.8560 1.8560 1.8560 260.4963 29.7608 290.2571

Page 8 of 9
SO2 Fugitive PM10
Exhaust PM10
PM2.5 Total
Bio- CO2 NBio- CO2
6.2 Area by SubCategoryUnmitigated
ROG NOx CO Total CO2 CH4 N2O CO2e
SubCategory lb/day lb/day
PM10 Total
Fugitive PM2.5
Exhaust PM2.5
Architectural Coating
0.8891 0.0000 0.0000 0.0000 0.0000 0.0000 0.0000
Consumer Products
6.4017 0.0000 0.0000 0.0000 0.0000 0.0000 0.0000
Hearth 1.1913 0.1765 10.8187 0.0353 1.7649 1.7649 1.7649 1.7649 260.4963 0.0000 260.4963 1.2178 0.0000 286.0694
Landscaping 0.5063 0.1917 16.5787 8.7000e-004
0.0911 0.0911 0.0911 0.0911 29.7608 29.7608 0.0291 30.3720
Total 8.9884 0.3682 27.3975 0.0362 1.2469 0.0000 316.44141.8560 1.8560 1.8560 1.8560
SO2 Fugitive PM10
Exhaust PM10
260.4963 29.7608 290.2571
PM2.5 Total
Bio- CO2 NBio- CO2
Mitigated
ROG NOx CO Total CO2 CH4 N2O CO2e
SubCategory lb/day lb/day
PM10 Total
Fugitive PM2.5
Exhaust PM2.5
Architectural Coating
0.8891 0.0000 0.0000 0.0000 0.0000 0.0000 0.0000
Consumer Products
6.4017 0.0000 0.0000 0.0000 0.0000 0.0000 0.0000
Hearth 1.1913 0.1765 10.8187 0.0353 1.7649 1.7649 1.7649 1.7649 260.4963 0.0000 260.4963 1.2178 0.0000 286.0694
Landscaping 0.5063 0.1917 16.5787 8.7000e-004
0.0911 0.0911 0.0911 0.0911 29.7608 29.7608 0.0291 30.3720
Total 8.9884 0.3682 27.3975 0.0362 1.8560 1.8560 1.8560 1.8560 260.4963 29.7608 290.2571 1.2469 0.0000 316.4414
7.0 Water Detail

Page 9 of 9
7.1 Mitigation Measures Water
Apply Water Conservation Strategy
8.0 Waste Detail
8.1 Mitigation Measures Waste
Institute Recycling and Composting Services
Load Factor Fuel Type
10.0 Vegetation
9.0 Operational Offroad
Equipment Type Number Hours/Day Days/Year Horse Power

Page 1 of 12
CalEEMod Version: CalEEMod.2013.2.2 Date: 8/24/2016 1:04 PM
SFSU - Creative Arts & Holloway - Non-Event DaySan Francisco County, Annual
1.0 Project Characteristics
1.1 Land Usage
Land Uses Size Metric Lot Acreage Floor Surface Area Population
Junior College (2Yr) 75.00 1000sqft 1.00 75,000.00 0
Junior College (2Yr) 60.00 1000sqft 0.90 60,000.00 0
Enclosed Parking with Elevator 70.00 Space 0.00 28,000.00 0
Apartments Mid Rise 200.00 Dwelling Unit 1.00 111,146.00 550
Strip Mall 25.00 1000sqft 0.30 25,000.00 0
1.2 Other Project Characteristics
Urbanization Urban Wind Speed (m/s) 4.6 Precipitation Freq (Days) 64
Climate Zone 5 Operational Year 2020
Utility Company Pacific Gas & Electric Company
CO2 Intensity (lb/MWhr)
499.66 CH4 Intensity (lb/MWhr)
0.029 N2O Intensity (lb/MWhr)
0.006
Vehicle Trips - For a non-event day, trip rates were adjusted to zero trips
1.3 User Entered Comments & Non-Default Data
Project Characteristics - PG&E CO2 Intensity Factor adjusted per 33% RPS by 2020
Land Use - Junior College used to represent University (since University doesn't have 1,000 sqft metric). Dwelling units based on assumption of 2.75 people/beds per unit. Acreages adjusted to match respective blockOff-road Equipment - Added a trencher to account for utility installation
Woodstoves - No fireplaces assumed
Area Coating - Adusted non-residential interior/exterior area based on minimal surfaces to be coated in parking garage
Energy Use - Default energy

Page 2 of 12
Waste Mitigation - 75% waste diversion consistent with AB 341 (not mitigation)
Table Name Column Name Default Value New Value
tblArchitecturalCoating ConstArea_Nonresidential_Exterior 94,000.00 0.00
tblArchitecturalCoating ConstArea_Nonresidential_Interior 282,000.00 0.00
tblArchitecturalCoating ConstArea_Residential_Exterior 75,024.00 0.00
tblArchitecturalCoating ConstArea_Residential_Interior 225,071.00 0.00
tblAreaCoating Area_Nonresidential_Exterior 94000 81680
tblAreaCoating Area_Nonresidential_Interior 282000 240000
tblFireplaces NumberGas 110.00 0.00
tblFireplaces NumberNoFireplace 62.00 200.00
tblFireplaces NumberWood 28.00 0.00
tblLandUse LandUseSquareFeet 200,000.00 111,146.00
tblLandUse LotAcreage 1.38 0.90
tblLandUse LotAcreage 1.72 1.00
tblLandUse LotAcreage 0.63 0.00
tblLandUse LotAcreage 5.26 1.00
tblLandUse LotAcreage 0.57 0.30
tblLandUse Population 572.00 550.00
tblOffRoadEquipment OffRoadEquipmentUnitAmount 1.00 0.00
tblProjectCharacteristics CO2IntensityFactor 641.35 499.66
tblProjectCharacteristics OperationalYear 2014 2020
tblTripsAndVMT WorkerTripNumber 44.00 0.00
tblVehicleTrips ST_TR 7.16 0.00
tblVehicleTrips ST_TR 11.23 0.00
tblVehicleTrips ST_TR 42.04 0.00
tblVehicleTrips SU_TR 6.07 0.00
tblVehicleTrips SU_TR 1.21 0.00
Construction Off-road Equipment Mitigation -
Energy Mitigation - Exceed Title 24: 25% improvement is based on compliance with 2013 Title 24 (versus 2008 Title 24) + project design guidelines note 20% improvement beyond that
Water Mitigation - 20% indoor and 20% outdoor water reduction by 2020

Page 3 of 12
tblVehicleTrips SU_TR 20.43 0.00
tblVehicleTrips WD_TR 6.59 0.00
27.49 0.00
tblVehicleTrips WD_TR 44.32 0.00
tblVehicleTrips WD_TR

Page 4 of 12
2.0 Emissions Summary
SO2 Fugitive PM10
Exhaust PM10
PM2.5 Total
Bio- CO2 NBio- CO2
2.2 Overall OperationalUnmitigated Operational
ROG NOx CO Total CO2 CH4 N2O CO2e
Category tons/yr MT/yr
PM10 Total
Fugitive PM2.5
Exhaust PM2.5
Area 1.3826 0.0182 1.5506 2.7000e-004
0.0178 0.0178 0.0178 0.0178 1.2785 2.4299 3.7084 8.3500e-003
0.0000 3.8838
Energy 0.0364 0.3254 0.2395 1.9800e-003
0.0251 0.0251 0.0251 0.0251 0.0000 986.3208 986.3208 0.0433 0.0141 991.6064
Mobile 0.0000 0.0000 0.0000 0.0000 0.0000 0.0000 0.0000 0.0000 0.0000 0.0000 0.0000 0.0000 0.0000 0.0000 0.0000 0.0000
Waste 0.0000 0.0000 0.0000 0.0000 59.6286 0.0000 59.6286 3.5240 0.0000 133.6315
Water 0.0000 0.0000 0.0000 0.0000 6.8223 42.0044 48.8267 0.7032 0.0171 68.8784
Total 1.4189 0.3436 1.7901 2.2500e-003
4.2787 0.0312 1,198.0001
0.0000 0.0429 0.0429 0.0000 0.0429 0.0429
SO2 Fugitive PM10
Exhaust PM10
67.7294 1,030.7551
1,098.4845
PM2.5 Total
Bio- CO2 NBio- CO2
Mitigated OperationalROG NOx CO Total CO2 CH4 N2O CO2e
Category tons/yr MT/yr
PM10 Total
Fugitive PM2.5
Exhaust PM2.5
Area 1.3826 0.0182 1.5506 2.7000e-004
0.0178 0.0178 0.0178 0.0178 1.2785 2.4299 3.7084 8.3500e-003
0.0000 3.8838
Energy 0.0228 0.2037 0.1482 1.2400e-003
0.0158 0.0158 0.0158 0.0158 0.0000 768.2221 768.2221 0.0358 0.0107 772.2763
Mobile 0.0000 0.0000 0.0000 0.0000 0.0000 0.0000 0.0000 0.0000 0.0000 0.0000 0.0000 0.0000 0.0000 0.0000 0.0000 0.0000
Waste 0.0000 0.0000 0.0000 0.0000 14.9072 0.0000 14.9072 0.8810 0.0000 33.4079
Water 0.0000 0.0000 0.0000 0.0000 5.4578 31.8414 37.2993 0.5624 0.0136 53.3319
Total 1.4054 0.2219 1.6989 1.5100e-003
0.0000 0.0335 0.0335 0.0000 0.0335 0.0335 21.6435 802.4934 824.1369 1.4876 0.0243 862.8998
ROG NOx CO SO2 Fugitive PM10
Exhaust PM10
PM10 Total
Fugitive PM2.5
Exhaust PM2.5
PM2.5 Total
Bio- CO2 NBio-CO2 Total CO2 CH4 N20 CO2e
Percent Reduction
0.96 35.43 5.10 32.89 0.00 21.86 21.86 0.00 21.86 21.86 68.04 22.15 24.98 65.23 22.14 27.97

Page 5 of 12
CO SO2 Fugitive PM10
Fugitive PM2.5
Exhaust PM2.5
PM2.5 Total
Bio- CO2
4.0 Operational Detail - Mobile
4.1 Mitigation Measures Mobile
ROG NOx NBio- CO2 Total CO2 CH4 N2O CO2e
Category tons/yr MT/yr
Exhaust PM10
PM10 Total
Mitigated 0.0000 0.0000 0.0000 0.0000 0.0000 0.0000 0.0000 0.0000 0.0000 0.0000 0.0000 0.0000 0.0000 0.0000 0.0000 0.0000
Unmitigated 0.0000 0.0000 0.0000 0.0000 0.0000 0.0000 0.0000 0.0000 0.0000 0.0000 0.0000 0.0000 0.0000 0.0000 0.0000 0.0000
4.2 Trip Summary Information
Average Daily Trip Rate Unmitigated MitigatedLand Use Weekday Saturday Sunday Annual VMT Annual VMT
Apartments Mid Rise 0.00 0.00 0.00Enclosed Parking with Elevator 0.00 0.00 0.00
Junior College (2Yr) 0.00 0.00 0.00Junior College (2Yr) 0.00 0.00 0.00
Strip Mall 0.00 0.00 0.00Total 0.00 0.00 0.00
4.3 Trip Type Information
Miles Trip % Trip Purpose %
Land Use H-W or C-W H-S or C-C H-O or C-NW H-W or C-W
H-S or C-C H-O or C-NW Primary Diverted Pass-by
Apartments Mid Rise 12.40 4.30 5.40 26.10 29.10 44.80 86 11 3
Enclosed Parking with Elevator 9.50 7.30 7.30 0.00 0.00 0.00 0 0 0
Junior College (2Yr) 9.50 7.30 7.30 6.40 88.60 5.00 92 7 1
Junior College (2Yr) 9.50 7.30 7.30 6.40 88.60 5.00 92 7 1
Strip Mall 9.50 7.30 7.30 16.60 64.40 19.00 45 40 15

Page 6 of 12
LDA LDT1 LDT2 MDV LHD1 LHD2 MHD HHD OBUS UBUS MCY SBUS MH
0.631289 0.058518 0.148045 0.077273 0.026007 0.003276 0.026188 0.004043 0.003129 0.010899 0.010305 0.000529 0.000500
5.0 Energy Detail4.4 Fleet MixHistorical Energy Use: N
5.1 Mitigation Measures Energy
Exceed Title 24
ROG NOx CO SO2 Fugitive PM10
Exhaust PM10
PM10 Total
Fugitive PM2.5
Exhaust PM2.5
PM2.5 Total
Bio- CO2 NBio- CO2 Total CO2 CH4 N2O CO2e
Category tons/yr MT/yr
Electricity Mitigated 0.0000 0.0000 0.0000 0.0000 0.0000 542.6901 542.6901 0.0315 6.5200e-003
545.3717
Electricity Unmitigated
0.0000 0.0000 0.0000 0.0000 0.0000 626.4361 626.4361 0.0364 7.5200e-003
629.5316
NaturalGas Mitigated
0.0228 0.2037 0.1482 1.2400e-003
0.0158 0.0158 0.0158 0.0158 0.0000 225.5320 225.5320 4.3200e-003
4.1300e-003
226.9046
NaturalGas Unmitigated
0.0364 0.3254 0.2395 1.9800e-003
6.9000e-003
6.6000e-003
362.0749
5.2 Energy by Land Use - NaturalGas
0.0251 0.0251 0.0251 0.0251 0.0000
CO SO2 Fugitive PM10
Exhaust PM10
359.8847 359.8847
Exhaust PM2.5
PM2.5 Total
Bio- CO2 NBio- CO2
Unmitigated
NaturalGas Use
ROG NOx Total CO2 CH4 N2O CO2e
Land Use kBTU/yr tons/yr MT/yr
PM10 Total
Fugitive PM2.5
Enclosed Parking with Elevator
0 0.0000 0.0000 0.0000 0.0000 0.0000 0.0000 0.0000 0.0000 0.0000 0.0000 0.0000 0.0000 0.0000 0.0000

Page 7 of 12
Junior College (2Yr)
2.157e+006
0.0116 0.1057 0.0888 6.3000e-004
8.0400e-003
8.0400e-003
8.0400e-003
8.0400e-003
0.0000 115.1057 115.1057 2.2100e-003
2.1100e-003
115.8063
Junior College (2Yr)
2.69625e+006
0.0145 0.1322 0.1110 7.9000e-004
0.0100 0.0100 0.0100 0.0100 0.0000 143.8822 143.8822 2.7600e-003
2.6400e-003
144.7578
Strip Mall 120000 6.5000e-004
5.8800e-003
4.9400e-003
4.0000e-005
4.5000e-004
4.5000e-004
4.5000e-004
4.5000e-004
0.0000 6.4037 6.4037 1.2000e-004
1.2000e-004
6.4426
Apartments Mid Rise
1.77073e+006
9.5500e-003
0.0816 0.0347 1.8100e-003
1.7300e-003
5.2000e-004
6.6000e-003
6.6000e-003
6.6000e-003
0.0251
6.6000e-003
0.0000 94.4931 94.4931
0.0000 359.8847
95.0682
Total 0.0364 0.3254 0.2395 1.9800e-003
359.8847 6.9000e-003
6.6000e-003
362.0749
Mitigated
0.0251 0.0251 0.0251
NaturalGas Use
ROG NOx CO SO2 Fugitive PM10
Exhaust PM10
PM10 Total
Fugitive PM2.5
Exhaust PM2.5
PM2.5 Total
Bio- CO2 NBio- CO2 Total CO2 CH4 N2O CO2e
Land Use kBTU/yr tons/yr MT/yr
Enclosed Parking with Elevator
0 0.0000 0.0000 0.0000 0.0000 0.0000 0.0000 0.0000 0.0000 0.0000 0.0000 0.0000 0.0000 0.0000 0.0000
Junior College (2Yr)
1.31196e+006
7.0700e-003
0.0643 0.0540 3.9000e-004
4.8900e-003
4.8900e-003
4.8900e-003
4.8900e-003
0.0000 70.0112 70.0112 1.3400e-003
1.2800e-003
70.4373
Junior College (2Yr)
1.63995e+006
8.8400e-003
0.0804 0.0675 4.8000e-004
6.1100e-003
6.1100e-003
6.1100e-003
6.1100e-003
0.0000 87.5140 87.5140 1.6800e-003
1.6000e-003
88.0466
Strip Mall 79000 4.3000e-004
3.8700e-003
3.2500e-003
2.0000e-005
2.9000e-004
2.9000e-004
2.9000e-004
2.9000e-004
0.0000 4.2157 4.2157 8.0000e-005
8.0000e-005
4.2414
Apartments Mid Rise
1.1954e+006
6.4500e-003
0.0551 63.7911 1.2200e-003
0.0234 3.5000e-004
4.4500e-003
4.4500e-003
1.2400e-003
4.4500e-003
4.4500e-003
0.0000 63.7911
0.0157 0.0000
1.1700e-003
64.1793
Total 0.0228 0.2037 0.1482 225.5320 225.5320 4.3200e-003
4.1300e-003
226.9046
5.3 Energy by Land Use - Electricity
0.0157 0.0157 0.0157
Unmitigated
Electricity Use
Total CO2 CH4 N2O CO2e
Land Use kWh/yr to
MT/yr
Apartments Mid Rise
723070 163.8780 9.5100e-003
1.9700e-003
164.6878

Page 8 of 12
Enclosed Parking with Elevator
188720 42.7719 2.4800e-003
5.1000e-004
42.9832
Junior College (2Yr)
694200 157.3349 9.1300e-003
1.8900e-003
Junior College (2Yr)
867750 196.6686 0.0114 2.3600e-003
290250 65.7828 3.8200e-003
7.9000e-004
158.1123
197.6404
CO2e
66.1079
Total 626.4361 0.0364 7.5200e-003
629.5316
Strip Mall
9.1800e-003
1.9000e-003
Mitigated
Electricity Use
Total CO2 CH4 N2O
3.9000e-004
32.9836
Land Use kWh/yr to
MT/yr
Apartments Mid Rise
698106 158.2201
129.8115 7.5300e-003
1.5600e-003
159.0019
Enclosed Parking with Elevator
144816 32.8214 1.9000e-003
130.4529
Junior College (2Yr)
715950 162.2643 9.4200e-003
1.9500e-003
163.0661
Junior College (2Yr)
572760
545.3717
Strip Mall 262850 59.5728 3.4600e-003
7.2000e-004
CO SO2 Fugitive PM10
59.8672
Total 542.6901 0.0315 6.5200e-003
Fugitive PM2.5
Exhaust PM2.5
PM2.5 Total
Bio- CO2
6.0 Area Detail
6.1 Mitigation Measures Area
ROG NOx NBio- CO2 Total CO2 CH4 N2O CO2eExhaust PM10
PM10 Total

Page 9 of 12
Category tons/yr MT/yr
Mitigated 1.3826 0.0182 1.5506 2.7000e-004
0.0178 0.0178 0.0178 0.0178 1.2785 2.4299 3.7084 8.3500e-003
0.0000 3.8838
Unmitigated 1.3826 0.0182 1.5506 2.7000e-004
8.3500e-003
0.0000 3.88380.0178 0.0178 0.0178 0.0178
SO2 Fugitive PM10
Exhaust PM10
1.2785 2.4299 3.7084
PM2.5 Total
Bio- CO2 NBio- CO2
6.2 Area by SubCategoryUnmitigated
ROG NOx CO Total CO2 CH4 N2O CO2e
SubCategory tons/yr MT/yr
PM10 Total
Fugitive PM2.5
Exhaust PM2.5
Architectural Coating
0.1623 0.0000 0.0000 0.0000 0.0000 0.0000 0.0000 0.0000 0.0000 0.0000 0.0000
Consumer Products
1.1683 0.0000 0.0000 0.0000 0.0000 0.0000 0.0000 0.0000 0.0000 0.0000 0.0000
Hearth 6.4400e-003
9.5000e-004
0.0585 1.9000e-004
9.5500e-003
9.5500e-003
9.5500e-003
9.5500e-003
1.2785 0.0000 1.2785 5.9800e-003
0.0000 1.4040
Landscaping 0.0456 0.0173 1.4921 8.0000e-005
8.2000e-003
8.2000e-003
8.2000e-003
8.2000e-003
0.0000 2.4299 2.4299 2.3800e-003
0.0000 2.4798
Total 1.3826 0.0182 1.5506 2.7000e-004
8.3600e-003
0.0000 3.88380.0178 0.0178 0.0178 0.0178
SO2 Fugitive PM10
Exhaust PM10
1.2785 2.4299 3.7084
PM2.5 Total
Bio- CO2 NBio- CO2
Mitigated
ROG NOx CO Total CO2 CH4 N2O CO2e
SubCategory tons/yr MT/yr
PM10 Total
Fugitive PM2.5
Exhaust PM2.5
Architectural Coating
0.1623 0.0000 0.0000 0.0000 0.0000 0.0000 0.0000 0.0000 0.0000 0.0000 0.0000
Consumer Products
1.1683 0.0000 0.0000 0.0000 0.0000 0.0000 0.0000 0.0000 0.0000 0.0000 0.0000
Hearth 6.4400e-003
9.5000e-004
0.0585 1.9000e-004
9.5500e-003
9.5500e-003
9.5500e-003
9.5500e-003
1.2785 0.0000 1.2785 5.9800e-003
0.0000 1.4040
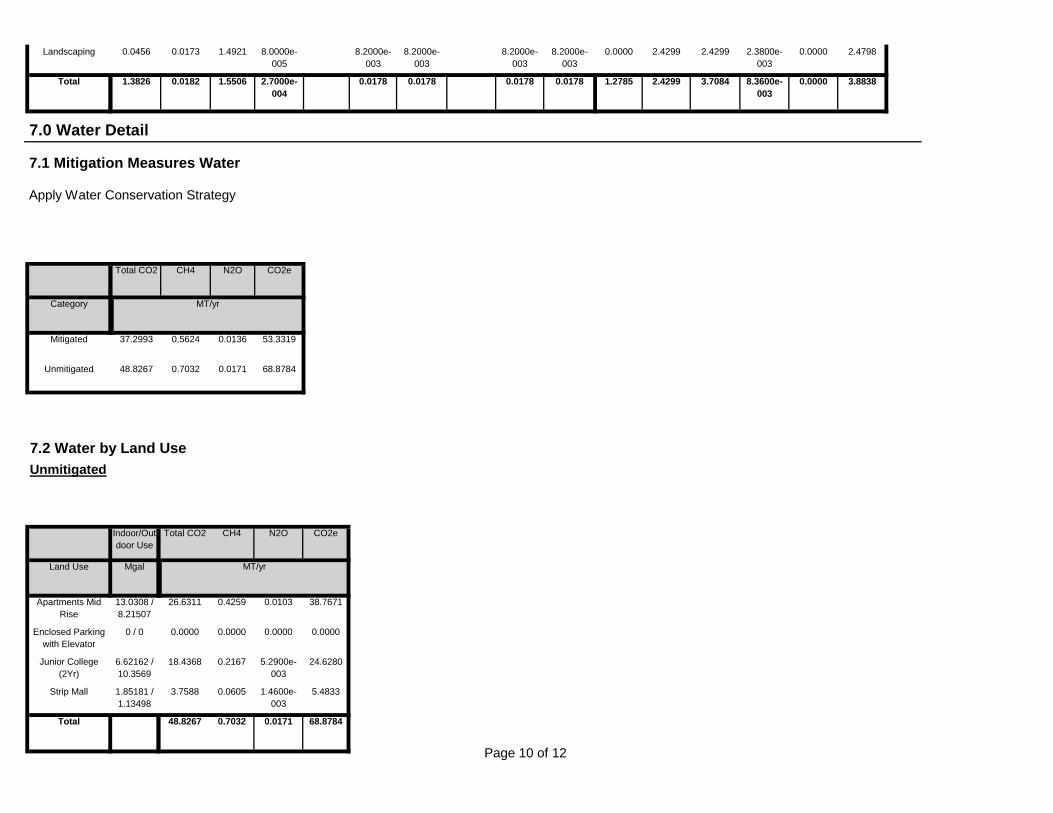
Page 10 of 12
Landscaping 0.0456 0.0173 1.4921 8.0000e-005
8.2000e-003
8.2000e-003
8.2000e-003
8.2000e-003
0.0000 2.4299 2.4299 2.3800e-003
0.0000 2.4798
Total 1.3826 0.0182 1.5506 2.7000e-004
0.0178 0.0178 0.0178 0.0178 1.2785 2.4299 3.7084 8.3600e-003
0.0000 3.8838
7.0 Water Detail
7.1 Mitigation Measures Water
Apply Water Conservation Strategy
Total CO2 CH4 N2O CO2e
Category ton
MT/yr
Mitigated 37.2993 0.5624 0.0136 53.3319
CO2e
Unmitigated 48.8267 0.7032 0.0171 68.8784
0.4259 0.0103
7.2 Water by Land UseUnmitigated
Indoor/Outdoor Use
Total CO2 CH4 N2O
0.0000 0.0000
Land Use Mgal to
MT/yr
Apartments Mid Rise
13.0308 / 8.21507
26.6311
18.4368 0.2167 5.2900e-003
38.7671
Enclosed Parking with Elevator
0 / 0 0.0000 0.0000
24.6280
Strip Mall 1.85181 / 1.13498
3.7588 0.0605 1.4600e-003
5.4833
Junior College (2Yr)
6.62162 / 10.3569
Total 48.8267 0.7032 0.0171 68.8784

Page 11 of 12
N2O CO2e
0.3407 8.2200e-003
MitigatedIndoor/Outdoor Use
Total CO2 CH4
0.0000 0.0000
Land Use Mgal to
MT/yr
Apartments Mid Rise
10.4246 / 6.57206
20.2371
14.2068 0.1733 4.2300e-003
29.9406
Enclosed Parking with Elevator
0 / 0 0.0000 0.0000
19.1571
Strip Mall 1.48145 / 0.907986
2.8553 0.0484 1.1700e-003
4.2342
Junior College (2Yr)
5.2973 / 8.28551
Total 37.2993 0.5624 0.0136 53.3319
8.0 Waste Detail
8.1 Mitigation Measures Waste
Institute Recycling and Composting Services
Category/Year
Total CO2 CH4 N2O CO2e
ton
MT/yr
Unmitigated 59.6286 3.5240 0.0000 133.6315
Mitigated 14.9072 0.8810 0.0000 33.4079
8.2 Waste by Land UseUnmitigated

Page 12 of 12
CO2e
1.1037 0.0000
Waste Disposed
Total CO2 CH4 N2O
0.0000 0.0000
Land Use tons to
MT/yr
Apartments Mid Rise
92 18.6752
35.6249 2.1054 0.0000
41.8523
Enclosed Parking with Elevator
0 0.0000 0.0000
79.8377
Strip Mall 26.25 5.3285 0.3149 0.0000 11.9415
Junior College (2Yr)
175.5
Total 59.6286 3.5240 0.0000 133.6315
MitigatedWaste
DisposedTotal CO2 CH4 N2O CO2e
Land Use tons to
MT/yr
Apartments Mid Rise
23 4.6688 0.2759 0.0000 10.4631
Enclosed Parking with Elevator
0 0.0000 0.0000 0.0000 0.0000
Junior College (2Yr)
43.875 8.9062 0.5263 0.0000
0.8810 0.0000
19.9594
Strip Mall 6.5625 1.3321 0.0787 0.0000 2.9854
33.4079
9.0 Operational Offroad
Equipment Type Number Hours/Day Days/Year
Total 14.9072
Horse Power Load Factor Fuel Type
10.0 Vegetation

Page 1 of 4
CalEEMod Version: CalEEMod.2013.2.2
Date: 8/24/2016 1:07 PM
SFSU - Creative Arts & Holloway - Non-Event DaySan Francisco County, Mitigation Report
Operational Percent Reduction Summary
Category ROG NOx CO SO2Exhaust PM10
Exhaust PM2.5 Bio- CO2 NBio- CO2
Total CO2 CH4 N2O CO2e
Percent Reduction
Architectural Coating 0.00 0.00 0.00 0.00 0.00 0.00 0.00 0.00 0.00 0.00 0.00 0.00
Consumer Products 0.00 0.00 0.00 0.00 0.00 0.00 0.00 0.00 0.00 0.00 0.00 0.00
Electricity 0.00 0.00 0.00 0.00 0.00 0.00 0.00 13.37 13.37 13.37 13.30 13.37
Hearth 0.00 0.00 0.00 0.00 0.00 0.00 0.00 0.00 0.00 0.00 0.00 0.00
Landscaping 0.00 0.00 0.00 0.00 0.00 0.00 0.00 0.00 0.00 0.00 0.00 0.00
Mobile 0.00 0.00 0.00 0.00 0.00 0.00 0.00 0.00 0.00 0.00 0.00 0.00
Natural Gas 37.34 37.41 38.10 37.37 37.37 37.37 0.00 37.33 37.33 37.39 37.42 37.33
Water Indoor 0.00 0.00 0.00 0.00 0.00 0.00 20.00 24.20 23.61 20.01 20.12 22.57
Water Outdoor 0.00 0.00 0.00 0.00 0.00 0.00 0.00 0.00 0.00 0.00 0.00 0.00
Operational Mobile Mitigation
Project Setting:
Mitigation S l t d
Category Measure % Reduction Input Value 1 Input Value 2
Increase Diversity 0.27 0.60
Input Value 3
No Land Use Increase Density 0.00
No Land Use Improve Walkability Design 0.00
No Land Use

Page 2 of 4
No Land Use Improve Destination Accessibility 0.00
Integrate Below Market Rate Housing 0.00
No Land Use Increase Transit Accessibility 0.25
Land Use Land Use SubTotal 0.00
No Land Use
No Neighborhood Enhancements Improve Pedestrian Network
Implement NEV Network 0.00
No Neighborhood Enhancements Provide Traffic Calming Measures
Neighborhood Enhancements Neighborhood Enhancements Subtotal 0.00
No Neighborhood Enhancements
No Parking Policy Pricing Limit Parking Supply 0.00
On-street Market Pricing 0.00
No Parking Policy Pricing Unbundle Parking Costs 0.00
Parking Policy Pricing Parking Policy Pricing Subtotal 0.00
No Parking Policy Pricing
No Transit Improvements Provide BRT System 0.00
Increase Transit Frequency 0.00
No Transit Improvements Expand Transit Network 0.00
Transit Improvements Transit Improvements Subtotal 0.00
No Transit Improvements
Land Use and Site Enhancement Subtotal 0.00
Transit Subsidy
No Commute Implement Trip Reduction Program
No Commute Implement Employee Parking "Cash Out"
No Commute
No Commute Workplace Parking Charge
Market Commute Trip Reduction Option 0.00
No Commute Encourage Telecommuting and Alternative Work Schedules
0.00
No Commute Employee Vanpool/Shuttle 0.00 2.00
No Commute
No Commute Provide Ride Sharing Program

Page 3 of 4
Implement School Bus Program 0.00
Commute Commute Subtotal 0.00
Total VMT Reduction 0.00
No School Trip
Area Mitigation
Measure Implemented Mitigation Measure Input Value
No Only Natural Gas Hearth
No No Hearth
No Use Low VOC Cleaning Supplies
No Use Low VOC Paint (Residential Interior) 100.00
No Use Low VOC Paint (Residential Exterior) 150.00
No Use Low VOC Paint (Non-residential Interior) 100.00
No Use Low VOC Paint (Non-residential Exterior) 150.00
No % Electric Lawnmower
No % Electric Leafblower
No % Electric Chainsaw
Energy Mitigation Measures
Measure Implemented Mitigation Measure Input Value 1 Input Value 2
Yes Exceed Title 24 40.00
No Install High Efficiency Lighting 0.00
No On-site Renewable 0.00 0.00
Appliance Type Land Use Subtype % Improvement
ClothWasher 30.00
DishWasher 15.00
Fan 50.00

Page 4 of 4
Refrigerator 15.00
Water Mitigation Measures
Measure Implemented Mitigation Measure Input Value 1 Input Value 2
Yes Apply Water Conservation on Strategy 20.00 20.00
No Use Reclaimed Water 0.00 0.00
No Use Grey Water 0.00
No Install low-flow bathroom faucet 32.00
No Install low-flow Kitchen faucet 18.00
No Install low-flow Toilet 20.00
No Install low-flow Shower 20.00
No Turf Reduction 0.00
No Use Water Efficient Irrigation Systems 6.10
Institute Recycling and Composting ServicesPercent Reduction in Waste Disposed
75.00
No Water Efficient Landscape 0.00 0.00
Solid Waste Mitigation
Mitigation Measures Input Value

Modeling Calculations Average Emissions; Demolition; Architectural Coatings; Traffic

SFSU - Creative Arts & Holloway Mixed-Use Project Average Pollutant Emissions
Unmitigated Construction tons Unmitigated Construction average lbs/dayYear ROG Nox PM10 exh PM2.5 exh Year ROG Nox PM10 exh PM2.5 exh2017-2019 2.818 9.3995 0.4879 0.4568 Total 8.9 29.7 1.5 1.4
Construction Duration: 632 days Total Duration
Project Operations lbs/day Project Operations - GHGsNon-Event -- 265 days per year (assuming 80 events) Project Annual GHGs (MT/year)Summer ROG Nox PM10 PM2.5 CO2 CH4 N2O MT CO2ENon-Event 9.1133 1.4841 1.9423 1.9423 NonEvent 824.1369 1.4876 0.0243 862.8998Subtotal (Daily*285/2) 1298.6453 211.4843 276.7778 276.7778 Event 1061.896 1.4965 0.0243 1,100.85
Wtd Avg 876.44 1.49 0.02 915.25Winter ROG Nox PM10 PM2.5 Const 55.02Non-Event 9.1133 1.4841 1.9423 1.9423 Existing Annual GHGs (MT/year)Subtotal (Daily*285/2) 1298.6453 211.4843 276.7778 276.7778 CO2 CH4 N2O MT CO2E
253.08 0.35 0.00 261.95Event -- 80 days per year Summer ROG Nox PM10 PM2.5Event 9.8042 2.8351 3.3411 2.336Subtotal (Daily*80/2) 392.168 113.404 133.644 93.44
Winter ROG Nox PM10 PM2.5Event 9.833 2.989 3.3412 2.3361Subtotal (Daily*80/2) 393.32 119.56 133.648 93.444
Project Summary ROG Nox PM10 PM2.5Total pounds per year 3,382.78 655.93 820.85 740.44Total tons per year 1.69 0.33 0.41 0.37Average pounds/day 9.27 1.80 2.25 2.03
Existing Operations ROG Nox PM10 PM2.5Total tons per year 0.29 0.22 0.13 0.04Average pounds/day 1.58 1.23 0.73 0.24

SFSU - Creative Arts & Holloway Mixed-Use Project Demolition
DemolitionBuildings 52,982.00 sf Block 1
32,023.00 sf Block 6Tonnage debris 3,910.23 tons Building debris based on CalEEMod assumption of 0.046 tons/sf
Asphalt Demodepth 4 inches = 0.111 ydarea 0.83 ac = 4017.169 sq ydvolume = 445.9057912 yd3
Tonnage debris = 535.0869494 Paved Area debris: assuming 2,400 lbs/cy debris (CalRecycle 2004)
Total Demo Offhaul 4,445.32 tons
CalRecycle 2004. Construction/Demolition and Inert Debris Tools and Resources. January 23, 2004.Available at: http://www.calrecycle.ca.gov/swfacilities/cdi/Tools/Calculations.htm

SFSU - Creative Arts & Holloway Mixed-Use Project Architectural Coatings
Proposed ProjectINPUT VALUES LandUseSubType LandUseUnLandUseSize LandUseSquareFeetAssumed:
Residential SF 111,146 Student Housing 550 beds 111,146 200 dwelling units Residential Interior 225,071 Total ResSF 111,146 (based on 2.75 beds per unit)
Residential Exterior 75,024 Retail 25 ksf 25,000 555.73 sf/duCreative Arts 75 ksf 75,000
Non-Residential SF 160,000 Concert Hall 60 ksf 60,000 Non-Residential Interior 240,000 Total NonResSF 160,000 Non-Residential Exterior 80,000 Parking Garage 70 spaces 28000
Parking SF 28,000 Parking Exterior * 6% 1,680.00
Non-Residential Exterior 81,680

SFSU - Creative Arts & Holloway Mixed-Use Project Traffic
SF State PM Peak Hour Net New Trips by Land Use
Housing Retail Academic Concert Hall Total Net NewVehicle -20 0 0 251 231Transit -41 0 0 109 68Active 49 0 0 52 101
-12 0 0 412 400Source: Fehr & Peers, 2016
Notes: Vehicle trips includes drive alone, motorcycle, carpool, TNC, taxi and drop off/pick ups.
SF State Daily Net New Trips by Land Use
Housing Retail Academic Concert Hall Total Net NewVehicle -145 0 0 251 106Transit -289 0 0 109 -180Active 631 0 0 52 683
197 0 0 412 609Source: Fehr & Peers, 2016
Notes: Vehicle trips includes drive alone, motorcycle, carpool, TNC, taxi and drop off/pick ups.
Existing Project Existing ProjectVehicle 145 0 145 251
Daily Trip GenExisting 190 beds
69 dwelling units (per 2.75 beds/unit)2.10 trips/du
Normal Day 550 beds200 dwelling units (per 2.75 beds/unit)
0 trips/du
Event Day 550 beds200 dwelling units (per 2.75 beds/unit)
0.00 trip/du1.86 trips/ksf concert hall
Daily Concert Day
xed-Use Building (Block BECA (Block 1)
xed-Use Building (Block BECA (Block 1)