appendix c: growth and economic assessment report
TRANSCRIPT

Oxford to Cambridge Expressway
Corridor Assessment Report
Appendix C: Growth and Economic Assessment Report
PCF Stage 1
June 2018
HE565628-JAC-GEN-SCHW_MT-RP-TR-0017| P01
Registered office Bridge House, 1 Walnut Tree Close, Guildford, GU1 4LZ
Highways England Company Limited registered in England and Wales number 09346363

i
Contents
Executive Summary ...................................................................................................................... 1
1. Introduction ....................................................................................................................... 2
1.1 Background ......................................................................................................................... 2
1.2 This Appendix ..................................................................................................................... 2
2. Enabled Development Methodology ............................................................................... 3
2.1 Introduction ......................................................................................................................... 3
2.2 Method Overview ................................................................................................................ 3
2.3 Growth Assumptions ........................................................................................................... 4
2.4 Growth Modelling Approach................................................................................................ 5
2.5 Scenarios Tested ................................................................................................................ 9
2.6 Junction Capacity ................................................................................................................ 9
2.7 Reference Case Growth ................................................................................................... 11
2.8 Caveats and Limitations .................................................................................................... 12
3. Enabled Development Results ...................................................................................... 13
3.1 Introduction ....................................................................................................................... 13
3.2 Housing Growth ................................................................................................................ 13
3.3 Workers and Jobs ............................................................................................................. 15
3.4 Land Take Assessment .................................................................................................... 15
4. Econometric Modelling .................................................................................................. 23
4.1 Introduction ....................................................................................................................... 23
4.2 Approach to Modelling ...................................................................................................... 23
4.3 Econometric Modelling Results ........................................................................................ 25
5. Conclusions .................................................................................................................... 28
Appendix A. Glossary ................................................................................................................. 29

Oxford to Cambridge Expressway Corridor Assessment report
1
Executive Summary
This Growth and Economic Assessment Appendix presents the findings of the enabled development
and economic growth modelling for the Oxford to Cambridge Expressway to inform the Stage 1A
corridor selection process. This includes an assessment of the potential role of the Project in enabling
new homes, new employment space and new jobs.
The analysis has also carried out sensitivity tests to illustrate how the Oxford to Cambridge Expressway
in combination with East West Rail (EWR) and other public transport could enable higher development
densities, reduced land take (for the same scale of development), and give the potential for modal shift
towards non-car transport to in effect increase capacity and enable further development.
No decisions have been made by government at this stage on if, how much and where extra growth is
planned in the corridor. Consequently, this analysis focuses on considering how much growth could by
enabled by the Project if it were to go ahead. The scale of growth potentially enabled only takes in to
account the potential ability of the Oxford to Cambridge Expressway to accommodate traffic associated
with the growth. The potential scale of development does not take in to account other factors such as
environmental constraints. Further work would be needed to consider to what degree they influence the
scale of potential growth.
Overall the assessment has identified the following:
All corridor options have the potential to enable significant amounts of new housing and
employment if it were decided to plan for and allocate such growth.
Corridor C2/C3, followed by B2/B3, will potentially enable the most new homes. This is due to
the assessed greater spare capacity of the Oxford to Cambridge Expressway junctions for
these corridors. Higher spare capacity is a result of less existing or future planned development
in these areas and therefore less traffic flow. Enabled development is less along corridors which
are already more heavily developed, such as Corridor A.
Partly as a consequence of the higher level of enabled development, Corridors C2/C3 and
B2/B3 are also modelled to have the greatest impact in terms of the number of workers and
jobs enabled. However, productivity and economic growth impacts are estimated to be greater
along Corridor B than C. This is due to the improved connectivity, travel time savings, and
improved linkages to existing clusters of high value knowledge economy for Corridor B options.
Corridors B1 and C1, to the north and west of Oxford, are most closely aligned with EWR and
its stations, and are consequently modelled to benefit the most from the multi-modal corridor in
terms of providing the potential for increased density and reduced land take.
This assessment is heavily dependent on the modelled capacity and the number and location
of the junctions on the Oxford to Cambridge Expressway. Junction capacity could change, and
greater capacity delivered in locations to enable new town development for example. Also the
Oxford to Cambridge Expressway could free up capacity on other roads, and therefore enable
wider growth, and this could be relevant in existing congested areas. However, this impact has
not been modelled at this stage. As such these figures provide a high level review of
development enabled based on the assumed conditions modelled.
In summary while the enabled development impacts are fairly similar for Corridor C2/C3 and B2/B3, the
additional productivity and economic benefits along Corridor B2/B3 suggest that in the longer term this
corridor could provide the greatest growth benefits.
The main CAR details how the findings of this growth modelling has been applied to the relevant
Strategic and Intervention Objectives set by Highways England and the Department for Transport.

Oxford to Cambridge Expressway Corridor Assessment report
2
1. Introduction
1.1 Background
Highways England (HE) is preparing an assessment of the overall case for investment in the Oxford to
Cambridge Expressway and appraisal of corridor and route options. Assessment of the enabled
development and economic growth potential is required to support the appraisal.
The enabled development and economic growth potential analysis will feed into a sifting process which
will include traffic and transport, environmental (relating to the road), engineering, highway design and
cost considerations and support in the identification of a preferred corridor and route alignment for the
Oxford to Cambridge Expressway. The analysis will also inform the wider economic impact assessment
for the investment. It will be used by HE to plan for the development of the new route.
The project is progressing through Highways England Project Control Framework (PCF) at Stage 1.
1.2 This Appendix
The Corridor Assessment Report (CAR) presents the findings of Stage 1A of the PCF process and
presents a comparative analysis of each corridor to identify an optimal corridor option for the Oxford to
Cambridge Expressway, which will be progressed to Stage 1B assessment (route analysis).
This Growth and Economic Assessment Appendix sets out the results of the enabled development and
economic growth modelling. This report includes the following sections:
Methodology
Growth modelling results
Econometric modelling results
Conclusions and next steps.

Oxford to Cambridge Expressway Corridor Assessment report
3
2. Enabled Development Methodology
2.1 Introduction
This section provides a high-level overview of the methodology applied at this stage to support the
corridor selection process. This includes an overview of the various stages of the assessment, approach
to modelling enabled development, scenarios tested, core assumptions, and caveats and limitations of
the assessment which should be considered when interpreting the results.
The method applied to inform the corridor decision making process is focused on reviewing the potential
of each corridor option to unlock new homes, create new jobs, and have productivity impacts on the
economy. Broad assumptions are used to provide a high level order of magnitude assessment for each
corridor. There are inherent uncertainties and margins of error. Sensitivity testing has been undertaken
to provide a further level of analysis on key factors which could alter development and growth (e.g.
alignment with EWR).
Analysis and research is ongoing for each corridor to inform the Value For Money (VfM) assessment
and align with the WebTAG guidance. This will be progressed during Stage 1B.
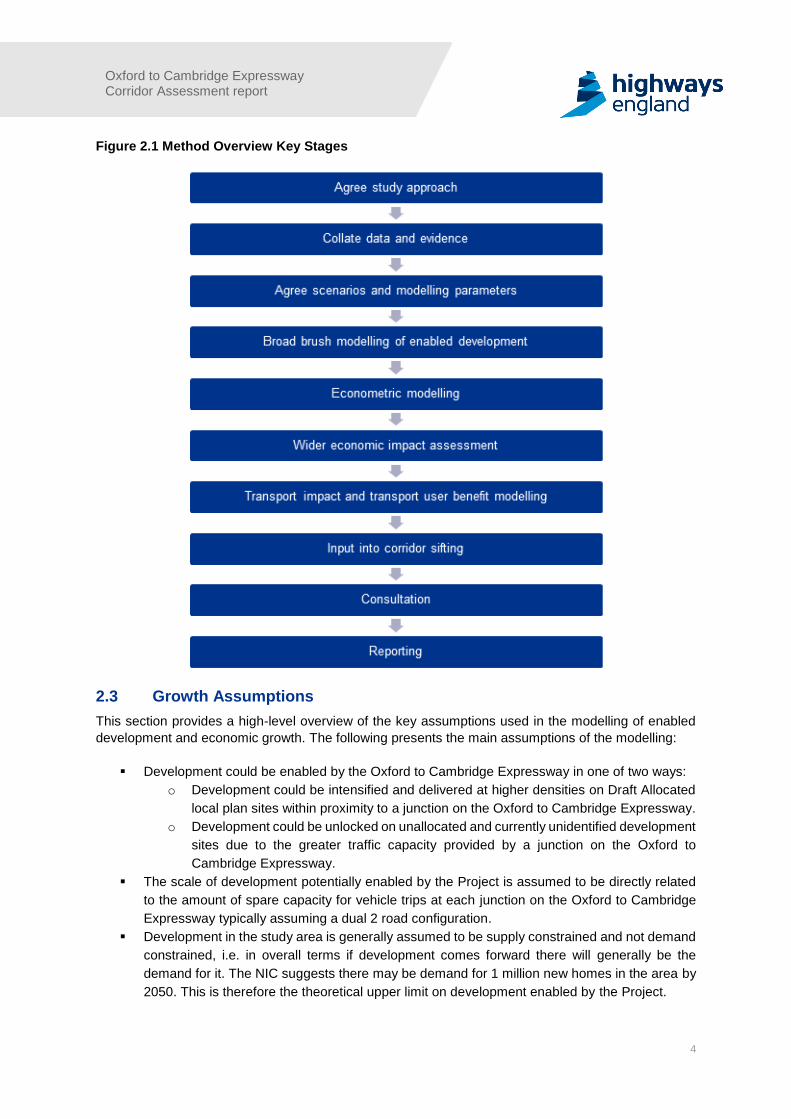
2.2 Method Overview
The enabled development and economic growth modelling has two main purposes. In Stage 1A this
focuses on a high-level assessment of the enabled development and economic growth potential of the
Project to inform the corridor selection process. At Stage 1B this will be developed further to prepare a
WebTAG compliant assessment of the wider economic benefits of the preferred corridor which will be
used to develop the business case for investment in the Project. Figure 2.1 presents the key stages
and tasks which have been undertaken at Stage 1A to inform the corridor selection process.
Oxford to Cambridge Expressway Corridor Assessment report
4
Figure 2.1 Method Overview Key Stages
2.3 Growth Assumptions
This section provides a high-level overview of the key assumptions used in the modelling of enabled
development and economic growth. The following presents the main assumptions of the modelling:
Development could be enabled by the Oxford to Cambridge Expressway in one of two ways:
o Development could be intensified and delivered at higher densities on Draft Allocated
local plan sites within proximity to a junction on the Oxford to Cambridge Expressway.
o Development could be unlocked on unallocated and currently unidentified development
sites due to the greater traffic capacity provided by a junction on the Oxford to
Cambridge Expressway.
The scale of development potentially enabled by the Project is assumed to be directly related
to the amount of spare capacity for vehicle trips at each junction on the Oxford to Cambridge
Expressway typically assuming a dual 2 road configuration.
Development in the study area is generally assumed to be supply constrained and not demand
constrained, i.e. in overall terms if development comes forward there will generally be the
demand for it. The NIC suggests there may be demand for 1 million new homes in the area by
2050. This is therefore the theoretical upper limit on development enabled by the Project.

Oxford to Cambridge Expressway Corridor Assessment report
5
We assume that Expressway junctions will be located at key intersections with the existing
strategic road network and close to existing settlements.
Enabled housing development is assumed to generally take place within 4km (5-10 minute
drive time on local roads) to each Expressway junction. Enabled employment development can
also take place in this area but is also anticipated to take place in a wider area (e.g. nearby
town centres).
The amount and location of development enabled is assumed not to be constrained by existing
planning policy for the purposes of estimating the Oxford to Cambridge Expressway related
enabled capacity. There could though be other constraints, e.g. environmental, that it is decided
do limit capacity. These have not been considered in this exercise.
We assume that sufficient investment in essential local and non-transport strategic
infrastructure will be available so that the development potential associated with the Project is
not limited by these factors. (We assume that funds such as Community Infrastructure Levy
(CIL), S106, Housing Infrastructure Fund (HIF), the Oxfordshire Housing Deal and their
successors can contribute to this investment).
EWR could also enable new development, and the scale of this impact is being reviewed by a
separate commission. Where EWR stations and Expressway Junctions are within proximity
there could be a combined impact which could enable development in two ways:
o EWR could enable higher density development. If a set amount of land could be
developed then the scenario with EWR could enable more development than the
scenario without EWR
o EWR could enable a modal shift to more use of public transport/cycling/walking which
would allow more development for a given junction capacity (assuming this constraint
comes in to effect before any constraint on rail capacity)
Both of these effects of EWR combined with the Oxford to Cambridge Expressway are tested
and presented as sensitivity analysis on the overall results for each corridor.
2.4 Growth Modelling Approach
The following presents the key stages and tasks involved in the modelling of the amount of
development enabled by the Project:
A development database was prepared of all known planned, promoted and allocated
development sites within the enabled growth areas of each Oxford to Cambridge Expressway
corridor.
Promoted sites are removed, duplicated sites combined (assuming largest site areas, and
largest development potential is retained, and smaller sites removed), under construction
development discounted where likely to be complete in 2018, and gaps in the development
database filled. This provides the ‘Reference Case’ for the development potential in each
corridor.
Draft Allocated sites within 4km of each Expressway junction are then treated with development
intensification assumptions. This provides an indication of the potential intensification impact of
the Oxford to Cambridge Expressway.

Oxford to Cambridge Expressway Corridor Assessment report
6
We have carried out a broad-brush initial assessment of junction capacity and spare capacity.
Spare capacity is taken to be the difference between total indicative capacity and capacity net
of wider assumed traffic demand and data from the National Trip End Model (NTEM) on
assumed development. We assume that NTEM accounts for 75% of the growth identified in the
development database (reference case) i.e. this development does not require additional
capacity provided by the Oxford to Cambridge Expressway. The remaining 25% reference case
growth is counted against the overall Oxford to Cambridge Expressway junction capacity
figures.
The growth potentially enabled by the Project is assumed to broadly be constrained by the
spare capacity of each junction. This is based on the number of journeys during peak time
which can enter and exit the junction, with a conversion factor to provide an estimate for number
of homes, and an allowance to achieve 85% of total capacity to ensure the normal functioning
of the junction.
The capacity of each junction to accommodate new homes is broadly assumed to be
independent of the capacity of each junction to accommodate new jobs. Specifics will depend
on locations and commuting patterns.
The spare capacity of each junction has only very broadly been estimated and actual spare
capacity could vary substantially from the figures used in this initial analysis. Results could vary
for example if it is concluded that the Project generates more traffic travelling through the region
from and to locations outside the region on the road than current assumed.
The difference in capacity between the different corridors are largely a consequence of the
underlying assumptions on how the different locations of the junctions will impact on capacity.
These assumptions could vary significantly in the light of further work.
Growth potential should be considered in the context of the property market and economic
development potential of each corridor though given the scale of development and long time
frames there is significant potential for new property market and economic development
characteristics to emerge.
Intensified development is compared to junction capacity in each area. Where junction capacity
is less than the ‘Reference Case’ then no impacts are expected. Where junction capacity is less
than the total intensification impact of the Oxford to Cambridge Expressway then the
intensification impact is capped to junction capacity. When junction capacity is higher than the
intensification impact of the Oxford to Cambridge Expressway, the remaining junction capacity
is identified as new unallocated development enabled by Oxford to Cambridge Expressway.
This provides the ‘Oxford to Cambridge Expressway Case’ as both intensification on existing
sites, and as new unallocated development (e.g. unplanned new towns or settlements).
Once we have identified the number of existing planned, intensified, and new unallocated
dwellings proposed for each junction we then estimate the equivalent number of population and
workers which will be accommodated. From this we estimate the number of jobs which would
be required to support this incoming population, and then convert this number of jobs into the
employment floorspace required to deliver jobs growth.
The land take of the modelled unplanned growth is then estimated based on the density and
floorspace assumptions. This identifies the total land required for development under each
corridor option and each scenario.
All growth modelling is undertaken for each junction, before being aggregated up and
summarised at the overall corridor level. Section 3 of this report presents the summary results
for each corridor.
Oxford to Cambridge Expressway Corridor Assessment report
7
A ‘EWR and Oxford to Cambridge Expressway Case’ scenario has been run which considers
the additional intensification which could be enabled on sites which are within 3km of the EWR
stations and 4km from an Oxford to Cambridge Expressway junction. This follows a similar
approach as outlined above, but with higher development densities (+60% for residential
density, and +20% for employment land density).
Sensitivity testing is also undertaken to assess the impact of modal shift from road to rail where
the Oxford to Cambridge Expressway junctions and EWR align. This is based on the
assumption that there could be 20% increase in spare capacity at Oxford to Cambridge
Expressway Junctions when aligned with EWR, resulting in an increased scale of development.
Figure 2.2 provides a summary of the various stages and tasks undertaken in the enabled
development growth modelling.

Oxford to Cambridge Expressway Corridor Assessment report
8
Figure 2.2 Enabled Development Growth Modelling Overview
Ox-Cam Case
Modelling
Ox-Cam and
EWR Case
Modelling
Data Collection
Reference Case
Modelling
Ox-Cam Case Unallocated
Development Impact
General location of unallocated
development identified (by junction
and LA) however not included in
development database
Land take (ha) of unallocated land
for Ox-Cam Case estimatedOx-Cam Case Intensification Impact
Development Database
Development potential modelled
based on Assumptions
Promoted Allocated Permitted
Removed
potential for use in Stage 1b
Duplicated SitesSites with no development
details
Sites with full development
details
Promoted Sites
from ‘Call for Sites’ and other LA
Studies
Allocated Sites
from Local Plans
Ox-Cam and EWR Case Intensification Impact
Ox-Cam and EWR Case
Unallocated Development
Impact
Land take (ha) of unallocated land
for Ox-Cam and EWR case
estimated
Draft Allocation Sites within 3km
of EWR Station are subject to
further development intensification
Remaining spare capacity is
identified as new unallocated
development enabled by Ox-Cam
Junction capacity less than
existing allocations
No Ox-Cam impact (reference
case figures used)
Junction capacity less than Ox-
Cam intensification potential
Ox-Cam intensification impact is
capped to junction capacity
Junction capacity is more than Ox-
Cam intensification potential
Remaining capacity identified as
new unallocated development
enabled by Ox-Cam
Permitted Sites
from Glenigans database
Study Area
4km from WSP routes
Removed
Records of all sites retained, but
only the largest sites are retained
for modelling
Draft Allocation sites within 4km
of an Ox-Cam junction are
subject to development
intensification assumptions
Total intensified development
compared to junction capacity
Reference Case Development Database

Oxford to Cambridge Expressway Corridor Assessment report
9
2.5 Scenarios Tested
This Appendix presents results for three scenarios, seven potential Oxford to Cambridge Expressway
routes and sensitivity testing of the possible impact East West Rail (EWR) could have on growth
enabled by the Project. Table 2.1 below presents the growth scenarios tested.
Table 2.1 Growth Scenarios Tested
Scenario Oxford to Cambridge
Expressway EWR Western Section
1. Reference Case X X
2. Impact on Allocated Growth Sites X
3. Impact on Allocated and Aspirational Growth X
The three scenarios are:
Reference Case – Under this scenario the Project is assumed not to proceed. Existing planned
development sites (e.g. those with planning permission) and allocated sites (e.g. those
development sites which have been identified and adopted in local plans) are assumed to come
forward for development up to their planned capacity as per the local plans. Where
development details have not been made available the potential capacity of the site has been
estimated based on a series of assumptions.
Oxford to Cambridge Expressway Case allocated sites – Under this scenario the Oxford to
Cambridge Expressway will come forward along one of seven corridors. We assume that the
Project could have the impact of increasing the capacity and density of development on ‘Draft
Allocated’ sites (e.g. development sites identified for growth in draft local plans) within 4km of
each new Oxford to Cambridge Expressway junction.
Oxford to Cambridge Expressway Case allocated and aspirational growth – Under this scenario
the Oxford to Cambridge Expressway will come forward along one of seven corridors, and in
addition to intensifying ‘Draft Allocated’ sites, the spare capacity for vehicle trips at each junction
will enable new development to come forward on unallocated (not currently identified or planned
for) sites generally within 4km of the new Oxford to Cambridge Expressway junction.
2.6 Junction Capacity
The Project is a proposed nationally significant piece of infrastructure which can facilitate and improve
east west travel demand movements. When introduced the Oxford to Cambridge Expressway is
expected to become an attractive route for existing users, as well as future users, of the highway
network.
To inform Stage 1A Corridor Option Selection within the wider HE PCF, traffic modelling is undertaken
to understand the potential impacts of the introduction of the Project. The modelling exercise is carried
out within Highways England’s South East Regional Transport Model (SERTM) Design Freeze v3.

Oxford to Cambridge Expressway Corridor Assessment report
10
One of the impacts to be understood is the differentiation of how each proposed corridor will enable
additional housing and jobs growth above the current national forecasts. The current national forecasts
are provided by the Trip End Modelling PROgram (TEMPRO) V7.2. TEMPRO is updated at various
points in the cycle of local authority planning periods and as such includes the most relevant planning
forecasts for each authority, based upon published documentation such as the Strategic Housing Land
Availability Assessment (SHLAA) and if available local plans. The national forecasts for future traffic
conditions have been applied to the entire extents of SERTM and are assumed to be inclusive of
committed and allocated sites at a local authority level. That is to say that traffic impacts in the forecast
years are reflective of a growth scenario which does not specifically account for a development that is
dependent (unlocked) on the introduction of the Project.
To determine the additional development enabled by the Project a high level junction assessment is
carried out for each corridor. This assessment introduces junctions at various locations within each
corridor, dependent on a set of previously agreed criteria. For example, intersection of Oxford to
Cambridge Expressway with existing major roads (typically A road and above in hierarchy) or known
interactions with existing urban conurbations.
At each of the junctions introduced, within each of the specific corridor options, vehicle capacity is
calculated and compared against the forecast numbers of vehicles through each junction. This allows
for a Volume to Capacity (VoC) ratio to be determined for each junction within each corridor option.
Available capacity is then calculated for each junction, up to a total VoC of 0.85. This figure is generally
accepted as being the threshold for ‘approaching capacity’ and it is at this point that performance of the
junction may start to deteriorate. It assumed that any additional vehicles at a junction as a result of
dependent development should not take that junction to a state of deteriorating performance. Figure
2.3 shows an example diagram for the calculation of available junction capacity.
Figure 2.3 Spare Junction Capacity Calculation Diagram

Oxford to Cambridge Expressway Corridor Assessment report
11
The total available capacity at each junction is summed over each corridor. This spare capacity in
vehicles by corridor is then used to determine the likely number of dwellings that would produce the
equivalent number of vehicles. The trip rate to convert from traffic flow to dwellings was extracted from
observed count data which is stored in a database called Trip Rate Information Computer System
(TRICS), and an average rate of areas with similar properties as the area of interest was used to include
more development trip information and to provide a more accurate trip rate. This rate of production is
assumed to be consistent across corridors so as to not bias any assessment.
The estimated increase in number of dwellings per local authority in the future, and potential users of
the Oxford to Cambridge Expressway junctions, was calculated using a combination of TEMPRO and
TRICS. TEMPRO determined the number of trips, and TRICS was used to convert this into the number
of dwellings. These figures could then be compared with the estimated available capacity to determine
whether there would be enough capacity at each of the junctions to accommodate the predicted number
of dwellings.
While TEMPRO includes the majority of the allocated growth anticipated to come forward in the future
it is understand that it may not include all growth in the corridor areas. In addition it may not consider
permitted or planned developments which have been submitted and may come forward in these areas.
When the enabled development impacts of the Project are being considered the spare junction capacity
is reduced further taking into account 25% of the Permitted and Allocated growth estimated in the
Reference Case for each junction.
There are several assumptions associated with this methodology, more specifically:
Junctions are treated in isolation and as such, vehicle impacts on capacity of movement through
multiple junctions is not captured
Junction capacity is the modelled capacity of each junction, meaning that under certain
operational conditions, the overall capacity for any one junction may change slightly from
corridor to corridor option
Junction capacity is based on typical design standards. There is potential for larger capacity
junctions to be designed for and delivered in areas where new towns are proposed, or additional
junctions to be developed in these areas. This could significantly change the amount of spare
capacity for any given corridor
Dwelling production rates of vehicles is assumed to be the same, irrespective of geography
Expressway junctions were modelled to provide all movements to minimise the delays and they
could differ from the actual designs
For residential trip rates, privately owned houses and flats with select locations of Edge of Town
Centre and Suburban area was collected and used to determine a residential weekday trip rate
Due to the proximity of sub-options 2 and 3 the junction capacity for these corridor options are
considered to be the same.
The assessment does not consider the additional loading and requirements of aspiration
employment and jobs growth trips.
2.7 Reference Case Growth
Work on the assessed Reference Case growth (that which would occur independent of the Project) is
still on-going. Further steps and caveats on accuracy include:
The Reference Case growth relates to the permitted and allocated development within a 4km
corridor study area and is therefore different for each corridor. This is a smaller study area than
used in the 2016 NIC work.

Oxford to Cambridge Expressway Corridor Assessment report
12
The Reference Case is defined as allocated development capacity and development from 2018
onwards. As all local plans do not run through to 2050 this does not cover all capacity that could
come forward between now and 2050 without the Project.
The work does not yet take full account of feedback from consultations with the local authorities
and their latest information. For example, there may be further sites where development is
complete and will should be taken out of our database.
The figures do not include an allowance for development on sites of less than 100 units. This
will tend to increase numbers.
The figures are not directly comparable with other assessment of baseline capacity as for
example work for the National Infrastructure Commission (NIC) and England’s Economic
Heartland (EEH) assess baseline for the full area of the local authorities in the Oxford to
Cambridge Expressway corridor whereas the figures presented here are for the area of
influence within these local authorities.
Our understanding is that the figures for the EEH work project forward rates of development
through to 2050 and so present higher numbers and are also not comparable with this work
which focuses on allocations rather than rates of development.
Future revisions to our estimates are likely to differ from our latest estimate.
2.8 Caveats and Limitations
In addition to above points the following provides an overview of other caveats and limitations of this
enabled development and economic growth modelling that should be considered when interpreting
the results:
The assessment does not consider, or test, the scale of aspirational development envisaged
by NIC (i.e. 1 million new home). This is not yet an adopted policy position, and it is unlikely
that the Project alone will deliver this scale of growth.
The scale of development which could be enabled by the Project would require a substantial
increase in the construction and delivery of new homes if to be achieved by 2050. The realism
of this requirement has not been tested at this stage.
The assessment does not consider the additional capacity which will be freed up on other roads
as a result of the Oxford to Cambridge Expressway. This additional capacity could enable
development along other road networks as a result of spare capacity.
Environmental constraints on enabled development have not been assessed at this stage.
The modelled junction capacity is a key driver in the scale of development which can be enabled
by the Project. At present spare junction capacity has been assessed based on a range of
assumptions regarding the type of junction needed, likely location, and potential existing and
future traffic loading. The junction capacity could change significantly and can be designed to
be larger or smaller if required. For example, if a new town was proposed a larger junction with
greater capacity could be developed to service this new settlement. At Stage 1A all junctions
are modelled to be of similar scale, with the key differentiator in capacity being the existing and
future traffic flows.

Oxford to Cambridge Expressway Corridor Assessment report
13
3. Enabled Development Results
3.1 Introduction
The following section presents the results of the enabled development and economic growth modelling
for Stage 1A. This section presents a comparative analysis between each corridor for a series of key
growth indicators including the number of homes enabled, amount of employment floorspace, number
of workers, jobs, productivity, and land take. We also present sensitivity testing on the potential impact
of EWR in terms of land take and modal shift impacts.
In summary the results of the growth modelling indicate that the Project can provide improved
accessibility that could enable a substantial number of new homes across all corridors, with the most
enabled development observed along corridors which have the lowest current traffic flow levels,
including Corridor C2/C3 and Corridor B2/3. Partly due to these higher levels of development these
corridors will also have the greatest impact in terms of the number of workers and jobs. However greater
economic and productivity impacts could be observed in Corridor B2/B3.
Corridors B1 and C1, to the north and west of Oxford, are most aligned with EWR stations, and could
therefore benefit the most from the multi-modal corridor, providing increased density and reduced land
take. The corridor that benefits the most from EWR could though be influenced by decisions on if and
where to locate new settlements and the relation of these settlements to the Oxford to Cambridge
Expressway junctions and EWR stations.
This assessment is heavily dependent on the modelled capacity and location of the Oxford to
Cambridge Expressway junctions. Junction capacity could change, and greater capacity delivered in
locations to enable new town development.
3.2 Housing Growth
The Project can enable development through intensification of draft allocated sites, and by unlocking
new unallocated sites for development. This effect will not be universal across the entire corridor, but
focused around the main Oxford to Cambridge Expressway junctions due to the improved accessibility.
Table 3.1 and Figure 3.1 below presents our analysis of the homes potentially enabled by the Project
for each corridor option under each scenario. This shows an estimate of the homes which the Project
could enable. These figures include the Reference Case growth.
This assessment shows that overall the Project is estimated to have the potential to enable between
295,000 and 355,000 new homes in addition to the Reference Case. Corridors C2/C3 are assessed to
have the most capacity to generate new homes, equivalent to 355,000 new homes on unallocated sites,
and 360,000 homes in total. This is closely followed by Corridor B2/B3 which could enable 345,000 new
homes on unallocated sites, and deliver 350,000 homes in total. This should be observed in the context
that Corridor C includes one extra junction compared to the other corridor options.
Table 3.1 Assumed Development Enabled Under Each Scenario: Homes
Scenario Corridor
A
Corridor
B1
Corridor
B2
Corridor
B3
Corridor
C1 Corridor
C2 Corridor
C3
Reference Case 85,000 90,000 90,000 90,000 90,000 90,000 90,000

Oxford to Cambridge Expressway Corridor Assessment report
14
Scenario Corridor
A
Corridor
B1
Corridor
B2
Corridor
B3
Corridor
C1 Corridor
C2 Corridor
C3
Oxford to
Cambridge
Expressway
Intensification
Impact (Inc. Ref
Case)
90,000 95,000 95,000 95,000 95,000 100,000 100,000
Oxford to
Cambridge
Expressway Case
Intensification and
Aspirational Growth
(Inc. Ref Case)
405,000 390,000 440,000 440,000 410,000 455,000 455,000
Total Oxford to
Cambridge
Expressway
Additional Growth
Impact (Exc. Ref
Case)
320,000 300,000 350,000 350,000 320,000 360,000 360,000
Note: figures rounded to nearest 5,000. Figures may not sum due to rounding
Figure 3.1 Assumed Development Enabled Under Each Scenario: Homes
Note: figures rounded to nearest 5,000. Figures may not sum due to rounding.
Comparing this growth with the NIC’s vision for delivery of 1 million new homes suggests that the
Oxford to Cambridge Expressway and associated local infrastructure could enable between 30-35%
of this growth. When taken alongside Reference Case growth, this could enable closer to 45% of the
required growth.

Oxford to Cambridge Expressway Corridor Assessment report
15
The Reference Case growth is based on a more confined study area for the Project compared to the
overall Oxford Cambridge corridor area used as a basis for the NIC’s vision and so are likely to under-
estimate total growth.
3.3 Workers and Jobs
We estimate the potential incoming population and number of workers which could be accommodated
at development enabled by the Project. This is based on a broad assumption of 2.33 people per dwelling
and 1.27 workers per dwelling.
The number of forecast jobs in the wider study area (i.e. full local authority areas) under the corridor
options has been estimated by Cambridge Econometrics using their Local Economic Forecasting Model
(LEFM), presented in Section 4.
The resulting ratios of workplace to resident workforce is shown in Table 3.2 below.
Table 3.2 Oxford to Cambridge Expressway Jobs to Resident Workforce Ratios
2020 2050,
Reference
Case
2050,
Scenario
A
2050,
Scenario
B1
2050,
Scenario
B2/3
2050,
Scenario
C1
2050,
Scenario
C2/3
Ratio of
Workplace
to Resident
Employment
1.12 1.09 1.06 1.07 1.06 1.06 1.06
The wider study area current experiences net in-commuting, with 12% more people employed within
the area than there are employed people who live in the area. The construction of a significant number
of new homes is expected to have a direct impact on this ratio as if workers within the study area are
more easily able to find homes also located within the area then the net inward commuting effect should
decrease, and the ratio of resident and workplace employment will move closer to parity. We see that
the Reference Case scenario reduces the workplace/resident employment ratio to 1.09, whereas the
five Expressway scenarios all produce a ratio of around 1.06 to 1.07. The ratio is not anticipated to vary
significantly between the Expressway scenarios.
3.4 Land Take Assessment
The Project will increase the capacity and provide access to allow development to come forward. Some
of this development will take place on previously undeveloped land and may be planned to achieve
higher densities in response to the changing growth agenda in these areas. In additional, where the
Oxford to Cambridge Expressway junctions and EWR stations are suitably close to each other there
could be the potential for higher densities of development, delivering more homes and job opportunities
over the same spaces due to the improved access and connectivity. This could result in more efficient
use of development land. While land take will be large due to large scale of growth, higher densities will
mean less land is required to deliver the same amount of growth.
The following analysis considers the amount of land which would be required to deliver the development
enabled by the Project and compares this to the existing amount of greenfield land available. This also
considers the potential impact that EWR will have in conjunction with the Oxford to Cambridge
Expressway to increase density and make more efficient use of land.

Oxford to Cambridge Expressway Corridor Assessment report
16
This assessment does not consider environmental and utilities capacity constraints as this analysis has
not yet been undertaken.
Table 3.3 and Figure 3.2 below present the existing urban area around each Oxford to Cambridge
Expressway junction location, the amount of greenfield land (including land with environmental
constraints) and the potential land take required to deliver the number of homes and jobs enabled by
the Oxford to Cambridge Expressway only (not including EWR).
This indicates that Corridor C1 is currently the most densely developed corridor, with over 8,900ha of
existing urban area, while Corridor B2/B3 are the leased developed with 7,900ha of urban area. The
amount of greenfield land along each corridor is significant. This includes land which is contained and
could not come forward for development including protected environmentally sensitive areas. Corridor
C2/C3 has the largest amount of greenfield land, totalling 52,500ha.
Growth enabled by the Project is estimated to require between 7,000ha to 8,500ha for Corridor B1 and
C2/C3 respectively. This level of growth will have different impacts on greenfield land, with Corridor
B2/B3 requiring 17% of the greenfield land capacity, and Corridor B1 requiring 15% of the greenfield
land capacity based upon the growth and density assumptions used for this modelling.

Oxford to Cambridge Expressway Corridor Assessment report
17
Table 3.3 Oxford to Cambridge Expressway Land Take Assessment
Corridor
A
Corridor
B1
Corridor
B2
Corridor
B3
Corridor
C1 Corridor
C2 Corridor
C3
Existing Urban
Area 8,500 8,500 8,000 8,000 9,000 9,000 9,000
Ref Case Land
Take 3,000 3,500 3,000 3,000 3,500 3,500 3,500
Oxford to
Cambridge
Expressway
Enabled
Development
Land Take
7,500 7,000 8,000 8,000 7,500 8,500 8,500
Total Urban
Land Take 19,000 19,000 19,000 19,000 20,000 21,000 21,000
Unallocated
Greenfield Land 49,500 47,500 49,500 49,500 48,000 52,500 52,500
Proportion of
Greenfield land
required to
deliver Oxford to
Cambridge
Expressway
enabled
development
15.3% 14.7% 16.6% 16.6% 15.7% 16.1% 16.1%
Note: Figures rounded to nearest 5,000. Figures may not sum due to rounding.
Figure 3.2 Oxford to Cambridge Expressway Land Take Assessment
Note: Figures rounded to nearest 500ha.

Oxford to Cambridge Expressway Corridor Assessment report
18
Table 3.4 and Figure 3.3 presents the proportion of the total area around each Oxford to Cambridge
Expressway junction which is currently urban, would be developed during the Reference Case, would
be developed during the Oxford to Cambridge Expressway case, and then demonstrates the impact
EWR could have in reducing land take requirements by increasing densities.
This indicates that under the Reference Case and Oxford to Cambridge Expressway the proportion of
land around each junction which may be required for development would double compared to existing
conditions. The proportion of urban area around each junction would increase from between 13% and
14%, to between 31% for Corridor A and C1, and 32% for Corridor C2/C3. This impact will be from both
the Reference Case and Oxford to Cambridge Expressway scale growth.
With the changes in densities assumed in this modelling EWR could decrease the amount of urban
areas by a modest volume, with the smallest impact of 0.6% for Corridor A, and largest impact of 1.7%
and 1.5% for Corridor B1 and C1 respectively. That is due to the greater alignment of these two corridors
with EWR.
Table 3.4 Comparison of the Proportion of Urban Land by Scenario
Corridor
A Corridor
B1 Corridor
B2 Corridor
B3 Corridor
C1 Corridor
C2 Corridor
C3
Existing Urban Area
13.6% 14.1% 13.2% 13.2% 13.8% 13.7% 13.7%
Reference Case Urban Area (inc. existing)
18.8% 20.2% 18.1% 18.1% 19.5% 19.2% 19.2%
Oxford to Cambridge Expressway future Urban Area (inc. existing and Ref. case)
31.2% 32.0% 31.7% 31.7% 31.2% 32.2% 32.2%
Oxford to Cambridge Expressway and EWR future Urban Area (inc. existing and Ref. case)
30.6% 30.3% 30.8% 30.8% 29.7% 31.6% 31.6%
Impact of EWR on land take
-0.6% -1.7% -0.9% -0.9% -1.5% -0.7% -0.7%

Oxford to Cambridge Expressway Corridor Assessment report
19
Figure 3.3 Comparison of the Proportion of Urban Land by Scenario
3.4.1 Modal Split Sensitivity Test
Where the Project aligns with EWR commuters will have a choice of transport options. This could have
the effect of reducing the number of trips by residents via the Oxford to Cambridge Expressway, and in
effect increase the spare capacity of the Oxford to Cambridge Expressway junction, as people choose
to use non-car modes and in particular rail as their preferred mode of transport. This modal shift impact
has not yet been modelled through detailed traffic modelling but is presented here as a high-level
sensitivity test.
The following analysis considers the potential for modal shift of up to 20% of trips from Oxford to
Cambridge Expressway to EWR. This will effectively increase the spare capacity on Oxford to
Cambridge Expressway Junctions by 20% and allow for more development to come forward in these
areas. This impact is only tested at junctions which are near proposed EWR stations.
Figure 3.4 presents the current proposed route for EWR and Table 3.5 below presents the alignment
of the Oxford to Cambridge Expressway Junctions and EWR Stations which has been used in this
sensitivity testing. This indicates that Corridors B1 and C1 are most closely aligned to EWR Stations.

Oxford to Cambridge Expressway Corridor Assessment report
20
Figure 3.4 EWR Stations
Source: EastWestRail, http://www.eastwestrail.org.uk/east-west-rail-route/, 2018
Table 3.5 Tested Alignment of Oxford to Cambridge Expressway Junctions and EWR Stations
Oxford to Cambridge Expressway Junction
EWR Station Oxford to Cambridge Expressway Corridor effected
1A, 1B, 1C West of Didcot - -
2A, 2B, 2C Abingdon - -
3A North of Great Milton - -
3B East of Oxford - -
3C North Oxford Oxford Oxford Parkway
Corridor B1 Corridor C1
4A North of Thame - -
4B East of Oakley - -
4C Wendlebury Bicester Village Corridor B1 Corridor C1
5C South of Bicester Bicester Village
Corridor B1 Corridor B2 Corridor B3 Corridor C1 Corridor C2 Corridor C3
5A Northwest of Aylesbury Aylesbury Vale Parkway Corridor A
5B Twyford Winslow Corridor B1 Corridor B2 Corridor B3
6C Buckingham - -

Oxford to Cambridge Expressway Corridor Assessment report
21
Oxford to Cambridge Expressway Junction
EWR Station Oxford to Cambridge Expressway Corridor effected
7B, 7C South of Bletchley Bletchley
Corridor B1 Corridor B2 Corridor B3 Corridor C1 Corridor C2 Corridor C3
6A North of Leighton Buzzard
No differentiation between corridors and therefore no impact modelled.
8A, 8B, 8C Brogborough
9A, 9B, 9C Southwest of Kempston
10A, 10B, 10C South of Kempston
11A, 11B, 11C East of Bedford
12A, 12B, 12C South of St Neots
13A, 13B, 13C West of Cambourne
14A, 14B, 14C West Cambridge
Table 3.6 and Figure 3.5 below presents the potential impact of modal shift to EWR on the enabled
development capacity of the Oxford to Cambridge Expressway. This indicates that the greatest impact
from EWR could be in Corridor B1 with 8% more development, and Corridor C1 with 7% more
development enabled. However, despite this increase, Corridor C2/C3, followed by B2/B3 would still
have the largest enabled development under the assumptions used. These figures do not include
Reference Case growth, and only consider new unallocated development, not intensification of
allocated sites.
Table 3.6 Spare Oxford to Cambridge Expressway Capacity and Impact of EWR from Modal
Shift: Dwellings Enabled
Corridor
A Corridor
B1 Corridor
B2 Corridor
B3 Corridor
C1 Corridor
C2 Corridor
C3
Project Only New Unallocated Development
315,000 295,000 345,000 345,000 315,000 355,000 355,000
Project and EWR New Unallocated Development
325,000 320,000 360,000 360,000 340,000 365,000 365,000
EWR Impact on Enabled Development
3% 8% 4% 4% 7% 3% 3%
Note: Figures rounded to nearest 5,000.

Oxford to Cambridge Expressway Corridor Assessment report
22
Figure 3.5 Spare Oxford to Cambridge Expressway Capacity and Impact of EWR from Modal
Shift: Dwellings Enabled
Note: Figures rounded to nearest 5,000.

Oxford to Cambridge Expressway Corridor Assessment report
23
4. Econometric Modelling
4.1 Introduction
This section presents the approach and key findings of the econometric growth modelling undertaken
to inform the corridor sifting process.
4.2 Approach to Modelling
The econometric modelling was carried out using Cambridge Econometrics (CE)’s Local Economic
Forecasting Model (LEFM) and its associated scenario analysis tool in order to quantify the relative
wider economic benefits that could accrue from each of the short-listed corridor options.
WebTAG M5.3 guidance states that in addition to straightforward wider economic analysis using a
simple tailor made tool such as Wider Impacts and Transport Appraisal (WITA), ‘…in some
circumstances it may be relevant to adopt more sophisticated economic principles in the appraisal’1.
The use of LEFM in this appraisal is intended to provide that additional analysis.
The purpose of the econometric modelling exercise was to identify the corresponding sectoral outcomes
that would correspond to the potential enabled development physical growth scenarios and what
implications this would have for employment, wages and GVA on both the local and national scale.
LEFM has been designed to project economic indicators for a local area by explaining the output of
local industries through an explicit representation of expenditure flows in the area and their links with
the world outside the local area. In this it differs from other methods of local economy modelling which
typically link local output or employment (by sector) directly to national or regional output or
employment. Such methods include shift-share or econometrically estimated equations. While these
methods allow a user to derive projections for local output or employment growth from national or
regional projections, they offer little scope for introducing an explanation of local performance relative
to these higher levels, and they are typically not suitable for analysing the indirect effects on the local
economy arising from the opening of a new enterprise or the closure of an existing one.
LEFM is also distinguished from other approaches by its sectoral detail. It identifies 45 sectors2 (defined
on SIC07), allowing (for example) electronics to be distinguished from electrical equipment, and IT
services from other business support services. Detailed disaggregation by sector is usually valuable
because different sectors have different prospects (e.g. technological change is driving much faster
growth in electronics and computing than in the other sectors with which they are commonly combined),
because they have different employment characteristics, and also because it allows local knowledge
about specific firms to be more easily incorporated in the forecast. One of the consequences of working
in such detail is that most variables in the model have to be disaggregated by sector (or a similar
classification: see below for more details).
In order the estimate the wider sectoral and economic impacts of the corridor scenarios the LEFM
scenario modelling tool is used. This tool takes the existing sectoral projections for each area generated
by the main LEFM model and simulates their progression over time under a variety of different
scenarios. The exogenous inputs into this tool are:
1 WebTAG M5.3. p7

Oxford to Cambridge Expressway Corridor Assessment report
24
The peak commuting travel times between districts under each corridor option, using the Stage
0 traffic modelling. This allows us to calculate the expansion of labour and product markets and
estimate the increased likelihood of collaborative activity due to increased effective economic
mass of each district.
The physical growth that could be released in each scenario, as set out in the preceding
chapters of this Appendix. Significant additional housing stock feeds directly into estimates for
future population growth, which in turn drives growth in labour supply and demand for local
services.
The growth in employment by sector is calculated by a combination of two mechanisms, the strength
of which depends on the sector in question: the increase in demand for local services both within the
district and in neighbouring districts is driven by growth in population; whilst the growth of existing
clusters is driven by improvements to local sectoral productivity and the increase in national and
international competitiveness this implies.
Localisation agglomeration benefits are calculated on a sector-by-sector and district-by-district basis,
and informed by both the existing spatial distribution of sectoral clusters and the effects of the increased
access to sectoral economic mass in neighbouring districts provided by the improved connectivity.
Feedback mechanisms between productivity and employment growth are incorporated into the model
on a spatial-sectoral basis, along with employment and productivity spill-over impacts both between
sectors and between local areas, based around empirically derived input/output tables.
The implications for occupational structure are calculated using the sectoral/occupational conversion
projections produced by CE as part of the Working Futures project. Wage levels are assumed to grow
as a set proportion of productivity growth by sector.
The model has produced 5-yearly projections of the following variables between 2030 and 2050:
Employment (by 45 sectors)
Productivity (by 45 sectors)
GVA (by 45 sectors)
Occupation (by 25 occupations)
Mean Wage level
For the following local authority districts, as well as for the UK as a whole:
Oxford
South Oxfordshire
Vale of White Horse
Cherwell
West Oxfordshire
West Berkshire
Aylesbury Vale
Milton Keynes
Bedford
Huntingdonshire
South Cambridgeshire
Cambridge
East Cambridgeshire

Oxford to Cambridge Expressway Corridor Assessment report
25
We have also considered the problems of additionality and displacement using the following
assumptions:
The proportion of external migration into the study area is assumed to remain constant at the
rate of the past decade at 15% of all inward migration, and is considered a net addition to UK
population
Any employment and GVA generated by the proportion of the growth in demand for services
generated by external migrants into the study area is considered a net addition to UK
employment and GVA
Any productivity and GVA growth generated by additional agglomeration benefits due to
improved connectivity and/or increased economic density within the study area is considered a
net addition to UK productivity and GVA
Any employment and GVA growth generated by an increase in productivity that leads to a
growth in the UK’s market share of internationally tradable sectors is considered a net addition
to UK employment and GVA.
By comparing the outputs for different scenarios it is possible to quantify the net benefit of different
schemes above the Reference Case across a range of different economic indicators, including labour
productivity, total employment, GVA/capita, average real wage, and % of employment in high-value or
knowledge sector jobs.
4.3 Econometric Modelling Results
The results of the scenario modelling exercise are shown in the figures below. On a district-by-district
level sub-options 2 and 3 are identical and are thus presented together.
Figure 4.1 shows the total additional employment estimated to be generated by 2050 in each corridor
option compared to the Reference Case. Employment growth is partly driven by additional service
demand due to population growth and partly by growth of existing sectoral clusters. We see that all
corridor options produce additional employment for between 250,000 and 350,000 additional workers,
with the more direct routes (A and B) producing the highest levels of employment growth.
Figure 4.1 Estimated Total Additional Employment over Reference Case

Oxford to Cambridge Expressway Corridor Assessment report
26
Figure 4.2 shows the estimated growth in high skill and knowledge sector employment. Growth in these
sectors is largely driven by the assessed impact of the Expressway in facilitating greater productivity
and employment growth in existing sectoral clusters. Again we see that the greater growth occurs in
the more direct routes that best link the three main knowledge sector clusters in the ‘missing link’ area
centred around of Oxford, Milton Keynes and Science Vale.
Figure 4.2 Additional Estimated Employment in High Skill and Knowledge Sectors
Figure 4.3 shows the estimated growth in productivity and corresponding growth in wages induced by
the different corridor options. Productivity growth is driven largely by agglomeration benefits due to
increased access to economic mass (including access to labour pools, access to customers, and
increased knowledge spill-overs both within and between sectors). We find estimated additional real-
terms productivity impacts of between £1,500 and £2,500 per worker per year by 2050. Wages grow at
approximately half this level in line with recent historic trends.

Oxford to Cambridge Expressway Corridor Assessment report
27
Figure 4.3 Additional Real Labour Productivity and Annual Wage over Reference Case
In all of the above analysis the projections only include the impacts that arise endogenously as a result
of the implementation of the Expressway options, as manifested by our two modelling factors: additional
housing stock; and reduced AM peak travel times. These projections are intended for comparison
purposes only and are not intended as a stand-alone forecast, and do not preclude the possibility that
additional investment in the area, either in infrastructure or otherwise, produces significantly higher
levels of growth. There is also the potential that the clustering effect created by a new economic corridor
could lead to new activities, industries, employment and higher growth than shown in the model.

Oxford to Cambridge Expressway Corridor Assessment report
28
5. Conclusions
This Growth and Economic Assessment Appendix presents the findings of the enabled development
and economic growth modelling for the Oxford to Cambridge Expressway to inform the Stage 1A
corridor selection process. This includes an assessment of the potential role of the Project in enabling
new homes, new employment space and new jobs.
The analysis has also carried out sensitivity tests to illustrate how the Oxford to Cambridge Expressway
in combination with EWR and other public transport could enable higher development densities,
reduced land take (for the same scale of development), and give the potential for modal shift towards
non-car transport to in effect increase capacity and enable further development.
No decisions have been made by government at this stage on if, how much and where extra growth is
planned in the corridor. Consequently, this analysis focuses on considering how much growth could by
enabled by the Project if it were to go ahead. The scale of growth potentially enabled only takes in to
account the potential ability of the Project to accommodate traffic associated with the growth. The
potential scale of development does not take in to account other factors such as environmental
constraints. Further work would be needed to consider to what degree they influence the scale of
potential growth.
Overall the assessment has identified the following:
All corridor options have the potential to enable significant amounts of new housing and
employment if it were decided to plan for and allocate such growth.
Corridor C2/C3, followed by B2/B3, will potentially enable the most new homes. This is due to
the assessed greater spare capacity of the Oxford to Cambridge Expressway junctions for
these corridors. Higher spare capacity is a result of less existing or future planned development
in these areas and therefore less traffic flow. Enabled development is less along corridors which
are already more heavily developed, such as Corridor A.
Partly as a consequence of the higher level of enabled development, Corridors C2/C3 and
B2/B3 are also modelled to have the greatest impact in terms of the number of workers and
jobs enabled. However, productivity and economic growth impacts are estimated to be greater
along Corridor B than C. This is due to the improved connectivity, travel time savings, and
improved linkages to existing clusters of high value knowledge economy for Corridor B options.
Corridors B1 and C1, to the north and west of Oxford, are most closely aligned with EWR and
its stations, and are consequently modelled to benefit the most from the multi-modal corridor in
terms of providing the potential for increased density and reduced land take.
This assessment is heavily dependent on the modelled capacity and location of the Oxford to
Cambridge Expressway junctions. Junction capacity could change, and greater capacity
delivered in locations to for example enable new town development. Also the Oxford to
Cambridge Expressway could free up capacity on other roads, and therefore enable wider
growth, and this could be relevant in existing congested areas. However, this impact has not
been modelled at this stage. As such these figures provide a high level review of development
enabled based on the assumed conditions modelled.
In summary while the enabled development impacts are fairly similar for Corridor C2/C3 and B2/B3, the
additional productivity and economic benefits along Corridor B2/B3 suggest that in the longer term this
corridor could provide the greatest growth benefits.
The main CAR details how the findings of this growth modelling has been applied to the relevant
Strategic and Intervention Objectives set by HE and DfT.

Oxford to Cambridge Expressway Corridor Assessment report
29
Appendix A. Glossary
ASR Appraisal Specification Report
BCR Benefit cost ratio
CBA Cost benefit assessment
CE Cambridge Econometrics
CIL Community Infrastructure Levy
DCLG Department for Communities and Local Government
DfT Department for Transport
EWR East West Rail
FUR Functional urban region
GIS Geographic information system
GVA Gross value added
Ha Hectare
HE Highways England
HIF Housing Infrastructure Fund
JSP Joint Statutory Plan
NIC National Infrastructure Commission
LA Local authority
LEFM Local Economy Forecasting Model
LUTI Land Use Transport Interaction
NPPV Net present public value
OS Ordinance Survey
PCF Project Control Framework
PMA Property market area
pp pages
PTAL Public transport accessibility level
RIS Road Investment Strategy
S106 Section 106 planning obligations agreement
SEM Supplementary economic model
SERTM South East Regional Traffic Model
SHMA Strategic housing market assessment
SHLAA Strategic housing land availability assessment
SIC Standard industrial classification
Sq ft Square feet
Sq m Square metre
SRN Strategic road network
TAG Transport Appraisal Guide
TIEP Transport Infrastructure and Economic Performance (report)
TIS Transport investment strategy
TGB Treasury Green Book
VfM Value for Money
WITA Wider Impacts in Transport Appraisal