appendix b hydraulic investigation - pima countyrfcd.pima.gov/largefiles/pdi/appxb.pdf · appendix...
TRANSCRIPT

US Army Corps of Engineers Los Angeles District
Santa Cruz River, Paseo de las Iglesias
Pima County, Arizona
Feasibility Study Draft Report
Appendix B Hydraulic Investigation
July 2004
Prepared by:
U.S. ARMY CORPS OF ENGINEERS, LOS ANGELES DISTRICT PLANNING DIVISION, WATER RESOURCES BRANCH
P.O. BOX 532711 LOS ANGELES, CALIFORNIA 90053-2325
And:
Flood Control Planning Division Pima County Department of Transportation
and Flood Control District

TABLE OF CONTENTS I Introduction II Descriptions of Current Hydraulic Studies
1.1 Flood Insurance Study 1.2 Master Drainage Study, San Xavier District 1.3 Los Reales Improvement District LOMR 1.4 Midvale Park Master Drainage Report 1.5 Old West Branch of the Santa Cruz River LOMR
III Hydraulic Investigation of With Project Conditions
1.1 Introduction 1.1.1 Purpose 1.1.2 Study Area Description 1.2 Methodology 1.2.1 Guidance 1.2.2 Analysis Tools 1.2.3 Hydrology and Design Discharges 1.2.4 Topographic Mapping and Vertical Datum 1.3 Hydraulic 1.3.1 Previous Models and Data 1.3.2 With Project Conditions Analysis 1.3.3 Model Alteration 1.3.4 Results 1.3.5 Sediment Budget Analysis 1.3.6 Bank Erosion
IV References LIST OF FIGURES Figure 1: Map of Paseo de Las Iglesias Study Area showing the Hydraulic Study Areas and Major Washes Figure 2: Paseo de Las Iglesias Study Area LIST OF APPENDICES Appendix 1: Flood Insurance Study: HEC-2 input files (Disk) for the Santa Cruz
River and Old West Branch of the Santa Cruz River, Old West Branch of the Santa Cruz River work maps (5) and printout of HEC-2 Input Data (duplicate of file contents)
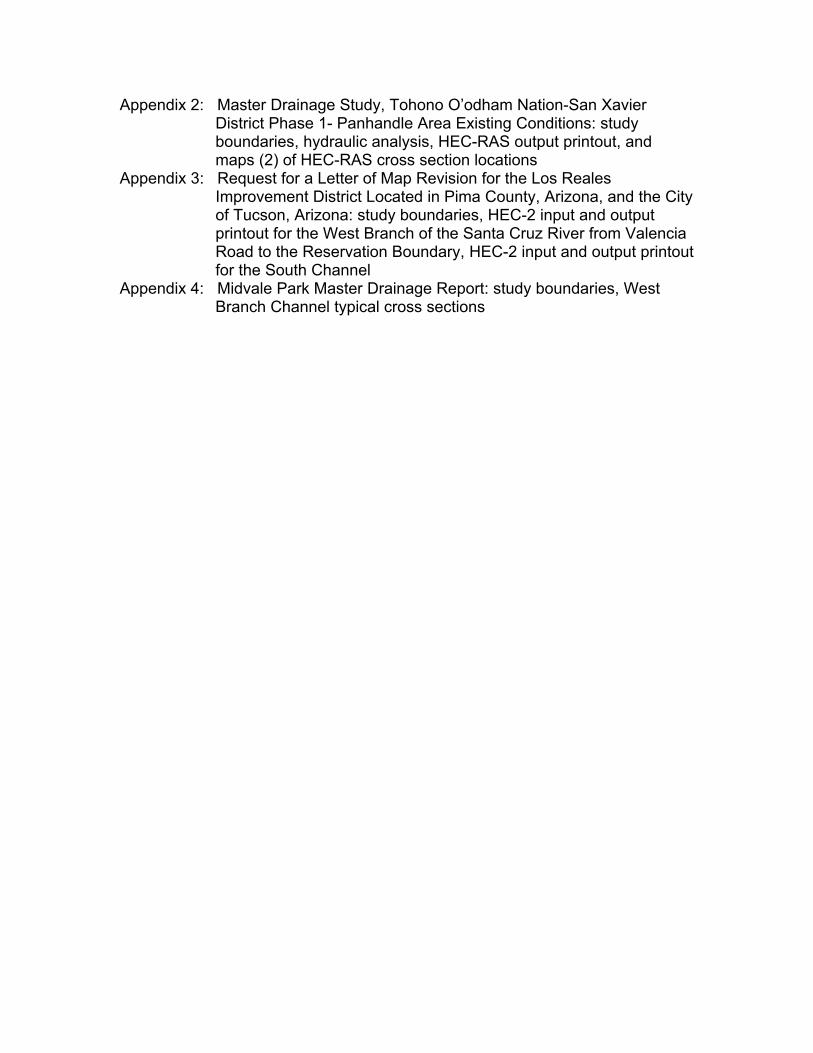
Appendix 2: Master Drainage Study, Tohono O’odham Nation-San Xavier District Phase 1- Panhandle Area Existing Conditions: study boundaries, hydraulic analysis, HEC-RAS output printout, and maps (2) of HEC-RAS cross section locations
Appendix 3: Request for a Letter of Map Revision for the Los Reales Improvement District Located in Pima County, Arizona, and the City of Tucson, Arizona: study boundaries, HEC-2 input and output printout for the West Branch of the Santa Cruz River from Valencia Road to the Reservation Boundary, HEC-2 input and output printout for the South Channel
Appendix 4: Midvale Park Master Drainage Report: study boundaries, West Branch Channel typical cross sections

I INTRODUCTION
The Paseo de Las Iglesias Study Area is traversed by several watercourses including the Santa CruzRiver (SCR) and the West Branch of the Santa Cruz River (WBSCR). The study area is locatedbetween the Los Reales Road alignment and Congress Street within Township 14, Range 13, Sec-tions 14, 22-24, 25-27, 34 and 35, as well as Township 15, Range 13, Sections 2-3, 10-11, 14, and 15(Figure 1). Five separate studies contain hydraulic data for the watercourses traversing and immedi-ately adjacent to this reach. This report summarizes the available hydraulic information, includingHEC-2 analyses, work maps, and hydraulic information for bridges and culverts within and adjacentto the study area. Much of the information sited is available within the attached appendices.
II DESCRIPTION OF CURRENT HYDRAULIC STUDIES
1.1 The most recent SCR Flood Insurance Study (FIS) that includes the Paseo de Las Iglesiasstudy area was performed on March 26th, 1990, by CMG Drainage Engineering Inc. The CMGDrainage Engineering study area covers the reach of the SCR downstream of the I-19 bridge (southof the study area) north past Congress Street through Tucson (Figure 1). The FIS was issued by theFederal Emergency Management Agency (FEMA) on February 8, 1999. The peak discharges of theSCR at both Drexel Road and Congress Street are reported to be 16800, 41000, 60000, and 93000cfs for the 10-, 50-, 100-, and 500-year flood events, respectively. The drainage areas at Drexel Roadand Congress Street are 2101 and 2222 square miles, respectively. The cross section elevations weredetermined using the 1984, 1”=200’ aerial topography maps with a 2’ contour interval based on theNorth American Vertical Datum (NAVD) 1929. The complete set of mylars of these orthophoto-topographic maps with floodplain delineations is available through the Pima County Department ofTransportation, Mapping and Records Division. The FIS document is available through the FEMAPublication Center. Although no formal written report was prepared, CMG Drainage EngineeringInc. provided the input files for the HEC-2 analyses. A diskette containing the HEC-2 model inputfiles for the 10-, 50-, 100-, and 500-year floodplain (PC25uf5.DAT) and the floodway(PC25ux5.DAT) for the Santa Cruz River from the I-19 bridge to Camino Del Cerro are available inAppendix 1.
1.2 Master Drainage Study, Tohono O’odham Nation-San Xavier District Phase 1- PanhandleArea Existing Conditions was prepared by McGovern, MacVittie, Lodge, and Associates, Inc.(MMLA) on July 31, 2001. The area studied is immediately adjacent to the south and west of thePaseo de Las Iglesias study area (Figure 1). Hydraulic information contained in this report includesdetails regarding four culvert crossings on Valencia Road, the Los Reales Improvement Districtcollector and conveyance channels, and floodplain analysis utilizing HEC-RAS.
The culvert under Valencia Road at Valencia Wash (west of the Master Drainage Study area) is aseven-cell, 10’ x 6’ RCBC, with a design capacity (QDesign) of 5257 cfs, which
Page 1

will fully contain 100-year flood discharge (Q100) of 3680 cfs. A single-cell 10’ x 4’ RCBC culvertat the southwest corner of Mission Road and Valencia Road conveys flows under Valencia Road intoa concrete lined channel that conveys flows into the WBSCR. The QDesign of 360 cfs is sufficient topass the Q100 of 251 cfs, assuming all flow will concentrate at the headwall of the culvert. A three-cell, 71” x 47” CMPA is located in the historic alignment of the WBCSR at Valencia and MissionRoad, 900’ west of the WBSCR channel realignment. The QDesign of 512 cfs conveys low flowsunder Valencia Road. The final culvert documented in this MMLA report conveys the flows from therelocated WBSCR under Valencia Road, east of Mission Road. It is a ten-cell 12’ x 8’ RCBC withupstream channel improvements. The QDesign of 8000 cfs could pass the Q100 of 6900 cfs, asdetermined in this MMLA Master Drainage Study, under Valencia road without breakout, exceptearthen berms near the relocated WBSCR prevent some runoff from entering the channel, contribut-ing to a wide floodplain in the area. This relocated WBSCR culvert design was also analyzed in theMidvale Park Master Drainage Report, which is presented in Section 1.4 (below).
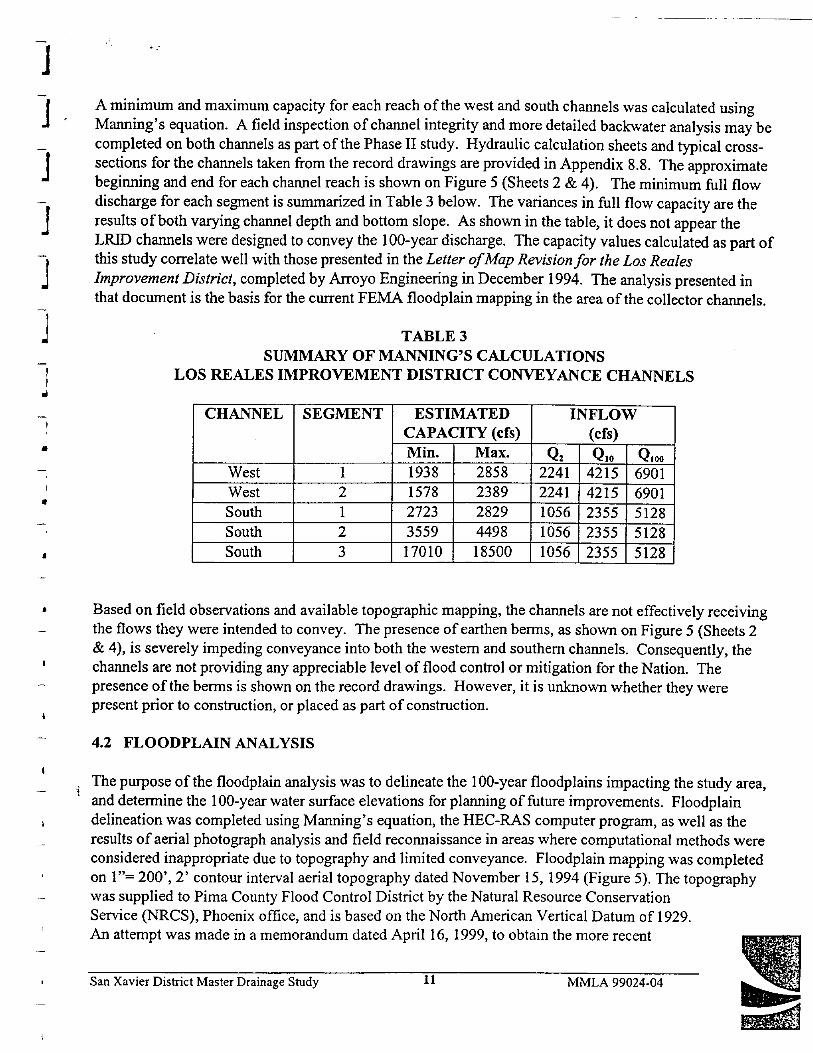
Collector and conveyance channels information described in the MMLA Master Drainage Study arebased on information more completely documented in the Arroyo Engineering Inc. report describedin section 1.3 (below). HEC-RAS analyses of the floodplains in the Panhandle Study Area wereperformed based on discharges obtained from Manning Equation calculations. Topographic mappingbased on aerial topography taken November 15, 1992 was completed by Kucera International Inc.,with a horizontal scale of 1”=200’ and a vertical contour interval of 2’, based on NAVD 1929. Asumming of hydrographs was done to obtain the 100-year discharge of 6809 cfs for Mission Washupstream of Valencia Road. The HEC-RAS output files, as well as maps showing cross sectionlocations are included in Appendix 2.
1.3 The Request for a Letter of Map Revision for the Los Reales Improvement District Lo-cated in Pima County, Arizona, and the City of Tucson, Arizona report was completed by ArroyoEngineering Inc. in December of 1994. This Letter of Map Revision (LOMR) was approved byFEMA prior to the issuance of the February 8, 1999 FIS, so the information contained in the currentFIS reflects this LOMR. The Los Reales Improvement District (LRID) is located south of ValenciaRoad, entirely within Section 15 of Township 15 South, Range 13 East (Figure 1). The report con-tains detailed hydraulic analysis based on existing conditions including a new floodwall and associ-ated drainage channels. The ground-profile data for the eastern portion of the report was based on1984 Cooper Aerial Survey Co. aerial topographic maps, and the western portion was based on the1986, McLain Aerial Surveys aerial topography maps. Both map sets have a horizontal scale of1”=200’ and a 2’ contour interval based on NAVD 1929. Two HEC-2 models were assembled. Thefirst detailed the depth of ponding against the floodwall, determined flood depths south of ValenciaRoad along the WBSCR, and performed split flow analysis to differentiate water flowing into theSouth Channel or westward into the SCR. The second HEC-2 model and split flow analysis wasused to predict water surface elevations in the South Channel, and quantify the amount of floodwaterthat will either flow northward along Indian Agency Road, or eastward in the South Channel.
Page 2

Ground profile data used to represent the improved portions of the South Channel were taken fromfield survey data and approved constructions plans. In evaluating breakout flows, a value of 2.6 wasassigned to the weir-loss coefficient “C” to represent the flow over the roadways and channel levees.Areas of ineffective flow downstream of channel expansions were assigned specific cross sections,and an expansion ratio of 4:1 was used to delineate these areas. A 100-year peak discharge of 7638cfs (determined by Buck Lewis and Associates, Inc., 1982) was used to establish flood heights forthe WBSCR.
Based on the split flow calculations, output data predicted that 3131 cfs will flow northward in the“West Branch Channel” (WBSCR) during a 100-year flood, 3308 cfs will flow northward from theReservation into the South Channel, and 1199 cfs will flow directly eastward into the SCR. A splitflow calculation performed on the 3131 cfs flowing northward in the WBSCR predicted that ap-proximately 219 cfs and 123 cfs will breakout at two locations and sheet flow to the east. This 342cfs of break-out flow will concentrate south of Valencia Road, then be conveyed under the road by a2-cell, 10’x 4’ RCBC, into a 30’ wide flood control channel that trends northwesterly and feeds backinto the WBSCR. A separate split flow calculation predicted that the 3308 cfs that flows in the SouthChannel during the 100-year flood would be entirely contained within the South Channel. Fullprintouts of the input and output files, the plotted hydraulic cross sections, and river profiles for theHEC-2 model of the SCR are contained in Appendix 3. Printouts contain a summary of the split flowcalculations.
1.4 The Midvale Park Master Drainage Report was completed in July of 1983 by Dooley-Jones& Associates, Inc. This study covers an irregular area south of Irvington Road and west of the SCR,within Township 15 South, Range 13 East, Sections 3, 10, and 15 (Figure 1). The report describedthe general design of numerous hydraulic structures. Tables and graphs for roadway capacities wereprovided, but were not tied to specific locations. Numerous generalized typical, as well as somealternative, cross sections and plans are provided for roadways, drainage channels, detentions basins,spillways, etc., but no specific location information was provided for this hydraulic information. Thetypical cross sections for the West Branch Channel are included in Appendix 4.
1.5 The Old West Branch of the Santa Cruz River Letter of Map Revision Study was com-pleted in 1994 by McGovern, MacVittie, Lodge, and Associates, Inc. No project report documentwas prepared. The Letter of Map Revision was approved by FEMA on July 24, 2000. The areastudied includes the historic WBSCR north of Irvington Road to its confluence with the SCR (Figure1). The cross section elevations were based on 1983, 1”=200’ Cooper Aerial Survey Co. aerialtopography maps with a 2’ contour interval based on the NAVD 1929. The discharges used in themodels were based on the Tucson Stormwater Management Study. Copies of the applicable workmaps, and a diskette with the WBSCR HEC-2 input files are located in Appendix 1.
Page 3

Page 4
III. HYDRAULIC INVESTIGATION OF WITH PROJECT CONDITIONS 1.1 INTRODUCTION 1.1.1 PURPOSE The purpose of this section is to document the hydraulic analysis completed in support of the Alternative Formulation Briefing (AFB) milestone for the Santa Cruz River, Paseo de las Iglesias Feasibility Study. This hydraulic analysis has been conducted to determine the “With Project” hydraulic conditions on the Santa Cruz River for the final array of alternatives. With Project hydraulic analysis was not performed on the Old West Branch and Los Reales tributaries, because no flood damage reduction or ecosystem restoration measures are being proposed for these reaches. 1.1.2 STUDY AREA DESCRIPTION The Santa Cruz River has its headwaters in the San Rafael Valley in southeastern Arizona. From there, the river flows south into Mexico. After a 35-mile loop through Mexico, it turns to flow northward and reenters Arizona about six miles east of Nogales. The river continues northward to Tucson then northwest to its confluence with the Gila River 12 miles southwest of Phoenix. The river runs approximately 43 miles north of the US-Mexico border before entering the study area. Throughout this reach, flow occurs only because of effluent discharges or following major storms. The Paseo de las Iglesias study area (see Figure 2) encompasses approximately 5005 acres and consists of a 7.5 river mile reach of the Santa Cruz River and its tributary washes. Beginning where Congress Street crosses the river in downtown Tucson the study area extends upstream to the south along the river to the boundary of the San Xavier District of the Tohono O’Odham Nation. The eastern study boundary is represented by Interstates 10 and 19. The western study area boundary is represented by Mission Road and the San Xavier District of the Tohono O’Odham Nation. Soil cement bank protection exists on both channel banks between Irvington Road and Ajo Way; near Valencia Road; and on both banks of the river between Silver Lake Road (29th Street) and Congress Street. All other portions of the river are unprotected with near vertical eroded banks. Bridges in the study area include Valencia Road, Irvington Road, Ajo Way, Silverlake Road, 22nd Street, and Congress Street. The main channel of the Santa Cruz River flows in a relatively straight northerly direction from the southern to the northern borders of the study area. The West Branch tributary of the Santa Cruz River currently extends from the southern border of the study area to the north approximately 3.5 river miles to where it joins the mainstem of the Santa Cruz River, just north of Irvington Road. The portion of this channel just north of Irvington Road, the New West Branch, has been re-routed. The former channel (before it was re-routed) extends from just north of Irvington to just south of 22nd Street where it joins the mainstem of the Santa Cruz River.

Page 5
The reach investigated for this hydraulic analysis includes approximately seven and one-half (7.5) river miles of stream channel and historic floodplain areas and is characterized by an incised, partially bank protected river with a narrow 100-year floodplain. Between Ajo Way and Irvington Road, the New West Branch tributary joins the Santa Cruz River at a confluence marked by a large concrete drop structure and energy dissipater. 1.1.2.1 Major Tributaries Old West Branch: The Old West Branch of the Santa Cruz River is an entrenched natural channel that extends from Irvington Road to 22nd Street where it joins the river. The average base width is 20 ft and the average bank height is 10 ft. There is a significant amount of vegetation (e.g., mesquite) growing along the banks and some vegetation growing in the channel bed. There is a large concrete drop structure at the confluence of the New West Branch and the Santa Cruz River. Vehicular bridges exist at the Silverlake Road and Ajo Way crossings. Los Reales Improvement District: The Pima County Department of Transportation and Flood Control District (FCD) formed the Los Reales Improvement District in 1987 in order to construct a flood-control levee and associated drainage ways. The District is located at the upstream end of the New West Branch, between Los Reales and Valencia Roads. The purpose of this project was to divert flows around the development and dispose of these flood flows either into the Santa Cruz River or into the New West Branch channel. Along the south boundary of this Improvement District, there is a 4 ft high, 1400 ft long floodwall, which extends between the Tohono O’odham Indian Reservation Boundary and Indian Agency Road. On the west end of this floodwall, a partially lined concrete channel diverts a portion of the flood flows northward into the New West Branch channel. A partially lined concrete channel exists along the south edge of the development and diverts all remainder flood flows into the Santa Cruz River approximately opposite Hughes Wash. New West Branch: The New West Branch diversion is an entrenched partially bank protected trapezoidal channel that extends 3.5 miles from Los Reales road to Irvington Road where it joins the river. The channel has a natural bottom with 3 on 1 concrete lined sideslopes. The base width varies from 100 to 120 ft. The average bank height is 8 ft. There is a large concrete drop structure at the confluence of the New West Branch and the Santa Cruz River. Vehicular bridges exist at Irvington and Valencia Roads and one (1) a pedestrian bridge exists south of Drexel Road.

Page 6
Figure 2: Paseo de las Iglesias Study Area

Page 7
1.2 METHODOLOGY 1.2.1 GUIDANCE The hydraulic analysis was prepared in accordance with EM 1110-2-1601, “Hydraulic Design of Flood Control Channels”, USACE 1994. EM 1110-2-1418, “Channel Stability Assessment for Flood Control Projects” (USACE, 1994), and EM 1110-2-1619, “Risk-Based Analysis for Flood Damage Reduction Studies” (USACE, 1996) provided additional guidance. 1.2.2 ANALYSIS TOOLS HEC-RAS (USACE 2001) was used for the Santa Cruz River with project conditions model(s). The ArcView (ESRI 1999) extension HEC-GeoRAS (HEC 2000) was used as a pre and post processor for HEC-RAS. 1.2.3 HYDROLOGY AND DESIGN DISCHARGES Table 1 below summarizes the peak discharges that were used for the with project hydraulic analysis. Hydrologic methodologies and assumptions were used to develop the respective discharges are documented in Appendix A, Hydrology.
Table 1: Santa Cruz River (Drainage Area = 2,222 Sq. mi.) Discharge – Frequency Relationships
Frequency (Year) Discharge (cfs)
2 4,900
5 9,500 10 14,000
20 20,000 50 35,000 100 55,000
200 75,000 500 120,000
1.2.4 TOPOGRAPHIC MAPPING AND VERTICAL DATUM The information used for this study is based on two vertical datums. The original Flood Insurance Study (FIS) models and workmaps that were based on the National Geodetic Vertical Datum of 1929 (NGVD 1929). The datum used for the current topography is the North American Vertical Datum of 1988 (NAVD 1988). The difference between these datums varies as a function of location.

Page 8
However, within the study reach, a constant difference was determined to be appropriate and reasonable. The following equations were used to convert between the datums:
Elev(NAVD) = Elev(NGVD) + ♠ Elev Elev(NGVD) = Elev(NAVD) - ♠ Elev
where: Elev(NAVD) = elevation in NAVD 1988 datum;
Elev(NGVD) = elevation in NGVD 1929 datum. ♠ Elev = 2.2 ft. The Pima County Flood Control District provided digital orthophotos (1998), digital terrain model (DTM) breakline data, DTM mass points, ArcInfo coverage of the existing mapped floodplains, and digital GIS layers for the County. Additional field survey data was provided by Pima County for the New West Branch diversion. Triangulated Irregular Networks (TIN) were then developed to obtain cross section data for the models. All topography provided by Pima County was based on NAVD 1988 datum. 1.2.4.1 New West Branch Survey Information Field survey information for the New West Branch channel was provided by Pima County on 18 June 2003. The survey information consisted of a spreadsheet containing northing, easting, elevation data and an AutoCAD image of the points and breaklines. The data is on the same coordinate system as the topography that was used in the original hydraulic model. Pima County also provided some field drawing showing structure locations (e.g., bike paths, concrete channel locations, pipes).

Page 9
1.3. HYDRAULIC ANALYSES 1.3.1 PREVIOUS MODELS AND DATA The Pima County Department of Transportation and Flood Control District assembled a continuous HEC-2 water surface profile model for the Santa Cruz River that extended through Pima County, from the Santa Cruz County line to the Pinal County line. The original model was adapted from previously coded HEC-2 flood insurance study and County engineering study models. In September 1998, the Corps of Engineers (USACE) converted the original Pima County HEC-2 model into a HEC-RAS model for the Gila River, Santa Cruz River Watershed, Pima County, Arizona, Final Feasibility Study, dated August 2001. Within Pima County, the Santa Cruz River was modeled under six contiguous reaches, which provided the modelers an efficient method to characterize the hydraulic differences along the river. The geometric data contained in the USACE model was updated at several locations along the Santa Cruz River from cross-section data provided by Pima County that was generated from detailed topography provided to the County by the U.S. Bureau of Reclamation. The Paseo de las Iglesias study area is contained in the Tucson Urban reach, known as Reach 4 in the USACE Santa Cruz River Watershed Feasibility Study. The original cross-section geometric data within the stream valley in Reach 4 was not updated from the Bureau of Reclamation topography; however, some of the overbank areas (also known as the Historic Floodplain) have been updated using the GEO-RAS software program. The distinction for the age of the geometric data indicates that the station versus elevation data used to define the in-channel cross-sections (low flow area) is older than the historic floodplain (upland areas that receive flow only during major flood events) data, which was more recently updated with accurate topography. In short, the model’s accuracy for predicting floodwater surface elevations is somewhat diminished “inside” the channel, whereas flood elevations “outside” the channel are more accurate. Starting Water Surface Elevations The starting water surface elevations were determined for each model based on stage-discharge curves from the FIS model at the downstream end of the Santa Cruz River model. Bridge Modeling All bridges on the Santa Cruz River were modeled using detailed bridge geometry developed for the Santa Cruz River Watershed Study (USACE 2001) HEC-RAS model. Contraction and expansion loss coefficients were set at 0.30 and 0.50, respectively in the cross sections upstream and downstream of bridges. Standard bridge pier loading was used.

Page 10
Manning’s Roughness Coefficients Manning’s roughness coefficients contained in the Pima County FIS model were used initially. These roughness coefficients were subsequently field checked and found to be reasonable. In general, roughness coefficients assigned to the channel, overbanks, and ineffective flow areas were 0.025 – 0.035, 0.035 – 0.070, and 1.00 respectively. For with project conditions, the roughness coefficients will be increased to reflect the proposed establishment of vegetation along the channel where it does not currently exist. 1.3.1.1 Revised New West Branch Model At the request of the non-federal sponsor, additional hydraulic analysis was performed subsequent to the Without Project investigation. Based on suspicions that the New West Branch Channel actually has a higher conveyance capacity, field survey data described in Section 2.4.1 was provided by the non-federal sponsor. The Without Project HEC-RAS model was then updated using this new survey information. However, there were two limitations with the new data: 1) the survey locations did not correspond with the original HEC-RAS cross-sections, and were subsequently incorporated into the original model as additional cross-sections; and 2) the new survey only included channel geometric information, i.e. there was no overbank information. Once the original HEC-RAS model was updated with new geometric information, another channel capacity-split flow analysis was performed to determine the amount of water overtopping the left bank. Finally, the left overbank was modeled separately using the flows determined from the split flow analysis to compute the more representative water surface elevations. 1.3.1.1.1 Revised New West Branch Model Results 1. The 2-, 5-, 10-, 25-, 50-, 100-, 200-, and 500-year flood events were simulated for the
New West Branch channel reach. There are no breakouts for the 50-year flood event. The New West Branch was determined to have a flood conveyance capacity of between a 50- and 100-year flood event within the channel system. The 100-, 200-, and 500-year flood events would overtop the channel banks, primarily the left overbank looking downstream.
2. For the 100-year flood event, approximately 1,120 cfs overtops the left bank. The breakout over the weir (left levee) extends approximately 760 ft with a depth of 1-2 ft. The overbank breakout flow then quickly spreads out onto the overbank where flood depths of approximately one foot are experienced.
3. The 200- and 500-year flood events would overtop the channel similar to the original HEC-RAS model results.
4. Plate 15 in the Without Project Hydraulics Appendix was updated to reflect the changes described above. Specifically, the 50-year floodplain was removed from the left overbank. The 100-year floodplain was redrawn, while the 200- and 500-year floodplains remained the same.
5. Conclusions: The revised without-project overflow analysis for the New West Branch of the Santa Cruz River indicated that the existing channel capacity and

Page 11
amount of overflow is different from the original hydraulic model results. Applicable hydraulic data tables, overflow maps, and equivalent annual damage estimates were updated based on the results of this analysis.
1.3.2 SANTA CRUZ RIVER WITH PROJECT CONDITIONS ANALYSIS As part of the project, ecosystem restoration measures are being proposed within the active channel, on the channel banks and the historic overbank floodplain. The predominant method for ecosystem restoration is the establishment of native vegetation species in areas that do not receive high frequency flows. These areas exist within the main channel but are located on terraces that are above low flow channel or 2-year recurrent event water surface elevation. Stream banks along the Santa Cruz River are highly unstable and nearly vertical cliffs composed of weakly cemented sands, which are highly susceptible to instability from shear stresses during flood events, desiccation and wind erosion from the lack of vegetative cover that would normally provide stability from these erosive forces. Modifications to the present channel geometry important to the ability to construct, re-vegetate and sustain a restored riparian ecosystem include lowering the gradient of the steep channel banks, reducing instability from water and wind erosion. By altering the station versus elevation data on specific River Station cross-sections, the available flow area within the channel can be increased which would result in a lower water surface elevation. The hydraulic investigation of the potential impacts of the proposed actions for the project can be analyzed by modeling the proposed conditions and comparing the results to the existing conditions. The two major changes to the existing model, adding vegetation for an increased Manning’s roughness coefficient and decreasing the steepness of the channel banks through the alteration of station versus elevation data, will allow for the comparison of existing and proposed conditions. 1.3.3 SANTA CRUZ RIVER MODEL ALTERATION The existing USACE Santa Cruz River Watershed Study HEC-RAS model was used to determine the hydraulic effects of proposed channel alterations on portions of the study area. The limits of the HEC-RAS model for the Santa Cruz River study are located upstream at River Station 40.11 (Los Reales Road) and downstream at River Station 32.62 (Congress Street bridge). River Stations within the model are defined and measured as river miles starting at zero at the mouth of the Santa Cruz and increasing in an upstream direction. There are 73 HEC-RAS River Station (RS) cross-sections and five bridge crossings within the study area model. Areas along the project reach that lacked soil cement bank protection and had sufficient width of adjacent vacant land were identified for the establishment of vegetation and laying back the over steep banks. Areas along the channel that are currently protected by soil cement or areas where development exists in close proximity to the historic floodplain were not altered in the model. Based on these parameters, two main reaches of the model were identified for channel alterations as shown in Table 2:

Page 12
Table 2: Reach Alteration River Station Limits
Reach Upstream RS in Reach Downstream RS in Reach No. of RS Altered Upstream RS 39.16 (Valencia Rd) RS 36.93 (Irvington Rd) 23 Downstream RS 35.66 (Ajo Way) RS 34.34 (Silverlake Rd) 15
The cross-section geometric data for each River Station in these two reaches was examined to determine the existing slopes of the channel banks and the location and value of the Manning’s roughness coefficient. Within the station versus elevation data that define the cross-sectional shape of the channel at that River Station, the channel banks that were steeper than a five-on-one vertical to horizontal (5:1 V:H) slope where altered to achieve a 5:1 slope. The station versus elevation data pairs that defined the steep slopes within the cross-section were replaced by proposed station versus elevation data pairs that were set on a 5:1 slope. Alteration to the existing station versus elevation data pairs was limited to only those data pairs that define the channel geometry at elevations above the 2-year recurrent storm water surface elevation. By preserving geometric data pairs near the invert of the channel, the channel-forming discharge (also known as the bankfull discharge) was left in tact to prevent further instability within the low flow boundaries of the channel. The location and value of the Manning’s roughness coefficient was reviewed and altered for each of the River Stations identified in Table 2. The roughness coefficient is applied to each cross-section by indicating the location and value in the model. The overbank areas, either left overbank or right overbank, usually have higher roughness values than in the channel, which is attributed to the fact that larger vegetation and/or development (resulting in higher roughness values) is more readily able to grow in less flooded areas on the overbanks. Likewise, the channel roughness values are lower because frequent discharges presumably reduce the ability for vegetation to persist. Manning’s roughness values for floodplain (or overbank) areas in the project were set at 0.05, corresponding to the existing scattered brush and trees in the project area. The roughness values for channel areas in the project were set at 0.025; the appropriate value for the existing clean, straight, full stage channel, with no rifts or deep pools. The roughness values (0.05 in the floodplain and 0.025 in the channel) set for the project were unchanged in value, however, the location of where the roughness values were applied was changed in each of the 38 altered River Stations. The left overbank and right overbank areas (roughness set at 0.05) were expanded toward the centerline of the channel to account for the proposed establishment of vegetation on the banks and in the terraces. Likewise, the channel roughness value (set at 0.025) was applied to the reduced lateral extent of the 2-year recurrent storm water surface elevation, where dense vegetation typically does not exist, due to the higher frequency of flow. 1.3.4 SANTA CRUZ RIVER MODEL RESULTS There was an increase in the 100-year recurrent floodwater surface elevation in 19 of the 38 altered cross-sections due to the change in roughness values within the channel (decreasing

Page 13
horizontal range of 0.025 to only include 2-year event discharges). A rise is defined in this investigation as any increase exceeding 0.1 feet in vertical elevation. The largest rise was 1.53 feet at River Station 37.4, which is located on a meander bend approximately halfway between Irvington Road bridge crossing and Drexel Road. The proposed 100-year recurrent flood event water surface elevation at this, and all other locations showing increases remains within the Santa Cruz River valley banks and would not induce flooding conditions in the historic floodplain. Thirteen (13) altered cross-section River Stations showed a reduction in the 100-year recurrent flood water surface elevation due primarily to added available flow area from laying back the steep banks to a uniform 5:1 slope. A reduction is defined in this investigation as any decrease in water surface elevation greater than 0.09-feet. River Station 35.66, located immediately downstream from the Ajo Way bridge crossing, exhibited the largest reduction in water surface flood elevation at a minus 2.03 feet. The remaining six cross-section River Stations either exhibited no change in water surface elevation, exhibited an increase between 0 and 0.1 feet, or exhibited a reduction in water surface elevation between 0 and 0.1 feet. These results are expected and would typically be observed in this type of project where both the roughness and channel geometry are altered for the purpose of ecosystem restoration and bank stability efforts. Table 3 provides a comparison of With and Without Project model results. River stations are measured from the confluence of the Santa Cruz River and Gila River, 35 miles downstream of the study area. Overflow maps are provided in Figures 2a and 2b following Table 3.
Table 3: Santa Cruz River Comparison – With Project
Without Project With Project Change in Water Surface Water Surface Water Surface
Q Total Elevation Elevation Elevation River Station Profile (cfs) (ft) (ft) (Pro - Ex)ft
40.11 2YR 4900 2469.23 2469.23 0 40.11 100YR 55000 2475.79 2475.79 0
40.01 2YR 4900 2468.45 2468.45 0 40.01 100YR 55000 2472.89 2472.89 0
39.92 2YR 4900 2466.88 2466.88 0 39.92 100YR 55000 2470.83 2470.86 0.03
39.82 2YR 4900 2461.68 2461.68 0 39.82 100YR 55000 2470.64 2470.67 0.03
39.73 2YR 4900 2461.48 2461.48 0 39.73 100YR 55000 2469.91 2469.95 0.04

Page 14
Without Project With Project Change in Water Surface Water Surface Water Surface
Q Total Elevation Elevation Elevation River Station Profile (cfs) (ft) (ft) (Pro - Ex)ft
39.63 2YR 4900 2459.64 2459.65 0.01 39.63 100YR 55000 2466.77 2466.5 -0.27
39.54 2YR 4900 2452.28 2452.28 0 39.54 100YR 55000 2468.56 2468.44 -0.12
39.44 2YR 4900 2452.26 2452.25 -0.01 39.44 100YR 55000 2468.32 2468.19 -0.13
39.35 2YR 4900 2452.24 2452.24 0 39.35 100YR 55000 2468.33 2468.2 -0.13
39.25 2YR 4900 2452.24 2452.24 0 39.25 100YR 55000 2468.31 2468.18 -0.13
39.16 2YR 4900 2451.19 2451.19 0 39.16 100YR 55000 2461.3 2461.34 0.04
39.06 2YR 4900 2448.34 2448.36 0.02 39.06 100YR 55000 2460.92 2459.64 -1.28
38.97 2YR 4900 2445.32 2445.32 0 38.97 100YR 55000 2462.12 2461.85 -0.27
38.965 Bridge at Valencia Road
38.96 2YR 4900 2444.58 2444.58 0 38.96 100YR 55000 2461.85 2461.56 -0.29
38.82 2YR 4900 2444.11 2444.11 0 38.82 100YR 55000 2461.97 2461.64 -0.33
38.73 2YR 4900 2443.98 2443.98 0 38.73 100YR 55000 2461.84 2461.42 -0.42
38.63 2YR 4900 2443.68 2443.68 0 38.63 100YR 55000 2461.52 2460.85 -0.67
38.54 2YR 4900 2441.46 2441.46 0 38.54 100YR 55000 2454.84 2454.7 -0.14
38.44 2YR 4900 2437.64 2437.64 0 38.44 100YR 55000 2448.7 2448.88 0.18
38.35 2YR 4900 2435.89 2435.89 0 38.35 100YR 55000 2449.1 2449.69 0.59

Page 15
Without Project With Project Change in Water Surface Water Surface Water Surface
Q Total Elevation Elevation Elevation River Station Profile (cfs) (ft) (ft) (Pro - Ex)ft
38.25 2YR 4900 2435.22 2435.23 0.01 38.25 100YR 55000 2449.04 2449.59 0.55
38.16 2YR 4900 2433.42 2433.42 0 38.16 100YR 55000 2443.53 2443.84 0.31
38.06 2YR 4900 2430.62 2430.61 -0.01 38.06 100YR 55000 2438.59 2439.12 0.53
37.97 2YR 4900 2429.4 2429.29 -0.11 37.97 100YR 55000 2438.19 2438.63 0.44
37.87 2YR 4900 2428.44 2428.34 -0.1 37.87 100YR 55000 2437.85 2438.17 0.32
37.78 2YR 4900 2427.53 2427.54 0.01 37.78 100YR 55000 2435.48 2436.56 1.08
37.69 2YR 4900 2425.24 2425.22 -0.02 37.69 100YR 55000 2432.52 2433.24 0.72
37.59 2YR 4900 2422.32 2422.43 0.11 37.59 100YR 55000 2431.07 2431.52 0.45
37.5 2YR 4900 2420.07 2420.06 -0.01 37.5 100YR 55000 2430.66 2430.6 -0.06
37.4 2YR 4900 2418.3 2418.25 -0.05 37.4 100YR 55000 2428.37 2429.9 1.53
37.31 2YR 4900 2416.32 2416.44 0.12 37.31 100YR 55000 2427.15 2426.74 -0.41
37.21 2YR 4900 2414.97 2415 0.03 37.21 100YR 55000 2426.71 2426.68 -0.03
37.12 2YR 4900 2413.64 2413.62 -0.02 37.12 100YR 55000 2426.35 2426.66 0.31
37.02 2YR 4900 2412.55 2412.53 -0.02 37.02 100YR 55000 2426.06 2426.58 0.52
36.93 2YR 4900 2409.84 2409.85 0.01 36.93 100YR 55000 2425.66 2424.93 -0.73

Page 16
Without Project With Project Change in Water Surface Water Surface Water Surface
Q Total Elevation Elevation Elevation River Station Profile (cfs) (ft) (ft) (Pro - Ex)ft
36.83 2YR 4900 2406.66 2406.66 0 36.83 100YR 55000 2425.72 2425.72 0
36.825 Bridge at Irvington
36.82 2YR 4900 2405.23 2405.23 0 36.82 100YR 55000 2415.19 2415.19 0
36.72 2YR 4900 2403.34 2403.34 0 36.72 100YR 55000 2412.15 2412.15 0
36.63 2YR 4900 2400.53 2400.53 0 36.63 100YR 55000 2412.33 2412.33 0
36.54 2YR 4900 2399.42 2399.42 0 36.54 100YR 55000 2413.18 2413.18 0
36.44 2YR 4900 2398.23 2398.23 0 36.44 100YR 55000 2409.92 2409.92 0
36.35 2YR 4900 2396.84 2396.84 0 36.35 100YR 55000 2408.79 2408.79 0
36.25 2YR 4900 2395.84 2395.84 0 36.25 100YR 55000 2408.43 2408.43 0
36.16 2YR 4900 2394.47 2394.47 0 36.16 100YR 55000 2407.2 2407.2 0
36.06 2YR 4900 2392.93 2392.93 0 36.06 100YR 55000 2405.5 2405.5 0
35.97 2YR 4900 2390.12 2390.12 0 35.97 100YR 55000 2403.03 2403.04 0.01
35.87 2YR 4900 2389.79 2389.79 0 35.87 100YR 55000 2403.1 2403.11 0.01
35.78 2YR 4900 2388.67 2388.67 0 35.78 100YR 55000 2401.88 2401.88 0
35.775 Bridge at Ajo Way
35.77 2YR 4900 2387.62 2387.62 0 35.77 100YR 55000 2398.6 2398.6 0

Page 17
Without Project With Project Change in Water Surface Water Surface Water Surface
Q Total Elevation Elevation Elevation River Station Profile (cfs) (ft) (ft) (Pro - Ex)ft
35.66 2YR 4900 2383.58 2383.58 0 35.66 100YR 55000 2395.78 2393.75 -2.03
35.57 2YR 4900 2382.74 2382.72 -0.02 35.57 100YR 55000 2391.2 2391.22 0.02
35.47 2YR 4900 2381.1 2381.09 -0.01 35.47 100YR 55000 2389.48 2389.98 0.5
35.38 2YR 4900 2379.67 2379.67 0 35.38 100YR 55000 2388.91 2389.75 0.84
35.29 2YR 4900 2377.91 2377.91 0 35.29 100YR 55000 2385.5 2385.78 0.28
35.19 2YR 4900 2376.5 2376.5 0 35.19 100YR 55000 2386.02 2386.06 0.04
35.1 2YR 4900 2375.33 2375.35 0.02 35.1 100YR 55000 2384.83 2384.02 -0.81
35 2YR 4900 2374.06 2373.85 -0.21 35 100YR 55000 2381.4 2381.41 0.01
34.91 2YR 4900 2372.47 2372.56 0.09 34.91 100YR 55000 2382.4 2382.9 0.5
34.81 2YR 4900 2369.62 2369.61 -0.01 34.81 100YR 55000 2379.88 2379.06 -0.82
34.72 2YR 4900 2367.01 2367.05 0.04 34.72 100YR 55000 2379.7 2378.3 -1.4
34.62 2YR 4900 2366.41 2366.45 0.04 34.62 100YR 55000 2377.82 2377.95 0.13
34.53 2YR 4900 2365.24 2365.24 0 34.53 100YR 55000 2378.49 2378.34 -0.15
34.43 2YR 4900 2362.4 2362.4 0 34.43 100YR 55000 2378.3 2377.98 -0.32
34.34 2YR 4900 2359.3 2359.31 0.01 34.34 100YR 55000 2377.32 2376.87 -0.45
34.25 2YR 4900 2357.34 2357.34 0

Page 18
Without Project With Project Change in Water Surface Water Surface Water Surface
Q Total Elevation Elevation Elevation River Station Profile (cfs) (ft) (ft) (Pro - Ex)ft
34.25 100YR 55000 2376.17 2376.17 0
34.245 Bridge at Silverlake
34.24 2YR 4900 2356.23 2356.23 0 34.24 100YR 55000 2367.77 2367.77 0
34.14 2YR 4900 2352.86 2352.86 0 34.14 100YR 55000 2365.45 2365.45 0
34.05 2YR 4900 2350.55 2350.55 0 34.05 100YR 55000 2363.73 2363.73 0
33.95 2YR 4900 2350.35 2350.35 0 33.95 100YR 55000 2365.62 2365.62 0
33.86 2YR 4900 2349.38 2349.38 0 33.86 100YR 55000 2362.38 2362.38 0
33.76 2YR 4900 2348.08 2348.08 0 33.76 100YR 55000 2361.08 2361.08 0
33.755 Bridge at 22nd Street
33.75 2YR 4900 2346.96 2346.96 0 33.75 100YR 55000 2359.02 2359.02 0
33.66 2YR 4900 2343.92 2343.92 0 33.66 100YR 55000 2359.21 2359.21 0
33.57 2YR 4900 2343 2343 0 33.57 100YR 55000 2359.18 2359.18 0
33.47 2YR 4900 2342.02 2342.02 0 33.47 100YR 55000 2356.6 2356.6 0
33.38 2YR 4900 2340.92 2340.92 0 33.38 100YR 55000 2354.7 2354.7 0
33.28 2YR 4900 2339.79 2339.79 0 33.28 100YR 55000 2352.68 2352.68 0
33.19 2YR 4900 2338.64 2338.64 0 33.19 100YR 55000 2350.77 2350.77 0
33.09 2YR 4900 2338.19 2338.19 0

Page 19
Without Project With Project Change in Water Surface Water Surface Water Surface
Q Total Elevation Elevation Elevation River Station Profile (cfs) (ft) (ft) (Pro - Ex)ft
33.09 100YR 55000 2352.45 2352.45 0
33 2YR 4900 2337.02 2337.02 0 33 100YR 55000 2351.65 2351.65 0
32.9 2YR 4900 2334.77 2334.77 0 32.9 100YR 55000 2350.15 2350.15 0
32.81 2YR 4900 2333.55 2333.55 0 32.81 100YR 55000 2350.13 2350.13 0
32.72 2YR 4900 2332.9 2332.9 0 32.72 100YR 55000 2350.07 2350.07 0
32.62 2YR 4900 2331.85 2331.85 0 32.62 100YR 55000 2347.46 2347.46 0
32.615 Bridge at Congress Street
32.61 2YR 4900 2331.48 2331.48 0 32.61 100YR 55000 2343.46 2343.46 0
32.53 2YR 4900 2330.8 2330.8 0 32.53 100YR 55000 2343.5 2343.5 0
32.44 2YR 4900 2328.25 2328.25 0 32.44 100YR 55000 2340.82 2340.82 0
32.34 2YR 4900 2325.37 2325.37 0 32.34 100YR 55000 2341.27 2341.27 0
32.25 2YR 4900 2323 2323 0 32.25 100YR 55000 2340.48 2340.48 0
32.15 2YR 4900 2321.94 2321.94 0 32.15 100YR 55000 2341.06 2341.06 0
32.06 2YR 4900 2320.98 2320.98 0 32.06 100YR 55000 2340.87 2340.87 0
31.96 2YR 4900 2319.87 2319.87 0 31.96 100YR 55000 2339.73 2339.73 0
31.955 Bridge at St. Marys
31.95 2YR 4900 2318.71 2318.71 0

Page 20
Without Project With Project Change in Water Surface Water Surface Water Surface
Q Total Elevation Elevation Elevation River Station Profile (cfs) (ft) (ft) (Pro - Ex)ft
31.95 100YR 55000 2332.88 2332.88 0
31.82 2YR 4900 2315.83 2315.83 0 31.82 100YR 55000 2328.3 2328.3 0
31.73 2YR 4900 2314.02 2314.02 0 31.73 100YR 55000 2328.03 2328.03 0
31.63 2YR 4900 2311.68 2311.68 0 31.63 100YR 55000 2327.63 2327.63 0
31.54 2YR 4900 2310.72 2310.72 0 31.54 100YR 55000 2328.56 2328.56 0
31.53 Bridge at Speedway
31.52 2YR 4900 2310.13 2310.13 0 31.52 100YR 55000 2323.43 2323.43 0

Figure 3 Santa Cruz River With Project Floodplain Northern Portion of Study Area
Page 21

Figure 4 Santa Cruz River With Project Floodplain Southern Portion of Study Area
Page 22

Page 23
1.3.5 SEDIMENT BUDGET ANALYSIS To date, a sediment budget level of analysis was undertaken for the Without Project Condition only. The computer program SAM (WES, 1997) was used for the sediment budget analysis. More detailed analysis (e.g., HEC-6, HEC, 1993) program model approach will be utilized once a recommend plan is identified for design purposes. In general, the previous analysis results indicate that there would be significant to moderate degradation at both the extreme upstream and downstream reaches and to a lesser extent within the middle reaches. In other words, almost all of the entire study reach was found to be subject to some overall degradation. However, a full comprehension of the results especially at the upstream and downstream limit of the study reach needs to be expanded upon. In the case of the upstream reach, the deep scour phenomenon may be the result of the equilibrium conditions that were assumed for this reach. Whereas, for the downstream reach, the obvious effects of the existing grade control structure downstream of Congress Street could not be incorporated in the sediment budget model. Hence, the application of a sediment budget analysis inherently suffers several notable shortcomings as a penalty for the simple and expedient nature of the calculations. Specifically, the analysis does not properly restrict the deposition of the wash load from the supply reach; it does not revise the hydraulic characteristics of the stream to reflect the changes in bed slope caused by scour and deposition; it does not account for the effect of changes in the bed material composition on the computed sediment transport capacities; and it does not account for armoring of the streambed that would limit degradation. Because of these simplifications, a sediment budget analysis typically overestimates aggradation and degradation. This overestimation is evident in the results for the upstream reach of the Santa Cruz River. In addition, a sediment budget analysis is extremely sensitive to the selection of subreaches and representative cross sections. Relatively minor differences in average hydraulic characteristics, particularly velocity, can translate into large differences in computed average bed changes. For these reasons, firm conclusions as to the stability of the study reach could not be drawn from the limited sedimentation computations. However, the reach did appear to exhibit a progression toward quasi-equilibrium by a lessening in the erosion rate. Because of the inadequacies of the sediment budget analysis, the historical behavior of the existing stream was reviewed to add additional clarity in assessing the stability of this reach of the Santa Cruz River. The following excerpt was extracted from the Santa Cruz River Management Study (SLA, 1986):
“USGS data suggest that there may have been vertical stability during the early to mid 19th century, but that this reach has been degrading since the 1950’s. There have been multiple references to degradation along specific reaches of the Santa Cruz River during the late 1950’s to the mid 1960’s. Ajo Way to Grant Road experienced 10 to 15 feet of degradation, while 6 to 8 feet of degradation occurred between Speedway Boulevard and Valencia Road. This change may be partially due to the extensive use of materials from the Santa Cruz River streambed during the construction of the I-10 highway during the late 1950’s/early 1960’s. While subsequent bed profiles show a slight recovery, the overall profile of the streambed has still degraded by one to four feet through the Tucson Urban Reach since

Page 24
1947. Historic lateral changes are not easily identified through this reach of the river due to extensive fill and channelization. There is general agreement that this reach is well defined and incised; however, any documentation of the lateral changes may suffer due to the intensive channel work performed in the metropolitan area.
The floods of 1983 were a significant test of lateral and channel stability. During this event, the unstabilized embankments along two reach locations—one reach located just upstream of and within the southern end (i.e., between I-19 and Ajo Way), and the other reach located at the northern end of the Tucson Urban Reach (i.e., just downstream of Grant Road to the Silverbell Golf Course)—experienced significant erosion/lateral migration (i.e., from 200 feet to 500 feet).” 1.3.6 BANK EROSION 1.3.6.1 Background The bank erosion study was limited to the Santa Cruz River. The New West Branch was not studied since its banks are lined with concrete/soil cement. This was the same case for the Los Reales Improvement District area. The Old West Branch was not studied due to plan formulation constrains that preclude structural channel modifications. 1.3.6.2 Geomorphic Relationships Since there is no official guidance on determining bank erosion, several widely acceptable technical approaches within the hydraulic community were used in the study. The processes and methodologies were found in the following references: a. EM 1110-2-1418, “Channel Stability Assessment for Flood Control Channels” (US Army
Corps of Engineers, 1994). The section titled “Channel Evolution and Geomorphic Thresholds” has guidance on distinguishing braided from non-braided channels. The channel slope of the study area is approximately 0.003. In natural streams the channel-forming discharge can often be taken as equivalent to the bank-full discharge. In terms of flood frequency, a return period of around 2 years appears to be common in the eastern half of the United States. However, in the western United States area, a return period between 5 and 10 years is more appropriate (the latter for urban and channelized streams). The channel forming discharge is between 4900 cfs (2-year flood event) and 14000 cfs (10-year flood event). This range of data was plotted on Figure 2-24. The Leopold & Wolman 1957 braided vs. meandering separation line was used to distinguish between braided and meandering channels. According to this figure, this reach of the Santa Cruz River is of the braided type.
b. Rosgen Classification System (Rosgen, 1996). This reach of the Santa Cruz River has a
slope of 0.003, sinuosity less than 1.2, has multiple channels, and consists of sands and

Page 25
gravels. According to the Rosgen Classification System, it can be classified as a D4 or D5 channel. Rosgen describes a D5 channel as follows: “The D5 stream types are multiple channel systems described as braided streams... The braided channel system is characterized by high bank erosion rates, excessive deposition occurring as both longitudinal and transverse bars, and annual shifts of the bed location. A combination of adverse conditions are responsible for channel braiding, including high sediment supply, high bank erodibility, moderately steep gradients, and very flashy runoff conditions which can vary rapidly from a base flow to an over-bank flow on a frequent basis (Rosgen, 1996).”
c. Restoring Streams in Cities (Riley, 1998). According to the book: “A braided stream
channel is typically wide and shallow and contains a number of separated channels that flow in and around mid-channel sediment bars and islands. Braided channels usually indicate that a stream is supplied with more sediment than it can carry. Other conditions that can lead to braiding are steep slopes, coarse materials with low erosion resistance, sediments deposited at grade changes, and aggradation that allows the channel to shift course…A braided stream is unstable, changes its alignment rapidly, carries large amounts of sediment, is wide and shallow even at flood flows, and is in general unpredictable.” This reach of the Santa Cruz River certainly fits this description.
d. USGS Water Supply Paper 2429, Channel Change on the Santa Cruz River, Pima County,
Arizona, 1936-86 (USGS, 1995). This paper contained some historical and geomorphic information.
1.3.6.3 Existing Bank Protection In response to historical flooding and lateral bank erosion, Pima Count and the City of Tucson initiated a program of bank stabilization. Many areas in the study reach were channelized and the banks lined with soil cement revetments. Soil cement grade control structures were also installed to prevent scour at selected bridges. Currently, the following areas of the Santa Cruz River are completely bank protected with soil cement and were excluded from this analysis:
• Upstream and downstream of the Valencia Road Bridge, • Irvington Road to Ajo Way, and • Silverlake Road to Congress Street.
There are three (3) remaining gaps that are currently unprotected:
• Los Reales Road to south of Valencia Road, • North of Valencia Road to Irvington Road, and • Ajo Way to Silverlake Road.
1.3.6.4 Historical Bank Erosion Information The following excerpts from USGS Water Supply Paper 2429 (1995) pertain to this study reach:

Page 26
“The Tucson reach has shown the least lateral instability during the period. Either much of the apparent stability is artificial—because of bank armoring, which has prevented channel change, or of artificial filling, which has obscured the record of change occurring between 1936 and 1986. Parts of the reach underwent about 15 ft of degradation between the 1950’s and 1976.”
“Arroyo change along other reaches of the Santa Cruz River is difficult to evaluate because the Tucson and Sahuarita reaches have been subject to extensive human alteration and much of the apparent lateral stability of the reaches is artificial. For example, according to bridge specifications prepared in 1916, the channel at Congress Street in the Tucson reach widened to 375 ft during the floods of 1914-15, but subsequent artificial filling reduced width at that location to less than 200 ft. Two motels now stand on landfill above the site of the migrating meander that destroyed the Congress Street bridge in 1915. In contrast to the San Xavier reach, most arroyo widening of the upper Tucson reach took place in the 1950’s, and little widening occurred thereafter except locally as a result of the flood of 1983. Some of the arroyo widening that took place between Silverlake Road and Congress Street in the 1950’s may have been associated with construction activity that is visible in aerial photographs of 1960…The most pronounced arroyo widening occurred from Silverlake Road to Grant Road during 1953-60 before degradation had begun at most locations in the Tucson reach. Between Silverlake Road and Congress Street, the rate of arroyo widening was constant from 1953 to 1971. From Congress Street to Grant Road, however, no significant arroyo widening occurred between 1960 and 1978 even though this was a period of maximum incision and subsequent vertical fluctuation. After the flood of 1983, only the part of the Tucson reach from Congress Street to Speedway Boulevard showed a significant increase in mean arroyo width.” “Between 1915 and 1929, extensive arroyo widening occurred during 1914-15 floods throughout the reach and the Congress Street bridge was destroyed. Between 1930 and 1959, extensive widening occurred between Speedway Boulevard and Grant Road and channel degradation begins during the later years. Between 1960 and 1986, the arroyo widths were generally stable. There was apparent narrowing at some locations caused by channelization and landfill operations. As much as 15 ft of arroyo incision occurred. There was substantial arroyo wall retreat along unprotected segments of the reach as a result of 1983 flood.” Table 4 summarizes the amount of bank movement between 1941 and 2002. Within the study reach, there was major arroyo widening throughout the study period. There was considerable degradation in the 1950’s and 1960’s. Artificial changes include extensive channelization and armoring; and landfill operations. There was sand-gravel mining at Valencia Road. There were some armoring, highway fill, and landfill at other locations. At some locations, the banks generally did not move. This is expected in geologically confined reaches and reaches with bank protection. At other locations, the banks moved as much as 900 ft within the past 60 years. In addition, the migration rate per year for each bank

Page 27
was determined by dividing the migration amount by the number of years between the photographs, i.e. the migration rate was linearized from the historical data.
Table 4: Bank Erosion Between 1941-2002
Year Bank Width Lt. Bank Erosion
Rt. Bank Erosion
Lt. Bank Erosion Rate
Per Year
Rt Bank Erosion Rate
Per Year Station 34.43
1941 180 1960 130 40 60 2 3 2002 650 350 170 8 4
Station 35.66 1941 220 1960 250 420 380 22 20 2002 330 380 460 9 11
Station 37.50 1941 610 1960 360 340 680 18 36 2002 890 380 850 9 20
1.3.6.5 Erosion Hazard Boundary Mapping Erosion hazard boundary maps from the Santa Cruz River Management Study (SLA, 1986) were also considered in this study. The subject report developed a map identifying potential erosion-hazard areas based on lateral-migration measurements and a time-sequence series of historical photographs. They present the “worst-case” estimates of the potential bank erosion limits of the Santa Cruz River. The erosion limits within the study area were manually digitized and is illustrated in Plate 19. The Pima County Flood Control District provided digitized historical aerial photographs of the Santa Cruz River study reach dated 1941 and 1969. The digitized photographs were not georeferenced or orthorectified. Using an ArcView extension, the photographs were georeferenced only. They were not orthorectified since this is a more involved process. The left and right banks were then digitized. Given the original conditions of the photographs, the historical bank locations are not exact but were determined to be adequate for this level of study. Recent geologic banks were determined from reviewing the historical aerial photographs and viewing the shape of the topographic lines along the Santa Cruz River study reach. The boundaries were initially set to include all areas where abandoned meander features were found as well as extending to the areas where the contour lines changed direction from following the regional slopes to being perpendicular to the river channel. This coverage should be fairly close to the maximum historical meander belt for the river in this reach. It varies from approximately 0.5 mile in width at 22nd Street to approximately 1.5 miles in width at Valencia Road. Lateral migration would not be expected to exceed these limits.

Page 28
1.3.6.6 Conclusions The purpose of this erosion investigation was to determine the maximum bank erosion as well as the average annual bank erosion along the study reach of the Santa Cruz River. The references cited in this section contained numerous historical material for the Santa Cruz River and geomorphic relationships for natural streams. However, there was no information or guidance to calculate average annual bank erosion for braided type streams. To complicate matters, there were several artificial features that affected the bank stability of the study reach, i.e. bridge abutment fill, bank armoring, gravel mining, etc. For the reasons stated above, it was determined that a simplified methodology would be used to determine the maximum bank erosion; it would be inappropriate at this time to determine an average annual erosion rate given all the uncertainties. Using a combination of all the methods and historical information described above, a maximum bank erosion set of limits was developed and is illustrated on Plate 19. It is anticipated that the With Project Conditions bank erosion analysis will not significantly change from the Without Project analysis. The flattening of unprotected banks and introduction of vegetative habitat may prevent bank erosion and lateral head cutting during frequent storm events, however these measures are unlikely to provide sufficient bank stability infrequent (e.g., 50 to 500-year) storm events. 1.4 NEW WEST BRANCH WITH PROJECT CONDITIONS 1.4.1 ALTERNATIVES ANALYSES The revised without project conditions HEC-RAS model for the New West Branch was modified to determine the impacts of two proposed alternatives. These alternatives are NWB-1 (Channel Invert Excavation), NWB-2 (raise Existing Levees), and NWB-3 (Floodwalls). 1.4.1.1 Alternative NWB-1 (Channel Dredging) The without project hydraulic model was modified to determine the impacts of channel dredging. The following impacts or concerns were identified:
a) Excavation can increase the conveyance of the New West Branch up to the 100-yr flood event only. Up to two (2) ft of excavation is necessary.
b) Excavation alone would not contain the 200- and 500-yr flood events. c) The existing grade control structure at Station 6.0 would need to be modified (i.e.,
lowered or reconstructed) as well as the key-in to the existing bank protection. d) The existing footbridge upstream of Drexel Road would need to be removed or
replaced.

Page 29
e) Excavation may result in undermining of the existing soil cement bank protection. The toe down depth(s) of the existing soil cement bank protection is unknown and cannot be verified. Additional field exploration will be required to determine structural integrity, toe-down depths, and subsurface conditions behind and under the soil cement.
The results of this evaluation are presented in Figures 5 and 6 and Table 5. 1.4.1.2 Alternative NWB-2 and NWB-3 Low levees currently exist along both channel banks, however they do not contain the 100, 200, and 500-year flows. An alternative analysis was performed to determine effects of raising the existing levees to protect for the 100 through 500-year flood events. As built drawings for the existing levees and bank protection are not available therefore, for engineering design and cost estimating purposes, the existing levees were assumed to be structurally inadequate, therefore new engineered levees are assumed. Due to the high velocities and possibility of run-up at the curve, rigid armoring (i.e., soil cement) is recommended for the inside slopes of the levees. The results of the evaluation and required levee heights for each respective design storm are presented in Table 6.

02410
2420
2430
2440
2450
2460
2470
2480
FIGURE 5 Paseo de las Iglesias - New West Branch Plan: 1) Excavation 2 12/3/2003 2) Levee 12/3/2003 Geom: Excavation Alternative 2 Flow: Excavation Alternative 2
Ele
vatio
n (ft
)
Legend
WS 100YR - Excavation 24.
000
NewWestBranch Reach
2000 40
WS 100YR - Levee
Ground
5.00
0
6.00
0
6.8
8.00
0
8.7
9.00
0
00 6000 8000 10000 12000 14000 16000
Main Channel Distance (ft)
LOB
ROB
Ground
10.0
0011
.2
12.0
00
12.8
13.3
13.8
15.0
00
16.0
0017
.000
19.0
00
20.0
00
21.0
00
22.0
00
23.0
00
24.0
00
25.0
00
26.0
001

9800 9850 9900 9950 10000 10050 10100 10150 102002420
2425
2430
2435
2440
FIGURE 6 Paseo de las Iglesias - New West Branch Plan: 1) Excavation 2 2) Levee Geom: Excavation Alternative 2 Flow: Excavation Alternative 2
River = NewWestBranch Reach = Reach RS = 6.8
Station (ft)
Ele
vatio
n (ft
)
Legend
WS 100YR - Levee
WS 100YR - Excavation 2
Ground - Levee
Levee - Levee
Bank Sta - Levee
Ground - Excavation 2
Levee - Excavation 2
Bank Sta - Excavation 2
1

TABLE 5 HEC-RAS Plan: Excavation 2 River: NewWestBranch Reach: Reach Profile: 100YR
Reach River Sta Profile Q Total Min Ch El W.S. Elev Crit W.S. E.G. Elev E.G. Slope Vel Chnl Flow Area Top Width Froude # Chl
(cfs) (ft) (ft) (ft) (ft) (ft/ft) (ft/s) (sq ft) (ft)
Reach 1.000 100YR 9908.00 2414.25 2419.37 2419.37 2421.76 0.005646 12.42 797.89 165.90 1.00
Reach 1.9 100YR 9908.00 2415.00 2420.44 2420.44 2422.76 0.005491 12.24 809.58 173.32 1.00
Reach 2.000 100YR 9908.00 2414.78 2422.13 2420.63 2422.99 0.002886 7.43 1334.23 375.13 0.69
Reach 3.000 100YR 9908.00 2415.55 2421.54 2421.22 2423.58 0.004423 11.47 863.44 172.99 0.91
Reach 4.000 100YR 9908.00 2416.43 2423.87 2422.19 2425.14 0.002102 9.05 1095.26 179.15 0.64
Reach 4.2 100YR 9908.00 2417.00 2423.76 2422.80 2425.37 0.003119 10.19 972.70 179.52 0.77
Reach 5.000 100YR 9908.00 2418.25 2425.11 2423.96 2426.65 0.002776 9.96 994.70 173.40 0.73
Reach 5.2 100YR 9908.00 2417.80 2425.95 2423.17 2426.89 0.001285 7.80 1270.47 178.32 0.51
Reach 6.000 100YR 9908.00 2419.13 2426.71 2424.46 2427.77 0.001579 8.25 1201.48 181.41 0.56
Reach 6.3 100YR 9908.00 2419.46 2426.87 2424.86 2428.06 0.001803 8.73 1134.46 173.47 0.60
Reach 6.8 100YR 9908.00 2420.25 2427.51 2425.70 2428.73 0.001984 8.85 1119.35 180.83 0.63
Reach 7.000 100YR 9908.00 2420.47 2427.74 2425.87 2428.93 0.001920 8.75 1132.23 181.65 0.62
Reach 8.000 100YR 9908.00 2421.47 2428.57 2426.87 2429.84 0.002103 9.07 1092.72 177.93 0.64
Reach 8.7 100YR 9908.00 2422.59 2429.62 2428.01 2430.92 0.002189 9.14 1083.69 179.72 0.66
Reach 9.000 100YR 9908.00 2423.25 2430.28 2428.63 2431.57 0.002176 9.09 1089.89 181.53 0.65
Reach 9.2 100YR 9908.00 2423.57 2430.70 2429.14 2432.03 0.002275 9.23 1073.62 182.32 0.67
Reach 10.000 100YR 9908.00 2424.94 2432.07 2430.19 2433.17 0.001826 8.40 1178.98 193.51 0.60
Reach 10.5 Bridge
Reach 11.000 100YR 9908.00 2425.48 2432.71 2430.83 2433.93 0.001926 8.86 1118.66 176.34 0.62
Reach 11.2 100YR 9908.00 2425.77 2432.63 2432.01 2434.52 0.003689 11.03 898.16 166.47 0.84
Reach 11.3 100YR 9908.00 2425.70 2433.16 2432.15 2434.78 0.003038 10.23 968.72 174.06 0.76
Reach 12.000 100YR 9908.00 2427.04 2434.22 2433.27 2435.94 0.003105 10.51 942.36 164.96 0.78
Reach 12.2 100YR 9908.00 2428.00 2434.39 2433.89 2436.37 0.004013 11.30 877.01 167.11 0.87
Reach 12.8 100YR 9908.00 2429.50 2436.56 2435.19 2437.98 0.002463 9.56 1036.35 175.69 0.69
Reach 13.000 100YR 9908.00 2430.08 2437.84 2435.69 2438.45 0.001304 6.24 1588.68 318.09 0.49
Reach 13.3 100YR 9908.00 2431.52 2437.35 2437.35 2439.86 0.005442 12.69 780.73 156.75 1.00
Reach 13.8 100YR 9908.00 2432.76 2440.45 2438.31 2441.27 0.001420 7.27 1362.91 229.94 0.53
Reach 14.000 100YR 9908.00 2432.60 2440.80 2437.68 2441.36 0.000842 6.04 1639.74 246.62 0.41
Reach 15.000 100YR 9908.00 2434.04 2441.82 2441.82 2444.26 0.005392 12.53 790.67 160.29 0.99
Reach 16.000 100YR 9908.00 2437.70 2445.60 2445.18 2447.75 0.004193 11.76 842.55 155.97 0.89
Reach 17.000 100YR 9908.00 2442.96 2448.67 2448.67 2451.07 0.005484 12.43 797.12 164.41 0.99
Reach 17.5 Bridge
Reach 18.000 100YR 9908.00 2444.29 2450.86 2450.06 2452.71 0.003608 10.93 906.18 165.90 0.82
Reach 19.000 100YR 9908.00 2446.01 2453.32 2452.51 2455.22 0.003423 11.06 895.89 156.02 0.81
Reach 20.000 100YR 9908.00 2448.79 2456.03 2454.62 2457.06 0.002229 8.16 1213.53 242.86 0.64
Reach 21.000 100YR 9908.00 2448.97 2457.62 2456.96 2459.62 0.003657 11.34 874.07 154.39 0.84
Reach 22.000 100YR 9908.00 2450.92 2459.81 2458.95 2461.68 0.003281 10.97 903.34 154.56 0.80
Reach 23.000 100YR 9908.00 2452.07 2461.86 2461.64 2464.28 0.004654 12.48 793.62 144.70 0.94
Reach 24.000 100YR 9908.00 2454.54 2464.56 2463.77 2466.74 0.003502 11.84 837.13 133.33 0.83
Reach 25.000 100YR 9908.00 2458.40 2466.90 2466.65 2469.54 0.004559 13.04 759.86 127.70 0.94
Reach 26.000 100YR 9908.00 2462.46 2469.55 2469.48 2471.98 0.005118 12.53 790.64 154.60 0.98
HEC-RAS Standard Output Table for Proposed Excavation Alternative

Table 6. New West Branch of the Santa Cruz River Required Levee Elevations
Station1 100-yr 200-yr 500-yr Left Levee Right Levee 100-yr 200-yr 500-yr Left Levee Right Levee Left Levee Right Levee Left Levee Right Levee
1 2419.4 2420.0 2420.6 2423.8 2423.2 2421.4 2422.0 2422.6 -2.5 -1.8 -1.8 -1.2 -1.2 -0.61.9 2420.4 2421.1 2421.7 2423.5 2422.1 2422.4 2423.1 2423.7 -1.0 0.3 -0.3 1.0 0.3 1.6
2 2422.1 2423.3 2424.2 2423.0 2422.2 2424.1 2425.3 2426.2 1.2 1.9 2.3 3.1 3.2 4.03 2421.5 2422.4 2423.2 2423.9 2423.1 2423.5 2424.4 2425.2 -0.4 0.5 0.5 1.3 1.3 2.14 2423.9 2424.6 2425.3 2425.1 2425.4 2425.9 2426.6 2427.3 0.8 0.4 1.5 1.2 2.3 1.9
4.2 2423.8 2424.5 2425.2 2424.8 2425.3 2425.8 2426.5 2427.2 1.0 0.5 1.7 1.2 2.4 2.05 2425.1 2425.8 2426.5 2425.9 2428.1 2427.1 2427.8 2428.5 1.2 -0.9 1.9 -0.2 2.5 0.4
5.2 2425.3 2426.1 2426.7 2425.6 2427.9 2427.3 2428.1 2428.7 1.8 -0.6 2.5 0.2 3.1 0.86 2427.1 2427.9 2428.5 2427.3 2430.0 2429.1 2429.9 2430.5 1.9 -0.9 2.6 -0.1 3.3 0.5
6.3 2427.6 2428.3 2429.0 2426.8 2430.1 2429.6 2430.3 2431.0 2.8 -0.5 3.5 0.2 4.1 0.86.8 2429.0 2429.8 2430.5 2427.2 2428.5 2431.0 2431.8 2432.5 3.8 2.4 4.5 3.2 5.2 3.9
7 2429.3 2430.1 2430.8 2427.7 2429.5 2431.3 2432.1 2432.8 3.5 1.7 4.4 2.6 5.1 3.38 2430.0 2430.8 2431.5 2429.4 2430.8 2432.0 2432.8 2433.5 2.6 1.2 3.5 2.1 4.2 2.8
8.7 2431.1 2432.0 2432.7 2429.8 2430.8 2433.1 2434.0 2434.7 3.3 2.3 4.2 3.2 4.9 3.99 2431.5 2432.4 2433.1 2431.0 2431.6 2433.5 2434.4 2435.1 2.5 1.8 3.3 2.7 4.1 3.4
9.2 2431.9 2432.7 2433.4 2431.3 2431.7 2433.9 2434.7 2435.4 2.6 2.3 3.4 3.1 4.1 3.810 2432.9 2433.7 2434.5 2437.7 2435.0 2434.9 2435.7 2436.5 -2.8 -0.1 -2.0 0.7 -1.2 1.511 2433.6 2434.4 2435.3 2436.7 2436.0 2435.6 2436.4 2437.3 -1.1 -0.5 -0.2 0.4 0.6 1.3
11.2 2433.6 2434.5 2435.3 2435.0 2435.0 2435.6 2436.5 2437.3 0.6 0.6 1.4 1.4 2.3 2.311.3 2433.8 2434.7 2435.5 2435.0 2434.6 2435.8 2436.7 2437.5 0.8 1.2 1.7 2.1 2.5 2.9
12 2434.5 2435.3 2436.1 2436.7 2436.8 2436.5 2437.3 2438.1 -0.2 -0.3 0.6 0.6 1.4 1.312.2 2434.7 2435.5 2436.2 2435.3 2436.4 2436.7 2437.5 2438.2 1.3 0.3 2.1 1.1 2.9 1.912.8 2436.5 2437.3 2437.9 2436.9 2437.9 2438.5 2439.3 2439.9 1.6 0.6 2.4 1.3 3.1 2.0
13 2437.8 2438.8 2439.6 2441.9 2441.9 2439.8 2440.8 2441.6 -2.1 -2.1 -1.2 -1.2 -0.3 -0.313.3 2437.4 2438.1 2438.7 2440.6 2440.9 2439.4 2440.1 2440.7 -1.2 -1.6 -0.5 -0.8 0.1 -0.213.8 2440.5 2441.3 2442.1 2442.0 2441.7 2442.5 2443.3 2444.1 0.4 0.8 1.3 1.7 2.1 2.5
14 2440.8 2441.7 2442.5 2444.0 2443.5 2442.8 2443.7 2444.5 -1.2 -0.7 -0.4 0.2 0.4 1.015 2441.8 2442.5 2443.1 2447.5 2447.6 2443.8 2444.5 2445.1 -3.6 -3.8 -2.9 -3.1 -2.3 -2.516 2445.6 2446.3 2446.8 2449.1 2449.6 2447.6 2448.3 2448.8 -1.5 -2.0 -0.8 -1.3 -0.2 -0.817 2448.7 2449.4 2450.0 2450.5 2450.5 2450.7 2451.4 2452.0 0.2 0.2 0.9 0.8 1.5 1.518 2453.7 2453.9 2454.1 2450.7 2453.0 2455.7 2455.9 2456.1 4.9 2.7 5.2 3.0 5.4 3.219 2454.3 2454.8 2454.9 2456.1 2456.1 2456.3 2456.8 2456.9 0.2 0.2 0.7 0.6 0.8 0.820 2456.1 2456.9 2457.7 2459.1 2458.3 2458.1 2458.9 2459.7 -1.0 -0.2 -0.1 0.7 0.7 1.521 2457.6 2458.2 2458.7 2461.4 2461.2 2459.6 2460.2 2460.7 -1.8 -1.6 -1.2 -1.0 -0.7 -0.522 2459.8 2460.7 2461.4 2463.8 2463.7 2461.8 2462.7 2463.4 -2.0 -1.9 -1.1 -1.0 -0.4 -0.323 2461.9 2462.6 2463.2 2466.1 2466.6 2463.9 2464.6 2465.2 -2.2 -2.8 -1.5 -2.0 -0.8 -1.424 2464.6 2465.3 2466.0 2468.3 2468.5 2466.6 2467.3 2468.0 -1.7 -1.9 -0.9 -1.1 -0.3 -0.525 2466.9 2467.7 2468.5 2470.0 2470.7 2468.9 2469.7 2470.5 -1.1 -1.8 -0.3 -1.0 0.4 -0.226 2469.6 2470.5 2471.3 2472.1 2472.2 2471.6 2472.5 2473.3 -0.5 -0.6 0.4 0.3 1.2 1.1
Notes:1. Station numbers with decimals are from additional Pima County survey data.2. HEC-RAS computed water surface elevations.3. 95% confidence levee elevation (computed water surface elevation + 2.0 ft).4. Negative numbers indicate locations where levee raising is not necessary.
WSEL2 (ft) Minimum Top of Levee3 (ft)Existing Top of Levee (ft)Minimum Required Levee Raising4 (ft)
100-yr 200-yr 500-yr
Levee Heights.xls

Page 34
IV. REFERENCES Arroyo Engineering, Inc., 1994, Request for a Letter of Map Revision for the Los Reales Improvement District Located in Pima County, Arizona, and in the City of Tucson, Arizona, Tucson, Arizona. Buck Lewis and Associates, Inc., (revised) 1982, Drainage Study for Mission Road, Valencia Road to Tucson City Limits, Tucson, Arizona . CMG Drainage Engineering Inc, 1990, Santa Cruz River Input Data Files, Tucson Arizona. Dooley-Jones & Associates, Inc. 1983, Midvale Park Master Drainage Report, Tucson, Arizona. Environmental Systems Research Institute, Inc., 1999, ArcView GIS 3.2, Redlands, California. Federal Emergency Management Agency, 1999, Flood Insurance Study, Tucson, Arizona. Hydrologic Engineering Center, 1990, User’s Manual – HEC-2 Water Surface Profiles, Davis, California. Hydrologic Engineering Center, 1993, User’s Manual – HEC-6 Scour and Deposition in Rivers and Reservoirs, Davis, California. Hydrologic Engineering Center, 1998, User’s Manual – HEC-FDA Flood Damage Reduction Analysis, Davis, California. Hydrologic Engineering Center, 2000, User’s Manual – HEC-GeoRAS River Analysis System, Davis, California. Hydrologic Engineering Center, 2001, User’s Manual – HEC-RAS River Analysis System, Davis, California. LMT Engineering, Inc., 2001, Paseo de las Iglesias Flood Control Project, Santa Cruz River, Congress to Los Reales, Pima County, Arizona, Tucson, Arizona. McGovern, MacVittie, Lodge, and Associates, Inc., 1994, Old West Branch of the Santa Cruz River Letter of Map Revision Study Input Data Files and Maps, Tucson, Arizona. McGovern, MacVittie, Lodge, and Associates, Inc.,2001, Master Drainage Study, Tohono O’odham Nation-San Xavier District Phase 1- Panhandle Area Existing Conditions, Pima County Arizona.

Page 35
Pima County Department of Transportation and Flood Control District, 1982, Pima County Drainage Development and Channel Design Standards, Pima County, Arizona. Pima County Department of Transportation and Flood Control District, 2001, Santa Cruz River, Paseo de las Iglesias, Pima County, Arizona, Feasibility Study, Hydrology Report, Tucson, Arizona. Pima County Department of Transportation and Flood Control District, 2001, Santa Cruz River, Paseo de las Iglesias, Pima County, Arizona, Feasibility Study, Hydraulic Report, Tucson, Arizona. Pima County Department of Transportation, Technical Services – GIS Database Services, 2001, Pima County Land Information System Version 14.0 Data Layers, Tucson, Arizona. Riley, Ann L., 1998, Restoring Streams in Cities: A Guide for Planners, Policymakers, and Citizens, Washington, D.C. Rosgen, Dave, 1996, Applied River Morphology, Minneapolis, Minnesota. Simons, Li, & Associates et al., 1993, Tucson Stormwater Management Study, Tucson, Arizona. US Army Corps of Engineers, 1994, EM 1110-2-1601, Hydraulic Design of Flood Control Channels, Change 1, Washington, D.C. US Army Corps of Engineers, 1994, EM 1110-2-1418, Channel Stability Assessment for Flood Control Projects, Washington, D.C. US Army Corps of Engineers, 1996, EM 1110-2-1619, Risk-Based Analysis for Flood Damage Reduction Studies, Washington, D.C. US Army Corps of Engineers, Waterways Experiment Station, 1997, SAM User’s Manual, Hydraulic Design Package for Channels, Vicksburg, Mississippi. US Army Corps of Engineers, Engineer Research and Development Center, 2001, Hydraulic Design of Stream Restoration Projects, Vicksburg, Mississippi. US Army Corps of Engineers, Los Angeles District, 2001, Santa Cruz River Management Study, Final Feasibility Report and Appendices, Los Angeles, California. US Geological Survey, 1995, Water Supply Paper 2429, Channel Change on the Santa Cruz River, Pima County, Arizona, 1936-86, Denver, Colorado.


Appendix 2
Master Drainage Study, Tohono O’Odham Nation-San Xavier District Phase 1- Pan-handle Area Existing Conditions: study boundaries, hydraulic analysis, HEC-RASoutput printout, and maps (2) of HEC-RAS cross section locations


Appendix 3
Request for a Letter of Map Revision for the Los Reales Improvement District Lo-cated in Pima County, Arizona, and the City of Tucson, Arizona: study boundaries,HEC-2 input and output printout for the West Branch of the Santa Cruz River fromValencia Road to the Reservation Boundary, HEC-2 input and output printout for theSouth Channel


Appendix 4
Midvale Park Master Drainage Report: study boundaries, West Branch Channel typi-cal cross sections

