appendix a weight of evidence€¦ · 28 switch yard locomotives anti-idling controls5 2007-2008 96...
TRANSCRIPT

Appendix A – Weight of Evidence
Appendix B – Public Hearing Record
Appendix C – Emissions Data -
Appendix D – SEMI Mobile Data
Appendix E – SEMI Monitoring Strategy
Appendix F – Calculation of Severstal emissions support documentation
Appendix G – Detroit Apportionment Studies
Appendix H – Modeling Data
Appendix I –High PM Final Report
Appendix J – Severstal Permit

1
Appendix A: Tables and Figures
MDEQ PM2.5 SIP

33--Year Average PM2.5 Concentrations Year Average PM2.5 Concentrations Southeast MichiganSoutheast Michigan
Figure 1
Source: SEMCOG
Open symbols indicate monitors that currently violate the annual standard.
9
12
15
18
21
2000-2002 2001-2003 2002-2004 2003-2005 2004-2006 2005-2007
Con
cent
ratio
n (u
g/m
3)
Dearborn
SW HSWyandotte
Allen Park
Linwood
Luna Pier
Oak ParkYpsilanti
Livonia
E 7 Mile
Port Huron
New Haven
2

Expected Change in On-Road Mobile Source Emissions due to National Controls
tons
/yea
r
0
50,000
100,000
150,000
2002 2005 2009 2018
VOCNOxPM2.5
45%
50%
47%
27%
25%
26%
Figure 2
Percentages indicate reduction from 2002
82%69%
70%
Source: SEMCOG On-Road Mobile Source Emissions Inventory for Southeast Michigan PM2.5 SIP, 20073

4
Table 1
Note: Modeling includes regional and national controls, not local controls
Monitor County Site 03-'05 04-'06 05-'07
Base Year Design Value*
2009 Design Value Decrease
260990009 Macomb New Haven 13 12.5 12.5 12.7 11.4 -1.3261150005 Monroe Luna Pier 14.1 13.8 13.8 13.9 12.2 -1.7261250001 Oakland Oak Park 14.3 13.4 13.6 13.8 12.4 -1.4261470005 St. Clair Port Huron 13.8 13.1 13.2 13.4 11.8 -1.6261610008 Washtenaw Ypsilanti 14.3 13.6 13.7 13.9 12.2 -1.7261630001 Wayne Allen Park 15.1 14.5 14 14.5 13 -1.5261630015 Wayne Southwest HS 16.4 15.8 15.5 15.9 14.2 -1.7261630016 Wayne Linwood 15.2 14.2 14.3 14.6 13.1 -1.5261630019 Wayne E. 7 Mile 14.8 14.1 14.1 14.3 12.9 -1.4261630025 Wayne Livonia 13.9 13.1 13.2 13.4 11.8 -1.6261630033 Wayne Dearborn 18.2 17.2 17.2 17.5 15.8 -1.7261630036 Wayne Wyandotte 15.4 14.3 14.3 14.7 13.1 -1.6
* Average of three 3-year periods centered on 2005
Forecasted Change in PM2.5 Concentrations Between 2005 and 2009due to Regional and National On-the-Books Controls
Source: LADCO Round 5 Modeling

5
Industrial Sources Within 3 Miles of Dearborn Monitor
3-mile radius around Dearborn
Emissions point sources
Figure 3

6
Figure 3: 2002 Annual NOx, PM10, SO2 and VOC, Dearborn Monitor, Wayne County Map, Continued

7
S
E
N
W
Location of Severstal in Relation to Dearborn Monitor
1,000 Yards
Severstal steel facility
Pollution Rose for Iron at Dearborn
2003-2004
Figure 4 Figure 5
Dearborn Monitor
Average is nearly 2 ug/m3 when winds are from the southwest.
AverageMedian

8
Figure 6
Source: LADCO
Analysis of Crustal Concentrations in Southeast MichiganIron vs. Non-Iron

•Emissions for PM2.5 calculated using RTI’s (2006) PM2.5-fil ratio: PM.
•Highlighted numbers indicate past actual emissions that used RTI (2006) emission factors instead of those reported by Severstal North America (from PTI #182-05B).
•For additional details see Appendix G
Source: MDEQ
S o u rce Na m e 2002 p a st a ctu a l 2009 fu tu re p o te n tia l Ne t Ch a n g e (tp y)B B F S toves (B F G ) 19.42 21.95 2.53C B F S toves (B F G ) 34.80 37.84 3.04B B F S toves (NG ) 1.74 1.84 0.09C B F S toves (NG ) 1.65 2.49 0.84B B F Cas thous e (Roof M onitor) 15.53 1.31 -14.22C B F Cas thous e (Roof M onitor) 27.11 3.27 -23.83B B F B leeders 0.12 0.12 0.01C B F B leeders 0.20 0.31 0.10B B F Taphole B urn ing 0.14 0.15 0.01C B F Taphole B urn ing 0.10 0.15 0.05B F B Cas thous e B aghous e S tac k 0.00 5.63 5.63B F C Cas thous e B aghous e S tac k 0.00 11.25 11.25L im e Unloading - B O F Rec eiving 2.63 2.63 0.00Relad ling S outh - S TA CK 3.12 0.00 -3.12Relad ling S outh - F UG ITIV E S 1.08 1.45 0.37Torc h Cut t ing 1.99 0.00 -1.99B O F Natura l G as 1.98 2.66 0.68B O F E S P S tac k 147.72 162.88 15.16B O F S ec ondary E m is s . B aghous e 0.00 6.20 6.20B O F Tapping (Roof M onitor) 125.27 1.95 -123.32B O F S lag Tap (Roof M onitor) 8 .57 0.13 -8.44B O F Charg ing (Roof M onitor) 40.79 2.19 -38.59Des ulfuriz a t ion - S TA CK 3.84 3.84 0.00Des ulfuriz a t ion - F UG ITIV E S 2.96 3.98 1.02#1 LRF S tac k 29.68 29.68 0.00#2 LRF S tac k 16.96 16.96 0.00DD B aghous e - Cok e Trans fer 3 .75 3.75 0.00E E B aghous e - Cok e Unload ing 4.69 4.69 0.00E E B aghous e - Natura l G as 0.02 0.03 0.01Raw M ateria l Handling 4.38 4.38 0.00A nnealing F urnac es 4.42 6.08 1.66Reheat F urnac e #1 11.84 12.97 1.13Reheat F urnac e #2 11.84 12.97 1.13Reheat F urnac e #3 11.84 12.97 1.13Hand S c arfing 13.14 17.66 4.52B B F S lag P it 0 .01 0.01 0.00C B F S lag P it 0 .02 0.04 0.01Des ulfuriz a t ion S lag P it 0 .07 0.10 0.03P arts C lean ing 0.00 0.00 0.00M aintenanc e P ain t B ooth 0.00 0.00 0.00J-9 D ip Tank 0.00 0.00 0.00F ine Coal S ilo B aghous e 0.00 1.16 1.16F ilte r #4 (P ulveriz er B aghous e) 0.00 3.00 3.00Rail Un load ing B aghous e 0.00 1.88 1.88Raw Coal S ilo B aghous e 0.00 0.34 0.34Rail Car B u ild ing Heater 0 .00 0.82 0.82P ulveriz er Hot G as G enerator 0 .00 0.82 0.82P roc es s F ugit ives 0.00 1.28 1.28S e ve rsta l Em issio n s T o ta ls 553.43 405.81 -147.62
Table 2:
Severstal Emissions for PM2.5 in tons per year (2002
Base year versus 2009 Potential)
9

10
Table 3: Emissions reductions near Dearborn and SWHS monitors
Source: MDEQ
Company Equipement Change Date Nox (tpy) SO2 (tpy)Filterable PM (tpy) PM (TPY)
PM10 (tpy)
Filterable PM2.5 (tpy) HC,CO
CO Boiler1 Nov-03 -184.4 -10.11FCCU Controls1 Dec-04 -242 -389 -84.04BT Inter Heater1 Nov-05 -14BT Charge Heater1 Nov-05 -9Crude/Vac Heater1 Nov-05 -145Street sweeping2 -64.1 -12.9Retired offsets2 -71Total -410 -573.4 -94.2 -64.1 -83.9
US Steel Corp Blast furnace B bag house3 Sep-05 -76.5
Blast furnace C4,8 Oct-07 -81.5 702.9 -50.7 -8.5Blast furnace B4,8 Jul-08 -31.0 256.6 -34.7 -5.9BOF4,9 Oct-07 67.9 0.1 -496.8 -148.3Torch cutting4 2007 -2.0 -2.0Reladling4 2007 -12.0 -2.8annealing and reheat furnaces4 2007 60.6 0.3 5.1 5.0Coal pulverization4 2007 21.5 0.1 16.6 9.3other4 2007 0.1 15.7 5.6Total 37.6 960.0 -558.8 -147.6
--28 Switch yard locomotives anti-idling controls5 2007-2008 96 2.8
--4 Swith yard locomotives-engine rebuild6 2007-2008 66 1.8
--School bus (diesel oxidation catalyst and crankcase filter)7
20% reduction/ bus
50% reduction/bus
1 NSR Settlement Agreement w ith Marathon Petroleum Company (reported in MDEQ PTI #388-07)2 MDEQ Permit to Install (PTI) application Heavy Oil Upgrade Project #388-07 for Marathon Petroleum Company3 MDEQ Consent Order 1-2005 and ROP 199600123a for United States Steel4 MDEQ Permit to Install #182-05B for Severstal North America, Inc.5 Supplemental Environmental Project (SEP) for Chrysler 6 Funding f rom the Federal Congestion Mitigation Air Quality (CMAQ) Program7 Funded by Severstal SEP, Clean School Bus federal grants, and possible additional buses f rom Marathon PTI application #388-078 Used 0.15 emissions factors (Severstal uses 0.09) for blast furnace cast house roof monitors prior to control retrof its (RTI, 2006)9 Used 0.23 emissions factor (Severstal uses 0.046) for BOF tapping and 0.15 emissions factor (Severstal uses 0.030) for BOF charging (RTI, 2006)
Marathon Petroleum Co
Severstal North America

Table 1Recent Plant Closings
Dearborn & SWHS Monitoring areas
NOx SO2 PM25 PM10 VOC NOx SO2 PM25 PM10 VOC NOx SO2 PM25 PM10 VOC
Carmeuse/ Detroit Lime 2002 555.98 29.14 5.87 0.00 555.98 29.14 5.87Daimler Chrystler McGraw Glass 2003 8.25 0.05 5.32 8.25 0.05 5.32Frito Lay 2003 4.54 0.02 2.13 1.15 4.54 0.02 2.13 1.15IPMC Acquisition 2003 128.08 0.40 3.71 128.08 0.40 3.71Gutter Supliers, Inc 2004 0.73 0.00 1.56 0.73 0.00 1.56Darling International* 2005 19.48 5.25 16.94 12.48 5.54 0.91 0.23 0.51 9.04 13.95 4.34 -0.23 16.43 3.44Honeywell 2005 39.21 37.60 82.15 0.37 39.21 37.60 81.78Total 750.74 71.56 -0.23 24.43 96.97*Partial plant closing
Difference (tons/year) Facility
Last Year Reported
2002 (tons/year) Current (tons/year)
Source: MDEQ
Table 4
11

10
12
14
16
18
20
22
2000 2001 2002 2003 2004 2005 2006
Dearborn Wyandotte SWHS Oak Park
Allen Park Linw ood Ypsilanti Luna Pier
Linear (Allen Park) Linear (Wyandotte) Linear (Oak Park) Linear (Luna Pier)
Linear (Ypsilanti) Linear (SWHS) Linear (Dearborn) Linear (Linw ood)
Source: LADCO
Figure 7
Trends in Southeast Michigan PM2.5 Monitoring Data Industrial vs. Non-Industrial Sites
Monitors in non-industrial areasMonitors in industrial areas 12

AERMOD Hot Spot Modeling Results - 2008
Source: SEMCOG & MDEQ
Table 5Estimate of Potential Emission Reductions fromDiesel Switch Engine Retrofits in Dearborn Area
Switch Engine Locomotives Being Retrofitted Retrofit of all Switch Locomotives
Estimated Reduction in PM2.5 Concentrations
Number of Engines Type of Retrofit Funding Source
PM2.5 emission
reduction per locomotive
Average PM Reduction (tons/day)2
PM Reduction
(lb/day)
Dearborn µg/m³
SWHS µg/m³
Wyandotte µg/m³
CSX 4
Retrofit of conventional
diesel locomotive with Generator Set (GENSET)
engine technology
80% Federal Congestion
Mitigation Air Quality (CMAQ)
Program, 20% CSX
0.46 tons/year1 0.0055 10.99 0.905 0.017 0.002
Norfolk Southern 12 Teleflex Ecotrans
APU technology Chrysler SEP .07 tons/year2 0.0025 5.01 0.006 0.002 0.001
U.S. Steel (River Rouge and Ecorse)
16
Kim HotStartAPU's along with
the ZTR SmartStart
systems
Chrysler SEP .07 tons/year2 0.0033 6.69 0.005 0.013 0.004
Total 32 0.0113 22.69 0.916 0.032 0.0071CSX CMAQ funding application. Submitted to SEMCOG on September 7, 2007.2EPA, Case Study: Chicago Locomotive Idle Reduction Project, March, 2004. 335 average switch engine service days/year, reduction of 2.4 tons NOx and 0.07 tons of PM per retrofitted engine per year.
Railyard
13

14
1 = Dearborn Site12 = Newberry
2
= SW HS3
Ambassador Bridge
34 = Allen park
4
= Wyandotte= Linwood
Key
+ PM2.5
Norfolk Southern
CSX
76
5
7
6
5 -FIA
US Steel
Rail yard
Location of Rail Yards and PM2.5 Monitors in Dearborn Area
Figure 8

Source: SEMCOG
9
15

16
Table 6SO2 and NOx RACT model run for
Michigan’s seven county non-attainment area.
Source: MDEQ
Monitored2005 Base RRF 2005 RACM Net Reduction
ug/m3 ug/m3 ug/m3Dearborn 18.55 0.945 17.54 1.01West Fort 17.21 0.945 16.27 0.94Wyandotte 16.41 0.945 15.51 0.90Linwood 16.01 0.945 15.14 0.87Port Huron 15.09 0.942 14.22 0.87Allen Park 15.94 0.945 15.07 0.87New Haven 14.37 0.942 13.54 0.83Ypsilanti 15.61 0.950 14.82 0.79Livonia 14.94 0.950 14.19 0.75Ann Arbor 13.20 0.950 12.54 0.66East 7 Mile 16.48 0.960 15.82 0.66Luna Pier 15.70 0.958 15.05 0.65Oak Park 15.46 0.960 14.84 0.62Lansing 13.54 0.959 12.98 0.56Flint 12.89 0.973 12.54 0.35Bay City 12.44 0.972 12.09 0.35Kalamazoo 13.83 0.976 13.50 0.33Saginaw 11.72 0.972 11.39 0.33Jenison 13.99 0.978 13.68 0.31Grand Rapids 13.72 0.978 13.42 0.30Holland 12.39 0.979 12.13 0.26Coloma 13.05 0.982 12.81 0.24Muskegon 13.07 0.982 12.84 0.23Sault Ste Marie 8.16 0.982 8.01 0.15
STATEWIDE AVERAGE 0.58
MICHIGAN RACT-RACM ANALYSIS(ASSUMES 100% NOx/SO2 CUTS IN 7-COUNTY SE MICHIGAN - ALL SOURCES)

Table 7Change in Southeast Michigan PM2.5 Concentrations
3 Yr. Average2001-2003 2005-2007
Dearborn 19.5 17.2 2.3 -12%SW HS 17.5 15.5 2.0 -11%Wyandotte 16.9 14.3 2.6 -15%Allen Park 16.1 14.0 2.1 -13%Linwood 15.7 14.3 1.4 -9%Luna Pier 15.1 13.8 1.3 -9%Oak Park 14.8 13.6 1.2 -8%Ypsilanti 14.7 13.7 1.0 -7%Livonia 14.4 13.2 1.2 -8%E 7 Mile 15.0 14.1 0.9 -6%Port Huron 14.0 13.2 0.8 -6%New Haven 13.3 12.5 0.8 -6%Regional Average 15.6 14.1 1.5 -9%
Monitoring Site Change Percent Change
Source: Compiled by SEMCOG using MDEQ monitoring data 17

18
Table 8 PM2.5 Monitoring Data Summary: Annual PM2.5
Lowest concentration at this site
Source: MDEQ
Tim
e Pe
riod
Year
Dea
rbor
n
SW H
S
Wya
ndot
te
Alle
n Pa
rk
Linw
ood
Luna
Pie
r
Oak
Par
k
Ypsi
lant
i
Livo
nia
E 7
Mile
Port
Hur
on
New
Hav
en
New
berr
y
FIA
2000 22.76 20.34 19.30 16.99 17.67 16.92 18.57 16.82 16.53 17.04 16.262001 20.95 19.33 21.49 20.05 17.19 16.24 15.58 15.92 15.39 14.58 13.65 14.752002 20.99 16.80 15.40 15.32 15.04 14.99 12.73 14.71 13.33 14.39 12.13 11.862003 22.59 17.41 15.07 17.37 18.36 15.93 18.39 16.70 15.96 17.05 18.73 14.472004 17.71 14.95 14.48 15.41 14.87 13.02 13.73 13.74 12.72 13.23 11.44 11.822005 21.50 20.20 16.96 18.45 18.92 16.50 17.49 17.49 17.86 19.82 16.76 15.21 16.382006 18.79 16.98 15.10 13.70 13.04 14.55 13.51 14.80 13.34 15.20 15.52 13.68 14.782007 18.84 15.15 13.75 12.92 13.98 12.26 12.48 12.95 12.23 13.20 12.64 12.37 13.63 13.832008* 16.59 16.07 12.55 13.86 14.59 13.25 13.59 13.23 13.56 13.60 13.66 13.27 14.00 14.262000 20.13 17.04 16.52 13.69 13.82 14.54 14.79 12.85 14.08 13.93 14.65 12.762001 18.58 20.05 17.53 16.68 15.66 16.58 17.30 15.46 15.67 14.88 16.26 14.682002 18.15 17.42 15.98 16.15 15.61 17.77 17.29 14.57 14.26 15.83 14.03 13.372003 19.03 15.39 20.37 15.25 15.33 12.84 13.79 15.05 15.36 14.80 13.11 12.922004 16.10 15.01 12.74 12.22 12.10 12.61 11.26 11.76 11.98 12.47 12.81 11.492005 16.57 14.73 14.93 13.77 14.78 13.40 13.77 14.27 11.74 14.48 14.73 14.21 14.602006 12.85 12.26 10.95 11.59 11.58 10.91 10.40 10.67 11.23 10.39 10.71 9.65 10.10 11.712007 15.20 13.05 12.41 10.28 12.12 11.41 12.27 11.68 10.59 11.16 9.97 9.58 12.85 12.9820082000 17.56 16.29 15.64 14.46 13.52 14.33 11.88 13.21 13.28 13.74 12.83 12.432001 18.27 17.67 18.53 17.46 16.57 15.68 14.81 14.15 15.14 14.76 14.12 13.182002 20.22 18.27 16.51 17.33 16.78 15.96 16.07 16.43 16.47 17.86 16.28 15.192003 17.83 16.68 16.37 15.11 14.94 14.36 13.66 14.39 13.89 13.98 13.05 13.082004 17.46 17.69 15.91 16.18 14.78 14.83 14.78 14.17 14.13 15.44 13.18 14.232005 18.22 18.73 18.58 17.15 16.62 19.78 17.61 17.69 17.45 17.43 16.47 16.14 17.66 18.202006 15.56 14.93 13.69 13.76 12.58 12.98 10.76 13.12 10.01 11.78 9.09 9.50 14.34 14.202007 16.02 15.12 14.60 13.76 14.74 14.87 14.68 13.78 13.76 14.36 14.49 13.33 15.35 14.652008
1st Q
uart
er
Aver
age
2nd
Qua
rter
Aver
age
3rd
Qua
rter
Aver
age
*Note: The first quarter of 2008 for Dearborn, normally the highest quarter of the year, is 2.25 ug/m3 lower than 2007 first quarter data. All the other monitors except Dearborn and Wyandotte increased from 2007 first quarter data.

19
Table 8: ContinuedLowest concentration at this site
Source: MDEQ
Tim
e Pe
riod
Year
Dea
rbor
n
SW H
S
Wya
ndot
te
Alle
n Pa
rk
Linw
ood
Luna
Pie
r
Oak
Par
k
Ypsi
lant
i
Livo
nia
E 7
Mile
Port
Hur
on
New
Hav
en
New
berr
y
FIA
2000 20.06 18.71 19.07 17.08 16.94 14.96 16.31 14.16 14.46 12.87 12.22 --- ---2001 20.63 16.07 15.26 14.79 13.47 12.69 12.23 12.44 12.18 13.79 11.81 11.78 --- ---2002 20.00 17.20 17.24 15.02 14.95 16.30 13.90 13.72 13.43 14.48 12.91 12.98 --- ---2003 17.34 17.26 13.45 13.17 14.78 12.01 12.48 12.78 11.59 13.01 12.11 10.92 --- ---2004 16.06 13.90 11.52 13.14 13.00 11.47 11.26 11.79 11.45 11.76 10.99 10.29 --- ---2005 17.90 15.18 15.19 14.38 13.70 13.10 12.99 13.00 12.68 14.20 12.41 11.94 --- 14.252006 17.30 14.56 11.94 13.70 14.97 12.45 13.78 11.61 12.46 13.46 12.86 12.27 11.98 11.842007 17.49 14.82 13.47 14.08 14.61 13.78 13.89 13.51 14.42 13.31 12.64 12.46 14.23 13.8620081999 16.82 17.57 16.28 16.66 17.08 14.16 14.19 13.07 13.16 12.66 --- ---2000 20.13 18.10 17.63 15.56 15.49 15.19 15.39 14.26 14.59 14.51 14.35 13.42 --- ---2001 19.61 18.28 18.20 17.25 15.72 15.30 14.70 14.49 14.60 14.50 13.96 13.60 --- ---2002 19.84 17.42 16.28 15.96 15.60 16.26 15.00 14.86 14.37 15.64 13.84 13.35 --- ---2003 19.20 16.69 16.32 15.23 15.85 13.79 14.58 14.73 14.20 14.71 14.25 12.85 --- ---2004 16.83 15.39 13.66 14.24 13.69 12.98 12.76 12.87 12.57 13.23 12.11 11.96 --- ---2005 18.55 17.21 16.42 15.94 16.01 15.70 15.47 15.61 14.93 16.48 15.09 14.38 --- ---2006 16.13 14.68 12.92 13.19 13.04 12.72 12.11 12.55 11.80 12.71 12.04 11.28 --- 13.132007 16.89 14.54 13.59 12.76 13.86 13.08 13.33 12.98 12.75 13.01 12.44 11.94 14.02 13.83200899-01 18.9 18.0 17.4 16.5 16.1 15.2 14.7 14.3 14.1 13.8 13.2 --- ---00-02 19.9 17.9 17.4 16.3 15.6 15.8 15.0 14.5 14.5 14.9 14.0 13.5 --- ---01-03 19.5 17.5 16.9 16.1 15.7 15.1 14.8 14.7 14.4 15.0 14.0 13.3 --- ---02-04 18.6 16.5 15.4 15.1 15.0 14.3 14.1 14.2 13.7 14.5 13.4 12.7 --- ---03-05 18.2 16.4 15.5 15.1 15.2 14.2 14.3 14.4 13.9 14.8 13.8 13.1 --- ---04-06 17.2 15.8 14.3 14.5 14.2 13.8 13.4 13.7 13.1 14.1 13.1 12.5 --- ---05-07 17.2 15.5 14.3 14.0 14.3 13.8 13.6 13.7 13.2 14.1 13.2 12.5 13.2 ---
Ann
ual A
vera
ge3-
Year
Ave
rage
4th
Qua
rter
Ave
rage

PM2.5 Speciation Trends ug/m3/year
SpeciesAllen Park
Jan ’01-Dec ‘06
Dearborn
May ‘02 –Dec ‘06
Luna Pier
May ‘02 - Dec ‘06
Ypsilanti
June ‘03 –June ‘05
Nitrate -0.16 -0.11 -0.19
-0.22
0.007
-0.22
Soil -0.019 -0.08 0.008 -0.00
-0.32
0.34
Sulfate -0.17 -0.19 -0.09
EC 0.01 -0.04 -0.01
OC -0.17 -0.54 -0.43
FRM PM2.5 (1999-2005)
-0.32 -0.56 -0.12
Significant trends in bold.
Table 9
Source: LADCO 20

21
Figure 10
Source: LADCO

22
Figure 11
Source: LADCO

Figure 12
Source: SEMOS
9.2 8.710.3 11.3 11.9 12.0 12.4
0
2
4
6
8
10
12
14
Port Huron New Haven E. SevenMile
Linwood SW HighSchool
Dearborn Allen Park
Monitoring Site
PM
2.5
Con
c. (u
g/m
3)When Winds Are From Northeast (0-60o)
2001 - 2006
Average PM2.5 Concentrations
23

Figure 13
Source: SEMOS
When Winds Are From Northwest (300-360o)2001 - 2006
Average PM2.5 Concentrations
5.77.0 7.2 7.8
9.9 9.99.0
0
2
4
6
8
10
12
Saginaw Flint Oak Park Linwood SW HighSchool
Dearborn Allen Park
Monitoring Site
PM2.
5 C
onc.
(ug/
m3)
24

25
Figure 14
Source: LADCO

26
Figure 15
Source: LADCO

Pollution Roses2003-2004
Organic Carbon - Dearborn
Iron – Allen Park
Average
Median
N
S
W E
N
N
S
W
S1
N
S
E
Figure 16
Source: MDEQ
E
Iron – Dearborn
Organic Carbon – Allen Park
E
WW
27

Source: LADCO 28
Figure 17

Average Difference in ConcentrationsBetween Dearborn and Selected “Background” Monitors
Figure 18
0
1
2
3
4
5
6
7
8
9
Oak Park Linwood E7 Mile SWHS Wyandotte Allen Park Luna Pier Ypsilanti Livonia
N NE E SE S SW W NW
Diff
eren
ce (u
g/m
3)
Background Monitor
Wind Direction
Source: MDEQ 29

Proximity of Severstal to Air Monitors
Severstal
Dearborn Monitor
Allen ParkMonitor
Figure 19
30

Table 10Organic Carbon Analysis by Wind Direction
Dearborn vs. Allen Park2003-2006
Source: SEMOS
Northeast Winds East Winds Southeast WindsDearborn Allen Park Difference Dearborn Allen Park Difference Dearborn Allen Park Difference
2003 Average 3.91 3.47 0.44 4.88 5.00 -0.12 6.69 4.91 1.792004 Average 2.96 2.75 0.21 4.05 3.10 0.96 5.56 4.52 1.042005 Average 3.14 2.69 0.45 4.60 3.96 0.64 5.58 5.11 0.472006 Average 3.70 3.67 0.03 3.33 2.66 0.67 5.41 4.75 0.66
4-yr Average 3.42 3.12 0.30 4.45 3.95 0.50 5.84 4.87 0.97Median 3.39 2.86 4.38 3.56 5.75 4.33Std. Deviation 0.87 1.04 0.59 1.78 1.80 1.54 2.13 2.19 1.52
Northwest Winds West Winds Southwest WindsDearborn Allen Park Difference Dearborn Allen Park Difference Dearborn Allen Park Difference
2003 Average 5.55 4.57 0.98 6.47 3.58 2.89 5.99 4.84 1.152004 Average 4.10 3.34 0.76 5.21 3.29 1.92 5.59 4.15 1.442005 Average 2.45 2.41 0.04 4.89 3.46 1.43 5.67 4.41 1.262006 Average 3.27 2.90 0.36 4.49 3.56 0.92 5.34 5.07 0.27
4-Yr Average 3.62 3.15 0.47 5.18 3.47 1.71 5.70 4.58 1.12Median 3.65 3.03 4.82 3.21 5.68 4.49Std. Deviation 1.30 1.14 0.79 1.42 1.35 1.43 1.61 1.73 1.50
Measurement
Measurement
31

Figure 20
Source: LADCO 32

33
Detroit PMF Results: Organic Mass (OM)
Nitrate12%
Soil9%
Mobile/Urban53%
Burning1%
Copper15%
Diesel2%
Sulfate8%
Allen Park
Dearborn
• Mobile/urban factor is ~ 50% of OM at both sites
• Diesel at Allen Park is a large amount of OM
• OM associated with sulfate and nitrate is 13%-20%
• Industrial profiles account for 8%-15% of OM, higher at Dearborn
Mobile/Urban54%
Metal Plating5%
Burning2%
Diesel19%
Secondary Sulfate9%
Soil4%
Secondary Nitrate4% Metal Processing
3%
33
Figure 21
SOURCE: Sonoma Technologies Inc., 2006

34
0 2 4 6 8 10 12Source contribution, ug/m3
Mobile
Gasoline Veh.
Diesel Veh.
Sec. Sulfate/Coal
Sec. Nitrate
Iron/Steel Mfg.
Refinery/Oil
Municipal Incin.
Sludge Incin.
Mixed Industrial
Industrial/Zinc
Sea Salt/Road Salt
Crustal
Biomass Burning
BrownOC-Allen ParkBrownOC-DearbornBrownPM-Allen ParkBrownPM-DearbornGildemeister-Allen ParkGildemeister-DearbornHammond-KeithHammond-MayburyMorishita-MayburyWade-Allen ParkWade-Dearborn
Summary of Source Apportionment Results at Detroit SitesFigure 22
Source: LADCO

Dearborn CMBw/ point source profile
Jan
2004
Feb
2004
Mar
200
4
Apr
200
4
May
200
4
Jun
2004
Jul 2
004
Aug
200
4
Sep
200
4
Oct
200
4
Nov
200
4
Dec
200
4
Jan
2005
Feb
2005
Mar
200
5
1/28
/200
4
9/24
/200
4
11/5
/200
4
Sou
rce
cont
ribut
ion μ g
m-3
0
2
4
6
8
10
12
14
Est
imat
ed c
once
ntra
tion
of u
nkno
wns
ng
m-3
0
1000
2000
3000
4000dirt biomass natural gas diesel gasoline smoker point source other Measured OC sum unknowns
Figure 23Dearborn CMB Analysis
Source Profile Comparison – Average vs. High PM2.5 Days
Source: LADCO
Monthly Averages
DaysHigh
35

Figure 24
Source: “Preliminary Results from the Deployment of an Advanced Mobile Laboratory in Detroit”, Jeff Brook, Environment Canada, May 7, 2007.
Continuous Monitoring of CRUISER is Detroit Area
36

37
Route of CRUISER in Detroit AreaFigure 25
Monitor location
Point of interest
Dearborn
Sausage Factory
Train
Dix RoadAllen
Park
Source:

Observed Increase in Pollutant ConcentrationsBetween Locations Immediately Upwind & Downwind
of Zug Island
Fall 2006
Source: “Preliminary Results from the Deployment of an Advanced Mobile Laboratory in Detroit”, Jeff Brook, Environment Canada, May 7, 2007.
Table 11
38

39
Figure 26: Black carbon (aethalometer) data for FIA (LF) and combined monitors of Dearborn (D), Newberry (NB), FIA and Allen Park (not shown) (red indicates higher concentrations and green indicates lower concentrations).
Source: LADCO
Joint surface from aethalometer data at all 4 sites – area of greatest COMBINED influence on all sites. Highly industrialized area
FIA aethalometer data points very specifically to Ambassador Bridge (1-hr data, 2006 annual)
Zug Island

40
Newberry aethalometer data – points very specifically to intermodal freight terminal (1 hr data, 2006)
Figure 27: Black carbon (aethalometer) and OC data for Newberry monitor (red indicates higher concentrations and green indicates lower concentrations).
Source: LADCO
Newberry continuous OC data – also identifies freight terminal as source of OC

41
Figure 28Dearborn Monitor Relative to Severstal Operations
Source: MDEQ

42
Figure 29Detroit Metro Airport 2002 Windrose
Source: MDEQ

43
Dearborn MonitorS.W.H.S. Monitor
Allen Park Monitor
SEVERSTAL
U.S. STEEL
MARATHON
FORD MOTORSROUGE COMPLEX
Figure 30Monitors of Concern Relative to Primary Facilities
Source: MDEQ

44
Figure 31
Source: “Data Analysis to Support Local Area Modeling” (Kenski, 2007)

45
Dearborn -Dearborn Allen Park Allen Park ³
Monitored Values (ug/m3) (ug/m3) (ug/m3)2000-2004 Weighted Total Average ¹ 19.3 17.3 2.00
Monitored Local Primary Values ²Clarkson Report 4.55 2.23 2.32Sonoma Report 4.36 1.98 2.38LADCO Analysis 4 3.25 0.95 2.30
AERMOD Modeled Value (Dearborn only) ² 4.66
¹ Total PM-2.5² Local Industrial Primary PM-2.5 only³ Assumed to be the neighbor scale contribution to Dearborn4 LADCO report assumes Soil-Fe contribution only
MONITORED VERSUS MODELED LOCAL IMPACTSTABLE 312
Source: MDEQ

46
Table 13Estimated Contribution to PM2.5 Concentrations
from Local Sources Hotspot Modeling Results
MAERSEMISSIONS 4.66 µg/m³ 2.35 µg/m³ 0.50 µg/m³
(tpy)A8640 479.3 PM-2.5 SEVERSTAL NORTH AMERICA, INC. 3.44 µg/m³ 0.46 µg/m³ 0.24 µg/m³
A7809 666.3 PM-10 U S STEEL GREAT LAKES WORKS 0.15 µg/m³ 0.97 µg/m³ 0.08 µg/m³
A8648 17.0 PM-10 FORD MOTOR CO ROUGE COMPLEX 0.39 µg/m³ 0.06 µg/m³ 0.03 µg/m³
A9831 198.3 PM-10 MARATHON ASHLAND PETROLEUM 0.11 µg/m³ 0.09 µg/m³ 0.05 µg/m³
B2132 12.6 PM-10 WYANDOTTE DEPT MUNI POWER 0.00 µg/m³ 0.00 µg/m³ 0.00 µg/m³
B2169 71.2 PM-10 CARMEUSE LIME/ RIVER ROUGE 0.28 µg/m³ 0.60 µg/m³ 0.06 µg/m³
B2810 42.6 PM-10 DETROIT EDISON RIVER ROUGE 0.00 µg/m³ 0.00 µg/m³ 0.00 µg/m³
B2811 186.8 PM-10 DETROIT EDISON TRENTON CHANNEL 0.00 µg/m³ 0.00 µg/m³ 0.01 µg/m³
B3518 5.5 PM-10 UNITED STATES GYPSUM CO 0.01 µg/m³ 0.02 µg/m³ 0.00 µg/m³
B3533 15.0 PM-10 EDW C LEVY CO PLANT 1 0.15 µg/m³ 0.08 µg/m³ 0.02 µg/m³
B3567 7.3 PM-10 ST MARY'S CEMENT 0.06 µg/m³ 0.04 µg/m³ 0.01 µg/m³
N6631 84.4 PM-10 DEARBORN INDUSTRIAL GENERATION 0.05 µg/m³ 0.01 µg/m³ 0.01 µg/m³
DEARBORN TOTAL SWHS TOTAL ALLEN PARK TOTAL
Source: MDEQ

Public Comment Period Record
STATE OF MICHIGAN
DEPARTMENT OF ENVIRONMENTAL QUALITY
AIR QUALITY DIVISION
PROPOSED PM2.5
STATE IMPLEMENTATION PLAN
February 4 to March 5, 2008

PM 2.5 PUBLIC COMMENT PERIOD RECORD
TABLE OF CONTENTS Notice published on the DEQ Internet ........................................................................1 Notice of Public Comment Period published in the DEQ Calendar on February 4,
February 18, and March 3, 2008 .....................................................................2 Written Comments Submitted by:
Michael Johnston, Michigan Manufacturers Association .................................5 Kurt A. Kissling, Pepper Hamilton LLP ............................................................7 Michael Lebeis, DTE Energy ...........................................................................9 Louis P. Pocalujka, Consumers Energy ........................................................11 Paul Tait, Southeast Michigan Council of Governments................................13 Steve Rosenthal, U.S. Environmental Protection Agency .............................14
APPENDIX A: Proposed PM 2.5 State Implementation Plan, February 4, 2008

MICHIGAN DEPARTMENT OF ENVIRONMENTAL QUALITY MICHIGAN’S FINE PARTICULATE MATTER (PM 2.5) STATE IMPLEMENTATION PLAN (SIP): The Air Quality Division is holding a public comment period through March 5, 2008, on a proposed SIP for Southeast Michigan’s PM 2.5 nonattainment area, including Livingston, Macomb, Monroe, Oakland, St. Clair, Washtenaw, and Wayne counties. The public comment period meets the public participation requirements for a SIP submittal. Written comments should be sent to:
Attention: Mary Ann Halbeisen Michigan Department of Environmental Quality Air Quality Division P.O. Box 30260 Lansing, Michigan 48909
TENTATIVE PUBLIC HEARING SCHEDULED: If requested by March 5, 2008, a public hearing will be held on March 11, 2008, at 1:30 p.m., in the Constitution Hall, Lillian Hatcher Conference Room, 3rd Floor North, 525 West Allegan Street, Lansing, Michigan. Those interested may contact the Air Quality Division at 517-335-1059 after March 5, 2008, to determine if a hearing was requested and will be held. The PM 2.5 SIP can be viewed by clicking on the following links:
• Michigan State Implementation Plan for PM 2.5 • Appendix A • Appendix C • Appendix D • Appendix E • Appendix F
For further information, contact Cynthia Hodges at 517-335-1059 or Email at [email protected]. Decision-maker: DEQ Director.
PM 2.5 PUBLIC COMMENT PERIOD RECORD
1

MICHIGAN DEPARTMENT OF ENVIRONMENTAL QUALITY
PO BOX 30473 LANSING MI 48909-7973
CALENDAR February 4, 2008
♦ ENVIRONMENTAL ASSISTANCE CENTER 800-662-9278 E-mail: deq-ead-env- [email protected]
The DEQ Environmental Assistance Center (EAC) is available to provide direct access to DEQ environmental programs, answers to environmental questions, referrals to DEQ technical staff, and quick response. Questions on any items listed in the DEQ Calendar can be referred to the EAC.
♦ PUBLICATION
SCHEDULE
The DEQ Calendar is published every two weeks, on alternate Mondays, by the Michigan Department of Environmental Quality. We welcome your comments.
♦ CALENDAR LISTSERV
You may subscribe to receive the DEQ Calendar electronically by sending an Email to the listserv at [email protected] and in the body of the message type Subscribe, DEQ-CALENDAR, and your name.
♦ INTERNET ACCESS www.michigan.gov/ deqcalendar
The DEQ Calendar is available on the DEQ World Wide Web site in pdf and html format. Access the calendar at www.michigan.gov/deqcalendar.
♦ TIMETABLE FOR
DECISIONS
No decision listed in the DEQ Calendar will be made prior to seven days after the initial Calendar publication date.
♦ TIPS FOR CITIZEN INPUT
Refer to the “Public Involvement Handbook, A Citizens Guide” to increase the effectiveness of your input into DEQ programs. Access the handbook at www.michigan.gov/deq and click on "Get Involved, Programs for Citizens."
♦ CONTENTS PART I: ENVIRONMENTAL ISSUES, PERMITTING, AND RELATED REGULATIONS *Permit Decisions Before the Office of the Director 3 *Other Decisions Before the Office of the Director 3 *Proposed Settlements of Contested Cases 5 *Administrative Rules Promulgation 5 *Announcements 5 *Public Hearings and Meetings 6 *Division Permit Contacts 9 PART II: ENVIRONMENTAL CONFERENCES, WORKSHOPS, AND TRAINING PROGRAMS 10
Recycled
Paper
Governor Jennifer M. Granholm Director Steven E. Chester
PM 2.5 PUBLIC COMMENT PERIOD RECORD
2

CALENDAR February 4, 2008
PART I: ENVIRONMENTAL ISSUES, PERMITTING AND RELATED REGULATIONS
Permit Decisions Before the Office of the Director AIR QUALITY DIVISION See Map -
DOW CHEMICAL COMPANY – 32 INCINERATOR, MIDLAND, MIDLAND COUNTY, proposed Permit to Install application for changes to permit conditions for the existing hazardous waste incinerator and operation of 32-Incinerator. The facility is located at Midland Operations, Main Street, Midland. Additionally, the new 32-Incinerator will require revisions to Renewable Operating Permit (ROP) No. MI-ROP-A4033-2004a. This public comment period meets the public participation requirements for a future administrative amendment to the ROP. The responsible official for the source is Brad Fedorchak, Michigan Operations, 1261 Building, D-Street, Midland, Michigan. New Source Review and ROP public notice documents can be viewed on the Internet at www.michigan.gov/deqair. Public comment will be taken through February 19, 2008. If a public hearing is requested in writing by February 19, 2008, an informational session and public hearing will be held February 21, 2008, (see February 21 listing in this calendar). Written comments should be sent to the Michigan Department of Environmental Quality, Air Quality Division, P.O. Box 30260, Lansing, Michigan 48909, to the attention of William A. Presson, Acting Permit Section Supervisor. Information Contact: Paul Schleusener, Air Quality Division, 517-335-6828. Decision-maker: G. Vinson Hellwig, Air Quality Division Chief.
WASTE AND HAZARDOUS MATERIALS DIVISION See Map -
SAUK TRAIL DEVELOPMENT, INC., WAYNE COUNTY. Consideration of a Part 115 Solid Waste Management construction permit application for a type II solid waste landfill modification of an existing permit. A decision is expected by May 8, 2008. Information Contact: Larry AuBuchon at 586-753-3840 or, Email at [email protected] Decision-maker: DEQ Director.
Other Decisions Before the Office of the Director ENVIRONMENTAL SCIENCE AND SERVICES DIVISION See Map -
CLEAN CORPORATE CITIZEN DESIGNATION, PILGRIM MANOR RETIREMENT COMMUNITY, 2025 LEONARD STREET NE, GRAND RAPIDS, MICHIGAN, KENT COUNTY. The Michigan Department of Environmental Quality has received an application for Clean Corporate Citizen (C3) designation from Pilgrim Manor Retirement Community as provided for under Administrative Rules R324.1508: Clean Corporate Citizen Program. A decision on the C3 designation approval or disapproval will be made on or before March 18, 2008. The C3 program provides incentives for improved environmental protection. Regulated establishments that have demonstrated environmental stewardship can receive C3 designation and public recognition for their efforts and are entitled to certain regulatory benefits. Information Contact: Kelie Bond, Environmental Science and Services Division, 517-241-7969. Decision-maker: DEQ Director.
AIR QUALITY DIVISION See Map -
H INDUSTRIES, DETROIT, WAYNE COUNTY. Written comments are being accepted on a proposed Consent Order to administratively resolve alleged air pollution violations. You may obtain copies of the proposed Consent Order and Staff Activity Report on the Web at www.michigan.gov/deqair. Submit written comments to Ronald Pollom, Michigan Department of Environmental Quality, Air Quality Division, P.O. Box 30260, Lansing, Michigan 48909. Written comments must be received by February 20, 2008. If a request is received in writing by February 20, 2008, a public hearing will be scheduled. Information Contact: Ronald Pollom, Air Quality Division, 517-335-4624. Decision-maker: G. Vinson Hellwig, Air Quality Division Chief.
AIR QUALITY DIVISION See Map -
MICHIGAN’S FINE PARTICULATE MATTER (PM 2.5) STATE IMPLEMENTATION PLAN (SIP) proposed for Southeast Michigan’s PM 2.5 nonattainment area, including Livingston, Macomb, Monroe, Oakland, St. Clair, Washtenaw, and Wayne counties. The Air Quality Division will hold a public comment period through March 5, 2008, that meets the public participation requirements for a SIP submittal. The PM 2.5 SIP can be viewed on the Web at www.michigan.gov/deqair. If requested by March 5, 2008, a hearing will be held March 11, 2008 (see March 11 listing in this calendar). Written comments should be sent to the Michigan Department of Environmental Quality, Air Quality Division, P.O. Box 30260, Lansing, Michigan 48909, to the attention of Mary Ann Halbeisen. Information Contact: Cynthia Hodges, Air Quality Division, 517-335-1059. Decision-maker: DEQ Director.
3
PM 2.5 PUBLIC COMMENT PERIOD RECORD
3

CALENDAR February 4, 2008
any air emission changes at the stationary source. The ROP public notice documents can be viewed on the Web at www.michigan.gov/deqair. The responsible official of the stationary source is Tim Schimke, 1525 Miltner Street, Cadillac, Michigan 49601. Comments on the draft permit are to be submitted to Kurt Childs, Michigan Department of Environmental Quality, Air Quality Division, Cadillac District Office, 120 West Chapin Street, Cadillac, Michigan 49601. The decision-maker for the permit is Janis Denman, District Supervisor. If requested in writing by March 5, 2008, a public hearing may be scheduled. Information Contact: Kurt Childs, Air Quality Division, 231-775-3960, extension 6253.
MARCH 5, 2008 DEADLINE FOR PUBLIC COMMENT REGARDING MICHIGAN’S FINE PARTICULATE MATTER (PM 2.5) STATE IMPLEMENTATION PLAN (SIP) proposed for Southeast Michigan’s PM 2.5 nonattainment area, including Livingston, Macomb, Monroe, Oakland, St. Clair, Washtenaw, and Wayne counties. This public comment period meets the public participation requirements for a SIP submittal. The PM 2.5 SIP can be viewed on the Web at www.michigan.gov/deqair. If requested by March 5, 2008, a hearing will be held March 11, 2008 (see March 11 listing in this calendar). Written comments should be sent to the Michigan Department of Environmental Quality, Air Quality Division, P.O. Box 30260, Lansing, Michigan 48909, to the attention of Mary Ann Halbeisen. Information Contact: Cynthia Hodges, Air Quality Division, 517-335-1059.
MARCH 11, 2008 TENTATIVELY SCHEDULED PUBLIC HEARING REGARDING MICHIGAN’S FINE PARTICULATE MATTER (PM 2.5) STATE IMPLEMENTATION PLAN (SIP) proposed for Southeast Michigan’s PM 2.5 nonattainment area, including Livingston, Macomb, Monroe, Oakland, St. Clair, Washtenaw, and Wayne counties. This public comment period meets the public participation requirements for a SIP submittal. The PM 2.5 SIP can be viewed on the Web at
1:30 p.m.
www.michigan.gov/deqair. If requested by March 5, 2008, a public hearing will be held in the Constitution Hall, Lillian Hatcher Conference Room, 3rd Floor North, 525 West Allegan Street, Lansing, Michigan. Those interested may contact the Air Quality Division at 517-335-1059 after March 5, 2008, to determine if a hearing was requested and will be held. Information Contact: Cynthia Hodges, Air Quality Division, 517-335-1059.
Division Permit Contacts For additional information on permits, contact:
517-373-7074 Pam Blue Air Quality Division 517-335-4607 Cari DeBruler
517-373-8798 Land and Water Management Division Wendy Fitzner
(land/water interface permits)
517-241-1545 Office of Geological Survey Thomas Godbold (oil, gas, mineral well, and sand dune mining permits)
517-335-4034 Waste & Hazardous Materials Division Wanda Williams
517-241-1346 Water Bureau Susan Ashcraft • Groundwater Permits on Public Notice
NPDES Permits on Public Notice• Certificates of Coverage on Public Notice•
9
PM 2.5 PUBLIC COMMENT PERIOD RECORD
4

620 S. Capitol Avenue • Lansing, MI 48933-4247 • Phone: 517-372-5900 • Fax: 517-372-3322 • http://www.mma-net.org
“Manufacturing Makes Michigan Work”
Attention: Mary Ann Halbeisen Michigan Department of Environmental Quality Air Quality Division P.O. Box 30260 Lansing, Michigan 48909 Sent via Email: [email protected] March 5, 2008 Michigan’s Fine Particulate Matter (Pm 2.5) State Implementation Plan The Michigan Manufactures Association appreciates the opportunity to submit comments on the notice for the proposed State Implementation Plan for Fine Particulate Matter (PM 2.5), which requires response by March 5, 2008. The history on setting the federal standard dates back to 1997, when the EPA issued its PM 2.5 standard. MMA has been concerned about the economic impact of additional federal regulation on Michigan. MMA filed comments with the EPA outlining our concerns as recently as January 30, 2006. The history on setting the federal standard dates back to 1997, when the EPA issued its PM 2.5 standard. The federal courts have deliberated on these issues for years until the DC Circuit Court in 2002, rejected the claim that the agency acted in an arbitrary and capricious manner in setting the standard. Despite our objections, and those of many business organizations across the country, including the National Association of Manufacturers, the EPA has moved forward with changes in the standard, which result in seven counties in southeast Michigan being designated as not meeting the National Ambient Air Quality Standards for Particulate Matter (PM 2.5), including Wayne, Oakland, Macomb, Washtenaw, St. Clair, Monroe, and Livingston. Given the constraints of the federal regulatory mandate, the state is forced to respond with a state implementation plan or face federal sanctions that include withholding federal transportation dollars. The proposed SIP forwarded by the DEQ is the product of years of close consultation with Southeast Michigan Council of Governments (SEMCOG), which is the Metropolitan Planning Organization for Southeast Michigan. SEMCOG’s Air Quality Task Force has held several meetings over the past several years that have included opportunities for public involvement and comment from interested stakeholders. With our state economy having a manufacturing concentration seven times greater than the national average, any increase in regulation in Michigan tends to have more impact here than in other states. We believe the SIP addresses the requirements scientifically, and to the extent possible, recognizes the cost implications for Michigan. We appreciate the work of both the DEQ and SEMCOG in developing this science based approach. Many stakeholders have taken advantage of the opportunities provided in the process
PM 2.5 PUBLIC COMMENT PERIOD RECORD
5

620 S. Capitol Avenue • Lansing, MI 48933-4247 • Phone: 517-372-5900 • Fax: 517-372-3322 • http://www.mma-net.org
“Manufacturing Makes Michigan Work”
to make contributions to the understanding of PM 2.5. We believe that with the increased monitoring we have learned a great deal about the speciation of the components of PM 2.5. As we learn more, we begin to understand how much more there is to learn in the future. We hope that increased knowledge will help us refine our regulatory approaches to ensure regulatory resources are targeted where they have the most benefit, while not spending economic resources where they do not generate environmental benefit. We are confident we will continue to make significant scientific progress for the benefit Michigan’s air quality and our economy. We believe that Michigan is very close to meeting attainment under the new federal standards, and we look forward to achieving the goal of meeting attainment again. Michigan manufacturers are already spending billions of dollars implementing multiple control strategies that will continue to yield significant co-benefits for air quality in Michigan. The process used to develop the DEQ’s proposed SIP for PM 2.5 has been open and deliberative. Michigan is poised to continue to make significant progress in air quality improvement. MMA supports the proposed SIP for PM 2.5. Thank you for the opportunity to participate in your processes and comment on the proposed SIP for PM 2.5. Sincerely,
Michael Johnston Director of Regulatory Affairs
PM 2.5 PUBLIC COMMENT PERIOD RECORD
6

PM 2.5 PUBLIC COMMENT PERIOD RECORD
7

PM 2.5 PUBLIC COMMENT PERIOD RECORD
8

PM 2.5 PUBLIC COMMENT PERIOD RECORD
9

PM 2.5 PUBLIC COMMENT PERIOD RECORD
10

COMMENTS OF CONSUMERS ENERGY March 5, 2008 Submitted via e-mail to: [email protected] SUBJECT: Comments of Consumers Energy on Michigan Department of Environmental Quality’s Proposed State Implementation Plan Submittal for Fine Particulate Matter (PM 2.5) Ms Halbeisen: Consumers Energy appreciates this opportunity to comment on the DEQ’s Proposed State Implementation Plan Submittal for Regional Haze. Consumers Energy is one of the nation’s largest combined gas and electric utilities, ranking fifth among the gas utilities and thirteenth among electric utilities. We serve approximately 6.5 million of Michigan’s 9.9 million residents with electricity, or gas, or both. We serve more than 8,600 industrial electric customers. Consumers Energy is proud of its achievements in meeting or exceeding previous Federal and State air regulatory initiatives. These include, but are not limited to Michigan’s 1980 sulfur in fuel limitation rule, the Acid Rain provisions of the 1990 Clean Air Act Amendments, and the NOx SIP Call. We are currently carrying out our plans for the implementation of the first phase of the Clean Air Interstate Rule (CAIR). We have historically been active participants in State Implementation Plan (SIP) development for criteria pollutants in Michigan, particularly when our sources are factors in designing an attainment strategy. Accordingly, we have been active participants in the preparation of this proposed SIP. GENERAL STATEMENT REGARDING AIR EMISSIONS AND AMBIENT AIR QUALITY Nationwide, emitting sources, including electric power plants, have been making dramatic reductions in emissions for decades while supplying the nation’s ever-increasing demand for energy and consumer products. Since 1970, total emissions of the six criteria air pollutants dropped by 54 percent. Air quality will continue to dramatically improve due to huge emission cuts already in the pipeline, some ordered just within this past year. Many of the control programs that are producing these successes are still being implemented. For the electric utility industry, this includes CAIR, which will result in significant reductions in PM 2.5 and its precursors, over the course of its implementation.
PM 2.5 PUBLIC COMMENT PERIOD RECORD
11

COMMENTS PERTAINING TO THE PROPOSED STATE IMPLEMENTATION PLAN SUBMITTAL FOR PM 2.5 Consumers Energy supports the DEQ’s proposed submittal and plan of action. In particular, we commend the Department and the Southeast Michigan Council of Governments (SEMCOG) for convening a stakeholder group that was well versed in issues related to particulate matter and nonattainment in Southeast Michigan. We believe that the end result is a deliberate, practical, area-specific approach to defining and resolving the issue of nonattainment of the PM 2.5 NAAQS in Southeast Michigan. We believe that it is important to acknowledge and commend the efforts of the DEQ’s Air Quality Division and SEMCOG, with assistance from the Lake Michigan Air Directors Consortium (LADCO), in working to understand the nature of PM 2.5 nonattainment in Southeast Michigan. This included the use of advanced monitoring techniques to detect and quantify the various components of PM 2.5, as well as the efforts put forth to compile a comprehensive emissions inventory. It made use of reasoned application of air quality computer models for PM 2.5. We also acknowledge the strong, open, professional, working interaction with the stakeholder group. The information obtained and ideas exchanged, combined with State and Federal rules that are on the books, the application of local control measures, and the trend analyses for PM 2.5 data, provide the basis for the weight of evidence argument for attaining the standard. The problem was clearly analyzed, debated and defined. The solution presented in this proposed submittal is geared towards resolving the problem at hand. During this process, the state of the understanding of PM 2.5 was advanced. It also brought the recognition that there is much more that is to be learned, particularly as we head towards addressing nonattainment issues with regard to the next PM 2.5 NAAQS. Consumers Energy appreciates this opportunity to discuss our views on the DEQ’s Proposed State Implementation Plan Submittal for PM 2.5. If you have any questions, please contact Louis Pocalujka at 517-788-2160. Sincerely, Louis Pocalujka, Senior Environmental Planner Environmental & Laboratory Services Consumers Energy 1945 W. Parnall Road Jackson, MI 49201
2
PM 2.5 PUBLIC COMMENT PERIOD RECORD
12

PM 2.5 PUBLIC COMMENT PERIOD RECORD
13

4++t~ S~.4y UNITED STATES ENVIRONMENTAL PROTECTION AGENCY 48
o n $ REGION 5 ~ W J AIR AND RADIA1-ION DIVISION ** \O
77 WEST JACKSON BOULEVARD '%L PRO+"" CHICAGO, IL 60604-3590
MAR 1 7 2008 REPLY TO THE ATTENTION OF: (AR-18J)
Robert Irvine Division of Air Quality Department of Environmental Quality 525 West Allegan Street P.O. Box 30473 Lansing, MI 48909-7973
Dear Mr. Irvine:
We appreciate the work that the Michigan Department of Environmental Quality has done to address the particulate matter problem in Southeast Michigan. We are pleased to review the draft plan that you have made available for public comment.
The enclosure provides comments on your draft plan. We are particularly concerned that Michigan appears to need to request an extension to the attainment deadline for Southeast Michigan, and in that context that Michigan appears not to have evaluated candidate control measures adequately or implemented a full set of reasonably available control measures.
We look forward to working with you to address these concerns. Please contact John Summerhays at (312) 886-6067 if you have any questions about these comments.
Sincerely yours,
sieve Rosenthal, ~cting Chief Criteria Pollutants Section
cc: Mary Ann Halbeisen, MDEQ
Enclosure
PM 2.5 PUBLIC COMMENT PERIOD RECORD
14

1
Comments on Draft Michigan SIP for PM2.5 in Southeast Michigan
Modeling Analyses Michigan’s attainment demonstration for PM2.5 in Southeast Michigan reflects a combination of regional and local modeling. Michigan’s draft SIP mostly addresses the local area analysis, and so our comments predominantly apply to this analysis. A key component of the local area analysis is the concentration, identified through air quality data analyses, that is attributed to local sources. Our guidance for local area analyses recommends using a concentration derived in this manner in conjunction with local area modeling that assess prospective reductions in these local area concentrations. We applaud Michigan for following this general approach. However, we have concerns about several elements of Michigan’s draft analysis. We have organized our modeling comments into comments on 1) the magnitude of the estimated impact of local sources, 2) the relationship between the estimated impact of local sources (derived from monitoring data) and the emissions of the sources included in the local source modeling analysis, 3) separating the concentration addressed by regional modeling from the concentration addressed by local source modeling, 4) more specific comments on modeling methods used in the local source modeling, 5) clarifications we would request, and 6) evidence to be considered in the weight of evidence assessment. 1. The most challenging element of a local area analysis is assessing the concentrations attributable to local sources and assuring reasonable correspondence between this impact estimate and the source emissions to which those impacts are being attributed. Source apportionment analyses are often the best means of assessing this impact, and we are pleased that several studies of this type have been conducted. This first comment addresses the overall magnitude of the local source impacts. a. The local area analysis must address the same time frame as the regional analysis. If Michigan uses regional modeling for years centering on 2005, then Michigan must assure that its local area analysis also represents conditions in the years centered on 2005. Tables 7 and 9 show a downward trend measured PM2.5 at all monitors. They also show that the difference between Allen Park and Dearborn has gotten smaller over time. This means that presumably, the local contribution to PM2.5 at Dearborn is smaller now than it was 3-5 years ago. Thus, if Michigan’s principal analysis of attainment uses data centered on 2005, then a lower local source impact would be warranted. b. The Sonoma report identifies a “Steel Industry” impact at the Dearborn monitor of 0.81 ug/m3. The failure to note this result is a serious omission from the draft SIP that reduces its credibility. The Sonoma report identifies several other industrial source types with similar or greater impacts. The steel mill impact, which reflects the impact of Severstal and other sources with similar types of emissions, is a better starting point for assessing the impact of local source controls, particularly the controls at Severstal.
PM 2.5 PUBLIC COMMENT PERIOD RECORD
15

2
EPA has also conducted analyses of the impact of steel mills in this area. EPA estimated that these sources cumulatively contribute 0.48 ug/m3 to this monitor. Further details of EPA’s analysis are provided in “Regulatory Impact Analysis (RIA) for the Proposed National Ambient Air Quality Standards for Particulate Matter,” dated October 6, 2006, in particular in Appendix B, “Local-Scale Assessment of Primary PM2.5 for Five Urban Areas,” at page B-29, Table 17. We are continuing to examine the various studies that evaluate the impact of various local sources. Nevertheless, it appears that Michigan has substantially overstated the impact of local sources included in its analysis, such that the benefit of the noted local controls is likely to be substantially less than the draft SIP estimates. 2. The validity of the local area analysis depends on assuring that the local source impact determined by monitoring data analysis reflects the impact of a set of sources that reasonably corresponds to the set of sources included in the local area modeling, as well as assuring that the composition (mix of PM2.5 components) included in the estimated local impact reasonably corresponds to the composition of the modeled emissions. We have several comments regarding how well the impact estimate corresponds to the emissions being analyzed. a. The draft SIP’s estimates of local source impacts reflect the results of source apportionment analyses. By their nature, such analyses involve substantial quantities of information regarding the composition of each of the source combinations identified as contributing to the observed concentrations. This information should be presented, along with more information about the studies generally. This information should indicate the relative proportions of the various PM2.5 components that are included. The draft SIP focuses on the combination of “mixed industrial” and “soil.” As noted above, information on the contribution of steel industry sources is more germane to Michigan’s local area analysis and would provide a better means of assessing the impact of emission reductions at Severstal. b. The identified sources for the AERMOD modeling only included point sources. Michigan must either include other relevant sources or use an estimated impact of local sources that excludes the impact of other sources. Other local sources that may be affecting the monitors include locomotives and other non-road vehicles, on-road vehicles, road dust, and other area sources. Since Michigan in particular has not included “soil”-related emissions in its modeling analysis, it is inappropriate to include “soil” in its monitoring-based estimate of local source impacts. If the impact of local rail operations are included in the monitored impact value, it would clearly be important to include those sources in the modeling analysis as well. Excluding important local sources of primary PM from the modeling but including the impact of those emissions in the monitoring-based impact estimate will cause an overstating of the importance of the modeled sources.
PM 2.5 PUBLIC COMMENT PERIOD RECORD
16

3
c. The AERMOD modeling and post-processing used only total PM2.5 data. Speciation of the PM2.5 data into components (organic particles, elemental carbon, sulfate, nitrate, and other) should be applied to help determine how much of the emissions and emissions reductions (especially from Severstal) may actually be organic particles or elemental carbon. It may not be reasonable to assume that all of the PM2.5 emissions are crustal/metals without documentation of assumed speciation profiles from these facilities. The CAMx modeling speciation profiles are one source of data. d. Similarly, Michigan should characterize the composition of the estimated impact of local sources to the extent practicable. At least some of this information is available from the source apportionment analyses Michigan is using. This type of information is essential to assess whether the impact estimate appropriately matches the emissions included in the local area modeling. The evidence available suggests that the ambient impact used in Michigan’s analysis includes a significant fraction of organic particles, especially insofar as this impact estimate reflected conditions around 2002. In contrast, the local area modeling appears to include very little organic particle emissions. The result appears to be the application of a reduction percentage derived from principally inorganic particle emissions data to an impact estimate that includes particulate matter (especially organic particulate matter) that is not reduced by that percentage. Thus, more generally, despite the challenges of addressing speciated information, this type of information is necessary to assure that the estimated local impact properly matches the emissions used in the modeling analysis. 3. Conceptually, Michigan is considering some portion of the monitored concentration to be attributable to regional sources and some portion of the monitored concentration to be attributable to local sources. It follows that the regional model would only address prospective changes in the impacts of regional sources, just as the local area analysis only speaks to the impact of local sources. That is, if the 2005-centered total design value at the Dearborn monitor is 17.6 ug/m3, and if the impact of the addressed emissions of local sources is 2.3 ug/m3, then the regional modeling would only address the difference of 15.3 ug/m3. Since the multiplication by relative response factors is done on a PM2.5 component-by- PM2.5 component basis, we recommend that Michigan estimate the local source impact on a component-by-component basis, subtract these values from the total estimated component concentrations, and thereby obtain an estimate of the portion of the observed concentration for each component that is attributable to regional sources (i.e., sources and emissions not included in the local area analysis). These regional values should then be multiplied times the appropriate relative response factor to estimate the future year concentrations attributable to regional sources. 4. We have several more specific comments on procedures for the local modeling analysis.
PM 2.5 PUBLIC COMMENT PERIOD RECORD
17

4
a. The greatest impact of PM2.5 from Severstal on Dearborn seems to be due to emissions from roof monitors. The parameters used when modeling these emissions as volume sources in AERMOD suggest that the emissions from the roof monitors have no buoyancy (i.e. are emitted at ambient temperature). In fact these emissions would be quite hot. Consideration of the buoyancy of these emissions in the modeling run could have a large impact on the results. b. For the AERMOD run which analyzed the impact of Severstal at the Dearborn monitor, the rural setting was used though the sources are clearly in an urban area and would most likely experience the effects of the urban heat island effect at night. Using the urban setting for this analysis would be more appropriate. Given that this rural run does not include the increased turbulence at nighttime due to the simulation of the urban heat island effect that would be included in the urban run, the contribution of the roof monitor emissions from Severstal could be overestimated due to an increased number of simulated stable conditions.
c. On Page 20-21, the last several paragraphs of Section 9.6.2 discuss the guidance for demonstrating attainment for Ozone, PM2.5, and Regional Haze. The text further discusses how several aspects of the guidance were not followed; e.g., quarterly analysis and speciated primary PM2.5. As a general rule, the guidance should be followed. If situations arise where the guidance isn't followed, justification and documentation should be provided to allow the reviewers to assess the validity of the alternative method. It's not clear whether or not quarterly RRF's would result in a significantly different result than use of the annual values. Quarterly RRF's should be developed from the modeling and applied to the local source contribution to the primary quarterly PM2.5 value.
d. No information is presented to discuss how the meteorological data has been processed, for example what surface and upper air stations were used and how the surface characteristics were generated. The meteorological preprocessor for AERMOD, called AERMET, incorporates surface characteristics (i.e., surface roughness, Bowen ratio, albedo). The selection of surface characteristic values can have a significant impact on predicted concentrations. Documentation on these aspects should be included to allow a more comprehensive review.
e. The documentation indicates 1 year of meteorological data was used. The guidance recommends more data be used if available. Five years of met data (e.g., 2002-2006) should be modeled to determine if there is variation in the local sources impact contribution from year to year. This could be particularly important in determining the relative response factor and in Step 2 on page 21 where the percent of the local primary PM2.5 determined to come from Severstal is based on AERMOD results.
f. EPA’s guidance recommends using a receptor grid sufficient to represent local scale impacts at and near the monitor. We recommend applying a 100 meter receptor grid, extending out a distance that would preclude receptors being located on modeled source private property (e.g., 300-400 meters). The receptors should be averaged to obtain a representative value.
PM 2.5 PUBLIC COMMENT PERIOD RECORD
18

5
5. We would request several types of information that would clarify the nature of the State’s analyses. a. Throughout the main document there are references to modeling and inventories for 2002, 2005, and 2009. The CAMx modeling used 2005 and 2009, and the AERMOD modeling used 2002 and 2009. However, it is difficult to understand what emissions levels were used in various parts of the modeling analyses. Many of the tables in Appendix A have inconsistent inventory numbers and it is not always clear what year the emissions represent. Also, there is limited documentation available for the CAMx modeling inventories. We request the following inventory summary information:
1) Statewide emissions totals (NOx, VOC, SO2, PM2.5, etc.) used for the 2002, 2005, and 2009 CAMx modeling for EGU, non-EGU point, area, on-road mobile, and non-road mobile.
2) The same information for the Detroit nonattainment area. 3) Detailed emissions summaries for 2005 and 2009 for the Detroit area EGUs (by
unit). 4) PM2.5 emissions summaries for 2002/2005 and 2009 for all sources modeled with
AERMOD. 5) CAMx emissions summaries for 2005 and 2009 for the AERMOD sources. 6) Detailed emissions (by process and/or stack) for the AERMOD sources. (See
comment 5.c below) b. Page 52 of the TSD shows emissions totals by State and by sector. The emissions projections for Michigan for EGU SOX emissions in 2009 projected from 2005 are 667 TPD. The Michigan EGU SOX emissions in 2009 projected from 2002 are 1,022 TPD. The Michigan EGU SOX emissions in 2002 are 1,103 TPD and 1,251 TPD in 2005. There is clearly some change in methodology or some reason that needs to be explained about why Michigan SOX emissions are higher in 2005 than 2002 and so much lower in 2009 when projected from 2005 compared to 2009 projected from 2002. c. The SIP should also better clarify the inventory of sources used in the local modeling analysis. Further documentation of the inventory should especially be provided for Severstal, including full documentation of the estimates of emissions before and after compliance with the requirements that Michigan has adopted for this company. Given the potential for deterioration of control equipment, this documentation should identify the limits being imposed, so as to reflect the degree of control equipment deterioration which could occur without violating the adopted requirements. The draft SIP should include the complete AERMOD input files for both the base case and the future case runs. Based on information provided informally to EPA, it appears that Michigan has assumed a reduction of emissions at Severstal that likely represents an overly optimistic capture and control efficiency mandated by the applicable limit. It is also not clear whether the emission estimates for the future case and the current case are based on the same underlying emission factor.
PM 2.5 PUBLIC COMMENT PERIOD RECORD
19

6
d. The regional modeling indicates PM2.5 reductions of 1.5-1.9 ug/m3 at the Detroit area monitors between 2005 and 2009 (Table 1). Application of the speciated model attainment test involves calculating changes in concentration for each PM species. Therefore, the 1.5-1.9 ug/m3 reduction can be broken down into each of the component species. Please supply a table which shows the changes in PM species to allow a better understanding of where the PM reductions are coming from. e. There is a discussion of the emissions from switching locomotives, noting that 28 of them will be retrofitted with anti-idling equipment. It is noted that the emissions from these sources are relatively small, but may be important due to their proximity to monitors and the fact that they operate 24 hours per day. From the documentation it is not clear: 1) Where all of these rail yards and locomotives are located. 2) Which ones will be retrofitted or replaced. 3) How these locomotives and other rail yard sources were modeled in the regional modeling and local scale modeling. f. To help support the modeled conclusions, it would be helpful to include a discussion on the meteorological data used in the AERMOD modeling, including some information that support the fact that the number of calms in the 2002 meteorological data was not unreasonably large. This seems particularly important in this modeling exercise where the greatest impacts are coming from roof monitor emissions close to the receptor that are modeled as non-buoyant. g. NOx and SO2 RACT modeling is mentioned on page 17 of this section. It is unclear how the impact of the 50% reduction in all NOX emissions across the entire State was evaluated. The term “relative reduction factor” is mentioned but the estimation methodology is not described in any detail. h. According to the discussion on page 21, the 2009 project design value for Dearborn (15.7) and SWHS (14.2) are based on “on the books” controls after a review of the TSD. The TSD has results for each monitor in 2009 based on “on the books plus will do” controls and has slightly higher 2009 projected design values for Dearborn (15.8) and SWHS. Michigan should clarify whether the “will do” scenario includes the changes in emissions from the 3 local sources in Wayne County that are mentioned in the local scale dispersion modeling. Michigan should also further explain the differences in controls in Southeast Michigan between the “on the books” scenario and the “on the books plus will do” scenario. It is difficult to understand why controls beyond those that are on the books will lead to an increase in the projected design value. h. It is unclear from the write-up how the primary PM2.5 emissions from Severstal were modeled in CAMx. Michigan should explain whether the full emissions were modeled for both the base and future year CAMx runs, whether the PM2.5 emissions were excluded entirely, or whether the 2009 CAMx run reflects emission controls at this facility. If Michigan has concluded that it has avoided double-counting the effects of
PM 2.5 PUBLIC COMMENT PERIOD RECORD
20

7
Severstal and its emission changes, Michigan should explain its rationale for this conclusion. 6. We have comments on the supplementary evidence as to whether Southeast Michigan will attain the standard by 2009. a. Some important evidence, contributing to the weight of evidence, suggests that Southeast Michigan will not attain the standard as early as 2009. First, modeling conducted by LADCO based on 2000 to 2004 data suggests that the area will be at 17.7 ug/m3 (minus any reductions from local source emission controls) in 2009. Second, the modeling described by Michigan assumes full control of the Monroe power plant, whereas the installation of controls at this plant are not expected to occur until mid- to late 2009, so that the significant benefits of this control will mostly not occur in 2009. For these reasons, and given our concerns about the magnitude of air quality improvement that can be expected from the local source controls, we are concerned about the prospects that Southeast Michigan will not in fact attain the standard in 2009. b. The draft SIP cites a number of emission reductions, implying that these improve the prospects beyond what would be inferred from the modeling results. However, most of these reductions occurred before 2005, so that these reductions would already be reflected in 2005 air quality and thus would already be reflected in Michigan’s modeling analysis. Most of the plants on the list in Table 4 were closed by 2005. The largest change in emissions from plant closings is with NOx, and we agree with the implication that NOx emission reductions can have significant benefits for PM2.5 air quality. However, use of air quality data centered on 2005 in the modeling analysis inherently already takes credit for these air quality benefits. Similarly, many of the reductions at Marathon occurred either before or during 2005, and the controls at US Steel were implemented in mid-2005. Thus, these reductions are also inherently already largely reflected in the modeling analysis. Conversely, some emission increases are expected at relevant local sources. For example, Severstal is expected to increase its NOx emissions by 37.6 tons per year. If the rail yard reductions in NOx (67 and 66 tpy) are significant given their proximity to the monitor of interest, then the increase in Severstal’s emissions would also be significant. Severstal is also expected to increase its SO2 emissions. Emission increases between 2005 and 2009 are also expected at Marathon. Reasonably Available Control Technology (RACT)/Reasonably Available Control Measures (RACM) 1. The comments above suggest significant prospects that Michigan will not attain the PM2.5 standard in 2009. In this context, it appears that Michigan has not provided the
PM 2.5 PUBLIC COMMENT PERIOD RECORD
21

8
review and implementation of RACT measures that the PM Implementation Rule requires. Michigan seems to have conducted very little review of candidate control measures. Michigan must address RACT for the range of significant PM2.5 components or their precursors, as applicable for sources throughout the designated nonattainment area. This review must address directly emitted organic and inorganic particles as well as SO2 and NOx. 2. Michigan conducted sensitivity modeling assessing the impact of an arbitrary percentage reduction of NOx and SO2 emissions, including one run assessing the impact of statewide reductions and another run assessing the impact of reductions within the 7-county nonattainment area. While we are not fully clear on the details of Michigan's analysis, Michigan's results suggest to us that reduction of NOx and SO2 emissions in Michigan have the potential to provide significant benefit for air quality in the Detroit area. We do not think the analysis approach in Appendix F can adequately address the RACT/RACM requirement. Control measures outside the nonattainment area in some cases have less air quality benefit in the nonattainment area and may be less reasonable than control measures within the nonattainment area. Nevertheless, Michigan must evaluate the candidate measures and assess whether any of these measures can reasonably be implemented outside the nonattainment area. Within the nonattainment area, given the significant air quality problems that exist and appear likely to remain, we believe that Michigan upon further review will identify several measures that will be found to constitute RACT. Two measures in particular that we would highlight are the set of measures known as "NOx RACT" and coke oven gas desulfurization. Many states in the Midwest and elsewhere that, like Detroit, are violating both the ozone and the PM2.5 standard are adopting rules requiring RACT for NOx. We believe that the benefits of reducing industrial point source NOx are commensurate with the portion of the inventory that these sources emit. The particulate matter problem by nature involves a combination of numerous components, and so the solution to the problem necessarily involves numerous measures, no one of which by itself would solve the problem. (Indeed, particulate matter appears to have even more contributors than ozone, and an even greater variety of control measures may be needed.) It appears that "NOx RACT" would have a significant benefit in the Detroit area at reasonable cost. We would be happy to share information on the limits that other states have adopted or proposed, to provide more information on the limits that they have found to constitute RACT. Coke oven gas desulfurization is done at most U.S. coke plants. We believe this measure can be expected to provide worthwhile air quality benefits in the Detroit area at reasonable cost. Further discussion of this and other iron and steel plant measures is provided in a report by RTI International, available at
PM 2.5 PUBLIC COMMENT PERIOD RECORD
22

9
http://www.epa.gov/pm/measures/detroit_steel_recommendations20060207.pdf. This report recommends testing of condensible emissions at the EES coke plant to assess the quantity of these emissions. These emissions presumably are predominantly sulfate emissions, which would be substantially reduced with desulfurization of the coke oven gas. That is, desulfurization of the coke oven gas would make moot what quantity of condensible particulate matter is currently emitted. 3. The draft SIP comments on the length of Michigan’s rulemaking process and the difficulty of implementing controls before 2010. Since the SIP submittal schedule has provided the state 3 years after the April 2005 effective date of the PM2.5 designations to complete any necessary rulemaking, the length of the state’s rulemaking process does not constitute an acceptable rationale for failing to adopt measures that would facilitate attainment. In addition, Michigan has provided very little information on the timetable for implementing individual measures. A more detailed review must be conducted to identify candidate measures and to evaluate whether each candidate measure is reasonable. Given the prospects for continued nonattainment in Southeast Michigan beyond 2009, we believe that the SIP submittal schedule is providing Michigan ample opportunity to implement additional measures that will assist and expedite attainment. 4. Regarding organic particle impacts, Michigan’s draft SIP notes the uncertainties regarding the composition of this impact. We would comment that 0.8 ug/m3 impact attributed to a steel mill, if it all approximates an annual average impact, is a highly significant impact. We also note the work underway under LADCO contract to extend and enhance previous work on organic particle origins in the Detroit area and elsewhere. Organic particles are a substantial fraction of the PM2.5 concentrations in Southeast Michigan. LADCO has done substantial work to assess contributions to organic particle concentrations in Southeast Michigan and elsewhere. This is important information to provide in the SIP, in part because it has significant relevance to this plan for providing for attainment of the PM2.5 standards. The draft SIP comments that the Dearborn monitor records an especially high quantity of organic particles, and implicitly suggests that the industrial area has greater than average emissions of these particles. For this reason, it is especially important that Michigan supplement the air quality analyses with work to investigate these emissions, including investigating the industrial sources that would be suspected of emitting this type of particulate matter. Since the area has a number of candidate sources of organic particulate matter, and since these types of sources appear to have a significant effect on air quality, a more thorough investigation of these sources must be conducted. Michigan should request stack tests in cases where potentially significant emissions cannot readily be estimated accurately through available emission factors. We understand that the investigation of candidate measures may need to begin as an investigation of the emissions of candidate sources, but for purposes of this SIP the investigation must then include an investigation of candidate control measures, with implementation of those measures that are reasonable.
PM 2.5 PUBLIC COMMENT PERIOD RECORD
23

10
5. At various places in the SIP, Michigan identifies source types that appear to be significant. For example, on page 20, the draft SIP notes that fugitive dust from storage piles, unpaved lots, and barren land areas collectively is cause for concern. Michigan needs to identify candidate measures and evaluate whether the measures addressing the source types that have been identified as contributing to the problem constitute RACT/RACM. 6. Some interesting analysis done by LADCO using nonparametric regression shows local area hotspots in Zug Island and at the Ambassador Bridge. The SIP should describe what types of controls are being implemented for these 2 hotspot areas that are clearly impacting local PM2.5. 7. Some parts of the discussion of local controls need clarification. On page 32, Michigan should provide estimates of PM2.5 emission reductions for U.S. Steel, to provide more directly relevant information concerning potential PM2.5 air quality impacts. On pages 32-33, for Marathon, it is not clear how the installation of a new coking unit to process heavy crude oil will affect PM and PM precursor emissions. Enforceability of Control Measures 1. Michigan’s draft SIP does not include copies of any rules, permits, consent decrees or other enforceable documents. Therefore, the draft SIP provides no basis for finding the control measures described in the SIP to be enforceable or creditable. To make these control measures enforceable and creditable, the final SIP must include documents that mandate these control measures, and the limits must be provided in a manner that, upon EPA approval, could be enforced by EPA. We would also encourage Michigan to send us these documents informally for our early review. We intend to examine the limits in these documents, to assess the both the enforceability of the requirements and the quantitative reduction required, including assessing the degree to which equipment for emissions capture and equipment for emissions control might be allowed to deteriorate. 2. Michigan’s draft SIP notes emission reductions attributable to several source shutdowns. For these reductions to be creditable, Michigan must assure that the shutdowns are permanent and enforceable, such that the shutdowns will not create offsets that would allow a new source or a major modification to use the emission reductions negate the air quality benefits of the shutdown. Contingency Measures Under Clean Air Act and the Implementation Rule, contingency measures must be able to “take effect without significant further action by the State or EPA.” Merely having a list of potential measures that would be candidates for future evaluation, adoption and implementation falls well short of this test. Especially given the prospects that Michigan will need to implement its contingency measures relatively soon, Michigan needs to
PM 2.5 PUBLIC COMMENT PERIOD RECORD
24

11
complete the evaluation work in advance of submitting its contingency measures, so that the submitted contingency measures will be fully defined measures that can be implemented promptly. Given our concerns about implementation of RACT/RACM in Southeast Michigan, we anticipate that the listed contingency measures will also be evaluated as candidate RACT/RACM measures. We expect that Michigan’s work on RACT/RACM measures will also lead to identification of other possible contingency measures, just as we expect that some of the measures on Michigan’s contingency measure list will prove to be RACT/RACM. Once Michigan completes the necessary evaluation of candidate RACT/RACM measures, Michigan should from that process obtain sufficient information also to provide better defined contingency measures. For each measure, we then expect the SIP to document exactly how the measure would be implemented and under what schedule and under what circumstances the measure would take effect. Reasonable Further Progress If, as appears to be the case, the Detroit area needs an extension of the attainment deadline, then Michigan would need to provide a submittal addressing the requirement for reasonable further progress. Emissions Inventory We understand that the final SIP will include more thorough documentation of the emissions inventory, including documentation being prepared by LADCO. We will provide more thorough comments once that documentation becomes available. Nevertheless, we recommend one clarification to the summary information provided here. The table has a category of emissions identified as “nh3.” We request further explanation of this category. We then recommend use of a more descriptive label for this category of sources. Monitoring Analyses 1. The draft SIP, at page 18, states that “counties to the north of Wayne County do not contribute to PM2.5 nonattainment at the monitors showing violation of the standard.” The draft SIP then concedes that an increase in concentrations at the violating monitors (characterized as a little increase) “is attributable to Oakland and Macomb Counties.” Additional comments on EPA’s designation for Southeast Michigan appear at various points throughout the draft SIP. As another example, on pages 4 to 5, the State reiterates arguments that only Wayne County should be designated nonattainment and asserts that EPA’s inclusion of other counties in the designated nonattainment area was “arbitrary.” As you know, EPA promulgated designations effective April 5, 2005. That rulemaking included EPA's evaluation of what areas violate the standards, and what areas
PM 2.5 PUBLIC COMMENT PERIOD RECORD
25

12
“contribute” to violations of the standard in accordance with section 107 of the Clean Air Act. That rulemaking took into consideration the views of the State. Thus, EPA has already addressed the appropriate geographic scope of the area that contributes to violations of the standards in Wayne County. As a result of that designation, the SIP developed for the Southeast Michigan area must meet the statutory and regulatory requirements for nonattainment area plans, most notably the requirement for Michigan to submit a SIP providing for timely attainment and adequate analysis and implementation of RACT and RACM throughout the nonattainment area. While Michigan has latitude to provide for attainment using any of various combinations of measures providing for timely attainment, the nonattainment area, by defining the contributing area, represents the geographic area for which control measures are most likely to be beneficial and necessary. EPA has previously explained in detail the reasons for the geographic scope of the designated nonattainment area. These reasons were articulated both to the State and to Oakland County in the following documents: (i) a letter from EPA to Governor Jennifer M. Granholm, dated June 29, 2004; (ii) a letter from EPA to Steven E. Chester, Director of MDEQ, dated January 20, 2006; (iii) a letter from EPA to Marc D. Machlin, Esq., also dated January 20, 2006, concerning a petition for reconsideration filed on behalf of Oakland County, Michigan; and (iv) a letter from EPA to Marc D. Machlin, Esq., dated September 25, 2007, concerning a second petition for reconsideration filed on behalf of Oakland County, Michigan. These documents and other information relevant to the designation may be found at: http://www.epa.gov/pmdesignations/. The inclusion of this commentary in the draft SIP suggests that Michigan has failed to address the requirement for the SIP to examine candidate control measures throughout the designated nonattainment area. Furthermore, of course, we disagree with these statements, having thoroughly examined the pertinent issues in our prior rulemaking. The area violates the annual standard, which reflects a combination of contributions from all wind directions. We have already determined that sources beyond the 3 mile radius referenced in the draft SIP and indeed sources outside of Wayne County contribute to violations of the standards in the area. Accordingly, the area to be addressed by this SIP has already been defined, and the SIP is an inappropriate place to dispute the designation or to suggest that the State prefers to fall short of its SIP obligation. 2. Figure 6 does not suggest that OC is decreasing faster at one location or that it is substantively decreasing at all. 3. Figures 8 and 9 contradict each other. The Detroit urban excess in Figure 8 appears to be around 1 to 1.5 ug/m3. The Detroit urban excess in Figure 9 appears to be around 5 to 7 ug/m3. 4. Section 9.4 and Figure 18 are very confusing. It is very difficult to discern the mobile contribution to OC from Figure 18 because it looks like it contains pie charts of contributions to PM2.5 mass and not OC.
PM 2.5 PUBLIC COMMENT PERIOD RECORD
26

5. A mobile laboratory study is referenced in this section, but the measurement locations relative to Dearborn are not stated and the results are for a single day, so it is difficult to discern information relevant to Dearborn.
PM 2.5 PUBLIC COMMENT PERIOD RECORD
27

General Summary of Comments and MDEQ Responses for the PM2.5 SIP Comment: Comments were received from several groups that appreciated the opportunity to participate with the SEMOS group in developing this SIP and WOE. Several comments supported the WOE approach that clearly analyzed emissions inventory, monitoring and modeling to develop the attainment strategy. Several comments supported using a focused and cost effective strategy in the attainment demonstration by targeting sources local to the monitors showing non-attainment instead of applying controls to the whole 7-county non-attainment area.
Comment: DTE Energy did not agree with including additional sulfur dioxide controls on the Edison Energy Service’s coke battery as a contingency measure since the coke battery is upwind of the Dearborn monitor.
Response: MDEQ disagrees and believes that sulfur controls on the coke battery are a valid contingency measure and likely have some impact on the high monitors.
Comment: DTE Energy indicated several areas that needed clarification:
1. The table identified as the “Model Based Projections of Future Year Air Quality” has a misleading title and should reflect the true nature of this modeling projection.
2. The SIP needs to address other nearby sites that slightly exceed the annual NAAQS, like SWHS and should document why this site is of less concern than Dearborn (i.e., regional modeling shows attainment).
3. Indicated that wind directions need to be addressed consistently in the document. Sometimes wind directions are separated into 60-degree sectors, and other analyses use 10-degree wind sector data.
4. The current list of contingency measure sources is too broad and ambiguous.
5. The contingency plan would benefit from more details regarding how ongoing special monitoring studies at the Dearborn site will be used to identify the source(s) responsible for the organic carbon (OC), and possibly the sulfate excess, when compared against Allen Park data.
Response: MDEQ has made these corrections/clarifications.
Comment: SEMCOG suggested that additional information that has become available should be incorporated into the SIP before submitting to EPA.
Response: MDEQ agrees and has made appropriate updates.

EPA comments Region V EPA provided extensive comments on Michigan’s draft PM2.5 SIP, particularly focusing on the local scale modeling and including several areas where information was lacking or needed updating. MDEQ notes that generally accepted procedures for doing the local scale modeling, as has been discussed for months by state modelers throughout the region as well as EPA modelers, was used in this SIP. The approach taken is conservative in the assumptions and has been thoroughly described in the SIP document. Comments and responses are as follows:
Comment: Local area modeling needed to address the same time frame as the regional modeling. Response: The local scale modeling was re-run using ’05 met data. There was very little change in the final values as a result of this action. Comment: Results from source apportionment analyses should be noted. Response: A review of several source apportionment studies was included in Appendix G. Comment: Modeling could be run using the urban setting. Response: The local scale modeling was re-run using urban meteorological data. Comment: Additional information on the MET data used in modeling is needed. Response: Surface characteristic values have been documented. The guidance (referenced below) specifies "For both base and future year use the same 1 year of met data – the same year as used for the photochemical modeling". The guidance DOES say "if available, use more than 1 year of met data" but gives no additional information. As 2005 was a worse case year (as opposed to 2004 and 2006), using the single year of 2005 met is defensible, and it remains consistent with the photochemical modeling run. Reference: "Guidance on the Use of Models and Other Analyses for Demonstrating Attainment of Air Quality Goals for Ozone, PM2.5, and Regional Haze"; Section 5.3.2 Comment: Additional details and permit limits for Severstal’s emissions is needed. Response: Documentation has been added more completely describing the permitted emission limits at Severstal and the emission values modeled.

Comment: Information on modeling locomotives is needed. Response: The table describing how locomotives were modeled in the regional and local scale modeling has been updated. Comment: Additional information on RACT modeling and RACT analysis is needed. Response: Additional documentation was provided regarding the 50% cut analysis for RACT, including the relative reduction factors, etc. Much more detail has been provided on the likely affected sources and affected emissions under RACT programs. Comment: Additional information on contingency measures is needed. Response: MDEQ has added more information on the individual potential measures and has ranked the measures on the ease of implementation. Comment: Clarification needed on the ‘nh3’ category for the emissions table. Response: A footnote was added to the table to clarify that the nh3 emission values only apply to the NH3 source category in the table. Comment: Clarification needed for several figures in the WOE. Response: MDEQ has clarified the figures, adding and revising headings and making other revisions.

Appendix C
EMISSIONS INVENTORY METHODOLOGY
SUPPORT DOCUMENTATION
FOR THE
FINE PARTICULATE SIP
January 2008

Table of Contents
Page
1. Introduction ............................................................................................................ 2
2. EGU Point Sources ............................................................................................... 2
3. Non-EGU Point Sources ........................................................................................ 6
4. Stationary Non-Point Sources............................................................................... 10
5. Non-road Mobile Sources ..................................................................................... 49
6. On-road Mobile Sources ....................................................................................... 52
7. Area Source Ammonia and Biogenic Emissions................................................... 53
1

1. Introduction Emissions inventory documentation support for the PM2.5 Fine Particulate SIP is provided in this appendix. An inventory was prepared for all counties in Michigan. Mobile estimates for the nonattainment counties were prepared by the Southeast Michigan Council of Governments (SEMCOG) and appear in a separate appendix. Mobile emissions for other counties were prepared by the Midwest Regional Planning Organization’s (MRPO) contractor using traffic and vehicle information provided by the Michigan Department of Transportation. The Lake Michigan Air Director’s Consortium (LADCO) is the MRPO. The focus of the inventory effort was to produce modeling inventories for the base year (2005) and the attainment year (2009). The future year projections take into account existing control measures and measures that are known to be on the way (e.g., CAIR measures). This inventory is referred to as the LADCO Base-M inventory. Procedures used to prepare these inventory products can be found in the “Regional Air Quality Analyses for Ozone, PM2.5, and Regional Haze: Technical Support Document,” prepared by LADCO. LADCO has produced numerous summary reports with State and county total emissions and has posted them on their Internet site at:
http://www.ladco.org/tech/emis/basem/baseM_reports.htm In a related effort, the 2005 Michigan statewide inventory was submitted to the EPA by the Michigan Department of Environmental Quality (MDEQ) pursuant to 40 CFR Part 51, Subpart A – Emissions Inventory Reporting Requirements. 2. EGU Point Sources 2005 EGU Point Source Methodology The 2005 EGU point source data originated with annual emissions data provided to Michigan DEQ via the Michigan Air Emissions Reporting System (MAERS). Temporal allocation was performed by emission unit, month, day of week and hour using the procedures described in “Temporally Allocating Emissions with CEM Data for Chemical Transport and SIP Modeling,” available at:
http://www.epa.gov/ttn/chief/conference/ei15/session4/edick.pdf In addition to the heat input-based temporal profiles described in the paper, separate temporal profiles were developed based on Continuous Emissions Monitoring (CEM) reported emissions of NOX and SO2 and these profiles were used instead of heat input to temporalize annual emissions of the respective pollutants. The CEM data used as the basis of the profiles was that for 2004 through 2006 obtained from the EPA Clean Air Markets Division (CAMD) website:
http://cfpub.epa.gov/gdm/index.cfm?fuseaction=iss.progressresults
2

Growing EGU Point Source to 2009 The 2009 data is obtained from Integrated Planning Model (IPM) results obtained by the EPA and converted to a modeling inventory by LADCO. The following is a LADCO Integrated Planning Model discussion, which details the methodologies used to project the EGU emissions to 2009 using results from the IPM model: Specifically, future year emissions are based on EPA’s IPM3.0 modeling. Three CAIR scenarios were addressed:
• Round 5a: EPA’s IPM3.0 was assumed as the future year base for EGUs. • Round 5b: EPA’s IPM3.0, with several “will do” adjustments identified by the
States. These adjustments should reflect a legally binding commitment (e.g., signed contract, consent decree, or operating permit).
• Round 5c: EPA’s IPM3.0, with several “may do” adjustments identified by the States. These adjustments reflect less rigorous criteria, but should still be some type of public reality (e.g., BART determination or press announcement).
Inter-RPO IPM Global Parameter Decisions (May 11, 2005):
The following summarizes the decisions made by VISTAS, MRPO, CENRAP, and MANE-VU for global assumptions to be used in EGU forecasting with IPM. These decisions and changes are made to IPM version 2.1.9 assumptions, which can be referenced via EPA’s IPM website at:
http://www.epa.gov/airmarkets/epa-ipm/ A. Market Assumptions 1. National Electricity and Peak Demand
Decision: Use unadjusted Energy Information Agency (EIA) Annual Energy Output (AEO) 2005 national electricity and peak demand values.
2. Regional Electricity and Demand Breakout Decision: Use the existing IPM region breakdown as conducted in earlier modeling.
3. Natural Gas Supply Curve and Price Forecast Decision: Take existing supply curves and scale application to EIA AEO 2005 price point. In this approach, the EPA 2.1.9 gas supply curves will be scaled in such a manner that IPM will solve for AEO 2005 gas prices when the power sector gas demand in IPM is consistent with AEO 2005 power sector gas demand projections. In instances where the power sector gas demand in IPM is lower than that of AEO 2005 projections, IPM will project gas prices that are lower than that in AEO 2005 and vice versa.
4. Oil Price Forecast Decision: Use EIA AEO 2005 values.
3

5. Coal Supply and Price Forecast Decision: Take existing supply curves and scale application to EIA AEO 2005 price points, coal supply regions, and coal grades. In this approach, the coal supply curves used in EPA 2.1.9 are scaled in such a manner that the average mine mouth coal prices that the IPM is solving in aggregated coal supply regions are comparable to AEO 2005. Due to the fact that the coal grades and supply regions between AEO 2005 and the EPA 2.1.9 are not directly comparable, this is an approximate approach and has to be performed in an iterative fashion. This approach does not involve updating the coal transportation matrix with EIA assumptions due to significant differences between the EPA 2.1.9 and EIA AEO 2005 coal supply and coal demand regions.
B. Technical Assumptions 1. Firmly Planned Capacity Assumptions
Decision: Use revisions and new data as provided by RPOs and stakeholders. Decision: Allow North Carolina Clean Smokestacks 2009 data as provided to define “must run” units.
2. Pollution Control Retrofit Cost and Performance [SO2, NOx, and Hg] Decision: Retain pollution control retrofit cost and performance values.
3. New Conventional Capacity cost and performance assumptions Decision: Use EIA AEO 2005 cost and performance assumptions for new conventional capacity. Decision: Retain existing 2.1.9 framework cost and performance for new renewable capacity. Decision: Exclude constraint on new capacity type builds (i.e., no new coal).
4. SO2 Title IV Allowance Bank Decision: Use existing SO2 allowance bank value (4.99 million tons) for 2007.
5. Nuclear Re-licensing and Uprate Decision: Use existing IPM configuration with updated EIA AEO 2005 (~$27/kW) incurrence cost for continued operation.
C. Strategy Assumptions 1. Clear Air Mercury Rule (CAMR) Decision: Include CAMR in future rounds of IPM modeling. 2. Renewable Portfolio Standards
Decision: Model Renewable Portfolio Standards (RPS) based on the most recent Regional Greenhouse Gas Initiative documentation using a single RPS region for MA, RI, NY, NJ, MD and CT. The RPS requirements within these states can be met by renewable generation from New England, New York and PJM. EPA 2.1.9
4

methodology and hardwired EIA AEO 2004 projected renewable builds for the remainder of the country.
D. Other Assumptions 1. Run Years
Decision: Revise runs years to 2008 [2007-08], 2009 [2009], 2012 [2010-13], 2015 [2014-17], 2018 [2018], 2020 [2019-22], and 2026 [2023-2030].
2. Canadian Sources Decision: Utilize existing v.2.1.9 configuration (no Canadian site specific sources).
3. Non-EGU Point Sources 2005 Non-EGU Point Source Methodologies The 2005 point source data have as their original sources the 2005 Michigan point source emission inventory. This section of the document describes the compilation and processing of point source emission data submitted to comply with the Consolidated Emission Reporting Rule (CERR) for the EPA NEI 2005 inventory. The data originates with the entry of data by the reporting facilities into the MAERS. The electronic data received from the reporting facilities is reviewed and compiled by the MDEQ, and exported to the fixed-width text version of the National Inventory Format (NIF). After the exported data is loaded into a PostgreSQL database patterned after the MS Access version of the NIF, the following processing steps and checks are performed. Both emissions estimated by default calculations in MAERS and any emissions reported by facility operators are maintained in MAERS. For evaluation and quality assurance purposes, both types of records are included in the exports. To avoid double-counting, where a specific process/pollutant has emission records both reported directly by the facility operator, and estimated via MAERS calculations, the latter are excluded. Portable facilities, such as asphalt plants, report total throughput and emissions, plus operating percentages for each county in which the portable facility was located during the year. From this information, records are generated for each county of operation, and throughput and emissions are apportioned based on the operating percentages reported by county and process. As geographic coordinates for all operating sites are not reported, coordinates corresponding to the centers of the counties of operation are assigned. As attention has shifted from total particulate to PM10 and PM2.5, total particulate records are excluded from the reporting requirements.
5

Over 99.8 percent of total criteria emissions are accounted for by emissions reported by operator; therefore, exported criteria emissions estimated via MAERS calculations are excluded. In the site table, where strFacilityCategory is not set in the export, it is set to “01.” Mandatory geo-coordinate fields were added to the NIF specifications released in December 2003, well after it would have been possible to collect this information from the reporting facilities for 2002 operations. The following values were deemed most often representative and the exported data are updated accordingly for 2002 data: “strHorizontalCollectionMethodCode” is set to '027' “strHorizontalAccuracyMeasure” is set to '2000' “strHorizontalReferenceDatumCode” is set to '001' “strReferencePointCode” is set to '106' For 2005, these geographic data elements were requested of the facilities. The defaults above were applied only where data was not provided by the facility. MAERS tracks emissions of some pollutants that are of interest to the Great Lakes Commission, but which do not have corresponding pollutant codes in the most recent NIF pollutant code table. Emission records for the following pollutant codes are excluded:
7440508; 8052413; DICDD,TOT; DICDF,TOT; HYDFLUORO; PERFLUORO; TRICDD,TO; TRICDF,TO; CH4; CO2; N20; 117840; 7783064.
Emission records for ammonia are exported with the Chemical Abstract Service (CAS) number 7664417, rather than the pollutant code NH3. These pollutant codes are updated to NH3. Likewise, records exported with pollutant codes PAH and POM are updated to pollutant codes 234 and 246, respectively. All criteria and HAP emissions are reported at the process level, and the export routines reflect that in the strEmissionDataLevel field of the emission table. This field is set to null for criteria pollutant emission records per EPA guidance. All emissions are exported as pounds of annual emissions. The EPA guidance suggests that criteria pollutant emission be reported in tons. The field strEmissionUnitNumerator is changed to TON and the filed dblEmissionNumericValue is divided by two000 for criteria pollutant emission records. Null values in the quarterly throughput fields of process records are set to zero. Where quarterly throughput fields of process records sum to zero, throughput percentages are set to 25% for each quarter.
6

MAERS recognizes a control device code of '909' for a “Roll Media Fiberglass Tack Filter (Tacky 1 side),” which is not recognized in the NIF code tables. Where this control device code is exported, the “strPrimaryDeviceTypeCode” field of the control equipment table is updated to a value of 058. Because of the exclusion of emission records as described above, referential integrity of the exported data can be compromised. At this point, it is re-established by deleting records stepwise, in the following order.
CE records without corresponding EM records PE records without corresponding EM records EP records without corresponding EM records ER records without corresponding EP records EU records without corresponding EP records SI records without corresponding EU records
The data are then checked again for referential integrity and mandatory fields and then loaded into the MS Access shell version of the NIF via append queries that connect to the PostgreSQL data tables via ODBC. The Basic Content and Format Checker is run and its output is reviewed. Where corrections are needed, to assure consistency among data sources, the corrections are made in the MAERS and a full iteration of the export and post-processing steps are performed. The 2005 point source inventory was incorporated into the LADCO Base M inventory and serve as the basis for Michigan’s 2005 CERR submittal. Growing Stationary Non-EGU Point, Stationary Area, Locomotive, Shipping, and Aircraft Categories to 2009 The 2009 emissions are based on work and a follow-up report (E.H. Pechan & Associates, Inc., Development of Growth and Control Factors for Lake Michigan Air Directors Consortium, Final Report, December 14, 2004) done by E.H. Pechan & Associates, Inc. (Pechan). This work supports LADCO’s efforts to forecast anthropogenic emissions for the purpose of assessing progress for air quality goals, including goals related to regional haze and attainment of the ozone NAAQS. The Pechan growth factors were used to estimate the LADCO base M future year emissions posted by LADCO in 2007. The future year emissions represent both emission controls that already exist and those that are known to be on the way (e.g., CAIR control measures). To assess progress for attaining air quality goals, LADCO requires emission activity growth and control data to forecast emissions from a 2005 base-year inventory to several future years of interest. These future years include 2009, 2012, and 2018 (e.g., 2018 is the first milestone for regional haze reasonable progress demonstrations). Pechan prepared emission control factors to support forecasting for each of these years. Because the incremental level of effort required to develop emission activity
7

growth factors for each year over the 2003-2018 period was nominal, Pechan prepared non-EGU point and area and non-road source growth factors for each year over this entire period. The report describes Pechan efforts to develop emission growth and control data to support future year air quality modeling by LADCO. The report is organized into a background chapter and: Chapter II, which describes the development of the emission activity growth data; Chapter III, which discusses how the emission control data were compiled; Chapter IV, which describes the preparation of the growth and control factor files; Chapter V, which identifies projection issues for future consideration; and Chapter VI, which presents the references consulted in preparing this report. The Pechan Growth and Control Factor report is too lengthy to be included in this document, but it can be provided upon request or downloaded at: http://www.ladco.org/reports/rpo/MWRPOprojects/Strategies/Growth&ControlDraftReportOct26-04.pdf For sectors non-EGU point source, stationary area source and MAR source sectors, the future year emissions for the LADCO States were derived by applying growth and control factors to the base year inventory. As stated above, these factors were developed by a contractor (E.H. Pechan). Growth factors were based initially on EGAS (version 5.0), and were subsequently modified (for select, priority categories) by examining emissions activity data. Additional information on the procedures used to project emissions can be found in the “Regional Air Quality Analyses for Ozone, PM2.5, and Regional Haze: Technical Support Document” prepared by LADCO. 4. Stationary Area Sources 2005 Stationary Area Source Emission Inventory The following is a description of the various area source categories that were inventoried as part of the year 2005 emissions inventory as required by the EPA under the CERR. It also provides documentation as part of the development of a broader emissions inventory (which encompasses point, area, non-road mobile, on-road mobile, and biogenic sources) that is being developed for (SIP requirements for attainment with the 8-hour ozone and PM2.5 NAAQS and the regional haze regulations. For the purpose of developing state SIPs to demonstrate compliance with the ozone NAAQS, PM2.5 NAAQS and regional haze rule, states are currently required to submit base-year inventories, 3-year cycle update inventories, rate of progress inventories, and modeling inventories. In a November 18, 2002 memorandum – 2002 Base-year Emission
8

Inventory for SIP Planning Process, EPA identified year 2002 as the base-year for the SIP planning process. Within 3 years after designations are determined, states will need to submit SIP attainment demonstrations for the 8-hour ozone and PM2.5 NAAQS. The 2002 base-year inventory serves several purposes in supporting air quality modeling and control measure selection to determine the types and amount of emission reductions needed to meet reasonable further progress (RFP) and rate of progress (ROP) emission reduction targets and demonstrate attainment. Many of the emission inventory planning requirements can be found in the EPA document entitled: Emissions Inventory Guidance for Implementation of Ozone and Particulate Matter National Ambient Air Quality Standards (NAAQS) and Regional Haze Regulations. Subsequent to the submission of the 2002 inventory, there was considerable discussion by LADCO staff with states and the EPA as to the appropriateness of 2002 base-year inventory with respect to using a 2005 base-year inventory. At the time of the preparation of the year 2005 emissions inventory, these discussions were still ongoing between LADCO and EPA. EPA designated nonattainment areas for the 8-hour ozone NAAQS with an effective date of June 15, 2004, while nonattainment designations for the PM2.5 NAAQS were published in the Federal Register later on January 5, 2005, with an effective date of April 5, 2005. For those states participating in regional planning organizations, there are additional SIP inventory requirements for regional haze. The cascading effect of subsequent nonattainment designations as well as subsequent attainment demonstrations, existing emission reductions from NOx SIP calls, and the appropriateness of the base-years 2002 and 2005 were discussed by LADCO, EPA, and the states. The 2005 inventory was developed to fulfill both a base-year inventory and three-year cycle update inventories that are required by the existing CERR. The following chart shows the specific air pollutants that must be provided by the CERR and base-year inventories for the 8-hour ozone and PM2.5 NAAQS and regional haze regulations.
9

Required Air Pollutants Emissions
CO NH3 NOX
PbPM10-PRI
PM25-PRI SOX VOC
Consolidated Emissions Reporting Rule (CERR)
√ √ √ √ √ √ √ √
Ozone NAAQS √ √ √ PM2.5 NAAQS √ √ √ √ √ √ Regional haze √ √ √ √ √ In producing the 2005 emission inventory, multiple emission estimates must be provided to reflect temporal resolution that is required by the CERR and base-year inventories for the ozone and PM2.5 NAAQS. These requirements are summarized as follows:
Temporal Resolution Requirements for Inventories Statewide
Inventory Summer Weekday
Consolidated Emissions Reporting Rule (CERR)
Required
Ozone NAAQS Required Required PM2.5 NAAQS Required Optional Regional haze Required Optional Consequently, the statewide year 2005 emission estimates that are being provided reflect the annual and summer weekday for the referenced air pollutants. A list of the 30 area source categories appears on the following page. EPA requires specific data elements to be provided via electronic data transfer using the National Emission Inventory NEI-NIFV3.0 format. A description of data structures can be found in the EPA publication NEI Input Format (NIF) Version 3.0 User’s Guide Instructions and Conventions of Use, April 2003.
10

Summary of Area Sources and Respective Air Pollutants Inventoried for 2005 Inventory Seq #
Area Source Description SCCs SIC CO NH3 NOX
PM10-PRI
PM25-PRI SOX VOC
1 Crude oil production 2310010000 1311 √
2 Natural gas production 2310020000 1311 √
3 Breweries 2302070001 2082 √ 4 Cutback asphalts 2461021000 2951 √ 5 Distilleries 2302070010 2085 √
6 Emulsified asphalts 2461022000 2951 √
7 Aircraft refueling 2275900000 4581 √ 8 Commercial coal 2103002000 9999 √ √ √ √ √ √ √
9 Commercial distillate oil 2103004000 9999 √ √ √ √ √ √ √
10 Commercial kerosene 2103011005 9999 √ √ √ √ √ √ √
11 Commercial natural gas 2103006000 9999 √ √ √ √ √ √ √
12 Commercial residual oil 2103005000 9999 √ √ √ √ √ √ √
13 Gasoline marketing
2505030120, 2501060100, 2501060051, 2501060052, 2501060053, 2501060200 5541 √
14 Industrial coal 2102002000 3999 √ √ √ √ √ √ √
15 Industrial distillate oil 2102004000 3999 √ √ √ √ √ √ √
16 Industrial kerosene 2102011000 3999 √ √ √ √ √ √ √
11

17 Industrial natural gas 2102006000 3999 √ √ √ √ √ √ √
18 Industrial residual oil 2102005000 3999 √ √ √ √ √ √ √
19 Residential coal 2104001000 8811 √ √ √ √ √ √ √
20 Residential distillate oil 2104004000 8811 √ √ √ √ √ √ √
21 Residential kerosene 2104011000 8811 √ √ √ √ √ √ √
22 Residential natural gas 2104006000 8811 √ √ √ √ √ √ √
23 Residential propane 2199007000 8811 √ √ √ √ √ √
24 Municipal landfills 2620030000 4953 √ √ √ √ √ 25 Vessel ballasting 2505020900 4432 √
26 Vessel loading 2505020120, 2505020030,2505020150, 2505020180, 2505020090, 2505020060 4432 √
27 Remedial action 2660000000 9511 √ √ √ √ √
28 Traffic marking paints 2401008000 1611 √
29 Wineries 2302070005 2084 √ 30 Aviation stage I 2501080050 5541 √
12

Oil and Natural Gas Production The oil and gas production area source category represents those VOC emissions that result from the exploration, drilling, and the field processing of crude oil and natural gas. Fugitive VOC emissions occur from control valves, relief valves, spills, pipe fittings, pump seals and compressor seals in the production and field processing of crude oil and natural gas. Individual county crude oil and natural gas production data was obtained from the MDEQ, Geological and Land Management Division. VOC emission factors were derived from the EPA publication entitled: Revision of Evaporative Hydrocarbon Emission Factors (EPA – 450/3-76-039). The emission factors are 107 pounds of emitted VOC per thousand barrels of produced crude oil and 175 pounds of emitted VOC per million cubic feet of produced natural gas. For crude oil production, emission controls reflecting NESHAP application of a 45% reduction in VOC were considered. This control level was based on EPA determination of an overall 45% reduction in VOC from oil and natural gas production facilities. This control reduction was obtained from a 5/14/99 EPA fact sheet that was published with the Final Air Toxics Rules for Oil and Natural Gas Production Facilities and Natural Gas Transmission and Storage Facilities. Rule effectiveness of 80% was then applied, and point source deductions were performed to estimate the area source contribution. For natural gas, emission controls from Michigan air pollution control rule R336.1629 of 72% and the federal emission control reduction in VOC of 19% associated with NESHAP application to natural gas transmission and storage were applied. The 19% emission reduction was obtained from the 5/14/99 EPA fact sheet that was published with the Final Air Toxics Rules for Oil and Natural Gas Production Facilities and Natural Gas Transmission and Storage Facilities. The federal NESHAP rule became effective June 17, 1999. Area source emissions were then reported using Source Classification Codes (SCC) of 2310010000 for crude petroleum oil production and 2310020000 for natural gas production. Vessel Loading/Ballasting Evaporative VOC occur from Great Lakes ships when being loaded with gasoline and petrochemicals. Vapors are also displaced when cargo tanks are loaded with water for ballasting. In order to estimate VOC from vessel loading/ballasting activities, a list of marine terminals at Michigan based ports handling petroleum products was obtained from the MDOT. Because of the need to acquire information on gasoline and petrochemical handling at each Michigan port and the time frames during vessel loading/ballasting occurred, a survey form was again sent to the marine terminals that were previously surveyed in the 2002 inventory. This State survey approach went beyond the EPA’s prescribed inventory procedures in Volume III, Chapter 12 of the Emission Inventory Improvement Program January 2001 guidance for Marine Vessel Loading, Ballasting and Transit. The survey form requested information on days of operation, seasonal fuel transfer information on gasoline, distillate fuel oil, jet naphtha, jet kerosene, kerosene, residual fuel oil, and crude petroleum loading into ship and barge cargo tanks as well as ballast operations. The survey data was then summed to derive individual county totals. The results of this survey revealed that there were only
13

two fuel types (contaminated gasoline, and residual fuel oil) where loading had occurred. VOC emission factors (0.00009 lbs/1000 gallons of residual fuel oil and 3.4 lbs/1000 gallons of gasoline) were then applied to their respective fuel volumes to obtain the estimated emission losses. Although the EPA, on September 19, 1995, issued Federal Standards for Marine Tank Vessel Loading Operations and National Emission Standards for Hazardous Air Pollutants for Marine Vessel Loading Operations, the respective facilities transferring fuel were exempt from control requirements. Consequently, emissions estimates were based on the respective emission factors without the application of control measures. Individual county VOC emission estimates from loading and ballasting operations were reported using the following SCC codes:
Vessel Loading/Ballasting Operations
Reported SCC Code
Vessel loading, distillate fuel oil
2505020090
Vessel loading, gasoline 2505020120 Vessel loading, residual fuel oil
2505020060
Vessel loading, crude oil 2505020030 Vessel loading, naphtha 2505020150 Vessel loading, jet kerosene 2505020180 Vessel loading, kerosene 2505020180 Vessel ballasting, gasoline 2505020900 Vessel ballasting, crude oil 2505020900
Service Station Loading (Stage I) Gasoline vapor loss occurs at service stations when gasoline is unloaded from delivery tank trucks into underground storage tanks. The extent of vapor loss is dependent upon the method of filling (splash, submerge, or vapor balanced). In computing VOC emissions from service station loading, year 2005 gasoline throughput estimates were obtained from Energy Information Administration's Petroleum Marketing Monthly data. The monthly data was then summed to derive an estimated statewide gasoline total. County gasoline total estimates were then determined by apportioning the statewide gasoline by the percent of state gasoline sales occurring within each county. County gasoline sales data was obtained from the U.S. Department of Commerce, Bureau of Census, Michigan 1997 Economic Census, Retail Trade, Geographic Area Series. State gasoline throughput consumption was apportioned on a county basis using the following mathematical equation: Ct = St x Cs/Ss
14

Where: Ct = Estimated county gasoline consumption for year 2005 St = Statewide gasoline consumption for year 2005 Cs = County gasoline service station retail sales data Ss = State gasoline service station retail sales data VOC emission estimates were developed based upon the guidance provided in the EPA prescribed inventory procedures in Volume III, Chapter 11 of the Emission Inventory Improvement Program January 2001 guidance for Gasoline Marketing (Stage I and Stage II) and subsequent September 2002 Draft Summary of the Analysis of the Emissions Reported in the 1999 NEI for Stage I and Stage II Operations at Gasoline Service Stations. Year 2005 and summer weekday emission factors were developed based upon actual temperature, and RVP fuel volatility information for various regions of the State to reflect the applicable RVP control measures. Monthly temperature data was obtained for the year 2005 from the NOAA, National Climatic Center Local Climatological Data that was utilized in determining year and summer day temperatures for the Michigan Upper Peninsula and Michigan Lower Peninsula regions. Reid Vaporr Pressure (RVP) data for marketed gasoline during year 2005 was obtained from the Michigan Department of Agriculture, Motor Fuels Quality, Laboratory Division. VOC mission factors were then developed for splash fill, submerge fill, and vapor balanced gasoline dispensing facilities on a county basis which reflected the actual temperature and RVP of marketed gasoline products.
Year 2005 Temperature Summary
Lower UpperPeninsula Peninsula
Month MonthAvg of Day Avg of Day
Month Maximum MaximumDecember 33.5 24.8January 28.0 18.9February 33.8 29.5March 38.2 33.2April 59.7 53.8May 64.8 59.3June 82.4 77.1July 83.5 79.4August 81.8 77.1September 77.3 72.5October 62.1 55.7November 49.4 37.1
Year Avg 57.9 51.5Ozone Season Avg 74.9 69.9Summer Weekday Avg 82.6 77.9
Stage I loading emission factors were determined using the methodology specified in September 2002 Draft Summary of the Analysis of the Emissions Reported in the 1999 NEI for Stage I and Stage II Operations at Gasoline Service Stations. The following equation is presented: L = 12.46xSPM/T Where: L = Loading loss (uncontrolled), pounds per 1000 gal of liquid loaded S= A saturation factor where S= 0.6 for submerged loading with no vapor balance, S = 1.00 for submerge loading with vapor balance, and S = 1.45 = splash
15

loading no vapor balance P = True vapor pressure of liquid loaded, pounds per square inch absolute (psia) M = Molecular weight of vapors, pounds per pound-mole T = Temperature of bulk liquid in degrees F + 460 The quantity of county gasoline throughput that is splash filled, submerge filled, and vapor balanced was estimated on basis of past gasoline surveys, and the applicability of state regulations which require the installation of submerge fill or vapor balanced systems. These percentages were obtained from the year 1999 emissions inventory. The same county fractional percentages of splash filled, submerge filled, and vapor balanced were used in the year 2005 inventory for consistency with respect to prior emission inventory. The respective emission estimates were reported using the following SCC codes:
Michigan Gasoline Marketing Stage I Emission SCC Codes
Stage I Type SCC Submerge filled loading
2501060051
Splash filled loading
2501060052
Vapor balanced loading
2501060053
The EPA on December 19, 2003 issued final rule requirements for Stage I gasoline distribution in Standards of Performance for Bulk Gasoline Terminals and National Emission Standards for Gasoline Distribution Facilities (Bulk Gasoline Terminals and Pipeline Breakout Stations. These NESHAP requirements will be applied in point source inventories for bulk terminals.
16

17
Calculation of Stage I Emission Factors for Year 2005 Notes: Gasoline stage I temperatures based on available data as of 5/18/06. Reid vapor pressures were derived from Michigan Dept. of Agriculture analytical data which showed higher than expected averages due to the suspension of RVP restrictions during Hurricane Katrina. Ozone Summer Year 2005 Year 2005 Year 2005 Year 2005 Ozone Summer
Year 2005 Season Weekday Ozone Summer Ozone Summer
Year 2005 Season Weekday
Annual 4/1/05-9/30/05
6/1/05-8/31/05 Year 2005 Season Weekday Year Ozone Summer
Year 2005 Season Weekday Annual
4/1/05-9/30/05
6/1/02-8/31/02
Emission Emission Emission Annual 4/1/05-9/30/05
6/1/05-8/31/05 2005 Season Weekday Annual
4/1/05-9/30/05
6/1/05-8/31/05 Saturation RVP RVP RVP
Factor Factor Factor Temperature Temperature Temperature Annual RVP RVP True
Vapor True Vapor True Vapor Factor Molecular Molecular Molecular
Region lbs/1000
gal lbs/1000
gal lbs/1000
gal F F F RVP 4/1/05-9/30/05
6/1/05-8/31/05
Pressure P Pressure P Pressure P S Weight Weight Weight
Vapor Balance Gasoline Upper Peninsula 0.76 0.91 0.99 51.1 69.9 77.9 11.2 9.6 9.0 4.82 5.82 6.4 1 64.4 66.2 66.67 Lower Peninsula 0.86 1.00 1.07 57.9 74.9 82.6 11.2 9.6 9.0 5.58 6.5 7 1 64.4 66.2 66.67 SE Michigan 0.86 0.96 0.99 57.9 74.9 82.6 11.2 9.3 8.4 5.58 6.23 6.4 1 64.4 66.47 67.07 Submerge Fill Gasoline Upper Peninsula 4.54 5.44 5.93 51.1 69.9 77.9 11.2 9.6 9.0 4.82 5.82 6.4 0.6 64.4 66.2 66.67 Lower Peninsula 5.19 6.01 6.43 57.9 74.9 82.6 11.2 9.6 9.0 5.58 6.5 7 0.6 64.4 66.2 66.67 SE Michigan 5.19 5.79 5.91 57.9 74.9 82.6 11.2 9.3 8.4 5.58 6.23 6.4 0.6 64.4 66.47 67.07 Splash Fill Gasoline Upper Peninsula 10.97 13.14 14.33 51.1 69.9 77.9 11.2 9.6 9.0 4.82 5.82 6.4 1.45 64.4 66.2 66.67 Lower Peninsula 12.54 14.53 15.54 57.9 74.9 82.6 11.2 9.6 9.0 5.58 6.5 7 1.45 64.4 66.2 66.67 SE Michigan 12.54 13.99 14.29 57.9 74.9 82.6 11.2 9.3 8.4 5.58 6.23 6.4 1.45 64.4 66.47 67.07

18
Service Station Unloading/Vehicle Fueling (Stage II) Motor vehicle fueling at service stations results in evaporative loss of gasoline. VOC emissions are produced during displacement of vaporized hydrocarbons and spillage of gasoline during refueling. EPA guidance in Volume III, Chapter 11 of the Emission Inventory Improvement Program January 2001 guidance for Gasoline Marketing (Stage I and Stage II) recommends the MOBILE model be used to generate refueling (Stage II) emission factors for highway emission inventories. Additional procedures were presented in September 2002 Draft Summary of the Analysis of the Emissions Reported in the 1999 NEI for Stage I and Stage II Operations at Gasoline Service Stations. The MOBILE6 model was used to derive the Stage II emission factor by obtaining monthly emission factors in grams/VOC mile as well as fuel economy as miles per gallon and vehicle miles traveled mix for the different gasoline vehicle types (e.g., LDTV, LDGT, and HDGV). For each vehicle type, the monthly emission factor was multiplied by the fuel economy to obtain an emission factor in unit grams of VOC/gallon. grams VOC/gallon = Grams/mile x miles/gallon Stage II grams/gallon refueling emission factor rates were initially prepared by SEMCOG using MOBILE6.2 and then later adjusted for year 2005 state specific RVP and temperature data. The vehicle miles traveled (VMT) mix for each vehicle types was used to calculate a single weighted monthly emission factor. Summer and average annual emission factors were then developed for Southeast Michigan, the rest of the Lower Peninsula, and the Upper Peninsula. SEMCOG’s Stage II grams/gallon adjusted emission factors are presented below. It is noted that the Stage II emission rates for year 2005 were greater than year 2002 rates due to the marketing of RVP exempt fuels created by Hurricane Katrina disruption of refinery operations.
Year 2005 Refueling Emission Rates for State of Michigan Average Type and Geographical Area Grams/Gal
lon Summer (Average of monthly refueling emission rates for June, July & August, 2005)
Southeast Michigan (Livingston, Macomb, Monroe, Oakland, St. Clair, Washtenaw and Wayne counties)
2.71
Rest of Lower Peninsula (All counties in Lower Peninsula except the 7 Southeast Michigan counties)
3.04
Upper Peninsula (All counties in the Upper Peninsula) 2.85 Average Annual (Average of monthly refueling emission rates) Southeast Michigan (Livingston, Macomb, Monroe, Oakland, St. Clair, Washtenaw and Wayne counties)
2.94
Rest of Lower Peninsula (All counties in Lower Peninsula except the 7 Southeast Michigan counties)
3.05
Upper Peninsula (All counties in the Upper Peninsula) 2.94

19
All rates were initially calculated using MOBILE6.2 model, and then later adjusted for year 2005 RVP and temperature conditions. The respective SEMCOG grams VOC/gallon were then converted to lbs/1000 gallons. Lbs VOC/1000 gallons = Grams VOC/gallon x 1 lb/453 grams x 1000 gallons Year 2005 gasoline throughput estimates were obtained from Energy Information Administration's Petroleum Marketing Monthly data. The monthly data was then summed to derive an estimated statewide gasoline total. County gasoline total estimates were then determined by apportioning the statewide gasoline by the percent of state gasoline sales occurring within each county. County gasoline sales data was obtained from the U.S. Department of Commerce, Bureau of Census, Michigan 1997 Economic Census, Retail Trade, Geographic Area Series. Total county emissions estimates were based on the county gasoline volume by the corresponding refueling emission factor. Emission rates were reported using the SCC code 2501060100. Service Station Tank Breathing Pressure changes occur within underground storage tanks as a result of temperature differences that exist between gasoline vapor and the liquid phases. The exchange of vapor within the storage tank to the atmosphere is commonly described as tank breathing. Underground gasoline storage tank breathing losses were estimated by applying a 1.0 pound per thousand gallon throughput emission factor using procedures presented in EPA’s Volume III, Chapter 11 of the Emission Inventory Improvement Program January 2001 guidance for Gasoline Marketing (Stage I and Stage II) and September 2002 Draft Summary of the Analysis of the Emissions Reported in the 1999 NEI for Stage I and Stage II Operations at Gasoline Service Stations. Year 2005 county gasoline consumption estimates were obtained by apportionment of the statewide gasoline consumption based on the county percentage of state gasoline retail sales. Statewide gasoline consumption data was obtained from Energy Information Administration's Petroleum Marketing Monthly and county retail gasoline sales information was identified in the U.S. Department of Commerce, Bureau of Census, Michigan 1997 Economic Census, Retail Trade, Geographic Area Series. Emission estimates were reported using the SCC of 2501060200. Gasoline Tank Truck Transit Breathing losses from gasoline tank trucks occurs as a result of pressure changes within the containment vessel. The pressure change in the containment vessel is caused by temperature differences between the vapor and liquid phases as well as

20
agitation during transport. Gasoline tank trucks leak VOC vapors and liquids from gaskets, seals, and seams during transport. Because some gasoline is delivered to bulk plants rather than delivered directly to service stations from terminals, the amount of gasoline transferred in any area may exceed the total gasoline consumption, due to additional trips involved. Therefore, gasoline tank truck transit evaporation emissions were based on the total volume of gasoline transferred rather than county consumption level. The total gasoline transferred in a given county was obtained by taking the sum of both the service station volume delivery and the bulk plant gasoline transfer. The bulk plant gasoline transfer volume in a county was obtained from point source data. VOC emissions estimates were developed using the gasoline tank truck transit emission factors identified by EPA procedures presented in Volume III, Chapter 11 of the Emission Inventory Improvement Program January 2001 guidance for Gasoline Marketing (Stage I and Stage II) . In this document, VOC loss from gas filled tank truck emission factor was 0.005 lbs/1000 gallons while empty vapor-filled tank trucks were 0.055 lbs/1000 gallons. A single emission factor of 0.06 lbs/1000 gallons was derived by taking the sum of the two respective factors, and then applying this emission factor to the total transported gasoline volume. Further emission adjustments were then made to the respective emission totals to reflect those delivery vessels in those counties that are subject to Michigan Air Pollution Control Rule R 336.1627. A control efficiency of 76% was considered before subsequent application of an 80% rule effectiveness and 100% rule penetration factors for delivery vessels in those counties subject to R336.1627. Emission estimates were reported using the SCC of 2505030120. Aviation Fuel Stage I Loading Gasoline vapor loss occurs at airports when gasoline is unloaded from delivery tank trucks into underground storage tanks. Because of the need to temporally adjust aircraft refueling emissions for all respective fuel types within all Michigan counties, it was determined that local aviation fuel sales information could only be acquired by contacting each fuel distributor serving each airport. Because the fleet of the aircraft varies at each airport, the amount of fuel type consumed will likewise be dependent on the types of aircraft being serviced and not just based upon Landing-Take Offs (LTOs) alone. A list of those Michigan commercial and private airports where fuels are dispensed was obtained from the MDOT publication 2003 Michigan Airport Directory. A survey form was then mail to each airport operations manager. Total fuels sales information by fuel type(s) and season were obtained from either airport staff or assigned fixed base operators. This information was then summed for each Michigan county to provide an estimate of the total volumes of jet kerosene, jet naphtha, and aviation gasoline handled at each airport facility. Stage I loading VOC emission factors for jet kerosene and jet naphtha were determined using the following equation:

21
L = 12.46xSPM/T Where: L = Loading loss (uncontrolled), pounds per 1000 gal of liquid loaded S= A saturation factor where 1.45 = splash loading P = True vapor pressure of liquid loaded, pounds per square inch absolute (psia) M = Molecular weight of vapors, pounds per pound-mole T = Temperature of bulk liquid in degrees F + 460 For Stage I aviation gasoline VOC emissions, an emission factor was obtained the EPA publication entitled: Documentation for the 2002 Nonpoint Source National Emission Inventory for Criteria and Hazardous Air Pollutants (January 2004 Version). The resultant emission factors were then applied to the total county fuel throughput after considering point source fuel throughput deductions. Because EPA does not have itemized SCC codes by fuel type, VOC emissions were added together and reported using a SCC of 2501080050. Aircraft Refueling (Stage II) Aircraft refueling at airports results in the evaporative loss of aviation gasoline, jet kerosene, and jet naphtha. VOC emissions occur when vapor laden air in a partially empty fuel tank is displaced to the atmosphere during refueling. The quantity of the vapor being displaced is dependent upon the fuel temperature, fuel vapor pressure, aircraft fuel tank temperature, and the fuel dispensing rate. Because of the need to temporally adjust aircraft refueling emissions for each respective fuel type within each Michigan county, it was determined that local aviation fuel sales information could only be acquired by contacting each fuel distributor serving each airport. Because the fleet of the aircraft varies at each airport, the amount of fuel type consumed will likewise be dependent on the types of aircraft being serviced and not just based upon LTOs alone. A list of those Michigan commercial and private airports where fuels are dispensed was obtained from the MDOT publication 2003 Michigan Airport Directory. A survey form was then mailed to each airport operations manager. Total fuels sales information by fuel type(s) and season were obtained from either airport staff or assigned fixed base operators. This information was then summed for each Michigan county to provide the

22
total dispensed volumes of jet kerosene, jet naphtha, and aviation gasoline. VOC aviation refueling loss emission factors were obtained from the EPA publication Compilation of Air Pollutant Emission Factors, Volume 1: Stationary Point and Area Sources, 5th Edition and Supplements (AP-42) were then applied to the respective county total fuel volumes.
Aviation Fuel
Type
Emission Factor as lbs of VOC/1000 gallons fuel
Jet kerosene 0.08 Jet naphtha 5.58 Aviation gasoline
12.20
Because there is no provision currently to allow for the reporting of emissions by individual fuel type, emissions were then summed for all fuel types and reported using the SCC code 2275900000. Traffic Marking Coatings Traffic marking coatings are paints that are used to mark pavement, including dividing lines for traffic lanes, parking space markings, crosswalks, and arrows to direct traffic flow. VOC emissions result from the evaporation of organic solvents during the application and curing of the marking paint. VOC emissions were estimated for each county using the methodology identified in the EPA’s Volume III, Chapter 14 of the Emission Inventory Improvement Program May 1997 Final Guidance for Traffic Markings. The preferred method was to conduct surveys to determine the volume of water and solvent based coating consumption, coating formulation (in terms of pounds of VOC content per applied gallon), and months of year 2005 when the coatings were applied. Survey forms were mailed to all Michigan county road commissions, major municipality road maintenance departments, and to MDOT. In those situations where a county road commission failed to submit such information, emission estimates were based upon results of those counties that had responded to the survey. An average coating application rate (total gallons of coating applied per road miles in county) was first determined from survey respondents. Road length miles were obtained for the counties that failed to respond to the survey. Total coating gallon consumption estimates were estimated for counties that failed to respond by applying the road length miles to the average coating application rate. Similarly, an average VOC content (as lbs/gallon) was obtained by dividing the total mass of VOC emissions by the total coating volume of survey respondents. The result thereof was then applied to the estimated coating volumes for those counties that did not respond to the survey. This average density was reflective of the proportions of solvent and water based coatings by survey respondents. Seasonal coating application was also based

23
upon county survey results of the months during which the coatings were applied. It should be recognized that year 2002 was a recession year in which Michigan county and local governments had limited budgets. Consequently, it is likely that projected emissions would be greater during better economic times. Traffic marking paint emissions were reported using a SCC of 2401008000 Cutback Asphalts Cutback asphalt is a bituminous road coating material that is prepared by blending an asphalt cement tar with a petroleum distillate (such as naphtha, kerosene, or other fuel oils). Cutback asphalt is used as a pavement sealant, tack coat, pothole filler, and a bonding agent between layers of paving material. Evaporative loss of the solvent from bitumen cement occurs as the cutback asphalt cures on the road surface. The rate at which VOC emissions occur is dependent both upon the temperature of the applied road surface, and the type of solvent used in the formulation of the cutback asphalt material. Gasoline or naphtha is used as a diluent in the production of “rapid cure” cutback asphalts. Kerosene and other low volatility fuel oils are also used as diluents in the production of “medium cure” and “slow cure” cutback asphalts. VOC emissions were estimated for each county using the methodology identified in the EPA’s Volume III, Chapter 17 of the Emission Inventory Improvement Program January 2001 Final Guidance for Asphalt Paving. In this document, the preferred method was to conduct surveys to determine locally-specific information on cutback asphalt use on Michigan roads. In order to estimate VOC emissions from the application of cutback asphalt materials (rapid cure, medium cure, and slow cure), a survey was mailed to all Michigan county road commissions, major municipality road maintenance departments, and to MDOT. The survey requested information on:
1. The quantities of rapid cure, medium cure, and slow cure cutback asphalt materials that were applied during year 2005;
2. The type of petroleum distillate and volume that was used as a diluent in the
formulation of each cutback paving material; and
3. The months during which cutback asphalt materials were applied. The EPA has determined that evaporation occurs on about four months with 75 percent by weight of diluent evaporates in the first day for rapid cure materials while it takes about one week for 50 percent by weight of diluent to evaporate from medium cure cutback asphalt materials. Conservative estimates were made by assuming that all the diluent evaporates within the season during which it is applied.

24
VOC emission estimates were based on the amount of the petroleum based diluent that comprises the cutback asphalt material and then applying their respective solvent density. Emission estimates were reported using a SCC of 2461021000. Emulsified Asphalts Emulsified asphalts are a type of liquefied road surfacing material that is used in the same application as cutback asphalts. Instead of blending the asphalt material with a petroleum distillate like their cutback asphalt counterparts, emulsified asphalts use a blend of water with an emulsifier (soap). Emulsified asphalts either rely on water evaporation to cure (anionic-high float emulsions) or ionic bonding of the emulsion and the aggregate surface (cationic emulsions). In the EPA’s Volume III, Chapter 17 of the Emission Inventory Improvement Program January 2001 Final Guidance for Asphalt Paving., the preferred method is conduct a survey of emulsified asphalt application on Michigan roads. Survey forms were mailed to all Michigan county road commissions, major municipality road maintenance departments, and to MDOT. This form requested information on the quantities of asphalt materials (in pounds and barrels) applied to Michigan roadways and the months during which they were applied. Road length miles were also obtained for all Michigan counties. In those situations where a county road commission failed to submit such information, emission estimates were based upon results of those counties that had responded to the survey. An average application rate (total barrels of emulsified asphalts applied per road miles in county) was first determined from survey respondents. Total barrel consumption estimates were estimated for counties that failed to respond by applying the road length miles to the average emulsified asphalt application rate. VOC emissions were obtained by applying an EPA factor of 9.2 lbs VOC/barrel of applied asphalt. It was further assumed that all emissions occur during the season that the asphalt materials were applied and reported using a SCC of 2461022000. Breweries Breweries, microbreweries, brewpubs, and contract brewers emit VOC including ethanol, ethyl acetate, myrcene and other higher alcohols from various brewing processes. For the smaller brewers, VOC are lost by the fermentation, in brew kettles, hot wort, mash and lauter tuns, and through spent grain. Microbreweries and brewpubs typically produce beer for patron on-site consumption, although some may have limited keg distribution. These smaller microbreweries and brewpubs typically combine some processes, and canning/bottling operations typically do not exist since the beer is consumed on-site or stored in kegs. Various trade organization lists were obtained to identify brewers in the State of Michigan along with their beer production. Although there are some regional breweries, the vast majority are brewpubs and microbreweries. These facilities have very small to

25
insignificant volatile organic compound emissions. Emission estimates were based on a combined emission factor rate obtained from Compilation of Air Pollutant Emission Factors, Volume 1: Stationary Point and Area Sources, 5th Edition and Supplements (AP-42) of 3.0465 lbs VOC per 1000 barrels. Consequently, this small emission factor and Michigan beer production rates didn’t justify the need for a survey of such establishments. Emissions were estimated by establishment on the basis of trade reported production and applying the respective emission factor. A SCC of 2302070001 was used in reporting brewery emissions. Distilleries Distilleries include ethanol production facilities that are used in the production of gasohol motor fuels, grain alcohol for industrial purposes, and distilled spirits for personal consumption. These products are produced from the fermentation of aged mashed grains with distillation for the capture of desired alcohol based products. The fermentation products use yeast to convert grain sugars into ethanol, ethyl acetate, isomyl alcohol, isobutyl alcohol and carbon dioxide. Grains used in the process may include corn, rye, barley, and wheat. A more detailed description of distilleries and their emissions can be found in the EPA publication entitled: Compilation of Air Pollutant Emission Factors, Volume 1: Stationary Point and Area Sources, 5th Edition and Supplements (AP-42). During year 2005, there was only one ethanol production facility in operation. The Michigan Ethanol LLC - Caro, Michigan facility was already being reported as a point source. Consequently, the area source contribution from distilleries using SCC 2302070010 had zero emissions for all Michigan counties. A number of new ethanol plants were under construction, but did not operate in the 2005 inventory year. Wineries Wineries produce alcohol beverages from the fermentation of fruit juices. The major processes in vinification include fruit harvesting, crushing, pressing, fermentation, clarification, aging, finishing, and bottling. During this fermentation process of both red and white wines, primarily ethanol and smaller quantities of methyl alcohol, n-propyl alcohol, butyl alcohol, isoamyl alcohol, and acetaldehydes are produced along with carbon dioxide. This process involves the reaction of a yeast with glucose and fructose sugars to produce ethanol and carbon dioxide. The EPA emission factors are reflective of VOC evolved during fermentation in vinification. County estimates of wine production were based upon wine volume information of Michigan Department of Treasury tax receipt information supplied to the Michigan Grape and Wine Industry Council. A VOC emission factor was obtained from Compilation of Air Pollutant Emission Factors, Volume 1: Stationary Point and Area Sources, 5th Edition and Supplements (AP-42).of 4.6263 lbs VOC/ 1000 gallons This emission factor is a sum of ethyl alcohol, methyl alcohol, n-propyl alcohol, n-butyl

26
alcohol, sec-butyl alcohol, isobutyl alcohol, isoamyl alcohol and acetaldehyde for red wine from AP-42. Emission estimates were reported using a SCC of 230207005 Stationary Source Fossil Fuel Combustion The combustion of natural gas, propane-LPG, distillate fuel oil, kerosene, and residual fuel oil in small boilers, furnaces, heaters, and stoves are also a source of VOC, NOx, particulates, sulfur dioxide, and ammonia emissions. Because these sources are so numerous to be identified in point source inventories, this area source category attempts to provide a collective estimate of emissions from these smaller energy consumption sources by subtracting all fuel used by point sources from total fuel consumption. Procedures for the estimation of these smaller sources are presented in the EPA’s documents entitled:
1. Volume II, Chapter 2 of the Emission Inventory Improvement Program January 2001 Preferred and Alternate Methods for Estimating Air Emissions from Boilers.
2. Emission Inventory Improvement Program –April 6, 1999, Area Source Category
Abstract- Fuel Oil and Kerosene Combustion
3. Emission Inventory Improvement Program –April 6, 1999, Area Source Category Abstract-Natural Gas and LPG Combustion
4. Emission Inventory Improvement Program –April 6, 1999, Area Source Category
Abstract-Coal Combustion
5. Documentation for the Draft 1999 National Emissions Inventory (Version 3.0) for Criteria Air Pollutants and Ammonia
6. Hanke, B.H, manuscript prepared for U.S Environmental Protection Agency
entitled: A National Methodology and Emission Inventory for Residential Fuel Combustion
This documentation involves determination of total fuel consumption over an area with subsequent fuel deductions made for point source fuel consumption, and then applying emissions factors to estimate fuel emissions. Total fuel consumption information was based on data supplied from U.S. Department of Energy, EIA documents. This unaccounted fuel consumption was then apportioned to individual counties using U.S. Census Bureau information for the individual end use sector fuel types based upon LADCO states methodology. Area source fuel emissions were reported for the following residential, commercial/institutional, and industrial end use sectors. Since utility boilers are accounted as point sources, area source emissions are not reported for this end use sector.

27
Residential Boilers & Furnaces County emission estimates for the residential end use sector was based upon the consumption of natural gas, propane-LPG, distillate fuel oil, kerosene, and coal. This energy consumption information was obtained from U.S. Department of Energy, EIA data. Since the EIA merely provides statewide fuel consumption totals, county fuel consumption estimates were obtained by apportioning the fuel consumption based upon the number of year 2000 occupied household census counts using the given fuel. Emission estimates were calculated using the following mathematical equation: Cf = Ch/Sh x Sf Where Cf = Estimated county residential sector consumption of a given fuel type for year 2005 Ch = Number of year 2000 census occupied households in a given county that utilize a given fuel type Sh = Total number of year 2000 census occupied households statewide that utilize a given fuel type Sf = Total statewide residential sector consumption of a given fuel type
Michigan Residential Fuel Consumption Information Sources
Residential Fuel Type
U.S. Dept of Energy, EIA Data Sources
Natural gas Natural Gas Annual 2005, Michigan Table 48 Propane LPG Petroleum Marketing Annual, 2005, Table 49: Prime
Supplier Sales Volumes of Aviation Fuels, Propane and Residual Fuel Oil by PAD District and State
Distillate fuel oil Fuel Oil and Kerosene Sales 2005 Report, Table 19: Adjusted Sales for Residential Use: Distillate Fuel Oil and Kerosene, 2005
Kerosene Fuel Oil and Kerosene Sales 2005 Report, Table 18: Adjusted Sales of Kerosene by Energy Use
Coal EIA Annual Coal Report 2005, Table 26 U.S. Coal Consumption by End Use Sector, by Census Division and State 2005, 2004 (Thousand Short Tons)

28
Upon obtaining county residential fuel consumption estimates for the various fuel types in all Michigan counties Cf, emission estimates were obtained by applying an emission factor that is specific to that fuel type. These emission factors were obtained from various EPA publications.
Michigan Residential Fuel Emission Factors
Residential Fuel Type
Units
CO
NH3
NOx
PM10-PRI
PM25-
PRI
SO2
VOC
Natural gas Lbs/million cubic feet
40
0.49 94 7.6 7.6 0.6 5.5
Propane LPG
Lbs/1000 gal
3.2
13 0.68 0.68 0.1 0.5
Distillate fuel oil
Lbs/1000 gal
5.0
0.8 18 2.38 2.13 42.60 0.7
Kerosene Lbs/1000 gal
4.8
0.8 17.4 2.38 2.13 41.1 0.7
Coal Lbs/ton 275
0.000565 3.0 18.63 4.86 37.83 10
Sources of Emission Factors:
1. U.S. Environmental Protection Agency Documentation for the Draft 1999 National Emissions Inventory (Version 3.0) for Criteria Air Pollutants and Ammonia
2. Hanke, B.H, manuscript prepared for U.S Environmental Protection Agency
entitled: A National Methodology and Emission Inventory for Residential Fuel Combustion
3. U.S. Environmental Protection Agency. Final Report on Development and
Selection of Ammonia Emission Factors The resulting emission estimates were reported by individual fuel type using the following SCC codes.

29
Michigan Residential Combustion Emission SCC Codes
Residential Fuel Type
SCC
Natural gas 2104006000 Propane LPG 2199007000 Distillate fuel oil 2104004000 Kerosene 2104011000 Coal 2104001000
Commercial/Institutional Boilers and Furnaces Estimation of fuel combustion by the commercial/institutional sector was performed using an adaptation of a methodology presented in the U.S. Environmental Protection Agency publications:
1. Emission Inventory Improvement Program –April 6, 1999, Area Source Category Abstract- Fuel Oil and Kerosene Combustion
2. Emission Inventory Improvement Program –April 6, 1999, Area Source Category
Abstract-Natural Gas and LPG Combustion
3. Emission Inventory Improvement Program –April 6, 1999, Area Source Category Abstract-Coal Combustion
County emission estimates for the commercial/institutional end use sector were based upon the consumption of natural gas, residual fuel oil, distillate fuel oil, kerosene, and coal. This energy consumption information was obtained from U.S. Department of Energy, EIA data. Fuels were subtracted for point sources, and the net area fuel contribution was apportioned or allocated using procedures instructed by LADCO. This procedure involved statewide commercial/ institutional fuel apportionment to a county level using the commercial/institutional employment data as obtained from U.S. Department of Commerce, Bureau of Census publication entitled: County Business Patterns, Michigan: 2003 (CBP/03-24 issued September, 2005). County fuel estimates of individual fuel types were estimated using the following equation: Cf = Ce/Se x Sf Cf = Estimated county commercial/institutional sector consumption of a given fuel type Ce= Total county employment in the commercial/institutional sector Se= Statewide employment in commercial/institutional sector Sf= Statewide commercial/institutional sector consumption of a given fuel type

30
Because the Energy Information data includes diesel fuel totals within the distillate fuel oil total, these motor vehicle fuels were deducted to provide only an estimate of #1, #2, and #4 fuel oils.
Michigan Commercial/Institutional Fuel Consumption Information Sources
Fuel Type U.S. Dept of Energy, EIA Data Sources
Natural gas Natural Gas Annual 2005, Michigan Table 48 Residual fuel oil Fuel Oil and Kerosene Sales 2005 Report, Table 17:
Adjusted Sales of Residual Oil by Energy Use, 2004 and 2005
Distillate fuel oil Fuel Oil and Kerosene Sales 2005 Report, Table 20: Adjusted Sales for Commercial Use: Distillate Fuel Oil, Residual Fuel Oil and Kerosene 2005
Kerosene Fuel Oil and Kerosene Sales 2005 Report, Table 18: Adjusted Sales of Kerosene by Energy Use
Coal EIA Annual Coal Report 2005, Table 26 U.S. Coal Consumption by End Use Sector, by Census Division and State 2005, 2004 (Thousand Short Tons)
Upon obtaining county commercial/institutional fuel consumption estimates for the various fuel types in all Michigan counties Cf, emission estimates were obtained by applying an emission factor that is specific to that fuel type. These emission factors were obtained from various EPA publications.
Michigan Commercial/Institutional Fuel Emission Factors
Commercial/Institutional
Fuel Type
Units
CO
NH3
NOx
PM10-PRI
PM25-
PRI
SO2
VOC
Natural gas Lbs/million cubic feet
84 0.49 100 7.6 7.6 0.6 5.5
Residual fuel oil Lbs/1000 gal
5
0.80 55 9.07 3.37 194.05 1.13
Distillate fuel oil Lbs/1000 gal
5
0.80 20 2.38 2.13 53.96 0.34
Kerosene Lbs/1000 gal
5
0.80 18 2.38 2.13 41.1 0.713
Coal Lbs/ton 6
0.000565 7.5 6.0 2.2 36.86 0.05

31
Sources of Emission Factors:
1. LADCO state uniform adopted emission factors for commercial/institutional natural gas combustion
2. U.S. Environmental Protection Agency. FIRES database
3. U.S. Environmental Protection Agency. Compilation of Air Pollutant Emission
Factors, Volume 1: Stationary Point and Area Sources, 5th Edition and Supplements (AP-42)
4. U.S. Environmental Protection Agency. Final Report on Development and
Selection of Ammonia Emission Factors The resulting emission estimates were reported by individual fuel type using the following SCC codes.
Michigan Commercial/Institutional Combustion Emission SCC Codes
Fuel Type SCC Natural gas 2103006000 Residual fuel oil 2103005000 Distillate fuel oil 2103004000 Kerosene 2103011005 Coal 2103002000
Industrial Boilers and Furnaces Estimation of fuel combustion emissions of industrial boilers and furnaces was performed in similar manner as the commercial/institutional sector. Statewide industrial fuel consumption information was obtained from the U.S. Department of Energy, EIA publications. Point source deductions were made for each fuel type to obtain the area contribution which was then apportioned to the county level using LADCO prescribed procedures. County fuel consumption estimates of natural gas, residual fuel oil, distillate fuel oil, kerosene, and coal were based upon the following mathematical equation: Cf = Ce/Se x Sf

32
Cf = Estimated county industrial sector consumption of a given fuel type Ce= Total county employment in the industrial sector Se= Statewide employment in industrial sector Sf= Statewide industrial sector consumption of a given fuel type
Michigan Industrial Fuel Consumption Information Sources
Industrial Fuel Type
U.S. Dept of Energy, EIA Data Sources
Natural gas Natural Gas Annual 2005, Michigan Table 48 Residual fuel oil Fuel Oil and Kerosene Sales 2005 Report, Table 17:
Adjusted Sales of Residual Oil by Energy Use, 2004 and 2005
Distillate fuel oil Fuel Oil and Kerosene Sales 2005 Report, Table 21 Adjusted Sales for Industrial Use: Distillate Fuel Oil, Residual Fuel Oil, and Kerosene (#1, #2, and #4 fuel oils– excludes diesel oil)
Kerosene Fuel Oil and Kerosene Sales 2005 Report, , Table 18: Adjusted Sales of Kerosene by Energy Use
Coal EIA Annual Coal Report 2005, Table 26 U.S. Coal Consumption by End Use Sector, by Census Division and State 2005, 2004 (Thousand Short Tons)
County employment data was obtained from the U.S. Department of Commerce, Bureau of Census publication entitled: County Business Patterns, Michigan: 2003 (CBP/03-24 issued September, 2005). Upon obtaining county industrial fuel consumption estimates for the various fuel types in all Michigan counties Cf, emission estimates were obtained by applying an emission factor that is specific to that fuel type. These emission factors were generally based on the LADCO adopted emissions factors.

33
Michigan Industrial Fuel Emission Factors
Industrial Fuel Type
Units
CO
NH3
NOx
PM10-PRI
PM25-
PRI
SO2
VOC
Natural gas
Lbs/million cubic feet
84 3.2 100 7.6 7.6 0.6 5.5
Residual fuel oil
Lbs/1000 gal
5.0
0.8 55 7.17 4.67 157 0.28
Distillate fuel oil
Lbs/1000 gal
5.0
0.8 20 2.3 1.55 53.96 0.2
Kerosene Lbs/1000 gal
5.0
0.8 18 2.38 2.13 41.1 0.713
Coal Lbs/ton 6
0.00057 7.5 6.0 2.2 38 0.05
Sources of Emission Factors:
1. LADCO state uniform adopted emission factors for industrial natural gas, residual fuel oil, distillate fuel oil, and coal combustion
2. U.S. Environmental Protection Agency. FIRES database 3. U.S. Environmental Protection Agency. Compilation of Air Pollutant Emission
Factors, Volume 1: Stationary Point and Area Sources, 5th Edition and Supplements (AP-42)
4. U.S. Environmental Protection Agency. Final Report on Development and
Selection of Ammonia Emission Factors Emission estimates were reported using the following SCC codes:
Michigan Industrial Combustion Emission SCC Codes
Industrial Fuel Type
SCC
Natural gas 2102006000 Residual fuel oil 2102005000 Distillate fuel oil 2102004000 Kerosene 2102011000 Coal 2102002000

34
Remedial Action, Site Clean Up & Leaking Storage Tanks Evaporative VOC emissions occur during remediation and clean up at those sites of environmental contamination. Such remediation activities may include air stripping or sparging of a VOC from contaminated groundwater or incineration of a spoil material removed from a contaminated site. In some instances carbon adsorption may be required to reduce VOC emitted during air stripping or spraying operations. Estimation of VOC loss from remedial action activities was determined by summing the allowable emissions from permits to those parties that were engaged in such activities as provided by the MDEQ, Air Quality Division, Permit Section. Although site remediation activities are subject to NESHAPs, these requirements did not apply at the time of the year 2005 emissions inventory. Emissions were reported using a SCC of 2660000000. Municipal Waste Landfills A municipal solid waste landfill is defined as any facility that is regulated under Subtitle D of the Resource Conservation and Recovery Act (RCRA) which receives primarily household and/or commercial wastes. VOC are produced from municipal solid waste by: the volatilization of the waste material itself, the microbiological (anaerobic) putrefaction of organic waste materials that result in the formation of organic acids and alcohols that are vaporized, and the chemical reaction of one or more waste materials or chemical decomposition intermediate. The rate at which VOCs are emitted from a landfill is dependent upon the structural design of cells, the waste composition (physical/chemical properties), the moisture content of the waste, the amount of waste disposed, temperature, age of the landfill, the chemical reactivity of the waste, the microbiological toxicity of the waste, and the effectiveness of landfill gas collection systems. Where landfill gas is collected for use in boilers, internal combustion engines (reciprocating and turbines) or flared at the landfill site, there are additional air pollutants such as NOx, particulates (PM2.5 and PM10), and carbon monoxide produced from incomplete combustion. Estimation of VOC emissions from municipal landfills were based on the revised technical procedures presented in the EPA publication entitled: Volume III, Chapter 15 of the Emission Inventory Improvement Program January 2001 Revised Final Guidance for Landfills. In this publication, the preferred method for the estimation of area source emissions is to use the LandGem model or the equations from the Compilation of Air Pollutant Emission Factors, Volume 1: Stationary Point and Area Sources, 5th Edition and Supplements (AP-42) section on landfills. LandGem is a computer based model that uses the same equations as that of AP-42. The emissions calculation for the estimation of landfill gas requires site specific information including: landfill design capacity, accumulated waste totals from operation of the landfill, and existing control requirements from landfill gas collection systems. Landfills may be subject to either

35
new source performance standards (40 Code of Federal Regulations part 60 Subpart WWW) or emission guidelines (40 Code of Federal Regulations, part 60, Subpart Cc). Landfills are now also subject to NESHAPs which became effective on January 16, 2003. For those landfills that were not being reported in the point source inventory, area emission estimates were reported on the basis on LandGem model simulations using the SCC of 2620030000. These simulations reflected total waste receipts under the prior year 1999 inventory with addition made for waste receipts for years 2000-2005 as obtained from annual reports by the MDEQ, Waste and Hazardous Division Report of Solid Waste Landfilled in Michigan. For those landfills that operated landfill gas collection/combustion systems, emission estimates considered tables 2.4-3 and 2.4-5 of AP-42 with adjustments considered for a landfill gas methane collection efficiency of 75% of LandGem model predicted methane generation at a given landfill site.
Non-Methane Organic Compound Control Efficiencies for Landfill Gas Combustion from AP-42
Combustion Control
Device Typical Control Efficiency (%)
Boilers 98 Flares 99.2 Gas Turbines 94.4 IC Engine 97.2
Emission Rates for Secondary Compounds from Landfill Gas Combustion
(Based upon lbs/ Million Cubic Feet of Landfill Gas Combusted)
Combustion Control Device
NOX PM2.5-PRI
PM10-PRI
CO
Flare 40 17 17 750 IC Engine 250 48 48 470 Boiler 33 8.2 8.2 5.7 Gas Turbines 87 22 22 230
Architectural Surface Coating, 2005 Alternative method one was chosen from the guidance document Emission Inventory Improvement Program (EIIP), Volume III, Area Sources Preferred and Alternative Methods, Chapter 3: Architectural Surface Coating. Data was readily available for the use of per capita emission factors. MDEQ, Air Quality Division staff determined per capita usage factors by dividing the 2004 national total architectural surface quantities for solvent and water based coatings (U.S. Census Bureau MA325F, Paint and Allied Products) by the U.S. population for 2004 (U.S. Census Bureau, http://www.census.gov).

36
http://www.census.gov/industry/1/ma325f04.pdf
http://www.census.gov/popest/national/files/NST_EST2005_ALLDATA.csv Solvent-Based Paint Solvent-based paints produced and shipped in the U.S. in 2004, the most recent available year, were totaled (includes architectural lacquers and architectural coatings, n.s.k.). The resulting number was divided by the 2005 U.S. population to produce a per capita solvent-based paint usage factor of 0.5265 gallons per person. The resulting solvent paint use, in gallons per county, was multiplied by a VOC emission factor of 3.87 lb/gal, from Table 5-2 of the EIIP guidance, Volume III, Area Sources Preferred and Alternative Methods, Chapter 3: Architectural Surface Coating. This produced total VOC emissions from solvent-based paint. The VOC was then speciated for toxics, utilizing speciation factors from Table 5-4 from the EIIP guidance. Acetone, listed in the methodology prepared by the Great Lakes states, was removed because it is not a toxic. Water-Based Paint Water-based paints produced and shipped in the U.S. in 2004 were totaled. The resulting number was divided by the 2005 U.S. population to produce a per capita water-based paint usage factor of 2.2473 gallons per person. The resulting water-based paint use in gallons per county was multiplied by a VOC emission factor of 0.74 lb/gal, from Table 5-2 from the EIIP guidance, Volume III, Area Sources Preferred and Alternative Methods, Chapter 3: Architectural Surface Coating. This produced total VOC emissions from water-based paint. The VOC was speciated for toxics, utilizing speciation factors from Table 5-3 from the EIIP guidance. No point source deductions were performed, as none were needed for this category. Autobody Refinishing in Michigan, 2005 Alternate method 3 of the EIIP document, Volume III, Area Sources Preferred and Alternative Methods, Chapter 13: Auto Body Refinishing was followed by Michigan. National emissions for the category were allocated to the county level based on census data. 79,429.59 tons of VOC were estimated nationally for this category based on 1997, 1998 and 1999 data, as indicated within the GLC methodology. The estimate of national VOC emissions from autobody refinishing was divided by a 2005 national population estimate of 296,410,404 to produce a VOC emission factor of 0.54 lbs/person.

37
Area source estimations were adjusted by deducting point source VOC emissions. A seasonal adjustment factor of 1.0 was made for this category for the ozone season. The category of auto refinishing was considered to be uniform throughout the year, per Table 5.8.1 of the EPA document Procedures for the Preparation of Emission Inventories for Carbon Monoxide and Precursors of Ozone, Volume I: General Guidance for Stationary Sources. Ozone season daily emissions were calculated per the example on page 5-23 of this document. Ozone season throughput was also calculated. 5 activity days per week were selected, per Table 5.8.1. Annually, 260 days of operation were assumed. NOx and CO emissions were not calculated, as this category is not considered a source of NOx or CO. References 1. Emission Inventory Improvement Program, Volume 3, Chapter 13, Auto Body
Refinishing, January 2000. 2. Fire 6.23 database 3. U.S. Census Bureau, Population Division. 2006. Population Estimates Program.
Washington, DC 20233. 4. Annual County Business Patterns data are available through U.S. census at
http://www.census.gov/epcd/cbp/view/cbpview.html 5. Section 3.8 of Procedures for the Preparation of Emission Inventories for Carbon
Monoxide and Precursors of Ozone, Volume I (1991) Estimating Emissions from Consumer and Commercial Solvent Use The GLC methodology, a portion of which is included below, was based on the EIIP guidance document, Volume III, Area Sources Preferred and Alternative Methods, Chapter 5: Consumer and Commercial Solvent Use. Michigan used the EIIP and GLC guidance for the estimation of criteria and toxic pollutants for this category for 2005. Michigan chose to use the preferred method with per capita emission factors, adjusted for the federal VOC reduction rule as provided in Table 2 of the EIIP guidance.

38
SCCs The following SCCs were utilized by Michigan, per LADCO’s recommendations:
2460100000 personal care products
2460200000 household Products
2460400000 automotive aftermarket
2460600000 adhesives and sealants
2460800000 FIFRA-regulated products
2460500000 coatings and related products
2460900000 miscellaneous products
From GLC methodology: Overview All quotes and information contained within are from the source, Emission Inventory Improvement Program, Volume 3, Chapter 5, Consumer and Commercial Solvent Use, August 1996. The consumer and commercial solvent source category includes a wide array of products including personal care products, household cleaning products and household pesticides. However, all VOC emitting products used by businesses, institutions and numerous industrial manufacturing operations are also included. A detailed list of products included in this category can be found on page 5.2-3 of the 1996 EIIP document. The majority of VOCs introduced into the atmosphere from this category is a result of evaporation of the solvent contained in the product or from the propellant released during product use. Dry cleaning Area Source Emissions for Michigan, 2005 Standard Industrial Classification (SIC) 7215 (coin-operated dry cleaning establishments) was not considered for this inventory. The AQD’s dry cleaning staff in the Technical Programs Unit indicated that virtually all coin-operated dry cleaning machines in Michigan have been discontinued due to the large cost of keeping them supplied with perchloroethylene (per Elden Dickinson, AQD). SIC 7216 (dry cleaning establishments, excluding coin-operated facilities) was considered instead. Under the North American Industrial Classification System (NAICS), SIC 7216 is known as NAICS 812320.

39
To calculate 2002 VOC emissions, Michigan utilized alternative method two, per employee emission factor. 2003 county employment data was obtained from the U.S. Census Bureau’s document, 2003 Michigan County Business Patterns. 2005 data was not available, and was not expected for some time. Dry cleaning has a uniform seasonal adjustment factor (1.0), remaining constant during the ozone season, per EPA’s Procedures for the Preparation of Emission Inventories for Carbon Monoxide and Precursors of Ozone, Volume I: General Guidance for Stationary Sources. 2003 employment data, the latest from the U.S. Census Bureau’s County Business Patterns, was obtained for NAICS 812320, for each county where it was available. Where available, employment data for the broader category of NAICS 812 was also obtained. The next step was to determine a ratio between the number of employees under NAICS 812320, and the number of employees under NAICS 812. For counties that had employment numbers for NAICS 812, this ratio was used to estimate how many of the employees would fall under the code 812320. The next task was to develop an employment number for those counties where drycleaner employment numbers were not available from the County Business Patterns. Using population numbers for those counties where employment data was available, a per capita number of dry cleaning employees was calculated. As certain counties have no perchloroethylene drycleaners (per lists of perc dry cleaners from Randy Johnson, AQD), values of zero were entered for those counties. Reports from Michigan’s 2005 point source emission inventory (the latest complete inventory) were reviewed to determine if any counties had point source employment for SIC 7216 (NAICS 812320). Berrien, Ingham and Jackson (NAICS 8123) counties did have point sources under SIC 7216, and the number of employees at each source was obtained from the emission inventory. Each source’s employment number was subtracted from the appropriate county’s employment number. Once estimates of employment for SIC 7216 were available for each county, an emission factor for VOC of 1,800 lb/yr/employee was obtained from Table 4.5-1 of EIIP Vol. III, Chapter 4.

40
From EIIP
Subcategory Reactive VOC (lb/year/employee
)
Total Organics (lb/year/employee
) All solvents (total) 1,800 2,300 Halogenated Solvents PERC, TCA and CFC 113 Coin Operated Commercial/Industrial
980 52
1,200
Mineral Spirits and Other Unspecified Solvents
1,800 1,800
On a per-unit basis: 0.8 tons/facility-year (assumes that average coin-op facility has two dry cleaning units and each emits 0.4 tons of PERC per year). From AP-42 Commercial: 1.3 lb/year/person (all nonmethane VOC) Coin Operated: 0.4 lb/year/person (all nonmethane VOC) A rule for perchloroethylene dry cleaning air emissions became effective late 1996 (58FR49354. National Emission Standards for Hazardous Air Pollutants for Source Categories: Perchloro-ethylene Dry Cleaning Facilities. Final Rule. September 22, 1993.). EPA estimates the rule reduces perchloroethylene emissions from dry cleaning operations by 44%. Depending on the methodology used to estimate air emissions from perchloroethylene dry cleaning operations the effectiveness of this rule may need to be factored into the calculation. References: U.S. Census Bureau, 2003 Michigan County Business Patterns Emission Inventory Improvement Program Vol. III, Area Sources: Preferred and Alternative Methods, Chapter 4, Dry cleaning. May 1996. Elden Dickinson, Dry Cleaning Unit, Drinking Water and Radiological Protection Division, Michigan DEQ. Personal communication, 5/07/01. US EPA. Procedures for the Preparation of Emission Inventories for Carbon Monoxide and Precursors of Ozone, Volume I: General Guidance for Stationary Sources. May 1991. EPA –450/4-91-016.

41
Graphic Arts Criteria and Toxics, 2005 The EIIP area source guidance document, dated November 18, 1996, was followed. The EIIP preferred method was not utilized, as it required a survey of facilities. Alternative Method 1, ink sales emission factor method, was found to be not feasible for Michigan, as (during calculation of the 1999 inventory) point sources used more ink than the state proportion of national ink production was calculated to be. Per Alternative Method 2, the population of the inventory region was obtained from state data for 2005, and multiplied by the per capita emission factor provided in the EIIP guidance. This produced total uncontrolled emissions from all graphic arts facilities with less than 100 tons per year of VOC emissions, for the entire state. This method used a 1991 EPA emission factor of 0.00065 tons VOC per capita. Total uncontrolled VOC emissions from area source graphic arts facilities (those with less than 100 tons per year of VOC emissions) was then estimated for each county. This was done by obtaining uncontrolled VOC emissions from point sources with less than 100 tons per year of VOC, from the 2005 EI. SICs 2711, 2721, 2752 and 2754 (NAICS 51111, 511112, 323114, and 323111) were the SIC codes queried. This number was then subtracted from total uncontrolled emissions from graphic arts facilities, on a county by county basis. The remaining number is the area source VOC emissions per year. Solvent Cleaning 2005 (criteria) In this category, the use of solvents is broken into two broad classifications. The classifications are solvent cleaning (which is composed of cold cleaning and vapor/in-line cleaning), and solvent cleanup (predominantly wipe cleaning of external surfaces). EIIP Alternative Method Solvent Cleaning Equipment (both Cold Cleaners and Vapor/In-line Cleaners): Emission factors: EIIP Table 6.5-2 provides per capita and per employee emission factors, as reproduced below. Recommended Method for Solvent Cleaning Equipment Michigan chose to use the per employment factors available in Table 6.5-2 from Procedures for the Preparation of Emission Inventories for Carbon Monoxide and Precursors of Ozone: Volume I: General Guidance for Stationary Sources (EPA, 1991), for the 2005 emissions inventory. Employee data was obtained from the U.S. Bureau

42
of the Census document, County Business Patterns, Michigan: 2003, which was the most recent version at the time the category was estimated. Area source emissions were then determined by subtracting point source emissions from total emissions. When the result was a negative number, area source emissions were set to zero. The following SCCs, per email from Grant Hetherington, WI DNR on 9/19/05, were utilized for reporting the emissions to be consistent with the other LADCO states: 2415360000 - Auto Repair Services (SIC 75): Cold Cleaning 2415345000 - Miscellaneous Manufacturing (SIC 39): Cold Cleaning 2415245000 - Miscellaneous Manufacturing (SIC 39): Conveyerized Degreasing 241523000 - Electronic and Other Elec. (SIC 36): Conveyerized Degreasing

43
Table 6.5-2: Per Capita and Per Employee Solvent Cleaning Emission Factors (EPA, 1991)
Per Capita
Factor Per Employee Factor
(lb/yr/person) (lb/yr/person) Subcategory SIC Codes VOCs Organic
s VOCs Organic
s Solvent cleaning
25, 33-39, 417
4.3 7.2 87 144
(total) 423, 551, 552,
554-556, 753
Cold Cleaning Automobile Repair
417, 423, 551,
2.5 2.5 270 270
552, 554-556,
753 Manufacturing 25, 33-39 1.1 1.1 24 24 Vapor and In-Line Cleaning Electronics and 36 0.21 1.1 29 150 Electrical Other 25, 33-39,
417, 0.49 25 9.8 49
423, 551, 552,
554-556, 753
2005 point source employment data was obtained from MAERS. These values were then deducted from the total emissions estimated by using the per capita emission factor and 2005 Michigan county population data. References EPA. Procedures for the Preparation of Emission Inventories for Carbon Monoxide and Precursors of Ozone: Volume I: General Guidance for Stationary Sources (May 1991). EPA. STAPPA-ALAPCO-EPA Emission Inventory Improvement Program (EIIP). Volume III - Area Sources Preferred and Alternative Methods. Chapter 6, Solvent Cleaning. September 1997.

44
US Department of Commerce, Bureau of the Census. County Business Patterns, Michigan: 2003. September 2005. Industrial Surface Coatings, Toxics, 2005 The GLC methodology was followed by Michigan for estimating toxics for 2005. The GLC methodology is based on EIIP, Volume III, Area Sources Preferred and Alternative Methods, Chapter 8: Industrial Surface Coating. In most cases alternative method one, default per employee factors, were used, except for SCCs where the per employee-based emission factors yielded unrealistically high values of pollutants. The MDEQ, Air Quality Division staff believe that the point source employee deductions performed for each affected SCC (based on NAICS information from U.S. Census Bureau’s County Business Patterns, and the Air Quality Division’s point source inventory) do not account for all of the point source employees, resulting in the high values. For the SCCs 2401050000 (miscellaneous finished metal) and 2401070000 (motor vehicles), it was decided that per capita based emission estimates would be utilized instead of the per employment based methods which yielded large values of 486 million lbs VOC (935 tons per summer weekday) and 57 million lbs VOC, respectively. The per capita methods yielded more realistic numbers of 4.6 million and 10.9 million lbs VOC. For the SCC 2401020000 (furniture and fixtures), the employment based method resulted in an estimate of 31 million lbs (60 tons per summer weekday). The per capita method resulted in an estimate of 20 million lbs. As the estimates for 2401020000 appeared unrealistically large with either method, this category was omitted from the inventory. Total area source VOC emissions for industrial surface coating for 2005 were approximately 50 million lbs. From the GLC methodology:
Source Identification Searching through the Standard Industrial Classification Code List (SIC), the North American Industry Classification System (NAICS), through the Factor Information Retrieval System (FIRE 6.23) and table 8.5-1 of the Volume III Chapter 8 Industrial Surface Coating September 1997 publication of EPA, the following codes were identified for each of the fifteen industrial surface coating category.
Factory Finished Wood - A2401015000 SIC 2426-2429, 243-245, 2492, 2499 NAICS 321113, 321912, 32192, 321911, 321918, 33711, 321212, 321214, 321213, 321991, 321992, 33999, 333414, 321999, 321211

45
Wood Furniture - A2401020000 SIC 25 NAICS 337122, 337121, 337124, 337214, 33791, 337129, 337125, 337211, 33636, 339942, 337127, 337212, 337215, 33792, Metal Cans - A2401040000 SIC 3411 NAICS 332431 Misc Finished Metals - 240105000 SIC 34xx(exclude 341 and 3498) NAICS 332211, 332212, 332213, 332999, 332722, 332117, 332912, 332611, 332998, 332913, 332439, 33251, 332919, 332312, 322225, 332618, 332321, 332313, 33242, 332612, 332322, 332311, 339911, 333924, 332114, 332721, 332994, 334518, 332111, 332112, 33637, 332115, 332116, 332214, 332813, 339914, 339912, 332812, 332992, 332993, 332995, 332911 Machinery and Equipment - A2401055000 SIC 35 NAICS 333611, 333618, 333111, 332323, 333312, 333112, 33312, 333131, 336311, 333995 333132, 333921, 333922, 333923, 333924, 333513, 332997, 333514, 333511, 333515, 333516, 333992, 333518, 333292, 33321, 333291, 333293, 333294, 33322, 33241, 333295, 333911, 332991, 333912, 333411, 333993, 333612, 333994, 333613, 314999, 334418, 333996, 333997, 33271, 333999, 334119, 334518, 333512, 333991, 333412, 336391, 333415, 333913, Large Appliances - A240106000 SIC 363 NAICS 335221, 335222, 335224, 335211, 339999, 333414, 335212, 333298, 335228, Electronic and Other Electrical - 2401065000 SIC 36,123,357 NAICS 334111, 334112, 334113, 33422, 334418, 334613, 333992, 335129, 333311, 333313, 339942, 51222, 335311, 335313, 335312, 335991, 335314, 335999, 33511, 335931, 335932, 335121, 335122, 334613, 336321, 335129, 33431, 334612, 334419, 335911, 335912, 333319, 334411, 334412, 334414, 336322, 334415, 334416, 334417, 333618, 33429, 33421, Motor Vehicles - 240107000 SIC 3711

46
NAICS 33611, 336112, 33612, 336211 Other Transportation Coatings - 2401075000 SIC 37(not 3711,373) NAICS 336213, 336312, 336322, 33633, 33634, 33635, 336399, 336212, 336415, 336411, 336412, 54171, 332912, 336999, 336413, 333911, 333924, 33651, 336991, 336414, 336419, 336214, 336992 Marine Coatings - 240108000 SIC 373 NAICS 48839, 336611, 336612, 81149 Misc. Product Coatings Manufacturing - 240109000 SIC NAICS 339 Industrial High Performance Maintenance Coatings- 2401100000 SIC NAICS 811 Other Special Purpose Coatings - 2401200000 SIC NAICS VOC factors from Table 8.5-1 of the EIIP guidance were applied to employment estimates based on the U.S. Bureau of the Census document, County Business Patterns: Michigan, 2003, which was the most recent data available at the time the estimates were created. References EPA. STAPPA-ALAPCO-EPA Emission Inventory Improvement Program (EIIP). Volume III: Chapter 8 Industrial Surface Coating September 1997. U. S. Census web site http://www.census.gov/

47
Open Burning: Municipal Solid Waste, 2005 Criteria Pollutants For the category of open burning of municipal solid waste (MSW), EPA’s methodology from Appendix A of Documentation for the Final 2002 Nonpoint Sector (Feb 06 Version) National Emission Inventory for Criteria and Hazardous Air Pollutants was followed. The ratio of urban to rural population was obtained from 2000 U.S. Census data, per the EPA’s method, then multiplied by a 2005 U.S. Census Bureau estimate of the county population in Michigan to obtain an estimate of rural population in 2005. Per capita emission factors were used, after first excluding those counties where the population was greater than 80% urban under EPA’s presumption that open burning of MSW would not occur there. Outdoor Wood Boilers, 2005 criteria pollutant estimates The Wisconsin methodology distributed by Bart Sponseller was followed. Per that methodology, the MARAMA emission factor of 13.82 g/kg wood burned was used. An estimate of 11.68 cords/yr/unit in Michigan was obtained from Brian Brady, MDEQ Air Quality Division. Brian serves as the MDEQ, Air Quality Division’s outdoor wood boiler expert. Michigan estimated an average weighted density of 1.65 tons/cord of wood, based on information contained within Table 8 of the USDA survey report “Residential Fuelwood Consumption and Production in Michigan, 1992.” Per the Wisconsin methodology, it was assumed that 90% of outdoor wood boilers are used in rural areas and 10% are used in urban areas. To determine which counties were urban and which were rural, staff reviewed the list of counties, which are part of Michigan’s Consolidated Statistical Areas (metropolitan areas) and determined that the 22 affected counties should be considered as urban. Ten percent of the 29,568 Michigan outdoor wood boilers were apportioned to the urban counties by population. The remaining 90% of the outdoor wood boilers were apportioned to the 61 rural counties by population. Residential Wood Burning, 2005 Michigan utilized the EIIP methodology’s alternative method for estimating emissions from residential woodburning, by apportioning data from the U.S. Census Bureau and the EIA. Two options were available to estimate woodburning households per county.

48
• Housing Units with Wood Heat by County was determined by using 1990 U.S. Census Data, Database C90STF3C1, Summary Level State, for House Heating Fuel for Occupied Housing Units (http://venus.census.gov/cdrom/lookup). Although this data is for the 1990 year, it did provide a value for each county.
• Housing Units with Wood Heat by County was determined by using the U.S.
Census Bureau’s DP-4, Profile of Selected Housing Characteristics: 2000, Data Set: Census 2000 Summary File 3 (SF 3) for Michigan. This file provided a total value of households using wood heating. However, no breakdown was given by county.
The MDEQ, Air Quality Division staff used the 2000 number of total wood burning households in Michigan, and used the 1990 county proportions of the 1990 total to apportion the 2000 value to the county level. Then, based on county value for number of wood burning households, the value for state wood use in cords was apportioned to each county. The 2003 state wood use in cords data came from the US

49
MAP States Page, Table 8, Residential Energy Consumption Estimates, Selected Years 1960-2003, Michigan, from the U.S. Department of Energy, EIA:
http://www.eia.doe.gov/emeu/states/sep_use/res/use_res_mi.html Data for 2005 was not yet available. Once county wood use in cords was produced, the next step was to determine the wood weight in tons for each county. Wood weight was determined by estimating a weighted average wood weight of 1.65 tons per cord, from species and consumption data from Table 8 of the USDA report, “Residential Fuelwood Consumption and Production in Michigan, 1992.” Michigan did not have data available on the number of catalytic and non-catalytic woodstoves in Michigan, but did utilize 1993 survey data which showed the proportions of fireplaces to woodstoves by county in Michigan. This was used to apportion wood weight per county between wood stoves and fireplaces. SCCs and emission factors were selected for fireplaces – cordwood (2104008001), and woodstoves – general (2104008010). No ozone season activity was estimated, as staff felt it was unlikely that residents would utilize their fireplaces or wood stoves between June 1 and August 31 of each year. FIRE 6.23 (Factor Information Retrieval System Version 6.23) and Source Summary Database (SSD) list the following Area Mobile Source Codes (AMS): A2104008000: Total wood stoves and fireplaces A2104008001: (lb/ton dry wood burned): Fireplaces - general A2104008010: (mg/Mg dry wood burned): Wood stoves - general A2104008030: (lb/ton dry wood burned): Catalytic wood stoves - general A2104008050: (lb/ton dry wood burned): Non-catalytic wood stoves - general A2104008051: (lb/ton dry wood burned): Non-catalytic wood stoves -
conventional A2104008052: (lb/ton dry wood burned): Non-catalytic wood stoves - low emitting A2104008053: (lb/ton dry wood burned): Non-catalytic wood stoves - pellet fired Michigan selected AMS codes A2104008001 and A2104008010. These were the most appropriate codes, as data exists for the proportion of woodstoves to fireplaces per county in Michigan, but data was not available on numbers of catalytic or non-catalytic wood stoves. Emission factors for A2104008010 were converted from mg/Mg to lb/ton by multiplying by the conversion factor of 2.00E-06.

50
References 1. USEPA, “Factor Information Retrieval System Version 6.23”, U.S. Environmental
Protection Agency, 2000. 2. EPA, STAPPA, ALAPCO, Emission Inventory Improvement Program (EIIP), Volume
III, July 1997, Chapter 2. Structure Fires, 2005 Criteria Emissions The EIIP guidance from EIIP Volume III, Chapter 18: Structure Fires, was followed. The preferred method for estimating emissions was used, due to the availability of county level structure fire data for 2002. More recent data was not available; the fire statistics data, which was originally kept by the Michigan State Police Fire Marshall Division, is now kept by the Michigan Department of Labor and Economic Growth. DLEG staff were unable to locate more recent county level data on structure fires. The 2002 data was re-used from the 2002 area source submittal. However, it did not provide any detail on the extent of each structure fire, or indicate if the structure was residential or commercial. The default fuel loading factor provided in the EIIP guidance (1.15 tons of fuel per structure fire) was used. Emission factors for VOC, CO, and NOx were obtained from Table 18.4-1. Year 2009 Stationary Area Source Emission Inventory Projections: See Growing Stationary Non-EGU Point, Stationary Area, Locomotive, Shipping, and Aircraft Categories for the Years 2009 in the Non-EGU Point Sources section for reference and methodology for projecting the Stationary Area Source inventory. 5. Non-Road Mobile Non-Road Emissions Estimation exclusive of Locomotive, Shipping, and Aircraft Emissions Non-road emission estimates for 2005 and 2009 were obtained from the EPA’s National Mobile Inventory Model (NMIM). The model uses a database to store the information about individual counties, referred to as the NMIM County Database (NCD); the current version is NCD20051207.

51
Recent updates to the model were made by the EPA and can be found at: www.epa.gov/omswww/models/nonrdmdl/nonrdmdl2005/readme.htm, (NON-ROAD2005 Update Chronology). One of the updates included in this modeling was a correction in the NON-ROAD.EXE file that includes modifications for permeation. Changes were also made in the external files (15 files) to incorporate recommendations of SEMCOG and LADCO consultants regarding fuel data. Program files for emissions and population data were modified. These changes were made to improve the accuracy of the model estimates and to produce emission values that will be consistent with those that will be used for future ozone and fine particulate SIP demonstrations. The Non-road emissions estimates were prepared by Wisconsin for all LADCO States, including Michigan. Additional details on the procedures used to prepare these inventory products can be found in the “Regional Air Quality Analyses for Ozone, PM2.5, and Regional Haze: Technical Support Document” prepared by LADCO. 2005 Aircraft Emissions Estimation In order to estimate aircraft emissions, aircraft activity was obtained for Michigan airports. Historically this information was obtained from MDOT. However MDOT was unable to provide updated information for year 2005. In the absence of updated MDOT 2005 aircraft activity data, commercial aircraft and commercial air freight departure information by aircraft model type was obtained from FAA airport records. For determining airport LTO cycles, the Air Traffic Activity Data System (ATADS) air traffic count database of larger towered airports, Terminal Area Forecast (TAF) air traffic operations database of towered and non-towered airports, and G.C.R. & Associates airport activity data were used. Since ATADS provides aircraft operations for a limited number of the States’ airports, TAF aircraft operations estimates were considered where ATADS information was unavailable. G.C.R. & Associates, Inc. consultant data was used for the smaller airports of which FAA aircraft operations information was unavailable. The following information from the respective sources was considered in the development of emission estimates: 1. Commercial scheduled and non-scheduled aircraft air carrier activity and
commercial air freight activity by aircraft model types, 2. General aviation and air taxi annual local and itinerant operations for year
2005, 3. Military annual local and itinerant operations for year 2005. Due to need
to have aircraft operations information expressed as LTO cycles, the following assumptions were made:

52
a. For commercial aircraft and commercial air freight activity, the number of annual aircraft annual LTO cycles was assumed to be equal to the number of departures. The daily LTO cycle frequency was then obtained by dividing the yearly LTO cycles by 365.
b. For general aircraft annual local and itinerant airport operations, each
respective operations total was divided by two to obtain the corresponding year local and itinerant LTO cycles. The expected daily local and itinerant LTO cycles then were obtained by dividing these annual totals by 365.
c. For military annual local and itinerant operations, each respective
operations total was divided by two to obtain the corresponding year local and itinerant LTO cycles. The expected military daily local and itinerant LTO cycles then were obtained by dividing these annual totals by 365.
Airport LTO cycles were further categorized into commercial aircraft by plane and engine type, general aviation itinerant aircraft of unknown aircraft type, general aviation local aircraft of unknown aircraft type, and military aircraft. This was necessary in order to utilize the U.S. Department of Transportation, FAA EDMS 4.5 Emissions and Dispersion Modeling System. A description of this model can be found in the FAA publication entitled: Emissions and Dispersion Modeling System (EDMS) User Manual (September 2004). Commercial and air freight aircraft emission factors per LTO cycle were determined using EDMS 4.5 for each commercial aircraft type models where possible were used at each towered airport. Default commercial aircraft engine type, and EPA default time in mode values for takeoff, approach, and landing roll times were used in the EDMS 4.5 model simulations. For those aircraft types that could not be determined using the EDMS 4.5 emissions model, aircraft emission factors based upon EPA alternative fleet average procedures were then used to estimate their emissions. These included general aviation and air taxi itinerant aircraft of unknown aircraft type, general aviation local aircraft of unknown aircraft type, and military aircraft. Conversion from total hydrocarbons to VOC was performed and based upon the EPA guidance. Aircraft emissions were then obtained by adding emissions contributions from commercial, itinerant general, and local general aircraft, and were reported using the following SCC codes.

53
Michigan Aircraft Emission SCC Codes
Aircraft Type SCC
Military 2275001000 Commercial 2275020000 General Aviation 2275050000
2005 Locomotive and Shipping Emissions Estimation The 2005 non-road shipping and Locomotive emissions were prepared using the same techniques used for the 2002 emissions. These estimates are based on work and a follow-up report (Environ Report for LADCO, April 2004, 2002 Shipping Emissions Sources) completed by Environ to support LADCO’s efforts to prepare a 2002 Air Emissions Inventory. The report describes Environ efforts to develop a shipping 2002 air emissions estimates to support air quality modeling. The Environ report is too long to be included in this document, but it can be provided upon request or downloaded at: http://ladco.org/reports/rpo/MWRPOprojects/Emissions/Environ_Final_Report_non-road.pdf The estimate of 2005 locomotive and shipping emissions was made by LADCO in the same manner as the 2002 inventory described above. The 2005 estimates are part of LADCO’s base M inventory. Non-Road Mobile Source Emission Inventory Projections to 2009 The non-road source categories exclusive of locomotive, shipping, and aircraft were grown in the EPA Mobile source model NMIM. The locomotive, shipping, and aircraft non-NMIM source categories were grown using growth factors provided in the report (E.H. Pechan & Associates, Inc., Development of Growth and Control Factors for Lake Michigan Air Directors Consortium, Final Report, December 14, 2004) done by E.H. Pechan & Associates, Inc. for LADCO and available upon request. See Growing Stationary Non-EGU Point, Stationary Area, Locomotive, Shipping, and Aircraft Categories for the Years 2009 in the Non-EGU Point Sources section for references and methodology for projecting the Locomotive, Shipping and Aircraft emissions inventory.

54
6. On-Road Mobile For the 2005 base year, the emissions model CONCEPT was run by a LADCO contractor (Environ) using transportation data (e.g., VMT and vehicle speeds) supplied by the state (MDOT) and local planning agencies (SEMCOG) in the LADCO States and Minnesota for 24 networks. These data were first processed with T3 (Travel Demand Modeling [TDM] Transformation Tool) to provide input files for CONCEPT to calculate link specific, hourly emission estimates. CONCEPT was run with meteorological data for a July and January weekday, Saturday, and Sunday (July 15 – 17 and January 16 – 18). The mobile emissions derived from the SEMCOG network, which include all the Michigan nonattainment counties, are detailed in Appendix D. Similar to the base year modeling, CONCEPT was run using transportation data (e.g., VMT and vehicle speeds) supplied by the state and local planning agencies for 2009 and 2018. CONCEPT was only run with meteorological data for a weekday. The emissions for Saturday and Sunday were derived by using scaling factors based on the 2005 emissions. Additional details on the procedures used to prepare these inventory products can be found in the “Regional Air Quality Analyses for Ozone, PM2.5, and Regional Haze: Technical Support Document” prepared by LADCO. 7. Area Source Ammonia and Biogenic Emissions Ammonia Emissions LADCO estimated area source ammonia emissions for all member states, including Michigan. The CMU-based 2002 (Base K) ammonia emissions were projected to 2005 using growth factors from the Round 4 emissions modeling. These emissions were then adjusted by applying temporal factors by month based on the process-based ammonia emissions model. Biogenic Emissions A LADCO contractor (Alpine) provided an updated version of the CONCEPT/MEGAN4 (Model of Emissions of Gases and Aerosols from Nature) biogenics model, which was used to produce 2005 base year biogenic emission estimates. Model improvements included: (a) reduced model run times, (b) improved ability to run successive days, and (c) enhanced meteorological input processing5. Compared to the previous (EMS/BIOME) emissions, there is more regional isoprene using MEGAN compared to the BIOME estimates used for Base K. Also, with the

55
secondary organic aerosol updates to the CAMx air quality model, Base M includes emissions for monoterpenes and sesquiterpenes, which are pre-cursors of secondary PM2.5 organic carbon mass. Additional details on the procedures used to prepare these inventory products can be found in the “Regional Air Quality Analyses for Ozone, PM2.5, and Regional Haze: Technical Support Document” prepared by LADCO.

Appendix D
MOBILE EMISSIONS
USED FOR THE CONFORMITY BUDGET
SUPPORT DOCUMENTATION
FOR THE
FINE PARTICULATE SIP
January 2008
1

Southeast Michigan On-Road Mobile Source Emissions Inventory Developed for the 2008 PM2.5 State Implementation Plan Submittal
January 28, 2008
Prepared by the Southeast Michigan Council of Governments (SEMCOG) 535 Griswold, Suite 300 Detroit, MI 48226 (313) 961-4266
2

Table of Contents
I. Overview of On-Road Mobile Modeling Process..................................................... 3 II. Modeling Inputs and Assumptions .......................................................................... 3
A. Mobile6 Input Parameters.................................................................................. 3 B. Vehicle Miles of Travel (VMT) Estimation & Emissions Calculation ................... 6
III. Resulting On-Road Mobile Source Emissions Inventory ....................................... 14
List of Tables Table 1: Minimum and Maximum Daily Temperatures Used in Mobile6......................... 4 Table 2: Oxygenated Fuel Inputs Used in Mobile6......................................................... 5 Table 3: Age Distribution of Southeast Michigan Fleet................................................... 6 Table 4: Average Annual Daily Travel Adjustment Factors ............................................ 7 Table 5: HPMS Normalization Factors ........................................................................... 7 Table 6: VMT Seasonal Adjustment Factors .................................................................. 8 Table 7: Southeast Michigan VMT Vehicle Mix Factors for Typical Weekday................ 9 Table 8: Vehicle Class Conversion Process: FHWA to Mobile6................................... 11 Table 9: Time of Day & Directional Split Factors for Typical Weekday......................... 12 Table 10: 2002 On-Road Mobile Source Emissions..................................................... 14 Table 11: 2005 On-Road Mobile Source Emissions..................................................... 15 Table 12: 2009 On-Road Mobile Source Emissions..................................................... 15 Table 13: 2018 On-Road Mobile Source Emissions..................................................... 15
3

Southeast Michigan PM2.5 On-Road Mobile Source Emissions Inventory
Developed for the 2008 PM2.5 State Implementation Plan The Southeast Michigan Council of Governments (SEMCOG) is the Metropolitan Planning Organization (MPO) and lead local air quality planning agency for a seven-county region that comprises Southeast Michigan’s PM2.5 nonattainment area (Livingston, Macomb, Monroe, Oakland, Washtenaw, and Wayne counties). Under an agreement with the State of Michigan, SEMCOG is responsible for developing the on-road mobile source emissions inventories for this region. This document provides detailed information on the air quality emissions modeling process used by SEMCOG to develop the on-road mobile source emissions inventory for the Southeast Michigan PM2.5 State Implementation Plan (SIP). I. Overview of On-Road Mobile Modeling Process The general process for developing on-road mobile source emissions inventories involves applying emission factors to estimates of vehicle miles of travel (VMT) within the Southeast Michigan nonattainment area. The emission factors are generated by the U.S. Environmental Protection Agency’s (EPA) Mobile6 model. The VMT is estimated using SEMCOG’s Travel Demand Forecast Model. Actual emissions calculation is done using a post-processing model, developed by SEMCOG. The post-processor multiplies the travel model VMT by the appropriate Mobile6 emission to calculate link-level emissions of volatile organic compounds (VOC), carbon monoxide (CO), nitrogen oxides (NOx), fine particulate (PM2.5), sulfur dioxide (SO2), and ammonia (NH3). Emission inventories were developed for four different analysis years: 2002, 2005, 2009 and 2018. In keeping with EPA guidance on the preparation of annual inventories, the analysis involved the development of seasonal inventories that were then summed to create an annual inventory for each analysis year. II. Modeling Inputs and Assumptions The following paragraphs explain the various model inputs and assumptions used to create the emissions inventories. A. Mobile6.2 Input Parameters
As required by the U.S. Environmental Protection Agency (EPA), the inventory was developed using emission rates generated by EPA’s Mobile6.2 emission factor model. It also used the updated PM rate table for heavy-duty vehicles, which EPA released on March 17, 2006. This rate table corrects an over estimation of PM10 and PM2.5 heavy-duty vehicle emissions by the previous version of the model for years 2007 and beyond. The Mobile6.2 model allows for input of certain localized data in order to provide better emissions estimates for a given region. Six localized data inputs were used in SEMCOG’s analysis:
4

• Minimum & Maximum Daily Temperatures: Table 1 shows the temperatures used to simulate an average day in each of the four seasons. The values were derived from National Weather Service local climatological data reports, provided by the Michigan Department of Environmental Quality (MDEQ). 2002 values were calculated by averaging the monthly minimum and maximum temperatures between 2001 and 2003. Values for years 2005 through 2018, used the average monthly minimum and maximum temperatures observed between 2004 and 2006.
Table 1 Minimum and Maximum Daily Temperatures Used in Mobile6
Season Winter Spring Summer Fall
Analysis Year
Min Max Min Max Min Max Min Max
2002 22.8 35.6 38.1 56.8 62.5 81.9 44.6 61.8
2005-2018 22.3 35.2 39.8 58.7 62.8 81.7 45.1 62.6
• Reid Vapor Pressure (RVP): Mobile6 summer runs for years 2002 and 2005
used an RVP of 7.8 pounds per square inch (psi), which was the maximum level allowed by law in Southeast Michigan during the summer months until 2007. In 2007, a new law went into affect, requiring 7.0 psi vapor pressure gasoline between June 1st and September 15th of each year. Thus, an RVP of 7.0 was used for summer runs in years 2009 and 2018.
For the other three seasons, 2002 fuel sample data, obtained from the Michigan Department of Agriculture, were used to compute the average RVP for each season in each year. The averages were 12.3 psi for winter, 11.1 psi for spring, and 10.7 psi for fall. These values were used for all analysis years.
• Gasoline Sulfur Values: The 2002 values were derived from Alliance of
Automobile Manufacturers North American Fuel Survey data for Wayne County, Michigan. The summer value was 439 ppm. The value for the other three seasons was 424 ppm. As new gasoline sulfur standards should be phased-in by 2009 in Midwest states, the Mobile6 default value of 30 ppm was used for all seasons in years 2009 and 2018.
• Diesel Sulfur Values: As with gasoline, the 2002 diesel sulfur level was derived
from the 2002 Alliance of Automobile Manufacturers fuel survey. This value was 380 ppm. As data on seasonal variation was not available, the same value was used for all 2002 runs. For future years, the new diesel sulfur standard of 15 ppm, which begins phasing in during 2006, was used. A value of 106.3 was used for 2005, which was derived through linear interpolation of the 2002 and 2006 values.
5

• Oxygenated Fuels Inputs: In addition to providing the local gasoline sulfur values, the 2002 North American Fuel Survey data showed that approximately 25% of the fuel sold in Southeast Michigan contained an oxygenate. The vast majority of this oxygenate was ethanol. A small fraction was MTBE. The observed values from the fuel survey were used in SEMCOG’s 2002 base year modeling. For 2005 and all future years, SEMCOG assumed that oxygenate would continue to be present in 25% of the region’s gasoline. However, as use of MTBE was banned in Michigan in 2003, it was assumed that all of the oxygenate in these years would be ethanol. Table 6 shows the specific oxygenate inputs used in Mobile6.
Table 2 Oxygenated Fuel Inputs Used in Mobile6
Year Oxygenate % Market Share % Weight Ethanol 20.7 3.2 2002 MTBE 3.5 1.9 Ethanol 25.0 3.2 2005 -
2018 MTBE 0.0 0.0
• Age Distribution of Vehicle Fleet: Table 3 shows the vehicle fleet age distribution data used in Mobile6. The light-duty distribution was developed by the Lake Michigan Air Directors Consortium (LADCO), using 2004 vehicle registration data for Southeast Michigan. The heavy-duty distribution was developed from national data, using EPA guidance.
6

Table 3 Age Distribution of Southeast Michigan Fleet
Vehicle Class Vehicle Age
(Years) Light Duty
Vehicle Light Duty
Truck 1 Light Duty
Truck 2 Light Duty
Truck 3 Light Duty
Truck 4 Heavy Duty
Truck Heavy
Duty Bus Motorcycle
1 0.0919 0.1267 0.1563 0.1325 0.1375 0.031 0.029 0.017 2 0.1225 0.1689 0.2084 0.1767 0.1833 0.082 0.078 0.098 3 0.1262 0.1740 0.2147 0.1820 0.1888 0.068 0.065 0.088 4 0.0866 0.0421 0.1114 0.0940 0.1255 0.077 0.074 0.071 5 0.0438 0.0207 0.0500 0.0383 0.0567 0.065 0.062 0.072 6 0.0452 0.0155 0.0455 0.0500 0.0757 0.082 0.097 0.063 7 0.0359 0.0166 0.0370 0.0256 0.0429 0.062 0.069 0.052 8 0.0345 0.0123 0.0278 0.0233 0.0351 0.047 0.059 0.040 9 0.0337 0.0210 0.0225 0.0228 0.0256 0.037 0.044 0.027 10 0.0419 0.0260 0.0217 0.0300 0.0252 0.036 0.046 0.020 11 0.0401 0.0391 0.0213 0.0296 0.0289 0.042 0.051 0.020 12 0.0409 0.0357 0.0204 0.0248 0.0087 0.048 0.053 0.432 13 0.0390 0.0290 0.0160 0.0227 0.0115 0.045 0.048 0.000 14 0.0374 0.0435 0.0112 0.0175 0.0041 0.041 0.046 0.000 15 0.0351 0.0390 0.0080 0.0208 0.0069 0.038 0.042 0.000 16 0.0338 0.0426 0.0075 0.0228 0.0045 0.031 0.034 0.000 17 0.0270 0.0322 0.0084 0.0179 0.0050 0.026 0.028 0.000 18 0.0194 0.0354 0.0022 0.0140 0.0037 0.014 0.013 0.000 19 0.0174 0.0279 0.0026 0.0132 0.0071 0.010 0.011 0.000 20 0.0133 0.0201 0.0019 0.0101 0.0056 0.010 0.010 0.000 21 0.0094 0.0115 0.0018 0.0075 0.0028 0.010 0.007 0.000 22 0.0049 0.0054 0.0011 0.0040 0.0016 0.018 0.008 0.000 23 0.0027 0.0041 0.0005 0.0021 0.0007 0.017 0.007 0.000 24 0.0026 0.0030 0.0004 0.0012 0.0002 0.014 0.005 0.000
25+ 0.0148 0.0078 0.0016 0.0168 0.0125 0.049 0.015 0.000 B. Vehicle Miles of Travel (VMT) Estimation & Emissions Calculation
• Demographic Data: Travel forecasts used in the conformity analysis are based on demographic data from SEMCOG’s 2030 Regional Development Forecast (RDF), which was published in 2001.
• Description of SEMCOG’s travel forecasting model: VMT forecasts for the conformity analysis were developed using SEMCOG’s TransCAD travel forecasting model (version E4-enhanced). A more detailed description of the model is available from SEMCOG upon request.
7

• HPMS Normalization Factors: EPA and FHWA guidance stipulates that VMT used to construct mobile source emissions inventories be consistent with that reported through the Highway Performance Monitoring System (HPMS), In accordance with this guidance, SEMCOG developed factors to normalize the TransCAD travel model VMT to the Michigan Department of Transportation (MDOT) HPMS VMT. The factors were developed in a four-step process: 1. 2002 HPMS universe data, aggregated by county and functional class, were
obtained from MDOT. 2. 2002 average weekday TransCAD model VMT were also aggregated by
county and functional class. 3. TransCAD VMT was converted to average annual daily VMT (AADVMT)
using day-of-week adjustment factors from MDOT’s publication Seasonal Analysis of Michigan’s Permanent Traffic Recorder (PTR) Data For 2001, 2002, 2003.
4. Normalization factors for each county and functional class were computed by dividing the HPMS VMT by the corresponding TransCAD AADVMT.
The daily adjustment factors used in step 3, along with the resulting normalization factors, are provided in tables 4 and 5. These factors were applied to all travel model VMT, in both current and future years, prior to calculating vehicle emissions.
Table 4 Average Annual Daily Travel Adjustment Factors
Area Type1 Urban Urban Area Limit Rural
AADT Adj. Factor 0.8597 0.9214 1.0209
1 Urban includes the city of Detroit; Urban Area Limit includes Macomb, Oakland and Wayne counties (excluding Detroit); Rural includes Livingston, Monroe, St. Clair and Washtenaw counties.
Table 5 HPMS Normalization Factors
County Freeway Principal Arterial
Minor Arterial Collector
Livingston 0.688099 1.585526 1.015991 0.535365 Macomb 1.040133 1.204916 1.136826 0.855788 Monroe 0.855686 1.007290 1.093279 0.689459 Oakland 1.074974 1.043694 1.009170 0.697480 St. Clair 0.867815 1.066117 1.363675 1.033534 Washtenaw 0.829980 0.930350 0.900897 0.793497 Wayne
Detroit 1.137798 1.184245 1.372235 1.784939 Outer-Wayne 1.061630 1.344744 1.280373 1.665449
8

• VMT Seasonal Adjustment: Once the travel model VMT had been normalized to HPMS data, seasonal adjustment factors were applied to generate average daily VMT for each of the four seasons. The factors are shown in Table 6 below. They were developed using data from the MDOT report Seasonal Analysis of Michigan’s Permanent Traffic Recorder (PTR) Data for 2001, 2002, 2003.
Table 6 VMT Seasonal Adjustment Factors
Season Area Type1
Winter Summer Spring Fall Urban 0.9417 1.0384 1.0080 1.0172 Urban Area Limit 0.9491 1.0095 1.0528 0.9940 Rural 0.8685 1.1682 0.9737 1.0357
1 Urban include the city of Detroit; Urban Area Limit includes Macomb. Oakland and Wayne counties (excluding Detroit); Rural includes Livingston, Monroe, St. Clair and Washtenaw counties.
• VMT Distribution by Vehicle Class: SEMCOG’s emissions post-processor apportions each roadway link’s hourly VMT among the eight different vehicle classes contained in the Mobile6 default “descriptive” emissions rate tables. This is done by multiplying the hourly VMT by the appropriate vehicle mix factors, listed in Table 7. The factors were developed using vehicle classification count data for Southeast Michigan. Freeway factors were computed from year 2000 MDOT PTR data. Arterial factors were developed from 1999 and 2000 screen line traffic counts taken by SEMCOG. The conversion of traffic count data from the standard 13 FHWA bins to the eight vehicle classes in Mobile6 was done using vehicle sales and mileage accumulation data from EPA’s technical memorandum: Fleet Characterization Data for Mobile61. Table 8 shows this apportionment.
9

Table 7 Southeast Michigan VMT Vehicle Mix Factors for Typical Weekday - Freeways
Vehicle Type Hour LDGV LDDV LDGT LDGT LDDT HDGV HDDV MC Total Road
Type 1&2 3&4 1 46.05 0.34 26.37 9.36 0.25 5.38 12.25 0.00 100.002 43.18 0.32 24.47 8.68 0.23 7.05 16.07 0.00 100.003 39.97 0.30 24.63 8.74 0.23 7.66 17.46 0.00 98.994 37.94 0.28 24.76 8.79 0.23 8.54 19.46 0.00 100.005 40.14 0.30 26.98 9.58 0.26 7.17 16.33 0.00 100.766 44.87 0.33 30.45 10.82 0.29 4.04 9.21 0.00 100.007 45.71 0.34 30.83 10.95 0.29 3.36 7.65 0.87 100.008 49.01 0.36 28.31 10.05 0.26 3.39 7.73 0.87 99.999 46.39 0.34 26.67 9.47 0.25 4.88 11.12 0.87 100.00
10 41.91 0.31 26.50 9.40 0.25 6.37 14.51 0.87 100.1311 40.56 0.30 25.94 9.21 0.24 6.98 15.90 0.87 100.0012 40.56 0.30 25.94 9.21 0.24 7.02 15.99 0.87 100.1313 41.15 0.30 26.06 9.25 0.24 6.75 15.38 0.87 100.0014 41.83 0.31 26.93 9.56 0.25 6.44 14.68 0.87 100.8715 42.50 0.31 27.89 9.91 0.27 5.57 12.68 0.87 100.0116 43.85 0.32 29.18 10.37 0.27 4.65 10.60 0.87 100.1317 46.39 0.34 28.69 10.18 0.27 3.74 8.51 0.87 99.0018 48.42 0.36 28.11 9.98 0.26 3.39 7.73 0.87 99.1219 48.42 0.36 28.11 9.98 0.26 3.39 7.73 0.87 99.1220 47.74 0.35 27.87 9.89 0.26 3.97 9.04 0.87 99.9921 48.33 0.36 28.08 9.97 0.26 3.70 8.43 0.87 99.9922 48.33 0.36 27.99 9.93 0.26 3.70 8.43 0.00 98.9923 48.25 0.36 27.87 9.89 0.26 4.08 9.30 0.00 99.99
Free
way
24 47.40 0.35 27.39 9.72 0.25 4.77 10.86 0.00 100.74
10

Table 7 continued Southeast Michigan VMT Vehicle Mix Factors for Typical Weekday - Arterials
Vehicle Type LDGV LDDV LDGT LDGT LDDT HDGV HDDV MC Total Road
Type
Hour
1&2 3&4 1 53.71 0.40 29.24 10.38 0.27 1.53 3.48 1.00 100.002 53.04 0.39 29.51 10.47 0.28 1.57 3.58 1.15 100.003 51.58 0.38 29.97 10.64 0.27 1.88 4.28 1.15 100.154 50.23 0.37 30.97 10.99 0.29 1.88 4.28 1.00 100.005 49.08 0.36 31.08 11.04 0.29 2.18 4.97 1.00 100.016 47.42 0.35 31.45 11.17 0.29 2.53 5.77 1.00 100.007 47.63 0.35 30.57 10.86 0.29 3.05 6.95 1.00 100.708 47.94 0.35 28.59 10.15 0.26 3.61 8.23 1.00 100.159 46.59 0.34 28.12 9.98 0.26 3.97 9.04 1.00 99.3010 45.70 0.34 29.29 10.39 0.28 4.01 9.14 1.00 100.1611 45.70 0.34 29.79 10.58 0.28 3.75 8.55 1.00 100.0112 46.28 0.34 29.49 10.46 0.28 3.71 8.45 1.00 100.0013 46.95 0.35 28.99 10.29 0.27 3.71 8.45 1.00 100.0014 46.95 0.35 28.99 10.29 0.27 3.66 8.34 1.00 99.8515 47.16 0.35 28.95 10.27 0.27 3.61 8.23 1.00 99.8516 47.16 0.35 29.06 10.31 0.27 3.87 8.82 1.00 100.8517 47.84 0.35 28.67 10.18 0.26 3.82 8.71 1.00 100.8418 48.72 0.36 28.13 9.98 0.26 3.52 8.02 1.00 100.0019 49.87 0.37 28.64 10.17 0.27 2.91 6.63 1.00 99.8520 51.11 0.38 29.07 10.32 0.27 2.39 5.45 1.15 100.1521 52.26 0.39 29.47 10.46 0.28 2.09 4.76 1.00 100.6922 53.14 0.39 28.93 10.27 0.27 1.83 4.17 1.00 100.0023 53.82 0.40 29.17 10.35 0.27 1.53 3.48 1.00 100.00
Arte
rial
24 54.60 0.40 29.44 10.45 0.27 1.22 2.78 0.85 100.00
11

Table 8 Vehicle Class Conversion Process: FHWA to Mobile6
FHWA Class
(Count Bin)
General Vehicle Class
Mobile6 Vehicle Class
ProportionAssigned
to M6 ClassBin 1 Motorcycle Motorcycle 100.0
Light Duty Gas Vehicle 67.6Light Duty Diesel Vehicle 0.5Light Duty Gas Truck 1&2 23.4Light Duty Gas Truck 3&4 8.3
Bin 2 Light Duty Vehicle
Light Duty Diesel Truck 0.2Light Duty Gas Truck 1&2 73.2Light Duty Gas Truck 3&4 26.0
Bin 3 Light Duty Truck
Light Duty Diesel Truck 0.8Heavy Duty Gas Truck 30.5Bins 4-13 Heavy Duty Heavy Duty Diesel Truck 69.5
• Time of Day and Directional Split Apportioning: SEMCOG’s emission estimation process is designed to capture the temporal variation in emissions. This is accomplished through the application of hour-of-day (K) and directional split (D) factors, developed from 1985 traffic survey data2. Table 9 provides both the hourly distribution and directional split factors, by functional class.. The factors are applied at the link level. Thus, the daily VMT for each two-way link is divided into 48 separate values (24 hours x 2 directions for each hour). In the case of one-way links/streets, only the hourly factors are applied, creating 24 hourly VMT values per link.
12

Table 9 Time of Day & Directional Split Factors for Typical Weekday
Time of Day Volume Factors
Directional Split Factors Hour Ending
Freeways Arterials Freeways Arterials
1:00 a.m. 0.015 0.014 0.59 0.60
2:00 0.009 0.007 0.58 0.59
3:00 0.007 0.005 0.58 0.60
4:00 0.006 0.003 0.56 0.58
5:00 0.009 0.004 0.59 0.61
6:00 0.022 0.012 0.62 0.67
7:00 0.051 0.031 0.64 0.67
8:00 0.075 0.056 0.61 0.65
9:00 0.064 0.058 0.58 0.60
10:00 0.052 0.048 0.56 0.57
11:00 0.049 0.050 0.54 0.55
12:00 0.051 0.057 0.53 0.54
1:00 p.m. 0.051 0.062 0.53 0.54
2:00 0.052 0.060 0.53 0.54
3:00 0.060 0.065 0.53 0.54
4:00 0.073 0.076 0.55 0.56
5:00 0.079 0.081 0.58 0.58
6:00 0.077 0.079 0.57 0.58
7:00 0.054 0.061 0.56 0.56
8:00 0.038 0.048 0.54 0.55
9:00 0.031 0.040 0.55 0.56
10:00 0.030 0.035 0.55 0.57
11:00 0.026 0.026 0.55 0.61
12:00 0.021 0.021 0.55 0.57 Source: Survey of Regional Traffic Volume Patterns in Southeast Michigan, SEMCOG, September 1985.
13

• Travel Speed Estimation: Because of recognized limitations with speeds generated from most travel demand models, SEMCOG’s emissions estimation process does not use link speeds from TransCAD. Instead a post-processing equation is used, based on research conducted by Richard Dowling and Alexander Skabardonis in the early 1990’s3. Their findings, along with speed data collected by SEMCOG in 19924, were used to develop the following speed equation5: Avg. Link Speed = Avg. Queue Speed * (Avg. Queue Length/Length) +
Uncongested Speed * (1 – (Avg. Queue Length/Length))
where: Uncongested Speed = 1.24 * Survey Speed(fc,h)/(1 + (V/Ci)11) fc = functional class h = hour of day Avg. Queue Speed = capacity/lane * 25 ft./vehicle Avg. Queue Length = average Queue * 25 ft./vehicle Avg. Queue = (Q1 + Q2)/2 Q1 = queue at start of time slice Q2 = queue at end of time slice = Q1 + (1-hour traffic/lane – 1-hour
capacity/lane)
Separate link speeds are calculated for each hour of the day and direction of travel (48 speeds for each two-way link, 24 speeds for each one-way link).
• Local VMT Estimation and Emissions Calculation: Because SEMCOG’s travel model does not include local (residential) streets, the emissions post-processor uses gross level local road VMT data from MDOT’s HPMS to calculate base-year local road emissions. This VMT is allocated among the different vehicle classes using the vehicle mix distribution for arterials during the noon hour (see Table 4 of Appendix G). A single set of local road emission factors, based on the Mobile6.2 default speed of 12.9 mph, is applied to the local VMT (for each vehicle class) to calculate emissions. This process can be expressed as follows: LRE = ∑cv Local VMTc * %VMTv * EFv
where: LRE = local road emissions %VMT = % VMT occurring on an urban arterial at noon hour c = county v = vehicle class EF = emission factor for local road at 12.9 mph
• Emissions from Freeway and Arterial Travel: As noted above, SEMCOG’s post-processing model (EMIS_FC_M6PM) follows EPA’s Quality Review Guidelines for 1990 Base Year Inventories. However, the program does not use the approach of assigning one emission factor for each vehicle type and road type, at a single speed. Instead emissions are calculated at the link level, based on the directional speed and VMT for each hour, on each link. The process can
14

be expressed by the following equation:
Ea-b = ∑k,d,v VMTa-b (in hour k, direction d) * EFfc,s,v * %VMTfc,v
where: Ea-b = emissions for link a-b k = hour of day d = direction of travel v = vehicle class EF = emissions factor fc = functional class/facility type s = average link speed in hour k, direction d
• Daily Emissions Summation for Each Season: Once link-level emissions
have been calculated, they are aggregated by pollutant, vehicle class, functional class and county. Summary reports are then generated showing total daily emissions of each pollutant by county, road type and vehicle type. Information on VMT and average speed is also provided. A separate post-processing run is performed for each season of each analysis year.
• Annual Emissions Calculation: Once average daily emissions have been
calculated for each season in a given analysis year. These emissions are multiplied by the number of days in that season, then summed to obtain the annual inventory. Emissions are reported in tons per year.
II. Resulting On-Road Mobile Source Emissions Inventory Tables 10-13 contain the on-road mobile source emissions inventories resulting from the modeling process described above. Each table lists the annual emissions of six different pollutants, by county, for a given analysis year (2002, 2005, 2009 or 2018). The six pollutants are those specified in the EPA’s 2007 Clean Air Fine Particle Implementation Rule. They include volatile organic compounds (VOC), carbon monoxide (CO), nitrogen oxide (NOx), directly emitted PM2.5, sulfur dioxide (SO2), and ammonia (NH3).
Table 10 2002 On-Road Mobile Source Emissions
Tons/Year
County VOC CO NOx PrimaryPM2.5*
SO2 NH3
Livingston 2,273 41,619 7,032 118 295 189 Macomb 7,893 131,842 18,736 359 945 624 Monroe 2,372 42,803 7,124 121 305 195 Oakland 16,351 275,611 41,379 760 1,960 1,279 St. Clair 2,091 34,038 4,997 95 250 165Washtenaw 4,536 80,205 13,071 226 575 370 Wayne 23,457 391,446 59,052 1,087 2,793 1,821 Reg. Total 58,972 997,564 151,390 2,767 7,122 4,642* Primary PM2.5, which includes all exhaust emissions as well as those from brake and tire wear.
Table 11 2005 On-Road Mobile Source Emissions
15

Tons/Year
County VOC CO NOx PrimaryPM2.5*
SO2 NH3
Livingston 1,697 31,039 5,418 89 71 201 Macomb 5,785 97,334 14,121 265 221 646 Monroe 1,743 31,635 5,454 91 73 206 Oakland 11,918 202,301 31,088 560 458 1,319 St. Clair 1,551 25,240 3,813 71 59 172Washtenaw 3,350 59,242 9,962 170 137 388 Wayne 16,931 284,801 43,981 792 647 1,859 Reg. Total 42,974 731,593 113,838 2,039 1,667 4,790* Primary PM2.5, which includes all exhaust emissions as well as those from brake and tire wear.
Table 12 2009 On-Road Mobile Source Emissions
Tons/Year
County VOC CO NOx Primary PM2.5* SO2 NH3
Livingston 1,303 23,364 3,650 65 20 209 Macomb 4,364 72,675 9,434 193 63 666 Monroe 1,339 23,958 3,703 67 21 215 Oakland 8,965 150,463 20,682 404 130 1,355 St. Clair 1,177 18,988 2,559 52 17 178Washtenaw 2,580 45,167 6,801 125 40 410 Wayne 12,449 207,581 28,657 559 179 1,870 Reg. Total 32,177 542,196 75,486 1,465 469 4,903* Primary PM2.5, which includes all exhaust emissions as well as those from brake and tire wear.
Table 13 2018 On-Road Mobile Source Emissions
County Tons/Year
VOC CO NOx Primary PM2.5*
SO2 NH3
Livingston 802 20,339 1,375 39 23 237 Macomb 2,521 59,542 3,502 113 67 705 Monroe 802 20,286 1,357 39 23 236 Oakland 5,107 120,939 7,386 228 134 1,409 St. Clair 702 16,100 980 31 19 195 Washtenaw 1,548 38,146 2,501 74 43 449 Wayne 7,030 166,315 10,270 314 185 1,932 Reg. Total 18,511 441,665 27,372 837 493 5,164
*Primary PM2.5, which includes all exhaust emissions as well as those from brake and tire wear.
1 U.S. Environmental Protection Agency, Fleet Characterization Data for Mobile6: Development and Use of Age Distributions, Average Annual Mileage Accumulation Rates, and Projected Vehicle Counts for Use in MOBILE6, September 2001. 2 SEMCOG, Survey of Regional Traffic Volume Patterns in Southeast Michigan, tables 3–7, 1985.
16

3 Dowling, Richard and Alexander Skabardonis, Improving the Average Travel Speeds Estimated by Planning Models, Transportation Research Board, January 1992. 4 SEMCOG, Survey of Roadway Speeds in Southeast Michigan, January 1993. 5 More complete documentation of the use of SEMCOG speed survey data in the development of this equation can be found in the document Redesignation of Southeast Michigan to Attainment for Ozone: Technical Support Document, jointly published by MDNR, MDOT and SEMCOG in November 1993.
17

Appendix E
SOUTHEASTERN MICHIGAN PM2.5 CONTROL PLAN:
MONITORING STRATEGY
SUPPORT DOCUMENTATION
FOR THE
FINE PARTICULATE SIP
May 2008

Southeastern Michigan PM2.5 Control Plan: Monitoring Strategy The purpose of this document is to propose a monitoring strategy as part of the southeastern Michigan PM2.5 control plan. The strategy consists of ambient measurements both from the existing monitoring network (with a few changes) and new special purpose monitoring, and associated data analyses. The ability to implement this strategy, especially changing the existing network and conducting new monitoring, is dependent on the availability of additional funding. (Note, the strategy will need to be reviewed and, as necessary, revised based on the final set of emission reduction programs selected for the PM2.5 control plan.) Monitoring Objectives The objectives of the monitoring strategy include:
• assess attainment of National Ambient Air Quality Standard, • provide real-time measurements (to support public outreach), • improve understanding of the PM2.5 nonattainment problem (including to help
identify the contribution of source types and source regions to PM2.5 levels), • track progress towards attainment (and assess effectiveness of emission
reduction programs).
Measurements A summary of existing and suggested additional measurements is provided in Table 1. A map of the existing monitoring sites is shown in Figure 1.
Figure 1. PM2.5 Monitoring Sites in Southeastern Michigan (Note: although not shown, there are two other sites – Newberry and FIA – located near Dearborn and Fort Street (SWHS))

Two changes to the existing monitoring network (pending the availability of funding) are recommended:
• Establish a TEOM monitor at SWHS1.
• Establish an STN monitor at SWHS – either by moving the Luna Pier STN
monitor or siting an available STN monitor (which would require additional resources for lab support).
It should also be noted that in light of pending budget cuts by USEPA, the State may need to reduce the number of FRM (and, perhaps, STN) sites in the network. Further discussion is needed on any specific proposed reductions. New special purpose monitoring (pending the availability of funding) is desirable to improve understanding of the PM2.5 nonattainment problem, especially for organic carbon. General suggestions for organic carbon-related monitoring and data analyses are discussed in the Appendix. Of these suggestions, serious consideration should be given to the following activities in southeastern Michigan:
• Collect continuous OC/EC data at Dearborn and, if possible, Allen Park. (Note, these data should be reviewed regularly to assess the adequacy of the existing 1-in-6-day STN sampling schedule at Dearborn.)
• Collect speciated OC data at Dearborn. High time resolution data are important.
One approach is to analyze existing or new filters for many high OC concentration days, similar to what University of Wisconsin did earlier this year.
• Following analysis of the continuous measurements (see below) and the
subsequent identification of important local sources, source sampling should be conducted for the important sources in the vicinity of the Dearborn monitor to develop improved source profiles for source apportionment analyses.
Although lesser priority, additional lab analyses of existing filters would also be desirable to support source apportionment analyses and improve understanding of PM2.5 sources:
• ICP/MS to determine metals concentrations - ICP/MS yields lower minimum detection limits (MDLs) than the standard XRF protocol, but also has disadvantages, including poorer resolution for some species and it is a destructive method. While ICP/MS is technically feasible and yields good quality data, it is more expensive than XRF (i.e., about $28K for 40 elements on 100 FRM Teflon samples, or about $19K for 20 elements on 100 FRM Teflon samples).
• Scanning electron microscopy to assess sources of certain elements (note: this
type of analysis was recently done using filters collected in the vicinity of Granite City Steel near St. Louis)
1 As noted in Table 1, Dr. Jerry Keeler has operated a TEOM at SW High School, but these data are not currently available.

Data Analysis Near-term activities include additional analysis of existing measurements, including a review of continuous measurements to assess plume hits, and an examination of burning sources, as discussed in the Appendix. On-going activities include quarterly review of FRM and STN data, and periodic source apportionment studies using the latest measurement (e.g., assess trends in source contributions). These activities can be conducted by in-house personnel (e.g., MDEQ and LADCO).

Table 1. PM2.5-Related Air Quality Measurements in Southeastern Michigan
Monitoring Type FRM TEOM Aethalometer STN Other/New Measurements Pollutant/Species PM2.5 mass PM2.5 mass Black (elemental)
carbon Sulfates, nitrates, organic carbon, elemental carbon, soil
Sampling Frequency 1-in-3 day, 1-in-6 day
continuous continuous 1-in-3 day, 1-in-6 day
Purpose Assess attainment of NAAQS
Provide real-time measurements
Provide data for SIP development
Provide data for SIP development (improve understanding of PM2.5)
Allen Park 261630001 x x x x Continuous OC/EC
Measurements (if available)
SW High School 261630015 x x (Keeler short-term study)
Establish STN monitor (use existing equipment of move Luna Pier STN) Establish TEOM
Linwood 261630016 x E. 7 Mile 261630019 x Livonia 261630025 x Dearborn 261630033 x x x x Continuous OC/EC
Measurements Speciated OC Data (w/ source apportionment analyses)
Wyandotte 261630036 x Newberry 261630038 x x x x (Schauer short-
term study)
FIA 261630039 x x New Haven 260990009 x Luna Pier 261150005 x x (move to SWHS?) Oak Park 261250001 x Port Huron 261470005 x x Ann Arbor 261610005 x Ypsilanti 261610008 x x x

APPENDIX
Organic Carbon Monitoring and Data Analysis Activities Overview: The purpose of this paper is to suggest ambient measurements and data analyses for organic carbon (OC) to address the following objectives: Near-Term (by early 2007): (1) better define burning source(s) (2) better identify local OC sources (3) justify emissions inventory adjustment factors Longer-Term (2008 and beyond): (1) improve understanding of mobile sources (2) improve understanding of OC sources (3) assess effectiveness of control programs in reducing OC concentrations These monitoring and data analysis activities are intended to provide a better understanding of organic carbon and support possible regulatory efforts for PM2.5 in the Upper Midwest. Background: In 2004 – 2005, LADCO supported the Urban Organics Study, with contractor assistance study by the University of Wisconsin and Sonoma Technology, Inc. (STI). The purpose of this study was to provide ambient measurement-based information on sources of PM2.5 organic carbon concentrations (e.g., anthropogenic v. biogenic, urban v. rural, and primary v. secondary). It was hoped that this information would be sufficient to identify organic carbon sources and to determine possible control programs. Special OC measurements were made at five urban sites (Chicago, St. Louis, Detroit, Cincinnati, and Indianapolis) and one rural site (Bondville, IL)2. Source apportionment analyses were then conducted using these measurements. The study results indicated four major OC source types (mobile, burning, industrial, and secondary), but were unable to provide any further definition. Consequently, the resulting control strategy implications were rather general, and numerous suggestions were made for further work. Monitoring and Data Analysis Activities: To meet the near-term and longer-term objectives, the following activities should be considered:
(1) Maintain STN Network: Speciated PM2.5 measurements need to be continued at a core set of existing sites. (Due to funding cuts and periodic network reviews, it may not be possible or necessary to maintain all original STN sites.) On-going measurements are needed to define trends in PM2.5 species and improve understanding of organic carbon sources.
(2) Continuous Data Collection: Continuous EC/OC (Sunset method) and BC
(aethelometer) measurements at multiple locations are needed to further explore plumes and diurnal behavior. Such data are desirable in one or more of the expected PM2.5 residual nonattainment areas: Detroit, Chicago, Cleveland, Granite City (St. Louis), and Steubenville.
2 In the case of Detroit, STI focused on measurements collected at Allen Park, while UW analyzed measurements from both Allen Park and Dearborn.

While we are awaiting these data, follow-up analyses to the Urban Organics Study should be conducted. For example, available continuous air quality and meteorological measurements should be reviewed to look for plume “hits”. This analysis may help identify nearby sources.
(3) Speciated OC Data Collection: Special measurements, such as hi-vol sampling with
analysis of individual organic species to identify specific chemical markers to support source apportionment studies. Such measurements were collected in the Urban Organics Study, and a special study in the Seney National Wildlife Refuge (see “Source Apportionment of Atmospheric Fine Particulate Matter Collected at the Seney National Wildlife Refuge”, May 2004). In the Seney study, chemical markers associated with biogenic emissions were identified.
(4) Analysis of Burning Source: Levoglucosan analysis is needed to determine biomass
burning (independent of OC analysis). The Jeff Collett method (anion-exchange chromatography with pulsed amperometric detection) is very specific for levoglucosan and can be done more cheaply. This is typically done on high-vol filters and has not been attempted on archived STN or FRM filters, but Jeff thinks it is possible and is interested in such a project. (Neil Frank is also interested in a multi-regional program to look at ways to estimate biomass using levoglucosan and, perhaps, potassium and may have money that could be leveraged.)
While we are awaiting these data, follow-up analyses to the Urban Organics Study should be conducted. For example, back trajectories should be prepared for all days identified as having a high burning source impact in the initial source apportionment analyses. This information may help determine source regions and burning activities.
(5) Examination of Old and New Carbon: C14 analysis could be conducted to determine
fossil/modern carbon split. New carbon is mostly associated with biogenic Secondary Organic Aerosol (SOA) and biomass burning, while old carbon is associated with mobile source, stationary fossil fuel combustion, and fossil fuel source SOA. Together with the levoglucosan data above, this would allow us to develop a more certain bound on anthropogenic and biogenic contributions (i.e., biomass burning is a fraction of modern carbon -- whatever is left of modern carbon after biomass burning is subtracted is the biogenic contribution). This is an expensive analysis -- ~$500/sample.
(6) Characterize Intra-City Spatial Variability (Jamie Schauer methodology): Routine
sampling along a transect in the prevailing wind direction with at least three sites to quantify upwind, center city or industry, and downwind. Detroit would be an ideal location; for example, select Allen Park, Dearborn, and Linwood. Combining this with continuous data (EC/OC) would help discern some source patterns (mobile, industrial plumes) in the much higher resolution data.
(7) Development of Source Profiles: Source sampling is critical in light of the significant
uncertainties we have discovered in numerous source apportionment studies. Most important are steel mills, especially the different processes within the mills, locomotives, and other off-road mobile sources. Data on on-road mobile sources would be helpful as well. (Note, these data may be EPA’s Kansas City study.)

Would also be useful to have resuspended dust (road dust and soil) for various cities -- this would help interpret some profiles that can confuse common crustal signatures with those of industrial processes and develop some knowledge of geological variability in the Midwest. Need to find Gary Casuccio's report on CCSEM at a Pennsylvania steel mill -- supposedly this characterizes various processes.
(8) Additional Data Analyses (using existing data): Besides the two follow-up data
analysis activities noted above (i.e., analysis of available continuous data and trajectory analyses of burning source), additional recommended analyses include: (a) evaluate the emissions inventory in the context of the source apportionment results (note, this analysis is likely to lead to an adjustment factor for primary organic carbon emissions from on-road mobile sources), and (b) assess trends in source contributions (note, this analysis may help determine the effectiveness of certain control programs).
The table below identifies the relevant objectives for these activities:
Next Steps: This paper will be shared with federal, state, academic, and stakeholder representatives to ensure that the recommended activities are relevant and appropriate. In addition, available funding options need to be explored (e.g., private foundations, special federal appropriation, and stakeholder contributions). Once we have a good idea of how much new money will be available, then the activities will be prioritized and LADCO will proceed with a competitive contract process.

Appendix F
CALCULATION OF SEVERSTAL EMISSIONS
SUPPORT DOCUMENTATION
FOR THE
FINE PARTICULATE SIP
May 2008

Determining the emissions from Severstal North America steel mill for Michigan’s AERMOD modeling evaluation was complicated process that involved using: 1)PM emissions reported from MDEQ permit #182-05B (Severstal permit) and 2)emissions and calculation from the steel mill study done by RTI (2006) to determine PM2.5. This appendix gives the details in how the emissions estimates for modeling were developed. Table 1 shows how PM was calculated for the Severstal permit showing the throughput and emissions factors used by Severstal in their permit. The 2009 future potential limits for PM are the maximum emission limits allowed in the Severstal permit once controls are installed (fall 2007 for most emission sources). Table 2 compares the 2002 PM emissions and emissions factors used in the Severstal permit, the RTI report, and MDEQ that were used to develop the AERMOD modeling emissions. MDEQ used a hybrid between the Severstal permit emissions and the RTI report, based on recommendations of MDEQ permit engineers. The RTI report indicated that Severstal has a local hood to capture charging and tapping emissions from the BOF and send the emissions to the ESP for control. Severstal uses an estimated capture efficiency of 95 percent for charging and tapping emissions (emission factors of 0.03 and 0.046 lb/ton, respectively). RTI research indicated that 95 percent capture is more appropriate for hoods designed and dedicated to capture fugitive emissions, not for a local hood like Severstal had. Furthermore, Severstal had several exceedances of the 20 percent opacity limit for the BOF shop, which supported a lower capture efficiency as in the RTI report. There is no emission factor for the type of blast furnace casthouse roof monitor as used at Severstal. Severstal uses 85 percent capture efficiency, however, one study, as indicated in the RTI report, found a 74 percent reduction using a similar system. RTI used a75 percent reduction which would also be supported by the opacity exceedences reported for the casthouses as well. Since the Severstal permit does not contain PM2.5 emissions numbers, they had to be calculated using the PM2.5-FIL:PM-FIL ratio provided in the RTI report. Table 3 shows the generic source types and ratios used to calculate PM2.5 from PM (this table is Table 5-2 in the RTI report). Table 4 show the ratio used for each Severstal specific emission sources to calculate the 2002 actual PM2.5 emissions and the 2009 PM2.5 future potential emissions used for MDEQs AERMOD modeling.

Table 1. PM calculations from Severstal permit. Source
Throughput Value Throughput Value
2009 Emission
Factor Value
Units
2009 Potential Emissions
(tpy)
2002 Emission
FactorUnits
2002 Emissions
(tpy)
Net Change
(tpy)
B BF Stoves (BFG) 13,392.0 MMSCF 15,136.6 MMSCF 2.9 lb/MMSCF 21.95 2.9 lb/MMSCF 19.42 2.53C BF Stoves (BFG) 24,003.0 MMSCF 37,841.1 MMSCF 2 lb/MMSCF 37.84 2.9 lb/MMSCF 34.80 3.04B BF Stoves (NG) 459.0 MMSCF 483.7 MMSCF 7.6 lb/MMSCF 1.84 7.6 lb/MMSCF 1.74 0.09C BF Stoves (NG) 434.0 MMSCF 655.3 MMSCF 7.6 lb/MMSCF 2.49 7.6 lb/MMSCF 1.65 0.84B BF Casthouse (Roof Monitor) 900,533.0 TPY 949,000.0 TPY 0.012 lb/ton 5.69 0.09 lb/ton 40.52 -34.83C BF Casthouse (Roof Monitor) 1,571,337.0 TPY 2,372,500.0 TPY 0.012 lb/ton 14.24 0.09 lb/ton 70.71 -56.48B BF Bleeders 80.5 MMSCF 84.9 MMSCF 2.9 lb/MMSCF 0.12 2.9 lb/MMSCF 0.12 0.01C BF Bleeders 140.5 MMSCF 212.2 MMSCF 2.9 lb/MMSCF 0.31 2.9 lb/MMSCF 0.20 0.10B BF Taphole Burning 1,440.0 ft. of pipe 1,517.5 ft. of pipe 0.5 lb Fe/lb fume 0.15 0.5 lb Fe/lb fume 0.14 0.01C BF Taphole Burning 1,020.0 ft. of pipe 1,540.1 ft. of pipe 0.5 lb Fe/lb fume 0.15 0.5 lb Fe/lb fume 0.10 0.05BF B Casthouse Baghouse Stack 250,000 ACFM 0.003 gr/dscf 24.46 24.46BF C Casthouse Baghouse Stack 500,000 ACFM 0.003 gr/dscf 48.93 48.93Lime Unloading - BOF Receiving 14,000 ACFM 14,000 ACFM 0.005 gr/dscf 2.63 0.600 lb/hr 2.63 0.00Reladling South - STACK 130,000 ACFM 0.010 gr/dscf 13.58 -13.58Reladling South - FUGITIVES 2,471,870.0 TPY 3,321,500.0 TPY 0.0038 lb/ton 6.31 0.0038 lb/ton 4.697 1.61Torch Cutting 39,745.2 TPY 0.1 lb/ton 0.00 0.1 lb/ton 1.987 -1.99BOF Natural Gas 520.0 MMSCF 698.7 MMSCF 7.6 lb/MMSCF 2.66 7.6 lb/MMSCF 1.98 0.68BOF ESP Stack 841,000 ACFM 841,000 ACFM 0.0152 gr/dscf 223.12 0.0152 gr/dscf 202.35 20.77BOF Secondary Emiss. Baghouse 1,000,000 ACFM 0.003 gr/dscf 32.62 32.62BOF Tapping (Roof Monitor) 2,944,089.0 TPY 4,052,230.0 TPY 0.0026 lb/ton 5.27 0.046 lb/ton 67.71 -62.45BOF Slag Tap (Roof Monitor) 372,502.0 TPY 500,538.2 TPY 0.0026 lb/ton 0.65 0.046 lb/ton 8.57 -7.92BOF Charging (Roof Monitor) 2,471,870 TPY 3,321,500.0 TPY 0.0060 lb/ton 9.96 0.030 lb/ton 37.08 -27.11Desulfurization - STACK 94,500 ACFM 94,500 ACFM 0.010 gr/dscf 9.15 0.010 gr/dscf 9.15 0.00Desulfurization - FUGITIVES 2,471,870.0 TPY 3,321,500.0 TPY 0.0218 lb/ton 36.20 0.0218 lb/ton 26.94 9.26#1 LRF Stack 175,000 ACFM 175,000 ACFM 0.0052 gr/dscf 29.68 0.0052 gr/dscf 29.68 0.00#2 LRF Stack 100,000 ACFM 100,000 ACFM 0.0052 gr/dscf 16.96 0.0052 gr/dscf 16.96 0.00Vacuum DegasserDD Baghouse - Coke Transfer 20,000.0 ACFM 20,000.0 ACFM 0.005 gr/dscf 3.75 0.005 gr/dscf 3.75 0.00EE Baghouse - Coke Unloading 25,000.0 ACFM 25,000.0 ACFM 0.005 gr/dscf 4.69 0.005 gr/dscf 4.69 0.00EE Baghouse - Natural Gas 5.0 MMSCF 6.7 MMSCF 7.6 lb/MMSCF 0.03 7.6 lb/MMSCF 0.02 0.01Raw Material Handling 1.00 PPH 4.38 1.00 PPH 4.38 0.00Annealing Furnaces 883.2 MMSCF 1,215.7 MMSCF 10 lb/MMSCF 6.08 10 lb/MMSCF 4.42 1.66Reheat Furnace #1 2,367.0 MMSCF 2,593.4 MMSCF 10 lb/MMSCF 12.97 10 lb/MMSCF 11.84 1.13Reheat Furnace #2 2,367.0 MMSCF 2,593.4 MMSCF 10 lb/MMSCF 12.97 10 lb/MMSCF 11.84 1.13Reheat Furnace #3 2,367.0 MMSCF 2,593.4 MMSCF 10 lb/MMSCF 12.97 10 lb/MMSCF 11.84 1.13Hand Scarfing 262,805.0 TPY 353,136.0 TPY 0.1 lb/ton 17.66 0.1 lb/ton 13.14 4.52B BF Slag Pit 156,692.7 TPY 165,126.0 TPY 0.0088 lb/ton 0.73 0.0088 lb/ton 0.69 0.04C BF Slag Pit 273,412.6 TPY 412,815.0 TPY 0.0088 lb/ton 1.82 0.0088 lb/ton 1.20 0.61Desulfurization Slag Pit 81,571.7 TPY 109,609.5 TPY 0.09 lb/ton 4.93 0.09 lb/ton 3.67 1.26Parts Cleaning 2,131.0 Gallons 2,131.0 GallonsMaintenance Paint Booth 70.0 Gallons 70.0 GallonsJ-9 Dip Tank 1,210.0 Gallons 1,210.0 Gallons 0.1 lb/1000lb 0.00 0.00Equipment and Emissions from On-Site Coal PulverizationFine Coal Silo Baghouse 6,200.0 ACFM 0.005 gr/dscf 1.16 1.16Filter #4 (Pulverizer Baghouse) 16,000.0 ACFM 0.005 gr/dscf 3.00 3.00Rail Unloading Baghouse 30,000.0 ACFM 0.005 gr/dscf 1.88 1.88Raw Coal Silo Baghouse 1,800.0 ACFM 0.005 gr/dscf 0.34 0.34Rail Car Building Heater 214.7 MMSCF 7.6 lb/MMSCF 0.82 0.82Pulverizer Hot Gas Generator 214.7 MMSCF 7.6 lb/MMSCF 0.82 0.82Process Fugitives 8.56 8.56Totals 573.14 664.20 -36.84
PM
EMISSIONS RESTRICTED BY LIMITS IN EXISTING PERMIT
RULE 290 EXEMPT EMISSION UNIT
2002 ACTUAL 2009 PROJECTED

Table 2. 2002 PM emissions and emissions factors comparisons used in the Severstal permit, RTI report and MDEQ AERMOD modeling. Numbers in red used RTI values instead of Severstal permit numbers.
Source
Severstal 2002
Emission Factor
Severstal 2002
Emissions (tpy)
RTI 2002 Emission
Factor
RTI 2002 Emissions
(tpy)
MDEQ 2002 Emission
Factor
MDEQ 2002
Emissions (tpy)
Units for emissions
factors
B BF Stoves (BFG) 2.9 19.42 2.9 19.42 2.9 19.42 lb/MMSCFC BF Stoves (BFG) 2.9 34.80 2.9 34.80 2.9 34.80 lb/MMSCFB BF Stoves (NG) 7.6 1.74 1.9 0.44 7.6 1.74 lb/MMSCFC BF Stoves (NG) 7.6 1.65 1.9 0.41 7.6 1.65 lb/MMSCFB BF Casthouse (Roof Monitor) 0.09 40.52 0.15 67.54 0.15 67.54
0.15 117.85
0.230 338.570.230 42.840.150 185.39
lb/tonC BF Casthouse (Roof Monitor) 0.09 70.71 0.15 117.85 lb/tonB BF Bleeders 2.9 0.12 2.9 0.12 2.9 0.12 lb/MMSCFC BF Bleeders 2.9 0.20 2.9 0.20 2.9 0.20 lb/MMSCFB BF Taphole Burning 0.5 0.14 inventory 0.14 0.5 0.14 lb Fe/lb fumeC BF Taphole Burning 0.500 0.10 inventory 0.10 0.5 0.10 lb Fe/lb fumeBF B Casthouse Baghouse StackBF C Casthouse Baghouse StackLime Unloading - BOF Receiving 0.600 2.63 0.005 2.63 0.600 2.63 lb/hrReladling South - STACK 0.01 13.58 0.010 13.58 0.010 13.58 gr/dscfReladling South - FUGITIVES 0.0038 4.697 0.0095 11.74 0.0038 4.697 lb/tonTorch Cutting 0.1 1.987 0.1 1.99 0.1 1.987 lb/tonBOF Natural Gas 7.6000 1.98 1.9 0.49 7.6 1.98 lb/MMSCFBOF ESP Stack 0.0152 202.35 39.9 lb/hr 174.80 0.0152 202.35 gr/dscfBOF Secondary Emiss. BaghouseBOF Tapping (Roof Monitor) 0.046 67.71 0.230 338.57 lb/tonBOF Slag Tap (Roof Monitor) 0.046 8.57 lb/tonBOF Charging (Roof Monitor) 0.030 37.08 0.150 185.39 lb/tonDesulfurization - STACK 0.01 9.15 0.010 9.15 0.010 9.15 gr/dscfDesulfurization - FUGITIVES 0.0218 26.94 0.055 67.98 0.0218 26.94 lb/ton#1 LRF Stack 0.0052 29.68 0.0052 29.68 0.0052 29.68 gr/dscf#2 LRF Stack 0.0052 16.96 0.0052 16.96 0.0052 16.96 gr/dscfVacuum DegasserDD Baghouse - Coke Transfer 0.005 3.75 inventory 3.75 0.005 3.75 gr/dscfEE Baghouse - Coke Unloading 0.005 4.69 0.005 4.69 gr/dscfEE Baghouse - Natural Gas 7.60 0.02 7.6 0.02 lb/MMSCFRaw Material Handling 1 4.38 inventory 4.38 1.00 4.38 PPHAnnealing Furnaces 10 4.42 1.9 0.84 10 4.42 lb/MMSCFReheat Furnace #1 10 11.84 1.9 2.25 10 11.84 lb/MMSCFReheat Furnace #2 10 11.84 1.9 2.25 10 11.84 lb/MMSCFReheat Furnace #3 10 11.84 1.9 2.25 10 11.84 lb/MMSCFHand Scarfing 0.1 13.14 0.1 13.14 0.1 13.14 lb/tonB BF Slag Pit 0.0088 0.69 0.0088 0.69 0.0088 0.69 lb/tonC BF Slag Pit 0.0088 1.20 0.0088 1.20 0.0088 1.20 lb/tonDesulfurization Slag Pit 0.09 3.67 0.09 3.67 0.09 3.67 lb/tonParts CleaningMaintenance Paint BoothJ-9 Dip Tank
Fine Coal Silo BaghouseFilter #4 (Pulverizer Baghouse)Rail Unloading BaghouseRaw Coal Silo BaghouseRail Car Building HeaterPulverizer Hot Gas GeneratorProcess Fugitives
Storage piles tpy PM10 3.10Unpaved roads inventory 75.00Paved roads tpy PM10 34.00Parking lots, open areas inventory 22.00CC baghouse coke transfer inventory 4.70Totals 664.20 1267.21 1191.80
Emissions reported in RTI report only
Equipment and Emissions from On-Site Coal Pulverization

Table 3. Ratios to calculate PM2.5-Fil from the RTI report (Table 5.2 in RTI report)

Table 4. Ratio used from the RTI report to determine PM2.5 fraction of PM reported in Severstal permit. Numbers in red were not in Appendix B-2 in the RTI report.
Source Name (from Severstal permit)
Sources in RTI Report in Appendix B-2 (unless otherwise noted)
PM2.5 fil ratio: PM
MDEQ 2002 PM2.5
Emissions
MDEQ 2009
Potential PM2.5
Emissions
Net Change
(tpy)
B BF Stoves (BFG) B BF Stoves (BFG) 1.00 19.42 21.95 2.53C BF Stoves (BFG) C BF Stoves (BFG) 1.00 34.80 37.84 3.04B BF Stoves (NG) B BF Stoves (NG) 1.00 1.74 1.84 0.09C BF Stoves (NG) C BF Stoves (NG) 1.00 1.65 2.49 0.84B BF Casthouse (Roof Monitor) B BF Casthouse (Roof Monitor) 0.23 15.53 1.31 -14.22C BF Casthouse (Roof Monitor) C BF Casthouse (Roof Monitor) 0.23 27.11 3.27 -23.83B BF Bleeders BF bleeder stacks 1.00 0.12 0.12 0.01C BF Bleeders BF bleeder stacks 1.00 0.20 0.31 0.10B BF Taphole Burning Tapehole burning 1.00 0.14 0.15 0.01C BF Taphole Burning Tapehole burning 1.00 0.10 0.15 0.05BF B Casthouse Baghouse Stack Blast furnace casthouse* 0.23
0.23
0.19
0.20
1.001.00
111111
0.15
* from Table 5-2 in RTI report (see Table 3 above)
0.00 5.63 5.63BF C Casthouse Baghouse Stack Blast furnace casthouse* 0.00 11.25 11.25Lime Unloading - BOF Receiving Lime unloading 1.00 2.63 2.63 0.00Reladling South - STACK Reladling South - Stack 0.23 3.12 0.00 -3.12Reladling South - FUGITIVES Reladling South - Fugatives 0.23 1.08 1.45 0.37Torch Cutting Torch Cutting 1.00 1.99 0.00 -1.99BOF Natural Gas BOF (NG) 1.00 1.98 2.66 0.68BOF ESP Stack BOF ESP Stack 0.73 147.72 162.88 15.16BOF Secondary Emiss. Baghouse avg of BOF charge/tap baghouse* 0.00 6.20 6.20BOF Tapping (Roof Monitor) BOF Tapping (Roof Monitor) 0.37 125.27 1.95 -123.32BOF Slag Tap (Roof Monitor) Slag* 8.57 0.13 -8.44BOF Charging (Roof Monitor) BOF Charging (Roof Monitor) 0.22 40.79 2.19 -38.59Desulfurization - STACK Desulfurization - STACK 0.42 3.84 3.84 0.00Desulfurization - FUGITIVES Desulfurization - FUGITIVES 0.11 2.96 3.98 1.02#1 LRF Stack #1 LRF Stack 1.00 29.68 29.68 0.00#2 LRF Stack #2 LRF Stack 1.00 16.96 16.96 0.00Vacuum DegasserDD Baghouse - Coke Transfer DD Baghouse - Coke Transfer 1.00 3.75 3.75 0.00EE Baghouse - Coke Unloading assumed same as DD Baghouse 4.69 4.69 0.00EE Baghouse - Natural Gas assumed same as DD Baghouse 0.02 0.03 0.01Raw Material Handling Raw Material Handling 1.00 4.38 4.38 0.00Annealing Furnaces Annealing Furnaces (NG) 1.00 4.42 6.08 1.66Reheat Furnace #1 Reheat Furnace #1 (NG) 1.00 11.84 12.97 1.13Reheat Furnace #2 Reheat Furnace #2 (NG) 1.00 11.84 12.97 1.13Reheat Furnace #3 Reheat Furnace #3 (NG) 1.00 11.84 12.97 1.13Hand Scarfing Hand Scarfing 1.00 13.14 17.66 4.52B BF Slag Pit B BF Slag Pit 0.02 0.01 0.01 0.00C BF Slag Pit C BF Slag Pit 0.02 0.02 0.04 0.01Desulfurization Slag Pit Desulfurization Slag Pit 0.02 0.07 0.10 0.03Parts Cleaning 0.00 0.00 0.00Maintenance Paint Booth 0.00 0.00 0.00J-9 Dip Tank 0.00 0.00 0.00
Fine Coal Silo Baghouse assumed same as DD Baghouse 0.00 1.16 1.16Filter #4 (Pulverizer Baghouse) assumed same as DD Baghouse 0.00 3.00 3.00Rail Unloading Baghouse assumed same as DD Baghouse 0.00 1.88 1.88Raw Coal Silo Baghouse assumed same as DD Baghouse 0.00 0.34 0.34Rail Car Building Heater assumed same as DD Baghouse 0.00 0.82 0.82Pulverizer Hot Gas Generator assumed same as DD Baghouse 0.00 0.82 0.82Process Fugitives AP-42, aggregate handling (2006)** 0.00 1.28 1.28Totals 553.43 405.81 -147.62
Equipment and Emissions from On-Site Coal Pulverization
EMISSIONS RESTRICTED BY LIMITS IN EXISTING PERMIT
**from revisions to AP-42, 5th edition

Appendix G
OVERVIEW OF RECENT DETROIT PM SOURCE
APPORTIONMENT STUDIES
SUPPORT DOCUMENTATION
FOR THE
FINE PARTICULATE SIP
May 2008

Overview of Recent Detroit PM Source Apportionment Studies Donna Kenski Lake Michigan Air Directors Consortium November 26, 2007 Concentrations of PM2.5 in the Detroit metropolitan area currently exceed the National Ambient Air Quality Standard (NAAQS) at 2 of 11 monitoring sites and are within 1 ug of the NAAQS at 4 others (Fig. 1). Modeling studies show that federal controls are expected to bring all but the Dearborn monitor into attainment by 2012(?). Additional local control measures will be needed to achieve the NAAQS at Dearborn. To ensure effective controls, it is imperative that the state and local air programs understand the current composition of PM2.5 at each site and also the sources that contribute significant mass to them.
For general background, Fig. 2 shows the chemical components averaged over several years at the speciation trends network (STN) sites in Detroit and upwind. Organic carbon is the largest component of PM2.5 on an annual average basis, followed by ammonium sulfate and ammonium nitrate. Concentrations of ammonium sulfate are similar among sites, indicating its regional origin. Organic carbon (OC) and ammonium nitrate, in contrast, have significant site-to-site variability. It is these site differences in concentration, as well as temporal differences, that the source apportionment models use to extract information on the sources that contribute to PM2.5 mass.
Six recently published source apportionment studies have examined data from Detroit monitors. These studies are summarized here and a few key findings are drawn from the group as a whole. The studies varied in the number of samples analyzed, the locations of sample collection, the species chosen for study, the source apportionment models applied, and the time periods of sample collection, so conclusions here are necessarily qualitative and somewhat general. Nevertheless, similarities can be drawn despite the variety of approaches and data used. The two most robust studies, Wade et al. (2007) and Gildemeister et al. (2007), both used STN data from the Allen Park and Dearborn sites. The remaining four studies reviewed here collected data independent of the STN network, although one (Brown et al., 2006) used the Allen Park site to collect samples. Figure 3 shows the monitoring sites where data were collected for the studies presented here and Fig. 4 shows the sampling dates for the studies. Study Summaries
Wade et al. (2007): In the most comprehensive and most recent source apportionment analysis to date, Sonoma Technology examined STN data from

Allen Park (12/2000-12/2006, 662 samples) and Dearborn (5/2002-12/2006, 253 samples). Similar sources were identified at both sites, and contributions were similar for the major sources: secondary sulfate, secondary nitrate, and organic mass. The organic mass factor is described as distinct from elemental carbon (diesel) but is not necessarily only gasoline vehicles. Instead it probably includes some mass from other non-vehicle combustion sources, and is influenced by photochemistry and transport. The two sites are distinguished by the mass allocated to a steel source (1.27 ug at Dearborn vs. 0.05 ug at Allen Park), diesel vehicles (2.84 ug at Dearborn vs. 0.88 ug at Allen Park), and crustal species (1.36 ug at Dearborn vs. 0.62 at Allen Park). Additional mixed industrial factors were identified at each site as well, accounting for about 2 ug. The mixed industrial factors include some sulfate, indicating that local sulfate controls may be effective. Table 1 gives the source allocations for this study and the others, and Figure 5 shows the contributions by source, site, and study authors.
Gildemeister et al. (2007): In a study very similar to Wade et al., Gildemeister
et al. examined STN data from Allen Park (12/2000-4/2005) and Dearborn (5/2002-4/2005). PMF was used to distinguish seven sources common to both sites: Secondary sulfate, secondary nitrate, gasoline, diesel, mixed sea/road salt, iron/steel, and soil. A mixed industrial factor was also identified at Dearborn and a biomass burning factor was identified at Allen Park. Contributions to total PM2.5 mass are given in Table 1 and Fig. 5. Mass contributions from the secondary sulfate, secondary nitrate, and sea salt were similar at both sites, and also similar to those derived by Wade et al. The influence of local iron and steel industrial sources, mobile sources (gasoline and diesel), and soil was higher at Dearborn than Allen Park. Interestingly, gasoline sources were well correlated but diesel sources were not. The authors suggest that the diesel factor is a combination of sources with both area and point source characteristics. The wind analysis for diesel showed distinct directionality toward the port of Detroit and Ambassador Bridge.
Brown et al. (2006): Like Wade et al. and Gildemeister et al., Brown et al.
applied PMF to STN data from Allen Park and Dearborn. Seven sources were detected at Allen Park and nine at Dearborn. The allocations to secondary sulfate and nitrate were similar at both sites and also similar to those in Wade and Gildemeister. Mobile sources were about twice as high at Allen Park, but similar at Dearborn. Industrial sources accounted for about 1.3 ug/m3 at Allen Park and 3.5 ug/m3 at Dearborn. A biomass burning source accounted for 0.3 ug/m3 at both sites.
In addition, this study collected samples at Allen Park from Feb. 2004-Feb. 2005 on a 1-in-6-day schedule. These samples were analyzed for speciated organic carbon and elemental carbon in monthly composites and the resulting dataset was analyzed using the chemical mass balance (CMB) method of source apportionment. Eight sources were modeled. The mass apportioned was total organic carbon, rather than PM2.5 as in the studies above. Using the organic species allows more precise identification of source contributions from carbon

sources such as motor vehicles. In this study, mobile sources were apportioned to gasoline, diesel, and smoking vehicles. In Detroit, more than half of the OC allocated to mobile sources was attributed to smoking vehicles. Other sources included biomass burning, vegetative detritus, and dirt. Natural gas combustion was included in the model but its contribution was negligible. A significant portion of OC mass during the summer months was not allocated to any source and was presumed to be of secondary biogenic origin. This study is included in Table 1 and Fig. 5 despite the difference in the basis for allocating mass (OC vs PM2.5), because the sources it modeled are dominated by OC.
Morishita et al (2006): This study made speciated PM2.5 measurements during 4 summers (2000-2003) at the Maybury school near the Ambassador Bridge (see Fig. 3). Maybury school is not a Michigan DEQ site but is close to the West Fort St. site. PMF was applied to 96 samples, using 15 species: S, Se, Mn, Fe, Ni, Zn, Rb, Mo, Cd., Ba, La, Sm, Pb, EC, and OC. Notably, nitrate was excluded from the analysis, although since these were summer samples the nitrate fraction would likely be small. The important crustal species Ca and Si were also excluded, which may have hindered the model’s ability to detect a soil or road dust source. Six sources were identified and quantified, as given in Table 1 below: Secondary sulfate/coal combustion, motor vehicles, municipal waste incineration, oil refining/combustion, sewage sludge incineration, and iron/steel manufacturing. This study also evaluated two distinct periods during 2000 more intensively and found that elevated local source emissions, including incinerator and refinery emissions, were associated with adverse health effects during accompanying toxicological studies.
Hammond et al. (2007): Another special measurement study, in which researchers collected speciated PM2.5 samples for 11 2-week periods between October 1999 and May 2002. Samples were collected at Maybury School (as in Morishita, above), and also at Keith School in east Detroit. A total of 154 samples from the two sites were used in a PMF analysis. Species included were: PM25 mass, OC, EC, La, Sm, Ce, Pb, Al, P, S, V, Cr, Mn, Fe, Ni, Cu, Zn, K, and Se. As in the previous study, nitrate, Ca, and Si were not included. In East Detroit (Keith School) 5 sources were identified: Secondary sulfate/coal combustion, motor vehicles, refinery/oil combustion, automotive electroplating, and a mixed industrial factor including iron/steel manufacturing and waste incineration. At Maybury School, 7 sources were identified. These included the same factors found at Keith School, except the motor vehicles were split into two separate factors distinguished by gasoline combustion and diesel combustion, and an additional sewage sludge incineration source was identified.
Pere-Trepat et al. (2007): This analysis applied PMF to DRUM samples collected over a 6 week period at the Allen Park site between February and April 2002. The DRUM sampler collects particles in 3 different size modes (2.5>Dp>1.15, 1.15>Dp>0.34, and 0.34>Dp>0.1um) and in 3 hour time increments. Each size mode was analyzed for metals, PM mass, and optical

absorption. Carbon and nitrate cannot be quantified from this type of sampler, so a large fraction of PM2.5 mass was not represented in the species modeled. Misaligned time stamps plagued the analysis, but once discovered were able to be corrected. Nine factors were resolved with PMF: road salt, a mixed industrial factor with iron and zinc, 2 metal works factors (one with iron in all sizes and Zn, Ti, Cu, and Mn, and the other with intermediate size Fe, small size sulfur, and Zn, Al, Si, and Ca), road dust, and 4 sulfur-dominated sources. The authors suggest that some of the metal-dominated profiles may represent different processes or batch operations at the same facilities, because the wind direction analysis indicated similar origins for each. The sulfur profiles were distinguished by size fraction and temporal behavior and the authors concluded that one was of local origin because of its irregular peaks at random time intervals and one was transported from distant sources long range because of its slowly evolving temporal pattern. Of the other 2 sulfur factors, one may represent dry or wet deposition of sulfate on local soils which are subsequently resuspended, and the other may be associated with industrial activity in the Rouge complex, because it had peaks in the southerly direction. The study did not include quantitative estimates of PM2.5 mass associated with each source factor, so it is not included in Table 1 or Fig. 4. Key Findings and Synthesis:
• The Wade et al., Gildemeister, and Brown studies made very similar allocations to major sources at Allen Park and Dearborn. The data and modeling approach in these 2 studies were almost identical, which no doubt was an important factor in their similar findings.
• The Morishita and Hammond studies differed from Wade, Gildemeister, and Brown in that data were collected at different locations and the species included in the models were somewhat different. Important crustal components Ca and Si were not included as fitting species. Compared to the Wade, Gildemeister, and Brown studies, contributions from vehicles were about the same, secondary sulfate was about twice as high, and industrial contributions were highly variable, ranging from inconsequential at Keith School to a total of 7 ug at Maybury School. The very high allocation to secondary sulfate and low allocation to industry in Hammond et al. may indicate that mass from industrial sources is being assigned incorrectly to secondary sulfate.
• At Dearborn, the source apportionment results indicate that local industrial sources, including steel manufacturing but also other metal industries, likely contribute 2.5-3.5 ug/m3 to annual average PM2.5.
• Dearborn also experiences higher vehicle impacts than Allen Park (1.3 to 1.7 ug greater), and much of the increase is from diesel sources.
• Contributions from secondary sulfate and nitrate do not differ much between Allen Park and Dearborn, evidence that these categories are not being influenced by local sources. Some of the industrial source

fingerprints did include sulfate mass, however, which indicates that local sources of sulfate are present and may be suitable targets for control.
References 1. Brown, S.G., H.R. Hafner, P.T. Roberts, J.J. Schauer, and R.J. Sheesley,
Integration of Results for the Upper Midwest Urban Organics Study, Sonoma Technology Report STI-903520-2942-FR (March 2006).
2. Gildemeister, A.E., P.K. Hopke, E. Kim, Sources of fine urban particulate matter in Detroit, MI, Chemosphere 69(2007):1064-1074.
3. Hammond, D.M., J.T. Dvonch, G.J. Keeler, E.A. Parker, A.S. Kamal, J.A. Barres, F.Y. Yip, W. Brakefield-Caldwell, Atmos. Env. (2007), doi:10.1016 (accepted manuscript).
4. Morishita, M., G.J. Keeler, J.G. Wagner, and J.R. Harkema, Source Identification of ambient PM2.5 during summer inhalation exposure studies in Detroit, MI, Atmos. Env. 40(2006): 3823-3834.
5. Pere-Trepat, E., E. Kim, P. Paatero, P.K. Hopke, Source apportionment of time and size-resolved ambient particulate matter measured with a rotating DRUM impactor, Atmos. Env. 41(2007):5921-5933.
6. Wade, K.S., J.R. Turner, S.B. Brown, J. Garlock, and H.R. Hafner, Data Analysis and Source Apportionment of PM2.5 in Selected Midwestern Cities, Sonoma Technology Draft Final Report STI-907018.03-3264-DFR (Nov. 2007).

Fig. 1. Current Design Values for Detroit-Area PM2.5 FRM Monitors
Fig. 2 Chemical Composition of PM2.5 at Speciation Trends Network Sites

Fig. 3 Monitoring Sites in Detroit Where Source Apportionment Studies Have Been Performed
Fig. 4 Dates of Source Apportionment Studies

0 2 4 6 8 10 12Source contribution, ug/m3
Mobile
Gasoline Veh.
Diesel Veh.
Sec. Sulfate/Coal
Sec. Nitrate
Iron/Steel Mfg.
Refinery/Oil
Municipal Incin.
Sludge Incin.
Mixed Industrial
Industrial/Zinc
Sea Salt/Road Salt
Crustal
Biomass Burning BrownOC-Allen ParkBrownPM-Allen ParkBrownPM-DearbornGildemeister-Allen ParkGildemeister-DearbornHammond-KeithHammond-MayburyMorishita-MayburyWade-Allen ParkWade-DearbornBrownOC-Allen ParkWade-Dearborn
Summary of Source Apportionment Results at Detroit Sites
Fig. 5 Summary of Source Contributions from Various Studies and Sites (contributions less than 0.05 ug/m3 are not plotted). Unique symbols are used for each study and site; colors indicate sites—i.e., red=Allen Park, blue=Dearborn, orange=Keith School, een=Maybury School.

Table 1 Summary of Source Contributions to PM2.5 by Study and Site
Wade et al. Gildemeister et al. Brown et al.aMorishita
et al.b Hammond et al.
Source Category Allen Park Dearborn
Allen Park Dearborn
Allen Park(OC)
Allen Park(PM)
Dearborn (PM) Maybury School
Maybury School
Keith School
Vehicles 2.04 2.31 5.13 Gasoline 2.77 2.08 2.53 3.75 3.53 3.96 4.24 Diesel 0.88 2.84 0.67 1.17 2.37 1.06 2.16 Secondary sulfate/coal 4.99 5.24 4.99 4.84 4.51 4.49 7.28 10.89 11.01 Secondary nitrate 2.91 3.36 4.49 3.89 4.16 4.26 Industrial 1.35 2.35 Iron/steel mfg. 0.05 1.27 0.51 1.24 0.81 3.47 0.75 0.02 Mixed industry/zinc 0.85 1.51 1.30 0.32 Mixed industry/lead 1.39 0.55 Municipal incinerator 1.56 Sludge incinerator 1.76 0.02 Refinery/oil combustion 0.23 0.06 0.06 Electroplating 0.03 0.03 Sea/road salt 0.57 0.72 Crustal/soil 0.62 1.36 1.29 2.14 0.11 0.63 0.88 Biomass burning 0.51 1.20 0.30 0.31 aBrown et al. apportioned PM2.5 using STN data and organic carbon mass using speciated organic data. bMorishita data are averaged over 5 different sampling periods and weighted by number of samples.

Table 1 (Alternate version) Summary of Source Contributions to PM2.5 by Study and Site
Allen Park Dearborn Maybury School Keith
School
Wade Gildemeister Brown(PM)a Brown(OC)
Wade
Gildemeister Brown(PM)
Morishitab Hammond Hammond Vehicles 2.04 2.31 5.13 Gasoline 2.77 2.53 3.53 2.08 3.75 3.96 4.24 Diesel 0.88 0.67 2.37 2.84 1.17 1.06 2.16 Secondary sulfate/coal 4.99 4.99 4.51 5.24 4.84 4.49 7.28 10.89 11.01 Secondary nitrate 2.91 4.49 4.16 3.36 3.89 4.26 Industrial 1.35 2.35 Iron/steel mfg. 0.05 0.51 1.27 1.24 0.81 3.47 0.75 0.02 Mixed industry/zinc 0.85 1.51 1.30 0.32 Mixed industry/lead 1.39 0.55 Municipal incinerator 1.56 Sludge incinerator 1.76 0.02 Refinery/oil combustion 0.23 0.06 0.06 Electroplating 0.03 0.03 Sea/road salt 0.57 0.72 Crustal/soil 0.62 1.29 0.63 0.11 1.36 2.14 0.88 Biomass burning 0.51 0.30 1.20 0.31 aBrown et al. apportioned PM2.5 using STN data and organic carbon mass using speciated organic data. bMorishita data are averaged over 5 different sampling periods and weighted by number of samples.

Appendix H
MODELING INPUT FILES
SUPPORT DOCUMENTATION
FOR THE
FINE PARTICULATE SIP
April 2008

2005 AERMOD SUMMARY – DEARBORN MONITOR LOCATION *** AERMOD - VERSION 07026 *** *** 2005 MONITOR IMPACTS *** 04/28/08 *** POINT SOURCE DATA *** NUMBER EMISSION RATE BASE STACK STACK STACK STACK BLDG URBAN CAP/ EMIS RATE SOURCE PART. (GRAMS/SEC) X Y ELEV. HEIGHT TEMP. EXIT VEL. DIAMETER EXISTS SOURCE HOR SCALAR ID CATS. (METERS) (METERS) (METERS) (METERS) (DEG.K) (M/SEC) (METERS) VARY BY - - - - - - - - - - - - - - - - - - - - - - - - - - - - - - - - - - - - - - - - - - - - - - - - - - - - - - - - - - - - - - - - - BF_B_SS 0 0.60870E+00 322263.4 4685504.0 192.0 57.91 672.04 9.60 2.52 YES YES NO BF_C_SS 0 0.10486E+01 322221.8 4685586.5 192.0 64.01 672.04 13.70 2.74 YES YES NO BFCCH_BS 0 0.00000E+00 322262.1 4685580.0 192.0 60.96 338.71 19.96 2.74 YES YES NO LM_UL_BH 0 0.75700E-01 322184.0 4684950.0 192.0 10.97 294.26 22.64 0.61 YES YES NO HMTRN_BH 0 0.89800E-01 322024.8 4685203.0 192.0 8.23 352.60 0.05 1.75 YES YES NO BOF_ESP 0 0.42495E+01 321932.5 4685047.5 192.0 64.92 422.04 18.84 5.18 YES YES NO BOF_BH 0 0.00000E+00 322004.8 4685285.0 192.0 60.96 338.71 18.95 4.88 YES YES NO DESLF_BH 0 0.11050E+00 321971.5 4685217.5 192.0 11.28 380.37 0.05 1.68 YES YES NO LRF#1_S 0 0.85380E+00 321983.0 4684947.0 192.0 45.11 297.04 13.97 2.74 YES YES NO LRF2_FLX 0 0.48790E+00 322097.1 4684808.5 192.0 45.72 433.15 17.97 1.83 YES YES NO COKE_REC 0 0.24280E+00 322127.2 4684707.5 192.0 5.49 294.26 21.38 0.71 YES YES NO ANEAL_1S 0 0.11600E-01 321846.1 4685170.0 192.0 21.34 1060.93 0.05 0.76 YES YES NO ANEAL_2S 0 0.11600E-01 321826.2 4685209.5 192.0 21.34 1060.93 0.05 0.76 YES YES NO ANEAL_3S 0 0.11600E-01 321806.3 4685249.0 192.0 21.34 1060.93 0.05 0.76 YES YES NO ANEAL_4S 0 0.11600E-01 321786.4 4685288.5 192.0 21.34 1060.93 0.05 0.76 YES YES NO ANEAL_5S 0 0.11600E-01 321766.5 4685328.0 192.0 21.34 1060.93 0.05 0.76 YES YES NO ANEAL_6S 0 0.11600E-01 321746.6 4685367.5 192.0 21.34 1060.93 0.05 0.76 YES YES NO ANEAL_1N 0 0.11600E-01 321726.0 4685387.5 192.0 21.34 1060.93 0.05 0.76 YES YES NO ANEAL_2N 0 0.11600E-01 321713.8 4685412.0 192.0 21.34 1060.93 0.05 0.76 YES YES NO ANEAL_3N 0 0.11600E-01 321701.4 4685436.5 192.0 21.34 1060.93 0.05 0.76 YES YES NO ANEAL_4N 0 0.11600E-01 321689.1 4685461.0 192.0 21.34 1060.93 0.05 0.76 YES YES NO ANEAL_5N 0 0.11600E-01 321676.7 4685485.5 192.0 21.34 1060.93 0.05 0.76 YES YES NO RFURN1_1 0 0.17030E+00 320999.0 4685172.0 192.0 63.40 922.04 4.39 4.27 YES YES NO RFURN1_2 0 0.17030E+00 321004.0 4685162.0 192.0 63.40 922.04 4.39 4.27 YES YES NO RFURN2_1 0 0.17030E+00 321009.0 4685152.0 192.0 63.40 922.04 4.39 4.27 YES YES NO RFURN2_2 0 0.17030E+00 321014.0 4685141.0 192.0 63.40 922.04 4.39 4.27 YES YES NO RFURN3_1 0 0.17030E+00 321020.0 4685131.0 192.0 63.40 922.04 4.39 4.27 YES YES NO RFURN3_2 0 0.17030E+00 321025.0 4685120.0 192.0 63.40 922.04 4.39 4.27 YES YES NO EU0099 0 0.59750E+01 326027.0 4682852.0 192.0 96.01 477.60 4.28 5.03 NO YES NO EU0096 0 0.26820E+01 326192.0 4683221.0 192.0 20.73 294.30 15.16 3.30 NO YES NO EU0095 0 0.26310E+01 326475.0 4683520.0 192.0 19.81 294.30 10.35 3.05 NO YES NO RG0130 0 0.23970E+01 326323.0 4683637.0 192.0 60.96 416.50 15.63 5.33 NO YES NO EU0096A 0 0.12010E+01 326192.0 4683221.0 192.0 70.10 560.90 13.53 2.82 NO YES NO RG0133 0 0.98900E+00 326299.0 4683107.0 192.0 26.82 560.90 7.48 2.97 NO YES NO RG0132 0 0.87100E+00 326305.0 4683579.0 192.0 20.73 560.90 17.11 1.68 NO YES NO EU0095A 0 0.84500E+00 326475.0 4683520.0 192.0 60.96 383.20 13.37 2.84 NO YES NO EU0120 0 0.34600E+00 326309.0 4683644.0 192.0 33.22 544.30 21.15 1.40 NO YES NO RG0133A 0 0.29900E+00 326299.0 4683107.0 192.0 26.82 560.90 7.48 2.97 NO YES NO EU0118 0 0.24100E+00 326059.0 4683063.0 192.0 37.49 422.00 9.27 0.91 NO YES NO EU0076 0 0.21800E+00 325960.0 4683058.0 192.0 31.09 477.60 1.62 4.27 NO YES NO *** POINT SOURCE DATA *** NUMBER EMISSION RATE BASE STACK STACK STACK STACK BLDG URBAN CAP/ EMIS RATE SOURCE PART. (GRAMS/SEC) X Y ELEV. HEIGHT TEMP. EXIT VEL. DIAMETER EXISTS SOURCE HOR SCALAR ID CATS. (METERS) (METERS) (METERS) (METERS) (DEG.K) (M/SEC) (METERS) VARY BY - - - - - - - - - - - - - - - - - - - - - - - - - - - - - - - - - - - - - - - - - - - - - - - - - - - - - - - - - - - - - - - - - EU0076A 0 0.16500E+00 326087.0 4683007.0 192.0 31.09 477.60 1.62 4.27 NO YES NO RG0130A 0 0.15900E+00 326323.0 4683637.0 192.0 60.96 416.50 15.63 5.33 NO YES NO RG0132A 0 0.14700E+00 326305.0 4683579.0 192.0 20.73 560.90 17.11 1.68 NO YES NO A8648 0 0.49000E+00 321801.0 4686168.0 192.0 12.31 295.70 10.14 0.31 NO YES NO A9831 0 0.57000E+01 322000.0 4683150.0 192.0 49.43 455.50 10.24 1.91 NO YES NO B2132 0 0.36000E+00 322800.0 4675000.0 192.0 46.94 415.70 8.71 2.44 NO YES NO B2169 0 0.20500E+01 324525.0 4682560.0 192.0 12.19 294.30 10.00 0.30 NO YES NO B2810 0 0.12300E+01 325800.0 4682000.0 192.0 123.80 427.30 47.00 3.82 NO YES NO B2811 0 0.53700E+01 319700.0 4665600.0 192.0 162.69 419.70 41.04 4.34 NO YES NO B3518 0 0.16000E+00 324200.0 4682800.0 192.0 29.01 344.70 17.80 0.71 NO YES NO B3533 0 0.43000E+00 323800.0 4686900.0 192.0 12.19 294.30 10.00 0.30 NO YES NO B3567 0 0.21000E+00 323850.0 4683450.0 192.0 12.19 294.30 10.00 0.30 NO YES NO N6631 0 0.24300E+01 322513.0 4685652.0 192.0 55.27 416.40 17.46 3.37 NO YES NO *** VOLUME SOURCE DATA *** NUMBER EMISSION RATE BASE RELEASE INIT. INIT. URBAN EMISSION RATE SOURCE PART. (GRAMS/SEC) X Y ELEV. HEIGHT SY SZ SOURCE SCALAR VARY

ID CATS. (METERS) (METERS) (METERS) (METERS) (METERS) (METERS) BY - - - - - - - - - - - - - - - - - - - - - - - - - - - - - - - - - - - - - - - - - - - - - - - - - - - - - - - - - - - - - B_CH_RM1 0 0.89400E-01 322245.7 4685529.0 192.0 23.17 6.55 10.77 YES B_CH_RM2 0 0.89400E-01 322239.4 4685541.5 192.0 23.17 6.55 10.77 YES B_CH_RM3 0 0.89400E-01 322233.0 4685554.0 192.0 23.17 6.55 10.77 YES B_CH_RM4 0 0.89400E-01 322226.5 4685567.0 192.0 23.17 6.55 10.77 YES B_CH_RM5 0 0.89400E-01 322220.4 4685579.5 192.0 23.17 6.55 10.77 YES C_CH_RM1 0 0.19500E+00 322190.4 4685634.5 192.0 29.26 6.59 13.61 YES C_CH_RM2 0 0.19500E+00 322184.1 4685647.0 192.0 29.26 6.59 13.61 YES C_CH_RM3 0 0.19500E+00 322177.7 4685659.5 192.0 29.26 6.59 13.61 YES C_CH_RM4 0 0.19500E+00 322171.4 4685672.5 192.0 29.26 6.59 13.61 YES BOF_RMW1 0 0.31400E+00 322007.2 4685043.5 192.0 65.53 8.62 30.20 YES BOF_RMW2 0 0.31400E+00 321998.8 4685060.0 192.0 65.53 8.62 30.20 YES BOF_RMW3 0 0.31400E+00 321990.5 4685076.5 192.0 65.53 8.62 30.20 YES BOF_RMW4 0 0.31400E+00 321982.3 4685093.0 192.0 65.53 8.62 30.20 YES BOF_RMW5 0 0.31400E+00 321973.8 4685109.5 192.0 65.53 8.62 30.20 YES BOF_RMW6 0 0.31400E+00 321965.7 4685126.0 192.0 65.53 8.62 30.20 YES BOF_RME1 0 0.31400E+00 322043.5 4685061.0 192.0 65.53 7.66 30.20 YES BOF_RME2 0 0.31400E+00 322036.2 4685075.5 192.0 65.53 7.66 30.20 YES BOF_RME3 0 0.31400E+00 322028.7 4685090.0 192.0 65.53 7.66 30.20 YES BOF_RME4 0 0.31400E+00 322021.3 4685105.0 192.0 65.53 7.66 30.20 YES BOF_RME5 0 0.31400E+00 322013.9 4685119.5 192.0 65.53 7.66 30.20 YES BOF_RMN1 0 0.31400E+00 321991.2 4685164.5 192.0 57.61 4.47 26.51 YES BOF_RMN2 0 0.31400E+00 321986.9 4685173.0 192.0 57.61 4.47 26.51 YES BOF_RMN3 0 0.31400E+00 321982.7 4685181.5 192.0 57.61 4.47 26.51 YES BOF_RMN4 0 0.31400E+00 321978.3 4685190.0 192.0 57.61 4.47 26.51 YES BOF_RMN5 0 0.31400E+00 321973.8 4685199.0 192.0 57.61 4.47 26.51 YES HND_SCF1 0 0.75600E-01 321254.4 4684513.0 192.0 31.39 7.10 14.60 YES HND_SCF2 0 0.75600E-01 321247.6 4684527.0 192.0 31.39 7.10 14.60 YES HND_SCF3 0 0.75600E-01 321240.7 4684540.5 192.0 31.39 7.10 14.60 YES HND_SCF4 0 0.75600E-01 321233.8 4684554.0 192.0 31.39 7.10 14.60 YES HND_SCF5 0 0.75600E-01 321227.0 4684568.0 192.0 31.39 7.10 14.60 YES GROUP ID SOURCE IDs ALL BF_B_SS , BF_C_SS , B_CH_RM1, B_CH_RM2, B_CH_RM3, B_CH_RM4, B_CH_RM5, C_CH_RM1, C_CH_RM2, C_CH_RM3, C_CH_RM4, BFCCH_BS, LM_UL_BH, HMTRN_BH, BOF_ESP , BOF_BH , BOF_RMW1, BOF_RMW2, BOF_RMW3, BOF_RMW4, BOF_RMW5, BOF_RMW6, BOF_RME1, BOF_RME2, BOF_RME3, BOF_RME4, BOF_RME5, BOF_RMN1, BOF_RMN2, BOF_RMN3, BOF_RMN4, BOF_RMN5, DESLF_BH, LRF#1_S , LRF2_FLX, COKE_REC, ANEAL_1S, ANEAL_2S, ANEAL_3S, ANEAL_4S, ANEAL_5S, ANEAL_6S, ANEAL_1N, ANEAL_2N, ANEAL_3N, ANEAL_4N, ANEAL_5N, RFURN1_1, RFURN1_2, RFURN2_1, RFURN2_2, RFURN3_1, RFURN3_2, HND_SCF1, HND_SCF2, HND_SCF3, HND_SCF4, HND_SCF5, EU0099 , EU0096 , EU0095 , RG0130 , EU0096A , RG0133 , RG0132 , EU0095A , EU0120 , RG0133A , EU0118 , EU0076 , EU0076A , RG0130A , RG0132A , A8648 , A9831 , B2132 , B2169 , B2810 , B2811 , B3518 , B3533 , B3567 , N6631 , A8640 BF_B_SS , BF_C_SS , B_CH_RM1, B_CH_RM2, B_CH_RM3, B_CH_RM4, B_CH_RM5, C_CH_RM1, C_CH_RM2, C_CH_RM3, C_CH_RM4, BFCCH_BS, LM_UL_BH, HMTRN_BH, BOF_ESP , BOF_BH , BOF_RMW1, BOF_RMW2, BOF_RMW3, BOF_RMW4, BOF_RMW5, BOF_RMW6, BOF_RME1, BOF_RME2, BOF_RME3, BOF_RME4, BOF_RME5, BOF_RMN1, BOF_RMN2, BOF_RMN3, BOF_RMN4, BOF_RMN5, DESLF_BH, LRF#1_S , LRF2_FLX, COKE_REC, ANEAL_1S, ANEAL_2S, ANEAL_3S, ANEAL_4S, ANEAL_5S, ANEAL_6S, ANEAL_1N, ANEAL_2N, ANEAL_3N, ANEAL_4N, RFURN1_1, RFURN1_2, RFURN2_1, RFURN2_2, RFURN3_1, RFURN3_2, HND_SCF1, HND_SCF2, HND_SCF3, HND_SCF4, HND_SCF5, A7809 EU0099 , EU0096 , EU0095 , RG0130 , EU0096A , RG0133 , RG0132 , EU0095A , EU0120 , RG0133A , EU0118 , EU0076 , EU0076A , RG0130A , RG0132A , A8648 A8648 , A9831 A9831 , B2132 B2132 , B2169 B2169 ,

B2810 B2810 , B2811 B2811 , SUMMARY OF MAXIMUM ANNUAL ( 1 YRS) RESULTS *** ALL 1ST HIGHEST VALUE IS 4.60659 AT ( 322805.00, 4685985.00 A8640 1ST HIGHEST VALUE IS 2.95616 AT ( 322805.00, 4685985.00 A7809 1ST HIGHEST VALUE IS 0.26618 AT ( 322805.00, 4685985.00 A8648 1ST HIGHEST VALUE IS 0.56898 AT ( 322805.00, 4685985.00 A9831 1ST HIGHEST VALUE IS 0.19489 AT ( 322805.00, 4685985.00 B2132 1ST HIGHEST VALUE IS 0.00403 AT ( 322805.00, 4685985.00 B2169 1ST HIGHEST VALUE IS 0.25617 AT ( 322805.00, 4685985.00 B2810 1ST HIGHEST VALUE IS 0.00447 AT ( 322805.00, 4685985.00 B2811 1ST HIGHEST VALUE IS 0.01419 AT ( 322805.00, 4685985.00 B3518 1ST HIGHEST VALUE IS 0.01233 AT ( 322805.00, 4685985.00 B3533 1ST HIGHEST VALUE IS 0.22609 AT ( 322805.00, 4685985.00 B3567 1ST HIGHEST VALUE IS 0.04949 AT ( 322805.00, 4685985.00 N6631 1ST HIGHEST VALUE IS 0.04971 AT ( 322805.00, 4685985.00

2005 AERMOD SUMMARY – SWHS MONITOR LOCATION *** AERMOD - VERSION 07026 *** *** 2005 MONITOR IMPACTS *** 04/28/08 *** POINT SOURCE DATA *** NUMBER EMISSION RATE BASE STACK STACK STACK STACK BLDG URBAN CAP/ EMIS RATE SOURCE PART. (GRAMS/SEC) X Y ELEV. HEIGHT TEMP. EXIT VEL. DIAMETER EXISTS SOURCE HOR SCALAR ID CATS. (METERS) (METERS) (METERS) (METERS) (DEG.K) (M/SEC) (METERS) VARY BY - - - - - - - - - - - - - - - - - - - - - - - - - - - - - - - - - - - - - - - - - - - - - - - - - - - - - - - - - - - - - - - - - BF_B_SS 0 0.60870E+00 322263.4 4685504.0 192.0 57.91 672.04 9.60 2.52 YES YES NO BF_C_SS 0 0.10486E+01 322221.8 4685586.5 192.0 64.01 672.04 13.70 2.74 YES YES NO BFCCH_BS 0 0.00000E+00 322262.1 4685580.0 192.0 60.96 338.71 19.96 2.74 YES YES NO LM_UL_BH 0 0.75700E-01 322184.0 4684950.0 192.0 10.97 294.26 22.64 0.61 YES YES NO HMTRN_BH 0 0.89800E-01 322024.8 4685203.0 192.0 8.23 352.60 0.05 1.75 YES YES NO BOF_ESP 0 0.42495E+01 321932.5 4685047.5 192.0 64.92 422.04 18.84 5.18 YES YES NO BOF_BH 0 0.00000E+00 322004.8 4685285.0 192.0 60.96 338.71 18.95 4.88 YES YES NO DESLF_BH 0 0.11050E+00 321971.5 4685217.5 192.0 11.28 380.37 0.05 1.68 YES YES NO LRF#1_S 0 0.85380E+00 321983.0 4684947.0 192.0 45.11 297.04 13.97 2.74 YES YES NO LRF2_FLX 0 0.48790E+00 322097.1 4684808.5 192.0 45.72 433.15 17.97 1.83 YES YES NO COKE_REC 0 0.24280E+00 322127.2 4684707.5 192.0 5.49 294.26 21.38 0.71 YES YES NO ANEAL_1S 0 0.11600E-01 321846.1 4685170.0 192.0 21.34 1060.93 0.05 0.76 YES YES NO ANEAL_2S 0 0.11600E-01 321826.2 4685209.5 192.0 21.34 1060.93 0.05 0.76 YES YES NO ANEAL_3S 0 0.11600E-01 321806.3 4685249.0 192.0 21.34 1060.93 0.05 0.76 YES YES NO ANEAL_4S 0 0.11600E-01 321786.4 4685288.5 192.0 21.34 1060.93 0.05 0.76 YES YES NO ANEAL_5S 0 0.11600E-01 321766.5 4685328.0 192.0 21.34 1060.93 0.05 0.76 YES YES NO ANEAL_6S 0 0.11600E-01 321746.6 4685367.5 192.0 21.34 1060.93 0.05 0.76 YES YES NO ANEAL_1N 0 0.11600E-01 321726.0 4685387.5 192.0 21.34 1060.93 0.05 0.76 YES YES NO ANEAL_2N 0 0.11600E-01 321713.8 4685412.0 192.0 21.34 1060.93 0.05 0.76 YES YES NO ANEAL_3N 0 0.11600E-01 321701.4 4685436.5 192.0 21.34 1060.93 0.05 0.76 YES YES NO ANEAL_4N 0 0.11600E-01 321689.1 4685461.0 192.0 21.34 1060.93 0.05 0.76 YES YES NO ANEAL_5N 0 0.11600E-01 321676.7 4685485.5 192.0 21.34 1060.93 0.05 0.76 YES YES NO RFURN1_1 0 0.17030E+00 320999.0 4685172.0 192.0 63.40 922.04 4.39 4.27 YES YES NO RFURN1_2 0 0.17030E+00 321004.0 4685162.0 192.0 63.40 922.04 4.39 4.27 YES YES NO RFURN2_1 0 0.17030E+00 321009.0 4685152.0 192.0 63.40 922.04 4.39 4.27 YES YES NO RFURN2_2 0 0.17030E+00 321014.0 4685141.0 192.0 63.40 922.04 4.39 4.27 YES YES NO RFURN3_1 0 0.17030E+00 321020.0 4685131.0 192.0 63.40 922.04 4.39 4.27 YES YES NO RFURN3_2 0 0.17030E+00 321025.0 4685120.0 192.0 63.40 922.04 4.39 4.27 YES YES NO EU0099 0 0.59750E+01 326027.0 4682852.0 192.0 96.01 477.60 4.28 5.03 NO YES NO EU0096 0 0.26820E+01 326192.0 4683221.0 192.0 20.73 294.30 15.16 3.30 NO YES NO EU0095 0 0.26310E+01 326475.0 4683520.0 192.0 19.81 294.30 10.35 3.05 NO YES NO RG0130 0 0.23970E+01 326323.0 4683637.0 192.0 60.96 416.50 15.63 5.33 NO YES NO EU0096A 0 0.12010E+01 326192.0 4683221.0 192.0 70.10 560.90 13.53 2.82 NO YES NO RG0133 0 0.98900E+00 326299.0 4683107.0 192.0 26.82 560.90 7.48 2.97 NO YES NO RG0132 0 0.87100E+00 326305.0 4683579.0 192.0 20.73 560.90 17.11 1.68 NO YES NO EU0095A 0 0.84500E+00 326475.0 4683520.0 192.0 60.96 383.20 13.37 2.84 NO YES NO EU0120 0 0.34600E+00 326309.0 4683644.0 192.0 33.22 544.30 21.15 1.40 NO YES NO RG0133A 0 0.29900E+00 326299.0 4683107.0 192.0 26.82 560.90 7.48 2.97 NO YES NO EU0118 0 0.24100E+00 326059.0 4683063.0 192.0 37.49 422.00 9.27 0.91 NO YES NO EU0076 0 0.21800E+00 325960.0 4683058.0 192.0 31.09 477.60 1.62 4.27 NO YES NO *** POINT SOURCE DATA *** NUMBER EMISSION RATE BASE STACK STACK STACK STACK BLDG URBAN CAP/ EMIS RATE SOURCE PART. (GRAMS/SEC) X Y ELEV. HEIGHT TEMP. EXIT VEL. DIAMETER EXISTS SOURCE HOR SCALAR ID CATS. (METERS) (METERS) (METERS) (METERS) (DEG.K) (M/SEC) (METERS) VARY BY - - - - - - - - - - - - - - - - - - - - - - - - - - - - - - - - - - - - - - - - - - - - - - - - - - - - - - - - - - - - - - - - - EU0076A 0 0.16500E+00 326087.0 4683007.0 192.0 31.09 477.60 1.62 4.27 NO YES NO RG0130A 0 0.15900E+00 326323.0 4683637.0 192.0 60.96 416.50 15.63 5.33 NO YES NO RG0132A 0 0.14700E+00 326305.0 4683579.0 192.0 20.73 560.90 17.11 1.68 NO YES NO A8648 0 0.49000E+00 321801.0 4686168.0 192.0 12.31 295.70 10.14 0.31 NO YES NO A9831 0 0.57000E+01 322000.0 4683150.0 192.0 49.43 455.50 10.24 1.91 NO YES NO B2132 0 0.36000E+00 322800.0 4675000.0 192.0 46.94 415.70 8.71 2.44 NO YES NO B2169 0 0.20500E+01 324525.0 4682560.0 192.0 12.19 294.30 10.00 0.30 NO YES NO B2810 0 0.12300E+01 325800.0 4682000.0 192.0 123.80 427.30 47.00 3.82 NO YES NO B2811 0 0.53700E+01 319700.0 4665600.0 192.0 162.69 419.70 41.04 4.34 NO YES NO B3518 0 0.16000E+00 324200.0 4682800.0 192.0 29.01 344.70 17.80 0.71 NO YES NO B3533 0 0.43000E+00 323800.0 4686900.0 192.0 12.19 294.30 10.00 0.30 NO YES NO B3567 0 0.21000E+00 323850.0 4683450.0 192.0 12.19 294.30 10.00 0.30 NO YES NO N6631 0 0.24300E+01 322513.0 4685652.0 192.0 55.27 416.40 17.46 3.37 NO YES NO *** VOLUME SOURCE DATA *** NUMBER EMISSION RATE BASE RELEASE INIT. INIT. URBAN EMISSION RATE SOURCE PART. (GRAMS/SEC) X Y ELEV. HEIGHT SY SZ SOURCE SCALAR VARY ID CATS. (METERS) (METERS) (METERS) (METERS) (METERS) (METERS) BY

- - - - - - - - - - - - - - - - - - - - - - - - - - - - - - - - - - - - - - - - - - - - - - - - - - - - - - - - - - - - - B_CH_RM1 0 0.89400E-01 322245.7 4685529.0 192.0 23.17 6.55 10.77 YES B_CH_RM2 0 0.89400E-01 322239.4 4685541.5 192.0 23.17 6.55 10.77 YES B_CH_RM3 0 0.89400E-01 322233.0 4685554.0 192.0 23.17 6.55 10.77 YES B_CH_RM4 0 0.89400E-01 322226.5 4685567.0 192.0 23.17 6.55 10.77 YES B_CH_RM5 0 0.89400E-01 322220.4 4685579.5 192.0 23.17 6.55 10.77 YES C_CH_RM1 0 0.19500E+00 322190.4 4685634.5 192.0 29.26 6.59 13.61 YES C_CH_RM2 0 0.19500E+00 322184.1 4685647.0 192.0 29.26 6.59 13.61 YES C_CH_RM3 0 0.19500E+00 322177.7 4685659.5 192.0 29.26 6.59 13.61 YES C_CH_RM4 0 0.19500E+00 322171.4 4685672.5 192.0 29.26 6.59 13.61 YES BOF_RMW1 0 0.31400E+00 322007.2 4685043.5 192.0 65.53 8.62 30.20 YES BOF_RMW2 0 0.31400E+00 321998.8 4685060.0 192.0 65.53 8.62 30.20 YES BOF_RMW3 0 0.31400E+00 321990.5 4685076.5 192.0 65.53 8.62 30.20 YES BOF_RMW4 0 0.31400E+00 321982.3 4685093.0 192.0 65.53 8.62 30.20 YES BOF_RMW5 0 0.31400E+00 321973.8 4685109.5 192.0 65.53 8.62 30.20 YES BOF_RMW6 0 0.31400E+00 321965.7 4685126.0 192.0 65.53 8.62 30.20 YES BOF_RME1 0 0.31400E+00 322043.5 4685061.0 192.0 65.53 7.66 30.20 YES BOF_RME2 0 0.31400E+00 322036.2 4685075.5 192.0 65.53 7.66 30.20 YES BOF_RME3 0 0.31400E+00 322028.7 4685090.0 192.0 65.53 7.66 30.20 YES BOF_RME4 0 0.31400E+00 322021.3 4685105.0 192.0 65.53 7.66 30.20 YES BOF_RME5 0 0.31400E+00 322013.9 4685119.5 192.0 65.53 7.66 30.20 YES BOF_RMN1 0 0.31400E+00 321991.2 4685164.5 192.0 57.61 4.47 26.51 YES BOF_RMN2 0 0.31400E+00 321986.9 4685173.0 192.0 57.61 4.47 26.51 YES BOF_RMN3 0 0.31400E+00 321982.7 4685181.5 192.0 57.61 4.47 26.51 YES BOF_RMN4 0 0.31400E+00 321978.3 4685190.0 192.0 57.61 4.47 26.51 YES BOF_RMN5 0 0.31400E+00 321973.8 4685199.0 192.0 57.61 4.47 26.51 YES HND_SCF1 0 0.75600E-01 321254.4 4684513.0 192.0 31.39 7.10 14.60 YES HND_SCF2 0 0.75600E-01 321247.6 4684527.0 192.0 31.39 7.10 14.60 YES HND_SCF3 0 0.75600E-01 321240.7 4684540.5 192.0 31.39 7.10 14.60 YES HND_SCF4 0 0.75600E-01 321233.8 4684554.0 192.0 31.39 7.10 14.60 YES HND_SCF5 0 0.75600E-01 321227.0 4684568.0 192.0 31.39 7.10 14.60 YES GROUP ID SOURCE IDs ALL BF_B_SS , BF_C_SS , B_CH_RM1, B_CH_RM2, B_CH_RM3, B_CH_RM4, B_CH_RM5, C_CH_RM1, C_CH_RM2, C_CH_RM3, C_CH_RM4, BFCCH_BS, LM_UL_BH, HMTRN_BH, BOF_ESP , BOF_BH , BOF_RMW1, BOF_RMW2, BOF_RMW3, BOF_RMW4, BOF_RMW5, BOF_RMW6, BOF_RME1, BOF_RME2, BOF_RME3, BOF_RME4, BOF_RME5, BOF_RMN1, BOF_RMN2, BOF_RMN3, BOF_RMN4, BOF_RMN5, DESLF_BH, LRF#1_S , LRF2_FLX, COKE_REC, ANEAL_1S, ANEAL_2S, ANEAL_3S, ANEAL_4S, ANEAL_5S, ANEAL_6S, ANEAL_1N, ANEAL_2N, ANEAL_3N, ANEAL_4N, ANEAL_5N, RFURN1_1, RFURN1_2, RFURN2_1, RFURN2_2, RFURN3_1, RFURN3_2, HND_SCF1, HND_SCF2, HND_SCF3, HND_SCF4, HND_SCF5, EU0099 , EU0096 , EU0095 , RG0130 , EU0096A , RG0133 , RG0132 , EU0095A , EU0120 , RG0133A , EU0118 , EU0076 , EU0076A , RG0130A , RG0132A , A8648 , A9831 , B2132 , B2169 , B2810 , B2811 , B3518 , B3533 , B3567 , N6631 , A8640 BF_B_SS , BF_C_SS , B_CH_RM1, B_CH_RM2, B_CH_RM3, B_CH_RM4, B_CH_RM5, C_CH_RM1, C_CH_RM2, C_CH_RM3, C_CH_RM4, BFCCH_BS, LM_UL_BH, HMTRN_BH, BOF_ESP , BOF_BH , BOF_RMW1, BOF_RMW2, BOF_RMW3, BOF_RMW4, BOF_RMW5, BOF_RMW6, BOF_RME1, BOF_RME2, BOF_RME3, BOF_RME4, BOF_RME5, BOF_RMN1, BOF_RMN2, BOF_RMN3, BOF_RMN4, BOF_RMN5, DESLF_BH, LRF#1_S , LRF2_FLX, COKE_REC, ANEAL_1S, ANEAL_2S, ANEAL_3S, ANEAL_4S, ANEAL_5S, ANEAL_6S, ANEAL_1N, ANEAL_2N, ANEAL_3N, ANEAL_4N, RFURN1_1, RFURN1_2, RFURN2_1, RFURN2_2, RFURN3_1, RFURN3_2, HND_SCF1, HND_SCF2, HND_SCF3, HND_SCF4, HND_SCF5, A7809 EU0099 , EU0096 , EU0095 , RG0130 , EU0096A , RG0133 , RG0132 , EU0095A , EU0120 , RG0133A , EU0118 , EU0076 , EU0076A , RG0130A , RG0132A , A8648 A8648 , A9831 A9831 , B2132 B2132 , B2169 B2169 ,

B2810 B2810 , B2811 B2811 , SUMMARY OF MAXIMUM ANNUAL ( 1 YRS) RESULTS *** ALL 1ST HIGHEST VALUE IS 2.59188 AT ( 326344.00, 4685318.00 A8640 1ST HIGHEST VALUE IS 0.50181 AT ( 326344.00, 4685318.00 A7809 1ST HIGHEST VALUE IS 1.32983 AT ( 326344.00, 4685318.00 A8648 1ST HIGHEST VALUE IS 0.05653 AT ( 326344.00, 4685318.00 A9831 1ST HIGHEST VALUE IS 0.12335 AT ( 326344.00, 4685318.00 B2132 1ST HIGHEST VALUE IS 0.00528 AT ( 326344.00, 4685318.00 B2169 1ST HIGHEST VALUE IS 0.37947 AT ( 326344.00, 4685318.00 B2810 1ST HIGHEST VALUE IS 0.00836 AT ( 326344.00, 4685318.00 B2811 1ST HIGHEST VALUE IS 0.01458 AT ( 326344.00, 4685318.00 B3518 1ST HIGHEST VALUE IS 0.01348 AT ( 326344.00, 4685318.00 B3533 1ST HIGHEST VALUE IS 0.09325 AT ( 326344.00, 4685318.00 B3567 1ST HIGHEST VALUE IS 0.04027 AT ( 326344.00, 4685318.00 N6631 1ST HIGHEST VALUE IS 0.02793 AT ( 326344.00, 4685318.00
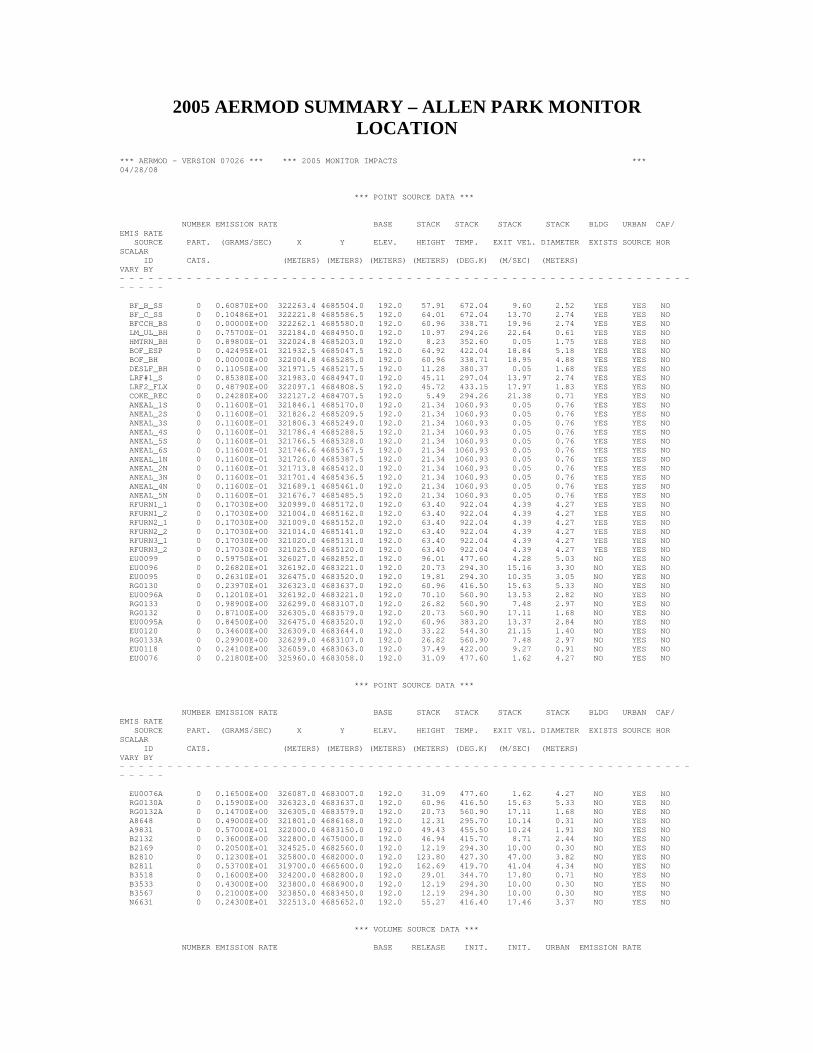
2005 AERMOD SUMMARY – ALLEN PARK MONITOR LOCATION
*** AERMOD - VERSION 07026 *** *** 2005 MONITOR IMPACTS *** 04/28/08 *** POINT SOURCE DATA *** NUMBER EMISSION RATE BASE STACK STACK STACK STACK BLDG URBAN CAP/ EMIS RATE SOURCE PART. (GRAMS/SEC) X Y ELEV. HEIGHT TEMP. EXIT VEL. DIAMETER EXISTS SOURCE HOR SCALAR ID CATS. (METERS) (METERS) (METERS) (METERS) (DEG.K) (M/SEC) (METERS) VARY BY - - - - - - - - - - - - - - - - - - - - - - - - - - - - - - - - - - - - - - - - - - - - - - - - - - - - - - - - - - - - - - - - - BF_B_SS 0 0.60870E+00 322263.4 4685504.0 192.0 57.91 672.04 9.60 2.52 YES YES NO BF_C_SS 0 0.10486E+01 322221.8 4685586.5 192.0 64.01 672.04 13.70 2.74 YES YES NO BFCCH_BS 0 0.00000E+00 322262.1 4685580.0 192.0 60.96 338.71 19.96 2.74 YES YES NO LM_UL_BH 0 0.75700E-01 322184.0 4684950.0 192.0 10.97 294.26 22.64 0.61 YES YES NO HMTRN_BH 0 0.89800E-01 322024.8 4685203.0 192.0 8.23 352.60 0.05 1.75 YES YES NO BOF_ESP 0 0.42495E+01 321932.5 4685047.5 192.0 64.92 422.04 18.84 5.18 YES YES NO BOF_BH 0 0.00000E+00 322004.8 4685285.0 192.0 60.96 338.71 18.95 4.88 YES YES NO DESLF_BH 0 0.11050E+00 321971.5 4685217.5 192.0 11.28 380.37 0.05 1.68 YES YES NO LRF#1_S 0 0.85380E+00 321983.0 4684947.0 192.0 45.11 297.04 13.97 2.74 YES YES NO LRF2_FLX 0 0.48790E+00 322097.1 4684808.5 192.0 45.72 433.15 17.97 1.83 YES YES NO COKE_REC 0 0.24280E+00 322127.2 4684707.5 192.0 5.49 294.26 21.38 0.71 YES YES NO ANEAL_1S 0 0.11600E-01 321846.1 4685170.0 192.0 21.34 1060.93 0.05 0.76 YES YES NO ANEAL_2S 0 0.11600E-01 321826.2 4685209.5 192.0 21.34 1060.93 0.05 0.76 YES YES NO ANEAL_3S 0 0.11600E-01 321806.3 4685249.0 192.0 21.34 1060.93 0.05 0.76 YES YES NO ANEAL_4S 0 0.11600E-01 321786.4 4685288.5 192.0 21.34 1060.93 0.05 0.76 YES YES NO ANEAL_5S 0 0.11600E-01 321766.5 4685328.0 192.0 21.34 1060.93 0.05 0.76 YES YES NO ANEAL_6S 0 0.11600E-01 321746.6 4685367.5 192.0 21.34 1060.93 0.05 0.76 YES YES NO ANEAL_1N 0 0.11600E-01 321726.0 4685387.5 192.0 21.34 1060.93 0.05 0.76 YES YES NO ANEAL_2N 0 0.11600E-01 321713.8 4685412.0 192.0 21.34 1060.93 0.05 0.76 YES YES NO ANEAL_3N 0 0.11600E-01 321701.4 4685436.5 192.0 21.34 1060.93 0.05 0.76 YES YES NO ANEAL_4N 0 0.11600E-01 321689.1 4685461.0 192.0 21.34 1060.93 0.05 0.76 YES YES NO ANEAL_5N 0 0.11600E-01 321676.7 4685485.5 192.0 21.34 1060.93 0.05 0.76 YES YES NO RFURN1_1 0 0.17030E+00 320999.0 4685172.0 192.0 63.40 922.04 4.39 4.27 YES YES NO RFURN1_2 0 0.17030E+00 321004.0 4685162.0 192.0 63.40 922.04 4.39 4.27 YES YES NO RFURN2_1 0 0.17030E+00 321009.0 4685152.0 192.0 63.40 922.04 4.39 4.27 YES YES NO RFURN2_2 0 0.17030E+00 321014.0 4685141.0 192.0 63.40 922.04 4.39 4.27 YES YES NO RFURN3_1 0 0.17030E+00 321020.0 4685131.0 192.0 63.40 922.04 4.39 4.27 YES YES NO RFURN3_2 0 0.17030E+00 321025.0 4685120.0 192.0 63.40 922.04 4.39 4.27 YES YES NO EU0099 0 0.59750E+01 326027.0 4682852.0 192.0 96.01 477.60 4.28 5.03 NO YES NO EU0096 0 0.26820E+01 326192.0 4683221.0 192.0 20.73 294.30 15.16 3.30 NO YES NO EU0095 0 0.26310E+01 326475.0 4683520.0 192.0 19.81 294.30 10.35 3.05 NO YES NO RG0130 0 0.23970E+01 326323.0 4683637.0 192.0 60.96 416.50 15.63 5.33 NO YES NO EU0096A 0 0.12010E+01 326192.0 4683221.0 192.0 70.10 560.90 13.53 2.82 NO YES NO RG0133 0 0.98900E+00 326299.0 4683107.0 192.0 26.82 560.90 7.48 2.97 NO YES NO RG0132 0 0.87100E+00 326305.0 4683579.0 192.0 20.73 560.90 17.11 1.68 NO YES NO EU0095A 0 0.84500E+00 326475.0 4683520.0 192.0 60.96 383.20 13.37 2.84 NO YES NO EU0120 0 0.34600E+00 326309.0 4683644.0 192.0 33.22 544.30 21.15 1.40 NO YES NO RG0133A 0 0.29900E+00 326299.0 4683107.0 192.0 26.82 560.90 7.48 2.97 NO YES NO EU0118 0 0.24100E+00 326059.0 4683063.0 192.0 37.49 422.00 9.27 0.91 NO YES NO EU0076 0 0.21800E+00 325960.0 4683058.0 192.0 31.09 477.60 1.62 4.27 NO YES NO *** POINT SOURCE DATA *** NUMBER EMISSION RATE BASE STACK STACK STACK STACK BLDG URBAN CAP/ EMIS RATE SOURCE PART. (GRAMS/SEC) X Y ELEV. HEIGHT TEMP. EXIT VEL. DIAMETER EXISTS SOURCE HOR SCALAR ID CATS. (METERS) (METERS) (METERS) (METERS) (DEG.K) (M/SEC) (METERS) VARY BY - - - - - - - - - - - - - - - - - - - - - - - - - - - - - - - - - - - - - - - - - - - - - - - - - - - - - - - - - - - - - - - - - EU0076A 0 0.16500E+00 326087.0 4683007.0 192.0 31.09 477.60 1.62 4.27 NO YES NO RG0130A 0 0.15900E+00 326323.0 4683637.0 192.0 60.96 416.50 15.63 5.33 NO YES NO RG0132A 0 0.14700E+00 326305.0 4683579.0 192.0 20.73 560.90 17.11 1.68 NO YES NO A8648 0 0.49000E+00 321801.0 4686168.0 192.0 12.31 295.70 10.14 0.31 NO YES NO A9831 0 0.57000E+01 322000.0 4683150.0 192.0 49.43 455.50 10.24 1.91 NO YES NO B2132 0 0.36000E+00 322800.0 4675000.0 192.0 46.94 415.70 8.71 2.44 NO YES NO B2169 0 0.20500E+01 324525.0 4682560.0 192.0 12.19 294.30 10.00 0.30 NO YES NO B2810 0 0.12300E+01 325800.0 4682000.0 192.0 123.80 427.30 47.00 3.82 NO YES NO B2811 0 0.53700E+01 319700.0 4665600.0 192.0 162.69 419.70 41.04 4.34 NO YES NO B3518 0 0.16000E+00 324200.0 4682800.0 192.0 29.01 344.70 17.80 0.71 NO YES NO B3533 0 0.43000E+00 323800.0 4686900.0 192.0 12.19 294.30 10.00 0.30 NO YES NO B3567 0 0.21000E+00 323850.0 4683450.0 192.0 12.19 294.30 10.00 0.30 NO YES NO N6631 0 0.24300E+01 322513.0 4685652.0 192.0 55.27 416.40 17.46 3.37 NO YES NO *** VOLUME SOURCE DATA *** NUMBER EMISSION RATE BASE RELEASE INIT. INIT. URBAN EMISSION RATE

SOURCE PART. (GRAMS/SEC) X Y ELEV. HEIGHT SY SZ SOURCE SCALAR VARY ID CATS. (METERS) (METERS) (METERS) (METERS) (METERS) (METERS) BY - - - - - - - - - - - - - - - - - - - - - - - - - - - - - - - - - - - - - - - - - - - - - - - - - - - - - - - - - - - - - B_CH_RM1 0 0.89400E-01 322245.7 4685529.0 192.0 23.17 6.55 10.77 YES B_CH_RM2 0 0.89400E-01 322239.4 4685541.5 192.0 23.17 6.55 10.77 YES B_CH_RM3 0 0.89400E-01 322233.0 4685554.0 192.0 23.17 6.55 10.77 YES B_CH_RM4 0 0.89400E-01 322226.5 4685567.0 192.0 23.17 6.55 10.77 YES B_CH_RM5 0 0.89400E-01 322220.4 4685579.5 192.0 23.17 6.55 10.77 YES C_CH_RM1 0 0.19500E+00 322190.4 4685634.5 192.0 29.26 6.59 13.61 YES C_CH_RM2 0 0.19500E+00 322184.1 4685647.0 192.0 29.26 6.59 13.61 YES C_CH_RM3 0 0.19500E+00 322177.7 4685659.5 192.0 29.26 6.59 13.61 YES C_CH_RM4 0 0.19500E+00 322171.4 4685672.5 192.0 29.26 6.59 13.61 YES BOF_RMW1 0 0.31400E+00 322007.2 4685043.5 192.0 65.53 8.62 30.20 YES BOF_RMW2 0 0.31400E+00 321998.8 4685060.0 192.0 65.53 8.62 30.20 YES BOF_RMW3 0 0.31400E+00 321990.5 4685076.5 192.0 65.53 8.62 30.20 YES BOF_RMW4 0 0.31400E+00 321982.3 4685093.0 192.0 65.53 8.62 30.20 YES BOF_RMW5 0 0.31400E+00 321973.8 4685109.5 192.0 65.53 8.62 30.20 YES BOF_RMW6 0 0.31400E+00 321965.7 4685126.0 192.0 65.53 8.62 30.20 YES BOF_RME1 0 0.31400E+00 322043.5 4685061.0 192.0 65.53 7.66 30.20 YES BOF_RME2 0 0.31400E+00 322036.2 4685075.5 192.0 65.53 7.66 30.20 YES BOF_RME3 0 0.31400E+00 322028.7 4685090.0 192.0 65.53 7.66 30.20 YES BOF_RME4 0 0.31400E+00 322021.3 4685105.0 192.0 65.53 7.66 30.20 YES BOF_RME5 0 0.31400E+00 322013.9 4685119.5 192.0 65.53 7.66 30.20 YES BOF_RMN1 0 0.31400E+00 321991.2 4685164.5 192.0 57.61 4.47 26.51 YES BOF_RMN2 0 0.31400E+00 321986.9 4685173.0 192.0 57.61 4.47 26.51 YES BOF_RMN3 0 0.31400E+00 321982.7 4685181.5 192.0 57.61 4.47 26.51 YES BOF_RMN4 0 0.31400E+00 321978.3 4685190.0 192.0 57.61 4.47 26.51 YES BOF_RMN5 0 0.31400E+00 321973.8 4685199.0 192.0 57.61 4.47 26.51 YES HND_SCF1 0 0.75600E-01 321254.4 4684513.0 192.0 31.39 7.10 14.60 YES HND_SCF2 0 0.75600E-01 321247.6 4684527.0 192.0 31.39 7.10 14.60 YES HND_SCF3 0 0.75600E-01 321240.7 4684540.5 192.0 31.39 7.10 14.60 YES HND_SCF4 0 0.75600E-01 321233.8 4684554.0 192.0 31.39 7.10 14.60 YES HND_SCF5 0 0.75600E-01 321227.0 4684568.0 192.0 31.39 7.10 14.60 YES GROUP ID SOURCE IDs ALL BF_B_SS , BF_C_SS , B_CH_RM1, B_CH_RM2, B_CH_RM3, B_CH_RM4, B_CH_RM5, C_CH_RM1, C_CH_RM2, C_CH_RM3, C_CH_RM4, BFCCH_BS, LM_UL_BH, HMTRN_BH, BOF_ESP , BOF_BH , BOF_RMW1, BOF_RMW2, BOF_RMW3, BOF_RMW4, BOF_RMW5, BOF_RMW6, BOF_RME1, BOF_RME2, BOF_RME3, BOF_RME4, BOF_RME5, BOF_RMN1, BOF_RMN2, BOF_RMN3, BOF_RMN4, BOF_RMN5, DESLF_BH, LRF#1_S , LRF2_FLX, COKE_REC, ANEAL_1S, ANEAL_2S, ANEAL_3S, ANEAL_4S, ANEAL_5S, ANEAL_6S, ANEAL_1N, ANEAL_2N, ANEAL_3N, ANEAL_4N, ANEAL_5N, RFURN1_1, RFURN1_2, RFURN2_1, RFURN2_2, RFURN3_1, RFURN3_2, HND_SCF1, HND_SCF2, HND_SCF3, HND_SCF4, HND_SCF5, EU0099 , EU0096 , EU0095 , RG0130 , EU0096A , RG0133 , RG0132 , EU0095A , EU0120 , RG0133A , EU0118 , EU0076 , EU0076A , RG0130A , RG0132A , A8648 , A9831 , B2132 , B2169 , B2810 , B2811 , B3518 , B3533 , B3567 , N6631 , A8640 BF_B_SS , BF_C_SS , B_CH_RM1, B_CH_RM2, B_CH_RM3, B_CH_RM4, B_CH_RM5, C_CH_RM1, C_CH_RM2, C_CH_RM3, C_CH_RM4, BFCCH_BS, LM_UL_BH, HMTRN_BH, BOF_ESP , BOF_BH , BOF_RMW1, BOF_RMW2, BOF_RMW3, BOF_RMW4, BOF_RMW5, BOF_RMW6, BOF_RME1, BOF_RME2, BOF_RME3, BOF_RME4, BOF_RME5, BOF_RMN1, BOF_RMN2, BOF_RMN3, BOF_RMN4, BOF_RMN5, DESLF_BH, LRF#1_S , LRF2_FLX, COKE_REC, ANEAL_1S, ANEAL_2S, ANEAL_3S, ANEAL_4S, ANEAL_5S, ANEAL_6S, ANEAL_1N, ANEAL_2N, ANEAL_3N, ANEAL_4N, RFURN1_1, RFURN1_2, RFURN2_1, RFURN2_2, RFURN3_1, RFURN3_2, HND_SCF1, HND_SCF2, HND_SCF3, HND_SCF4, HND_SCF5, A7809 EU0099 , EU0096 , EU0095 , RG0130 , EU0096A , RG0133 , RG0132 , EU0095A , EU0120 , RG0133A , EU0118 , EU0076 , EU0076A , RG0130A , RG0132A , A8648 A8648 , A9831 A9831 , B2132 B2132 , B2169 B2169 ,

B2810 B2810 , B2811 B2811 , SUMMARY OF MAXIMUM ANNUAL ( 1 YRS) RESULTS *** ALL 1ST HIGHEST VALUE IS 0.65418 AT ( 317758.00, 4677306.00 A8640 1ST HIGHEST VALUE IS 0.30438 AT ( 317758.00, 4677306.00 A7809 1ST HIGHEST VALUE IS 0.12431 AT ( 317758.00, 4677306.00 A8648 1ST HIGHEST VALUE IS 0.02034 AT ( 317758.00, 4677306.00 A9831 1ST HIGHEST VALUE IS 0.08876 AT ( 317758.00, 4677306.00 B2132 1ST HIGHEST VALUE IS 0.00370 AT ( 317758.00, 4677306.00 B2169 1ST HIGHEST VALUE IS 0.05075 AT ( 317758.00, 4677306.00 B2810 1ST HIGHEST VALUE IS 0.00364 AT ( 317758.00, 4677306.00 B2811 1ST HIGHEST VALUE IS 0.01773 AT ( 317758.00, 4677306.00 B3518 1ST HIGHEST VALUE IS 0.00303 AT ( 317758.00, 4677306.00 B3533 1ST HIGHEST VALUE IS 0.01187 AT ( 317758.00, 4677306.00 B3567 1ST HIGHEST VALUE IS 0.00617 AT ( 317758.00, 4677306.00 N6631 1ST HIGHEST VALUE IS 0.01956 AT ( 317758.00, 4677306.00

2005 AERMOD SUMMARY – WYANDOTTE MONITOR LOCATION
*** AERMOD - VERSION 07026 *** *** 2005 MONITOR IMPACTS *** 04/28/08 *** POINT SOURCE DATA *** NUMBER EMISSION RATE BASE STACK STACK STACK STACK BLDG URBAN CAP/ EMIS RATE SOURCE PART. (GRAMS/SEC) X Y ELEV. HEIGHT TEMP. EXIT VEL. DIAMETER EXISTS SOURCE HOR SCALAR ID CATS. (METERS) (METERS) (METERS) (METERS) (DEG.K) (M/SEC) (METERS) VARY BY - - - - - - - - - - - - - - - - - - - - - - - - - - - - - - - - - - - - - - - - - - - - - - - - - - - - - - - - - - - - - - - - - BF_B_SS 0 0.60870E+00 322263.4 4685504.0 192.0 57.91 672.04 9.60 2.52 YES YES NO BF_C_SS 0 0.10486E+01 322221.8 4685586.5 192.0 64.01 672.04 13.70 2.74 YES YES NO BFCCH_BS 0 0.00000E+00 322262.1 4685580.0 192.0 60.96 338.71 19.96 2.74 YES YES NO LM_UL_BH 0 0.75700E-01 322184.0 4684950.0 192.0 10.97 294.26 22.64 0.61 YES YES NO HMTRN_BH 0 0.89800E-01 322024.8 4685203.0 192.0 8.23 352.60 0.05 1.75 YES YES NO BOF_ESP 0 0.42495E+01 321932.5 4685047.5 192.0 64.92 422.04 18.84 5.18 YES YES NO BOF_BH 0 0.00000E+00 322004.8 4685285.0 192.0 60.96 338.71 18.95 4.88 YES YES NO DESLF_BH 0 0.11050E+00 321971.5 4685217.5 192.0 11.28 380.37 0.05 1.68 YES YES NO LRF#1_S 0 0.85380E+00 321983.0 4684947.0 192.0 45.11 297.04 13.97 2.74 YES YES NO LRF2_FLX 0 0.48790E+00 322097.1 4684808.5 192.0 45.72 433.15 17.97 1.83 YES YES NO COKE_REC 0 0.24280E+00 322127.2 4684707.5 192.0 5.49 294.26 21.38 0.71 YES YES NO ANEAL_1S 0 0.11600E-01 321846.1 4685170.0 192.0 21.34 1060.93 0.05 0.76 YES YES NO ANEAL_2S 0 0.11600E-01 321826.2 4685209.5 192.0 21.34 1060.93 0.05 0.76 YES YES NO ANEAL_3S 0 0.11600E-01 321806.3 4685249.0 192.0 21.34 1060.93 0.05 0.76 YES YES NO ANEAL_4S 0 0.11600E-01 321786.4 4685288.5 192.0 21.34 1060.93 0.05 0.76 YES YES NO ANEAL_5S 0 0.11600E-01 321766.5 4685328.0 192.0 21.34 1060.93 0.05 0.76 YES YES NO ANEAL_6S 0 0.11600E-01 321746.6 4685367.5 192.0 21.34 1060.93 0.05 0.76 YES YES NO ANEAL_1N 0 0.11600E-01 321726.0 4685387.5 192.0 21.34 1060.93 0.05 0.76 YES YES NO ANEAL_2N 0 0.11600E-01 321713.8 4685412.0 192.0 21.34 1060.93 0.05 0.76 YES YES NO ANEAL_3N 0 0.11600E-01 321701.4 4685436.5 192.0 21.34 1060.93 0.05 0.76 YES YES NO ANEAL_4N 0 0.11600E-01 321689.1 4685461.0 192.0 21.34 1060.93 0.05 0.76 YES YES NO ANEAL_5N 0 0.11600E-01 321676.7 4685485.5 192.0 21.34 1060.93 0.05 0.76 YES YES NO RFURN1_1 0 0.17030E+00 320999.0 4685172.0 192.0 63.40 922.04 4.39 4.27 YES YES NO RFURN1_2 0 0.17030E+00 321004.0 4685162.0 192.0 63.40 922.04 4.39 4.27 YES YES NO RFURN2_1 0 0.17030E+00 321009.0 4685152.0 192.0 63.40 922.04 4.39 4.27 YES YES NO RFURN2_2 0 0.17030E+00 321014.0 4685141.0 192.0 63.40 922.04 4.39 4.27 YES YES NO RFURN3_1 0 0.17030E+00 321020.0 4685131.0 192.0 63.40 922.04 4.39 4.27 YES YES NO RFURN3_2 0 0.17030E+00 321025.0 4685120.0 192.0 63.40 922.04 4.39 4.27 YES YES NO EU0099 0 0.59750E+01 326027.0 4682852.0 192.0 96.01 477.60 4.28 5.03 NO YES NO EU0096 0 0.26820E+01 326192.0 4683221.0 192.0 20.73 294.30 15.16 3.30 NO YES NO EU0095 0 0.26310E+01 326475.0 4683520.0 192.0 19.81 294.30 10.35 3.05 NO YES NO RG0130 0 0.23970E+01 326323.0 4683637.0 192.0 60.96 416.50 15.63 5.33 NO YES NO EU0096A 0 0.12010E+01 326192.0 4683221.0 192.0 70.10 560.90 13.53 2.82 NO YES NO RG0133 0 0.98900E+00 326299.0 4683107.0 192.0 26.82 560.90 7.48 2.97 NO YES NO RG0132 0 0.87100E+00 326305.0 4683579.0 192.0 20.73 560.90 17.11 1.68 NO YES NO EU0095A 0 0.84500E+00 326475.0 4683520.0 192.0 60.96 383.20 13.37 2.84 NO YES NO EU0120 0 0.34600E+00 326309.0 4683644.0 192.0 33.22 544.30 21.15 1.40 NO YES NO RG0133A 0 0.29900E+00 326299.0 4683107.0 192.0 26.82 560.90 7.48 2.97 NO YES NO EU0118 0 0.24100E+00 326059.0 4683063.0 192.0 37.49 422.00 9.27 0.91 NO YES NO EU0076 0 0.21800E+00 325960.0 4683058.0 192.0 31.09 477.60 1.62 4.27 NO YES NO *** POINT SOURCE DATA *** NUMBER EMISSION RATE BASE STACK STACK STACK STACK BLDG URBAN CAP/ EMIS RATE SOURCE PART. (GRAMS/SEC) X Y ELEV. HEIGHT TEMP. EXIT VEL. DIAMETER EXISTS SOURCE HOR SCALAR ID CATS. (METERS) (METERS) (METERS) (METERS) (DEG.K) (M/SEC) (METERS) VARY BY - - - - - - - - - - - - - - - - - - - - - - - - - - - - - - - - - - - - - - - - - - - - - - - - - - - - - - - - - - - - - - - - - EU0076A 0 0.16500E+00 326087.0 4683007.0 192.0 31.09 477.60 1.62 4.27 NO YES NO RG0130A 0 0.15900E+00 326323.0 4683637.0 192.0 60.96 416.50 15.63 5.33 NO YES NO RG0132A 0 0.14700E+00 326305.0 4683579.0 192.0 20.73 560.90 17.11 1.68 NO YES NO A8648 0 0.49000E+00 321801.0 4686168.0 192.0 12.31 295.70 10.14 0.31 NO YES NO A9831 0 0.57000E+01 322000.0 4683150.0 192.0 49.43 455.50 10.24 1.91 NO YES NO B2132 0 0.36000E+00 322800.0 4675000.0 192.0 46.94 415.70 8.71 2.44 NO YES NO B2169 0 0.20500E+01 324525.0 4682560.0 192.0 12.19 294.30 10.00 0.30 NO YES NO B2810 0 0.12300E+01 325800.0 4682000.0 192.0 123.80 427.30 47.00 3.82 NO YES NO B2811 0 0.53700E+01 319700.0 4665600.0 192.0 162.69 419.70 41.04 4.34 NO YES NO B3518 0 0.16000E+00 324200.0 4682800.0 192.0 29.01 344.70 17.80 0.71 NO YES NO B3533 0 0.43000E+00 323800.0 4686900.0 192.0 12.19 294.30 10.00 0.30 NO YES NO B3567 0 0.21000E+00 323850.0 4683450.0 192.0 12.19 294.30 10.00 0.30 NO YES NO N6631 0 0.24300E+01 322513.0 4685652.0 192.0 55.27 416.40 17.46 3.37 NO YES NO *** VOLUME SOURCE DATA ***

NUMBER EMISSION RATE BASE RELEASE INIT. INIT. URBAN EMISSION RATE SOURCE PART. (GRAMS/SEC) X Y ELEV. HEIGHT SY SZ SOURCE SCALAR VARY ID CATS. (METERS) (METERS) (METERS) (METERS) (METERS) (METERS) BY - - - - - - - - - - - - - - - - - - - - - - - - - - - - - - - - - - - - - - - - - - - - - - - - - - - - - - - - - - - - - B_CH_RM1 0 0.89400E-01 322245.7 4685529.0 192.0 23.17 6.55 10.77 YES B_CH_RM2 0 0.89400E-01 322239.4 4685541.5 192.0 23.17 6.55 10.77 YES B_CH_RM3 0 0.89400E-01 322233.0 4685554.0 192.0 23.17 6.55 10.77 YES B_CH_RM4 0 0.89400E-01 322226.5 4685567.0 192.0 23.17 6.55 10.77 YES B_CH_RM5 0 0.89400E-01 322220.4 4685579.5 192.0 23.17 6.55 10.77 YES C_CH_RM1 0 0.19500E+00 322190.4 4685634.5 192.0 29.26 6.59 13.61 YES C_CH_RM2 0 0.19500E+00 322184.1 4685647.0 192.0 29.26 6.59 13.61 YES C_CH_RM3 0 0.19500E+00 322177.7 4685659.5 192.0 29.26 6.59 13.61 YES C_CH_RM4 0 0.19500E+00 322171.4 4685672.5 192.0 29.26 6.59 13.61 YES BOF_RMW1 0 0.31400E+00 322007.2 4685043.5 192.0 65.53 8.62 30.20 YES BOF_RMW2 0 0.31400E+00 321998.8 4685060.0 192.0 65.53 8.62 30.20 YES BOF_RMW3 0 0.31400E+00 321990.5 4685076.5 192.0 65.53 8.62 30.20 YES BOF_RMW4 0 0.31400E+00 321982.3 4685093.0 192.0 65.53 8.62 30.20 YES BOF_RMW5 0 0.31400E+00 321973.8 4685109.5 192.0 65.53 8.62 30.20 YES BOF_RMW6 0 0.31400E+00 321965.7 4685126.0 192.0 65.53 8.62 30.20 YES BOF_RME1 0 0.31400E+00 322043.5 4685061.0 192.0 65.53 7.66 30.20 YES BOF_RME2 0 0.31400E+00 322036.2 4685075.5 192.0 65.53 7.66 30.20 YES BOF_RME3 0 0.31400E+00 322028.7 4685090.0 192.0 65.53 7.66 30.20 YES BOF_RME4 0 0.31400E+00 322021.3 4685105.0 192.0 65.53 7.66 30.20 YES BOF_RME5 0 0.31400E+00 322013.9 4685119.5 192.0 65.53 7.66 30.20 YES BOF_RMN1 0 0.31400E+00 321991.2 4685164.5 192.0 57.61 4.47 26.51 YES BOF_RMN2 0 0.31400E+00 321986.9 4685173.0 192.0 57.61 4.47 26.51 YES BOF_RMN3 0 0.31400E+00 321982.7 4685181.5 192.0 57.61 4.47 26.51 YES BOF_RMN4 0 0.31400E+00 321978.3 4685190.0 192.0 57.61 4.47 26.51 YES BOF_RMN5 0 0.31400E+00 321973.8 4685199.0 192.0 57.61 4.47 26.51 YES HND_SCF1 0 0.75600E-01 321254.4 4684513.0 192.0 31.39 7.10 14.60 YES HND_SCF2 0 0.75600E-01 321247.6 4684527.0 192.0 31.39 7.10 14.60 YES HND_SCF3 0 0.75600E-01 321240.7 4684540.5 192.0 31.39 7.10 14.60 YES HND_SCF4 0 0.75600E-01 321233.8 4684554.0 192.0 31.39 7.10 14.60 YES HND_SCF5 0 0.75600E-01 321227.0 4684568.0 192.0 31.39 7.10 14.60 YES GROUP ID SOURCE IDs ALL BF_B_SS , BF_C_SS , B_CH_RM1, B_CH_RM2, B_CH_RM3, B_CH_RM4, B_CH_RM5, C_CH_RM1, C_CH_RM2, C_CH_RM3, C_CH_RM4, BFCCH_BS, LM_UL_BH, HMTRN_BH, BOF_ESP , BOF_BH , BOF_RMW1, BOF_RMW2, BOF_RMW3, BOF_RMW4, BOF_RMW5, BOF_RMW6, BOF_RME1, BOF_RME2, BOF_RME3, BOF_RME4, BOF_RME5, BOF_RMN1, BOF_RMN2, BOF_RMN3, BOF_RMN4, BOF_RMN5, DESLF_BH, LRF#1_S , LRF2_FLX, COKE_REC, ANEAL_1S, ANEAL_2S, ANEAL_3S, ANEAL_4S, ANEAL_5S, ANEAL_6S, ANEAL_1N, ANEAL_2N, ANEAL_3N, ANEAL_4N, ANEAL_5N, RFURN1_1, RFURN1_2, RFURN2_1, RFURN2_2, RFURN3_1, RFURN3_2, HND_SCF1, HND_SCF2, HND_SCF3, HND_SCF4, HND_SCF5, EU0099 , EU0096 , EU0095 , RG0130 , EU0096A , RG0133 , RG0132 , EU0095A , EU0120 , RG0133A , EU0118 , EU0076 , EU0076A , RG0130A , RG0132A , A8648 , A9831 , B2132 , B2169 , B2810 , B2811 , B3518 , B3533 , B3567 , N6631 , A8640 BF_B_SS , BF_C_SS , B_CH_RM1, B_CH_RM2, B_CH_RM3, B_CH_RM4, B_CH_RM5, C_CH_RM1, C_CH_RM2, C_CH_RM3, C_CH_RM4, BFCCH_BS, LM_UL_BH, HMTRN_BH, BOF_ESP , BOF_BH , BOF_RMW1, BOF_RMW2, BOF_RMW3, BOF_RMW4, BOF_RMW5, BOF_RMW6, BOF_RME1, BOF_RME2, BOF_RME3, BOF_RME4, BOF_RME5, BOF_RMN1, BOF_RMN2, BOF_RMN3, BOF_RMN4, BOF_RMN5, DESLF_BH, LRF#1_S , LRF2_FLX, COKE_REC, ANEAL_1S, ANEAL_2S, ANEAL_3S, ANEAL_4S, ANEAL_5S, ANEAL_6S, ANEAL_1N, ANEAL_2N, ANEAL_3N, ANEAL_4N, RFURN1_1, RFURN1_2, RFURN2_1, RFURN2_2, RFURN3_1, RFURN3_2, HND_SCF1, HND_SCF2, HND_SCF3, HND_SCF4, HND_SCF5, A7809 EU0099 , EU0096 , EU0095 , RG0130 , EU0096A , RG0133 , RG0132 , EU0095A , EU0120 , RG0133A , EU0118 , EU0076 , EU0076A , RG0130A , RG0132A , A8648 A8648 , A9831 A9831 , B2132 B2132 ,

B2169 B2169 , B2810 B2810 , B2811 B2811 , SUMMARY OF MAXIMUM ANNUAL ( 1 YRS) RESULTS *** ALL 1ST HIGHEST VALUE IS 0.59903 AT ( 322122.00, 4672602.00 A8640 1ST HIGHEST VALUE IS 0.14990 AT ( 322122.00, 4672602.00 A7809 1ST HIGHEST VALUE IS 0.23338 AT ( 322122.00, 4672602.00 A8648 1ST HIGHEST VALUE IS 0.00868 AT ( 322122.00, 4672602.00 A9831 1ST HIGHEST VALUE IS 0.05830 AT ( 322122.00, 4672602.00 B2132 1ST HIGHEST VALUE IS 0.00978 AT ( 322122.00, 4672602.00 B2169 1ST HIGHEST VALUE IS 0.07196 AT ( 322122.00, 4672602.00 B2810 1ST HIGHEST VALUE IS 0.00581 AT ( 322122.00, 4672602.00 B2811 1ST HIGHEST VALUE IS 0.03137 AT ( 322122.00, 4672602.00 B3518 1ST HIGHEST VALUE IS 0.00397 AT ( 322122.00, 4672602.00 B3533 1ST HIGHEST VALUE IS 0.00798 AT ( 322122.00, 4672602.00 B3567 1ST HIGHEST VALUE IS 0.00612 AT ( 322122.00, 4672602.00 N6631 1ST HIGHEST VALUE IS 0.01227 AT ( 322122.00, 4672602.00

2009 AERMOD SUMMARY – DEARBORN MONITOR LOCATION *** AERMOD - VERSION 07026 *** *** 2009 MONITOR IMPACTS (from Severstal, Marathon and U.S. reductions o *** 04/28/08 *** POINT SOURCE DATA *** NUMBER EMISSION RATE BASE STACK STACK STACK STACK BLDG URBAN CAP/ EMIS RATE SOURCE PART. (GRAMS/SEC) X Y ELEV. HEIGHT TEMP. EXIT VEL. DIAMETER EXISTS SOURCE HOR SCALAR ID CATS. (METERS) (METERS) (METERS) (METERS) (DEG.K) (M/SEC) (METERS) VARY BY - - - - - - - - - - - - - - - - - - - - - - - - - - - - - - - - - - - - - - - - - - - - - - - - - - - - - - - - - - - - - - - - - BF_B_SS 0 0.68440E+00 322263.4 4685504.0 192.0 57.91 672.04 9.60 2.52 YES NO NO BF_C_SS 0 0.11602E+01 322221.8 4685586.5 192.0 64.01 672.04 13.70 2.74 YES NO NO BFCCH_BS 0 0.48560E+00 322262.1 4685580.0 192.0 60.96 338.71 19.96 2.74 YES NO NO LM_UL_BH 0 0.75700E-01 322184.0 4684950.0 192.0 10.97 294.26 22.64 0.61 YES NO NO HMTRN_BH 0 0.00000E+00 322024.8 4685203.0 192.0 8.23 352.60 0.05 1.75 YES NO NO BOF_ESP 0 0.46856E+01 321932.5 4685047.5 192.0 64.92 422.04 18.84 5.18 YES NO NO BOF_BH 0 0.17840E+00 322004.8 4685285.0 192.0 60.96 338.71 18.95 4.88 YES NO NO DESLF_BH 0 0.11050E+00 321971.5 4685217.5 192.0 11.28 380.37 0.05 1.68 YES NO NO LRF#1_S 0 0.85380E+00 321983.0 4684947.0 192.0 45.11 297.04 13.97 2.74 YES NO NO LRF2_FLX 0 0.48790E+00 322097.1 4684808.5 192.0 45.72 433.15 17.97 1.83 YES NO NO COKE_REC 0 0.24280E+00 322127.2 4684707.5 192.0 5.49 294.26 21.38 0.71 YES NO NO ANEAL_1S 0 0.15900E-01 321846.1 4685170.0 192.0 21.34 1060.93 0.05 0.76 YES NO NO ANEAL_2S 0 0.15900E-01 321826.2 4685209.5 192.0 21.34 1060.93 0.05 0.76 YES NO NO ANEAL_3S 0 0.15900E-01 321806.3 4685249.0 192.0 21.34 1060.93 0.05 0.76 YES NO NO ANEAL_4S 0 0.15900E-01 321786.4 4685288.5 192.0 21.34 1060.93 0.05 0.76 YES NO NO ANEAL_5S 0 0.15900E-01 321766.5 4685328.0 192.0 21.34 1060.93 0.05 0.76 YES NO NO ANEAL_6S 0 0.15900E-01 321746.6 4685367.5 192.0 21.34 1060.93 0.05 0.76 YES NO NO ANEAL_1N 0 0.15900E-01 321726.0 4685387.5 192.0 21.34 1060.93 0.05 0.76 YES NO NO ANEAL_2N 0 0.15900E-01 321713.8 4685412.0 192.0 21.34 1060.93 0.05 0.76 YES NO NO ANEAL_3N 0 0.15900E-01 321701.4 4685436.5 192.0 21.34 1060.93 0.05 0.76 YES NO NO ANEAL_4N 0 0.15900E-01 321689.1 4685461.0 192.0 21.34 1060.93 0.05 0.76 YES NO NO ANEAL_5N 0 0.15900E-01 321676.7 4685485.5 192.0 21.34 1060.93 0.05 0.76 YES NO NO RFURN1_1 0 0.18660E+00 320999.0 4685172.0 192.0 63.40 922.04 4.39 4.27 YES NO NO RFURN1_2 0 0.18660E+00 321004.0 4685162.0 192.0 63.40 922.04 4.39 4.27 YES NO NO RFURN2_1 0 0.18660E+00 321009.0 4685152.0 192.0 63.40 922.04 4.39 4.27 YES NO NO RFURN2_2 0 0.18660E+00 321014.0 4685141.0 192.0 63.40 922.04 4.39 4.27 YES NO NO RFURN3_1 0 0.18660E+00 321020.0 4685131.0 192.0 63.40 922.04 4.39 4.27 YES NO NO RFURN3_2 0 0.18660E+00 321025.0 4685120.0 192.0 63.40 922.04 4.39 4.27 YES NO NO EU0099 0 0.40750E+01 326027.0 4682852.0 192.0 96.01 477.60 4.28 5.03 NO NO NO EU0096 0 0.26820E+01 326192.0 4683221.0 192.0 20.73 294.30 15.16 3.30 NO NO NO EU0095 0 0.26310E+01 326475.0 4683520.0 192.0 19.81 294.30 10.35 3.05 NO NO NO RG0130 0 0.23970E+01 326323.0 4683637.0 192.0 60.96 416.50 15.63 5.33 NO NO NO EU0096A 0 0.12010E+01 326192.0 4683221.0 192.0 70.10 560.90 13.53 2.82 NO NO NO RG0133 0 0.98900E+00 326299.0 4683107.0 192.0 26.82 560.90 7.48 2.97 NO NO NO RG0132 0 0.87100E+00 326305.0 4683579.0 192.0 20.73 560.90 17.11 1.68 NO NO NO EU0095A 0 0.84500E+00 326475.0 4683520.0 192.0 60.96 383.20 13.37 2.84 NO NO NO EU0120 0 0.34600E+00 326309.0 4683644.0 192.0 33.22 544.30 21.15 1.40 NO NO NO RG0133A 0 0.29900E+00 326299.0 4683107.0 192.0 26.82 560.90 7.48 2.97 NO NO NO EU0118 0 0.24100E+00 326059.0 4683063.0 192.0 37.49 422.00 9.27 0.91 NO NO NO EU0076 0 0.21800E+00 325960.0 4683058.0 192.0 31.09 477.60 1.62 4.27 NO NO NO *** POINT SOURCE DATA *** NUMBER EMISSION RATE BASE STACK STACK STACK STACK BLDG URBAN CAP/ EMIS RATE SOURCE PART. (GRAMS/SEC) X Y ELEV. HEIGHT TEMP. EXIT VEL. DIAMETER EXISTS SOURCE HOR SCALAR ID CATS. (METERS) (METERS) (METERS) (METERS) (DEG.K) (M/SEC) (METERS) VARY BY - - - - - - - - - - - - - - - - - - - - - - - - - - - - - - - - - - - - - - - - - - - - - - - - - - - - - - - - - - - - - - - - - EU0076A 0 0.16500E+00 326087.0 4683007.0 192.0 31.09 477.60 1.62 4.27 NO NO NO RG0130A 0 0.15900E+00 326323.0 4683637.0 192.0 60.96 416.50 15.63 5.33 NO NO NO RG0132A 0 0.14700E+00 326305.0 4683579.0 192.0 20.73 560.90 17.11 1.68 NO NO NO A8648 0 0.49000E+00 321801.0 4686168.0 192.0 12.31 295.70 10.14 0.31 NO NO NO A9831 0 0.28200E+01 322000.0 4683150.0 192.0 49.43 455.50 10.24 1.91 NO NO NO B2132 0 0.36000E+00 322800.0 4675000.0 192.0 46.94 415.70 8.71 2.44 NO NO NO B2169 0 0.20500E+01 324525.0 4682560.0 192.0 12.19 294.30 10.00 0.30 NO NO NO B2810 0 0.12300E+01 325800.0 4682000.0 192.0 123.80 427.30 47.00 3.82 NO NO NO B2811 0 0.53700E+01 319700.0 4665600.0 192.0 162.69 419.70 41.04 4.34 NO NO NO B3518 0 0.16000E+00 324200.0 4682800.0 192.0 29.01 344.70 17.80 0.71 NO NO NO B3533 0 0.43000E+00 323800.0 4686900.0 192.0 12.19 294.30 10.00 0.30 NO NO NO B3567 0 0.21000E+00 323850.0 4683450.0 192.0 12.19 294.30 10.00 0.30 NO NO NO N6631 0 0.24300E+01 322513.0 4685652.0 192.0 55.27 416.40 17.46 3.37 NO NO NO *** VOLUME SOURCE DATA *** NUMBER EMISSION RATE BASE RELEASE INIT. INIT. URBAN EMISSION RATE SOURCE PART. (GRAMS/SEC) X Y ELEV. HEIGHT SY SZ SOURCE SCALAR VARY

ID CATS. (METERS) (METERS) (METERS) (METERS) (METERS) (METERS) BY - - - - - - - - - - - - - - - - - - - - - - - - - - - - - - - - - - - - - - - - - - - - - - - - - - - - - - - - - - - - - B_CH_RM1 0 0.75000E-02 322245.7 4685529.0 192.0 23.17 6.55 10.77 NO B_CH_RM2 0 0.75000E-02 322239.4 4685541.5 192.0 23.17 6.55 10.77 NO B_CH_RM3 0 0.75000E-02 322233.0 4685554.0 192.0 23.17 6.55 10.77 NO B_CH_RM4 0 0.75000E-02 322226.5 4685567.0 192.0 23.17 6.55 10.77 NO B_CH_RM5 0 0.75000E-02 322220.4 4685579.5 192.0 23.17 6.55 10.77 NO C_CH_RM1 0 0.23500E-01 322190.4 4685634.5 192.0 29.26 6.59 13.61 NO C_CH_RM2 0 0.23500E-01 322184.1 4685647.0 192.0 29.26 6.59 13.61 NO C_CH_RM3 0 0.23500E-01 322177.7 4685659.5 192.0 29.26 6.59 13.61 NO C_CH_RM4 0 0.23500E-01 322171.4 4685672.5 192.0 29.26 6.59 13.61 NO BOF_RMW1 0 0.77000E-02 322007.2 4685043.5 192.0 65.53 8.62 30.20 NO BOF_RMW2 0 0.77000E-02 321998.8 4685060.0 192.0 65.53 8.62 30.20 NO BOF_RMW3 0 0.77000E-02 321990.5 4685076.5 192.0 65.53 8.62 30.20 NO BOF_RMW4 0 0.77000E-02 321982.3 4685093.0 192.0 65.53 8.62 30.20 NO BOF_RMW5 0 0.77000E-02 321973.8 4685109.5 192.0 65.53 8.62 30.20 NO BOF_RMW6 0 0.77000E-02 321965.7 4685126.0 192.0 65.53 8.62 30.20 NO BOF_RME1 0 0.77000E-02 322043.5 4685061.0 192.0 65.53 7.66 30.20 NO BOF_RME2 0 0.77000E-02 322036.2 4685075.5 192.0 65.53 7.66 30.20 NO BOF_RME3 0 0.77000E-02 322028.7 4685090.0 192.0 65.53 7.66 30.20 NO BOF_RME4 0 0.77000E-02 322021.3 4685105.0 192.0 65.53 7.66 30.20 NO BOF_RME5 0 0.77000E-02 322013.9 4685119.5 192.0 65.53 7.66 30.20 NO BOF_RMN1 0 0.77000E-02 321991.2 4685164.5 192.0 57.61 4.47 26.51 NO BOF_RMN2 0 0.77000E-02 321986.9 4685173.0 192.0 57.61 4.47 26.51 NO BOF_RMN3 0 0.77000E-02 321982.7 4685181.5 192.0 57.61 4.47 26.51 NO BOF_RMN4 0 0.77000E-02 321978.3 4685190.0 192.0 57.61 4.47 26.51 NO BOF_RMN5 0 0.77000E-02 321973.8 4685199.0 192.0 57.61 4.47 26.51 NO HND_SCF1 0 0.10160E+00 321254.4 4684513.0 192.0 31.39 7.10 14.60 NO HND_SCF2 0 0.10160E+00 321247.6 4684527.0 192.0 31.39 7.10 14.60 NO HND_SCF3 0 0.10160E+00 321240.7 4684540.5 192.0 31.39 7.10 14.60 NO HND_SCF4 0 0.10160E+00 321233.8 4684554.0 192.0 31.39 7.10 14.60 NO HND_SCF5 0 0.10160E+00 321227.0 4684568.0 192.0 31.39 7.10 14.60 NO GROUP ID SOURCE IDs ALL BF_B_SS , BF_C_SS , B_CH_RM1, B_CH_RM2, B_CH_RM3, B_CH_RM4, B_CH_RM5, C_CH_RM1, C_CH_RM2, C_CH_RM3, C_CH_RM4, BFCCH_BS, LM_UL_BH, HMTRN_BH, BOF_ESP , BOF_BH , BOF_RMW1, BOF_RMW2, BOF_RMW3, BOF_RMW4, BOF_RMW5, BOF_RMW6, BOF_RME1, BOF_RME2, BOF_RME3, BOF_RME4, BOF_RME5, BOF_RMN1, BOF_RMN2, BOF_RMN3, BOF_RMN4, BOF_RMN5, DESLF_BH, LRF#1_S , LRF2_FLX, COKE_REC, ANEAL_1S, ANEAL_2S, ANEAL_3S, ANEAL_4S, ANEAL_5S, ANEAL_6S, ANEAL_1N, ANEAL_2N, ANEAL_3N, ANEAL_4N, ANEAL_5N, RFURN1_1, RFURN1_2, RFURN2_1, RFURN2_2, RFURN3_1, RFURN3_2, HND_SCF1, HND_SCF2, HND_SCF3, HND_SCF4, HND_SCF5, EU0099 , EU0096 , EU0095 , RG0130 , EU0096A , RG0133 , RG0132 , EU0095A , EU0120 , RG0133A , EU0118 , EU0076 , EU0076A , RG0130A , RG0132A , A8648 , A9831 , B2132 , B2169 , B2810 , B2811 , B3518 , B3533 , B3567 , N6631 , A8640 BF_B_SS , BF_C_SS , B_CH_RM1, B_CH_RM2, B_CH_RM3, B_CH_RM4, B_CH_RM5, C_CH_RM1, C_CH_RM2, C_CH_RM3, C_CH_RM4, BFCCH_BS, LM_UL_BH, HMTRN_BH, BOF_ESP , BOF_BH , BOF_RMW1, BOF_RMW2, BOF_RMW3, BOF_RMW4, BOF_RMW5, BOF_RMW6, BOF_RME1, BOF_RME2, BOF_RME3, BOF_RME4, BOF_RME5, BOF_RMN1, BOF_RMN2, BOF_RMN3, BOF_RMN4, BOF_RMN5, DESLF_BH, LRF#1_S , LRF2_FLX, COKE_REC, ANEAL_1S, ANEAL_2S, ANEAL_3S, ANEAL_4S, ANEAL_5S, ANEAL_6S, ANEAL_1N, ANEAL_2N, ANEAL_3N, ANEAL_4N, RFURN1_1, RFURN1_2, RFURN2_1, RFURN2_2, RFURN3_1, RFURN3_2, HND_SCF1, HND_SCF2, HND_SCF3, HND_SCF4, HND_SCF5, A7809 EU0099 , EU0096 , EU0095 , RG0130 , EU0096A , RG0133 , RG0132 , EU0095A , EU0120 , RG0133A , EU0118 , EU0076 , EU0076A , RG0130A , RG0132A , A8648 A8648 , A9831 A9831 , B2132 B2132 , B2169 B2169 ,

B2810 B2810 , B2811 B2811 , SUMMARY OF MAXIMUM ANNUAL ( 1 YRS) RESULTS *** ALL 1ST HIGHEST VALUE IS 2.90616 AT ( 322805.00, 4685985.00 A8640 1ST HIGHEST VALUE IS 1.46937 AT ( 322805.00, 4685985.00 A7809 1ST HIGHEST VALUE IS 0.20107 AT ( 322805.00, 4685985.00 A8648 1ST HIGHEST VALUE IS 0.40983 AT ( 322805.00, 4685985.00 A9831 1ST HIGHEST VALUE IS 0.04845 AT ( 322805.00, 4685985.00 B2132 1ST HIGHEST VALUE IS 0.00198 AT ( 322805.00, 4685985.00 B2169 1ST HIGHEST VALUE IS 0.44433 AT ( 322805.00, 4685985.00 B2810 1ST HIGHEST VALUE IS 0.00163 AT ( 322805.00, 4685985.00 B2811 1ST HIGHEST VALUE IS 0.00469 AT ( 322805.00, 4685985.00 B3518 1ST HIGHEST VALUE IS 0.00573 AT ( 322805.00, 4685985.00 B3533 1ST HIGHEST VALUE IS 0.19010 AT ( 322805.00, 4685985.00 B3567 1ST HIGHEST VALUE IS 0.07665 AT ( 322805.00, 4685985.00 N6631 1ST HIGHEST VALUE IS 0.04956 AT ( 322805.00, 4685985.00

2009 AERMOD SUMMARY – SWHS MONITOR LOCATION *** AERMOD - VERSION 07026 *** *** 2009 MONITOR IMPACTS (from Severstal, Marathon and U.S. reductions o *** 04/28/08 *** POINT SOURCE DATA *** NUMBER EMISSION RATE BASE STACK STACK STACK STACK BLDG URBAN CAP/ EMIS RATE SOURCE PART. (GRAMS/SEC) X Y ELEV. HEIGHT TEMP. EXIT VEL. DIAMETER EXISTS SOURCE HOR SCALAR ID CATS. (METERS) (METERS) (METERS) (METERS) (DEG.K) (M/SEC) (METERS) VARY BY - - - - - - - - - - - - - - - - - - - - - - - - - - - - - - - - - - - - - - - - - - - - - - - - - - - - - - - - - - - - - - - - - BF_B_SS 0 0.68440E+00 322263.4 4685504.0 192.0 57.91 672.04 9.60 2.52 YES NO NO BF_C_SS 0 0.11602E+01 322221.8 4685586.5 192.0 64.01 672.04 13.70 2.74 YES NO NO BFCCH_BS 0 0.48560E+00 322262.1 4685580.0 192.0 60.96 338.71 19.96 2.74 YES NO NO LM_UL_BH 0 0.75700E-01 322184.0 4684950.0 192.0 10.97 294.26 22.64 0.61 YES NO NO HMTRN_BH 0 0.00000E+00 322024.8 4685203.0 192.0 8.23 352.60 0.05 1.75 YES NO NO BOF_ESP 0 0.46856E+01 321932.5 4685047.5 192.0 64.92 422.04 18.84 5.18 YES NO NO BOF_BH 0 0.17840E+00 322004.8 4685285.0 192.0 60.96 338.71 18.95 4.88 YES NO NO DESLF_BH 0 0.11050E+00 321971.5 4685217.5 192.0 11.28 380.37 0.05 1.68 YES NO NO LRF#1_S 0 0.85380E+00 321983.0 4684947.0 192.0 45.11 297.04 13.97 2.74 YES NO NO LRF2_FLX 0 0.48790E+00 322097.1 4684808.5 192.0 45.72 433.15 17.97 1.83 YES NO NO COKE_REC 0 0.24280E+00 322127.2 4684707.5 192.0 5.49 294.26 21.38 0.71 YES NO NO ANEAL_1S 0 0.15900E-01 321846.1 4685170.0 192.0 21.34 1060.93 0.05 0.76 YES NO NO ANEAL_2S 0 0.15900E-01 321826.2 4685209.5 192.0 21.34 1060.93 0.05 0.76 YES NO NO ANEAL_3S 0 0.15900E-01 321806.3 4685249.0 192.0 21.34 1060.93 0.05 0.76 YES NO NO ANEAL_4S 0 0.15900E-01 321786.4 4685288.5 192.0 21.34 1060.93 0.05 0.76 YES NO NO ANEAL_5S 0 0.15900E-01 321766.5 4685328.0 192.0 21.34 1060.93 0.05 0.76 YES NO NO ANEAL_6S 0 0.15900E-01 321746.6 4685367.5 192.0 21.34 1060.93 0.05 0.76 YES NO NO ANEAL_1N 0 0.15900E-01 321726.0 4685387.5 192.0 21.34 1060.93 0.05 0.76 YES NO NO ANEAL_2N 0 0.15900E-01 321713.8 4685412.0 192.0 21.34 1060.93 0.05 0.76 YES NO NO ANEAL_3N 0 0.15900E-01 321701.4 4685436.5 192.0 21.34 1060.93 0.05 0.76 YES NO NO ANEAL_4N 0 0.15900E-01 321689.1 4685461.0 192.0 21.34 1060.93 0.05 0.76 YES NO NO ANEAL_5N 0 0.15900E-01 321676.7 4685485.5 192.0 21.34 1060.93 0.05 0.76 YES NO NO RFURN1_1 0 0.18660E+00 320999.0 4685172.0 192.0 63.40 922.04 4.39 4.27 YES NO NO RFURN1_2 0 0.18660E+00 321004.0 4685162.0 192.0 63.40 922.04 4.39 4.27 YES NO NO RFURN2_1 0 0.18660E+00 321009.0 4685152.0 192.0 63.40 922.04 4.39 4.27 YES NO NO RFURN2_2 0 0.18660E+00 321014.0 4685141.0 192.0 63.40 922.04 4.39 4.27 YES NO NO RFURN3_1 0 0.18660E+00 321020.0 4685131.0 192.0 63.40 922.04 4.39 4.27 YES NO NO RFURN3_2 0 0.18660E+00 321025.0 4685120.0 192.0 63.40 922.04 4.39 4.27 YES NO NO EU0099 0 0.40750E+01 326027.0 4682852.0 192.0 96.01 477.60 4.28 5.03 NO NO NO EU0096 0 0.26820E+01 326192.0 4683221.0 192.0 20.73 294.30 15.16 3.30 NO NO NO EU0095 0 0.26310E+01 326475.0 4683520.0 192.0 19.81 294.30 10.35 3.05 NO NO NO RG0130 0 0.23970E+01 326323.0 4683637.0 192.0 60.96 416.50 15.63 5.33 NO NO NO EU0096A 0 0.12010E+01 326192.0 4683221.0 192.0 70.10 560.90 13.53 2.82 NO NO NO RG0133 0 0.98900E+00 326299.0 4683107.0 192.0 26.82 560.90 7.48 2.97 NO NO NO RG0132 0 0.87100E+00 326305.0 4683579.0 192.0 20.73 560.90 17.11 1.68 NO NO NO EU0095A 0 0.84500E+00 326475.0 4683520.0 192.0 60.96 383.20 13.37 2.84 NO NO NO EU0120 0 0.34600E+00 326309.0 4683644.0 192.0 33.22 544.30 21.15 1.40 NO NO NO RG0133A 0 0.29900E+00 326299.0 4683107.0 192.0 26.82 560.90 7.48 2.97 NO NO NO EU0118 0 0.24100E+00 326059.0 4683063.0 192.0 37.49 422.00 9.27 0.91 NO NO NO EU0076 0 0.21800E+00 325960.0 4683058.0 192.0 31.09 477.60 1.62 4.27 NO NO NO *** POINT SOURCE DATA *** NUMBER EMISSION RATE BASE STACK STACK STACK STACK BLDG URBAN CAP/ EMIS RATE SOURCE PART. (GRAMS/SEC) X Y ELEV. HEIGHT TEMP. EXIT VEL. DIAMETER EXISTS SOURCE HOR SCALAR ID CATS. (METERS) (METERS) (METERS) (METERS) (DEG.K) (M/SEC) (METERS) VARY BY - - - - - - - - - - - - - - - - - - - - - - - - - - - - - - - - - - - - - - - - - - - - - - - - - - - - - - - - - - - - - - - - - EU0076A 0 0.16500E+00 326087.0 4683007.0 192.0 31.09 477.60 1.62 4.27 NO NO NO RG0130A 0 0.15900E+00 326323.0 4683637.0 192.0 60.96 416.50 15.63 5.33 NO NO NO RG0132A 0 0.14700E+00 326305.0 4683579.0 192.0 20.73 560.90 17.11 1.68 NO NO NO A8648 0 0.49000E+00 321801.0 4686168.0 192.0 12.31 295.70 10.14 0.31 NO NO NO A9831 0 0.28200E+01 322000.0 4683150.0 192.0 49.43 455.50 10.24 1.91 NO NO NO B2132 0 0.36000E+00 322800.0 4675000.0 192.0 46.94 415.70 8.71 2.44 NO NO NO B2169 0 0.20500E+01 324525.0 4682560.0 192.0 12.19 294.30 10.00 0.30 NO NO NO B2810 0 0.12300E+01 325800.0 4682000.0 192.0 123.80 427.30 47.00 3.82 NO NO NO B2811 0 0.53700E+01 319700.0 4665600.0 192.0 162.69 419.70 41.04 4.34 NO NO NO B3518 0 0.16000E+00 324200.0 4682800.0 192.0 29.01 344.70 17.80 0.71 NO NO NO B3533 0 0.43000E+00 323800.0 4686900.0 192.0 12.19 294.30 10.00 0.30 NO NO NO B3567 0 0.21000E+00 323850.0 4683450.0 192.0 12.19 294.30 10.00 0.30 NO NO NO N6631 0 0.24300E+01 322513.0 4685652.0 192.0 55.27 416.40 17.46 3.37 NO NO NO *** VOLUME SOURCE DATA *** NUMBER EMISSION RATE BASE RELEASE INIT. INIT. URBAN EMISSION RATE SOURCE PART. (GRAMS/SEC) X Y ELEV. HEIGHT SY SZ SOURCE SCALAR VARY ID CATS. (METERS) (METERS) (METERS) (METERS) (METERS) (METERS) BY

- - - - - - - - - - - - - - - - - - - - - - - - - - - - - - - - - - - - - - - - - - - - - - - - - - - - - - - - - - - - - B_CH_RM1 0 0.75000E-02 322245.7 4685529.0 192.0 23.17 6.55 10.77 NO B_CH_RM2 0 0.75000E-02 322239.4 4685541.5 192.0 23.17 6.55 10.77 NO B_CH_RM3 0 0.75000E-02 322233.0 4685554.0 192.0 23.17 6.55 10.77 NO B_CH_RM4 0 0.75000E-02 322226.5 4685567.0 192.0 23.17 6.55 10.77 NO B_CH_RM5 0 0.75000E-02 322220.4 4685579.5 192.0 23.17 6.55 10.77 NO C_CH_RM1 0 0.23500E-01 322190.4 4685634.5 192.0 29.26 6.59 13.61 NO C_CH_RM2 0 0.23500E-01 322184.1 4685647.0 192.0 29.26 6.59 13.61 NO C_CH_RM3 0 0.23500E-01 322177.7 4685659.5 192.0 29.26 6.59 13.61 NO C_CH_RM4 0 0.23500E-01 322171.4 4685672.5 192.0 29.26 6.59 13.61 NO BOF_RMW1 0 0.77000E-02 322007.2 4685043.5 192.0 65.53 8.62 30.20 NO BOF_RMW2 0 0.77000E-02 321998.8 4685060.0 192.0 65.53 8.62 30.20 NO BOF_RMW3 0 0.77000E-02 321990.5 4685076.5 192.0 65.53 8.62 30.20 NO BOF_RMW4 0 0.77000E-02 321982.3 4685093.0 192.0 65.53 8.62 30.20 NO BOF_RMW5 0 0.77000E-02 321973.8 4685109.5 192.0 65.53 8.62 30.20 NO BOF_RMW6 0 0.77000E-02 321965.7 4685126.0 192.0 65.53 8.62 30.20 NO BOF_RME1 0 0.77000E-02 322043.5 4685061.0 192.0 65.53 7.66 30.20 NO BOF_RME2 0 0.77000E-02 322036.2 4685075.5 192.0 65.53 7.66 30.20 NO BOF_RME3 0 0.77000E-02 322028.7 4685090.0 192.0 65.53 7.66 30.20 NO BOF_RME4 0 0.77000E-02 322021.3 4685105.0 192.0 65.53 7.66 30.20 NO BOF_RME5 0 0.77000E-02 322013.9 4685119.5 192.0 65.53 7.66 30.20 NO BOF_RMN1 0 0.77000E-02 321991.2 4685164.5 192.0 57.61 4.47 26.51 NO BOF_RMN2 0 0.77000E-02 321986.9 4685173.0 192.0 57.61 4.47 26.51 NO BOF_RMN3 0 0.77000E-02 321982.7 4685181.5 192.0 57.61 4.47 26.51 NO BOF_RMN4 0 0.77000E-02 321978.3 4685190.0 192.0 57.61 4.47 26.51 NO BOF_RMN5 0 0.77000E-02 321973.8 4685199.0 192.0 57.61 4.47 26.51 NO HND_SCF1 0 0.10160E+00 321254.4 4684513.0 192.0 31.39 7.10 14.60 NO HND_SCF2 0 0.10160E+00 321247.6 4684527.0 192.0 31.39 7.10 14.60 NO HND_SCF3 0 0.10160E+00 321240.7 4684540.5 192.0 31.39 7.10 14.60 NO HND_SCF4 0 0.10160E+00 321233.8 4684554.0 192.0 31.39 7.10 14.60 NO HND_SCF5 0 0.10160E+00 321227.0 4684568.0 192.0 31.39 7.10 14.60 NO GROUP ID SOURCE IDs ALL BF_B_SS , BF_C_SS , B_CH_RM1, B_CH_RM2, B_CH_RM3, B_CH_RM4, B_CH_RM5, C_CH_RM1, C_CH_RM2, C_CH_RM3, C_CH_RM4, BFCCH_BS, LM_UL_BH, HMTRN_BH, BOF_ESP , BOF_BH , BOF_RMW1, BOF_RMW2, BOF_RMW3, BOF_RMW4, BOF_RMW5, BOF_RMW6, BOF_RME1, BOF_RME2, BOF_RME3, BOF_RME4, BOF_RME5, BOF_RMN1, BOF_RMN2, BOF_RMN3, BOF_RMN4, BOF_RMN5, DESLF_BH, LRF#1_S , LRF2_FLX, COKE_REC, ANEAL_1S, ANEAL_2S, ANEAL_3S, ANEAL_4S, ANEAL_5S, ANEAL_6S, ANEAL_1N, ANEAL_2N, ANEAL_3N, ANEAL_4N, ANEAL_5N, RFURN1_1, RFURN1_2, RFURN2_1, RFURN2_2, RFURN3_1, RFURN3_2, HND_SCF1, HND_SCF2, HND_SCF3, HND_SCF4, HND_SCF5, EU0099 , EU0096 , EU0095 , RG0130 , EU0096A , RG0133 , RG0132 , EU0095A , EU0120 , RG0133A , EU0118 , EU0076 , EU0076A , RG0130A , RG0132A , A8648 , A9831 , B2132 , B2169 , B2810 , B2811 , B3518 , B3533 , B3567 , N6631 , A8640 BF_B_SS , BF_C_SS , B_CH_RM1, B_CH_RM2, B_CH_RM3, B_CH_RM4, B_CH_RM5, C_CH_RM1, C_CH_RM2, C_CH_RM3, C_CH_RM4, BFCCH_BS, LM_UL_BH, HMTRN_BH, BOF_ESP , BOF_BH , BOF_RMW1, BOF_RMW2, BOF_RMW3, BOF_RMW4, BOF_RMW5, BOF_RMW6, BOF_RME1, BOF_RME2, BOF_RME3, BOF_RME4, BOF_RME5, BOF_RMN1, BOF_RMN2, BOF_RMN3, BOF_RMN4, BOF_RMN5, DESLF_BH, LRF#1_S , LRF2_FLX, COKE_REC, ANEAL_1S, ANEAL_2S, ANEAL_3S, ANEAL_4S, ANEAL_5S, ANEAL_6S, ANEAL_1N, ANEAL_2N, ANEAL_3N, ANEAL_4N, RFURN1_1, RFURN1_2, RFURN2_1, RFURN2_2, RFURN3_1, RFURN3_2, HND_SCF1, HND_SCF2, HND_SCF3, HND_SCF4, HND_SCF5, A7809 EU0099 , EU0096 , EU0095 , RG0130 , EU0096A , RG0133 , RG0132 , EU0095A , EU0120 , RG0133A , EU0118 , EU0076 , EU0076A , RG0130A , RG0132A , A8648 A8648 , A9831 A9831 , B2132 B2132 , B2169 B2169 ,

B2810 B2810 , B2811 B2811 , SUMMARY OF MAXIMUM ANNUAL ( 1 YRS) RESULTS *** ALL 1ST HIGHEST VALUE IS 1.87622 AT ( 326344.00, 4685318.00 A8640 1ST HIGHEST VALUE IS 0.24373 AT ( 326344.00, 4685318.00 A7809 1ST HIGHEST VALUE IS 0.87434 AT ( 326344.00, 4685318.00 A8648 1ST HIGHEST VALUE IS 0.08392 AT ( 326344.00, 4685318.00 A9831 1ST HIGHEST VALUE IS 0.04044 AT ( 326344.00, 4685318.00 B2132 1ST HIGHEST VALUE IS 0.00264 AT ( 326344.00, 4685318.00 B2169 1ST HIGHEST VALUE IS 0.44840 AT ( 326344.00, 4685318.00 B2810 1ST HIGHEST VALUE IS 0.00293 AT ( 326344.00, 4685318.00 B2811 1ST HIGHEST VALUE IS 0.00483 AT ( 326344.00, 4685318.00 B3518 1ST HIGHEST VALUE IS 0.00962 AT ( 326344.00, 4685318.00 B3533 1ST HIGHEST VALUE IS 0.11624 AT ( 326344.00, 4685318.00 B3567 1ST HIGHEST VALUE IS 0.03397 AT ( 326344.00, 4685318.00 N6631 1ST HIGHEST VALUE IS 0.01533 AT ( 326344.00, 4685318.00

2009 AERMOD SUMMARY – ALLEN PARK MONITOR LOCATION
*** AERMOD - VERSION 07026 *** *** 2009 MONITOR IMPACTS (from Severstal, Marathon and U.S. reductions o *** 04/28/08 *** POINT SOURCE DATA *** NUMBER EMISSION RATE BASE STACK STACK STACK STACK BLDG URBAN CAP/ EMIS RATE SOURCE PART. (GRAMS/SEC) X Y ELEV. HEIGHT TEMP. EXIT VEL. DIAMETER EXISTS SOURCE HOR SCALAR ID CATS. (METERS) (METERS) (METERS) (METERS) (DEG.K) (M/SEC) (METERS) VARY BY - - - - - - - - - - - - - - - - - - - - - - - - - - - - - - - - - - - - - - - - - - - - - - - - - - - - - - - - - - - - - - - - - BF_B_SS 0 0.68440E+00 322263.4 4685504.0 192.0 57.91 672.04 9.60 2.52 YES NO NO BF_C_SS 0 0.11602E+01 322221.8 4685586.5 192.0 64.01 672.04 13.70 2.74 YES NO NO BFCCH_BS 0 0.48560E+00 322262.1 4685580.0 192.0 60.96 338.71 19.96 2.74 YES NO NO LM_UL_BH 0 0.75700E-01 322184.0 4684950.0 192.0 10.97 294.26 22.64 0.61 YES NO NO HMTRN_BH 0 0.00000E+00 322024.8 4685203.0 192.0 8.23 352.60 0.05 1.75 YES NO NO BOF_ESP 0 0.46856E+01 321932.5 4685047.5 192.0 64.92 422.04 18.84 5.18 YES NO NO BOF_BH 0 0.17840E+00 322004.8 4685285.0 192.0 60.96 338.71 18.95 4.88 YES NO NO DESLF_BH 0 0.11050E+00 321971.5 4685217.5 192.0 11.28 380.37 0.05 1.68 YES NO NO LRF#1_S 0 0.85380E+00 321983.0 4684947.0 192.0 45.11 297.04 13.97 2.74 YES NO NO LRF2_FLX 0 0.48790E+00 322097.1 4684808.5 192.0 45.72 433.15 17.97 1.83 YES NO NO COKE_REC 0 0.24280E+00 322127.2 4684707.5 192.0 5.49 294.26 21.38 0.71 YES NO NO ANEAL_1S 0 0.15900E-01 321846.1 4685170.0 192.0 21.34 1060.93 0.05 0.76 YES NO NO ANEAL_2S 0 0.15900E-01 321826.2 4685209.5 192.0 21.34 1060.93 0.05 0.76 YES NO NO ANEAL_3S 0 0.15900E-01 321806.3 4685249.0 192.0 21.34 1060.93 0.05 0.76 YES NO NO ANEAL_4S 0 0.15900E-01 321786.4 4685288.5 192.0 21.34 1060.93 0.05 0.76 YES NO NO ANEAL_5S 0 0.15900E-01 321766.5 4685328.0 192.0 21.34 1060.93 0.05 0.76 YES NO NO ANEAL_6S 0 0.15900E-01 321746.6 4685367.5 192.0 21.34 1060.93 0.05 0.76 YES NO NO ANEAL_1N 0 0.15900E-01 321726.0 4685387.5 192.0 21.34 1060.93 0.05 0.76 YES NO NO ANEAL_2N 0 0.15900E-01 321713.8 4685412.0 192.0 21.34 1060.93 0.05 0.76 YES NO NO ANEAL_3N 0 0.15900E-01 321701.4 4685436.5 192.0 21.34 1060.93 0.05 0.76 YES NO NO ANEAL_4N 0 0.15900E-01 321689.1 4685461.0 192.0 21.34 1060.93 0.05 0.76 YES NO NO ANEAL_5N 0 0.15900E-01 321676.7 4685485.5 192.0 21.34 1060.93 0.05 0.76 YES NO NO RFURN1_1 0 0.18660E+00 320999.0 4685172.0 192.0 63.40 922.04 4.39 4.27 YES NO NO RFURN1_2 0 0.18660E+00 321004.0 4685162.0 192.0 63.40 922.04 4.39 4.27 YES NO NO RFURN2_1 0 0.18660E+00 321009.0 4685152.0 192.0 63.40 922.04 4.39 4.27 YES NO NO RFURN2_2 0 0.18660E+00 321014.0 4685141.0 192.0 63.40 922.04 4.39 4.27 YES NO NO RFURN3_1 0 0.18660E+00 321020.0 4685131.0 192.0 63.40 922.04 4.39 4.27 YES NO NO RFURN3_2 0 0.18660E+00 321025.0 4685120.0 192.0 63.40 922.04 4.39 4.27 YES NO NO EU0099 0 0.40750E+01 326027.0 4682852.0 192.0 96.01 477.60 4.28 5.03 NO NO NO EU0096 0 0.26820E+01 326192.0 4683221.0 192.0 20.73 294.30 15.16 3.30 NO NO NO EU0095 0 0.26310E+01 326475.0 4683520.0 192.0 19.81 294.30 10.35 3.05 NO NO NO RG0130 0 0.23970E+01 326323.0 4683637.0 192.0 60.96 416.50 15.63 5.33 NO NO NO EU0096A 0 0.12010E+01 326192.0 4683221.0 192.0 70.10 560.90 13.53 2.82 NO NO NO RG0133 0 0.98900E+00 326299.0 4683107.0 192.0 26.82 560.90 7.48 2.97 NO NO NO RG0132 0 0.87100E+00 326305.0 4683579.0 192.0 20.73 560.90 17.11 1.68 NO NO NO EU0095A 0 0.84500E+00 326475.0 4683520.0 192.0 60.96 383.20 13.37 2.84 NO NO NO EU0120 0 0.34600E+00 326309.0 4683644.0 192.0 33.22 544.30 21.15 1.40 NO NO NO RG0133A 0 0.29900E+00 326299.0 4683107.0 192.0 26.82 560.90 7.48 2.97 NO NO NO EU0118 0 0.24100E+00 326059.0 4683063.0 192.0 37.49 422.00 9.27 0.91 NO NO NO EU0076 0 0.21800E+00 325960.0 4683058.0 192.0 31.09 477.60 1.62 4.27 NO NO NO *** POINT SOURCE DATA *** NUMBER EMISSION RATE BASE STACK STACK STACK STACK BLDG URBAN CAP/ EMIS RATE SOURCE PART. (GRAMS/SEC) X Y ELEV. HEIGHT TEMP. EXIT VEL. DIAMETER EXISTS SOURCE HOR SCALAR ID CATS. (METERS) (METERS) (METERS) (METERS) (DEG.K) (M/SEC) (METERS) VARY BY - - - - - - - - - - - - - - - - - - - - - - - - - - - - - - - - - - - - - - - - - - - - - - - - - - - - - - - - - - - - - - - - - EU0076A 0 0.16500E+00 326087.0 4683007.0 192.0 31.09 477.60 1.62 4.27 NO NO NO RG0130A 0 0.15900E+00 326323.0 4683637.0 192.0 60.96 416.50 15.63 5.33 NO NO NO RG0132A 0 0.14700E+00 326305.0 4683579.0 192.0 20.73 560.90 17.11 1.68 NO NO NO A8648 0 0.49000E+00 321801.0 4686168.0 192.0 12.31 295.70 10.14 0.31 NO NO NO A9831 0 0.28200E+01 322000.0 4683150.0 192.0 49.43 455.50 10.24 1.91 NO NO NO B2132 0 0.36000E+00 322800.0 4675000.0 192.0 46.94 415.70 8.71 2.44 NO NO NO B2169 0 0.20500E+01 324525.0 4682560.0 192.0 12.19 294.30 10.00 0.30 NO NO NO B2810 0 0.12300E+01 325800.0 4682000.0 192.0 123.80 427.30 47.00 3.82 NO NO NO B2811 0 0.53700E+01 319700.0 4665600.0 192.0 162.69 419.70 41.04 4.34 NO NO NO B3518 0 0.16000E+00 324200.0 4682800.0 192.0 29.01 344.70 17.80 0.71 NO NO NO B3533 0 0.43000E+00 323800.0 4686900.0 192.0 12.19 294.30 10.00 0.30 NO NO NO B3567 0 0.21000E+00 323850.0 4683450.0 192.0 12.19 294.30 10.00 0.30 NO NO NO N6631 0 0.24300E+01 322513.0 4685652.0 192.0 55.27 416.40 17.46 3.37 NO NO NO *** VOLUME SOURCE DATA ***

NUMBER EMISSION RATE BASE RELEASE INIT. INIT. URBAN EMISSION RATE SOURCE PART. (GRAMS/SEC) X Y ELEV. HEIGHT SY SZ SOURCE SCALAR VARY ID CATS. (METERS) (METERS) (METERS) (METERS) (METERS) (METERS) BY - - - - - - - - - - - - - - - - - - - - - - - - - - - - - - - - - - - - - - - - - - - - - - - - - - - - - - - - - - - - - B_CH_RM1 0 0.75000E-02 322245.7 4685529.0 192.0 23.17 6.55 10.77 NO B_CH_RM2 0 0.75000E-02 322239.4 4685541.5 192.0 23.17 6.55 10.77 NO B_CH_RM3 0 0.75000E-02 322233.0 4685554.0 192.0 23.17 6.55 10.77 NO B_CH_RM4 0 0.75000E-02 322226.5 4685567.0 192.0 23.17 6.55 10.77 NO B_CH_RM5 0 0.75000E-02 322220.4 4685579.5 192.0 23.17 6.55 10.77 NO C_CH_RM1 0 0.23500E-01 322190.4 4685634.5 192.0 29.26 6.59 13.61 NO C_CH_RM2 0 0.23500E-01 322184.1 4685647.0 192.0 29.26 6.59 13.61 NO C_CH_RM3 0 0.23500E-01 322177.7 4685659.5 192.0 29.26 6.59 13.61 NO C_CH_RM4 0 0.23500E-01 322171.4 4685672.5 192.0 29.26 6.59 13.61 NO BOF_RMW1 0 0.77000E-02 322007.2 4685043.5 192.0 65.53 8.62 30.20 NO BOF_RMW2 0 0.77000E-02 321998.8 4685060.0 192.0 65.53 8.62 30.20 NO BOF_RMW3 0 0.77000E-02 321990.5 4685076.5 192.0 65.53 8.62 30.20 NO BOF_RMW4 0 0.77000E-02 321982.3 4685093.0 192.0 65.53 8.62 30.20 NO BOF_RMW5 0 0.77000E-02 321973.8 4685109.5 192.0 65.53 8.62 30.20 NO BOF_RMW6 0 0.77000E-02 321965.7 4685126.0 192.0 65.53 8.62 30.20 NO BOF_RME1 0 0.77000E-02 322043.5 4685061.0 192.0 65.53 7.66 30.20 NO BOF_RME2 0 0.77000E-02 322036.2 4685075.5 192.0 65.53 7.66 30.20 NO BOF_RME3 0 0.77000E-02 322028.7 4685090.0 192.0 65.53 7.66 30.20 NO BOF_RME4 0 0.77000E-02 322021.3 4685105.0 192.0 65.53 7.66 30.20 NO BOF_RME5 0 0.77000E-02 322013.9 4685119.5 192.0 65.53 7.66 30.20 NO BOF_RMN1 0 0.77000E-02 321991.2 4685164.5 192.0 57.61 4.47 26.51 NO BOF_RMN2 0 0.77000E-02 321986.9 4685173.0 192.0 57.61 4.47 26.51 NO BOF_RMN3 0 0.77000E-02 321982.7 4685181.5 192.0 57.61 4.47 26.51 NO BOF_RMN4 0 0.77000E-02 321978.3 4685190.0 192.0 57.61 4.47 26.51 NO BOF_RMN5 0 0.77000E-02 321973.8 4685199.0 192.0 57.61 4.47 26.51 NO HND_SCF1 0 0.10160E+00 321254.4 4684513.0 192.0 31.39 7.10 14.60 NO HND_SCF2 0 0.10160E+00 321247.6 4684527.0 192.0 31.39 7.10 14.60 NO HND_SCF3 0 0.10160E+00 321240.7 4684540.5 192.0 31.39 7.10 14.60 NO HND_SCF4 0 0.10160E+00 321233.8 4684554.0 192.0 31.39 7.10 14.60 NO HND_SCF5 0 0.10160E+00 321227.0 4684568.0 192.0 31.39 7.10 14.60 NO GROUP ID SOURCE IDs ALL BF_B_SS , BF_C_SS , B_CH_RM1, B_CH_RM2, B_CH_RM3, B_CH_RM4, B_CH_RM5, C_CH_RM1, C_CH_RM2, C_CH_RM3, C_CH_RM4, BFCCH_BS, LM_UL_BH, HMTRN_BH, BOF_ESP , BOF_BH , BOF_RMW1, BOF_RMW2, BOF_RMW3, BOF_RMW4, BOF_RMW5, BOF_RMW6, BOF_RME1, BOF_RME2, BOF_RME3, BOF_RME4, BOF_RME5, BOF_RMN1, BOF_RMN2, BOF_RMN3, BOF_RMN4, BOF_RMN5, DESLF_BH, LRF#1_S , LRF2_FLX, COKE_REC, ANEAL_1S, ANEAL_2S, ANEAL_3S, ANEAL_4S, ANEAL_5S, ANEAL_6S, ANEAL_1N, ANEAL_2N, ANEAL_3N, ANEAL_4N, ANEAL_5N, RFURN1_1, RFURN1_2, RFURN2_1, RFURN2_2, RFURN3_1, RFURN3_2, HND_SCF1, HND_SCF2, HND_SCF3, HND_SCF4, HND_SCF5, EU0099 , EU0096 , EU0095 , RG0130 , EU0096A , RG0133 , RG0132 , EU0095A , EU0120 , RG0133A , EU0118 , EU0076 , EU0076A , RG0130A , RG0132A , A8648 , A9831 , B2132 , B2169 , B2810 , B2811 , B3518 , B3533 , B3567 , N6631 , A8640 BF_B_SS , BF_C_SS , B_CH_RM1, B_CH_RM2, B_CH_RM3, B_CH_RM4, B_CH_RM5, C_CH_RM1, C_CH_RM2, C_CH_RM3, C_CH_RM4, BFCCH_BS, LM_UL_BH, HMTRN_BH, BOF_ESP , BOF_BH , BOF_RMW1, BOF_RMW2, BOF_RMW3, BOF_RMW4, BOF_RMW5, BOF_RMW6, BOF_RME1, BOF_RME2, BOF_RME3, BOF_RME4, BOF_RME5, BOF_RMN1, BOF_RMN2, BOF_RMN3, BOF_RMN4, BOF_RMN5, DESLF_BH, LRF#1_S , LRF2_FLX, COKE_REC, ANEAL_1S, ANEAL_2S, ANEAL_3S, ANEAL_4S, ANEAL_5S, ANEAL_6S, ANEAL_1N, ANEAL_2N, ANEAL_3N, ANEAL_4N, RFURN1_1, RFURN1_2, RFURN2_1, RFURN2_2, RFURN3_1, RFURN3_2, HND_SCF1, HND_SCF2, HND_SCF3, HND_SCF4, HND_SCF5, A7809 EU0099 , EU0096 , EU0095 , RG0130 , EU0096A , RG0133 , RG0132 , EU0095A , EU0120 , RG0133A , EU0118 , EU0076 , EU0076A , RG0130A , RG0132A , A8648 A8648 , A9831 A9831 , B2132 B2132 ,

B2169 B2169 , B2810 B2810 , B2811 B2811 , SUMMARY OF MAXIMUM ANNUAL ( 1 YRS) RESULTS *** ALL 1ST HIGHEST VALUE IS 0.42555 AT ( 317758.00, 4677306.00 A8640 1ST HIGHEST VALUE IS 0.14868 AT ( 317758.00, 4677306.00 A7809 1ST HIGHEST VALUE IS 0.08436 AT ( 317758.00, 4677306.00 A8648 1ST HIGHEST VALUE IS 0.03304 AT ( 317758.00, 4677306.00 A9831 1ST HIGHEST VALUE IS 0.02178 AT ( 317758.00, 4677306.00 B2132 1ST HIGHEST VALUE IS 0.00156 AT ( 317758.00, 4677306.00 B2169 1ST HIGHEST VALUE IS 0.08669 AT ( 317758.00, 4677306.00 B2810 1ST HIGHEST VALUE IS 0.00159 AT ( 317758.00, 4677306.00 B2811 1ST HIGHEST VALUE IS 0.00585 AT ( 317758.00, 4677306.00 B3518 1ST HIGHEST VALUE IS 0.00177 AT ( 317758.00, 4677306.00 B3533 1ST HIGHEST VALUE IS 0.01993 AT ( 317758.00, 4677306.00 B3567 1ST HIGHEST VALUE IS 0.01052 AT ( 317758.00, 4677306.00 N6631 1ST HIGHEST VALUE IS 0.00899 AT ( 317758.00, 4677306.00

2009 AERMOD SUMMARY – WYANDOTTE MONITOR LOCATION
*** AERMOD - VERSION 07026 *** *** 2009 MONITOR IMPACTS (from Severstal, Marathon and U.S. reductions o *** 04/28/08 *** POINT SOURCE DATA *** NUMBER EMISSION RATE BASE STACK STACK STACK STACK BLDG URBAN CAP/ EMIS RATE SOURCE PART. (GRAMS/SEC) X Y ELEV. HEIGHT TEMP. EXIT VEL. DIAMETER EXISTS SOURCE HOR SCALAR ID CATS. (METERS) (METERS) (METERS) (METERS) (DEG.K) (M/SEC) (METERS) VARY BY - - - - - - - - - - - - - - - - - - - - - - - - - - - - - - - - - - - - - - - - - - - - - - - - - - - - - - - - - - - - - - - - - BF_B_SS 0 0.68440E+00 322263.4 4685504.0 192.0 57.91 672.04 9.60 2.52 YES NO NO BF_C_SS 0 0.11602E+01 322221.8 4685586.5 192.0 64.01 672.04 13.70 2.74 YES NO NO BFCCH_BS 0 0.48560E+00 322262.1 4685580.0 192.0 60.96 338.71 19.96 2.74 YES NO NO LM_UL_BH 0 0.75700E-01 322184.0 4684950.0 192.0 10.97 294.26 22.64 0.61 YES NO NO HMTRN_BH 0 0.00000E+00 322024.8 4685203.0 192.0 8.23 352.60 0.05 1.75 YES NO NO BOF_ESP 0 0.46856E+01 321932.5 4685047.5 192.0 64.92 422.04 18.84 5.18 YES NO NO BOF_BH 0 0.17840E+00 322004.8 4685285.0 192.0 60.96 338.71 18.95 4.88 YES NO NO DESLF_BH 0 0.11050E+00 321971.5 4685217.5 192.0 11.28 380.37 0.05 1.68 YES NO NO LRF#1_S 0 0.85380E+00 321983.0 4684947.0 192.0 45.11 297.04 13.97 2.74 YES NO NO LRF2_FLX 0 0.48790E+00 322097.1 4684808.5 192.0 45.72 433.15 17.97 1.83 YES NO NO COKE_REC 0 0.24280E+00 322127.2 4684707.5 192.0 5.49 294.26 21.38 0.71 YES NO NO ANEAL_1S 0 0.15900E-01 321846.1 4685170.0 192.0 21.34 1060.93 0.05 0.76 YES NO NO ANEAL_2S 0 0.15900E-01 321826.2 4685209.5 192.0 21.34 1060.93 0.05 0.76 YES NO NO ANEAL_3S 0 0.15900E-01 321806.3 4685249.0 192.0 21.34 1060.93 0.05 0.76 YES NO NO ANEAL_4S 0 0.15900E-01 321786.4 4685288.5 192.0 21.34 1060.93 0.05 0.76 YES NO NO ANEAL_5S 0 0.15900E-01 321766.5 4685328.0 192.0 21.34 1060.93 0.05 0.76 YES NO NO ANEAL_6S 0 0.15900E-01 321746.6 4685367.5 192.0 21.34 1060.93 0.05 0.76 YES NO NO ANEAL_1N 0 0.15900E-01 321726.0 4685387.5 192.0 21.34 1060.93 0.05 0.76 YES NO NO ANEAL_2N 0 0.15900E-01 321713.8 4685412.0 192.0 21.34 1060.93 0.05 0.76 YES NO NO ANEAL_3N 0 0.15900E-01 321701.4 4685436.5 192.0 21.34 1060.93 0.05 0.76 YES NO NO ANEAL_4N 0 0.15900E-01 321689.1 4685461.0 192.0 21.34 1060.93 0.05 0.76 YES NO NO ANEAL_5N 0 0.15900E-01 321676.7 4685485.5 192.0 21.34 1060.93 0.05 0.76 YES NO NO RFURN1_1 0 0.18660E+00 320999.0 4685172.0 192.0 63.40 922.04 4.39 4.27 YES NO NO RFURN1_2 0 0.18660E+00 321004.0 4685162.0 192.0 63.40 922.04 4.39 4.27 YES NO NO RFURN2_1 0 0.18660E+00 321009.0 4685152.0 192.0 63.40 922.04 4.39 4.27 YES NO NO RFURN2_2 0 0.18660E+00 321014.0 4685141.0 192.0 63.40 922.04 4.39 4.27 YES NO NO RFURN3_1 0 0.18660E+00 321020.0 4685131.0 192.0 63.40 922.04 4.39 4.27 YES NO NO RFURN3_2 0 0.18660E+00 321025.0 4685120.0 192.0 63.40 922.04 4.39 4.27 YES NO NO EU0099 0 0.40750E+01 326027.0 4682852.0 192.0 96.01 477.60 4.28 5.03 NO NO NO EU0096 0 0.26820E+01 326192.0 4683221.0 192.0 20.73 294.30 15.16 3.30 NO NO NO EU0095 0 0.26310E+01 326475.0 4683520.0 192.0 19.81 294.30 10.35 3.05 NO NO NO RG0130 0 0.23970E+01 326323.0 4683637.0 192.0 60.96 416.50 15.63 5.33 NO NO NO EU0096A 0 0.12010E+01 326192.0 4683221.0 192.0 70.10 560.90 13.53 2.82 NO NO NO RG0133 0 0.98900E+00 326299.0 4683107.0 192.0 26.82 560.90 7.48 2.97 NO NO NO RG0132 0 0.87100E+00 326305.0 4683579.0 192.0 20.73 560.90 17.11 1.68 NO NO NO EU0095A 0 0.84500E+00 326475.0 4683520.0 192.0 60.96 383.20 13.37 2.84 NO NO NO EU0120 0 0.34600E+00 326309.0 4683644.0 192.0 33.22 544.30 21.15 1.40 NO NO NO RG0133A 0 0.29900E+00 326299.0 4683107.0 192.0 26.82 560.90 7.48 2.97 NO NO NO EU0118 0 0.24100E+00 326059.0 4683063.0 192.0 37.49 422.00 9.27 0.91 NO NO NO EU0076 0 0.21800E+00 325960.0 4683058.0 192.0 31.09 477.60 1.62 4.27 NO NO NO *** POINT SOURCE DATA *** NUMBER EMISSION RATE BASE STACK STACK STACK STACK BLDG URBAN CAP/ EMIS RATE SOURCE PART. (GRAMS/SEC) X Y ELEV. HEIGHT TEMP. EXIT VEL. DIAMETER EXISTS SOURCE HOR SCALAR ID CATS. (METERS) (METERS) (METERS) (METERS) (DEG.K) (M/SEC) (METERS) VARY BY - - - - - - - - - - - - - - - - - - - - - - - - - - - - - - - - - - - - - - - - - - - - - - - - - - - - - - - - - - - - - - - - - EU0076A 0 0.16500E+00 326087.0 4683007.0 192.0 31.09 477.60 1.62 4.27 NO NO NO RG0130A 0 0.15900E+00 326323.0 4683637.0 192.0 60.96 416.50 15.63 5.33 NO NO NO RG0132A 0 0.14700E+00 326305.0 4683579.0 192.0 20.73 560.90 17.11 1.68 NO NO NO A8648 0 0.49000E+00 321801.0 4686168.0 192.0 12.31 295.70 10.14 0.31 NO NO NO A9831 0 0.28200E+01 322000.0 4683150.0 192.0 49.43 455.50 10.24 1.91 NO NO NO B2132 0 0.36000E+00 322800.0 4675000.0 192.0 46.94 415.70 8.71 2.44 NO NO NO B2169 0 0.20500E+01 324525.0 4682560.0 192.0 12.19 294.30 10.00 0.30 NO NO NO B2810 0 0.12300E+01 325800.0 4682000.0 192.0 123.80 427.30 47.00 3.82 NO NO NO B2811 0 0.53700E+01 319700.0 4665600.0 192.0 162.69 419.70 41.04 4.34 NO NO NO B3518 0 0.16000E+00 324200.0 4682800.0 192.0 29.01 344.70 17.80 0.71 NO NO NO B3533 0 0.43000E+00 323800.0 4686900.0 192.0 12.19 294.30 10.00 0.30 NO NO NO B3567 0 0.21000E+00 323850.0 4683450.0 192.0 12.19 294.30 10.00 0.30 NO NO NO N6631 0 0.24300E+01 322513.0 4685652.0 192.0 55.27 416.40 17.46 3.37 NO NO NO *** VOLUME SOURCE DATA *** NUMBER EMISSION RATE BASE RELEASE INIT. INIT. URBAN EMISSION RATE

SOURCE PART. (GRAMS/SEC) X Y ELEV. HEIGHT SY SZ SOURCE SCALAR VARY ID CATS. (METERS) (METERS) (METERS) (METERS) (METERS) (METERS) BY - - - - - - - - - - - - - - - - - - - - - - - - - - - - - - - - - - - - - - - - - - - - - - - - - - - - - - - - - - - - - B_CH_RM1 0 0.75000E-02 322245.7 4685529.0 192.0 23.17 6.55 10.77 NO B_CH_RM2 0 0.75000E-02 322239.4 4685541.5 192.0 23.17 6.55 10.77 NO B_CH_RM3 0 0.75000E-02 322233.0 4685554.0 192.0 23.17 6.55 10.77 NO B_CH_RM4 0 0.75000E-02 322226.5 4685567.0 192.0 23.17 6.55 10.77 NO B_CH_RM5 0 0.75000E-02 322220.4 4685579.5 192.0 23.17 6.55 10.77 NO C_CH_RM1 0 0.23500E-01 322190.4 4685634.5 192.0 29.26 6.59 13.61 NO C_CH_RM2 0 0.23500E-01 322184.1 4685647.0 192.0 29.26 6.59 13.61 NO C_CH_RM3 0 0.23500E-01 322177.7 4685659.5 192.0 29.26 6.59 13.61 NO C_CH_RM4 0 0.23500E-01 322171.4 4685672.5 192.0 29.26 6.59 13.61 NO BOF_RMW1 0 0.77000E-02 322007.2 4685043.5 192.0 65.53 8.62 30.20 NO BOF_RMW2 0 0.77000E-02 321998.8 4685060.0 192.0 65.53 8.62 30.20 NO BOF_RMW3 0 0.77000E-02 321990.5 4685076.5 192.0 65.53 8.62 30.20 NO BOF_RMW4 0 0.77000E-02 321982.3 4685093.0 192.0 65.53 8.62 30.20 NO BOF_RMW5 0 0.77000E-02 321973.8 4685109.5 192.0 65.53 8.62 30.20 NO BOF_RMW6 0 0.77000E-02 321965.7 4685126.0 192.0 65.53 8.62 30.20 NO BOF_RME1 0 0.77000E-02 322043.5 4685061.0 192.0 65.53 7.66 30.20 NO BOF_RME2 0 0.77000E-02 322036.2 4685075.5 192.0 65.53 7.66 30.20 NO BOF_RME3 0 0.77000E-02 322028.7 4685090.0 192.0 65.53 7.66 30.20 NO BOF_RME4 0 0.77000E-02 322021.3 4685105.0 192.0 65.53 7.66 30.20 NO BOF_RME5 0 0.77000E-02 322013.9 4685119.5 192.0 65.53 7.66 30.20 NO BOF_RMN1 0 0.77000E-02 321991.2 4685164.5 192.0 57.61 4.47 26.51 NO BOF_RMN2 0 0.77000E-02 321986.9 4685173.0 192.0 57.61 4.47 26.51 NO BOF_RMN3 0 0.77000E-02 321982.7 4685181.5 192.0 57.61 4.47 26.51 NO BOF_RMN4 0 0.77000E-02 321978.3 4685190.0 192.0 57.61 4.47 26.51 NO BOF_RMN5 0 0.77000E-02 321973.8 4685199.0 192.0 57.61 4.47 26.51 NO HND_SCF1 0 0.10160E+00 321254.4 4684513.0 192.0 31.39 7.10 14.60 NO HND_SCF2 0 0.10160E+00 321247.6 4684527.0 192.0 31.39 7.10 14.60 NO HND_SCF3 0 0.10160E+00 321240.7 4684540.5 192.0 31.39 7.10 14.60 NO HND_SCF4 0 0.10160E+00 321233.8 4684554.0 192.0 31.39 7.10 14.60 NO HND_SCF5 0 0.10160E+00 321227.0 4684568.0 192.0 31.39 7.10 14.60 NO GROUP ID SOURCE IDs ALL BF_B_SS , BF_C_SS , B_CH_RM1, B_CH_RM2, B_CH_RM3, B_CH_RM4, B_CH_RM5, C_CH_RM1, C_CH_RM2, C_CH_RM3, C_CH_RM4, BFCCH_BS, LM_UL_BH, HMTRN_BH, BOF_ESP , BOF_BH , BOF_RMW1, BOF_RMW2, BOF_RMW3, BOF_RMW4, BOF_RMW5, BOF_RMW6, BOF_RME1, BOF_RME2, BOF_RME3, BOF_RME4, BOF_RME5, BOF_RMN1, BOF_RMN2, BOF_RMN3, BOF_RMN4, BOF_RMN5, DESLF_BH, LRF#1_S , LRF2_FLX, COKE_REC, ANEAL_1S, ANEAL_2S, ANEAL_3S, ANEAL_4S, ANEAL_5S, ANEAL_6S, ANEAL_1N, ANEAL_2N, ANEAL_3N, ANEAL_4N, ANEAL_5N, RFURN1_1, RFURN1_2, RFURN2_1, RFURN2_2, RFURN3_1, RFURN3_2, HND_SCF1, HND_SCF2, HND_SCF3, HND_SCF4, HND_SCF5, EU0099 , EU0096 , EU0095 , RG0130 , EU0096A , RG0133 , RG0132 , EU0095A , EU0120 , RG0133A , EU0118 , EU0076 , EU0076A , RG0130A , RG0132A , A8648 , A9831 , B2132 , B2169 , B2810 , B2811 , B3518 , B3533 , B3567 , N6631 , A8640 BF_B_SS , BF_C_SS , B_CH_RM1, B_CH_RM2, B_CH_RM3, B_CH_RM4, B_CH_RM5, C_CH_RM1, C_CH_RM2, C_CH_RM3, C_CH_RM4, BFCCH_BS, LM_UL_BH, HMTRN_BH, BOF_ESP , BOF_BH , BOF_RMW1, BOF_RMW2, BOF_RMW3, BOF_RMW4, BOF_RMW5, BOF_RMW6, BOF_RME1, BOF_RME2, BOF_RME3, BOF_RME4, BOF_RME5, BOF_RMN1, BOF_RMN2, BOF_RMN3, BOF_RMN4, BOF_RMN5, DESLF_BH, LRF#1_S , LRF2_FLX, COKE_REC, ANEAL_1S, ANEAL_2S, ANEAL_3S, ANEAL_4S, ANEAL_5S, ANEAL_6S, ANEAL_1N, ANEAL_2N, ANEAL_3N, ANEAL_4N, RFURN1_1, RFURN1_2, RFURN2_1, RFURN2_2, RFURN3_1, RFURN3_2, HND_SCF1, HND_SCF2, HND_SCF3, HND_SCF4, HND_SCF5, A7809 EU0099 , EU0096 , EU0095 , RG0130 , EU0096A , RG0133 , RG0132 , EU0095A , EU0120 , RG0133A , EU0118 , EU0076 , EU0076A , RG0130A , RG0132A , A8648 A8648 , A9831 A9831 , B2132 B2132 , B2169 B2169 ,

B2810 B2810 , B2811 B2811 , SUMMARY OF MAXIMUM ANNUAL ( 1 YRS) RESULTS *** ALL 1ST HIGHEST VALUE IS 0.44447 AT ( 322122.00, 4672602.00 A8640 1ST HIGHEST VALUE IS 0.06301 AT ( 322122.00, 4672602.00 A7809 1ST HIGHEST VALUE IS 0.17178 AT ( 322122.00, 4672602.00 A8648 1ST HIGHEST VALUE IS 0.01306 AT ( 322122.00, 4672602.00 A9831 1ST HIGHEST VALUE IS 0.01817 AT ( 322122.00, 4672602.00 B2132 1ST HIGHEST VALUE IS 0.00662 AT ( 322122.00, 4672602.00 B2169 1ST HIGHEST VALUE IS 0.12625 AT ( 322122.00, 4672602.00 B2810 1ST HIGHEST VALUE IS 0.00191 AT ( 322122.00, 4672602.00 B2811 1ST HIGHEST VALUE IS 0.00793 AT ( 322122.00, 4672602.00 B3518 1ST HIGHEST VALUE IS 0.00275 AT ( 322122.00, 4672602.00 B3533 1ST HIGHEST VALUE IS 0.01534 AT ( 322122.00, 4672602.00 B3567 1ST HIGHEST VALUE IS 0.01134 AT ( 322122.00, 4672602.00 N6631 1ST HIGHEST VALUE IS 0.00632 AT ( 322122.00, 4672602.00

2005 AERMOD SUMMARY – DEARBORN MONITOR LOCATION RAILYARD REDUCTIONS
*** AERMOD - VERSION 07026 *** *** DEARBORN MONITOR IMPACTS *** 04/29/08 *** VOLUME SOURCE DATA *** NUMBER EMISSION RATE BASE RELEASE INIT. INIT. URBAN EMISSION RATE SOURCE PART. (GRAMS/SEC) X Y ELEV. HEIGHT SY SZ SOURCE SCALAR VARY ID CATS. (METERS) (METERS) (METERS) (METERS) (METERS) (METERS) BY - - - - - - - - - - - - - - - - - - - - - - - - - - - - - - - - - - - - - - - - - - - - - - - - - - - - - - - - - - - - - CSX_01 0 0.36060E-02 322524.0 4686057.0 192.0 4.25 23.26 3.95 NO CSX_02 0 0.36060E-02 322545.0 4686012.0 192.0 4.25 23.26 3.95 NO CSX_03 0 0.36060E-02 322566.0 4685966.0 192.0 4.25 23.26 3.95 NO CSX_04 0 0.36060E-02 322587.0 4685921.0 192.0 4.25 23.26 3.95 NO CSX_05 0 0.36060E-02 322607.9 4685876.0 192.0 4.25 23.26 3.95 NO CSX_06 0 0.36060E-02 322628.9 4685830.0 192.0 4.25 23.26 3.95 NO CSX_07 0 0.36060E-02 322649.9 4685785.0 192.0 4.25 23.26 3.95 NO CSX_08 0 0.36060E-02 322670.9 4685740.0 192.0 4.25 23.26 3.95 NO CSX_09 0 0.36060E-02 322691.9 4685694.0 192.0 4.25 23.26 3.95 NO CSX_10 0 0.36060E-02 322712.9 4685649.0 192.0 4.25 23.26 3.95 NO CSX_11 0 0.36060E-02 322733.9 4685603.0 192.0 4.25 23.26 3.95 NO CSX_12 0 0.36060E-02 322754.8 4685558.0 192.0 4.25 23.26 3.95 NO CSX_13 0 0.36060E-02 322775.8 4685513.0 192.0 4.25 23.26 3.95 NO CSX_14 0 0.36060E-02 322796.8 4685467.0 192.0 4.25 23.26 3.95 NO CSX_15 0 0.36060E-02 322817.8 4685422.0 192.0 4.25 23.26 3.95 NO CSX_16 0 0.36060E-02 322838.8 4685377.0 192.0 4.25 23.26 3.95 NO SEVER_01 0 0.29250E-03 321271.3 4686627.0 192.0 4.25 23.26 3.95 NO SEVER_02 0 0.29250E-03 321240.7 4686588.0 192.0 4.25 23.26 3.95 NO SEVER_03 0 0.29250E-03 321210.1 4686548.0 192.0 4.25 23.26 3.95 NO SEVER_04 0 0.29250E-03 321179.5 4686509.0 192.0 4.25 23.26 3.95 NO SEVER_05 0 0.29250E-03 321148.9 4686469.0 192.0 4.25 23.26 3.95 NO SEVER_06 0 0.29250E-03 321118.3 4686430.0 192.0 4.25 23.26 3.95 NO SEVER_07 0 0.29250E-03 321087.7 4686390.0 192.0 4.25 23.26 3.95 NO SEVER_08 0 0.29250E-03 321057.1 4686350.0 192.0 4.25 23.26 3.95 NO SEVER_09 0 0.29250E-03 321026.5 4686311.0 192.0 4.25 23.26 3.95 NO SEVER_10 0 0.29250E-03 320995.8 4686271.0 192.0 4.25 23.26 3.95 NO SEVER_11 0 0.29250E-03 320965.3 4686232.0 192.0 4.25 23.26 3.95 NO SEVER_12 0 0.29250E-03 320934.7 4686192.0 192.0 4.25 23.26 3.95 NO SEVER_13 0 0.29250E-03 320904.0 4686153.0 192.0 4.25 23.26 3.95 NO SEVER_14 0 0.29250E-03 320873.4 4686113.0 192.0 4.25 23.26 3.95 NO SEVER_15 0 0.29250E-03 320842.8 4686074.0 192.0 4.25 23.26 3.95 NO CONLV_01 0 0.73150E-03 324682.3 4687492.0 192.0 4.25 23.26 3.95 NO CONLV_02 0 0.73150E-03 324731.7 4687500.0 192.0 4.25 23.26 3.95 NO CONLV_03 0 0.73150E-03 324781.0 4687508.0 192.0 4.25 23.26 3.95 NO CONLV_04 0 0.73150E-03 324830.4 4687516.0 192.0 4.25 23.26 3.95 NO CONLV_05 0 0.73150E-03 324879.8 4687524.0 192.0 4.25 23.26 3.95 NO CONLV_06 0 0.73150E-03 324929.1 4687532.0 192.0 4.25 23.26 3.95 NO CONLV_07 0 0.73150E-03 324978.4 4687540.0 192.0 4.25 23.26 3.95 NO CONLV_08 0 0.73150E-03 325027.8 4687548.0 192.0 4.25 23.26 3.95 NO CONLV_09 0 0.73150E-03 325077.2 4687556.0 192.0 4.25 23.26 3.95 NO *** VOLUME SOURCE DATA *** NUMBER EMISSION RATE BASE RELEASE INIT. INIT. URBAN EMISSION RATE SOURCE PART. (GRAMS/SEC) X Y ELEV. HEIGHT SY SZ SOURCE SCALAR VARY ID CATS. (METERS) (METERS) (METERS) (METERS) (METERS) (METERS) BY - - - - - - - - - - - - - - - - - - - - - - - - - - - - - - - - - - - - - - - - - - - - - - - - - - - - - - - - - - - - - CONLV_10 0 0.73150E-03 325126.5 4687564.0 192.0 4.25 23.26 3.95 NO CONLV_11 0 0.73150E-03 325175.9 4687572.0 192.0 4.25 23.26 3.95 NO CONLV_12 0 0.73150E-03 325225.2 4687580.0 192.0 4.25 23.26 3.95 NO CONLV_13 0 0.73150E-03 325274.6 4687588.0 192.0 4.25 23.26 3.95 NO CONLV_14 0 0.73150E-03 325323.9 4687596.0 192.0 4.25 23.26 3.95 NO CONLV_15 0 0.73150E-03 325373.3 4687604.0 192.0 4.25 23.26 3.95 NO CONLV_16 0 0.73150E-03 325422.7 4687612.0 192.0 4.25 23.26 3.95 NO CONLV_17 0 0.73150E-03 325472.0 4687620.0 192.0 4.25 23.26 3.95 NO CONLV_18 0 0.73150E-03 325521.4 4687628.0 192.0 4.25 23.26 3.95 NO NORFK_01 0 0.59770E-03 319338.3 4682375.0 192.0 4.25 23.26 3.95 NO NORFK_02 0 0.59770E-03 319386.9 4682387.0 192.0 4.25 23.26 3.95 NO NORFK_03 0 0.59770E-03 319435.4 4682399.0 192.0 4.25 23.26 3.95 NO NORFK_04 0 0.59770E-03 319484.0 4682411.0 192.0 4.25 23.26 3.95 NO NORFK_05 0 0.59770E-03 319532.5 4682423.0 192.0 4.25 23.26 3.95 NO NORFK_06 0 0.59770E-03 319581.1 4682435.0 192.0 4.25 23.26 3.95 NO NORFK_07 0 0.59770E-03 319629.6 4682447.0 192.0 4.25 23.26 3.95 NO NORFK_08 0 0.59770E-03 319678.2 4682459.0 192.0 4.25 23.26 3.95 NO NORFK_09 0 0.59770E-03 319726.8 4682471.0 192.0 4.25 23.26 3.95 NO NORFK_10 0 0.59770E-03 319775.3 4682483.0 192.0 4.25 23.26 3.95 NO NORFK_11 0 0.59770E-03 319823.8 4682495.0 192.0 4.25 23.26 3.95 NO NORFK_12 0 0.59770E-03 319872.4 4682507.0 192.0 4.25 23.26 3.95 NO NORFK_13 0 0.59770E-03 319921.0 4682518.0 192.0 4.25 23.26 3.95 NO NORFK_14 0 0.59770E-03 319969.5 4682530.0 192.0 4.25 23.26 3.95 NO NORFK_15 0 0.59770E-03 320018.1 4682542.0 192.0 4.25 23.26 3.95 NO NORFK_16 0 0.59770E-03 320066.6 4682554.0 192.0 4.25 23.26 3.95 NO

NORFK_17 0 0.59770E-03 320115.2 4682566.0 192.0 4.25 23.26 3.95 NO NORFK_18 0 0.59770E-03 320163.8 4682578.0 192.0 4.25 23.26 3.95 NO NORFK_19 0 0.59770E-03 320212.3 4682590.0 192.0 4.25 23.26 3.95 NO NORFK_20 0 0.59770E-03 320260.8 4682602.0 192.0 4.25 23.26 3.95 NO NORFK_21 0 0.59770E-03 320309.4 4682614.0 192.0 4.25 23.26 3.95 NO NORFK_22 0 0.59770E-03 320358.0 4682626.0 192.0 4.25 23.26 3.95 NO NORFK_23 0 0.59770E-03 320406.5 4682638.0 192.0 4.25 23.26 3.95 NO NORFK_24 0 0.59770E-03 320455.1 4682650.0 192.0 4.25 23.26 3.95 NO NORFK_25 0 0.59770E-03 320503.6 4682662.0 192.0 4.25 23.26 3.95 NO NORFK_26 0 0.59770E-03 320552.2 4682674.0 192.0 4.25 23.26 3.95 NO NORFK_27 0 0.59770E-03 320600.7 4682686.0 192.0 4.25 23.26 3.95 NO NORFK_28 0 0.59770E-03 320649.3 4682698.0 192.0 4.25 23.26 3.95 NO NORFK_29 0 0.59770E-03 320697.8 4682709.0 192.0 4.25 23.26 3.95 NO NORFK_30 0 0.59770E-03 320746.4 4682721.0 192.0 4.25 23.26 3.95 NO NORFK_31 0 0.59770E-03 320794.9 4682733.0 192.0 4.25 23.26 3.95 NO *** VOLUME SOURCE DATA *** NUMBER EMISSION RATE BASE RELEASE INIT. INIT. URBAN EMISSION RATE SOURCE PART. (GRAMS/SEC) X Y ELEV. HEIGHT SY SZ SOURCE SCALAR VARY ID CATS. (METERS) (METERS) (METERS) (METERS) (METERS) (METERS) BY - - - - - - - - - - - - - - - - - - - - - - - - - - - - - - - - - - - - - - - - - - - - - - - - - - - - - - - - - - - - - NORFK_32 0 0.59770E-03 320843.5 4682745.0 192.0 4.25 23.26 3.95 NO NORFK_33 0 0.59770E-03 320892.1 4682757.0 192.0 4.25 23.26 3.95 NO NORFK_34 0 0.59770E-03 320940.6 4682769.0 192.0 4.25 23.26 3.95 NO NORFK_35 0 0.59770E-03 320989.2 4682781.0 192.0 4.25 23.26 3.95 NO NORFK_36 0 0.59770E-03 321037.7 4682793.0 192.0 4.25 23.26 3.95 NO NORFK_37 0 0.59770E-03 321086.3 4682805.0 192.0 4.25 23.26 3.95 NO NORFK_38 0 0.59770E-03 321134.8 4682817.0 192.0 4.25 23.26 3.95 NO NORFK_39 0 0.59770E-03 321183.4 4682829.0 192.0 4.25 23.26 3.95 NO NORFK_40 0 0.59770E-03 321231.9 4682841.0 192.0 4.25 23.26 3.95 NO NORFK_41 0 0.59770E-03 321280.5 4682853.0 192.0 4.25 23.26 3.95 NO NORFK_42 0 0.59770E-03 321329.1 4682865.0 192.0 4.25 23.26 3.95 NO NORFK_43 0 0.59770E-03 321377.6 4682877.0 192.0 4.25 23.26 3.95 NO NORFK_44 0 0.59770E-03 321426.2 4682888.0 192.0 4.25 23.26 3.95 NO CONRV_01 0 0.33760E-03 323622.3 4682108.0 192.0 4.25 23.26 3.95 NO CONRV_02 0 0.33760E-03 323608.6 4682060.0 192.0 4.25 23.26 3.95 NO CONRV_03 0 0.33760E-03 323594.9 4682012.0 192.0 4.25 23.26 3.95 NO CONRV_04 0 0.33760E-03 323581.2 4681964.0 192.0 4.25 23.26 3.95 NO CONRV_05 0 0.33760E-03 323567.5 4681916.0 192.0 4.25 23.26 3.95 NO CONRV_06 0 0.33760E-03 323553.8 4681868.0 192.0 4.25 23.26 3.95 NO CONRV_07 0 0.33760E-03 323540.1 4681820.0 192.0 4.25 23.26 3.95 NO CONRV_08 0 0.33760E-03 323526.4 4681772.0 192.0 4.25 23.26 3.95 NO CONRV_09 0 0.33760E-03 323512.7 4681724.0 192.0 4.25 23.26 3.95 NO CONRV_10 0 0.33760E-03 323498.9 4681675.0 192.0 4.25 23.26 3.95 NO CONRV_11 0 0.33760E-03 323485.3 4681627.0 192.0 4.25 23.26 3.95 NO CONRV_12 0 0.33760E-03 323471.5 4681579.0 192.0 4.25 23.26 3.95 NO CONRV_13 0 0.33760E-03 323457.8 4681531.0 192.0 4.25 23.26 3.95 NO CONRV_14 0 0.33760E-03 323444.1 4681483.0 192.0 4.25 23.26 3.95 NO CONRV_15 0 0.33760E-03 323430.4 4681435.0 192.0 4.25 23.26 3.95 NO CONRV_16 0 0.33760E-03 323416.7 4681387.0 192.0 4.25 23.26 3.95 NO CONRV_17 0 0.33760E-03 323403.0 4681339.0 192.0 4.25 23.26 3.95 NO CONRV_18 0 0.33760E-03 323389.3 4681291.0 192.0 4.25 23.26 3.95 NO CONRV_19 0 0.33760E-03 323375.6 4681243.0 192.0 4.25 23.26 3.95 NO CONRV_20 0 0.33760E-03 323361.9 4681195.0 192.0 4.25 23.26 3.95 NO CONRV_21 0 0.33760E-03 323348.2 4681147.0 192.0 4.25 23.26 3.95 NO CONRV_22 0 0.33760E-03 323334.5 4681098.0 192.0 4.25 23.26 3.95 NO CONRV_23 0 0.33760E-03 323320.8 4681050.0 192.0 4.25 23.26 3.95 NO CONRV_24 0 0.33760E-03 323307.0 4681002.0 192.0 4.25 23.26 3.95 NO CONRV_25 0 0.33760E-03 323293.3 4680954.0 192.0 4.25 23.26 3.95 NO CONRV_26 0 0.33760E-03 323279.6 4680906.0 192.0 4.25 23.26 3.95 NO DELRAY_1 0 0.62690E-03 325953.7 4683583.0 192.0 4.25 23.26 3.95 NO *** VOLUME SOURCE DATA *** NUMBER EMISSION RATE BASE RELEASE INIT. INIT. URBAN EMISSION RATE SOURCE PART. (GRAMS/SEC) X Y ELEV. HEIGHT SY SZ SOURCE SCALAR VARY ID CATS. (METERS) (METERS) (METERS) (METERS) (METERS) (METERS) BY - - - - - - - - - - - - - - - - - - - - - - - - - - - - - - - - - - - - - - - - - - - - - - - - - - - - - - - - - - - - - DELRAY_2 0 0.62690E-03 325931.9 4683538.0 192.0 4.25 23.26 3.95 NO DELRAY_3 0 0.62690E-03 325910.2 4683493.0 192.0 4.25 23.26 3.95 NO DELRAY_4 0 0.62690E-03 325888.4 4683448.0 192.0 4.25 23.26 3.95 NO DELRAY_5 0 0.62690E-03 325866.6 4683403.0 192.0 4.25 23.26 3.95 NO DELRAY_6 0 0.62690E-03 325844.8 4683358.0 192.0 4.25 23.26 3.95 NO DELRAY_7 0 0.62690E-03 325823.1 4683313.0 192.0 4.25 23.26 3.95 NO USSTL_01 0 0.23420E-02 323661.1 4679390.0 192.0 4.25 23.26 3.95 NO USSTL_02 0 0.23420E-02 323690.8 4679430.0 192.0 4.25 23.26 3.95 NO USSTL_03 0 0.23420E-02 323720.5 4679471.0 192.0 4.25 23.26 3.95 NO USSTL_04 0 0.23420E-02 323750.3 4679511.0 192.0 4.25 23.26 3.95 NO USSTL_05 0 0.23420E-02 323780.0 4679551.0 192.0 4.25 23.26 3.95 NO USSTL_06 0 0.23420E-02 323809.7 4679591.0 192.0 4.25 23.26 3.95 NO USSTL_07 0 0.23420E-02 323839.4 4679631.0 192.0 4.25 23.26 3.95 NO USSTL_08 0 0.23420E-02 323869.2 4679672.0 192.0 4.25 23.26 3.95 NO USSTL_09 0 0.23420E-02 325180.8 4681844.0 192.0 4.25 23.26 3.95 NO USSTL_10 0 0.23420E-02 325230.7 4681841.0 192.0 4.25 23.26 3.95 NO USSTL_11 0 0.23420E-02 325280.7 4681838.0 192.0 4.25 23.26 3.95 NO USSTL_12 0 0.23420E-02 325330.6 4681836.0 192.0 4.25 23.26 3.95 NO USSTL_13 0 0.23420E-02 325380.5 4681833.0 192.0 4.25 23.26 3.95 NO USSTL_14 0 0.23420E-02 325430.4 4681830.0 192.0 4.25 23.26 3.95 NO

USSTL_15 0 0.23420E-02 325480.3 4681827.0 192.0 4.25 23.26 3.95 NO GROUP ID SOURCE IDs ALL CSX_01 , CSX_02 , CSX_03 , CSX_04 , CSX_05 , CSX_06 , CSX_07 , CSX_08 , CSX_09 , CSX_10 , CSX_11 , CSX_12 , CSX_13 , CSX_14 , CSX_15 , CSX_16 , SEVER_01, SEVER_02, SEVER_03, SEVER_04, SEVER_05, SEVER_06, SEVER_07, SEVER_08, SEVER_09, SEVER_10, SEVER_11, SEVER_12, SEVER_13, SEVER_14, SEVER_15, CONLV_01, CONLV_02, CONLV_03, CONLV_04, CONLV_05, CONLV_06, CONLV_07, CONLV_08, CONLV_09, CONLV_10, CONLV_11, CONLV_12, CONLV_13, CONLV_14, CONLV_15, CONLV_16, CONLV_17, CONLV_18, NORFK_01, NORFK_02, NORFK_03, NORFK_04, NORFK_05, NORFK_06, NORFK_07, NORFK_08, NORFK_09, NORFK_10, NORFK_11, NORFK_12, NORFK_13, NORFK_14, NORFK_15, NORFK_16, NORFK_17, NORFK_18, NORFK_19, NORFK_20, NORFK_21, NORFK_22, NORFK_23, NORFK_24, NORFK_25, NORFK_26, NORFK_27, NORFK_28, NORFK_29, NORFK_30, NORFK_31, NORFK_32, NORFK_33, NORFK_34, NORFK_35, NORFK_36, NORFK_37, NORFK_38, NORFK_39, NORFK_40, NORFK_41, NORFK_42, NORFK_43, NORFK_44, CONRV_01, CONRV_02, CONRV_03, CONRV_04, CONRV_05, CONRV_06, CONRV_07, CONRV_08, CONRV_09, CONRV_10, CONRV_11, CONRV_12, CONRV_13, CONRV_14, CONRV_15, CONRV_16, CONRV_17, CONRV_18, CONRV_19, CONRV_20, CONRV_21, CONRV_22, CONRV_23, CONRV_24, CONRV_25, CONRV_26, DELRAY_1, DELRAY_2, DELRAY_3, DELRAY_4, DELRAY_5, DELRAY_6, DELRAY_7, USSTL_01, USSTL_02, USSTL_03, USSTL_04, USSTL_05, USSTL_06, USSTL_07, USSTL_08, USSTL_09, USSTL_10, USSTL_11, USSTL_12, USSTL_13, USSTL_14, USSTL_15, CSX CSX_01 , CSX_02 , CSX_03 , CSX_04 , CSX_05 , CSX_06 , CSX_07 , CSX_08 , CSX_09 , CSX_10 , CSX_11 , CSX_12 , CSX_13 , CSX_14 , CSX_15 , CSX_16 , SEVERSTA SEVER_01, SEVER_02, SEVER_03, SEVER_04, SEVER_05, SEVER_06, SEVER_07, SEVER_08, SEVER_09, SEVER_10, SEVER_11, SEVER_12, SEVER_13, SEVER_14, SEVER_15, CONLIVER CONLV_01, CONLV_02, CONLV_03, CONLV_04, CONLV_05, CONLV_06, CONLV_07, CONLV_08, CONLV_09, CONLV_10, CONLV_11, CONLV_12, CONLV_13, CONLV_14, CONLV_15, CONLV_16, CONLV_17, CONLV_18, NORFOLK NORFK_01, NORFK_02, NORFK_03, NORFK_04, NORFK_05, NORFK_06, NORFK_07, NORFK_08, NORFK_09, NORFK_10, NORFK_11, NORFK_12, NORFK_13, NORFK_14, NORFK_15, NORFK_16, NORFK_17, NORFK_18, NORFK_19, NORFK_20, NORFK_21, NORFK_22, NORFK_23, NORFK_24, SUMMARY OF MAXIMUM ANNUAL ( 1 YRS) RESULTS *** ALL 1ST HIGHEST VALUE IS 0.92564 AT ( 322805.00, 4685985.00 CSX 1ST HIGHEST VALUE IS 0.90488 AT ( 322805.00, 4685985.00 SEVERSTA 1ST HIGHEST VALUE IS 0.00449 AT ( 322805.00, 4685985.00 CONLIVER 1ST HIGHEST VALUE IS 0.00381 AT ( 322805.00, 4685985.00 NORFOLK 1ST HIGHEST VALUE IS 0.00598 AT ( 322805.00, 4685985.00 CONRIVER 1ST HIGHEST VALUE IS 0.00227 AT ( 322805.00, 4685985.00 DELRAY 1ST HIGHEST VALUE IS 0.00055 AT ( 322805.00, 4685985.00 USSTEEL 1ST HIGHEST VALUE IS 0.00486 AT ( 322805.00, 4685985.00

2005 AERMOD SUMMARY – SWHS MONITOR LOCATION RAILYARD REDUCTIONS
*** AERMOD - VERSION 07026 *** *** DEARBORN MONITOR IMPACTS *** 04/29/08 *** VOLUME SOURCE DATA *** NUMBER EMISSION RATE BASE RELEASE INIT. INIT. URBAN EMISSION RATE SOURCE PART. (GRAMS/SEC) X Y ELEV. HEIGHT SY SZ SOURCE SCALAR VARY ID CATS. (METERS) (METERS) (METERS) (METERS) (METERS) (METERS) BY - - - - - - - - - - - - - - - - - - - - - - - - - - - - - - - - - - - - - - - - - - - - - - - - - - - - - - - - - - - - - CSX_01 0 0.36060E-02 322524.0 4686057.0 192.0 4.25 23.26 3.95 NO CSX_02 0 0.36060E-02 322545.0 4686012.0 192.0 4.25 23.26 3.95 NO CSX_03 0 0.36060E-02 322566.0 4685966.0 192.0 4.25 23.26 3.95 NO CSX_04 0 0.36060E-02 322587.0 4685921.0 192.0 4.25 23.26 3.95 NO CSX_05 0 0.36060E-02 322607.9 4685876.0 192.0 4.25 23.26 3.95 NO CSX_06 0 0.36060E-02 322628.9 4685830.0 192.0 4.25 23.26 3.95 NO CSX_07 0 0.36060E-02 322649.9 4685785.0 192.0 4.25 23.26 3.95 NO CSX_08 0 0.36060E-02 322670.9 4685740.0 192.0 4.25 23.26 3.95 NO CSX_09 0 0.36060E-02 322691.9 4685694.0 192.0 4.25 23.26 3.95 NO CSX_10 0 0.36060E-02 322712.9 4685649.0 192.0 4.25 23.26 3.95 NO CSX_11 0 0.36060E-02 322733.9 4685603.0 192.0 4.25 23.26 3.95 NO CSX_12 0 0.36060E-02 322754.8 4685558.0 192.0 4.25 23.26 3.95 NO CSX_13 0 0.36060E-02 322775.8 4685513.0 192.0 4.25 23.26 3.95 NO CSX_14 0 0.36060E-02 322796.8 4685467.0 192.0 4.25 23.26 3.95 NO CSX_15 0 0.36060E-02 322817.8 4685422.0 192.0 4.25 23.26 3.95 NO CSX_16 0 0.36060E-02 322838.8 4685377.0 192.0 4.25 23.26 3.95 NO SEVER_01 0 0.29250E-03 321271.3 4686627.0 192.0 4.25 23.26 3.95 NO SEVER_02 0 0.29250E-03 321240.7 4686588.0 192.0 4.25 23.26 3.95 NO SEVER_03 0 0.29250E-03 321210.1 4686548.0 192.0 4.25 23.26 3.95 NO SEVER_04 0 0.29250E-03 321179.5 4686509.0 192.0 4.25 23.26 3.95 NO SEVER_05 0 0.29250E-03 321148.9 4686469.0 192.0 4.25 23.26 3.95 NO SEVER_06 0 0.29250E-03 321118.3 4686430.0 192.0 4.25 23.26 3.95 NO SEVER_07 0 0.29250E-03 321087.7 4686390.0 192.0 4.25 23.26 3.95 NO SEVER_08 0 0.29250E-03 321057.1 4686350.0 192.0 4.25 23.26 3.95 NO SEVER_09 0 0.29250E-03 321026.5 4686311.0 192.0 4.25 23.26 3.95 NO SEVER_10 0 0.29250E-03 320995.8 4686271.0 192.0 4.25 23.26 3.95 NO SEVER_11 0 0.29250E-03 320965.3 4686232.0 192.0 4.25 23.26 3.95 NO SEVER_12 0 0.29250E-03 320934.7 4686192.0 192.0 4.25 23.26 3.95 NO SEVER_13 0 0.29250E-03 320904.0 4686153.0 192.0 4.25 23.26 3.95 NO SEVER_14 0 0.29250E-03 320873.4 4686113.0 192.0 4.25 23.26 3.95 NO SEVER_15 0 0.29250E-03 320842.8 4686074.0 192.0 4.25 23.26 3.95 NO CONLV_01 0 0.73150E-03 324682.3 4687492.0 192.0 4.25 23.26 3.95 NO CONLV_02 0 0.73150E-03 324731.7 4687500.0 192.0 4.25 23.26 3.95 NO CONLV_03 0 0.73150E-03 324781.0 4687508.0 192.0 4.25 23.26 3.95 NO CONLV_04 0 0.73150E-03 324830.4 4687516.0 192.0 4.25 23.26 3.95 NO CONLV_05 0 0.73150E-03 324879.8 4687524.0 192.0 4.25 23.26 3.95 NO CONLV_06 0 0.73150E-03 324929.1 4687532.0 192.0 4.25 23.26 3.95 NO CONLV_07 0 0.73150E-03 324978.4 4687540.0 192.0 4.25 23.26 3.95 NO CONLV_08 0 0.73150E-03 325027.8 4687548.0 192.0 4.25 23.26 3.95 NO CONLV_09 0 0.73150E-03 325077.2 4687556.0 192.0 4.25 23.26 3.95 NO *** VOLUME SOURCE DATA *** NUMBER EMISSION RATE BASE RELEASE INIT. INIT. URBAN EMISSION RATE SOURCE PART. (GRAMS/SEC) X Y ELEV. HEIGHT SY SZ SOURCE SCALAR VARY ID CATS. (METERS) (METERS) (METERS) (METERS) (METERS) (METERS) BY - - - - - - - - - - - - - - - - - - - - - - - - - - - - - - - - - - - - - - - - - - - - - - - - - - - - - - - - - - - - - CONLV_10 0 0.73150E-03 325126.5 4687564.0 192.0 4.25 23.26 3.95 NO CONLV_11 0 0.73150E-03 325175.9 4687572.0 192.0 4.25 23.26 3.95 NO CONLV_12 0 0.73150E-03 325225.2 4687580.0 192.0 4.25 23.26 3.95 NO CONLV_13 0 0.73150E-03 325274.6 4687588.0 192.0 4.25 23.26 3.95 NO CONLV_14 0 0.73150E-03 325323.9 4687596.0 192.0 4.25 23.26 3.95 NO CONLV_15 0 0.73150E-03 325373.3 4687604.0 192.0 4.25 23.26 3.95 NO CONLV_16 0 0.73150E-03 325422.7 4687612.0 192.0 4.25 23.26 3.95 NO CONLV_17 0 0.73150E-03 325472.0 4687620.0 192.0 4.25 23.26 3.95 NO CONLV_18 0 0.73150E-03 325521.4 4687628.0 192.0 4.25 23.26 3.95 NO NORFK_01 0 0.59770E-03 319338.3 4682375.0 192.0 4.25 23.26 3.95 NO NORFK_02 0 0.59770E-03 319386.9 4682387.0 192.0 4.25 23.26 3.95 NO NORFK_03 0 0.59770E-03 319435.4 4682399.0 192.0 4.25 23.26 3.95 NO NORFK_04 0 0.59770E-03 319484.0 4682411.0 192.0 4.25 23.26 3.95 NO NORFK_05 0 0.59770E-03 319532.5 4682423.0 192.0 4.25 23.26 3.95 NO NORFK_06 0 0.59770E-03 319581.1 4682435.0 192.0 4.25 23.26 3.95 NO NORFK_07 0 0.59770E-03 319629.6 4682447.0 192.0 4.25 23.26 3.95 NO NORFK_08 0 0.59770E-03 319678.2 4682459.0 192.0 4.25 23.26 3.95 NO NORFK_09 0 0.59770E-03 319726.8 4682471.0 192.0 4.25 23.26 3.95 NO NORFK_10 0 0.59770E-03 319775.3 4682483.0 192.0 4.25 23.26 3.95 NO NORFK_11 0 0.59770E-03 319823.8 4682495.0 192.0 4.25 23.26 3.95 NO NORFK_12 0 0.59770E-03 319872.4 4682507.0 192.0 4.25 23.26 3.95 NO NORFK_13 0 0.59770E-03 319921.0 4682518.0 192.0 4.25 23.26 3.95 NO NORFK_14 0 0.59770E-03 319969.5 4682530.0 192.0 4.25 23.26 3.95 NO NORFK_15 0 0.59770E-03 320018.1 4682542.0 192.0 4.25 23.26 3.95 NO NORFK_16 0 0.59770E-03 320066.6 4682554.0 192.0 4.25 23.26 3.95 NO

NORFK_17 0 0.59770E-03 320115.2 4682566.0 192.0 4.25 23.26 3.95 NO NORFK_18 0 0.59770E-03 320163.8 4682578.0 192.0 4.25 23.26 3.95 NO NORFK_19 0 0.59770E-03 320212.3 4682590.0 192.0 4.25 23.26 3.95 NO NORFK_20 0 0.59770E-03 320260.8 4682602.0 192.0 4.25 23.26 3.95 NO NORFK_21 0 0.59770E-03 320309.4 4682614.0 192.0 4.25 23.26 3.95 NO NORFK_22 0 0.59770E-03 320358.0 4682626.0 192.0 4.25 23.26 3.95 NO NORFK_23 0 0.59770E-03 320406.5 4682638.0 192.0 4.25 23.26 3.95 NO NORFK_24 0 0.59770E-03 320455.1 4682650.0 192.0 4.25 23.26 3.95 NO NORFK_25 0 0.59770E-03 320503.6 4682662.0 192.0 4.25 23.26 3.95 NO NORFK_26 0 0.59770E-03 320552.2 4682674.0 192.0 4.25 23.26 3.95 NO NORFK_27 0 0.59770E-03 320600.7 4682686.0 192.0 4.25 23.26 3.95 NO NORFK_28 0 0.59770E-03 320649.3 4682698.0 192.0 4.25 23.26 3.95 NO NORFK_29 0 0.59770E-03 320697.8 4682709.0 192.0 4.25 23.26 3.95 NO NORFK_30 0 0.59770E-03 320746.4 4682721.0 192.0 4.25 23.26 3.95 NO NORFK_31 0 0.59770E-03 320794.9 4682733.0 192.0 4.25 23.26 3.95 NO *** VOLUME SOURCE DATA *** NUMBER EMISSION RATE BASE RELEASE INIT. INIT. URBAN EMISSION RATE SOURCE PART. (GRAMS/SEC) X Y ELEV. HEIGHT SY SZ SOURCE SCALAR VARY ID CATS. (METERS) (METERS) (METERS) (METERS) (METERS) (METERS) BY - - - - - - - - - - - - - - - - - - - - - - - - - - - - - - - - - - - - - - - - - - - - - - - - - - - - - - - - - - - - - NORFK_32 0 0.59770E-03 320843.5 4682745.0 192.0 4.25 23.26 3.95 NO NORFK_33 0 0.59770E-03 320892.1 4682757.0 192.0 4.25 23.26 3.95 NO NORFK_34 0 0.59770E-03 320940.6 4682769.0 192.0 4.25 23.26 3.95 NO NORFK_35 0 0.59770E-03 320989.2 4682781.0 192.0 4.25 23.26 3.95 NO NORFK_36 0 0.59770E-03 321037.7 4682793.0 192.0 4.25 23.26 3.95 NO NORFK_37 0 0.59770E-03 321086.3 4682805.0 192.0 4.25 23.26 3.95 NO NORFK_38 0 0.59770E-03 321134.8 4682817.0 192.0 4.25 23.26 3.95 NO NORFK_39 0 0.59770E-03 321183.4 4682829.0 192.0 4.25 23.26 3.95 NO NORFK_40 0 0.59770E-03 321231.9 4682841.0 192.0 4.25 23.26 3.95 NO NORFK_41 0 0.59770E-03 321280.5 4682853.0 192.0 4.25 23.26 3.95 NO NORFK_42 0 0.59770E-03 321329.1 4682865.0 192.0 4.25 23.26 3.95 NO NORFK_43 0 0.59770E-03 321377.6 4682877.0 192.0 4.25 23.26 3.95 NO NORFK_44 0 0.59770E-03 321426.2 4682888.0 192.0 4.25 23.26 3.95 NO CONRV_01 0 0.33760E-03 323622.3 4682108.0 192.0 4.25 23.26 3.95 NO CONRV_02 0 0.33760E-03 323608.6 4682060.0 192.0 4.25 23.26 3.95 NO CONRV_03 0 0.33760E-03 323594.9 4682012.0 192.0 4.25 23.26 3.95 NO CONRV_04 0 0.33760E-03 323581.2 4681964.0 192.0 4.25 23.26 3.95 NO CONRV_05 0 0.33760E-03 323567.5 4681916.0 192.0 4.25 23.26 3.95 NO CONRV_06 0 0.33760E-03 323553.8 4681868.0 192.0 4.25 23.26 3.95 NO CONRV_07 0 0.33760E-03 323540.1 4681820.0 192.0 4.25 23.26 3.95 NO CONRV_08 0 0.33760E-03 323526.4 4681772.0 192.0 4.25 23.26 3.95 NO CONRV_09 0 0.33760E-03 323512.7 4681724.0 192.0 4.25 23.26 3.95 NO CONRV_10 0 0.33760E-03 323498.9 4681675.0 192.0 4.25 23.26 3.95 NO CONRV_11 0 0.33760E-03 323485.3 4681627.0 192.0 4.25 23.26 3.95 NO CONRV_12 0 0.33760E-03 323471.5 4681579.0 192.0 4.25 23.26 3.95 NO CONRV_13 0 0.33760E-03 323457.8 4681531.0 192.0 4.25 23.26 3.95 NO CONRV_14 0 0.33760E-03 323444.1 4681483.0 192.0 4.25 23.26 3.95 NO CONRV_15 0 0.33760E-03 323430.4 4681435.0 192.0 4.25 23.26 3.95 NO CONRV_16 0 0.33760E-03 323416.7 4681387.0 192.0 4.25 23.26 3.95 NO CONRV_17 0 0.33760E-03 323403.0 4681339.0 192.0 4.25 23.26 3.95 NO CONRV_18 0 0.33760E-03 323389.3 4681291.0 192.0 4.25 23.26 3.95 NO CONRV_19 0 0.33760E-03 323375.6 4681243.0 192.0 4.25 23.26 3.95 NO CONRV_20 0 0.33760E-03 323361.9 4681195.0 192.0 4.25 23.26 3.95 NO CONRV_21 0 0.33760E-03 323348.2 4681147.0 192.0 4.25 23.26 3.95 NO CONRV_22 0 0.33760E-03 323334.5 4681098.0 192.0 4.25 23.26 3.95 NO CONRV_23 0 0.33760E-03 323320.8 4681050.0 192.0 4.25 23.26 3.95 NO CONRV_24 0 0.33760E-03 323307.0 4681002.0 192.0 4.25 23.26 3.95 NO CONRV_25 0 0.33760E-03 323293.3 4680954.0 192.0 4.25 23.26 3.95 NO CONRV_26 0 0.33760E-03 323279.6 4680906.0 192.0 4.25 23.26 3.95 NO DELRAY_1 0 0.62690E-03 325953.7 4683583.0 192.0 4.25 23.26 3.95 NO *** VOLUME SOURCE DATA *** NUMBER EMISSION RATE BASE RELEASE INIT. INIT. URBAN EMISSION RATE SOURCE PART. (GRAMS/SEC) X Y ELEV. HEIGHT SY SZ SOURCE SCALAR VARY ID CATS. (METERS) (METERS) (METERS) (METERS) (METERS) (METERS) BY - - - - - - - - - - - - - - - - - - - - - - - - - - - - - - - - - - - - - - - - - - - - - - - - - - - - - - - - - - - - - DELRAY_2 0 0.62690E-03 325931.9 4683538.0 192.0 4.25 23.26 3.95 NO DELRAY_3 0 0.62690E-03 325910.2 4683493.0 192.0 4.25 23.26 3.95 NO DELRAY_4 0 0.62690E-03 325888.4 4683448.0 192.0 4.25 23.26 3.95 NO DELRAY_5 0 0.62690E-03 325866.6 4683403.0 192.0 4.25 23.26 3.95 NO DELRAY_6 0 0.62690E-03 325844.8 4683358.0 192.0 4.25 23.26 3.95 NO DELRAY_7 0 0.62690E-03 325823.1 4683313.0 192.0 4.25 23.26 3.95 NO USSTL_01 0 0.23420E-02 323661.1 4679390.0 192.0 4.25 23.26 3.95 NO USSTL_02 0 0.23420E-02 323690.8 4679430.0 192.0 4.25 23.26 3.95 NO USSTL_03 0 0.23420E-02 323720.5 4679471.0 192.0 4.25 23.26 3.95 NO USSTL_04 0 0.23420E-02 323750.3 4679511.0 192.0 4.25 23.26 3.95 NO USSTL_05 0 0.23420E-02 323780.0 4679551.0 192.0 4.25 23.26 3.95 NO USSTL_06 0 0.23420E-02 323809.7 4679591.0 192.0 4.25 23.26 3.95 NO USSTL_07 0 0.23420E-02 323839.4 4679631.0 192.0 4.25 23.26 3.95 NO USSTL_08 0 0.23420E-02 323869.2 4679672.0 192.0 4.25 23.26 3.95 NO USSTL_09 0 0.23420E-02 325180.8 4681844.0 192.0 4.25 23.26 3.95 NO USSTL_10 0 0.23420E-02 325230.7 4681841.0 192.0 4.25 23.26 3.95 NO USSTL_11 0 0.23420E-02 325280.7 4681838.0 192.0 4.25 23.26 3.95 NO USSTL_12 0 0.23420E-02 325330.6 4681836.0 192.0 4.25 23.26 3.95 NO USSTL_13 0 0.23420E-02 325380.5 4681833.0 192.0 4.25 23.26 3.95 NO USSTL_14 0 0.23420E-02 325430.4 4681830.0 192.0 4.25 23.26 3.95 NO

USSTL_15 0 0.23420E-02 325480.3 4681827.0 192.0 4.25 23.26 3.95 NO GROUP ID SOURCE IDs ALL CSX_01 , CSX_02 , CSX_03 , CSX_04 , CSX_05 , CSX_06 , CSX_07 , CSX_08 , CSX_09 , CSX_10 , CSX_11 , CSX_12 , CSX_13 , CSX_14 , CSX_15 , CSX_16 , SEVER_01, SEVER_02, SEVER_03, SEVER_04, SEVER_05, SEVER_06, SEVER_07, SEVER_08, SEVER_09, SEVER_10, SEVER_11, SEVER_12, SEVER_13, SEVER_14, SEVER_15, CONLV_01, CONLV_02, CONLV_03, CONLV_04, CONLV_05, CONLV_06, CONLV_07, CONLV_08, CONLV_09, CONLV_10, CONLV_11, CONLV_12, CONLV_13, CONLV_14, CONLV_15, CONLV_16, CONLV_17, CONLV_18, NORFK_01, NORFK_02, NORFK_03, NORFK_04, NORFK_05, NORFK_06, NORFK_07, NORFK_08, NORFK_09, NORFK_10, NORFK_11, NORFK_12, NORFK_13, NORFK_14, NORFK_15, NORFK_16, NORFK_17, NORFK_18, NORFK_19, NORFK_20, NORFK_21, NORFK_22, NORFK_23, NORFK_24, NORFK_25, NORFK_26, NORFK_27, NORFK_28, NORFK_29, NORFK_30, NORFK_31, NORFK_32, NORFK_33, NORFK_34, NORFK_35, NORFK_36, NORFK_37, NORFK_38, NORFK_39, NORFK_40, NORFK_41, NORFK_42, NORFK_43, NORFK_44, CONRV_01, CONRV_02, CONRV_03, CONRV_04, CONRV_05, CONRV_06, CONRV_07, CONRV_08, CONRV_09, CONRV_10, CONRV_11, CONRV_12, CONRV_13, CONRV_14, CONRV_15, CONRV_16, CONRV_17, CONRV_18, CONRV_19, CONRV_20, CONRV_21, CONRV_22, CONRV_23, CONRV_24, CONRV_25, CONRV_26, DELRAY_1, DELRAY_2, DELRAY_3, DELRAY_4, DELRAY_5, DELRAY_6, DELRAY_7, USSTL_01, USSTL_02, USSTL_03, USSTL_04, USSTL_05, USSTL_06, USSTL_07, USSTL_08, USSTL_09, USSTL_10, USSTL_11, USSTL_12, USSTL_13, USSTL_14, USSTL_15, CSX CSX_01 , CSX_02 , CSX_03 , CSX_04 , CSX_05 , CSX_06 , CSX_07 , CSX_08 , CSX_09 , CSX_10 , CSX_11 , CSX_12 , CSX_13 , CSX_14 , CSX_15 , CSX_16 , SEVERSTA SEVER_01, SEVER_02, SEVER_03, SEVER_04, SEVER_05, SEVER_06, SEVER_07, SEVER_08, SEVER_09, SEVER_10, SEVER_11, SEVER_12, SEVER_13, SEVER_14, SEVER_15, CONLIVER CONLV_01, CONLV_02, CONLV_03, CONLV_04, CONLV_05, CONLV_06, CONLV_07, CONLV_08, CONLV_09, CONLV_10, CONLV_11, CONLV_12, CONLV_13, CONLV_14, CONLV_15, CONLV_16, CONLV_17, CONLV_18, NORFOLK NORFK_01, NORFK_02, NORFK_03, NORFK_04, NORFK_05, NORFK_06, NORFK_07, NORFK_08, NORFK_09, NORFK_10, NORFK_11, NORFK_12, NORFK_13, NORFK_14, NORFK_15, NORFK_16, NORFK_17, NORFK_18, NORFK_19, NORFK_20, NORFK_21, NORFK_22, NORFK_23, NORFK_24, SUMMARY OF MAXIMUM ANNUAL ( 1 YRS) RESULTS *** ALL 1ST HIGHEST VALUE IS 0.04822 AT ( 326344.00, 4685318.00 CSX 1ST HIGHEST VALUE IS 0.01734 AT ( 326344.00, 4685318.00 SEVERSTA 1ST HIGHEST VALUE IS 0.00076 AT ( 326344.00, 4685318.00 CONLIVER 1ST HIGHEST VALUE IS 0.00598 AT ( 326344.00, 4685318.00 NORFOLK 1ST HIGHEST VALUE IS 0.00248 AT ( 326344.00, 4685318.00 CONRIVER 1ST HIGHEST VALUE IS 0.00117 AT ( 326344.00, 4685318.00 DELRAY 1ST HIGHEST VALUE IS 0.00730 AT ( 326344.00, 4685318.00 USSTEEL 1ST HIGHEST VALUE IS 0.01331 AT ( 326344.00, 4685318.00

2005 AERMOD SUMMARY – WYANDOTTE MONITOR LOCATION
RAILYARD REDUCTIONS *** AERMOD - VERSION 07026 *** *** DEARBORN MONITOR IMPACTS *** 04/29/08 *** VOLUME SOURCE DATA *** NUMBER EMISSION RATE BASE RELEASE INIT. INIT. URBAN EMISSION RATE SOURCE PART. (GRAMS/SEC) X Y ELEV. HEIGHT SY SZ SOURCE SCALAR VARY ID CATS. (METERS) (METERS) (METERS) (METERS) (METERS) (METERS) BY - - - - - - - - - - - - - - - - - - - - - - - - - - - - - - - - - - - - - - - - - - - - - - - - - - - - - - - - - - - - - CSX_01 0 0.36060E-02 322524.0 4686057.0 192.0 4.25 23.26 3.95 NO CSX_02 0 0.36060E-02 322545.0 4686012.0 192.0 4.25 23.26 3.95 NO CSX_03 0 0.36060E-02 322566.0 4685966.0 192.0 4.25 23.26 3.95 NO CSX_04 0 0.36060E-02 322587.0 4685921.0 192.0 4.25 23.26 3.95 NO CSX_05 0 0.36060E-02 322607.9 4685876.0 192.0 4.25 23.26 3.95 NO CSX_06 0 0.36060E-02 322628.9 4685830.0 192.0 4.25 23.26 3.95 NO CSX_07 0 0.36060E-02 322649.9 4685785.0 192.0 4.25 23.26 3.95 NO CSX_08 0 0.36060E-02 322670.9 4685740.0 192.0 4.25 23.26 3.95 NO CSX_09 0 0.36060E-02 322691.9 4685694.0 192.0 4.25 23.26 3.95 NO CSX_10 0 0.36060E-02 322712.9 4685649.0 192.0 4.25 23.26 3.95 NO CSX_11 0 0.36060E-02 322733.9 4685603.0 192.0 4.25 23.26 3.95 NO CSX_12 0 0.36060E-02 322754.8 4685558.0 192.0 4.25 23.26 3.95 NO CSX_13 0 0.36060E-02 322775.8 4685513.0 192.0 4.25 23.26 3.95 NO CSX_14 0 0.36060E-02 322796.8 4685467.0 192.0 4.25 23.26 3.95 NO CSX_15 0 0.36060E-02 322817.8 4685422.0 192.0 4.25 23.26 3.95 NO CSX_16 0 0.36060E-02 322838.8 4685377.0 192.0 4.25 23.26 3.95 NO SEVER_01 0 0.29250E-03 321271.3 4686627.0 192.0 4.25 23.26 3.95 NO SEVER_02 0 0.29250E-03 321240.7 4686588.0 192.0 4.25 23.26 3.95 NO SEVER_03 0 0.29250E-03 321210.1 4686548.0 192.0 4.25 23.26 3.95 NO SEVER_04 0 0.29250E-03 321179.5 4686509.0 192.0 4.25 23.26 3.95 NO SEVER_05 0 0.29250E-03 321148.9 4686469.0 192.0 4.25 23.26 3.95 NO SEVER_06 0 0.29250E-03 321118.3 4686430.0 192.0 4.25 23.26 3.95 NO SEVER_07 0 0.29250E-03 321087.7 4686390.0 192.0 4.25 23.26 3.95 NO SEVER_08 0 0.29250E-03 321057.1 4686350.0 192.0 4.25 23.26 3.95 NO SEVER_09 0 0.29250E-03 321026.5 4686311.0 192.0 4.25 23.26 3.95 NO SEVER_10 0 0.29250E-03 320995.8 4686271.0 192.0 4.25 23.26 3.95 NO SEVER_11 0 0.29250E-03 320965.3 4686232.0 192.0 4.25 23.26 3.95 NO SEVER_12 0 0.29250E-03 320934.7 4686192.0 192.0 4.25 23.26 3.95 NO SEVER_13 0 0.29250E-03 320904.0 4686153.0 192.0 4.25 23.26 3.95 NO SEVER_14 0 0.29250E-03 320873.4 4686113.0 192.0 4.25 23.26 3.95 NO SEVER_15 0 0.29250E-03 320842.8 4686074.0 192.0 4.25 23.26 3.95 NO CONLV_01 0 0.73150E-03 324682.3 4687492.0 192.0 4.25 23.26 3.95 NO CONLV_02 0 0.73150E-03 324731.7 4687500.0 192.0 4.25 23.26 3.95 NO CONLV_03 0 0.73150E-03 324781.0 4687508.0 192.0 4.25 23.26 3.95 NO CONLV_04 0 0.73150E-03 324830.4 4687516.0 192.0 4.25 23.26 3.95 NO CONLV_05 0 0.73150E-03 324879.8 4687524.0 192.0 4.25 23.26 3.95 NO CONLV_06 0 0.73150E-03 324929.1 4687532.0 192.0 4.25 23.26 3.95 NO CONLV_07 0 0.73150E-03 324978.4 4687540.0 192.0 4.25 23.26 3.95 NO CONLV_08 0 0.73150E-03 325027.8 4687548.0 192.0 4.25 23.26 3.95 NO CONLV_09 0 0.73150E-03 325077.2 4687556.0 192.0 4.25 23.26 3.95 NO *** VOLUME SOURCE DATA *** NUMBER EMISSION RATE BASE RELEASE INIT. INIT. URBAN EMISSION RATE SOURCE PART. (GRAMS/SEC) X Y ELEV. HEIGHT SY SZ SOURCE SCALAR VARY ID CATS. (METERS) (METERS) (METERS) (METERS) (METERS) (METERS) BY - - - - - - - - - - - - - - - - - - - - - - - - - - - - - - - - - - - - - - - - - - - - - - - - - - - - - - - - - - - - - CONLV_10 0 0.73150E-03 325126.5 4687564.0 192.0 4.25 23.26 3.95 NO CONLV_11 0 0.73150E-03 325175.9 4687572.0 192.0 4.25 23.26 3.95 NO CONLV_12 0 0.73150E-03 325225.2 4687580.0 192.0 4.25 23.26 3.95 NO CONLV_13 0 0.73150E-03 325274.6 4687588.0 192.0 4.25 23.26 3.95 NO CONLV_14 0 0.73150E-03 325323.9 4687596.0 192.0 4.25 23.26 3.95 NO CONLV_15 0 0.73150E-03 325373.3 4687604.0 192.0 4.25 23.26 3.95 NO CONLV_16 0 0.73150E-03 325422.7 4687612.0 192.0 4.25 23.26 3.95 NO CONLV_17 0 0.73150E-03 325472.0 4687620.0 192.0 4.25 23.26 3.95 NO CONLV_18 0 0.73150E-03 325521.4 4687628.0 192.0 4.25 23.26 3.95 NO NORFK_01 0 0.59770E-03 319338.3 4682375.0 192.0 4.25 23.26 3.95 NO NORFK_02 0 0.59770E-03 319386.9 4682387.0 192.0 4.25 23.26 3.95 NO NORFK_03 0 0.59770E-03 319435.4 4682399.0 192.0 4.25 23.26 3.95 NO NORFK_04 0 0.59770E-03 319484.0 4682411.0 192.0 4.25 23.26 3.95 NO NORFK_05 0 0.59770E-03 319532.5 4682423.0 192.0 4.25 23.26 3.95 NO NORFK_06 0 0.59770E-03 319581.1 4682435.0 192.0 4.25 23.26 3.95 NO NORFK_07 0 0.59770E-03 319629.6 4682447.0 192.0 4.25 23.26 3.95 NO NORFK_08 0 0.59770E-03 319678.2 4682459.0 192.0 4.25 23.26 3.95 NO NORFK_09 0 0.59770E-03 319726.8 4682471.0 192.0 4.25 23.26 3.95 NO NORFK_10 0 0.59770E-03 319775.3 4682483.0 192.0 4.25 23.26 3.95 NO NORFK_11 0 0.59770E-03 319823.8 4682495.0 192.0 4.25 23.26 3.95 NO NORFK_12 0 0.59770E-03 319872.4 4682507.0 192.0 4.25 23.26 3.95 NO NORFK_13 0 0.59770E-03 319921.0 4682518.0 192.0 4.25 23.26 3.95 NO NORFK_14 0 0.59770E-03 319969.5 4682530.0 192.0 4.25 23.26 3.95 NO

NORFK_15 0 0.59770E-03 320018.1 4682542.0 192.0 4.25 23.26 3.95 NO NORFK_16 0 0.59770E-03 320066.6 4682554.0 192.0 4.25 23.26 3.95 NO NORFK_17 0 0.59770E-03 320115.2 4682566.0 192.0 4.25 23.26 3.95 NO NORFK_18 0 0.59770E-03 320163.8 4682578.0 192.0 4.25 23.26 3.95 NO NORFK_19 0 0.59770E-03 320212.3 4682590.0 192.0 4.25 23.26 3.95 NO NORFK_20 0 0.59770E-03 320260.8 4682602.0 192.0 4.25 23.26 3.95 NO NORFK_21 0 0.59770E-03 320309.4 4682614.0 192.0 4.25 23.26 3.95 NO NORFK_22 0 0.59770E-03 320358.0 4682626.0 192.0 4.25 23.26 3.95 NO NORFK_23 0 0.59770E-03 320406.5 4682638.0 192.0 4.25 23.26 3.95 NO NORFK_24 0 0.59770E-03 320455.1 4682650.0 192.0 4.25 23.26 3.95 NO NORFK_25 0 0.59770E-03 320503.6 4682662.0 192.0 4.25 23.26 3.95 NO NORFK_26 0 0.59770E-03 320552.2 4682674.0 192.0 4.25 23.26 3.95 NO NORFK_27 0 0.59770E-03 320600.7 4682686.0 192.0 4.25 23.26 3.95 NO NORFK_28 0 0.59770E-03 320649.3 4682698.0 192.0 4.25 23.26 3.95 NO NORFK_29 0 0.59770E-03 320697.8 4682709.0 192.0 4.25 23.26 3.95 NO NORFK_30 0 0.59770E-03 320746.4 4682721.0 192.0 4.25 23.26 3.95 NO NORFK_31 0 0.59770E-03 320794.9 4682733.0 192.0 4.25 23.26 3.95 NO *** VOLUME SOURCE DATA *** NUMBER EMISSION RATE BASE RELEASE INIT. INIT. URBAN EMISSION RATE SOURCE PART. (GRAMS/SEC) X Y ELEV. HEIGHT SY SZ SOURCE SCALAR VARY ID CATS. (METERS) (METERS) (METERS) (METERS) (METERS) (METERS) BY - - - - - - - - - - - - - - - - - - - - - - - - - - - - - - - - - - - - - - - - - - - - - - - - - - - - - - - - - - - - - NORFK_32 0 0.59770E-03 320843.5 4682745.0 192.0 4.25 23.26 3.95 NO NORFK_33 0 0.59770E-03 320892.1 4682757.0 192.0 4.25 23.26 3.95 NO NORFK_34 0 0.59770E-03 320940.6 4682769.0 192.0 4.25 23.26 3.95 NO NORFK_35 0 0.59770E-03 320989.2 4682781.0 192.0 4.25 23.26 3.95 NO NORFK_36 0 0.59770E-03 321037.7 4682793.0 192.0 4.25 23.26 3.95 NO NORFK_37 0 0.59770E-03 321086.3 4682805.0 192.0 4.25 23.26 3.95 NO NORFK_38 0 0.59770E-03 321134.8 4682817.0 192.0 4.25 23.26 3.95 NO NORFK_39 0 0.59770E-03 321183.4 4682829.0 192.0 4.25 23.26 3.95 NO NORFK_40 0 0.59770E-03 321231.9 4682841.0 192.0 4.25 23.26 3.95 NO NORFK_41 0 0.59770E-03 321280.5 4682853.0 192.0 4.25 23.26 3.95 NO NORFK_42 0 0.59770E-03 321329.1 4682865.0 192.0 4.25 23.26 3.95 NO NORFK_43 0 0.59770E-03 321377.6 4682877.0 192.0 4.25 23.26 3.95 NO NORFK_44 0 0.59770E-03 321426.2 4682888.0 192.0 4.25 23.26 3.95 NO CONRV_01 0 0.33760E-03 323622.3 4682108.0 192.0 4.25 23.26 3.95 NO CONRV_02 0 0.33760E-03 323608.6 4682060.0 192.0 4.25 23.26 3.95 NO CONRV_03 0 0.33760E-03 323594.9 4682012.0 192.0 4.25 23.26 3.95 NO CONRV_04 0 0.33760E-03 323581.2 4681964.0 192.0 4.25 23.26 3.95 NO CONRV_05 0 0.33760E-03 323567.5 4681916.0 192.0 4.25 23.26 3.95 NO CONRV_06 0 0.33760E-03 323553.8 4681868.0 192.0 4.25 23.26 3.95 NO CONRV_07 0 0.33760E-03 323540.1 4681820.0 192.0 4.25 23.26 3.95 NO CONRV_08 0 0.33760E-03 323526.4 4681772.0 192.0 4.25 23.26 3.95 NO CONRV_09 0 0.33760E-03 323512.7 4681724.0 192.0 4.25 23.26 3.95 NO CONRV_10 0 0.33760E-03 323498.9 4681675.0 192.0 4.25 23.26 3.95 NO CONRV_11 0 0.33760E-03 323485.3 4681627.0 192.0 4.25 23.26 3.95 NO CONRV_12 0 0.33760E-03 323471.5 4681579.0 192.0 4.25 23.26 3.95 NO CONRV_13 0 0.33760E-03 323457.8 4681531.0 192.0 4.25 23.26 3.95 NO CONRV_14 0 0.33760E-03 323444.1 4681483.0 192.0 4.25 23.26 3.95 NO CONRV_15 0 0.33760E-03 323430.4 4681435.0 192.0 4.25 23.26 3.95 NO CONRV_16 0 0.33760E-03 323416.7 4681387.0 192.0 4.25 23.26 3.95 NO CONRV_17 0 0.33760E-03 323403.0 4681339.0 192.0 4.25 23.26 3.95 NO CONRV_18 0 0.33760E-03 323389.3 4681291.0 192.0 4.25 23.26 3.95 NO CONRV_19 0 0.33760E-03 323375.6 4681243.0 192.0 4.25 23.26 3.95 NO CONRV_20 0 0.33760E-03 323361.9 4681195.0 192.0 4.25 23.26 3.95 NO CONRV_21 0 0.33760E-03 323348.2 4681147.0 192.0 4.25 23.26 3.95 NO CONRV_22 0 0.33760E-03 323334.5 4681098.0 192.0 4.25 23.26 3.95 NO CONRV_23 0 0.33760E-03 323320.8 4681050.0 192.0 4.25 23.26 3.95 NO CONRV_24 0 0.33760E-03 323307.0 4681002.0 192.0 4.25 23.26 3.95 NO CONRV_25 0 0.33760E-03 323293.3 4680954.0 192.0 4.25 23.26 3.95 NO CONRV_26 0 0.33760E-03 323279.6 4680906.0 192.0 4.25 23.26 3.95 NO DELRAY_1 0 0.62690E-03 325953.7 4683583.0 192.0 4.25 23.26 3.95 NO *** VOLUME SOURCE DATA *** NUMBER EMISSION RATE BASE RELEASE INIT. INIT. URBAN EMISSION RATE SOURCE PART. (GRAMS/SEC) X Y ELEV. HEIGHT SY SZ SOURCE SCALAR VARY ID CATS. (METERS) (METERS) (METERS) (METERS) (METERS) (METERS) BY - - - - - - - - - - - - - - - - - - - - - - - - - - - - - - - - - - - - - - - - - - - - - - - - - - - - - - - - - - - - - DELRAY_2 0 0.62690E-03 325931.9 4683538.0 192.0 4.25 23.26 3.95 NO DELRAY_3 0 0.62690E-03 325910.2 4683493.0 192.0 4.25 23.26 3.95 NO DELRAY_4 0 0.62690E-03 325888.4 4683448.0 192.0 4.25 23.26 3.95 NO DELRAY_5 0 0.62690E-03 325866.6 4683403.0 192.0 4.25 23.26 3.95 NO DELRAY_6 0 0.62690E-03 325844.8 4683358.0 192.0 4.25 23.26 3.95 NO DELRAY_7 0 0.62690E-03 325823.1 4683313.0 192.0 4.25 23.26 3.95 NO USSTL_01 0 0.23420E-02 323661.1 4679390.0 192.0 4.25 23.26 3.95 NO USSTL_02 0 0.23420E-02 323690.8 4679430.0 192.0 4.25 23.26 3.95 NO USSTL_03 0 0.23420E-02 323720.5 4679471.0 192.0 4.25 23.26 3.95 NO USSTL_04 0 0.23420E-02 323750.3 4679511.0 192.0 4.25 23.26 3.95 NO USSTL_05 0 0.23420E-02 323780.0 4679551.0 192.0 4.25 23.26 3.95 NO USSTL_06 0 0.23420E-02 323809.7 4679591.0 192.0 4.25 23.26 3.95 NO USSTL_07 0 0.23420E-02 323839.4 4679631.0 192.0 4.25 23.26 3.95 NO USSTL_08 0 0.23420E-02 323869.2 4679672.0 192.0 4.25 23.26 3.95 NO USSTL_09 0 0.23420E-02 325180.8 4681844.0 192.0 4.25 23.26 3.95 NO USSTL_10 0 0.23420E-02 325230.7 4681841.0 192.0 4.25 23.26 3.95 NO USSTL_11 0 0.23420E-02 325280.7 4681838.0 192.0 4.25 23.26 3.95 NO USSTL_12 0 0.23420E-02 325330.6 4681836.0 192.0 4.25 23.26 3.95 NO

USSTL_13 0 0.23420E-02 325380.5 4681833.0 192.0 4.25 23.26 3.95 NO USSTL_14 0 0.23420E-02 325430.4 4681830.0 192.0 4.25 23.26 3.95 NO USSTL_15 0 0.23420E-02 325480.3 4681827.0 192.0 4.25 23.26 3.95 NO GROUP ID SOURCE IDs ALL CSX_01 , CSX_02 , CSX_03 , CSX_04 , CSX_05 , CSX_06 , CSX_07 , CSX_08 , CSX_09 , CSX_10 , CSX_11 , CSX_12 , CSX_13 , CSX_14 , CSX_15 , CSX_16 , SEVER_01, SEVER_02, SEVER_03, SEVER_04, SEVER_05, SEVER_06, SEVER_07, SEVER_08, SEVER_09, SEVER_10, SEVER_11, SEVER_12, SEVER_13, SEVER_14, SEVER_15, CONLV_01, CONLV_02, CONLV_03, CONLV_04, CONLV_05, CONLV_06, CONLV_07, CONLV_08, CONLV_09, CONLV_10, CONLV_11, CONLV_12, CONLV_13, CONLV_14, CONLV_15, CONLV_16, CONLV_17, CONLV_18, NORFK_01, NORFK_02, NORFK_03, NORFK_04, NORFK_05, NORFK_06, NORFK_07, NORFK_08, NORFK_09, NORFK_10, NORFK_11, NORFK_12, NORFK_13, NORFK_14, NORFK_15, NORFK_16, NORFK_17, NORFK_18, NORFK_19, NORFK_20, NORFK_21, NORFK_22, NORFK_23, NORFK_24, NORFK_25, NORFK_26, NORFK_27, NORFK_28, NORFK_29, NORFK_30, NORFK_31, NORFK_32, NORFK_33, NORFK_34, NORFK_35, NORFK_36, NORFK_37, NORFK_38, NORFK_39, NORFK_40, NORFK_41, NORFK_42, NORFK_43, NORFK_44, CONRV_01, CONRV_02, CONRV_03, CONRV_04, CONRV_05, CONRV_06, CONRV_07, CONRV_08, CONRV_09, CONRV_10, CONRV_11, CONRV_12, CONRV_13, CONRV_14, CONRV_15, CONRV_16, CONRV_17, CONRV_18, CONRV_19, CONRV_20, CONRV_21, CONRV_22, CONRV_23, CONRV_24, CONRV_25, CONRV_26, DELRAY_1, DELRAY_2, DELRAY_3, DELRAY_4, DELRAY_5, DELRAY_6, DELRAY_7, USSTL_01, USSTL_02, USSTL_03, USSTL_04, USSTL_05, USSTL_06, USSTL_07, USSTL_08, USSTL_09, USSTL_10, USSTL_11, USSTL_12, USSTL_13, USSTL_14, USSTL_15, CSX CSX_01 , CSX_02 , CSX_03 , CSX_04 , CSX_05 , CSX_06 , CSX_07 , CSX_08 , CSX_09 , CSX_10 , CSX_11 , CSX_12 , CSX_13 , CSX_14 , CSX_15 , CSX_16 , SEVERSTA SEVER_01, SEVER_02, SEVER_03, SEVER_04, SEVER_05, SEVER_06, SEVER_07, SEVER_08, SEVER_09, SEVER_10, SEVER_11, SEVER_12, SEVER_13, SEVER_14, SEVER_15, CONLIVER CONLV_01, CONLV_02, CONLV_03, CONLV_04, CONLV_05, CONLV_06, CONLV_07, CONLV_08, CONLV_09, CONLV_10, CONLV_11, CONLV_12, CONLV_13, CONLV_14, CONLV_15, CONLV_16, CONLV_17, CONLV_18, NORFOLK NORFK_01, NORFK_02, NORFK_03, NORFK_04, NORFK_05, NORFK_06, NORFK_07, NORFK_08, NORFK_09, NORFK_10, NORFK_11, NORFK_12, NORFK_13, NORFK_14, NORFK_15, NORFK_16, NORFK_17, NORFK_18, NORFK_19, NORFK_20, NORFK_21, NORFK_22, NORFK_23, NORFK_24, SUMMARY OF MAXIMUM ANNUAL ( 1 YRS) RESULTS *** ALL 1ST HIGHEST VALUE IS 0.04822 AT ( 326344.00, 4685318.00 CSX 1ST HIGHEST VALUE IS 0.01734 AT ( 326344.00, 4685318.00 SEVERSTA 1ST HIGHEST VALUE IS 0.00076 AT ( 326344.00, 4685318.00 CONLIVER 1ST HIGHEST VALUE IS 0.00598 AT ( 326344.00, 4685318.00 NORFOLK 1ST HIGHEST VALUE IS 0.00248 AT ( 326344.00, 4685318.00 CONRIVER 1ST HIGHEST VALUE IS 0.00117 AT ( 326344.00, 4685318.00 DELRAY 1ST HIGHEST VALUE IS 0.00730 AT ( 326344.00, 4685318.00 USSTEEL 1ST HIGHEST VALUE IS 0.01331 AT ( 326344.00, 4685318.00

Appendix I
A CONCEPTUAL MODEL FOR AMBIENT FINE PARTICULATE
MATTER OVER SOUTHEAST MICHIGAN
HIGH CONCENTRATION DAYS
SUPPORT DOCUMENTATION
FOR THE
FINE PARTICULATE SIP
May 2008

PM2.5 High Concentration Days over Southeast Michigan
Washington University in St. Louis April 23, 2008 1
1 2 3
A CONCEPTUAL MODEL FOR AMBIENT FINE PARTICULATE 4 MATTER OVER SOUTHEAST MICHIGAN: 5
HIGH CONCENTRATION DAYS 6 7 8 9 10
Revision 0.2 (Draft Final Report) 11 April 23, 2008 12
13 14 15 16
Prepared by 17 Jay R. Turner 18
Washington University 19 Campus Box 1180, One Brookings Drive 20
St. Louis, MO 63130-4899 21 telephone: 314-935-5480 22 facsimile: 314-935-7211 23
email: JRTURNER @WUSTL.EDU 24 25 26 27 28
Prepared for 29 Southeast Michigan Council of Governments (SEMCOG) 30
535 Griswold Street, Suite 300 31 Detroit, MI 48226-3602 32 telephone: 313-961-4266 33 facsimile: 314-961-4869 34
email: [email protected] 35 36
37

PM2.5 High Concentration Days over Southeast Michigan
Washington University in St. Louis April 23, 2008 2
A CONCEPTUAL MODEL FOR AMBIENT FINE PARTICULATE MATTER 38 OVER SOUTHEAST MICHIGAN: HIGH CONCENTRATION DAYS 39
40 Revision 0.2 (Draft Final Report); April 23, 2008 41
42 Prepared by Jay R. Turner*, Washington University in St. Louis 43
Prepared for Southeast Michigan Council of Governments (SEMCOG) 44 45 46 EXECUTIVE SUMMARY 47 48 In 2006, the USEPA promulgated revisions to the National Ambient Air Quality Standard 49 (NAAQS) for particulate matter (PM) which tightened the 24-hour (daily) PM2.5 standard from 50 65 μg/m3 to 35 μg/m3. This revision profoundly increased the frequency of exceedance days 51 observed in Southeast Michigan with fourteen of the fifteen compliance monitors violating the 52 standard for the period 2004-2006. An understanding of the drivers for high PM2.5 days is 53 needed to support the development of effective controls strategies; this study seeks to provide 54 insights into such drivers. 55 56 At most sites in Southeast Michigan, exceedances occur predominantly – and in some cases 57 exclusively – on days when the entire network is exhibiting high PM. For thirteen of the fifteen 58 monitors, at least 85% of exceedances from 1999 to 2006 occurred on days when the entire 59 network was exhibiting high PM. Drivers for network-wide high PM are regional transport, poor 60 atmospheric ventilation across the network, or both of these conditions. Two monitors in 61 particular – Dearborn and Wyandotte – frequently had exceedances on days when the entire 62 network was not exhibiting high PM with 38% of the Dearborn exceedances and 27% of the 63 Wyandotte exceedances occurring on such days. On these days, these sites are significantly 64 influenced by nearby emission sources. Dearborn continues to be influenced by nearby emission 65 sources which drive exceedances (or near exceedances) on days when the network-wide base 66 concentration is as much as 15 μg/m3 below the standard, although the frequency of such days 67 appears to be decreasing. In contrast, at Wyandotte all of the days for which nearby emission 68 sources were disproportionately contributing to exceedances (or near exceedances) of the 69 standard were prior to 2004. At those sites not significantly impacted by plumes from nearby 70 emission sources, high PM days are most often observed when the area is experiencing a 71 multiday high PM episode. 72 73 Seasonal variations in surface winds can explain the seasonal differences in frequency of site-74 specific high PM days between sites in the greater Wayne County area. Sites such as Allen Park, 75 which are relatively free of impacts from nearby sources, exhibit similar seasonal behavior with 76 high PM days most frequent in the summer followed by the winter. The monthly distribution of 77 high PM days is distorted for sites with significant nearby emission sources since there is a 78 strong seasonality to the surface winds distributions. For example, Dearborn has as many high 79 PM days in the winter as in the summer, with the winter season having a stronger contribution 80 from nearby sources located to the southwest of the site. 81 * Campus Box 1180, Washington University, One Brookings Drive, St. Louis, MO 63130-4899. telephone: 314-935-5480, facsimile 314-935-7211, email JRTURNER @WUSTL.EDU

PM2.5 High Concentration Days over Southeast Michigan
Washington University in St. Louis April 23, 2008 3
82 Network-wide high PM days have disproportionately high contributions from the major ions 83 (sulfate, nitrate, and ammonium) compared to other days. Summertime events are dominated by 84 sulfate and wintertime events are dominated by ammonium nitrate. However these so-called 85 high nitrate days typically have ammonium sulfate concentrations that are at least 50% of the 86 ammonium nitrate concentration. The role of sulfate on such days should not be overlooked 87 when considering the impact of SO2-based regional control strategies. In general, network-wide 88 PM base concentrations above ~20 μg/m3 tend to be disproportionately influenced by major ion 89 contributions and are indicative of a disproportionately high influence from regional sources. 90 On network-wide high PM days the sulfate and nitrate concentrations are typically several times 91 higher than the corresponding monthly median concentrations. In contrast, EC is on average 92 only 1.3 times higher. This pattern suggests that network-wide high PM days are primarily 93 influenced by regional transport and are to a lesser extent influenced by increased levels of 94 urban-scale emissions arising from poor atmospheric ventilation. As previously stated, emission 95 sources near the monitoring sites can still exert significant plume impacts regardless of the 96 network-wide PM behavior driven by regional and urban-scale contributions. 97 98 Many network-wide high PM days coincide with high nitrate, and in some cases there is 99 substantial variability in PM mass concentration across the network on these days. It is 100 important to determine whether the variability is real or a measurement artifact, because these 101 days can influence the site-specific design values and in general can explain many of the 102 exceedingly high PM levels observed at certain sites that otherwise do not appear to be 103 disproportionately impacted by nearby local emission source plumes on high PM days. 104 105 A conceptual model for fine PM over central Southeast Michigan includes four elements. The 106 largest contributor to annual average PM is regionally transported material that is temporally 107 varying but spatially homogeneous over the domain (indeed, this defines the spatial extent of the 108 domain for the conceptual model which in this case excludes the distant sites such as Luna Pier 109 and Port Huron). On some days, regionally transported PM contributions can be sufficiently 110 high to cause exceedances of the daily standard when coupled with average contributions from 111 urban- and finer-scale emission sources and, in relatively rare cases, the regionally transported 112 PM alone can cause exceedances of the daily standard. Urban-scale emission sources (mobile, 113 area, and point sources) create a spatial PM gradient across central Southeast Michigan. For 114 winds from a fixed direction, these contributions create an “urban plume” with decreasing 115 impacts with increasing distance from the zone of highest emissions activity. The spatial 116 gradients can be clearly discerned when binning data from days with common wind patterns and 117 become smeared, to some extent, when averaging over periods with varying wind patterns. At 118 many sites (e.g., Linwood, East 7 Mile) a PM plume emanating from the Detroit commercial / 119 industrial zone, which is nominally Dearborn and areas to its southeast towards the Detroit River, 120 including Zug Island, can be distinguished from the aforementioned urban plume. At sites 121 further downwind, such as New Haven, these two plumes have essentially merged into a single 122 urban plume. Average impacts from these plumes depend on the monitoring site location 123 relative to the Detroit population and commercial/industrial core zones and the frequency that 124 winds from these zones transport the plumes to the monitoring site. Finally, certain monitors in 125 the Detroit commercial/industrial zone are significantly impacted by emissions from nearby 126 sources that ultimately contribute to the distant PM plume emanating from this zone. At 127

PM2.5 High Concentration Days over Southeast Michigan
Washington University in St. Louis April 23, 2008 4
Dearborn and Wyandotte these sources are located southwest of the monitoring sites and 128 historically have contributed to exceedances (or nears exceedances) of the daily standard. These 129 sources also disproportionately influence the annual standard because they are oriented upwind 130 of the sites for prevailing winds from the southwest. 131 132 The analyses presented in this report exploited the relatively high spatial and temporal PM2.5 133 FRM measurement density across Southeast Michigan. Each site provided added value to the 134 analysis. Future reductions in either spatial or temporal measurement density would likely affect 135 the ability to update this analysis towards tracking the accountability of emission control 136 programs. 137 138 In summary, emission controls that reduce regionally transported PM are needed to reduce the 139 frequency of violations of the 24-hour PM2.5 standard. Emission reductions from a few specific 140 point sources, especially near Dearborn, are also needed. While regional and point source 141 controls will decrease annual average PM2.5 concentrations for standardized synoptic weather 142 patterns, relatively small but significant decreases could also be realized by controls on other 143 urban emission sources such as mobile, area, and other point sources.144

PM2.5 High Concentration Days over Southeast Michigan
Washington University in St. Louis April 23, 2008 5
1. MOTIVATION 145 146 In 2006, the USEPA promulgated revisions to the National Ambient Air Quality Standard 147 (NAAQS) for particulate matter (PM) which tightened the 24-hour (daily) PM2.5 standard from 148 65 μg/m3 to 35 μg/m3. This revision profoundly increased the frequency of exceedance days 149 observed in Southeast Michigan. For fifteen monitors over the time period 1999-20061, there 150 were 7 and 179 exceedance days (days with one-or-monitors in the area with concentration 151 greater than or equal to 35 μg/m3) under the old and new standards, respectively. While none of 152 the monitors violated the old standard, for the period 2004-2006 fourteen of the fifteen monitors 153 violated the new standard. Only one of the eleven sites elsewhere in the state – Grand 154 Rapids – violated the standard for the 2004-2006. This behavior motivates the need for a refined 155 understanding of the drivers for high concentration days in Southeast Michigan. In particular, a 156 detailed description is needed of the emissions, meteorology and atmospheric processes that 157 modulate PM concentrations. This “conceptual model”, with explicit emphasis on understanding 158 PM2.5 high mass concentration days over the Southeast Michigan, could be utilized towards 159 developing effective control strategies. 160 161 The conceptual model presented in this document is focused on the information needed to 162 support the development and implementation of control strategies to meet the 24-hour PM2.5 163 NAAQS. It intentionally excludes a detailed treatment of annual average concentration patterns 164 and instead focuses on the subset of days exhibiting high concentrations. Figure 1-1 shows the 165 elements that go into the development of a conceptual model which is necessarily dynamic and 166 must be refined as new knowledge becomes available. Content and presentation of the 167 conceptual model for PM2.5 over Southeast Michigan loosely follows the framework used by 168 Vickery (2004) for nine North American geographic regions and as revisited by Allen and 169 Turner (2008). A conceptual model for PM2.5 over St. Louis was recently developed which 170 included the following elements: annual and seasonal levels of PM2.5 in relation to the mass-171 based standards; compositional analysis of PM2.5; meteorological influences; atmospheric 172 processes contributing to PM2.5; sources and source regions contributing to the principle 173 chemicals of concern; and implications to policy makers (Turner and Garlock, 2007). For this 174 study, the framework has been modified to accommodate the emphasis on those days with high 175 PM concentrations. 176 177 An assessment of the drivers for high concentration days, compared to annual average behavior, 178 is complicated by several factors. First, high concentration days are relatively infrequent and 179 thus there is limited data to probe. Second, while the standard defines a bright line for 180 exceedance days, the use of threshold concentration values to censor data can mask some of the 181 key features. The sensitivity of key findings to the operational definition of a high concentration 182 day is important and care has been taken in this study to ensure the results are resistant to the 183 selection of the threshold concentration. 184 185
1 Some of these monitors did not operate for the entire eight year period, and the monitors collect samples with frequency from every day to every sixth day.

PM2.5 High Concentration Days over Southeast Michigan
Washington University in St. Louis April 23, 2008 6
refinements as new knowledge emergesrefinements as new knowledge emerges
186 Figure 1-1. Development of a conceptual model (adapted from Vickery, 2004). 187
188 189 This conceptual model is grounded in an analysis of eight years of PM2.5 FRM mass 190 concentration data and allied data for particle speciation and meteorology. Nonetheless, it 191 should be treated as a living document, to be periodically updated as additional data becomes 192 available (in particular to capture temporal trends) and revised as more-detailed analysis is 193 performed on the existing data. 194 195

PM2.5 High Concentration Days over Southeast Michigan
Washington University in St. Louis April 23, 2008 7
2. APPROACH 196 197 Extensive monitoring and data analysis has been performed for Southeast Michigan. From a 198 regulatory context, most of the data analysis effort has focused on the annual-average NAAQS. 199 This work focuses on the drivers for exceedances of the daily (24-hour) NAAQS. This metric 200 presents certain challenges to the characterization effort. In contrast to the annual average 201 NAAQS, which requires an understanding of the average contribution of sources to observed 202 burdens, consideration of the daily standard must necessarily focus on a much smaller number of 203 days and with interest in the drivers of the concentrations specifically on those days. Many of 204 the data analysis tools, such as receptor modeling by positive matrix factorization (PMF), are 205 most powerful when considering the average behavior; estimates for high concentration days are 206 less reliable and indeed in many analyses extreme values are down-weighted to improve the 207 stability of the solution. Air quality surveillance is relatively sparse with sustained daily FRM 208 measurements at only one site (Allen Park); this provides a challenge to placing an observed 209 exceedance day in a temporal context. However, the Southeast Michigan FRM network is 210 relatively dense, and this greatly facilitated the ability to the analyses presented in this report. 211 Semicontinuous PM mass and composition measurements certainly provide considerable insight 212 and in the future their deployment should be very beneficial in refining our knowledge of high 213 concentration events. 214 215 A significant body of work has been assembled to characterize PM in Southeast Michigan with 216 most-recent emphasis on the annual average PM2.5 NAAQS. Indeed, efforts currently underway 217 to address the annual average standard are expected to improve the area’s status with regard to 218 the daily standard. However, additional measures might be needed to eliminate violations and 219 bring the area into attainment with the daily standard. Thus, the key findings from this analysis 220 are compared and contrasted with the Weight-of-Evidence (WOE) developed for the annual 221 standard to more fully understand the synergies between the drivers and control strategies. 222 223 Many questions can be raised towards characterizing an observed exceedance of the daily 224 standard. Was it driven by local emissions, regional transport, or both? Did it arise from an 225 exceptional event, such as a structural fire or unusual industrial emission, or was it the 226 conventional mix of emission sources with their contributions amplified by poor atmospheric 227 ventilation conditions such as a persistent stagnation? Exceptional events will be experienced 228 that cannot be explained with the typical types and levels of surveillance. For example, 229 documented exceptional events at the St. Louis – Midwest Supersite in East St. Louis, IL, 230 included nearby structural fires that in some cases were captured by the images from an on-site 231 camera and in other cases were visually observed by site operators. The ability to identify 232 exceptional events in the East St. Louis time series decreased as the site operations became 233 routine and staff spent less time at the site. It is possible the observed high concentrations are 234 more susceptible to measurement error (indeed, in some cases even result solely from 235 measurement error) and uncontrollable measurement bias. We will examine this issue in the 236 context of spatial variability in FRM values on high nitrate days. The Regional Haze Rule 237 construct of isolating the 20% worst days – whether visibility or mass concentration – is closer in 238 spirit to the information needed for examining drivers for high concentration days. However, in 239 its most-commonly applied form it is inadequate because the average behavior on the 20% worst 240 days might not represent the condition on an actual day if there are a variety of drivers for high 241

PM2.5 High Concentration Days over Southeast Michigan
Washington University in St. Louis April 23, 2008 8
concentration days. The separation of contributions emanating from different spatial scales 242 (e.g., regional-, urban-, and even finer local-scales) is particularly challenging and the data 243 analysis approaches adopted for this study have been customized to elucidate the contributions 244 from these scales to the extent practicable. In consideration of the above issues, it is apparent 245 that analyses to capture the drivers for high concentration days must focus on distributions of 246 behavior rather than average (central tendency) behavior. The data analysis methods reflect this 247 consideration. 248 249 There are many possible drivers for intraurban variability in PM2.5 mass, including the following 250 six factors: local sources of primary PM emissions; transient emission events; topographic 251 barriers that isolate subregions of the urban area; meteorological phenomena that vary on spatial 252 scales within the urban area; differences in behavior of semi-volatile components; and 253 measurement error (Pinto et al. 2004; Turner and Allen, 2008). While this analysis does not 254 definitively identify which of these factors are responsible for observed differences across the 255 network, it does reflect upon these factors to explain the observed differences. 256 257 Figure 2-1 shows a conceptualization of intraurban variability arising from PM emission sources 258 acting on various spatial scales. The air mass is transecting the domain with persistent surface 259 winds from the left. Panel (a) shows the emission sources where the regional-scale contributions 260 are assumed to be homogeneous across the domain (this assumption neglects interactions 261 between regionally transported material and urban area emissions, such as urban plume 262 processing of regionally-transported PM precursor gases). Urban-scale emissions from mobile 263 sources, area sources, and point sources distributed across the metro core contribute to an 264 increase in PM mass concentration (dashed line) which is skewed towards the downwind end of 265 the domain. Neighborhood- and finer-scale emissions create local hot spots which disperse 266 downwind and become part of the urban-scale contributions. The red line in panel (b) shows the 267 concentration profile that would be observed along the transect. Monitor locations will dictate 268 which features of the profile are captured. For example, panel (c) shows the location of five 269 monitors (the “network-wide baseline” will be discussed later in this report). Monitor A is 270 located upwind of the urban area and measures the regional contributions. However, a wind 271 reversal would render it downwind of the urban area and in this case it might be impacted by the 272 urban plume (such as monitor D). Monitor B is impacted by both a local plume and upwind 273 urban contributions. The plume would miss the site with a wind reversal. Monitor C is located 274 near the core of the urban area (from an urban-scale emissions perspective). For this scenario it 275 is not impacted by local plumes but measures the cumulative contributions from upwind sources, 276 including point sources in the urban area. A wind reversal, however, might render monitor C 277 impacted by a local plume. Monitor D is outside the urban area emissions zone but nonetheless 278 is impacted by the “urban plume” as it is advected downwind, while monitor E is far enough 279 downwind that the urban plume has dispersed to the extent that the urban PM mass contributions 280 cannot be distinguished from the underlying regional contributions. A wind reversal would 281 render monitors D and E upwind of the urban area. This spatial concentration field represents a 282 snapshot in time which becomes smeared for a 24-hour sample as winds shift during the day, and 283 becomes further smeared when averaging results over many days. It is also a 1-D representation 284 of a 2-D surface which adds complexity. That said, it does motivate the use of surface winds as 285 a discriminator for studying site-specific PM mass trends to place each monitor in an emissions 286 field context. 287

PM2.5 High Concentration Days over Southeast Michigan
Washington University in St. Louis April 23, 2008 9
conc.
surface winds regional-scale contributions
urban-scale contributions
metro core (emissions perspective) downwind distance
neighborhood- and finer-scale contributions (e.g., point sources)
conc.
surface winds regional-scale contributions
urban-scale contributions
metro core (emissions perspective) downwind distance
neighborhood- and finer-scale contributions (e.g., point sources)
conc.
surface winds
metro core (emissions perspective) downwind distance
network-wide baseline
AA BB CC DD EE
(a)
(b)
(c)
288 289 Figure 2-1. The influence of emissions acting on various spatial scales to observed concentrations at 290 monitoring sites. 291

PM2.5 High Concentration Days over Southeast Michigan
Washington University in St. Louis April 23, 2008 10
The report is structured as follows. Section 3 presents an overview of the monitoring network 292 and key descriptive statistics and trends, including but not limited to the regulatory metrics. 293 Section 4 examines the drivers for high concentration days by taking advantage of the relatively 294 dense compliance monitoring network and particle speciation data. Section 5 refines the 295 understanding of local emission source contributions by exploiting spatial and temporal 296 variability within the network. Key findings, policy-relevant implications and recommendations 297 for future work are summarized in Section 6. 298

PM2.5 High Concentration Days over Southeast Michigan
Washington University in St. Louis April 23, 2008 11
3. SOUTHEAST MICHIGAN PM2.5 FRM NETWORK AND CONCENTRATION 299 TRENDS 300 301 The PM2.5 FRM monitoring network used in this analysis is summarized in Figures 3-1 and 3-2 302 and Table 3-1. For the PM2.5 compliance monitoring period of 1999-2006, there were fifteen 303 PM2.5 FRM monitoring sites in Southeast Michigan; three sites had collocated PM2.5 FRM 304 samplers. All FRM monitoring sites in the Detroit-Warren-Flint CSA are included except Flint. 305 For the purpose of this report, the spatial zone of Wayne County with highest population density 306 (>10 persons/acre) shall be called the Detroit population core and the spatial zone which includes 307 the Detroit central business district and industrialized zones to the south through west (e.g., 308 Dearborn, Zug Island) shall be called the Detroit commercial/industrial core. This latter zone 309 roughly includes the area covered by the five tightly clustered monitors in Figures 3-1 and 3-2 310 (Dearborn, Southwest High School, FIA/Lafayette, Newberry, and Linwood). Greater Wayne 311 County sites shall refer to the monitoring sites located in Wayne County plus the Oak Park 312 monitor site which is just across the county line in Oakland County. 313 314 Daily measurements have been maintained at Allen Park through the eight year period; most 315 other sites operated on a 1-in-3 day schedule although some were cut back to 1-in-6 day in recent 316 years due to budget constraints. There were 2,782 days with valid data reported for one-or-more 317 sites (95.2% of days), with this high temporal data density driven by the daily sampling at Allen 318 Park. There were 14,044 sampling events (neglecting collocated measurements). The historical 319 compliance status of each site with respect to the 24-hour PM2.5 NAAQS is presented in 320 Table 3-2. Exceedances of the 24-hour standard were observed on 179 days which is 6.1% of 321 the days with one-or-more monitors reporting valid data. There were 546 total exceedances 322 which correspond to 3.9% of all sampling events. 323 324 This report reflects on the conditions and drivers for high PM2.5 mass concentration days 325 (hereafter called “high PM days”). We are interested in both the frequency and intensity 326 (magnitude) of high concentration days since both factors are important in establishing the 327 design value. Figure 3-3 shows the site-specific frequencies of high concentration days using 328 thresholds of 25, 30, and 35 μg/m3. Exceedances were observed on 2-8% of sample days with 329 5-14%, and 8-24% of sample days having concentrations above 30 μg/m3 and 25 μg/m3, 330 respectively. Dearborn exhibits the highest frequency of high concentration days, followed by 331 SW High School and Wyandotte. The remaining monitors in Greater Wayne County exhibit 332 similar behavior. The frequencies for FIA/Lafayette and Newberry sites might be impacted by 333 the relatively short sampling histories at these sites and caution should be used in comparing and 334 contrasting these sites to the rest of the network. Ann Arbor and New Haven exhibit the lowest 335 frequencies of high concentration days; they are 50-60 km from the Detroit commercial / 336 industrial core to the west and northeast, respectively. However, these two sites do not represent 337 the spatial extents of the SE Michigan network with Luna Pier ~70 km to the southwest and Port 338 Huron ~80 km to the northeast. 339 340 Figure 3-4 shows the frequency of PM2.5 high concentration days by month for Allen Park, 341 Dearborn, Southwest High School and New Haven (frequency plots for all sites are presented in 342 Figure A-1, Appendix A). The pattern for Allen Park is generally representative of those 343 Greater Wayne county sites with relatively modest impacts from nearby sources, as will be 344

PM2.5 High Concentration Days over Southeast Michigan
Washington University in St. Louis April 23, 2008 12
345 Figure 3-1. Southeast Michigan PM2.5 FRM monitoring sites superposed on county boundaries and 2000 346 census tracts. The red rectangle includes a portion of Wayne County. 347 348
349 Figure 3-2. Southeast Michigan PM2.5 FRM monitoring sites (excluding Luna Pier and Port Huron) 350 superposed on 2000 census tract level population density data. 351
Wayne County

PM2.5 High Concentration Days over Southeast Michigan
Washington University in St. Louis April 23, 2008 13
Table 3-1. Southeast Michigan PM2.5 monitoring network as of December 2006, including 352 exceedances days for the NAAQS daily PM2.5 standard of 35 μg/m3. 353
(A) (B) (C) (D) (E) (F) (G)
Site Name AIRS IDSampling
Dates
Maximum Sampling
FrequencyNumber of
Sampling Days
Number of Exceedance
DaysSpeciation Site
(Dates)? Allen Park 261630001 05/99-- daily 2497 92 12/00-Ann Arbor 261610005 06/99-12/05 1-in-3 day 714 13 noDearborn 261630033 02/99-- 1-in-3 day 879 67 05/02--E 7 Mile 261630019 04/00-- 1-in-3 day 724 29 12/00-04/02FIA/Lafayette 261630039 08/05-- 1-in-3 day 155 1 noLinwood 261630016 05/99-- daily 2273 102 noLivonia 261630025 08/99-- 1-in-3 day 777 28 noLuna Pier 261150005 12/99-- 1-in-3 day 804 28 05/02--New Haven 260990009 01/99-- 1-in-3 day 878 22 noNewberry 261630038 12/04-- 1-in-3 day 161 6 noOak Park 261250001 01/99-- 1-in-3 day 793 32 noPort Huron 261470005 01/99-- 1-in-3 day 841 32 noSW High Sch. 261630015 02/99-- 1-in-3 day 881 41 noWyandotte 261630036 02/99-- 1-in-3 day 838 35 noYpsilanti 261610008 08/99-- 1-in-3 day 829 18 06/03-- 354
355 356 357 discussed later in this report. High concentration days are most frequent in the summer months 358 followed by the winter months, while high concentration days are relatively infrequent in the 359 spring. Dearborn exhibits higher frequencies of high concentration days for all months with the 360 winter frequencies comparable to the summer frequencies. Southwest High School monthly 361 frequencies fall between Allen Park and Dearborn, while New Haven has relatively few high 362 concentration days but with the same overall pattern as Allen Park – highest frequencies in the 363 summer followed by the winter. 364 365 366 Table 3-2. Southeast Michigan PM2.5 monitoring network compliance status for the daily PM2.5 NAAQS 367 (POC = 1 samplers only). 368
Three-Year Averages of 98th PercentilesSite AIRS ID 1999 2000 2001 2002 2003 2004 2005 2006 99-01 00-02 01-03 02-04 03-05 04-06Allen Park 261630001 43.7 38.6 44.2 39.6 40.5 36.9 43.0 34.1 42 41 41 39 40 38Ann Arbor 261610005 38.2 33.1 38.5 31.3 33.3 28.4 39.1 37 34 34 31 34 34Dearborn 261630033 45.1 45.1 43.2 45.7 42.8 39.4 50.2 43.1 44 45 44 43 44 44E 7 Mile 261630019 --- 42.0 42.0 34.4 37.1 35.0 52.3 36.2 42 39 38 36 41 41FIA/Lafayette 261630039 --- --- --- --- --- --- 43.9 32.4 --- --- --- --- --- 38Linwood 261630016 44.5 40.3 40.9 42.7 46.2 38.3 51.8 36.9 42 41 43 42 45 42Livonia 261630025 38.4 35.9 44.7 32.7 38.1 32.2 40.2 30.4 40 38 39 34 37 34Luna Pier 261150005 18.1 37.2 39.2 42.7 34.7 35.0 49.3 32.6 32 40 39 37 40 39New Haven 260990009 31.9 33.2 42.0 35.6 31.8 31.9 41.5 34.4 36 37 36 33 35 36Newberry 261630038 --- --- --- --- --- 36.8 57.5 28.6 --- --- --- --- --- 41Oak Park 261250001 42.8 40.7 39.4 38.4 36.6 32.5 52.2 33.0 41 40 38 36 40 39Port Huron 261470005 44.5 33.1 40.5 35.3 37.2 32.2 47.6 37.9 39 36 38 35 39 39SW High Sch. 261630015 50.2 44.5 42.9 38.2 33.6 36.0 49.7 36.2 46 42 38 36 40 41Wyandotte 261630036 45.0 42.7 46.6 34.1 34.8 32.3 46.7 33.2 45 41 39 34 38 37Ypsilanti 261610008 40.6 30.3 39.7 30.9 38.8 31.5 52.1 31.3 37 34 36 34 41 38
Annual 98th Percentiles
369 370 371

PM2.5 High Concentration Days over Southeast Michigan
Washington University in St. Louis April 23, 2008 14
Alle
n P
ark
Ann
Arb
or
Dea
rbor
n
E 7
Mile
FIA
/Laf
ayet
te
Linw
ood
Livo
nia
Luna
Pie
r
New
Hav
en
New
berr
y
Oak
Par
k
Por
t Hur
on
SW
Hig
h S
ch.
Wya
ndot
te
Yps
ilant
iperc
enta
ge o
f tot
al s
ampl
ing
days
abo
ve th
reho
ld c
once
ntra
tion
0
5
10
15
20
25
30
> 35 ug/m3
> 30 ug/m3
> 25 ug/m3
1999-2006
372 (a) 373
Alle
n P
ark
Ann
Arb
or
Dea
rbor
n
E 7
Mile
FIA
/Laf
ayet
te
Linw
ood
Livo
nia
Luna
Pie
r
New
Hav
en
New
berr
y
Oak
Par
k
Por
t Hur
on
SW
Hig
h S
ch.
Wya
ndot
te
Yps
ilant
iperc
enta
ge o
f tot
al s
ampl
ing
days
abo
ve th
reho
ld c
once
ntra
tion
0
5
10
15
20
25
30
> 35 ug/m3
> 30 ug/m3
> 25 ug/m3
2004-2006
374 (b) 375
376 Figure 3-3. Site-specific frequency of total sampling days above the designated concentration for 377 periods: 1999-2006 (a); and 2004-2006 (b), 378

PM2.5 High Concentration Days over Southeast Michigan
Washington University in St. Louis April 23, 2008 15
Allen Park
fract
ion
of d
ays
grea
ter t
han
thre
shol
d
0.00
0.05
0.10
0.15
0.20 > 35 ug/m3
> 30 ug/m3
379 Dearborn
fract
ion
of d
ays
grea
ter t
han
thre
shol
d
0.00
0.05
0.10
0.15
0.20
380 Southwest High Sch.
fract
ion
of d
ays
grea
ter t
han
thre
shol
d
0.00
0.05
0.10
0.15
0.20
381 New Haven
Month1 2 3 4 5 6 7 8 9 10 11 12
fract
ion
of d
ays
grea
ter t
han
thre
shol
d
0.00
0.05
0.10
0.15
0.20
382 Figure 3-4. Distribution of PM2.5 high concentration days by month for Allen Park (top) and Dearborn 383 (second from top), Southwest High School (second from bottom), and New Haven (bottom), 1999-2006. 384 385

PM2.5 High Concentration Days over Southeast Michigan
Washington University in St. Louis April 23, 2008 16
Surface winds dictate the coupling between local emission sources and the monitoring sites. 386 The wind rose for hourly values from Detroit Metropolitan Wayne County Airport is shown in 387 Figure 3-5 for the period 1999-2006. Prevailing surface winds are from the southwest with 388 frequent winds also from the west. Winds from the east are relatively infrequent. Hourly surface 389 winds distributions exhibit a distinct seasonality (Figure 3-6) albeit with some degree of 390 year-to-year variation (Figure B-1, Appendix B). Fall and winter months are more advective 391 with a pronounced southwesterly component while spring and summer months have lighter 392 winds and less distinct prevailing features. Seasonal variations in surface winds can explain the 393 seasonal differences in frequency of high PM days between the Greater Wayne County sites. For 394 example, Dearborn has a disproportionately higher frequency of high PM days in the winter 395 compared to Allen Park. This is consistent with the increased frequency of surface winds from 396 the southwest during the winter and the location of nearby emission sources in this direction (and 397 indeed located between Dearborn and Allen Park). 398 399 400
401 Figure 3-5. Wind rose for non-calm hours, observations at Detroit Metropolitan Wayne County Airport 402 (DTW), 1999-2006. Calms (wind speeds less than 2 mph) were 11% of total hours. 403 404
NNE
NE
ENE
E
ESE
SE
SSES
SSW
SW
WSW
W
WNW
NW
NNWN
0% 5% 10% 15%
NNE
NE
ENE
E
ESE
SE
SSES
SSW
SW
WSW
W
WNW
NW
NNWN
0% 5% 10% 15%
NNE
NE
ENE
E
ESE
SE
SSES
SSW
SW
WSW
W
WNW
NW
NNWN
0% 5% 10% 15%
NNE
NE
ENE
E
ESE
SE
SSES
SSW
SW
WSW
W
WNW
NW
NNWN
0% 5% 10% 15%
Spring Summer Fall Winter
6% 10% 13% 12%
405 406 Figure 3-6. Seasonal wind roses for non-calm hours, observations at Detroit Metropolitan Wayne 407 County Airport (DTW), 1999-2006. Calms (wind speeds less than 2 mph) are listed to the lower-left of 408 each wind rose. The wind speed scales are shown in the legend for Figure 3-5. 409
>2 - 4>4 - 8>8 - 16>16
WS (mph)

PM2.5 High Concentration Days over Southeast Michigan
Washington University in St. Louis April 23, 2008 17
4. CLIMATOLOGY OF NETWORK-WIDE HIGH PM DAYS 410 411 As previously described, a high fine PM mass concentration day at a given site can arise from 412 regional contributions, local contributions, or a combination of these factors. The climatology of 413 network-wide high PM days was examined to understand the drivers for such days. Regionally 414 transported materials might be higher or atmospheric ventilation might be poorer. The extent to 415 which these drivers act synergistically is not clear. For example, a summertime high pressure 416 system advecting regionally transported PM might stall out over the area. However, the lower 417 winds speeds might be partially offset by a large mixing layer depth on such days. While we 418 cannot make definitive statements about such coupling, this section provides a perspective on 419 these issues. 420 421 Descriptive analyses, including but not limited to those summarized in the previous section, 422 demonstrate a high coherence in high PM days across the network. Thus, an exploratory 423 analysis was performed to determine the frequency and nature of network-wide high PM days. 424 A subset of sampling days with network-wide high PM mass concentrations was identified by 425 first identifying those days with at least ten of the twelve Southeast Michigan FRM monitor sites 426 reporting a valid PM2.5 FRM mass concentration value2; these days are called valid network 427 days. Subsequently, the valid network days were screened to include only those days with at 428 least 2/3 of the reporting monitors having a PM concentration greater than a threshold value 429 (e.g., 30 μg/m3); these days are called network-wide high PM days. Table 4-1 summarizes the 430 characteristics of the valid network days and network-wide high PM days data sets. For the 431 period 1999-2006 there were 727 sampling days with ten-or-more FRM monitor sites reporting 432 valid PM2.5 concentrations (valid network days). 41 of these days (5.6%) had at least 2/3 of the 433 monitors above 30 μg/m3 (network-wide high PM days) and all of these days had one-or-more 434 monitor exceedance. Exceedances were also observed at one-or-more monitors on 35 days 435 (5.1%) that were below the network-wide high PM threshold; these days likely have stronger 436 influences from nearby emission sources impacting one or at most two sites. Figure 4-1 shows 437 the distribution of network-wide high PM days by month. The days are concentrated in the 438 summer followed by the winter, with few days in the seasonal transition months of April, May, 439 and November. This pattern is insensitive to the concentration threshold used to define network-440 wide high PM days. 441 442
Table 4-1. Valid network days and network-wide high PM days by year. 443
Year Valid Network Days Network-Wide High PM Days1999 014 01 7%2000 084 04 5%2001 104 10 10%2002 101 04 4%2003 113 05 4%2004 117 05 4%2005 121 09 7%2006 073 03 4%total 727 41 6% 444
2 Ann Arbor, FIA/Lafayette and Newberry were excluded form this analysis due to their limited period of operation.

PM2.5 High Concentration Days over Southeast Michigan
Washington University in St. Louis April 23, 2008 18
Month1 2 3 4 5 6 7 8 9 10 11 12
# da
ys w
ith a
t lea
st 2
/3 m
onito
rs
abov
e st
ated
con
cent
ratio
n
0
2
4
6
8
10
12
14
16
> 35 ug/m3
> 30 ug/m3
> 25 ug/m3
445 Figure 4-1. Frequency of network-wide high PM days by month using three different thresholds for 446 defining a high PM day: ≥25; ≥30; and ≥35 μg/m3. 447 448 449 The relevance of this analysis to understanding drivers for exceedances of the 24-hour standard 450 is demonstrated in Table 4-2. Valid network days, as defined above, capture 27-92% of all 451 sampling days (column D). The capture is relatively low at sites with daily sampling (Allen 452 Park, Linwood) because ten-or-more monitors must report valid data for the day to be designated 453 a valid network day. However, the percentage of total exceedances that fall on a valid network 454 day (column E) is nearly identical to the percentage capture of all sampling days by valid 455 network days (column D) and we conclude that the subset of sampling days captured by valid 456 network days is representative of all sampling days. Having established the representativeness 457 of valid network days, we observed that at most sites exceedances occur predominantly – and in 458 some cases exclusively – on days when the entire network is exhibiting high PM (column F). For 459 example, 96% of the exceedances at Allen Park on valid network days occurred on days when 460 the entire network was exhibiting high PM. Assuming the valid network days are representative 461 of all sampling days at Allen Park, we would assign 88 of the 92 total observed exceedances to 462 days with network-wide high PM. Similarly, 100% of the exceedances at Ypsilanti on valid 463 network days occurred on days when the entire network was exhibiting high PM. Assuming the 464 valid network days are representative of all sampling days at Ypsilanti, we would assign all of 465 the 18 total observed exceedances to days with network-wide high PM.3 Dearborn represents the 466 other extreme of behavior with only 62% of exceedances occurring on network-wide high PM 467 days. In summary: (1) For nine of the fifteen monitors, more than 90% of the exceedances 468 occurred on days when the entire network was exhibiting high PM; (2) Four monitors in the core 469 region had a high frequency of exceedances on days when the entire network was not exhibiting 470 high PM (Dearborn – 38%, Wyandotte – 27%, East 7 Mile – 15%, Linwood – 13%); and (3) At 471 Luna Pier and Port Huron, which are located at the geographic extents of the Southeast Michigan 472 3 In contrast to Allen Park where only 25 of the 92 exceedances were captured by valid network days (27%), at Ypsilanti 16 of the 18 exceedances where captured by valid network days (89%) and the assertion that the valid network days are representative of all sampling days is not even necessary.

PM2.5 High Concentration Days over Southeast Michigan
Washington University in St. Louis April 23, 2008 19
Table 4-2. Site-specific exceedance trends on valid network days. 473
(A) (B) (C) (D) (E) (F)
Site NameNumber of Sampling
DaysNumber of
Exceedance Days
% Sampling Days on Valid Network
Days% Exceedances on Valid
Network Days
% Network Day Exceedances on Network-
Wide High PM DaysAllen Park 2497 92 27.2% 27.2% 96.0%Ann Arbor 714 13 82.9% 92.3% 100.0%Dearborn 879 67 77.1% 77.6% 61.5%E 7 Mile 724 29 92.1% 89.7% 84.6%FIA/Lafayette 155 1 68.4% 100.0% 100.0%Linwood 2273 102 29.5% 29.4% 86.7%Livonia 777 28 87.1% 89.3% 92.0%Luna Pier 804 28 82.8% 85.7% 87.5%New Haven 878 22 80.4% 86.4% 100.0%Newberry 161 6 71.4% 100.0% 100.0%Oak Park 793 32 82.0% 75.0% 91.7%Port Huron 841 32 81.8% 81.3% 88.5%SW High Sch. 881 41 78.4% 73.2% 93.3%Wyandotte 838 35 80.2% 85.7% 73.3%Ypsilanti 829 18 82.8% 88.9% 100.0% 474
475 476 region, 12-13% of the exceedances were on days when the entire network was not exhibiting 477 high PM. It is possible the construct of network-wide high PM days is less robust for these sites 478 since they might not always be bathed in the same regional air mass as the core region. 479 480 The threshold concentration used to define a network-wide high PM day does not itself capture 481 the network-wide baseline PM level on that day (it is merely the bright line used to identify the 482 days). Thus, for the purposes of this report a base concentration for each valid network day was 483 defined as the 5th lowest concentration value across the network. Since at least ten monitors 484 must have valid data for the day to be designated a valid network day, the 5th lowest 485 concentration is no higher than the median concentration and ensures the base concentration is 486 not significantly influenced by the monitors at the geographic extents (Luna Pier and Port Huron) 487 which might be bathed in different air masses on certain days, and removes the influence of 488 one-or-two anomalously low concentration values. The base concentration includes regionally 489 transported PM and some portion of the urban-scale contributions. Excess mass at a given site, 490 relative to the base concentration, can be negative for cases such as monitors A and E in 491 Figure 2-1c. 492 493 Figure 4-2 shows the network-wide maximum and second maximum concentrations as a 494 function of the base concentration for valid network days. The maximum concentration is often 495 much greater than the base concentration and on these days there is a large local excess at the 496 maximum concentration site. However, the second maximum concentration is typically within 497 5 μg/m3 of the base concentration and thus on a given day there is typically at most one site with 498 a large local excess, regardless of the base concentration. This behavior holds at both high and 499
7 Typically synoptic winds would be analyzed to identify days conducive to regional transport but sulfate and nitrate will be used as a surrogate for regional transport in this work since the sulfate at Allen Park is overwhelmingly from regional transport and the nitrate is dominated by regional transport.

PM2.5 High Concentration Days over Southeast Michigan
Washington University in St. Louis April 23, 2008 20
base concentration, ug/m3
0 10 20 30 40 50 60 70 80
max
imum
con
cent
ratio
n, u
g/m
3
0
10
20
30
40
50
60
70
80
(a)
base concentration, ug/m3
0 10 20 30 40 50 60 70 80
seco
nd m
axim
um c
once
ntra
tion,
ug/
m3
0
10
20
30
40
50
60
70
80
(b)
500 Figure 4-2. Network-wide maximum concentration (a) and second maximum concentration (b) for each 501 valid network day compared to the respective network-wide base concentration. The analysis excludes 502 three sites – Ann Arbor, Lafayette/FIA, and Newberry. The solid line is the base concentration (1:1 line) 503 and the dashed line is 5 μg/m3 above the base concentration. 504 505 low base concentrations; the extreme maximum values possibly arise from nitrate hot spots or 506 measurement artifacts as will be described later in this report. 507 508 Day- and site-specific concentrations are compared to the base concentrations in Figure 4-3 for 509 valid network days. Most sites had a few exceedances days with concentrations in large excess 510 of the base concentration. Assuming poor atmospheric ventilation affects the sites similarly and 511 thus contributes to the base concentration, the extreme excursions above the base concentrations 512 likely arose from nearby emission source plumes, exceptional events (including but not limited 513 to releases from the local emission sources) or measurement error including but not limited to a 514 possible nitrate artifact. With the exception of Dearborn and Wyandotte, most exceedances were 515 clustered about the base concentration. Dearborn and Wyandotte had exceedances on days with 516 base concentrations as low as 20 μg/m3 demonstrating significant excess above the base 517 concentration. 518 519 The analysis so far has primarily focused on the relative frequency of network-wide high PM 520 days and their associations with exceedances. Figure 4-4 captures the influence of the extreme 521 values observed at each site (Figure 4-3), showing the 5th highest maximum excess and the 522 median excess compared to the base concentration for exceedance days falling on valid network 523 days. Several sites have low excess for the 5th highest maximum (yellow bars), although this 524 metric is sensitive to sampling frequency. Most sites have median excess below 5 μg/m3. 525 Excluding Dearborn and Wyandotte, and pooling the site-specific highest three excess 526 concentrations across the remaining ten sites, 23 of the 30 values occurred on only three days – 527 3/1/2003, 2/3/2005 and 2/6/2005. On all three days the network exhibited high and variable 528 concentrations, and the latter two days were the highest nitrate at Allen Park over all valid 529 network days (no speciation data for 3/1/2003). Further inspection of network-wide behavior on 530

PM2.5 High Concentration Days over Southeast Michigan
Washington University in St. Louis April 23, 2008 21
base concentration, ug/m3
0 10 20 30 40 50 60 70 80
site
-spe
cific
con
cent
ratio
n, u
g/m
3
0
10
20
30
40
50
60
70
80
Allen Park
base concentration, ug/m3
0 10 20 30 40 50 60 70 80
site
-spe
cific
con
cent
ratio
n, u
g/m
3
0
10
20
30
40
50
60
70
80
Dearborn
531
base concentration, ug/m3
0 10 20 30 40 50 60 70 80
site
-spe
cific
con
cent
ratio
n, u
g/m
3
0
10
20
30
40
50
60
70
80
East 7 Mile
base concentration, ug/m3
0 10 20 30 40 50 60 70 80
site
-spe
cific
con
cent
ratio
n, u
g/m
3
0
10
20
30
40
50
60
70
80
Linwood
532
base concentration, ug/m3
0 10 20 30 40 50 60 70 80
site
-spe
cific
con
cent
ratio
n, u
g/m
3
0
10
20
30
40
50
60
70
80
Livonia
base concentration, ug/m3
0 10 20 30 40 50 60 70 80
site
-spe
cific
con
cent
ratio
n, u
g/m
3
0
10
20
30
40
50
60
70
80
Luna Pier
533 534 Figure 4-3. Site-specific concentrations versus base concentrations for valid network days. Solid line is 535 the base concentration (1:1 line) and dashed line is 35 μg/m3. 536

PM2.5 High Concentration Days over Southeast Michigan
Washington University in St. Louis April 23, 2008 22
base concentration, ug/m3
0 10 20 30 40 50 60 70 80
site
-spe
cific
con
cent
ratio
n, u
g/m
3
0
10
20
30
40
50
60
70
80
New Haven
base concentration, ug/m3
0 10 20 30 40 50 60 70 80
site
-spe
cific
con
cent
ratio
n, u
g/m
3
0
10
20
30
40
50
60
70
80
Oak Park
537
base concentration, ug/m3
0 10 20 30 40 50 60 70 80
site
-spe
cific
con
cent
ratio
n, u
g/m
3
0
10
20
30
40
50
60
70
80
Port Huron
base concentration, ug/m3
0 10 20 30 40 50 60 70 80
site
-spe
cific
con
cent
ratio
n, u
g/m
3
0
10
20
30
40
50
60
70
80
SW High Sch.
538
base concentration, ug/m3
0 10 20 30 40 50 60 70 80
site
-spe
cific
con
cent
ratio
n, u
g/m
3
0
10
20
30
40
50
60
70
80
Wyandotte
base concentration, ug/m3
0 10 20 30 40 50 60 70 80
site
-spe
cific
con
cent
ratio
n, u
g/m
3
0
10
20
30
40
50
60
70
80
Ypsilanti
539 540 Figure 4-3 (continued). Site-specific concentrations versus base concentrations for valid network days. 541 Solid line is the base concentration (1:1 line) and dashed line is 35 μg/m3. 542

PM2.5 High Concentration Days over Southeast Michigan
Washington University in St. Louis April 23, 2008 23
0
5
10
15
20
Allen P
ark
Dearbo
rn
E 7 Mile
Linwoo
d
Livon
ia
Luna
Pier
New H
aven
Oak P
ark
Port H
uron
SW H
igh S
ch.
Wyand
otte
Ypsila
nti
site
con
c. in
exc
ess
of n
etw
ork-
wid
e ba
se c
onc.
, ug/
m3
5th max
50th percentile
543 Figure 4-4. Site-specific exceedance days: 5th-highest excess concentration compared to base 544 concentration (yellow); and 50th-precentile excess concentration compared to base concentration (green). 545
546 high nitrate days shows the spatial variability can range from nearly homogeneous to quite 547 heterogeneous (such as the above noted days). It is likely that nitrate is driving the variability on 548 such days and is responsible for many of the outlier mass concentrations at high base 549 concentrations in Figure 4-3. There are at least two possible explanations for this behavior. 550 First, there might be nitrate hot spots on high nitrate days. These hot spots are most likely to 551 occur on days with a liquid aerosol due to high humidity. A qualitative inspection of surface 552 weather on high nitrate days suggests they often coincide with fog events. The aerosol state 553 (liquid versus dry), and degree of water content if wet, might vary across the network due to 554 micrometeorology and this could influence nitrate uptake. Spatial variations in crustal material 555 could also influence the pH of the liquid aerosol which in turn influences nitrate uptake. Second, 556 there might be varying nitrate measurement artifact on certain high nitrate days. Even if the 557 ambient nitrate concentration is spatially homogeneous, perhaps the Teflon filters are retaining 558 nitrate to varying degrees and this artificially induces a spatial variability in both nitrate in FRM 559 mass. A better understanding of the drivers for high spatial variability in FRM mass on high 560 nitrate days is needed since only a few such events can dramatically affect the site-specific 561 design values for the 24-hour standard. When such patterns are observed, perhaps the Teflon 562 filters could be analyzed for nitrate by IC to determine the extent of nitrate retention; this would 563 be particularly insightful for days coinciding with speciation sampler operation. 564 565 Figure 4-5 shows the same data as Figure 4-3 for Dearborn and Wyandotte but stratified to 566 isolate the period 2004-2006 (the most-recent three-year period for the data set used in this 567 study). Focusing on those days with base concentration below 35 μg/m3 (to the left of the 568 vertical solid line) but with site-specific concentrations approaching or greater than 35 μg/m3 569

PM2.5 High Concentration Days over Southeast Michigan
Washington University in St. Louis April 23, 2008 24
base concentration, ug/m3
0 10 20 30 40 50 60 70 80
site
-spe
cific
con
cent
ratio
n, u
g/m
3
0
10
20
30
40
50
60
70
80
Dearborn(a)
base concentration, ug/m3
0 10 20 30 40 50 60 70 80
site
-spe
cific
con
cent
ratio
n, u
g/m
3
0
10
20
30
40
50
60
70
80
Wyandotte(b)
570 571 Figure 4-5. Site-specific concentrations versus base concentrations for valid network days at Dearborn 572 (a) and Wyandotte (b) stratified by year: 1999-2003 (red markers); and 2004-2006 (green markers). Solid 573 diagonal line is the base concentration (1:1 line), and the solid vertical line and dashed horizontal line are 574 35 μg/m3. 575 576 577 (above the dashed horizontal line), these days correspond to cases where nearby local emission 578 sources are likely significant contributors to an exceedance (or near exceedance) that otherwise 579 would not occur. For Dearborn (Figure 4-4a), there has been a decrease in frequency of such 580 local plume days but they are certainly still present for the 2004-2006 period. For Wyandotte 581 (Figure 4-4b), however, virtually all of the days with local source plumes driving an exceedance 582 (or near exceedance) of the standard were prior to 2004. For the most recent data (2004-2006), 583 Wyandotte does not appear to be disproportionately influenced by local plumes on exceedance 584 (or near exceedance) days. Again, these figures do not represent all sample days but rather the 585 subset of days with ten-or-more reporting monitors such that network-wide behavior could be 586 characterized; however, as previously demonstrated, this subset of days does appear to be 587 representative of the overall data set. 588 589 The analysis presented to this point clearly demonstrates that exceedances at most sites 590 correspond to days when the entire network is exhibiting high PM concentrations and the rare 591 extreme values are likely due to exceptional events or possibly a nitrate hot spot or measurement 592 artifact. Some sites, especially Dearborn and Wyandotte, have a significant excess superposed 593 on the base concentration leading to exceedances when the base concentration is as low as 594 20 μg/m3. It would be helpful to determine whether the day-to-day variability in the base 595 concentration is driven by regional transport, poor atmospheric ventilation of urban-scale 596 emissions, or a combination of these factors. There is no direct methodology to partition these 597 influences but insights can be obtained by examining the PM speciation data and surface winds 598

PM2.5 High Concentration Days over Southeast Michigan
Washington University in St. Louis April 23, 2008 25
FRM mass concentration, ug/m3
0 10 20 30 40 50 60 70
tota
l ion
con
cent
ratio
n, u
g/m
3
0
10
20
30
40
50
60
70
December - AprilMay - November
599 Figure 4-6. Total major ion concentration (sulfate, nitrate and ammonium) versus FRM mass at Allen 600 Park, stratified by season. 601 602 603 distributions.7 Figure 4-6 shows the contribution of major ions (sulfate, nitrate, and ammonium) 604 to FRM mass at Allen Park for the period December 2002 through December 2006. There were 605 valid FRM and speciation data for 21 of the 71 exceedances observed at Allen Park during this 606 time period. Six (29%) of these 21 exceedances days exhibited major ion concentrations greater 607 than 35 μg/m3 and thus the major ions alone were sufficient to cause the exceedance.8 Over all 608 21 exceedance days the major ion contribution was 56-112% of the standard (median 84%) and 609 53-85% of the FRM PM2.5 mass concentration (median 71%). At Allen Park the major ions are 610 more than half of the PM on all exceedance days and, since Allen Park is representative of the 611 network-wide base concentration (Figure 4-3), the major ions are deemed the dominant PM 612 component at all sites with small local plume impacts. 613 614 Aerosol composition at Allen Park was examined in more detail for the network-wide high PM 615 days. Speciation data was available for 31 of the 41 days. Figure 4-7 is a scattergram for sulfate 616 and nitrate on these days with all sulfate assumed to be ammonium sulfate and all nitrate 617 assumed to be ammonium nitrate. Summertime events typically exhibit high sulfate and 618 relatively low nitrate. Wintertime events exhibit high nitrate but sulfate is typically ~50% or 619 more of the nitrate concentration. Thus, while the wintertime events are often called high nitrate 620 days, it should be noted that sulfate is also quite significant on these days. Overall, 55% of these 621
8 This assumes nitrate does not appreciably volatile from the FRM Teflon filter; in practice, the major ion concentration will be lower due to nitrate volatilization.

PM2.5 High Concentration Days over Southeast Michigan
Washington University in St. Louis April 23, 2008 26
0
5
10
15
20
25
30
35
40
0 10 20 30 40
sulfate as ammonium sulfate, μg/m3
nitra
te a
s am
mon
ium
nitr
ate
,μg/
m3
May-NovemberDecember-April 1:1
2:1
1:2
622 Figure 4-7. Ammonium nitrate and ammonium sulfate concentrations at Allen Park on network-wide 623 high PM days. 624 625 626 31 days have a combined ammonium sulfate plus ammonium nitrate concentration exceeding 627 25 μg/m3 although, as previously mentioned, the contribution of these ions will be less on certain 628 days after correcting for ammonium nitrate loss from the FRM Teflon filters. 629 630 Previous work has demonstrated that sulfate at Allen Park is overwhelmingly from regional 631 transport; nitrate is likely dominated by regional transport but the precise split between regional 632 and local sources remains unknown. Assuming the sulfate and nitrate are regionally transported, 633 the total contribution from regional sources would likely be larger than the sum of the major ions 634 (after correction for nitrate loss), but cannot be further quantified because organic matter likely 635 has significant regional and local contributions and at this time the organic matter concentrations 636 in Southeast Michigan cannot be apportioned to regional and local contributions on an average 637 basis, no less a day-to-day basis. A multivariable linear regression was performed to explain the 638 observed organic carbon (OC) in terms of observed sulfate and elemental carbon (EC). The 639 unconstrained regression yielded (R2 = 0.50, all units in μg/m3); 640 641
ECSOOC )26.049.2()029.0176.0()22.053.1( 4 ±+±+±= 642 643 where the 95% confidence interval for each regression parameter is reported. There are many 644 caveats to this very simple approach to apportioning the OC. For example OC associated with 645 sulfate would likely vary by season due to differences in secondary formation rates. The 646 approach is merely intended as a crude way to assign OC to a component that associates with 647

PM2.5 High Concentration Days over Southeast Michigan
Washington University in St. Louis April 23, 2008 27
local, primary emissions (OC associating with EC) and a component that scales with sulfate. 648 The results should not be over-interpreted. Assuming an OM/OC ratio of 1.8, the scaling factor 649 for organic matter associated with sulfate would be 0.32×SO4. Figure 4-8 shows the 650 contribution of major ions measured at Allen Park to the base concentration on valid network 651 days (Figure 4-8a) and the contribution of the major ions plus this crude estimate of the OM 652 associated with sulfate (Figure 4-8b). The inclusion of associated OM substantially closes the 653 mass balance on the base concentration. High base concentrations can largely be explained by 654 regionally transported material alone and any concomitant increase in urban- and finer-scale 655 contributions (for example, due to poorer atmospheric ventilation) might be relatively modest. 656 From Figure 4-8a it can also be discerned that the major ion contribution deviates positively from 657 the median contribution at base concentrations above ~ 20 μg/m3; it is above this value that 658 major ions – and thus presumably regional transport – disproportionately influences the 659 observed PM2.5 mass concentrations. 660 661 Concentration enhancements in surrogates for regional transport (sulfate and nitrate as 662 surrogates) and urban-scale local emissions (EC as surrogate) were examined for the 663 network-wide high PM days. For each valid network day with speciation data at Allen Park, 664 concentrations for the major aerosol components were compared to the monthly median values 665 obtained by pooling over all valid network days and over all years. Sulfate was on average 666 4.5 times higher and nitrate was on average 2.8 times higher on network-wide high concentration 667 days compared to the corresponding monthly median value. In contrast, EC was on average only 668 1.3 times higher on network-wide high concentration days compared to the corresponding 669 monthly median EC concentration.9 Using the EC enhancement as an indicator for the 670 atmospheric ventilation of urban-sale emissions, this analysis suggests reduced atmospheric 671 ventilation on network-wide high PM days does indeed increase the urban- and-finer scale 672 contributions but, in the absence of direct plume hits from near-field sources, the enhancement is 673 much smaller than observed for the major ions which are associated with regional transport. OC 674 was on average 1.6 times higher on network-wide high PM days compared respective monthly 675 median concentration (1.8 times higher if the OC data is blank-corrected). This enhancement is 676 between the values ascribed to regionally transported material and urban-scale emissions, 677 consistent with OC contributions from a combination of local (urban or finer-scale) primary 678 sources and secondary formation (whether local or regional in origin). 679 680 Lastly, the daily FRM sampling at Allen Park is exploited to determine whether high PM days at 681 each site correspond to a spatially- and temporally- isolated excursion (high PM not observed at 682 Allen Park which, as shown in Figure 4-3, largely captures the network-wide PM base 683 concentration), a temporally-isolated excursion (high PM also observed at Allen Park on that day 684 but not the preceding or following day), or a multiday PM episode (high PM observed at Allen 685 Park on adjacent days). Multiday PM episodes are stratified into two groups – two successive 686 high PM days at Allen Park, and three-or-more successive high PM days at Allen Park. Two 687 successive high PM days could arise from a brief event that straddles midnight, while 688 three-or-more more successive high PM days clearly indicate an episode with temporal 689 persistence, whether caused by regional transport or sustained areawide air mass stagnations. 690 9 EC has a day-of-week trend at Allen Park (higher on weekdays) so the analysis was repeated by first stratifying days as weekends and weekdays and then calculating the day-specific enhancement compared to the respective weekend or weekday monthly median value. The same average enhancement – a factor of 1.3 – was obtained.

PM2.5 High Concentration Days over Southeast Michigan
Washington University in St. Louis April 23, 2008 28
High PM conditions were defined as >30 μg/m3 for the interrogated site and >25 μg/m3 for the 691 reference site (Allen Park). Figure 4-9 shows the site-specific distributions. Dearborn has the 692 highest frequency of spatially- and temporally-isolated high PM days (red bars; dates for all sites 693 listed in Appendix C). As previously described, nearby emission sources are most important at 694 this site and can drive high PM days even when the network-wide base concentration is as low as 695 20 μg/m3. Relatively high frequencies of spatially- and temporally-isolated high PM days were 696 also observed at Wyandotte, Southwest High School, and East 7 Mile. At all sites except 697 Dearborn, high PM days most frequently correspond to multiday PM episodes (blue plus green 698 bars) and most frequently to longer-persistence episodes (three- or-more days with high PM at 699 Allen Park). 700 701 In summary – 702
• Network-wide high PM days are observed primarily in the summertime but are also 703 observed in the wintertime. 704
• Network-wide high PM days in the summer typically have high sulfate and relatively low 705 ambient nitrate. The nitrate contributions to FRM mass will be even lower after 706 accounting from ammonium nitrate volatilization from the Teflon filter. 707
• Network-wide high PM days in the winter typically have high nitrate but ammonium 708 sulfate is typically at least 50% of the ammonium nitrate mass so these events are 709 actually high nitrate and high sulfate. 710
• Network-wide high PM days are primarily driven by regional transport with 711 intensification of urban-scale emissions due to low atmospheric ventilation being 712 relatively less important. Plume impacts from nearby emission sources are superposed 713 on the network-wide baseline. 714
• Site-specific high PM days are most often observed when the area is experiencing a 715 multiday high PM episode. 716

PM2.5 High Concentration Days over Southeast Michigan
Washington University in St. Louis April 23, 2008 29
0
10
20
30
40
50
60
70
0 10 20 30 40 50 60 70
FRM mass, ug/m3
tota
l ion
con
cent
ratio
n, u
g/m
3
all valid network daysnetwork-wide high PM day
1:1
median mass fraction
717 (a) 718
0
10
20
30
40
50
60
70
0 10 20 30 40 50 60 70
FRM mass, ug/m3
tota
l ion
con
cent
ratio
n pl
us a
ssoc
iate
d O
M, u
g/m
3 all valid network daysnetwork-wide high PM day
1:1
median mass fraction
719 (b) 720
721 Figure 4-8. Allen Park species contributions to the base concentration on valid network days: major ions 722 only (a); and major ions plus associated organic matter (b). 723

PM2.5 High Concentration Days over Southeast Michigan
Washington University in St. Louis April 23, 2008 30
724 725
Dea
rbor
n
Eas
t 7 M
ile
Linw
ood
Livo
nia
Luna
Pie
r
New
Hav
en
Oak
Par
k
Por
t Hur
on
Sou
thw
est H
S
Wya
ndot
te
Yps
ilant
i
fract
ion
in s
tate
d ca
tego
ry
0.0
0.2
0.4
0.6
0.8
1.0
AP < 25 ug/m3 on same dayAP > 25 ug/m3 on same day onlyAP > 25 ug/m3 on two consecutive daysAP > 25 ug/m3on three-or-more consecutive days
726 Figure 4-9. Classification of high PM days (PM2.5 > 30 μg/m3) at each site in Southeast Michigan by the 727 time series behavior of daily PM2.5 at Allen Park. 728 729 730
731

PM2.5 High Concentration Days over Southeast Michigan
Washington University in St. Louis April 23, 2008 31
5. RELATIONSHIPS BETWEEN SITE-SPECIFIC EXCESS MASS AND SURFACE 732 WINDS 733 734 The previous section demonstrates that exceedances of the 24-hour PM2.5 NAAQS at most sites 735 in Southeast Michigan are primarily driven by an enhancement of regionally transported material 736 which elevates the concentration baseline upon which local contributions are superposed. There 737 is typically a modest enhancement in the urban-scale contributions on high PM days, presumably 738 due to coincident air mass stagnations. This does not imply that urban-scale contributions are 739 small, but rather they are not significantly modulated on high PM days. At a few sites, plumes 740 from nearby emission sources can substantially contribute to exceedances and near exceedances. 741 742 This section presents relationships between the excess mass (relative a reference concentration 743 that should capture regional- and larger-scale influences, and to some extent urban-scale 744 influences) and surface winds for each site. This analysis does not focus on excess mass 745 observed on high PM days exclusively, but rather excess mass over the entire concentration 746 distribution. While in principle there might be different local sources contributing on high PM 747 days compared to all other days, the previous analyses do not provide any evidence for such 748 preferential behavior and there is much statistical power to be gained from using the entire data 749 set. Allen Park was initially chosen as a reference site for generating the times series of excess 750 mass. Figure 4-3 demonstrates that Allen Park is indeed highly correlated with the network-wide 751 base concentration on most days, although it is modestly influenced by nearby emissions for 752 winds from the northeast (Dearborn) (Wade et al. 2008). Thus, the calculated excess mass 753 concentrations at other sites might be biased low for winds from the northeast and sources in this 754 direction might be damped or even missed. This limitation does not significantly affect the 755 results for other bearings. Certain analyses were repeated using the network-wide base 756 concentration as the reference for calculating excess mass. This reduces the number of sample 757 days used in the analyses but removes any issues with directional bias introduced by using a 758 single site as the reference. Finally, this methodology also relies on having representative 759 surface winds at the site. It is not clear that hourly winds from Detroit Metropolitan Wayne 760 County Airport will be representative for sites such as Luna Pier and Port Huron; however, the 761 excess mass construct using Allen Park or the entire Southeast Michigan network to define a 762 base concentration is perhaps an equally limiting factor when examining these distant sites. 763 764 Relationships between excess mass and surface winds were probed using Conditional Probability 765 Function (CPF) and 1-D Nonparametric Wind Regression (NWR) plots. A brief summary of the 766 methods and their utility is presented in Appendix D. The stability of CPF and NWR results 767 was examined in various ways. Many analyses were run with the entire data set (1999-2006) and 768 the most recent three years (2004-2006) since greatest interest is in current conditions. The 769 former includes substantially more data and is less susceptible to spurious results. The threshold 770 for high excess mass in the CPF analysis was chosen as the top quartile and each analysis was 771 repeated using the top decile. Finally, sensitivity to days with high excess mass at the reference 772 site (Allen Park) was examined by running most of the analyses on the full data set and then 773 repeating the analyses with the data censored to exclude days where the excess mass was less 774 than -2 μg/m3. This threshold is based on two times the propagated collocated precision for the 775 concentration difference using a collocated precision of 0.7 μg/m3for a single measurement. 776 Since the excess mass concentration is a 24-hour integrated parameter but the surface winds data 777

PM2.5 High Concentration Days over Southeast Michigan
Washington University in St. Louis April 23, 2008 32
are hourly, care must be taken in handling calm hours. Calms days (operationally defined as 778 six-or-more calm hours in the day) were retained but calm hours (wind speeds less than 2 mph) 779 were removed.11 780 781 Figure 5-1 shows the CPF analysis results for each site using the top decile of the excess mass 782 distribution as the threshold for a high concentration and for the period 1999-2006. Plots for 783 Luna Pier, New Haven and Oak Park are excluded because they were either sensitive to the 784 methodology or indistinguishable from the CPF plot for the absolute mass concentration at the 785 site. The plots were nearly identical when using 1999-2006 data and 2004-2006 data only, 786 which means the bearings of sources driving the excess mass have not changed over time. 787 Dearborn, Newberry, and Wyandotte CPF plots all implicate sources to the southwest. These are 788 likely nearby sources and, recalling that the prevailing wintertime surface winds are from the 789 southwest (Figures 3-4 and 3-5) it is not surprising that the analyses in Section 4 implicated local 790 sources as significant contributors to the excess mass at these sites given the favorable wind 791 directions for advecting emissions from the sources to these sites. East 7 Mile, Linwood, and 792 Southwest High School CPF plots exhibit higher frequency of excess mass with winds from the 793 south/southwest, albeit weaker signatures than observed for Dearborn / Newberry / Wyandotte. 794 Ann Arbor and Ypsilanti have a higher frequency of high excess mass when the winds are from 795 the east and Livonia has a higher frequency of high excess mass when the winds are from the 796 southeast. All three of these cases correspond to bearings in the direction of the Detroit 797 population and/or commercial/industrial cores. However, surface winds from the east are not 798 common and thus these sites are rarely downwind of the urban core zones. The CPF plot for 799 Port Huron implicates sources at bearings east through south of the site which is consistent with 800 the industrial zones along the U.S./Canada border including but not limited to petroleum 801 refineries. In summary, the CPF plots are consistent with the local source impacts identified in 802 Section 4 and consistent with known emission source regions. It appears this analysis can pick 803 up the urban plume advected from Detroit to sites that are outside the urban emissions zone. 804 805 NWR plots show the expected excess concentration as a function of wind direction. Several 806 analyses were performed using Allen Park data for the reference concentrations (see footnote 807 #11). Subsequently, NWR plots were constructed using the network-wide base concentration 808 estimates for the reference concentrations and those results, which were generally consistent with 809 the results that were obtained using Allen Park as a reference, are presented here. Yearly box 810 plots were generated for the excess PM2.5 mass at each site compared to the network-wide base 811 concentration. FRM data for 2007 was also included in these time series plots but have not been 812 examined in sufficient detail for incorporation into wind regression analyses. Given the seasonal 813 and year-to-year variability in surface winds, the representativeness of valid network days was 814 assessed by comparing to the annual surface winds for all days. Figure B-2 shows annual wind 815 roses for all days and valid network days. 816 11 The following analyses were performed with results available upon request: CPF for top quartile of absolute concentration distribution (no subtraction of Allen Park concentration values), 1999-2006; CPF for top decile of entire excess mass distribution, 1999-2006; CPF for top quartile of entire excess mass distribution, 1999-2006; CPF for top quartile of censored excess mass distribution, 1999-2006; CPF for top decile of entire excess mass distribution, 2004-2006; CPF for top quartile of entire excess mass distribution, 2004-2006; NWR for entire excess mass distribution, 1999-2006; NWR for entire excess mass distribution, 2004-2006; and NWR for censored excess mass distribution, 1999-2006.

PM2.5 High Concentration Days over Southeast Michigan
Washington University in St. Louis April 23, 2008 33
0
45
90
135
180
225
270
315
15
30
60
75
105
120
150
165195
210
240
255
285
300
330
345
0 0.1 0.2 0.3 0.4
Ann Arbor
0
45
90
135
180
225
270
315
15
30
60
75
105
120
150
165195
210
240
255
285
300
330
345
0 0.1 0.2 0.3 0.4
Dearborn
0
45
90
135
180
225
270
315
15
30
60
75
105
120
150
165195
210
240
255
285
300
330
345
0 0.1 0.2 0.3 0.4
E 7 Mile
0
45
90
135
180
225
270
315
15
30
60
75
105
120
150
165195
210
240
255
285
300
330
345
0 0.1 0.2 0.3 0.4
FIA/Lafayette
0
45
90
135
180
225
270
315
15
30
60
75
105
120
150
165195
210
240
255
285
300
330
345
0 0.1 0.2 0.3 0.4
Linwood
0
45
90
135
180
225
270
315
15
30
60
75
105
120
150
165195
210
240
255
285
300
330
345
0 0.1 0.2 0.3 0.4
Livonia
Newberry0
45
90
135
180
225
270
315
15
30
60
75
105
120
150
165195
210
240
255
285
300
330
345
0 0.1 0.2 0.3 0.4
Port Huron0
45
90
135
180
225
270
315
15
30
60
75
105
120
150
165195
210
240
255
285
300
330
345
0 0.1 0.2 0.3 0.4
SW High Sch.0
45
90
135
180
225
270
315
15
30
60
75
105
120
150
165195
210
240
255
285
300
330
345
0 0.1 0.2 0.3 0.4
817 Wyandotte
0
45
90
135
180
225
270
315
15
30
60
75
105
120
150
165195
210
240
255
285
300
330
345
0 0.1 0.2 0.3 0.4
Ypsilanti0
45
90
135
180
225
270
315
15
30
60
75
105
120
150
165195
210
240
255
285
300
330
345
0 0.1 0.2 0.3 0.4
818 819 Figure 5-1. Conditional probability function plots for excess mass at each site relative to Allen Park, 820 1999-2006. Probabilities are for the top decile of the excess mass distribution. 821

PM2.5 High Concentration Days over Southeast Michigan
Washington University in St. Louis April 23, 2008 34
Data for 1999 were excluded from the concentration time series because the network was being 822 phased in during that year; there were only 14 valid network days and the valid network days 823 winds distribution was markedly different from the 1999 annual surface winds distribution. For 824 the remaining years the annual wind roses for valid network days showed good agreement with 825 the annual wind roses for all days (Figure B-2), including 2006 which had a relatively low 826 number of valid network days (also seasonally biased towards the first quarter) due to a 827 reduction in sampling frequency at certain sites. These favorable comparisons demonstrate the 828 representativeness in using valid network days to capture annual average behavior for the site-829 specific excess mass. 830 831 Figure 5-2 shows annual distributions of the network-wide base concentration. Similar 832 distributions were observed for the first four years (2000-2003) with substantial year-to-year 833 variability for the subsequent four years (2004-2007). The lowest median value was in 2004, 834 followed by a relatively high mean value in 2005. 835 836 Excess mass annual time series and NWR plots were generated for each site with selected results 837 presented in this report. NWR was performed after stratifying the data into two time periods: 838 2000-2003 and 2004-2006. Hourly surface winds distributions, Figure 5-3, exhibit a lower 839 frequency of winds from the southwest for the 2004-2006 period compared to the 2000-2003 840 period. However, the NWR results are presented as the expected concentration value for each 841 wind direction and thus are not influenced by the frequency distribution of wind direction. An 842 apportionment of the average excess mass to wind sectors (and thus emission sources in that 843 sector) would require a weighting of the sector-specific expected concentration by the sector-844 specific frequency of wind direction. This step is discussed in Section 6 as a recommendation 845 for future work. For the purpose of identifying whether emission source strengths have changed 846 over time, the expected concentration as presented in this section is appropriate since it is not 847 influenced by year-to-year differences in the distribution of surface wind directions. 848 849 850
2000 2001 2002 2003 2004 2005 2006 2007
netw
ork-
wid
e ba
selin
e co
ncen
tratio
n, u
g/m
3
0
5
10
15
20
25
30
35
40( 84) (104) (101) (113) (117) (121) ( 73) (120)
851 Figure 5-2. Annual distributions of the network-wide base concentration. Open circles are 5th and 95th 852 percentile values; the red and black lines are mean and median values (solid within box for yearly, dashed 853 for entire data set); and the number of samples is in parenthesis at the top of each plot. 854

PM2.5 High Concentration Days over Southeast Michigan
Washington University in St. Louis April 23, 2008 35
NNE
NE
ENE
E
ESE
SE
SSES
SSW
SW
WSW
W
WNW
NW
NNWN
0% 5% 10% 15%
10% 11%
NNE
NE
ENE
E
ESE
SE
SSES
SSW
SW
WSW
W
WNW
NW
NNWN
0% 5% 10% 15%
855 (a) 2000-2003 (b) 2004-2006 856
857 Figure 5-3. Wind rose for non-calm hours, observations at Detroit Metropolitan Wayne County Airport 858 (DTW): (a) 2000-2003; and (b) 2004-2006. Calms (wind speeds less than 2 mph) are listed to the 859 lower-left of each wind rose. 860 861 862 Ann Arbor, FIA/Lafayette, Newberry were excluded because sampling was not sustained over 863 the 2000-2006 time period. Luna Pier and Port Huron were excluded because they are at the 864 spatial extents of the geographic domain and both the base concentration estimates and surface 865 winds might not be representative. Figures 5-4 through 5-7 show the time series and NWR plots 866 for Dearborn, Wyandotte, Southwest High School and Linwood, respectively. NWR results as 867 polar plots are presented with the radial concentration units in μg/m3; the red line is the average 868 contribution and the pink lines are the 95% confidence intervals. NWR results were also 869 generated after first censoring the data to remove extreme values and thereby stabilize the 870 expected concentration estimates.12 The bottom plot in each panel of Figure 5-4 shows the NWR 871 results for censored data, and includes the difference in expected concentration values between 872 the two time periods (blue line). Figure E-1 (Appendix E) presents NWR results for all sites as 873 Cartesian plots for all data and censored data. 874 875 Dearborn (Figure 5-4) exhibits the average highest average excess mass. Both the mean and 876 median excess mass decreased beginning in 2005 despite an increase that year in the mean base 877 concentration (Figure 5-2). The time series for the annual base concentration and excess mass 878 concentration are decoupled which adds confidence that the decreases in excess mass are real. 879 Expected mass concentrations of at least 2 μg/m3 were observed for all wind directions (center 880 and bottom plots in Figure 5-4) with elevated excess mass for bearings 120-300°N and a 881 maximum in the expected concentration at ~225°N of with concentrations 9 and 7 μg/m3 for 882 2000-2003 and 2004-2006, respectively. The excess mass floor of ~2 μg/m3 might be real since 883 the Detroit population core, perhaps a surrogate for mobile source and area emissions, is to the 884
12 Extreme values were defined as those values exceeding the upper outer fences (UOF) and lower outer fences (LOF) of the nonparametric distribution of excess mass: CUOF = C75 + 3×CIQR; and CLOF = C25 - 3×CIQR where Ci is concentration i, subscripts 25 and 75 denote 25th and 75th percentiles, and IQR is the interquartile range (C75 - C25).
>2 - 4>4 - 8>8 - 16>16
WS (mph)

PM2.5 High Concentration Days over Southeast Michigan
Washington University in St. Louis April 23, 2008 36
DEARBORN 885
2000 2001 2002 2003 2004 2005 2006 2007
exce
ss a
bove
net
wor
k-w
ide
base
line,
ug/
m3
-5
0
5
10
15
20( 76) ( 98) ( 96) (105) (105) (114) ( 70) (114)
Dearborn
2000-2003 2004-2006
0 2 4 6 8 109
60
30
0
330
300
70
240
210
180
150
120
0 2 4 6 8 109
60
30
0
330
300
70
240
210
180
150
120
-2
0
2
4
6
8
10
000 030 060 090 120 150 180 210 240 270 300 330 360
wind direction, oN
1-D
NW
R e
xces
s m
ass
expe
cted
con
cent
ratio
n, μ
g/m
3 Dearborn, 2000-2003
Dearborn, 2004-2006
[2004-2006] minus [2000-2003]
886 Figure 5-4. Excess PM2.5 mass compared to the network-wide base concentration. Top: box plots of 887 annual excess mass concentration distributions. Open circles are 5th and 95th percentile values; the red 888 and black lines are mean and median values (solid within box for yearly, dashed for entire data set); and 889 the number of samples is in parenthesis. Center: 1-D NWR for excess mass at each site relative to the 890 network-wide baseline concentration for 2000-2003 (left) and 2004-2006 (right). Average concentrations 891 and 95% confidence intervals are red and pink lines, respectively, and radial units are μg/m3. Bottom: 892 1-D NWR expected excess mass concentrations after censoring the data to remove extreme values. 893

PM2.5 High Concentration Days over Southeast Michigan
Washington University in St. Louis April 23, 2008 37
WYANDOTTE 894
2000-2003 2004-2006
2000 2001 2002 2003 2004 2005 2006 2007
exce
ss a
bove
net
wor
k-w
ide
base
line,
ug/
m3
-5
0
5
10
15
20Wyandotte
( 82) ( 99) ( 90) (100) (107) (112) ( 69) (116)
0 1 2 3 4 59
60
30
0
330
300
70
240
210
180
150
120
0 1 2 3 4 59
60
30
0
330
300
70
240
210
180
150
120
2000-2003 2004-2006
-2
0
2
4
6
8
10
000 030 060 090 120 150 180 210 240 270 300 330 360
wind direction, oN
1-D
NW
R e
xces
s m
ass
expe
cted
con
cent
ratio
n, μ
g/m
3 Wyandotte, 2000-2003
Wyandotte, 2004-2006
[2004-2006] minus [2000-2003]
895 Figure 5-5. Excess PM2.5 mass compared to the network-wide base concentration. Top: box plots of 896 annual excess mass concentration distributions. Open circles are 5th and 95th percentile values; the red 897 and black lines are mean and median values (solid within box for yearly, dashed for entire data set); and 898 the number of samples is in parenthesis. Center: 1-D NWR for excess mass at each site relative to the 899 network-wide baseline concentration for 2000-2003 (left) and 2004-2006 (right). Average concentrations 900 and 95% confidence intervals are red and pink lines, respectively, and radial units are μg/m3. Bottom: 901 1-D NWR expected excess mass concentrations after censoring the data to remove extreme values. 902

PM2.5 High Concentration Days over Southeast Michigan
Washington University in St. Louis April 23, 2008 38
SOUTHWEST HIGH SCHOOL 903
2000-2003 2004-2006
2000 2001 2002 2003 2004 2005 2006 2007
exce
ss a
bove
net
wor
k-w
ide
base
line,
ug/
m3
-5
0
5
10
15
20Southwest High Sch.
( 82) ( 102) ( 94) (105) (110) (114) ( 70) (113)
0 1 2 3 4 59
60
30
0
330
300
70
240
210
180
150
120
0 1 2 3 4 59
60
30
0
330
300
70
240
210
180
150
120
-2
-1
0
1
2
3
4
5
6
7
8
9
10
000 030 060 090 120 150 180 210 240 270 300 330 360
wind direction, oN
1-D
NW
R e
xces
s m
ass
expe
cted
con
cent
ratio
n, μ
g/m
3 SW High Sch., 2000-2003
SW High Sch., 2004-2006
[2004-2006] minus [2000-2003]
904 Figure 5-6. Excess PM2.5 mass compared to the network-wide base concentration. Top: box plots of 905 annual excess mass concentration distributions. Open circles are 5th and 95th percentile values; the red 906 and black lines are mean and median values (solid within box for yearly, dashed for entire data set); and 907 the number of samples is in parenthesis. Center: 1-D NWR for excess mass at each site relative to the 908 network-wide baseline concentration for 2000-2003 (left) and 2004-2006 (right). Average concentrations 909 and 95% confidence intervals are red and pink lines, respectively, and radial units are μg/m3. Bottom: 910 1-D NWR expected excess mass concentrations after censoring the data to remove extreme values. 911

PM2.5 High Concentration Days over Southeast Michigan
Washington University in St. Louis April 23, 2008 39
LINWOOD 912
2000-2003 2004-2006
2000 2001 2002 2003 2004 2005 2006 2007
exce
ss a
bove
net
wor
k-w
ide
base
line,
ug/
m3
-5
0
5
10
15
20Linwood
( 80) ( 98) ( 91) (106) (105) (110) ( 66) (111)
0.0 0.5 1.0 1.5 2.0 2.59
60
30
0
330
300
70
240
210
180
150
120
0.0 0.5 1.0 1.5 2.0 2.59
60
30
0
330
300
70
240
210
180
150
120
-2
0
2
4
6
8
10
000 030 060 090 120 150 180 210 240 270 300 330 360
wind direction, oN
1-D
NW
R e
xces
s m
ass
expe
cted
con
cent
ratio
n, μ
g/m
3 Linwood, 2000-2003
Linwood, 2004-2006
[2004-2006] minus [2000-2003]
913 Figure 5-7 Excess PM2.5 mass compared to the network-wide base concentration. Top: box plots of 914 annual excess mass concentration distributions. Open circles are 5th and 95th percentile values; the red 915 and black lines are mean and median values (solid within box for yearly, dashed for entire data set); and 916 the number of samples is in parenthesis. Center: 1-D NWR for excess mass at each site relative to the 917 network-wide baseline concentration for 2000-2003 (left) and 2004-2006 (right). Average concentrations 918 and 95% confidence intervals are red and pink lines, respectively, and radial units are μg/m3. Bottom: 919 1-D NWR expected excess mass concentrations after censoring the data to remove extreme values. 920

PM2.5 High Concentration Days over Southeast Michigan
Washington University in St. Louis April 23, 2008 40
north and east and the site is located in the Detroit commercial/industrial core. It is possible, 921 however, that the excess mass floor reflects contamination in the NWR analysis from using 922 daily-integrated FRM mass together with hourly winds which might vary over the course of the 923 day and thus smear short duration, high intensity contributions from the local emission sources 924 across other wind directions. The period 2004-2006 does indeed exhibit lower excess mass 925 concentrations compared to 2000-2003, consistent with Figure 4-5, with maximum reductions of 926 ~2 μg/m3 from ~195-255°N. The Dearborn NWR results were insensitive to the censoring of 927 data to remove extreme values (Figure E-1). In summary, Dearborn is significantly influenced 928 by local emission sources to the southwest of the site. This is also the direction of the prevailing 929 wind and thus emission controls on these sources would have a dramatic impact on observed 930 concentrations at the Dearborn site. There is also a significant urban scale contribution 931 regardless of wind direction with expected concentration greater than 2 μg/m3 (the excess mass 932 floor is 2 μg/m3 plus there are urban-scale contributions to the base concentration) although the 933 relative contributions of mobile, area, and dispersed point source emissions is not clear. 934 935 Wyandotte and Southwest High School have similar mean and median excess mass, second after 936 Dearborn. Let us first consider Wyandotte. The top plot in Figure 5-5 shows a dramatic and 937 steady reduction in mean and median excess mass starting in 2004. Expected mass 938 concentrations were lowest for wind directions from the east/southeast (indeed, ~0 μg/m3 for 939 2004-2006) which is consistent with the orientation of the site relative to local sources and the 940 Detroit population and commercial / industrial cores. There are two sectors with high expected 941 excess mass concentrations. One sector is broadly to the north/northwest with expected excess 942 mass concentrations ~2 μg/m3 for 2000-2003 and with ~50% decrease for 2004-2006. This 943 bearing is consistent with the location of the Detroit population and commercial / industrial cores 944 which are north of Wyandotte. The other sector is to the southwest with a maximum excess 945 mass concentration of nearly 4 μg/m3 for 2000-2003 and with ~50% decrease for 2004-2006. 946 Given both the alignment of this sector with the prevailing wind direction and the magnitude of 947 the expected concentrations, the emission reductions achieved from this sector are most 948 responsible for the observed decrease in the excess mass concentration over time. Local 949 emission sources in this sector include a large quarry. Like Dearborn, the NWR results are 950 relatively insensitive to the censoring of extreme values (Figure E-1). In summary, the wind 951 direction dependence of expected excess mass concentration at Wyandotte is consistent with 952 known emission sources / source regions. Expected concentrations have decreased over the past 953 few years for two wind distinct bearings – north and southwest of the site – which suggest that 954 emission reductions have taken place in both sectors. The reductions from the southwest are 955 more significant to both annual average concentrations and high PM days. 956 957 Annual mean and median excess mass concentrations at Southwest High School also decreased 958 starting in 2005 (Figure 5-6). NWR polar plots suggest the excess mass decrease was driven by 959 emission reductions to the south/southwest. However, NWR results for all data and censored 960 data (Figure E-1) demonstrate that a few extreme events were driving the higher expected mass 961 from the south/southwest for 2000-2003 compared to 2004-2006. Indeed, the NWR plot for 962 censored data (Figure 5-6, bottom) shows essentially no difference in expected excess mass at 963 the location of the maximum (~190°N). Emission reductions might be driving small differences 964 in expected excess concentration between 2000-2003 and 2004-2006 at bearings of ~105, 965 250-300, and 355°N. The expected excess mass concentration floor was ~2 μg/m3 for 966

PM2.5 High Concentration Days over Southeast Michigan
Washington University in St. Louis April 23, 2008 41
2000-2003 and was modestly lower for 2004-2006. This floor is similar to the excess mass 967 concentration floor observed at Dearborn which is consistent with their close proximity. In 968 summary, in contrast to Dearborn and Wyandotte, individual local sources contributing to excess 969 mass at Southwest High School appear to have smaller average impact and are potentially more 970 numerous. Highest expected concentrations are from bearing of ~190°N and with extreme 971 events realized primarily in the period 2000-2003. Based on Figure 4-3 these events typically 972 occurred on relatively clean days (base concentrations 10-20 μg/m3) and were not sufficiently 973 high to cause exceedances. Like Dearborn, there is a relatively high floor for the excess mass 974 over all wind directions but the relative contributions of mobile, area, and dispersed point source 975 emissions is not known. 976 977 Linwood is located near the northeast corner of the Detroit industrial core. There are no 978 discernible changes in the excess mass distribution over time (Figure 5-7). NWR polar plots 979 show different features for the 2000-2003 and 2004-2006 time periods; the differences are driven 980 by extreme values and NWR on the censored data yields very consistent concentrations profiles 981 for the two time periods (Figure 5-7, bottom plot). The excess mass concentration floor is 982 ~0.5 μg/m3 with perhaps modestly lower values for bearings to the east/northeast (60-105°N). 983 Increased excess mass is observed over the range 120-240°N with a broad maximum at 150-984 210°N. This behavior suggests that Linwood is at the fringe of the high emissions zone in the 985 Detroit commercial/industrial core. Excess mass concentrations when the winds are from the 986 southwest approach 1.5-2 μg/m3, consistent with the floors at Dearborn and Southwest High 987 School. For other wind directions, the expected concentrations are lower. 988 989 The above detailed analysis of four sites – Dearborn ,Wyandotte, Southwest High School, and 990 Linwood – contributes to our understanding of local and urban-scale emissions contributions to 991 observed PM mass. Local point source impacts are historically large at both Dearborn and 992 Wyandotte but have been decreasing. In both cases, the largest contributors are located 993 southwest of the sites, which is consistent with the prevailing winds. Dearborn and Southwest 994 High School have expected excess mass concentrations of a least 1.5-2 μg/m3 from all wind 995 directions, while the minimum expected mass concentrations are lower at Wyandotte and 996 Linwood. Thus, Dearborn and Southwest High School appear to be within the high emissions 997 zone with contributions from multiple point sources and possibly significant contributions from 998 area and mobile sources. The plume from this high emissions zone is advected downwind, 999 consistent with the higher expected excess mass concentrations at Wyandotte and Linwood for 1000 winds from the north and south/southwest, respectively. Thus plume is superposed on the 1001 broader urban-scale emissions contributions from mobile, area, and possibly other point sources, 1002 which presumably also disperse as advected downwind. 1003 1004 This conceptual model is tested by examining excess mass patterns at sites outside the 1005 commercial/industrial core. Figure 5-8 shows the Allen Park, Dearborn, Linwood, East 7 Mile, 1006 and New Haven NWR results for 2004-2006 censored data (note the concentration scale range is 1007 different than Figures 5-4 to 5-7). These five sites fall roughly along a transect oriented ~225°N 1008 and thus can be examined using the framework of Figure 2-1. The right figure shows that Allen 1009 Park (black line) and Linwood (red line) concentration profiles are nearly mirror images 1010 spanning the range 0.25-2 μg/m3 with a Linwood maximum and Allen Park minimum at 1011 180-220°N. These sites are on opposite ends, and nearly equidistant, from Dearborn (clearly a 1012

PM2.5 High Concentration Days over Southeast Michigan
Washington University in St. Louis April 23, 2008 42
1013
-2
-1
0
1
2
3
4
5
6
7
8
000 030 060 090 120 150 180 210 240 270 300 330 360
wind direction, oN
1-D
NW
R e
xces
s m
ass
expe
cted
con
cent
ratio
n, μ
g/m
3 Allen Park, 2004-2006Dearborn, 2004-2006Linwood, 2004-2006East 7 Mile, 2004-2006New Haven, 2004-2006
-2.0
-1.5
-1.0
-0.5
0.0
0.5
1.0
1.5
2.0
2.5
3.0
000 030 060 090 120 150 180 210 240 270 300 330 360
wind direction, oN
1-D
NW
R e
xces
s m
ass
expe
cted
con
cent
ratio
n, μ
g/m
3 Allen Park, 2004-2006Linwood, 2004-2006East 7 Mile, 2004-2006New Haven, 2004-2006
1014 Figure 5-8. NWR expected concentrations for excess PM2.5 mass compared to the network-wide base 1015 concentration, 2004-2006 data censored to remove extreme values as described in footnote #12. 1016
1017 hot spot, left figure) and the industrialized zone to its southeast. This suggests there is an 1018 emissions plume emanating from Dearborn and industrial areas to its southeast, extending to the 1019 Detroit River, which impact Allen Park and Linwood similarly in terms of expected 1020 concentrations. Average mass contributions to these sites will differ with the frequency 1021 distribution of wind directions. The expected concentration from this plume decreases at more 1022 distant sites. It is still evident at East 7 Mile and is barely discernible from the baseline at New 1023 Haven. In addition to this plume from the Detroit commercial/industrial core, there appears to be 1024 a broader urban scale emissions profile as evidenced by the decreasing excess mass 1025 concentration floors with increasing distance from the Detroit population core. Expected excess 1026 mass concentrations for bearings outside the commercial / industrial core plume are ~ 0.5 μg/m3 1027 at Allen Park and Linwood, ~0 μg/m3 at East 7 Mile, and about -1 μg/m3 at New Haven. Recall 1028 that the base concentration includes regional and some urban-scale contributions and the 1029 negative excess concentrations at New Haven suggest a maximum of at least 1.5μg/m3 (based on 1030 -1 μg/m3 at New Haven and +0.5 μg/m3 at Allen Park/Linwood) for the urban-scale 1031 contributions within the metro area. 1032 1033 Six sites – Allen Park, East 7 Mile, Livonia, New Haven, Oak Park, and Ypsilanti – are 1034 considered from a complementary perspective. Figure 4-3 demonstrates that large excess mass 1035 excursions above the network-wide base concentration are relatively rare at these sites. There 1036 are occasional extreme excess values which are both positive and negative with respect to the 1037 base concentration, so the excess mass distributions were stabilized by censoring to remove 1038 extreme values.12 NWR results for all these sites using both all data and censored data are 1039 presented in Figure E-1. For each site, all expected concentrations were scaled so the lowest 1040 expected concentration as a function of wind direction was zero (concentrations are negative 1041 when the expected concentration is below the base concentration) and the normalized to a 1042 maximum expected concentration of unity. Figure 5-9 shows the scaled NWR concentration 1043 plots are superposed on 2000 census tract level population density data. The plots are ordered 1044 clockwise about Detroit area starting with Ypsilanti and ending with Allen Park. The following 1045 features are observed. 1046

PM2.5 High Concentration Days over Southeast Michigan
Washington University in St. Louis April 23, 2008 43
YPSILANTIYPSILANTI LIVONIA
1047 OAK PARKOAK PARK EAST 7 MILEEAST 7 MILE
1048 NEW HAVEN ALLEN PARKALLEN PARK
1049 Figure 5-5. 1-D NWR for excess mass at each site (green circle) relative to the network-wide 1050 baseline concentration for 2004-2006, censored to remove extreme values according to footnote 1051 #12. NWR results are superposed on 2000 census tract population density data.1052

PM2.5 High Concentration Days over Southeast Michigan
Washington University in St. Louis April 23, 2008 44
1053 • Ypsilanti. The expected excess mass concentration ranged from -1 to +1 μg/m3. 1054
Bearings of highest excess mass concentration correspond to an urban plume emanating 1055 from the east, consistent with the Detroit population and commercial/industrial cores. 1056
• Livonia. The expected excess mass concentration ranged from -1 to +1 μg/m3. Bearings 1057 of highest excess mass concentration correspond to an urban plume emanating from the 1058 Detroit population and commercial/industrial cores with potentially larger impacts from 1059 the latter core. 1060
• Oak Park. The expected excess mass concentration ranged from -0.5 to +1 μg/m3. The 1061 higher floor is consistent with this site being closer to the Detroit population and 1062 commercial/industrial cores than Ypsilanti and Livonia. Bearings of highest excess mass 1063 concentration range from due east to due south, consistent with the Detroit population 1064 and commercial/industrial cores. 1065
• East 7 Mile. The expected excess mass concentration ranged from 0 to +1 μg/m3. 1066 Highest concentration bearings are to southwest with elevated expected concentrations 1067 also to the west, consistent with the Detroit commercial/industrial and population cores, 1068 respectively. 1069
• New Haven. The expected excess mass concentration is nearly constant at -1 μg/m3. A 1070 bearing of modestly elevated expected excess mass concentrations is to the southwest, 1071 aligned with the Detroit commercial/industrial and population core. 1072
• Allen Park. The expected excess mass concentration ranged from 0.5 to +2 μg/m3. 1073 High concentration bearings are to the north through east of the site, consistent with the 1074 Detroit population and commercial/industrial cores. 1075
1076 These six sites completely surround the Detroit population and commercial / industrial cores and 1077 in each case demonstrate highest expected excess mass for winds from the core zones. This 1078 analysis clearly demonstrates the ability to decouple excess mass concentrations from the 1079 network-wide base and to draw a consistent interpretation from the results across all sites. 1080 Ypsilanti, Livonia and New Haven all have expected excess mass concentrations of about -1081 1 μg/m3 when the sites are upwind of the Detroit population and commercial/industrial cores. 1082 Thus a reasonable estimate for the average urban-scale contribution to the average network-wide 1083 base is about 1 μg/m3. The 2004-2006 average base concentration of 13.5 μg/m3 could be 1084 apportioned as 12.5 μg/m3 from regional sources and a 1 μg/m3 portion of the urban-scale 1085 contributions. Urban-scale emissions contribute, on average, up to 3 μg/m3 depending on 1086 location within the Greater Wayne County area and the specified wind pattern. They appear to 1087 be greatest in the Detroit commercial/industrial core and might include significant contributions 1088 from point sources that are either far enough from the monitor and/or low enough in emissions to 1089 not be distinguished from the urban-scale contributions. Large local emission sources can exert 1090 significant influence on near-field monitors as demonstrated for Dearborn and Wyandotte. 1091 1092 In summary, analyses of PM2.5 mass concentrations – separated into network-wide base and 1093 site-specific excess mass components – together with surface winds provide the following model 1094 for PM2.5 mass concentrations over Southeast Michigan (excluding the distant sites of Ann 1095 Arbor, Luna Pier, and Port Huron): 1096

PM2.5 High Concentration Days over Southeast Michigan
Washington University in St. Louis April 23, 2008 45
• At most sites, high PM days coincide with network-wide high PM levels and typically 1097 occur when the area is experiencing a multiday high PM episode (Section 4). 1098
• Hot spots of high PM concentration arise near large emission sources and, in the cases of 1099 Dearborn and Wyandotte, can drive exceedances (or near exceedances) of the daily 1100 standard. In both cases, the high emissions zones are located to the southwest of the 1101 monitoring sites. This is consistent with the prevailing winds from the southwest 1102 exacerbating the frequency of high impact days. Expected concentration contributions 1103 from these zones have decreased in recent years, presumably due to emission reductions. 1104
• An idealized conceptual model for PM behavior, that explains, both daily and annual PM 1105 mass trends, consists of four layers: (1) regionally transported PM with average 1106 concentration of about 12.5 μg/m3 over the 2004-2006 period; (2) urban-scale emissions 1107 from mobile, area, and point sources that contribute up to 3 μg/m3 for specific surface 1108 winds patterns, depending on location, with less impact when averaged over the 1109 distribution of wind directions impacting a given site; (3) a PM plume from the Detroit 1110 commercial/industrial core that remains distinct from the other urban-scale contributions 1111 for sites as distant as East 7 Mile and possible New Haven; and (4) localized hot spots for 1112 cases when certain monitoring sites are directly impacted by emission plumes from 1113 nearby sources with high potentially impacts on a given day and less impact when 1114 averaged of the distribution of wind directions impacting such sites. 1115
1116

PM2.5 High Concentration Days over Southeast Michigan
Washington University in St. Louis April 23, 2008 46
6. SUMMARY, POLICY-RELEVANT IMPLICATIONS, AND RECOMMENDATIONS 1117 1118 Summary 1119 1120 At most sites in Southeast Michigan, exceedances occur predominantly – and in some cases 1121 exclusively – on days when the entire network is exhibiting high PM. For thirteen of the fifteen 1122 monitors, at least 85% of exceedances occurred on days when the entire network was exhibiting 1123 high PM. Drivers for network-wide high PM are regional transport, poor atmospheric ventilation 1124 across the network, or both of these conditions. Two monitors in particular – Dearborn and 1125 Wyandotte – frequently had exceedances on days when the entire network was not exhibiting 1126 high PM with 38% of the Dearborn exceedances and 27% of the Wyandotte exceedances 1127 occurring on such days. On these days, these sites are significantly influenced by nearby 1128 emission sources. Dearborn continues to be influenced by nearby emission sources which drive 1129 exceedances (or near exceedances) on days when the network-wide base concentration is as 1130 much as 15 μg/m3 below the standard, although the frequency of such days appears to be 1131 decreasing. In contrast, at Wyandotte all of the days for which nearby emission sources were 1132 disproportionately contributing to exceedances (or near exceedances) of the standard were prior 1133 to 2004. At those sites not significantly impacted by plumes from nearby emission sources, high 1134 PM days are most often observed when the area is experiencing a multiday high PM episode. 1135 1136 Seasonal variations in surface winds can explain the seasonal differences in frequency of high 1137 PM days between sites in the Greater Wayne County area. Sites such as Allen Park, which are 1138 relatively free of impacts from nearby sources, exhibit similar seasonal behavior with high PM 1139 days most frequent in the summer followed by the winter. The monthly distribution of high PM 1140 days is distorted for sites with significant nearby emission sources since there is a strong 1141 seasonality to the surface winds distributions. For example, Dearborn has as many high PM days 1142 in the winter as in the summer, with the winter season having a stronger contribution from 1143 nearby sources located to the southwest of the site. 1144 1145 Network-wide high PM days have disproportionately high contributions from the major ions 1146 (sulfate, nitrate, and ammonium) compared to other days. Summertime events are dominated by 1147 sulfate and wintertime events are dominated by ammonium nitrate. However these so-called 1148 high nitrate days typically have ammonium sulfate concentrations that are at least 50% of the 1149 ammonium nitrate concentration. The role of sulfate on such days should not be overlooked 1150 when considering the impact of SO2-based regional control strategies. In general, network-wide 1151 PM base concentrations above ~20 μg/m3 tend to be disproportionately influenced by major ion 1152 contributions and are indicative of a disproportionately high influence from regional sources. 1153 On network-wide high PM days the sulfate and nitrate concentrations are typically several times 1154 higher than the corresponding monthly median concentrations. In contrast, EC is on average 1155 only 1.3 times higher. This pattern suggests that network-wide high PM days are primarily 1156 influenced by regional transport and are to a much lesser extent influenced by a increased levels 1157 of urban-scale emissions arising from poor atmospheric ventilation. As previously stated, 1158 emission sources near the monitoring sites can still exert significant plume impacts regardless of 1159 the network-wide PM behavior driven by regional and urban-scale contributions. 1160 1161

PM2.5 High Concentration Days over Southeast Michigan
Washington University in St. Louis April 23, 2008 47
Many network-wide high PM days coincide with high nitrate, and in some cases there is 1162 substantial variability in PM mass concentration across the network on these days. It is 1163 important to determine whether the variability is real or a measurement artifact, because these 1164 days can influence into the site-specific design values and in general can explain many of the 1165 exceedingly high PM levels observed at certain sites that otherwise do not appear to be 1166 disproportionately impacted by nearby local emission source plumes on high PM days. 1167 1168 A conceptual model for fine PM over central Southeast Michigan includes four elements. The 1169 largest contributor to annual average PM is regionally transported material that is temporally 1170 varying but spatially homogeneous over the domain (indeed, this defines the spatial extent of the 1171 domain for the conceptual model which in this case excludes the distant sites such as Luna Pier 1172 and Port Huron). On some days, regionally transported PM contributions can be sufficiently 1173 high to cause exceedances of the daily standard when coupled with average contributions from 1174 urban- and finer-scale emission sources and, in relatively rare cases, the regionally transported 1175 PM alone can cause exceedances of the daily standard. Urban-scale emission sources (mobile, 1176 area, and point sources) create a spatial PM gradient across central Southeast Michigan. For 1177 winds from a fixed direction, these contributions create an “urban plume” with decreasing 1178 impacts with increasing distance from the zone of highest emissions activity. The spatial 1179 gradients can be clearly discerned when binning data from days with common wind patterns and 1180 become smeared, to some extent, when averaging over periods with varying wind patterns. At 1181 many sites (e.g., Linwood, East 7 Mile) a PM plume emanating from the Detroit commercial / 1182 industrial zone, which is nominally Dearborn and areas to its southeast towards the Detroit River, 1183 including Zug Island, can be distinguished from the aforementioned urban plume. At sites 1184 further downwind, such as New Haven, these two plumes have essentially merged into a single 1185 urban plume. Average impacts from these plumes depend on the monitoring site location 1186 relative to the Detroit population and commercial/industrial core zones and the frequency that 1187 winds from these zones transport the plumes to the monitoring site. Finally, certain monitors in 1188 the Detroit commercial/industrial zone are significantly impacted by emissions from nearby 1189 sources that ultimately contribute to the distant PM plume emanating from this zone. At 1190 Dearborn and Wyandotte these sources are located southwest of the monitoring sites and 1191 historically have contributed to exceedances (or nears exceedances) of the daily standard. These 1192 sources also disproportionately influence the annual standard because they are oriented upwind 1193 of the sites for prevailing winds from the southwest. 1194 1195 In summary, emission controls that reduce regionally transported PM are needed to reduce the 1196 frequency of violations of the 24-hour PM2.5 standard. Emission reductions from a few specific 1197 point sources, especially near Dearborn, are also needed. While regional and point source 1198 controls will decrease annual average PM2.5 concentrations for standardized synoptic weather 1199 patterns, relatively small but significant decreases could also be realized by controls on other 1200 urban emission sources such as mobile, area, and other point sources. 1201

PM2.5 High Concentration Days over Southeast Michigan
Washington University in St. Louis April 23, 2008 48
Policy-Relevant Implications 1202 1203 The policy-relevant implications are framed using the Weight-of-Evidence (WOE)13 prepared in 1204 support of the control strategy package for the attaining the PM2.5 annual average standard. The 1205 WOE elements are in regular typeface with comments, based on this work, added in italics. 1206
1207 1208 I. Inventory 1209 • I(c)… National stationary source controls, including CAIR and the NOx SIP call, are expected to 1210
reduce point source NOx emissions by 40% and SO2 emissions by 15% between 2002 and 2009. 1211 These reductions are very important to the daily standard control strategy because exceedances of 1212 the daily standard tend to occur on days with network-wide high PM from regional transport of 1213 species including but likely not limited to ammonium sulfate and ammonium nitrate. 1214
• I(c)… [There] is compelling evidence that areas in Southeast Michigan that are currently attaining the 1215 [annual] standard will remain in compliance. For the period 2004-2006, only one monitor in 1216 Southeast Michigan was in compliance with the 24-hour standard. While reductions in local 1217 emissions should prevent backsliding, daily exceedances are coupled to the frequency and severity of 1218 regional transport episodes which can vary from year to year. For example, 2005 was severe in 1219 terms of regional transport and this is reflected in the elevated 98th percentile concentrations across 1220 all sites in Southeast Michigan. 1221
• I(d)… While these [programmed] reductions are already having a significant, positive impact in 1222 Southeast Michigan and will continue to do so in future, we cannot assume that they will result in 1223 attainment at Dearborn and Southwestern High School (SWHS), the two monitoring sites that are still 1224 exceeding the annual standard. Additional reductions in the vicinity of these sites are needed. 1225 Dearborn is currently the design value site for the daily standard. This study has demonstrated that 1226 contributions from certain local emission source have decreased in recent years. In contrast, the 1227 magnitude of the urban plume, which includes a broader range of emission sources, has not 1228 significantly decreased in recent years as evidenced by expected concentration patterns observed at 1229 sites such as East 7 Mile and Linwood. 1230
• I(e)… The area surrounding the two non-attaining monitors in Southeast Michigan contains a 1231 complex array of emission sources. Some of these sources may be significant contributors because 1232 their emissions occur closer to ground level and/or because of their proximity to a monitor. However, 1233 many of these are area sources that are exempt from MDEQ’s emissions inventory reporting 1234 requirements so their exact contribution is unknown. In addition, many of these smaller sources have 1235 little or no emission controls while larger sources already have controls in place. At these sites and a 1236 few other sites, the analysis in Section 5 point towards the bearings where efforts should be focused 1237 to refine emission estimates – in particular, zones southwest of the monitoring sites due to prevailing 1238 wintertime surface winds lead to lead to higher PM than the rest of the Southeast Michigan network. 1239
• I(f)… A number of industrial facilities in the area surrounding the Dearborn, Southwestern High 1240 School, and Wyandotte monitors have either closed or scaled back their operations since 2002. These 1241 changes are likely contributing to the more rapid decrease in PM2.5 levels observed at industrial 1242 monitoring sites. While we have indeed identified decreased local emission source contributions at 1243 some sites. 1244
• I(g)… In addition to changes that have already taken place, significant local PM2.5 reductions will be 1245 achieved from controls that are currently being phased in at the Severstal and U.S Steel facilities as 1246 well as the Marathon oil refinery. All three of these facilities are less than three miles from the 1247
13 “Weight of Evidence for the Southeast Michigan PM2.5 Attainment Strategy”, 8/28/2007 draft, prepared by SEMCOG and MDEQ.

PM2.5 High Concentration Days over Southeast Michigan
Washington University in St. Louis April 23, 2008 49
monitors measuring the highest PM2.5 concentrations in the region - Dearborn and Southwestern High 1248 School. Based on a recent EPA study as well as permit application data, MDEQ estimates these 1249 controls will provide a combined PM2.5 emission reduction of 330 tons per year. These reductions 1250 should reduce the frequency of high PM days that occur at these sites when the network-wide 1251 baseline concentration is relatively low, thereby reducing the frequency of spatially isolate 1252 exceedances and near exceedances. Conditions on network-wide high PM days will also be 1253 improved. Note that in these cases the sources are located at bearings where prevailing winds can 1254 favor plume impacts at the monitoring sites, especially in the wintertime. Impacts can be tracked by 1255 periodically updating the NWR plots and the evaluating shifts in the distribution of site-specific high 1256 PM days by month. For example, if local source impacts at Dearborn are indeed reduced, we would 1257 expect the distribution of high PM days by month for Dearborn to shift to more-closely resembling 1258 Allen Park. Intersite differences between Allen Park and Dearborn should also decrease for the 1259 relevant species in the CSN data. 1260
• I(h)… There are a significant number of storage piles, unpaved lots, and parcels of barren land in the 1261 vicinity of the Dearborn and SWHS monitors. While most emissions from these sources are larger 1262 than 2.5 microns, their collective impact is cause for concern. As part of a previous particulate SIP, a 1263 number of facilities in the area do have fugitive dust plans. However, many others do not. The 1264 contribution of fugitive dust to high PM days was not explicitly examined. 1265
II. Monitoring: 1266 • II(a)…PM2.5 in Southeast Michigan is comprised largely of sulfates, nitrates, and organic carbon. At 1267
the Dearborn monitoring site, there is also a significant “crustal” component, which is largely iron. 1268 The excess iron at Dearborn is largely related to steelmaking operations and efforts to reduce these 1269 emissions will reduce the local source impacts on exceedance and near exceedance days at 1270 Dearborn. 1271
• II(b)… Southeast Michigan’s current nonattainment designation pertains to the annual standard, not 1272 the daily standard. Developing a control strategy to address an annual standard is complicated 1273 because sources may be significant contributors on certain days or during certain times of the year but 1274 not during others. However, recent source apportionment studies show that the source contributions to 1275 PM2.5 on an annual average basis are similar to those on high PM2.5 concentration days. This suggests 1276 that a strategy designed to reduce annual average PM2.5 concentrations will also be effective in 1277 reducing high daily PM2.5 concentrations. Strategies targeting regional sulfate and nitrates will be 1278 important towards meeting both standards; in the absence of significant sulfate reduction it might be 1279 very challenging to meet the daily standard, even with aggressive local source controls. SO2 1280 reductions might not be fully realized as PM reductions if ammonium nitrate formation is ammonia 1281 limited. 1282
• II(c)… The entire Southeast Michigan area has been designated nonattainment. However, the only 1283 monitors measuring violations of the standard are located in a small portion of eastern Wayne 1284 County. For 2004-2006 all Southeast Michigan sites except Ann Arbor violated the daily standard. 1285 However, based on 2005-2007 data several sites were in compliance. This demonstrates the year-to-1286 year variations that can be induced by synoptic weather patterns which in turn include the frequency 1287 and severity of regional transport events. 1288
• II(f)… Since 2000, PM2.5 concentrations at all sites in the region have steadily declined. The 3-year 1289 average concentration dropped 1.6 μg/m3 between 2002 and 2006.. The largest decreases have 1290 occurred at the sites with the highest concentrations: Dearborn (2.69 μg/m3), SWHS (2.16 μg/m3), and 1291 Wyandotte (3.04 μg/m3). Dramatic year-to-year swings in the 98th percentile concentration are 1292 observed throughout the Southeast Michigan network due to varying impacts from regional transport. 1293 In this sense the daily stand is more “volatile” and it is harder to discern long term trends. 1294
• II(g)… PM2.5 concentrations at monitoring sites in the industrial core of Southeast Michigan’s 1295 nonattainment area (Dearborn, SWHS & Wyandotte) have been decreasing faster than other sites. 1296 This is likely due to changes in emissions in the industrial area. Reduced impacts from local emission 1297

PM2.5 High Concentration Days over Southeast Michigan
Washington University in St. Louis April 23, 2008 50
sources at Dearborn and especially Wyandotte have indeed been demonstrated in this study; average 1298 reductions are smaller at SWHS and are coupled to a lower frequency of extreme events which might 1299 have been caused by upsets at industrial facilities. Of course, any future industrial activity expansions 1300 that increase emissions could at least partially reverse these trends. 1301
• II(k)… At the time Southeast Michigan was designated nonattainment, monitoring data showed the 1302 Luna Pier monitor in Monroe County was violating the annual standard. This monitor is located in the 1303 southeastern corner of the county, one mile north of the Ohio border. In its February 2004 PM2.5 1304 nonattainment designation recommendation to EPA, MDEQ argued strongly that Monroe and Wayne 1305 counties should be designated as separate nonattainment areas because PM2.5 levels at the Luna Pier 1306 monitor tracked far more closely with those in Toledo. Many regional events operate on a large 1307 enough spatial scale to similarly impact Luna Pier and the Wayne County area. Indeed, the behavior 1308 at these two areas appears coupled on high PM days. That said, Figure 4-3 demonstrates that Luna 1309 Pier and Port Huron have the greatest dispersion about the network-wide base concentration – 1310 including many days that are lower than the base concentration – and thus they are not fully coupled. 1311
• II(l)… MDEQ and SEMCOG also showed that levels at the site had been decreasing in recent years 1312 and trend data indicated the monitor would likely measure attainment by the end of 2004. This was 1313 an accurate prediction. Levels at the site have continued to track those in Toledo and monitors in 1314 both areas have measured attainment of the standard since 2004. In 2005, EPA redesignated the 1315 Toledo area as attainment. Luna Pier continues to violate the daily standard (2004-2006 data). 1316
• II(m)… In addition, as of 2006, monitors at Allen Park, Linwood and Wyandotte are now measuring 1317 attainment [of the annual average NAAQS]. Allen Park, Linwood and Wyandotte continue to violate 1318 the daily standard (2004-2006 data). 1319
• II(n)… The area where the two remaining violating monitors (Dearborn and SWHS) are located is 1320 one with a history of particulate matter problems, associated with local industrial sources. […] the 1321 areas are nearly identical. The primary source of the former PM10 problem was determined to be a 1322 few local industrial sources. Emissions from these sources were reduced and the region came into 1323 compliance in 1996. The overlap of the Total Suspended Particulate (TSP) and PM10 nonattainment 1324 areas with the PM2.5 nonattainment area, and the successful attainment of those standards after the 1325 application of local controls, suggests that the most effective attainment strategy is to focus on local 1326 emission reductions from sources in this area. Reductions in local emissions near Dearborn have 1327 decreased the frequency of high PM days resulting from local emission sources (Figure 4-5) and the 1328 programmed emission reductions should further help to lower the local emission source influences. 1329 Local emissions near SWHS frequently lead to near exceedances when the network-wide PM levels 1330 are otherwise low but, unlike Dearborn and Wyandotte, the local source contributions appear to be 1331 just low enough to avoid exceedances on otherwise relatively clean days. 1332
• II(o)… Various analyses of both local and regional monitoring data all indicate that Southeast 1333 Michigan’s nonattainment problem is caused by a combination of regional transport and local 1334 emissions from sources in the vicinity of the violating monitors. This has also been demonstrated for 1335 the daily standard in this study with local source impacts driving the frequency of exceedances at a 1336 few sites and regional transport contributing to exceedances at all sites. 1337
• II(o)(3)… Lake Michigan Air Directors Consortium (LADCO) analysis of rural background 1338 concentrations versus urban excess in the Midwest shows that the vast majority of PM2.5 measured in 1339 our region is coming from outside Southeast Michigan. This pattern is certainly the case on network-1340 wide high PM days that coincide with the most frequent exceedances of the daily standard. 1341
• II(o)(6)… A wind rose for the iron component of PM2.5 at Dearborn points directly to the 1342 southwest. Conversely, the iron wind rose for Allen Park, while measuring much lower levels, 1343 points to the northeast. The Allen Park monitor is approximately five miles southwest of Dearborn. 1344 Additional wind direction analysis shows that, when winds are from the southwest average crustal 1345 concentrations at Dearborn are over 2.5 µg/m3 higher than those at Allen Park and are sometimes as 1346 much as 6 µg/m3 higher. This clearly indicates a significant local iron source directly between these 1347

PM2.5 High Concentration Days over Southeast Michigan
Washington University in St. Louis April 23, 2008 51
two sites (which are approximately five miles apart) and closer to the Dearborn monitor. The 1348 importance of local emission sources to the southwest of Dearborn has been demonstrated in this 1349 study. These sources likely lead to the high frequency of wintertime high PM days at Dearborn 1350 compared to the Allen Park and the rest of the network since the prevailing surface winds are from 1351 the southwest during the winter. 1352
• II(p)… The localized nature of Southeast Michigan’s nonattainment problem makes broad-based 1353 application of control measures throughout the official seven-county nonattainment area an 1354 ineffective and unproductive strategy for bringing the region into compliance. All available data 1355 show that targeted local organic carbon emission reductions, coupled with the iron reductions 1356 resulting from planned steel mill controls, will be the most cost-effective way to bring the region into 1357 attainment. Similarly, while the relative roles of regional- and urban-scale contributions have not 1358 been quantified in this study, it has been shown that regionally transported species concentrations 1359 are enhanced much more than urban-scale tracer species on high PM days. 1360
• II(y)… The difference in PM2.5 is highest from the southwest and west wind directions when nearby 1361 monitors are subtracted out of the Dearborn concentration. This would indicate that there is a large 1362 local source [or sources] between the Dearborn and “background” monitors (Allen Park, Luna Pier & 1363 Ypsilanti). This was clearly demonstrated in Section 5 of this study. 1364
1365 Recommendations for Future Work 1366 1367 Projects currently funded by LADCO will likely provide considerable refinements to this 1368 analysis. For example, sampling for organics speciation and the planned data analysis – 1369 including source apportionment – should inform the assignment of organic carbon to local and 1370 regional sources. . MDEQ is deploying semicontinuous monitors for particle speciation and 1371 high time resolution data can be particularly powerful for identifying source contributions. 1372 Results from the summer 2007 USEPA/ORD measurement intensive should be particularly 1373 insightful since PM elements were measured at high time resolution. Outdoor measurement data 1374 from USEPA’s DEARS project could also be exploited. 1375 1376 A background monitoring site would be helpful, but care is needed to ensure it is sufficiently 1377 coupled to the Detroit area in terms of air mass behavior. The site needs to be far enough away 1378 to not be influenced by the urban area, but close enough to still be similarly impacted by regional 1379 transport. This is even more critical if measurements will be conducted for 24-hour periods once 1380 every few days as the “snapshots” at each monitor must be synchronized across the domain. For 1381 example, the background site effectively used for St. Louis is about 100 km to the south which 1382 places it upwind of the city for the prevailing surface winds. Perhaps more importantly, 1383 however, the line connecting this site to the urban area is nearly perpendicular the direction of 1384 summertime synoptic air mass flows which lead to high PM in St. Louis (St. Louis is often on 1385 the backside of a high pressure system located over the Great Lakes, which lead to regional 1386 transport from the east/southeast). This orientation might actually be preferred as an upwind site 1387 – from the surface winds perspective – because the sites will be impacted at the same time for 1388 regional air masses with spatial extents greater than the site separation. 1389 1390 A better understanding of the drivers for high spatial variability in FRM mass on high nitrate 1391 days is needed since only a few such events can dramatically affect the site-specific design 1392 values for the 24-hour standard. When such patterns are observed, perhaps the Teflon filters 1393 could be analyzed for nitrate by IC to determine the extent of nitrate retention; this would be 1394

PM2.5 High Concentration Days over Southeast Michigan
Washington University in St. Louis April 23, 2008 52
particularly insightful for days coinciding with speciation sampler operation to place the Teflon 1395 filter nitrate levels in context of the ambient concentrations. 1396 It might be possible to better characterize the spatial pattern of urban-scale emission source 1397 contributions by performing reflectrometry measurements on archived PM2.5 FRM samples. The 1398 parameter from these measurements is typically highly correlated with thermo-optical EC. Thus, 1399 it provides an inexpensive approach to characterizing EC spatial profiles which might be a 1400 reasonable surrogate for urban-scale emission sources. 1401 1402 FIA/Lafayette and Newberry sites were excluded from this analysis because they commenced 1403 operation relatively recently. The analysis used concentration percentiles across the network to 1404 define network-wide behavior and thus it was necessary to use a temporally consistent subset of 1405 the network. The base concentrations generated from this work could be applied to the 1406 FIA/Lafayette and Newberry data to split observed concentrations into base and excess mass 1407 components, and then nonparametric wind regression (NWR) could be used to determine 1408 expected excess mass concentrations as a function of wind direction. This work, which is 1409 relatively modest in level of effort, could significantly contribute to our understanding of PM 1410 behavior in the Detroit commercial/industrial core. 1411 1412 Relatively little attention has been given to the behavior at Luna Pier and Port Huron on high 1413 concentration days. The analysis approach taken in this report has limitations when applied to 1414 sites at such large distances from the Greater Wayne County area. Locally-collected surface 1415 winds should be used to examine behavior at these sites. Luna Pier and Port Huron must also be 1416 considered within the context of emissions from Toledo and Sarnia, respectively. 1417 1418 NWR results are presented in Section 5 in terms of the expected concentration of excess mass 1419 observed at a site when the winds are from a given direction. This has proven to be insightful 1420 because the results do not depend on the frequency distribution of wind directions which can 1421 vary from year-to-year and confound the identification of temporal changes in emissions. From 1422 this analysis we can state that emissions from a certain wind sector have been modulated by a 1423 certain amount over time. However, we are also interested in an apportionment of the 1424 contributions of such emission sources to the PM burden at the monitoring site. This would 1425 require weighting the expected concentrations by the frequency of winds from each direction 1426 sector. We have developed a conceptual model based on the network behavior for various 1427 surface wind patterns. The next step is to incorporate the observed distribution of wind patterns 1428 to quantify how the observed PM levels are being modulated. We have shown that a PM plume 1429 from the Detroit commercial/industrial core impacts Linwood. By incorporating the observed 1430 distribution of surface wind directions we could quantify the annual-average PM mass from this 1431 plume impacting the site. This analysis would extend the focus of this report on high PM days to 1432 more robustly characterize annual average behavior and could be instrumental in providing a 1433 framework for assessing the effectiveness of emission control programs. 1434 1435 1436 1437

PM2.5 High Concentration Days over Southeast Michigan
Washington University in St. Louis April 23, 2008 53
7. REFERENCES 1438 1439 Allen, D.T.; Turner, J.R. (2008) “Transport of Atmospheric Fine Particulate Matter: Part 1. 1440 Findings from Recent Field Programs on the Extent of Regional Transport within North 1441 America”, J. Air Waste Manage. Assoc., 58, 254-264. 1442
Pinto, J.P.; Lefohn, A.S.; Shadwick, D.S. (2004) “Spatial variability of PM2.5 in urban areas in 1443 the United States”, J. Air Waste Manage. Assoc., 54, 440-449. 1444
Turner, J.R.; Allen, D.T.; (2008) “Transport of Atmospheric Fine Particulate Matter: Part 2. 1445 Findings from Recent Field Programs on the Intraurban Variability in Fine Particulate Matter”, 1446 J. Air Waste Manage. Assoc., 58, 196-215. 1447
Turner, J.R.; Garlock, J.L. (2007) “A conceptual model for ambient fine particulate matter over 1448 the St. Louis area”, Revision 3.0 (10/10/2007), prepared by the Air Quality Laboratory at 1449 Washington University in St. Louis, submitted to the Missouri Department of Natural Resources. 1450
Vickery, J.S. (2004) “Conceptual Models of PM for North American Regions”, Chapter 10 in 1451 Particulate Matter Science for Policy Makers: A NARSTO Assessment, P.H. McMurry, M.F. 1452 Shepherd, J.S. Vickery, eds., Cambridge University Press. 1453
Wade, K.S.; Turner, J.R.; Brown, S.G; Garlock, J.L., Hafner, H.R. (2008) “Data analysis and 1454 source apportionment of PM2.5 in selected Midwestern cities”, Report # STI-907018.03-3264-FR 1455 (February 2008), prepared by Sonoma Technology, Inc. (Petaluma, CA), submitted to the Lake 1456 Michigan Air Directors Consortium (LADCO). 1457
1458
ACKNOWLEDGEMENTS 1459 The analysis summarized in this report benefited from constructive input provided by members 1460 of the Southeast Michigan Ozone Study (SEMOS) group and project management provided by 1461 Ms. Joan Weidner and Mr. Chuck Hersey (SEMCOG). Technical assistance provided by 1462 Michigan DEQ staff (especially Mary Ann Heindorf, Cindy Hodges and Amy Robinson) and 1463 Ms. Ann Burns (SEMCOG) is also gratefully acknowledged. 1464
1465

PM2.5 High Concentration Days over Southeast Michigan
Washington University in St. Louis April 23, 2008 54
APPENDIX A: PM2.5 HIGH CONCENTRATION DAYS BY MONTH 1466 1467
Allen Park
Month1 2 3 4 5 6 7 8 9 10 11 12
fract
ion
of d
ays
grea
ter t
han
thre
shol
d
0.00
0.05
0.10
0.15
0.20
East 7 Mile
Month1 2 3 4 5 6 7 8 9 10 11 12
fract
ion
of d
ays
grea
ter t
han
thre
shol
d
0.00
0.05
0.10
0.15
0.20
Dearborn
Month1 2 3 4 5 6 7 8 9 10 11 12
fract
ion
of d
ays
grea
ter t
han
thre
shol
d
0.00
0.05
0.10
0.15
0.20
Luna Pier
Month1 2 3 4 5 6 7 8 9 10 11 12
fract
ion
of d
ays
grea
ter t
han
thre
shol
d
0.00
0.05
0.10
0.15
0.20
New Haven
Month1 2 3 4 5 6 7 8 9 10 11 12
fract
ion
of d
ays
grea
ter t
han
thre
shol
d
0.00
0.05
0.10
0.15
0.20
Oak Park
Month1 2 3 4 5 6 7 8 9 10 11 12
fract
ion
of d
ays
grea
ter t
han
thre
shol
d
0.00
0.05
0.10
0.15
0.20
1468
Wyandotte
Month1 2 3 4 5 6 7 8 9 10 11 12
fract
ion
of d
ays
grea
ter t
han
thre
shol
d
0.00
0.05
0.10
0.15
0.20
Ypsilanti
Month1 2 3 4 5 6 7 8 9 10 11 12
fract
ion
of d
ays
grea
ter t
han
thre
shol
d
0.00
0.05
0.10
0.15
0.20
Livonia
Month1 2 3 4 5 6 7 8 9 10 11 12
fract
ion
of d
ays
grea
ter t
han
thre
shol
d
0.00
0.05
0.10
0.15
0.20
Southwest High Sch.
Month1 2 3 4 5 6 7 8 9 10 11 12
fract
ion
of d
ays
grea
ter t
han
thre
shol
d
0.00
0.05
0.10
0.15
0.20
Linwood
Month1 2 3 4 5 6 7 8 9 10 11 12
fract
ion
of d
ays
grea
ter t
han
thre
shol
d
0.00
0.05
0.10
0.15
0.20
Port Huron
Month1 2 3 4 5 6 7 8 9 10 11 12
fract
ion
of d
ays
grea
ter t
han
thre
shol
d
0.00
0.05
0.10
0.15
0.20
1469 Figure A-1. Distribution of PM2.5 high concentration days by month, 1999-2006. Ann Arbor, 1470 FIA/Lafayette, and Newberry are excluded because FRM data was not collected at these sites over the 1471 entire time period. 1472

PM2.5 High Concentration Days over Southeast Michigan
Washington University in St. Louis April 23, 2008 55
APPENDIX B: HOURLY WIND ROSES 1473 1474
NNE
NE
ENE
E
ESE
SE
SSES
SSW
SW
WSW
W
WNW
NW
NNWN
0% 5% 10% 15%
NNE
NE
ENE
E
ESE
SE
SSES
SSW
SW
WSW
W
WNW
NW
NNWN
0% 5% 10% 15%
NNE
NE
ENE
E
ESE
SE
SSES
SSW
SW
WSW
W
WNW
NW
NNWN
0% 5% 10% 15%
NNE
NE
ENE
E
ESE
SE
SSES
SSW
SW
WSW
W
WNW
NW
NNWN
0% 5% 10% 15%
NNE
NE
ENE
E
ESE
SE
SSES
SSW
SW
WSW
W
WNW
NW
NNWN
0% 5% 10% 15%
NNE
NE
ENE
E
ESE
SE
SSES
SSW
SW
WSW
W
WNW
NW
NNWN
0% 5% 10% 15%
NNE
NE
ENE
E
ESE
SE
SSES
SSW
SW
WSW
W
WNW
NW
NNWN
0% 5% 10% 15%
Dec98-Feb99
Spring Summer Fall Winter
Mar99-May99 Jun99-Aug99 Sep99-Nov99
Dec99-Feb00 Mar00-May00 Jun00-Aug00 Sep00-Nov00
2011% 14% 13%
7% 10% 11% 10% 1475
NNE
NE
ENE
E
ESE
SE
SSES
SSW
SW
WSW
W
WNW
NW
NNWN
0% 5% 10% 15%
NNE
NE
ENE
E
ESE
SE
SSES
SSW
SW
WSW
W
WNW
NW
NNWN
0% 5% 10% 15%
NNE
NE
ENE
E
ESE
SE
SSES
SSW
SW
WSW
W
WNW
NW
NNWN
0% 5% 10% 15%
NNE
NE
ENE
E
ESE
SE
SSES
SSW
SW
WSW
W
WNW
NW
NNWN
0% 5% 10% 15%
NNE
NE
ENE
E
ESE
SE
SSES
SSW
SW
WSW
W
WNW
NW
NNWN
0% 5% 10% 15%
NNE
NE
ENE
E
ESE
SE
SSES
SSW
SW
WSW
W
WNW
NW
NNWN
0% 5% 10% 15%
NNE
NE
ENE
E
ESE
SE
SSES
SSW
SW
WSW
W
WNW
NW
NNWN
0% 5% 10% 15%
NNE
NE
ENE
E
ESE
SE
SSES
SSW
SW
WSW
W
WNW
NW
NNWN
0% 5% 10% 15%
Dec00-Feb01
Spring Summer Fall Winter
Mar01-May01 Jun01-Aug01 Sep01-Nov01
Dec01-Feb02 Mar02-May02 Jun02-Aug02 Sep02-Nov02
4% 9% 13% 9%
4% 7% 15% 11% 1476
Figure B-1. Seasonal wind roses for non-calm hours, observations at Detroit Metropolitan Wayne 1477 County Airport (DTW). Calms (wind speeds less than 2 mph) are listed to the lower-left of each wind 1478 rose. 1479
>2 - 4>4 - 8>8 - 16>16
WS (mph)

PM2.5 High Concentration Days over Southeast Michigan
Washington University in St. Louis April 23, 2008 56
NNE
NE
ENE
E
ESE
SE
SSES
SSW
SW
WSW
W
WNW
NW
NNWN
0% 5% 10% 15%
NNE
NE
ENE
E
ESE
SE
SSES
SSW
SW
WSW
W
WNW
NW
NNWN
0% 5% 10% 15%
NNE
NE
ENE
E
ESE
SE
SSES
SSW
SW
WSW
W
WNW
NW
NNWN
0% 5% 10% 15%
NNE
NE
ENE
E
ESE
SE
SSES
SSW
SW
WSW
W
WNW
NW
NNWN
0% 5% 10% 15%
NNE
NE
ENE
E
ESE
SE
SSES
SSW
SW
WSW
W
WNW
NW
NNWN
0% 5% 10% 15%
NNE
NE
ENE
E
ESE
SE
SSES
SSW
SW
WSW
W
WNW
NW
NNWN
0% 5% 10% 15%
NNE
NE
ENE
E
ESE
SE
SSES
SSW
SW
WSW
W
WNW
NW
NNWN
0% 5% 10% 15%
NNE
NE
ENE
E
ESE
SE
SSES
SSW
SW
WSW
W
WNW
NW
NNWN
0% 5% 10% 15%
Dec02-Feb03
Spring Summer Fall Winter
Mar03-May03 Jun03-Aug03 Sep03-Nov03
Dec03-Feb04 Mar04-May04 Jun04-Aug04 Sep04-Nov04
6% 11% 17% 11%
7% 7% 9% 16% 1480
NNE
NE
ENE
E
ESE
SE
SSES
SSW
SW
WSW
W
WNW
NW
NNWN
0% 5% 10% 15%
NNE
NE
ENE
E
ESE
SE
SSES
SSW
SW
WSW
W
WNW
NW
NNWN
0% 5% 10% 15%
NNE
NE
ENE
E
ESE
SE
SSES
SSW
SW
WSW
W
WNW
NW
NNWN
0% 5% 10% 15%
NNE
NE
ENE
E
ESE
SE
SSES
SSW
SW
WSW
W
WNW
NW
NNWN
0% 5% 10% 15%
NNE
NE
ENE
E
ESE
SE
SSES
SSW
SW
WSW
W
WNW
NW
NNWN
0% 5% 10% 15%
NNE
NE
ENE
E
ESE
SE
SSES
SSW
SW
WSW
W
WNW
NW
NNWN
0% 5% 10% 15%
NNE
NE
ENE
E
ESE
SE
SSES
SSW
SW
WSW
W
WNW
NW
NNWN
0% 5% 10% 15%
NNE
NE
ENE
E
ESE
SE
SSES
SSW
SW
WSW
W
WNW
NW
NNWN
0% 5% 10% 15%
Dec04-Feb05
Spring Summer Fall Winter
Mar05-May05 Jun05-Aug05 Sep05-Nov05
Dec05-Feb06 Mar06-May06 Jun06-Aug06 Sep06-Nov06
7% 11% 14% 12%
6% 12% 14% 12% 1481
Figure B-1 (continued). Seasonal wind roses for non-calm hours, observations at Detroit Metropolitan 1482 Wayne County Airport (DTW). Calms (wind speeds less than 2 mph) are listed to the lower-left of each 1483 wind rose. 1484

PM2.5 High Concentration Days over Southeast Michigan
Washington University in St. Louis April 23, 2008 57
NNE
NE
ENE
E
ESE
SE
SSES
SSW
SW
WSW
W
WNW
NW
NNWN
0% 5% 10% 15%
1999
11%
NNE
NE
ENE
E
ESE
SE
SSES
SSW
SW
WSW
W
WNW
NW
NNWN
0% 5% 10% 15%
2000
9%
NNE
NE
ENE
E
ESE
SE
SSES
SSW
SW
WSW
W
WNW
NW
NNWN
0% 5% 10% 15%
2001
9%
NNE
NE
ENE
E
ESE
SE
SSES
SSW
SW
WSW
W
WNW
NW
NNWN
0% 5% 10% 15%
2002
10%
NNE
NE
ENE
E
ESE
SE
SSES
SSW
SW
WSW
W
WNW
NW
NNWN
0% 5% 10% 15%
1999
19%
NNE
NE
ENE
E
ESE
SE
SSES
SSW
SW
WSW
W
WNW
NW
NNWN
0% 5% 10% 15%
2000
9%
NNE
NE
ENE
E
ESE
SE
SSES
SSW
SW
WSW
W
WNW
NW
NNWN
0% 5% 10% 15%
2001
9%
NNE
NE
ENE
E
ESE
SE
SSES
SSW
SW
WSW
W
WNW
NW
NNWN
0% 5% 10% 15%
2002
10%
Valid Network DaysAll Days
NNE
NE
ENE
E
ESE
SE
SSES
SSW
SW
WSW
W
WNW
NW
NNWN
0% 5% 10% 15%
2003
11%
NNE
NE
ENE
E
ESE
SE
SSES
SSW
SW
WSW
W
WNW
NW
NNWN
0% 5% 10% 15%
2004
10%
NNE
NE
ENE
E
ESE
SE
SSES
SSW
SW
WSW
W
WNW
NW
NNWN
0% 5% 10% 15%
2005
11%
NNE
NE
ENE
E
ESE
SE
SSES
SSW
SW
WSW
W
WNW
NW
NNWN
0% 5% 10% 15%
2006
11%
NNE
NE
ENE
E
ESE
SE
SSES
SSW
SW
WSW
W
WNW
NW
NNWN
0% 5% 10% 15%
2003
11%
NNE
NE
ENE
E
ESE
SE
SSES
SSW
SW
WSW
W
WNW
NW
NNWN
0% 5% 10% 15%
2004
10%
NNE
NE
ENE
E
ESE
SE
SSES
SSW
SW
WSW
W
WNW
NW
NNWN
0% 5% 10% 15%
2005
11%
NNE
NE
ENE
E
ESE
SE
SSES
SSW
SW
WSW
W
WNW
NW
NNWN
0% 5% 10% 15%
2006
11%
Valid Network DaysAll Days
1485
NNE
NE
ENE
E
ESE
SE
SSES
SSW
SW
WSW
W
WNW
NW
NNWN
0% 5% 10% 15%
2007
13%
NNE
NE
ENE
E
ESE
SE
SSES
SSW
SW
WSW
W
WNW
NW
NNWN
0% 5% 10% 15%
2007
13% 1486
1487 1488
Figure B-2. Annual wind roses for non-calm hours, observations at Detroit Metropolitan Wayne County 1489 Airport (DTW) for all days and valid network days. Calms (wind speeds less than 2 mph) are listed to the 1490 lower-left of each wind rose. 1491
>2 - 4>4 - 8>8 - 16>16
WS (mph)

PM2.5 High Concentration Days over Southeast Michigan
Washington University in St. Louis April 23, 2008 58
APPENDIX C: SITE-SPECIFIC HIGH PM DAYS NOT OBSERVED THROUGHOUT 1492 THE NETWORK, 1999-2006 1493 1494
Dearborn E 7 Mile Linwood Livonia Luna Pier Oak Park Port Huron SWHS Wyandotte07/05/1999 (2) 05/12/2000 (1) 11/18/1999 (2) 12/17/2000 (1,2) 05/10/2001 (1,2) 11/25/2006 (1) 05/07/2005 (1,2) 09/27/1999 (2) 07/05/1999 (2)01/01/2000 (2) 04/18/2004 (1,2) 12/08/1999 (2) 03/12/2002 (2) 07/18/2005 (1,2) 07/17/2000 (1,2) 05/06/2000 (1)01/31/2000 (2) 01/28/2005 (1,2) 01/02/2000 (2) 04/02/2002 (1,2) 02/09/2001 (1,2) 05/12/2000 (1)02/24/2000 (1,2) 05/07/2005 (1,2) 02/24/2000 (1,2) 11/02/2003 (1) 05/10/2001 (1,2) 12/26/2000 (1,2)03/07/2000 (1,2) 08/23/2001 (1) 01/10/2001 (1,2)05/06/2000 (1,2) 02/14/2003 (1) 01/28/2001 (1)05/12/2000 (1) 08/25/2003 (1) 07/09/2001 (1)06/08/2000 (1,2) 11/02/2003 (1) 08/23/2001 (1)09/09/2000 (1) 12/29/2003 (1,2) 11/28/2002 (1,2)12/23/2000 (1,2) 03/25/2004 (1,2) 03/19/2003 (1,2)01/10/2001 (1,2) 04/30/2004 (1) 08/25/2003 (1)01/28/2001 (1) 02/16/2006 (1) 02/06/2004 (1)03/02/2001 (1,2) 12/13/2006 (1) 07/18/2005 (1)08/23/2001 (1) 12/06/2005 (1,2)12/27/2001 (1,2) 12/21/2005 (1,2)01/05/2002 (2) 02/10/2006 (1)01/08/2002 (1,2)02/07/2002 (1,2)03/06/2002 (1)11/13/2002 (1,2)11/28/2002 (1,2)01/18/2003 (1,2)02/08/2003 (1,2)02/14/2003 (1)02/20/2003 (1,2)04/15/2003 (1,2)11/11/2003 (1,2)03/25/2004 (1,2)04/30/2004 (1)10/15/2004 (1)12/02/2004 (1,2)03/29/2005 (1,2)04/19/2005 (1,2)07/18/2005 (1,2)10/31/2005 (1,2)12/06/2005 (1,2)02/16/2006 (1)09/08/2006 (1,2)12/13/2006 (1,2) 1495 * Ann Arbor, FIA/Lafayette and Newberry excluded from the analysis. 1496 * No high PM days meeting these criteria for New Haven and Ypsilanti. 1497 (1) denotes site concentration >30 μg/m3 while Allen Park <25 μg/m3. 1498 (2) denotes site concentration >30 μg/m3 while network-wide base <25 μg/m3 (limited to those days which are valid 1499 network days) (red bars in Figure 4-9). 1500

PM2.5 High Concentration Days over Southeast Michigan
Washington University in St. Louis April 23, 2008 59
APPENDIX D: CPF AND NWR PLOTS14 1501
PM2.5 mass concentrations (both absolute and excess with respect to a reference site) were 1502 examined using Conditional Probability Function (CPF) plots and 1-D Nonparametric Wind 1503 Regression (NWR) plots. Kim and Hopke (2004) compared and contrasted the CPF and NWR 1504 methodologies and demonstrated that they provide complementary and largely consistent 1505 information. CPF plots provide insights into the bearing of emission sources impacting the 1506 monitoring site from a perspective that is not biased by the prevailing wind patterns. The plots 1507 address the question: “for the ensemble of hourly winds from a given direction, what fraction of 1508 these hours corresponds to high concentration days?”. The threshold for defining a “high 1509 concentration day” is typically chosen as the top 25th percentile of the concentration distribution 1510 (either absolute concentrations or mass fractions). For example, Figure D-1(a) shows the CPF 1511 plot for the PMF-resolved copper factor at the Springfield site in Chicago. Nearly 70% of the 1512 hours with winds from 180°N coincided with a daily contribution in the top quartile of the 1513 concentration distribution for the copper factor contributions. This pattern suggests a copper 1514 source south of the monitoring site but it does not address the magnitude of the impacts which 1515 depend on source strength, dispersion characteristics and the frequency of winds from this 1516 direction. 1517
One dimensional nonparametric wind regression estimates the expected value of concentration as 1518 a function of wind direction (Kim and Hopke, 2004). It is similar to a pollution rose but with 1519 more robust mathematical support. NWR results can be multiplied by the wind direction 1520 frequency distribution to determine the contribution of each wind direction to average PM mass. 1521 Figure D-1(b) shows the NWR plot for the PMF-resolved copper factor at the Springfield site in 1522 Chicago. Factor contributions (red line) for winds from 180°N are three times greater than the 1523 study-average factor contribution (pink circle). In aggregate the CPF and NWR plots provide 1524 insights into both the location of emission sources and their impacts. 1525
1526 0
45
90
135
180
225
270
315
15
30
60
75
105
120
150
165195
210
240
255
285
300
330
345
0 0.2 0.4 0.6 0.80.0 0.1 0.2 0.3 0.4 0.5 0.6 0.7 0.8
9
60
30
0
330
300
270
240
210
180
150
120
(a) (b)
1527
Figure D-1. Surface wind analyses for the PMF-resolved copper factor at the Springfield site in Chicago: 1528 (a) conditional probability function plot for the top quartile of absolute contributions; and (b) 1-D 1529 nonparametric wind regression plot (radial units in μg/m3) where the red line denotes the observed 1530 contributions from each bearing and the pink circle denotes the study-average contribution. 1531 14 Adapted from Wade et al. (2008).

PM2.5 High Concentration Days over Southeast Michigan
Washington University in St. Louis April 23, 2008 60
APPENDIX E: 1-D NWR ON PM2.5 EXCESS MASS 1532
-1.0
-0.5
0.0
0.5
1.0
1.5
2.0
2.5
3.0
000 030 060 090 120 150 180 210 240 270 300 330 360
wind direction, oN
1-D
NW
R e
xces
s m
ass
expe
cted
con
cent
ratio
n, u
g/m
3 Allen Park, 2000-2003
Allen Park, 2004-2006
[2004-2006] minus [2000-2003]
-1.0
-0.5
0.0
0.5
1.0
1.5
2.0
2.5
3.0
000 030 060 090 120 150 180 210 240 270 300 330 360
wind direction, oN
1-D
NW
R e
xces
s m
ass
expe
cted
con
cent
ratio
n, u
g/m
3 Allen Park, 2000-2003
Allen Park, 2004-2006
[2004-2006] minus [2000-2003]
-2
0
2
4
6
8
10
000 030 060 090 120 150 180 210 240 270 300 330 360
wind direction, oN
1-D
NW
R e
xces
s m
ass
expe
cted
con
cent
ratio
n, μ
g/m
3 Dearborn, 2000-2003
Dearborn, 2004-2006
[2004-2006] minus [2000-2003]
-2
0
2
4
6
8
10
000 030 060 090 120 150 180 210 240 270 300 330 360
wind direction, oN
1-D
NW
R e
xces
s m
ass
expe
cted
con
cent
ratio
n, μ
g/m
3 Dearborn, 2000-2003
Dearborn, 2004-2006
[2004-2006] minus [2000-2003]
-2.0
-1.5
-1.0
-0.5
0.0
0.5
1.0
1.5
2.0
2.5
3.0
000 030 060 090 120 150 180 210 240 270 300 330 360
wind direction, oN
1-D
NW
R s
ourc
e ap
porti
onm
ent o
n ex
cess
mas
s, u
g/m
3 E. 7 Mile, 2000-2003
E. 7 Mile, 2004-2006
[2004-2006] minus [2000-2003]
-2.0
-1.5
-1.0
-0.5
0.0
0.5
1.0
1.5
2.0
2.5
3.0
000 030 060 090 120 150 180 210 240 270 300 330 360
wind direction, oN
1-D
NW
R s
ourc
e ap
porti
onm
ent o
n ex
cess
mas
s, u
g/m
3 E. 7 Mile, 2000-2003
E. 7 Mile, 2004-2006
[2004-2006] minus [2000-2003]
-2.0
-1.5
-1.0
-0.5
0.0
0.5
1.0
1.5
2.0
2.5
3.0
000 030 060 090 120 150 180 210 240 270 300 330 360
wind direction, oN
1-D
NW
R e
xces
s m
ass
expe
cted
con
cent
ratio
n, u
g/m
3 Linwood, 2000-2003
Linwood, 2004-2006
[2004-2006] minus [2000-2003]
ALL DATA CENSORED DATA
-2.0
-1.5
-1.0
-0.5
0.0
0.5
1.0
1.5
2.0
2.5
3.0
000 030 060 090 120 150 180 210 240 270 300 330 360
wind direction, oN
1-D
NW
R e
xces
s m
ass
expe
cted
con
cent
ratio
n, u
g/m
3
Linwood, 2000-2003
Linwood, 2004-2006
[2004-2006] minus [2000-2003]
1533
Figure E-1 (continued). 1-D NWR results for PM2.5 excess mass relative to the network-wide base for 1534 all network days (left column) and censored to remove extreme values as defined in footnote #12 (right 1535 column). The blue line is the change between 2004-2006 and 2000-2003 and the error bands are 95% 1536 confidence intervals. 1537

PM2.5 High Concentration Days over Southeast Michigan
Washington University in St. Louis April 23, 2008 61
ALL DATA CENSORED DATA
-1.5
-1.0
-0.5
0.0
0.5
1.0
1.5
2.0
2.5
000 030 060 090 120 150 180 210 240 270 300 330 360
wind direction, oN
1-D
NW
R e
xces
s m
ass
expe
cted
con
cent
ratio
n, u
g/m
3 Livonia, 2000-2003
Livonia, 2004-2006
[2004-2006] minus [2000-2003]
-1.5
-1.0
-0.5
0.0
0.5
1.0
1.5
2.0
2.5
000 030 060 090 120 150 180 210 240 270 300 330 360
wind direction, oN
1-D
NW
R e
xces
s m
ass
expe
cted
con
cent
ratio
n, u
g/m
3 Livonia, 2000-2003
Livonia, 2004-2006
[2004-2006] minus [2000-2003]
-1.5
-1.0
-0.5
0.0
0.5
1.0
1.5
2.0
000 030 060 090 120 150 180 210 240 270 300 330 360
wind direction, oN
1-D
NW
R e
xces
s m
ass
expe
cted
con
cent
ratio
n, u
g/m
3 Luna Pier, 2000-2003
Luna Pier, 2004-2006
[2004-2006] minus [2000-2003]
-1.5
-1.0
-0.5
0.0
0.5
1.0
1.5
000 030 060 090 120 150 180 210 240 270 300 330 360
wind direction, oN
1-D
NW
R e
xces
s m
ass
expe
cted
con
cent
ratio
n, u
g/m
3 Luna Pier, 2000-2003
Luna Pier, 2004-2006
[2004-2006] minus [2000-2003]
-3.5
-3.0
-2.5
-2.0
-1.5
-1.0
-0.5
0.0
0.5
1.0
000 030 060 090 120 150 180 210 240 270 300 330 360
wind direction, oN
1-D
NW
R e
xces
s m
ass
expe
cted
con
cent
ratio
n, u
g/m
3
New Haven, 2000-2003
New Haven, 2004-2006
[2004-2006] minus [2000-2003]
-3.50
-3.00
-2.50
-2.00
-1.50
-1.00
-0.50
0.00
0.50
1.00
000 030 060 090 120 150 180 210 240 270 300 330 360
wind direction, oN
1-D
NW
R e
xces
s m
ass
expe
cted
con
cent
ratio
n, u
g/m
3 New Haven, 2000-2003
New Haven, 2004-2006
[2004-2006] minus [2000-2003]
-1.5
-1.0
-0.5
0.0
0.5
1.0
1.5
2.0
2.5
000 030 060 090 120 150 180 210 240 270 300 330 360
wind direction, oN
1-D
NW
R e
xces
s m
ass
expe
cted
con
cent
ratio
n, u
g/m
3 Oak Park, 2000-2003
Oak Park, 2004-2006
[2004-2006] minus [2000-2003]
-1.5
-1.0
-0.5
0.0
0.5
1.0
1.5
2.0
2.5
000 030 060 090 120 150 180 210 240 270 300 330 360
wind direction, oN
1-D
NW
R e
xces
s m
ass
expe
cted
con
cent
ratio
n, u
g/m
3 Oak Park, 2000-2003
Oak Park, 2004-2006
[2004-2006] minus [2000-2003]
1538
Figure E-1 (continued). 1-D NWR results for PM2.5 excess mass relative to the network-wide base for 1539 all network days (left column) and censored to remove extreme values as defined in footnote #12 (right 1540 column). The blue line is the change between 2004-2006 and 2000-2003 and the error bands are 95% 1541 confidence intervals. 1542

PM2.5 High Concentration Days over Southeast Michigan
Washington University in St. Louis April 23, 2008 62
ALL DATA CENSORED DATA
-3.0
-2.5
-2.0
-1.5
-1.0
-0.5
0.0
0.5
1.0
1.5
2.0
000 030 060 090 120 150 180 210 240 270 300 330 360
wind direction, oN
1-D
NW
R e
xces
s m
ass
expe
cted
con
cent
ratio
n, u
g/m
3Port Huron, 2000-2003
Port Huron, 2004-2006
[2004-2006] minus [2000-2003]
-3.0
-2.5
-2.0
-1.5
-1.0
-0.5
0.0
0.5
1.0
1.5
2.0
000 030 060 090 120 150 180 210 240 270 300 330 360
wind direction, oN
1-D
NW
R e
xces
s m
ass
expe
cted
con
cent
ratio
n, u
g/m
3
Port Huron, 2000-2003
Port Huron, 2004-2006
[2004-2006] minus [2000-2003]
-1
0
1
2
3
4
5
000 030 060 090 120 150 180 210 240 270 300 330 360
wind direction, oN
1-D
NW
R e
xces
s m
ass
expe
cted
con
cent
ratio
n, μ
g/m
3 SW High Sch., 2000-2003
SW High Sch., 2004-2006
[2004-2006] minus [2000-2003]
-1
0
1
2
3
4
5
000 045 090 135 180 225 270 315 360
wind direction, oN
1-D
NW
R e
xces
s m
ass
expe
cted
con
cent
ratio
n, u
g/m
3 SW High Sch., 2000-2003
SW High Sch., 2004-2006
[2004-2006] minus [2000-2003]
-1
0
1
2
3
4
5
000 030 060 090 120 150 180 210 240 270 300 330 360
wind direction, oN
1-D
NW
R e
xces
s m
ass
expe
cted
con
cent
ratio
n, μ
g/m
3 Wyandotte, 2000-2003
Wyandotte, 2004-2006
[2004-2006] minus [2000-2003]
-2.0
-1.5
-1.0
-0.5
0.0
0.5
1.0
1.5
2.0
2.5
3.0
000 030 060 090 120 150 180 210 240 270 300 330 360
wind direction, oN
1-D
NW
R e
xces
s m
ass
expe
cted
con
cent
ratio
n, u
g/m
3 Ypsilanti, 2000-2003
Ypsilanti, 2004-2006
[2004-2006] minus [2000-2003]
1543
Figure E-1 (continued). 1-D NWR results for PM2.5 excess mass relative to the network-wide base for 1544 all network days (left column) and censored to remove extreme values as defined in footnote #12 (right 1545 column). The blue line is the change between 2004-2006 and 2000-2003 and the error bands are 95% 1546 confidence intervals. 1547

MICHIGAN DEPARTMENT OF ENVIRONMENTAL QUALITY AIR QUALITY DIVISION
April 19, 2007
PERMIT TO INSTALL 182-05B
ISSUED TO SEVERSTAL NORTH AMERICA, INC
LOCATED AT 3001 Miller Road
Dearborn, Michigan
IN THE COUNTY OF Wayne
STATE REGISTRATION NUMBER A8640
The Air Quality Division has approved this Permit to Install, pursuant to the delegation of authority from the Michigan Department of Environmental Quality. This permit is hereby issued in accordance with and subject to Section 5505(1) of Article II, Chapter I, Part 55, Air Pollution Control, of the Natural Resources and Environmental Protection Act, 1994 PA 451, as amended. Pursuant to Air Pollution Control Rule 336.1201(1), this permit constitutes the permittee’s authority to install the identified emission unit(s) in accordance with all administrative rules of the Department and the attached conditions. Operation of the emission unit(s) identified in this Permit to Install is allowed pursuant to Rule 336.1201(6).
DATE OF RECEIPT OF ALL INFORMATION REQUIRED BY RULE 203:
January 11, 2007
DATE PERMIT TO INSTALL APPROVED:
April 19, 2007 SIGNATURE:
G. Vinson Hellwig
DATE PERMIT VOIDED:
SIGNATURE:
DATE PERMIT REVOKED:
SIGNATURE:

Severstal North America, Inc April 19, 2007 Permit No. 182-05B Page 1 of 83
PERMIT TO INSTALL Table of Contents
Section Page
Alphabetical Listing of Common Abbreviations / Acronyms ................................................................................ 2
General Conditions ................................................................................................................................................. 3
Special Conditions .................................................................................................................................................. 5
Emission Unit Identification ................................................................................................................................... 5
Flexible Group Identification.................................................................................................................................. 6
TABLE E-01.01 COAL HANDLING EQUIPMENT............................................................................................ 7
TABLE E-01.02 B BLAST FURNACE CAST HOUSE OPERATIONS........................................................... 10
TABLE E-01.03 B BLAST FURNACE STOVE ................................................................................................ 17
TABLE E-01.04 C BLAST FURNACE CAST HOUSE OPERATIONS........................................................... 19
TABLE E-01.05 C BLAST FURNACE STOVE ................................................................................................ 28
TABLE E-01.06 RELADLING - BOF ................................................................................................................ 31
TABLE E-01.07 DESULFURIZATION OPERATION...................................................................................... 36
TABLE E-01.08 BASIC OXYGEN FURNACE................................................................................................. 42
TABLE E-01.09 BOF DESUFURIZATION BY-PRODUCTS ‘DESULF’ PROCESS ..................................... 49
TABLE E-01.10 LADLE REFINING FACILITY No. 1 .................................................................................... 51
TABLE E-01.11 LADLE REFINING FACILITY No. 2 .................................................................................... 55
TABLE E-01.12 ANNEALING FURNACES..................................................................................................... 60
TABLE F-01.01 B & C BLAST FURNACE CAST HOUSE OPERATIONS ................................................... 62
TABLE F-01.02 B AND C BLAST FURNACE STOVES................................................................................. 64
TABLE F-01.03 BASIC OXYGEN FURNACE (BOF)/RELADLING SOUTH & NORTH BOF.................... 66
TABLE F-01.04 SLAB REHEAT FURNACES 1, 2, & 3 AT HOT STRIP MILL BUILDING........................ 73
TABLE F-01.05 FGFACILITY........................................................................................................................... 75
Appendix 1.3.1 Monitoring Continuous Emission Monitoring System (CEMS) Requirements......................... 76
Appendix 1.3.2 Continuous Opacity Monitoring System (COMS) Requirements.............................................. 77
Appendix 1.7. Emission Calculations .................................................................................................................. 79

Severstal North America, Inc April 19, 2007 Permit No. 182-05B Page 2 of 83
Common Abbreviations / Acronyms Common Acronyms Pollutant/Measurement Abbreviations
AQD Air Quality Division Btu British Thermal Unit ANSI American National Standards Institute °C Degrees Celsius BACT Best Available Control Technology CO Carbon Monoxide CAA Clean Air Act dscf Dry standard cubic foot CEM Continuous Emission Monitoring dscm Dry standard cubic meter CFR Code of Federal Regulations °F Degrees Fahrenheit COM Continuous Opacity Monitoring gr Grains EPA Environmental Protection Agency Hg Mercury EU Emission Unit hr Hour FG Flexible Group H2S Hydrogen Sulfide GACS Gallon of Applied Coating Solids hp Horsepower GC General Condition lb Pound HAP Hazardous Air Pollutant m Meter HVLP High Volume Low Pressure * mg Milligram ID Identification mm Millimeter LAER Lowest Achievable Emission Rate MM Million MACT Maximum Achievable Control Technology MW Megawatts MAERS Michigan Air Emissions Reporting System NOx Oxides of Nitrogen MAP Malfunction Abatement Plan PM Particulate Matter MDEQ Michigan Department of Environmental Quality PM-10 Particulate Matter less than 10 microns diameter MIOSHA Michigan Occupational Safety & Health
Administration pph Pound per hour
MSDS Material Safety Data Sheet ppm Parts per million NESHAP National Emission Standard for Hazardous Air
Pollutants ppmv Parts per million by volume
NSPS New Source Performance Standards ppmw Parts per million by weight NSR New Source Review psia Pounds per square inch absolute PS Performance Specification psig Pounds per square inch gauge PSD Prevention of Significant Deterioration scf Standard cubic feet PTE Permanent Total Enclosure sec Seconds PTI Permit to Install SO2 Sulfur Dioxide RACT Reasonable Available Control Technology THC Total Hydrocarbons ROP Renewable Operating Permit tpy Tons per year SC Special Condition Number µg Microgram SCR Selective Catalytic Reduction VOC Volatile Organic Compounds SRN State Registration Number yr Year TAC Toxic Air Contaminant Hg Mercury VE Visible Emissions Mn Manganese Cr Chromium Pb Lead * For High Volume Low Pressure (HVLP) applicators, the pressure measured at the HVLP gun air cap shall not exceed ten (10) pounds per square inch gauge (psig).

Severstal North America, Inc April 19, 2007 Permit No. 182-05B Page 3 of 83
GENERAL CONDITIONS 1. The process or process equipment covered by this permit shall not be reconstructed, relocated, or
modified, unless a Permit to Install authorizing such action is issued by the Department, except to the extent such action is exempt from the Permit to Install requirements by any applicable rule. [R336.1201(1)]
2. If the installation, construction, reconstruction, relocation, or modification of the equipment for which
this permit has been approved has not commenced within 18 months, or has been interrupted for 18 months, this permit shall become void unless otherwise authorized by the Department. Furthermore, the permittee or the designated authorized agent shall notify the Department via the Supervisor, Permit Section, Air Quality Division, Michigan Department of Environmental Quality, P.O. Box 30260, Lansing, Michigan 48909, if it is decided not to pursue the installation, construction, reconstruction, relocation, or modification of the equipment allowed by this Permit to Install. [R336.1201(4)]
3. If this Permit to Install is issued for a process or process equipment located at a stationary source that is
not subject to the Renewable Operating Permit program requirements pursuant to R336.1210, operation of the process or process equipment is allowed by this permit if the equipment performs in accordance with the terms and conditions of this Permit to Install. [R336.1201(6)(b)]
4. The Department may, after notice and opportunity for a hearing, revoke this Permit to Install if evidence
indicates the process or process equipment is not performing in accordance with the terms and conditions of this permit or is violating the Department’s rules or the Clean Air Act. [R336.1201(8), Section 5510 of Act 451, PA 1994]
5. The terms and conditions of this Permit to Install shall apply to any person or legal entity that now or
hereafter owns or operates the process or process equipment at the location authorized by this Permit to Install. If the new owner or operator submits a written request to the Department pursuant to R336.1219 and the Department approves the request, this permit will be amended to reflect the change of ownership or operational control. The request must include all of the information required by subrules (1)(a), (b), and (c) of R336.1219. The written request shall be sent to the District Supervisor, Air Quality Division, Michigan Department of Environmental Quality. [R336.1219]
6. Operation of this equipment shall not result in the emission of an air contaminant which causes injurious
effects to human health or safety, animal life, plant life of significant economic value, or property, or which causes unreasonable interference with the comfortable enjoyment of life and property. [R336.1901]
7. The permittee shall provide notice of an abnormal condition, start-up, shutdown, or malfunction that
results in emissions of a hazardous or toxic air pollutant which continue for more than one hour in excess of any applicable standard or limitation, or emissions of any air contaminant continuing for more than two hours in excess of an applicable standard or limitation, as required in Rule 912, to the Department. The notice shall be provided not later than two business days after start-up, shutdown, or discovery of the abnormal condition or malfunction. Written reports, if required, must be filed with the Department within 10 days after the start-up or shutdown occurred, within 10 days after the abnormal conditions or malfunction has been corrected, or within 30 days of discovery of the abnormal condition or malfunction, whichever is first. The written reports shall include all of the information required in Rule 912(5). [R336.1912]
8. Approval of this permit does not exempt the permittee from complying with any future applicable
requirements which may be promulgated under Part 55 of 1994 PA 451, as amended or the Federal Clean Air Act.

Severstal North America, Inc April 19, 2007 Permit No. 182-05B Page 4 of 83
9. Approval of this permit does not obviate the necessity of obtaining such permits or approvals from other
units of government as required by law. 10. Operation of this equipment may be subject to other requirements of Part 55 of 1994 PA 451, as
amended and the rules promulgated thereunder. 11. Except as provided in subrules (2) and (3) or unless the special conditions of the Permit to Install
include an alternate opacity limit established pursuant to subrule (4) of R336.1301, the permittee shall not cause or permit to be discharged into the outer air from a process or process equipment a visible emission of density greater than the most stringent of the following. The grading of visible emissions shall be determined in accordance with R336.1303. [R336.1301]
a) A six-minute average of 20 percent opacity, except for one six-minute average per hour of not
more than 27 percent opacity.
b) A visible emission limit specified by an applicable federal new source performance standard.
c) A visible emission limit specified as a condition of this permit to install. 12. Collected air contaminants shall be removed as necessary to maintain the equipment at the required
operating efficiency. The collection and disposal of air contaminants shall be performed in a manner so as to minimize the introduction of contaminants to the outer air. Transport of collected air contaminants in Priority I and II areas requires the use of material handling methods specified in R336.1370(2). [R336.1370]
13. The Department may require the permittee to conduct acceptable performance tests, at the permittee’s
expense, in accordance with R336.2001 and R336.2003, under any of the conditions listed in R336.2001. [R336.2001]

Severstal North America, Inc April 19, 2007 Permit No. 182-05B Page 5 of 83
SPECIAL CONDITIONS
Emission Unit Identification
Unit/Group ID Emission Unit/Process
Group Description
Installation/ Modification
Date
Control Device Description
Stack/ Vent ID Requirement Table No.
EUCOALHANDLING Raw coal silo, pulverized coal silo, rail car unloading shed, coal pulverizer, & two 25 MMBtu/hr natural gas-fired heaters
4 Baghouses NA E-01.01
EUBBFCASTHOUSE B Blast furnace cast house operations
1/1/1922
Baghouse ROOF MONITORS, SVBFCE
E-01.02 F-01.01
EUBFCESTOVE Blast Furnace B stove
1/1/1922 Low-NOx technology
SVBFCESTOVE E-01.03 F-01.02
EUCBFCASTHOUSE C Blast furnace cast house operations
1/1/48 Baghouse ROOF MONITORS, SVCFCE
E-01.04 F-01.01
EUCFCESTOVE Blast Furnace C stove
1/1/48 Low-NOx technology
SVCFCESTOVE E-01.05 F-01.02
EURELADLINGBOF Reladling south and north - BOF
1/1/75 Baghouse SVRELADLEBAG, SVBOFBH
E-01.06 F-01.03
EUDESULFURIZATION Desulfurization operation
1/1/81 Baghouse SVDESULF E-01.07
EUBOF Basic oxygen furnace (BOF), 2 vessels
1/1/64 Electrostatic precipitator, baghouse
SVBOFESP, SVBOFBH
E-01.08 F-01.03
EUDESULFWATERINGSTATION
BOF desulfurization by-product material “desulf” watering station located at the south end of the BOF building. Levy digs the desulf materials with a front-end loader, brings them to an open area for
4/17/95 NA NA E-01.09

Severstal North America, Inc April 19, 2007 Permit No. 182-05B Page 6 of 83
Unit/Group ID Emission Unit/Process
Group Description
Installation/ Modification
Date
Control Device Description
Stack/ Vent ID Requirement Table No.
cooling using water spray and for fugitive dust control. After thorough cooling, Levy loads the materials into trucks for processing off site.
EULADLEREFINE1 No. 1 Ladle refining facility
1/1/90 Baghouse SVLADLEREFINE1
E-01.10
EULADLEREFINE2 No. 2 Ladle refining facility
1/1/95 Baghouse SVLADLEREFINE2
E-01.11
EUANNEALFURNACES 34 annealing furnaces
NA NA E-01.12
EUSREHEATFURNACE1 Slab reheat furnace 1
1/1/79 NA SVHSMREHEATFCE11 SVHSMREHEATFCE21
F-01.04
EUSREHEATFURNACE2 Slab reheat furnace 2
1/1/74 NA SVHSMREHEATFCE21 SVHSMREHEATFCE22
F-01.04
EUSREHEATFURNACE3 Slab reheat furnace 3
1/1/74 NA SVHSMREHEATFCE31 SVHSMREHEATFCE32
F-01.04
Flexible Group Identification
Flexible Grouping ID Emission Unit/Process Groups Included in Flexible Grouping
Requirement Table No.
FGB&CCASTHOUSES EUBBFCASTHOUSE, EUCBFCASTHOUSE F-01.01 FGB&CSTOVES EUBFCESTOVE, EUCFCESTOVE F-01.02 FGBOFSHOP EUBOF, EURELADLINGBOF F-01.03 FGSREHEATFURNACE123 EUSREHEATFURNACE1, EUSREHEATFURNACE2,
EUSREHEATFURNACE3 F-01.04
FGFACILITY All equipment at the stationary source including equipment covered by other permits, grandfathered equipment and exempt equipment.
F-01.05

Severstal North America, Inc April 19, 2007 Permit No. 182-05B Page 7 of 83
TABLE E-01.01 COAL HANDLING EQUIPMENT EMISSION UNIT/PROCESS GROUP REQUIREMENTS EMISSION GROUP EUCOALHANDLING Flexible Grouping ID NA I. DESIGN PARAMETERS A. Pollution Control Equipment
4 Baghouses
B. Stack/Vent Parameters NA Stack/Vent ID a. Minimum
Height (feet)
b. Maximum Exhaust Dimension
(inches)
c. Temp.
(°F)
d. Air Flow Rate
(acfm)
Applicable Requirement
SVTRACKHOPPER NA NA NA 30,000 NA SVRAWCOALSILO NA NA NA 1,800 NA SVFINECOALSILO NA NA NA 6,200 NA SVPULVERIZER NA NA NA 16,000 NA C. Other Design Parameters NA II. MATERIAL USAGE/EMISSION LIMITS
A. Material Maximum Usage Rate Natural gas 1. 214.7 MMscf per 12-month rolling time period in the pulverizer hot gas
generator. (40 CFR 52.21(b)(3)) 2. 214.7 MMscf per 12-month rolling time period in the rail car shed
heater. (40 CFR 52.21(b)(3)) B. Pollutant Maximum Emission Limit
1. PM 1. 0.005 gr/dscf from the track hopper baghouse (40 CFR 52.21(b)(3), R336.1331(c))
2. 0.005 gr/dscf from the raw coal silo baghouse (40 CFR 52.21(b)(3), R336.1331(c))
3. 0.005 gr/dscf from the fine coal silo baghouse (40 CFR 52.21(b)(3), R336.1331(c))
4. 0.005 gr/dscf from the coal pulverizer baghouse (40 CFR 52.21(b)(3), R336.1331(c))
2. PM10 1. 0.005 gr/dscf from the track hopper baghouse (R336.1205(1)(a) & (b)) 2. 0.005 gr/dscf from the raw coal silo baghouse (R336.1205(1)(a) &(b)) 3. 0.005 gr/dscf from the fine coal silo baghouse (R336.1205(1)(a) &(b)) 4. 0.005 gr/dscf from the coal pulverizer baghouse (R336.1205(1)(a) &
(b)) 3. Visible emissions 1. 10% opacity from the track hopper baghouse (R336.1301(1)(c))
2. 10% opacity from raw coal silo baghouse (R336.1301(1)(c)) 3. 10% opacity from the fine coal silo baghouse (R336.1301(1)(c)) 4. 10% opacity from the coal pulverizer baghouse (R336.1301(1)(c))

Severstal North America, Inc April 19, 2007 Permit No. 182-05B Page 8 of 83
TABLE E-01.01 COAL HANDLING EQUIPMENT EMISSION UNIT/PROCESS GROUP REQUIREMENTS III. COMPLIANCE EVALUATION Records of all of the following shall be maintained on file for a period of 5 years.
A. MONITORING/RECORDKEEPING 1. Continuous Emission
Monitoring (CEM) System and Recordkeeping
NA
2. Process Monitoring System and Recordkeeping
NA
3. Other Monitoring and/or Recordkeeping
1. The permittee shall perform a Method 9 certified visible emission observation of each baghouse at least once a month during processing activity. The permittee shall initiate corrective action upon observation of visible emissions in excess of the applicable visible emission limitation and shall keep a written record of each required observation and corrective action taken. (R336.1910)
2. Permittee shall periodically inspect each baghouse to determine the
operational and physical condition of the baghouse at least once per month, and immediately after observing visible emissions in excess of the applicable limitation. Each baghouse shall be inspected as necessary immediately after a malfunction or failure of the baghouse or the process equipment to determine the reason for the malfunction or failure. Written records of each inspection and corrective action taken, if any, shall be maintained. (R336.1910)
3. The permittee shall keep, in a satisfactory manner, monthly and
previous 12-month fuel usage records for the rail car shed heater and the pulverizer hot gas generator. The permittee shall keep all records on file at the facility for a period of at least five years and make them available to the Department upon request. (R336.1205(1)(a) & (b), 40 CFR 52.21(b)(3)
B. TESTING/RECORDKEEPING 1. Parameter to be Tested/
Recorded NA
2. Method/Analysis NA 3. Frequency and Schedule of
Testing/Recordkeeping NA
IV. REPORTING Reports and Schedules NA V. OPERATIONAL PARAMETERS 1. The permittee shall not operate the coal pulverizer unless the baghouse is installed, maintained, and operated
in a satisfactory manner. (R336.1205(1)(a) & (b), R336.1301, R336.1331(c), R336.1910, 40 CFR 52.21(b)(3))
2. The permittee shall not load coal into the raw coal silo unless the baghouse is installed, maintained, and
operated in a satisfactory manner. (R336.1205(1)(a) & (b), R336.1301, R336.1331(c), R336.1910, 40 CFR 52.21(b)(3))

Severstal North America, Inc April 19, 2007 Permit No. 182-05B Page 9 of 83
TABLE E-01.01 COAL HANDLING EQUIPMENT EMISSION UNIT/PROCESS GROUP REQUIREMENTS 3. The permittee shall not load coal into the fine coal silo unless the baghouse is installed, maintained, and
operated in a satisfactory manner. (R336.1205(1)(a) & (b), R336.1301, R336.1331(c), R336.1910, 40 CFR 52.21(b)(3))
4. The permittee shall not load coal into the track hopper unless the baghouse is installed, maintained, and
operated in a satisfactory manner. (R336.1205(1)(a) & (b), R336.1301, R336.1331(c), R336.1910, 40 CFR 52.21(b)(3))
VI. OTHER REQUIREMENTS NA

Severstal North America, Inc April 19, 2007 Permit No. 182-05B Page 10 of 83
TABLE E-01.02 B BLAST FURNACE CAST HOUSE OPERATIONS EMISSION UNIT/PROCESS GROUP REQUIREMENTS EMISSION GROUP EUBBFCASTHOUSE Flexible Grouping ID FGB&CCASTHOUSE I. DESIGN PARAMETERS A. Pollution Control Equipment
Natural gas suppression system prior to installation of baghouse. Baghouse after June 30, 2008
B. Stack/Vent Parameters NA Stack/Vent ID a. Minimum
Height (feet)
b. Maximum Exhaust Dimension
(inches)
c. Temp.
(°F)
d. Air Flow Rate
(acfm)
Applicable Requirement
SVBBFROOFMONEAST 75.2 NA NA NA R336.1225 SVBBFROOFMONWEST 75.2 NA NA NA R336.1225 SVBFCE 200 111 150 250,000 R336.1225 C. Other Design Parameters NA II. MATERIAL USAGE/EMISSION LIMITS
A. Material Maximum Usage Rate NA NA
B. Pollutant Maximum Emission Limit 1. PM 1. 0.003 gr/dscf from baghouse stack (40 CFR 52.21(b)(3)
R336.1331, 40 CFR 63 Subpart FFFFF) 2. 5.59 lb/hr from baghouse stack (40 CFR 52.21(b)(3))
2. PM-10 1. 0.0015 gr/dscf from baghouse stack (R336.1205(1)(a) & (b)) 2. 2.85 lb/hr from baghouse stack (R336.1205(1)(a) & (b))
3. Opacity from roof monitors 20% (R336.1358 (1)) 4. Secondary emissions exiting any opening in the casthouse
20% (6-minute average) (40 CFR 63.7790(a))
5. Opacity from baghouse stack 10% (R336.1361) III. COMPLIANCE EVALUATION Records of all of the following shall be maintained on file for a period of 5 years.
A. MONITORING/RECORDKEEPING 1. Continuous Emission
Monitoring (CEM) System and Recordkeeping
NA
2. Process Monitoring System and Recordkeeping
1. If applicable, the permittee shall install, maintain, and operate a Continuous Parametric Monitoring System (CPMS) for the baghouse capture system according to the requirements of 40 CFR 63.7830(a) and 40 CFR 63.7831(e). (40 CFR 63.7830(a))
3. Other Monitoring and/or Recordkeeping
1. Prior to installation of the B blast furnace casthouse baghouse, the permittee shall perform a Method 9 certified visible emission observation of roof monitors at least once a week during the blast furnace operation for a minimum of one entire cast. After installation of the B blast furnace casthouse baghouse, the permittee shall perform non-certified visible emission observation for the roof monitors at least once a week during blast furnace processing activity and a Method 9 certified visible emission observation of roof monitors at least once every month during blast furnace processing activity. The permittee

Severstal North America, Inc April 19, 2007 Permit No. 182-05B Page 11 of 83
TABLE E-01.02 B BLAST FURNACE CAST HOUSE OPERATIONS EMISSION UNIT/PROCESS GROUP REQUIREMENTS
shall initiate corrective action upon observation of visible emissions in excess of the applicable visible emission limitation and shall keep a written record of each required observation and corrective action taken. (R336.1358(1))
2. The permittee shall maintain a copy of each notification and report
submitted under 40 CFR Part 63, Subpart FFFFF, including all documentation supporting the initial notification or notification of compliance status submitted according to 40 CFR 63.10(b)(2)(xiv)). (40 CFR 63.7842(a)(1))
3. The permittee shall maintain the records required for startup, shutdown
and malfunction under 63.6(e)(3)(iii) through (v). (40 CFR 63.7842(a)(2))
4. The permittee shall maintain records associated with performance tests,
and performance evaluations as required by 40 CFR 63.10(b)(2)(viii). (40 CFR 63.7842(a)(3))
5. Except as allowed in S.C. 8 permittee shall install, operate, and
maintain a bag leak detection system meeting the following specifications on the baghouse control: (40 CFR 63.7831(f)) a. Certified by the manufacturer to be capable of detecting emissions
of particulate matter at concentrations of 10 milligrams per actual cubic foot (0.0044 grains per actual cubic foot). (40 CFR 63.7831(f)(1))
b. Provides output of relative changes in particulate matter loadings. (40 CFR 63.7831(f)(2))
c. Is equipped with an alarm, located such that it is heard by appropriate plant personnel, that sounds an alarm when an increase in relative particulate loadings is detected over a preset level.
(40 CFR 63.7831(f)(3)) d. Initially adjusted by establishing the baseline output by adjusting
the sensitivity (range) and the averaging period of the device and setting the alarm set points and alarm delay time. (40 CFR 63.7831(f)(5))
6. Following the initial adjustment of the bag leak detection system, the
permittee shall not adjust the sensitivity or range, averaging period, alarm set points or alarm delay time except as specified in the operation and maintenance plan. This requirement does not apply if the permittee installs a COMS as specified in S.C. 8. (40 CFR 63.7831(f)(6))
7. If the sensitivity of the bag leak detection system is changed beyond
the limits established pursuant to 40 CFR 63.7831(f)(6), a copy of a written certification by a responsible official shall be included in the semiannual compliance report for that period. This requirement does not apply if the permittee installs a COMS as specified in S.C. 8. (40 CFR 63.7833(c)(2))

Severstal North America, Inc April 19, 2007 Permit No. 182-05B Page 12 of 83
TABLE E-01.02 B BLAST FURNACE CAST HOUSE OPERATIONS EMISSION UNIT/PROCESS GROUP REQUIREMENTS
8. If permittee does not install and operate a bag leak detection system, the permittee shall install, operate, and maintain a COMS according to the requirements in 40CFR Sec. 63.7831(h) and monitor the hourly average opacity of emissions exiting each control device stack according to the requirements in 40 CFR 63.7832. (40 CFR 63.7832)
9. The permittee shall monitor the pressure drop across each baghouse
compartment daily to ensure that the pressure drop is within the normal operating range identified in the manual. (40 CFR 63.7830(b)(1))
10. The permittee shall confirm that dust is being removed from hoppers on
a weekly basis through visual observations or other means of determining the proper functioning of the removal mechanisms. (40 CFR 63.7830(b)(2))
11. The permittee shall confirm that the compressed air supply to the pulse-
jet baghouse is operating properly on a daily basis. (40 CFR 63.7830(b)(3))
12. The permittee shall monitor the cleaning cycles of the baghouse to
ensure proper operation using appropriate technology. (40 CFR 63.7830(b)(4))
13. The permittee shall check the bag cleaning mechanisms for proper
functioning through monthly visual inspections or equivalent means. (40 CFR 63.7830(b)(5))
14. The permittee shall inspect the baghouse to confirm the physical
integrity of the baghouse through quarterly inspections of the interior of the baghouse for air leaks. (40 CFR 63.7830(b)(7))
15. The permittee shall inspect fans for wear, material buildup, and
corrosion on a quarterly basis using visual inspections, vibration detectors, or equivalent means. (40 CFR 63.7830(b)(8))
16. The permittee shall monitor the process as required by this table, except
during monitoring malfunctions, out-of-control periods, associated repairs, and required quality assurance or control activities (including calibration checks and required zero and span adjustments). (40 CFR 63.7832(a))
17. Data recorded during monitoring malfunctions, associated repairs, and
required quality assurance or control activities shall not be used in data averages and calculations used to report emission or operating levels or to fulfill minimum data availability requirements. (40 CFR 63.7832(b))
18. The permittee shall prepare, and operate at all times according to, a
written operation and maintenance plan for the baghouse capture system. The plan shall address each of the following: (40 CFR 63.7800(b))

Severstal North America, Inc April 19, 2007 Permit No. 182-05B Page 13 of 83
TABLE E-01.02 B BLAST FURNACE CAST HOUSE OPERATIONS EMISSION UNIT/PROCESS GROUP REQUIREMENTS
a. Weekly inspections of the equipment that is important to the performance of the total capture system, including, but not limited to, observations of the physical appearance of the equipment and requirements to repair any defect or deficiency in the capture system before the next scheduled inspection; (R336.1301, R336.1358(1), 40 CFR 63.7800(b)(1))
b. Operating limit parameters appropriate for the capture system
design that are representative and reliable indicators of the performance of the capture system including, but not limited to, operating limit parameters that indicate the level of the ventilation draft and the damper position settings for the capture system when operating to collect emissions, including revised settings for seasonal variations. Appropriate operating limit parameters for ventilation draft include, but are not limited to, volumetric flow rate through each separately ducted hood, total volumetric flow rate at the inlet to the control device to which the capture system is vented, fan motor amperage, or static pressure. (40 CFR 63.7800(b)(3))
19. If applicable, the permittee shall monitor the hourly average actual
volumetric flow rate through each separately ducted hood and the average hourly total volumetric flow rate at the inlet to the baghouse according to the requirements in 40 CFR 63.7832. (40 CFR 63.7830(a))
20. If applicable, the permittee shall develop and make available for
inspection upon request by AQD a site-specific monitoring plan that addresses all of the following requirements for the baghouse capture system: (40 CFR 63.7831(a)) a. Installation of the CPMS sampling probe or other interface at a
measurement location relative to each hooded emission point such that the measurement is representative of capture of the exhaust emissions; (40 CFR 63.7831(a)(1))
b. Performance and equipment specifications for the sample interface, the parametric signal analyzer, and the data collection and reduction system; (40 CFR 63.7831(a)(2))
c. Performance evaluation procedures and acceptance criteria; (40 CFR 63.7831(a)(3))
d. Ongoing operation and maintenance procedures in accordance with the general requirements of 40 CFR 63.8(c)(1), (c)(3), (c)(4)(ii), (c)(7), and (c)(8); (40 CFR 63.7831(a)(4))
e. Ongoing data quality assurance procedures in accordance with the general requirements of 40 CFR 63.8(d); and (40 CFR 63.7831(a)(5))
f. Ongoing recordkeeping and reporting procedures in accordance the general requirements of 40 CFR 63.10(c), (e)(1), and (e)(2)(i). (40 CFR 63.7831(a)(6))

Severstal North America, Inc April 19, 2007 Permit No. 182-05B Page 14 of 83
TABLE E-01.02 B BLAST FURNACE CAST HOUSE OPERATIONS EMISSION UNIT/PROCESS GROUP REQUIREMENTS
21. If applicable, the permittee shall operate and maintain the capture system CPMS in continuous operation according to the site-specific monitoring plan. Unless otherwise specified, the CPMS shall: (40 CFR 63.7831(b)) a. Complete a minimum of one cycle of operation for each successive
15-minute period and collect a minimum of three of the required four data points to constitute a valid hour of data; (40 CFR 63.7831(b)(1))
b. Provide valid hourly data for at least 95 percent of every averaging period; and (40 CFR 63.7831(b)(2))
c. Determine and record the hourly average of all recorded readings. (40 CFR 63.7831(b)(3))
22. The permittee shall operate the baghouse capture system at or above the
lowest value or settings established for the operating limits in the operation and maintenance plan and collect, reduce, and record the monitoring data for each of the operating limit parameters. (40 CFR 63.7833(b))
B. TESTING/RECORDKEEPING 1. Parameter to be Tested/
Recorded 1. Opacity 2. PM 3. PM-10
2. Method/Analysis Approved Method 3. Frequency and Schedule of
Testing/Recordkeeping 1. Within 180 operating days after commencement of trial operation of the
B blast furnace casthouse baghouse, verification of PM and PM10 emission rates from the B-Blast Furnace baghouse stack, by testing at owner's expense, in accordance with Department requirements, will be required. No less than 60 days prior to testing, a complete test plan shall be submitted to the AQD. The final plan must be approved by the AQD prior to testing. Verification of emission rates includes the submittal of a complete report of the test results to the AQD within 60 days following the last date of the test. (R336.1205, R336.1331(c), R336.2001, R336.2003, R336.2004, 40 CFR 52.21(b)(3))
2. The permittee shall conduct a performance test to demonstrate initial
compliance with the applicable emission and opacity limitations of 40 CFR Part 63, Subpart FFFFF, contained in this table within 180 days of the startup of “B” BF casthouse baghouse. (40 CFR 63.7820(a))
3. Permittee shall conduct performance tests for particulate matter
emissions and opacity at least once per permit term. (40 CFR 63.7821)
4. The permittee shall demonstrate compliance with the opacity limitation
in II.B.4 with a certified observer of Method 9 visible emissions using Method 9. The performance test for visible emissions shall consist of

Severstal North America, Inc April 19, 2007 Permit No. 182-05B Page 15 of 83
TABLE E-01.02 B BLAST FURNACE CAST HOUSE OPERATIONS EMISSION UNIT/PROCESS GROUP REQUIREMENTS
30 6-minute block averages during tapping of the furnace. (40 CFR 63.7823(c)(1) and (2))
5. The permittee shall maintain records of visible emissions observations
required by 40 CFR Part 63, Subpart FFFFF. (40 CFR 63.7842(c) 6. The permittee shall sample for an integral number of furnace tapping
operations to obtain at least 1 hour of sampling for each test run. (40 CFR 63.7822(e))
7. The permittee shall maintain records of the time corrective action was
initiated, the corrective action taken, and the date when corrective actions were completed in response to a bag leak detection system alarm. (40 CFR 63.7842(d) and 40 CFR 63.7833(c)(1))
8. Performance tests for visible emissions shall be conducted such that the
opacity observations overlap with the performance tests for particulate. (40 CFR 63.7823(b))
9. The permittee shall certify that the baghouse capture system operated
during the performance test at the site-specific operating limits established in the operation and maintenance plan using the following procedures: (40 CFR 63.7824(a)) a. Concurrent with all opacity observations, measure and record
values for each of the operating limit parameters in the capture system operation and maintenance plan according to the monitoring requirements specified in §63.7830(a). (40 CFR 63.7824(a)(1))
b. For any dampers that are manually set and remain at the same
position at all times the capture system is operating, the damper position shall be visually checked and recorded at the beginning and end of each opacity observation period segment. (40 CFR 63.7824(a)(2))
c. Review and record the monitoring data and identify and explain
any times the capture system operated outside the applicable operating limits. (40 CFR 63.7824(a)(3))
d. Certify in the performance test report that during all observation
period segments, the capture system was operating at the values or settings established in the capture system operation and maintenance plan. (40 CFR 63.7824(a)(4))
10. The permittee may change the operating limits for the baghouse capture
system if the following requirements are met: (40 CFR 63.7824(d)) a. Submit a written notification to the Administrator requesting to
conduct a new performance test to revise the operating limit. (40 CFR 63.7824(d)(1))

Severstal North America, Inc April 19, 2007 Permit No. 182-05B Page 16 of 83
TABLE E-01.02 B BLAST FURNACE CAST HOUSE OPERATIONS EMISSION UNIT/PROCESS GROUP REQUIREMENTS
b. Conduct a performance test to demonstrate compliance with the applicable operating limitation. (40 CFR 63.7824(d)(2))
c. Establish revised operating limits according to the applicable procedures in 40 CFR 63.7824, paragraphs (a) through (c) for a capture system. (40 CFR 63.7824(d)(3))
IV. REPORTING Reports and Schedules 1. Permittee shall report the results of the initial performance test in the
notification of compliance status. (40 CFR 63.7820(a), 40 CFR 63.7825(c) and 40 CFR 63.7840(e))
2. Permittee shall submit a notification of intent to perform any
performance testing under 40 CFR Part 63, Subpart FFFFF at least 60 calendar days before testing is to begin. (40 CFR 63.7840(d))
3. Any time an action taken by the permittee during a startup, shutdown,
or malfunction of an affected source (including actions taken to correct a malfunction) is not consistent with the procedures in the startup, shutdown, and malfunction plan, the permittee shall comply with all requirements of 63.10(d)(5)(ii). (40 CFR Part 63.7841(c))
V. OPERATIONAL PARAMETERS 1. After June 30, 2008, B Blast Furnace Cast House shall not be operated unless the baghouse is installed,
maintained and operated in a satisfactory manner. (R336.1205(1)(a) & (b), R336.1225, R336.1331(c), R336.1910, 40 CFR 52.21(b)(3), MDEQ Consent Order AQD No. 6-2006 Paragraph 10.B)
2. Prior to installation of the baghouse, the B Blast Furnace Cast House shall not be operated unless the natural
gas fired fume suppression system is installed and operating properly. (R336.1910) 3. Prior to installation of the baghouse, the permittee shall operate and maintain a flow indication system for
natural gas to the suppression system when the B Blast Furnace Casthouse is operated. (R336.1910) 4. The B Blast Furnace Cast House shall be operated and maintained in a manner consistent with good air
pollution control practices for minimizing emissions. (40 CFR 63.7800(a) and 40 CFR 63.6(e)(1)(i))
5. The permittee shall develop and implement a written startup, shutdown and malfunction plan for the B Blast Furnace Cast House. (40 CFR 63.7810(c), 40 CFR 63.7835(b) and 40 CFR 63.6(e)(3))
6. By January 31, 2008, the permittee shall provide the B blast furnace casthouse baghouse capture system
design plans and a signed certification from the designer, certifying that the baghouse capture system is designed to achieve no less than 98% collection efficiency. (R336.1205(1)(a) & (b), 40 CFR 52.21(b)(3))
VI. OTHER REQUIREMENTS 1. Records required under 40 CFR Part 63, Subpart FFFFF and specified in this table shall be retained for five
years. The records must be maintained onsite for the two most recent years of the five year period. Records from the remaining three years of the five year period may be keep offsite. (40 CFR 63.7843(b) and (c))

Severstal North America, Inc April 19, 2007 Permit No. 182-05B Page 17 of 83
TABLE E-01.03 B BLAST FURNACE STOVE EMISSION UNIT/PROCESS GROUP REQUIREMENTS FLEXIBLE GROUPING FGB&CSTOVES Emission Unit/Process Group EUBFCESTOVE I. DESIGN PARAMETERS A. Pollution Control Equipment
Low-NOx technology; scrubber and mechanical collector for blast furnace gas precleaning
B. Stack/Vent Parameters NA Stack/Vent ID a. Minimum
Height (feet)
b. Maximum Exhaust Dimension
(inches)
c. Temp.
(°F)
d. Air Flow Rate
(acfm)
Applicable Requirement
SVBSTOVE 190 99 750 NA R336.1225, 40 CFR 52.21(c) &
(d) C. Other Design Parameters NA II. MATERIAL USAGE/EMISSION LIMITS
A. Material Maximum Usage Rate NA NA
B. Pollutant Maximum Emission Limit 1. NOx 1. 36.0 lb/hr (R336.1205(1)(a) & (b))
2. 136.6 ton/12-month rolling period (R336.1205(1)(a) & (b))
2. SO2 1. 70.9 lb/hr. (40 CFR 52.21(c) & (d), 40 CFR 52.21(j)) 3. CO 1. 661.1 lb/hr (40 CFR 52.21(d)) III. COMPLIANCE EVALUATION Records of all of the following shall be maintained on file for a period of 5 years.
A. MONITORING/RECORDKEEPING 1. Continuous Emission
Monitoring (CEM) System and Recordkeeping
NA
2. Process Monitoring System and Recordkeeping
1. The permittee shall keep, in a satisfactory manner, daily fuel usage records for EUBFCESTOVE. The permittee shall keep all records on file at the facility for a period of at least five years and make them available to the Department upon request. (R336.1205(1)(a) & (b), 40 CFR 52.21(b)(3), (c), & (d))
2. Following the performance testing required in S.C. III.B.3.1 of this
table, the permittee shall determine compliance with emission limits in S.C. II.B.1.2 of this table by establishing emission factors based up on the BFCE stove stack testing and applying these emission factors to the daily fuel usage recorded in S.C. III.A.2.1, as outlined in Appendix 1.7. (R336.1205(1)(a) & (b))

Severstal North America, Inc April 19, 2007 Permit No. 182-05B Page 18 of 83
TABLE E-01.03 B BLAST FURNACE STOVE EMISSION UNIT/PROCESS GROUP REQUIREMENTS
3. Following the performance testing required in S.C. III.B.3.1 of Table E-01.05, the permittee shall determine compliance with the emission limit in S.C. II.B.3.1 of this table by establishing an emission factor based upon the CFCE stove stack testing and applying this emission factor to the daily fuel usage recorded in S.C. III.A.2.1, as outlined in Appendix 1.7. (40 CFR 52.21 (d))
3. Other Monitoring and/or Recordkeeping
NA
B. TESTING/RECORDKEEPING 1. Parameter to be Tested/
Recorded 1. NOx 2. SO2
2. Method/Analysis Approved method 3. Frequency and Schedule of
Testing/Recordkeeping 1. Within 180 operating days after commencement of trial operation of
the B blast furnace casthouse baghouse, verification of NOx and SO2 emission rates from the B-Blast Furnace stove stack, by testing at owner's expense, in accordance with Department requirements, will be required. No less than 60 days prior to testing, a complete test plan shall be submitted to the AQD. The final plan must be approved by the AQD prior to testing. Verification of emission rates includes the submittal of a complete report of the test results to the AQD within 60 days following the last date of the test. (R336.2001, R336.2003, R336.2004, 40 CFR 52.21(c) & (d), 40 CFR 52.21(j))
IV. REPORTING Reports and Schedules NA V. OPERATIONAL PARAMETERS 1. After completion of C-FCE modification, the permittee shall not operate EUBFCESTOVE unless the low-
NOx technology is installed, maintained, and operated in a satisfactory manner. (R336.1205(1)(a) & (b), R336.1910)
2. The permittee shall not fire blast furnace gas in EUBFCESTOVE unless the scrubber and mechanical
collector for pre-combustion gas cleaning are installed, maintained, and operated in a satisfactory manner. (R336.1205(1)(a) & (b), R336.1910, 40 CFR 52.21(b)(3))
VI. OTHER REQUIREMENTS NA

Severstal North America, Inc April 19, 2007 Permit No. 182-05B Page 19 of 83
TABLE E-01.04 C BLAST FURNACE CAST HOUSE OPERATIONS EMISSION UNIT/PROCESS GROUP REQUIREMENTS EMISSION GROUP EUCBFCASTHOUSE Flexible Grouping ID FGB&CBFCASTHOUSE I. DESIGN PARAMETERS A. Pollution Control Equipment
Baghouse.
B. Stack/Vent Parameters NA Stack/Vent ID a. Minimum
Height (feet)
b. Maximum Exhaust Dimension
(inches)
c. Temp.
(°F)
d. Air Flow Rate
(acfm)
Applicable Requirement
SVCBFROOFMONEAST 75.2 NA NA NA R336.1225 SVCBFROOFMONWEST 75.2 NA NA NA R336.1225 SVCFCE 200 153 150 500,000 R336.1225 C. Other Design Parameters NA II. MATERIAL USAGE/EMISSION LIMITS
A. Material Maximum Usage Rate NA NA
B. Pollutant Maximum Emission Limit 1. PM 1. 0.003 gr/dscf from baghouse stack (40 CFR 52.21(b)(3),
R336.1331, 40 CFR 63 Subpart FFFFF) 2. 11.17 lb/hr from baghouse stack (40 CFR 52.21(b)(3))
2. PM-10 1. 0.0015 gr/dscf from baghouse stack (R336.1205(1)(a) & (b)) 2. 5.70 lb/hr from baghouse stack (R336.1205(1)(a) & (b))
3. Opacity from roof monitors 20% (R336.1358 (1)) 4. Secondary emissions exiting any opening in the casthouse
20% (6-minute average) (40 CFR 63.7790(a))
5. Opacity from baghouse stack 10% (R336.1361) 6. SO2 from baghouse stack 1. 23.03 lb/hr (40 CFR 52.21 (c) & (d), 40 CFR 52.21 (j))
2. 91.79 ton per 12-month rolling time period (40 CFR 52.21 (c), (d), & (j))
7. NOx from baghouse stack 1. 2.45 lb/hr (R336.1205(1)(a) & (b)) 2. 9.77 ton per 12-month rolling time period (R336.1205(1)(a) & (b))
8. VOC from baghouse stack 1. 6.77 lb/hr (R336.1702(a)) 9. Mn 1. 0.00256 lb/hr from baghouse stack (R336.1225) 10. Pb 1. 0.00015 lb/hr from baghouse stack (40 CFR 52.21(d)) III. COMPLIANCE EVALUATION Records of all of the following shall be maintained on file for a period of 5 years.
A. MONITORING/RECORDKEEPING 1. Continuous Emission
Monitoring (CEM) System and Recordkeeping
NA
2. Process Monitoring System and Recordkeeping
1. If applicable, the permittee shall install, maintain, and operate a Continuous Parametric Monitoring System (CPMS) for the baghouse capture system according to the requirements of 40 CFR 63.7830(a) and 40 CFR 63.7831(e). (40 CFR 63.7830(a))

Severstal North America, Inc April 19, 2007 Permit No. 182-05B Page 20 of 83
TABLE E-01.04 C BLAST FURNACE CAST HOUSE OPERATIONS EMISSION UNIT/PROCESS GROUP REQUIREMENTS 3. Other Monitoring and/or
Recordkeeping 1. Prior to installation of the C blast furnace casthouse baghouse, the
permittee shall perform a Method 9 certified visible emission observation of roof monitors at least once a week during the blast furnace operation for a minimum of one entire cast. After installation of the C blast furnace casthouse baghouse, the permittee shall perform non-certified visible emission observation for the roof monitors at least once a week during blast furnace processing activity and a Method 9 certified visible emission observation of roof monitors at least once every month during blast furnace processing activity. The permittee shall initiate corrective action upon observation of visible emissions in excess of the applicable visible emission limitation and shall keep a written record of each required observation and corrective action taken. (R336.1358(1))
2. The permittee shall maintain a copy of each notification and report
submitted under 40 CFR Part 63, Subpart FFFFF, including all documentation supporting the initial notification or notification of compliance status submitted according to 40 CFR 63.10(b)(2)(xiv)). (40 CFR 63.7842(a)(1))
3. The permittee shall maintain the records required for startup, shutdown
and malfunction under 63.6(e)(3)(iii) through (v). (40 CFR 63.7842(a)(2))
4. The permittee shall maintain records associated with performance
tests, and performance evaluations as required by 40 CFR 63.10(b)(2)(viii). (40 CFR 63.7842(a)(3))
5. Except as allowed in S.C. 8, permittee shall install, operate, and
maintain a bag leak detection system meeting the following specifications on the baghouse control: (40 CFR 63.7831(f)) a. Certified by the manufacturer to be capable of detecting emissions
of particulate matter at concentrations of 10 milligrams per actual cubic foot (0.0044 grains per actual cubic foot). (40 CFR 63.7831(f)(1))
b. Provides output of relative changes in particulate matter loadings. (40 CFR 63.7831(f)(2))
c. Is equipped with an alarm, located such that it is heard by appropriate plant personnel, that sounds an alarm when an increase in relative particulate loadings is detected over a preset level.
(40 CFR 63.7831(f)(3)) d. Initially adjusted by establishing the baseline output by adjusting
the sensitivity (range) and the averaging period of the device and setting the alarm set points and alarm delay time. (40 CFR 63.7831(f)(5))
6. Following the initial adjustment of the bag leak detection system, the
permittee shall not adjust the sensitivity or range, averaging period, alarm set points or alarm delay time except as specified in the

Severstal North America, Inc April 19, 2007 Permit No. 182-05B Page 21 of 83
TABLE E-01.04 C BLAST FURNACE CAST HOUSE OPERATIONS EMISSION UNIT/PROCESS GROUP REQUIREMENTS
operation and maintenance plan. This requirement does not apply if the permittee installs a COMS as specified in S.C. 8. (40 CFR 63.7831(f)(6))
7. If the sensitivity of the bag leak detection system is changed beyond
the limits established pursuant to 40 CFR 63.7831(f)(6), a copy of a written certification by a responsible official shall be included in the semiannual compliance report for that period. This requirement does not apply if the permittee installs a COMS as specified in S.C. 8. (40 CFR 63.7833(c)(2))
8. If permittee does not install and operate a bag leak detection system,
the permittee shall install, operate, and maintain a COMS according to the requirements in 40 CFR Sec. 63.7831(h) and monitor the hourly average opacity of emissions exiting each control device stack according to the requirements in 40 CFR 63.7832. (40 CFR 63.7832)
9. The permittee shall monitor the pressure drop across each baghouse
compartment daily to ensure that the pressure drop is within the normal operating range identified in the manual. (40 CFR 63.7830(b)(1))
10. The permittee shall confirm that dust is being removed from hoppers on
a weekly basis through visual observations or other means of determining the proper functioning of the removal mechanisms. (40 CFR 63.7830(b)(2))
11. The permittee shall confirm that the compressed air supply to the pulse-
jet baghouse is operating properly on a daily basis. (40 CFR 63.7830(b)(3))
12. The permittee shall monitor the cleaning cycles of the baghouse to
ensure proper operation using appropriate technology. (40 CFR 63.7830(b)(4))
13. The permittee shall check the bag cleaning mechanisms for proper
functioning through monthly visual inspections or equivalent means. (40 CFR 63.7830(b)(5))
14. The permittee shall inspect the baghouse to confirm the physical
integrity of the baghouse through quarterly inspections of the interior of the baghouse for air leaks. (40 CFR 63.7830(b)(7))
15. The permittee shall inspect fans for wear, material buildup, and
corrosion on a quarterly basis using visual inspections, vibration detectors, or equivalent means. (40 CFR 63.7830(b)(8))
16. The permittee shall monitor the process as required by this table, except
during monitoring malfunctions, out-of-control periods, associated repairs, and required quality assurance or control activities (including calibration checks and required zero and span adjustments). (40 CFR 63.7832(a))

Severstal North America, Inc April 19, 2007 Permit No. 182-05B Page 22 of 83
TABLE E-01.04 C BLAST FURNACE CAST HOUSE OPERATIONS EMISSION UNIT/PROCESS GROUP REQUIREMENTS
17. Data recorded during monitoring malfunctions, associated repairs, and
required quality assurance or control activities shall not be used in data averages and calculations used to report emission or operating levels or to fulfill minimum data availability requirements. (40 CFR 63.7832(b))
18. The permittee shall prepare, and operate at all times according to, a
written operation and maintenance plan for the baghouse capture system. The plan shall address each of the following: (40 CFR 63.7800(b)) a. Weekly inspections of the equipment that is important to the
performance of the total capture system, including, but not limited to, observations of the physical appearance of the equipment and requirements to repair any defect or deficiency in the capture system before the next scheduled inspection; (R336.1301, R336.1358(1), 40 CFR 63.7800(b)(1))
b. Operating limit parameters appropriate for the capture system
design that are representative and reliable indicators of the performance of the capture system including, but not limited to, operating limit parameters that indicate the level of the ventilation draft and the damper position settings for the capture system when operating to collect emissions, including revised settings for seasonal variations. Appropriate operating limit parameters for ventilation draft include, but are not limited to, volumetric flow rate through each separately ducted hood, total volumetric flow rate at the inlet to the control device to which the capture system is vented, fan motor amperage, or static pressure. (40 CFR 63.7800(b)(3))
19. If applicable, the permittee shall monitor the hourly average actual
volumetric flow rate through each separately ducted hood and the average hourly total volumetric flow rate at the inlet to the baghouse according to the requirements in 40 CFR 63.7832. (40 CFR 63.7830(a))
20. If applicable, the permittee shall develop and make available for
inspection upon request by AQD a site-specific monitoring plan that addresses all of the following requirements for the baghouse capture system: (40 CFR 63.7831(a)) a. Installation of the CPMS sampling probe or other interface at a
measurement location relative to each hooded emission point such that the measurement is representative of capture of the exhaust emissions; (40 CFR 63.7831(a)(1))
b. Performance and equipment specifications for the sample interface, the parametric signal analyzer, and the data collection and reduction system; (40 CFR 63.7831(a)(2))
c. Performance evaluation procedures and acceptance criteria; (40 CFR 63.7831(a)(3))

Severstal North America, Inc April 19, 2007 Permit No. 182-05B Page 23 of 83
TABLE E-01.04 C BLAST FURNACE CAST HOUSE OPERATIONS EMISSION UNIT/PROCESS GROUP REQUIREMENTS
d. Ongoing operation and maintenance procedures in accordance with the general requirements of 40 CFR 63.8(c)(1), (c)(3), (c)(4)(ii), (c)(7), and (c)(8); (40 CFR 63.7831(a)(4))
e. Ongoing data quality assurance procedures in accordance with the general requirements of 40 CFR 63.8(d); and (40 CFR 63.7831(a)(5))
f. Ongoing recordkeeping and reporting procedures in accordance the general requirements of 40 CFR 63.10(c), (e)(1), and (e)(2)(i). (40 CFR 63.7831(a)(6))
21. If applicable, the permittee shall operate and maintain the capture
system CPMS in continuous operation according to the site-specific monitoring plan. Unless otherwise specified, the CPMS shall: (40 CFR 63.7831(b)) a. Complete a minimum of one cycle of operation for each successive
15-minute period and collect a minimum of three of the required four data points to constitute a valid hour of data; (40 CFR 63.7831(b)(1))
b. Provide valid hourly data for at least 95 percent of every averaging period; and (40 CFR 63.7831(b)(2))
c. Determine and record the hourly average of all recorded readings. (40 CFR 63.7831(b)(3))
22. The permittee shall operate the baghouse capture system at or above the
lowest value or settings established for the operating limits in the operation and maintenance plan and collect, reduce, and record the monitoring data for each of the operating limit parameters. (40 CFR 63.7833(b))
23. The permittee shall keep a daily record of the amount of iron cast from
the furnace. (R336.1205(1)(a) & (b), R336.1225) 24. The permittee shall keep, in a satisfactory manner, monthly and
previous 12-month records of SO2 and NOx emission calculations for C blast furnace casthouse baghouse, using emission factors developed during the testing required in SC III.B.3.1, using the method shown in Appendix 1.7. The permittee shall keep all records on file at the facility for a period of at least five years and make them available to the Department upon request. (R336.1205(1)(a) & (b), 40 CFR 52.21(c) and (d))
B. TESTING/RECORDKEEPING 1. Parameter to be Tested/
Recorded 1. Opacity 2. PM 3. PM-10 4. SO2

Severstal North America, Inc April 19, 2007 Permit No. 182-05B Page 24 of 83
TABLE E-01.04 C BLAST FURNACE CAST HOUSE OPERATIONS EMISSION UNIT/PROCESS GROUP REQUIREMENTS
5. NOx 6. VOC 7. Mn 8. Pb
2. Method/Analysis Approved Method 3. Frequency and Schedule of
Testing/Recordkeeping 1. Within 180 days after commencement of trial operation, verification of
PM, PM10, NOx, VOC, and SO2 emission rates from the C-Blast Furnace baghouse stack, by testing at owner's expense, in accordance with Department requirements, will be required. No less than 60 days prior to testing, a complete test plan shall be submitted to the AQD. The final plan must be approved by the AQD prior to testing. Verification of emission rates includes the submittal of a complete report of the test results to the AQD within 60 days following the last date of the test. (R336.1205, R336.702, R336.2001, R336.2003, R336.2004, 40 CFR 52.21(c) & (d), 40 CFR 52.21(j))
2. The permittee shall conduct a performance test to demonstrate initial
compliance with the applicable emission and opacity limitations of 40 CFR Part 63, Subpart FFFFF contained in this table within 180 days of startup. (40 CFR 63.7820(a))
3. Permittee shall conduct performance tests for particulate matter
emissions and opacity at least once per permit term. (40 CFR 63.7821)
4. The permittee shall demonstrate compliance with the opacity limitation
in II.B.4 with a certified observer of Method 9 visible emissions using Method 9. The performance test for visible emissions shall consist of 30 6-minute block averages during tapping of the furnace. (40 CFR 63.7823(c)(1) and (2))
5. The permittee shall maintain records of visible emissions observations
required by 40 CFR Part 63, Subpart FFFFF. (40 CFR 63.7842(c) 6. The permittee shall sample for an integral number of furnace tapping
operations to obtain at least 1 hour of sampling for each test run. (40 CFR 63.7822(e))
7. The permittee shall maintain records of the time corrective action was
initiated, the corrective action taken, and the date when corrective actions were completed in response to a bag leak detection system alarm. (40 CFR 63.7842(d) and 40 CFR 63.7833(c)(1))

Severstal North America, Inc April 19, 2007 Permit No. 182-05B Page 25 of 83
TABLE E-01.04 C BLAST FURNACE CAST HOUSE OPERATIONS EMISSION UNIT/PROCESS GROUP REQUIREMENTS
8. Performance tests for visible emissions shall be conducted such that the
opacity observations overlap with the performance tests for particulate. (40 CFR 63.7823(b))
9. The permittee shall obtain an analysis of the C Blast Furnace Casthouse
baghouse dust once per calendar month during the 1st year after the modification of C blast furnace and quarterly thereafter, or less frequently if approved in writing by the Air Quality Division. The analysis shall determine the percentage of Pb and Mn in the collected PM dust from the baghouse. The permittee shall submit an acceptable protocol for baghouse dust sampling and analysis methods to the Air Quality Division, at least 60 days prior the initial performance emission test. (R336.1225, R336.1228, 40 CFR 52.21(d))
10. Within 60 days of achieving the maximum production rate, but not later
than 180 days after commencement of trial operation, the permittee shall verify and quantify Mn and Pb emission rates and the ratio of Mn and Pb concentrations in the baghouse dust to the actual amount of Mn and Pb emitted from the C Blast Furnace Casthouse by testing at owner's expense, in accordance with Department requirements. No less than 60 days prior to testing, the permittee shall submit a complete test plan to the AQD. The AQD must approve the final plan prior to testing. Verification of emission rates includes the submittal of a complete report of the test results to the AQD within 60 days following the last date of the test. (R336.1225, R336.1228, R336.2001, R336.2003, R336.2004, 40 CFR 52.21(b)(3))
11. The permittee shall certify that the baghouse capture system operated
during the performance test at the site-specific operating limits established in the operation and maintenance plan using the following procedures: (40 CFR 63.7824(a)) a. Concurrent with all opacity observations, measure and record
values for each of the operating limit parameters in the capture system operation and maintenance plan according to the monitoring requirements specified in §63.7830(a). (40 CFR 63.7824(a)(1))
b. For any dampers that are manually set and remain at the same
position at all times the capture system is operating, the damper position shall be visually checked and recorded at the beginning and end of each opacity observation period segment. (40 CFR 63.7824(a)(2))
c. Review and record the monitoring data and identify and explain
any times the capture system operated outside the applicable operating limits. (40 CFR 63.7824(a)(3))
d. Certify in the performance test report that during all observation
period segments, the capture system was operating at the values or settings established in the capture system operation and maintenance plan. (40 CFR 63.7824(a)(4))

Severstal North America, Inc April 19, 2007 Permit No. 182-05B Page 26 of 83
TABLE E-01.04 C BLAST FURNACE CAST HOUSE OPERATIONS EMISSION UNIT/PROCESS GROUP REQUIREMENTS
12. The permittee may change the operating limits for the baghouse capture
system if the following requirements are met: (40 CFR 63.7824(d)) a. Submit a written notification to the Administrator requesting to
conduct a new performance test to revise the operating limit. (40 CFR 63.7824(d)(1))
b. Conduct a performance test to demonstrate compliance with the applicable operating limitation. (40 CFR 63.7824(d)(2))
c. Establish revised operating limits according to the applicable procedures in 40 CFR 63.7824, paragraphs (a) through (c) for a capture system. (40 CFR 63.7824(d)(3))
IV. REPORTING Reports and Schedules 1. Permittee shall report the results of the initial performance test in the
notification of compliance status. (40 CFR 63.7820(a), 40 CFR 63.7825(c) and 40 CFR 63.7840(e))
2. Permittee shall submit a notification of intent to perform any
performance testing under 40 CFR Part 63, Subpart FFFFF at least 60 calendar days before testing is to begin. (40 CFR 63.7840(d))
3. Any time an action taken by the permittee during a startup, shutdown,
or malfunction of an affected source (including actions taken to correct a malfunction) is not consistent with the procedures in the startup, shutdown, and malfunction plan, the permittee shall comply with all requirements of 63.10(d)(5)(ii). (40 CFR Part 63.7841(c))
V. OPERATIONAL PARAMETERS 1. After completion of C-FCE modification, C Blast Furnace Cast House shall not be operated unless the
baghouse is installed, maintained and operated in a satisfactory manner. (R336.1205(1)(a) & (b), R336.1225, R336.1331, R336.1910, 40 CFR 52.21(b)(3))
2. The permittee shall install a baghouse dust collector for C blast furnace casthouse according to the following
schedule: a. Complete construction and place in operation by January 31, 2008 or startup of enhanced C-FCE,
whichever is sooner. (R336.1205(1)(a) & (b), 40 CFR 52.21(b)(3)) 3. The permittee shall keep on file a copy of the CFCE baghouse capture system design plans and a signed
certification from the designer, certifying that the baghouse capture system is designed to achieve no less than 98% collection efficiency. (R336.1205(1)(a) & (b), 40 CFR 52.21(b)(3))
4. The C Blast Furnace Cast House shall be operated and maintained in a manner consistent with good air
pollution control practices for minimizing emissions. (40 CFR 63.7800(a) and 40 CFR 63.6(e)(1)(i))
5. The permittee shall develop and implement a written startup, shutdown and malfunction plan for the C Blast Furnace Cast House. (40 CFR 63.7810(c), 40 CFR 63.7835(b) and 40 CFR 63.6(e)(3))
6. The iron production from C Blast Furnace Casthouse shall not exceed a maximum of 10,000 tons per day
based on a calendar week average. (R336.1225, 40 CFR 52.21(c) & (d))

Severstal North America, Inc April 19, 2007 Permit No. 182-05B Page 27 of 83
TABLE E-01.04 C BLAST FURNACE CAST HOUSE OPERATIONS EMISSION UNIT/PROCESS GROUP REQUIREMENTS VI. OTHER REQUIREMENTS 1. Records required under 40 CFR Part 63, Subpart FFFFF and specified in this table shall be retained for five
years. The records must be maintained onsite for the two most recent years of the five year period. Records from the remaining three years of the five year period may be keep offsite. (40 CFR 63.7843(b) and (c))

Severstal North America, Inc April 19, 2007 Permit No. 182-05B Page 28 of 83
TABLE E-01.05 C BLAST FURNACE STOVE EMISSION UNIT/PROCESS GROUP REQUIREMENTS FLEXIBLE GROUPING FGB&CSTOVES Emission Unit/Process Group EUCFCESTOVE I. DESIGN PARAMETERS A. Pollution Control Equipment
Low-NOx technology; venturi scrubber and mechanical collector for blast furnace gas precleaning
B. Stack/Vent Parameters NA Stack/Vent ID a. Minimum
Height (feet)
b. Maximum Exhaust Dimension
(inches)
c. Temp.
(°F)
d. Air Flow Rate
(acfm)
Applicable Requirement
SVCSTOVE 210 129 750 NA R336.1225, 40 CFR 52.21(c) &
(d) C. Other Design Parameters NA II. MATERIAL USAGE/EMISSION LIMITS
A. Material Maximum Usage Rate NA NA
B. Pollutant Maximum Emission Limit 1. NOx 1. 106.3 lb/hr (R336.1205(1)(a) & (b))
2. 439.18 ton/12-month rolling period (R336.1205(1)(a) & (b))
2. SO2 1. 275.1 lb/hr 1. (40 CFR 52.21(c) & (d), 40 CFR 52.21(j)) 2. 1,096.1 ton/12-month rolling period (40 CFR 52.21(j))
3. CO 1. 2195.5 lb/hr (40 CFR 52.21(d) & (j)) 2. 8760 ton/12-month rolling period. (40 CFR 52.21(d) & (j))
4. PM 14.16 lb/hr (40 CFR 52.21(b)(3), R336.1331) 5. PM-10 14.16 lb/hr (R336.1205(1)(a) & (b)) 6. Mn 0.0154 lb/hr (R336.1225) 7. Hg 0.000414 lb/hr (R336.1201(3), R336.1228, R336.1901) 8. Pb 0.0141 lb/hr (40 CFR 52.21(d)) 1 This limit is based on a 24-hour average. III. COMPLIANCE EVALUATION Records of all of the following shall be maintained on file for a period of 5 years.
A. MONITORING/RECORDKEEPING 1. Continuous Emission
Monitoring (CEM) System and Recordkeeping
Continuous emission monitor for SO2 emissions (R336.1205(1)(a) & (b), 40 CFR 52.21(c), (d), & (j))
2. Process Monitoring System and Recordkeeping
1. The permittee shall install, calibrate, maintain and operate in a satisfactory manner a device to monitor and record the SO2 emissions from EUCFCESTOVE on a continuous basis. The permittee shall install and operate each CEM system to meet the timelines, requirements and reporting detailed in Appendix 1.3.1. and shall use the CEM data for determining compliance with Special Conditions II.B.2.1 and II.B.2.2 (R336.1205, 40 CFR 52.21 (c), (d), & (j))

Severstal North America, Inc April 19, 2007 Permit No. 182-05B Page 29 of 83
TABLE E-01.05 C BLAST FURNACE STOVE EMISSION UNIT/PROCESS GROUP REQUIREMENTS
2. The permittee shall keep, in a satisfactory manner, daily fuel usage
records for FGB&CSTOVES. The permittee shall keep all records on file at the facility for a period of at least five years and make them available to the Department upon request. (R336.1205(1)(a) & (b), 40 CFR 52.21(b)(3), (c), & (d))
3. Following the performance testing required in S.C. III.B.3.1 of this
table, the permittee shall determine compliance with the emission limits in S.C. II.B.1.2 and II.B.3.2 of this table by establishing emission factors based upon the CFCE stove stack testing and applying these emission factors to the daily fuel usage recorded in S.C. III.A.2.2, as outlined in Appendix 1.7. (R336.1205(1)(a) & (b), 40 CFR 52.21 (d))
3. Other Monitoring and/or Recordkeeping
NA
B. TESTING/RECORDKEEPING 1. Parameter to be Tested/
Recorded 1. NOx 2. SO2 3. CO 4. PM 5. PM-10 6. Mn 7. Hg 8. Pb
2. Method/Analysis Approved method 3. Frequency and Schedule of
Testing/Recordkeeping 1. Within 180 days after commencement of trial operation, verification of
NOx, SO2, CO, PM, PM-10 Mn, Hg, and Pb emission rates from the C-Blast Furnace stove stack, by testing at owner's expense, in accordance with Department requirements, will be required. The permittee shall record the sulfur content of the coal and coke combusted in C blast furnace averaged over the duration of the test. No less than 60 days prior to testing, a complete test plan shall be submitted to the AQD. The final plan must be approved by the AQD prior to testing. Verification of emission rates includes the submittal of a complete report of the test results to the AQD within 60 days following the last date of the test. (R336.2001, R336.2003, R336.2004, 40 CFR 52.21(c) & (d), 40 CFR 52.21(j))
IV. REPORTING Reports and Schedules NA

Severstal North America, Inc April 19, 2007 Permit No. 182-05B Page 30 of 83
TABLE E-01.05 C BLAST FURNACE STOVE EMISSION UNIT/PROCESS GROUP REQUIREMENTS V. OPERATIONAL PARAMETERS 1. After completion of C-FCE modification, the permittee shall not operate EUCFCESTOVE unless the low-
NOx technology is installed, maintained, and operated in a satisfactory manner. (R336.1205(1)(a) & (b), R336.1910)
2. The permittee shall not fire blast furnace gas in EUCFCESTOVE unless the venturi scrubber and
mechanical collector for pre-combustion gas cleaning are installed, maintained, and operated in a satisfactory manner. (R336.1205(1)(a) & (b), R336.1910, 40 CFR 52.21(b)(3))
VI. OTHER REQUIREMENTS 1. The permittee shall maintain a complete copy of the coke analysis, including the sulfur content, as supplied
by the coke vendor, for each shipment of coke. All records shall be kept on file for a period of at least five years and made available to the Department upon request. (R336.1225, 40 CFR 52.21(c) & (d))
2. The permittee shall maintain a complete copy of the coal analysis, including the sulfur content, as supplied
by the coal vendor, for each shipment of coal. All records shall be kept on file for a period of at least five years and made available to the Department upon request. (R336.1225, 40 CFR 52.21(c) & (d))

Severstal North America, Inc April 19, 2007 Permit No. 182-05B Page 31 of 83
TABLE E-01.06 RELADLING - BOF EMISSION UNIT/PROCESS GROUP REQUIREMENTS EMISSION GROUP EURELADLINGBOF (includes South and North Reladling) Flexible Grouping ID NA I. DESIGN PARAMETERS A. Pollution Control Equipment
Baghouse
B. Stack/Vent Parameters NA Stack/Vent ID a. Minimum
Height (feet)
b. Maximum Exhaust Dimension
(inches)
c. Temp.
(°F)
d. Air Flow Rate
(acfm)
Applicable Requirement
SVBOFBH (After C-FCE modification)
200 222 150 1,000,000 R336.1225
SVRELADLEBAG (until C-FCE modification)
27 69 175 130,000 R336.1225
C. Other Design Parameters NA II. MATERIAL USAGE/EMISSION LIMITS
A. Material Maximum Usage Rate NA NA
B. Pollutant Maximum Emission Limit 1. Opacity from hot metal transfer operation stack.
20% R336.1365(1)
2. Opacity from fugitive emissions from hot metal transfer operation building or enclosure.
20% R336.1365(2) and 40 CFR 63.7790(a)(Table 1, Item 12)
3. PM 1. 0.01 grain per dry standard cubic foot from the reladling south baghouse prior to C-FCE modification (40 CFR 63.7790(a)(Table 1, Item 10), R336.1331)
2. 6.31 ton per 12 month rolling time period from the roof monitors
(40 CFR 52.21(b)(3)) 4. PM10 1. 3.22 ton per 12 month rolling time period from the roof monitors
(R336.1205(1)(a) & (b)) III. COMPLIANCE EVALUATION Records of all of the following shall be maintained on file for a period of 5 years.
A. MONITORING/RECORDKEEPING 1. Continuous Emission
Monitoring (CEM) System and Recordkeeping
NA
2. Process Monitoring System and Recordkeeping
3. Other Monitoring and/or Recordkeeping
1. The permittee shall maintain a copy of each notification and report submitted under 40 CFR Part 63, Subpart FFFFF, including all documentation supporting the initial notification or notification of compliance status submitted according to 40 CFR 63.10(b)(2)(xiv)). (40 CFR 63.7842(a)(1))
2. The permittee shall maintain the records required for startup, shutdown
and malfunction under 63.6(e)(3)(iii) through (v). (40 CFR 63.7842(a)(2))

Severstal North America, Inc April 19, 2007 Permit No. 182-05B Page 32 of 83
TABLE E-01.06 RELADLING - BOF EMISSION UNIT/PROCESS GROUP REQUIREMENTS
3. The permittee shall maintain records associated with performance tests and performance evaluations as required by 40 CFR 63.10(b)(2)(viii). (40 CFR 63.7842(a)(3))
4. Except as allowed in S.C. 7, permittee shall install, operate, and
maintain a bag leak detection system meeting the following specifications on the baghouse control: (40 CFR 63.7831(f)) a. Certified by the manufacturer to be capable of detecting emissions
of particulate matter at concentrations of 10 milligrams per actual cubic foot (0.0044 grains per actual cubic foot). (40 CFR 63.7831(f)(1))
b. Provides output of relative changes in particulate matter loadings. (40 CFR 63.7831(f)(2))
c. Is equipped with an alarm, located such that it is heard by appropriate plant personnel, that sounds an alarm when an increase in relative particulate loadings is detected over a preset level. (40 CFR 63.7831(f)(3))
d. Initially adjusted by establishing the baseline output by adjusting the sensitivity (range) and the averaging period of the device and setting the alarm set points and alarm delay time. (40 CFR 63.7831(f)(5))
5. Following the initial adjustment of the bag leak detection system, the
permittee shall not adjust the sensitivity or range, averaging period, alarm set points or alarm delay time except as specified in the operation and maintenance plan. This requirement does not apply if the permittee installs a COMS as specified in S.C. 7. (40 CFR 63.7831(f)(6))
6. If the sensitivity of the bag leak detection system is changed beyond the
limits established pursuant to 40 CFR 63.7831(f)(6), a copy of a written certification by a responsible official shall be included in the semiannual compliance report for that period. This requirement does not apply if the permittee installs a COMS as specified in S.C. 7. (40 CFR 63.7833(c)(2))
7. If permittee does not install and operate a bag leak detection system,
the permittee shall install, operate, and maintain a COMS according to the requirements in 40 CFR Sec. 63.7831(h) and monitor the hourly average opacity of emissions exiting each control device stack according to the requirements in 40 CFR 63.7832. (40 CFR 63.7832)
8. The permittee shall monitor the pressure drop across the baghouse
compartment daily to ensure that the pressure drop is within the normal operating range identified in the manual. (40 CFR 63.7830(b)(1))
9. The permittee shall confirm that dust is being removed from hoppers on
a weekly basis through visual observations or other means of determining the proper functioning of the removal mechanisms. (40 CFR 63.7830(b)(2))

Severstal North America, Inc April 19, 2007 Permit No. 182-05B Page 33 of 83
TABLE E-01.06 RELADLING - BOF EMISSION UNIT/PROCESS GROUP REQUIREMENTS
10. The permittee shall perform monthly visual checks of bag tension on
the shaker-type baghouse to ensure that bags are not kinked (kneed or bent) or lying on their sides. If the shaker-type baghouse uses self-tensioning (spring-loaded) devices, the visual checks are not required. (40 CFR 63.7830(b)(6))
11. The permittee shall monitor the cleaning cycles of the baghouse to
ensure proper operation using appropriate technology. (40 CFR 63.7830(b)(4)
12. The permittee shall check the bag cleaning mechanisms for proper
functioning through monthly visual inspections or equivalent means. (40 CFR 63.7830(b)(5))
13. The permittee shall inspect the baghouse to confirm the physical
integrity of the baghouse through quarterly inspections of the interior of the baghouse for air leaks. (40 CFR 63.7830(b)(7))
14. The permittee shall inspect fans for wear, material buildup, and
corrosion on a quarterly basis using visual inspections, vibration detectors, or equivalent means. (40 CFR 63.7830(b)(8))
15. The permittee shall monitor the process as required by this table, except
during monitoring malfunctions, out-of-control periods, associated repairs, and required quality assurance or control activities (including calibration checks and required zero and span adjustments). (40 CFR 63.7832(a))
16. Data recorded during monitoring malfunctions, associated repairs, and
required quality assurance or control activities shall not be used in data averages and calculations used to report emission or operating levels or to fulfill minimum data availability requirements. (40 CFR 63.7832(b))
17. Using the method shown in Appendix 1.7, the permittee shall calculate
and record by the end of each calendar month the following from the BOF roof monitors:
a. emissions of PM b. emissions of PM-10 (R336.1205(1)(a) & (b), 40 CFR 52.21(b)(3)) 18. The permittee shall keep a daily record of the amount of iron
throughput to the Reladling South and North Operations. (R336.1205(1)(a) & (b), R336.1225)
B. TESTING/RECORDKEEPING 1. Parameter to be Tested/
Recorded 1. Opacity 2. PM
2. Method/Analysis Approved Method 3. Frequency and Schedule of
Testing/Recordkeeping 1. Sampling during the performance tests will occur only when the
operations being controlled are in operation. (40 CFR 63.7822(h))

Severstal North America, Inc April 19, 2007 Permit No. 182-05B Page 34 of 83
TABLE E-01.06 RELADLING - BOF EMISSION UNIT/PROCESS GROUP REQUIREMENTS
2. The permittee shall maintain records of the time corrective action was
initiated, the corrective action taken, and the date when corrective actions were completed in response to a bag leak detection system alarm. (40 CFR 63.7842(d) and 40 CFR 63.7833(c)(1))
3. The permittee shall demonstrate compliance with the opacity limitation
in II.B.2. with a certified observer of Method 9 visible emissions using Method 9 with the following exceptions: (40 CFR 63.7823(d)(1)(i))
a. Record observations to the nearest 5 percent at 15-second intervals
for at least three steel production cycles rather than using the procedure specified in Section 2.4 of Method 9. (40 CFR 63.7823(d)(1)(ii))
b. Determine the 3-minute block average opacity from the average of 12 consecutive observations recorded at 15-second intervals. (40 CFR 63.7823(d)(1)(iii))
4. Performance tests for visible emissions shall be conducted such that
the opacity observations overlap with the performance tests for particulate. (40 CFR 63.7823(b))
5. Permittee shall conduct performance tests for particulate matter
emissions and opacity at least once per permit term. (40 CFR 63.7821)
IV. REPORTING Reports and Schedules 1. Permittee shall submit a notification of intent to perform any
performance testing under 40 CFR Part 63, Subpart FFFFF at least 60 calendar days before testing is to begin. (40 CFR 63.7840(d))
2. When actions taken by the permittee during a startup, shutdown, or
malfunction of an affected source (including actions taken to correct a malfunction) are not consistent with the procedures in the startup, shutdown, and malfunction plan, the permittee shall comply with the requirements of 63.10(d)(5)(ii). (40 CFR Part 63.7841(c))
V. OPERATIONAL PARAMETERS 1. The Reladling South Operation and the associated baghouse shall be operated and maintained in a manner
consistent with good air pollution control practices for minimizing emissions at least to the levels required by 40 CFR Part 63, Subpart FFFFF. (40 CFR 63.7800(a) and 40 CFR 63.6(e)(1)(i))
2. The permittee shall develop and implement a written startup, shutdown and malfunction plan for the
Reladling South Operation and the associated emission control system and operate in accordance with the plan during periods of startup, shutdown, and malfunction. (40 CFR 63.7810(c), 40 CFR 63.7835(b), and 40 CFR 63.6(e)(3))
3. Until the modification of C-FCE, the permittee shall not operate Reladling South Operation unless the
baghouse dust collector is installed, maintained, and operated in a satisfactory manner. After modification of C-FCE, the permittee shall not operate Reladling South Operation unless the emissions are directed to the

Severstal North America, Inc April 19, 2007 Permit No. 182-05B Page 35 of 83
TABLE E-01.06 RELADLING - BOF EMISSION UNIT/PROCESS GROUP REQUIREMENTS
BOF baghouse secondary dust collector and the BOF baghouse secondary dust collector is installed, maintained, and operated in a satisfactory manner. (R336.1205(1)(a) & (b), R336.1225, R336.1910, 40 CFR 52.21(b)(3))
4. Upon rerouting the Reladling South Operations exhaust to the BOF baghouse secondary dust collector,
Special Conditions II.B.1, II.B.3.1, III.A.3.4 through III.A.3.16, and III.B.1.2 of this table shall no longer apply. Thereafter the permittee shall comply with the identical or more stringent emission, monitoring, testing, and recordkeeping requirements of Table F-01.03 that supersede the above Special Conditions. (40 CFR 63 Subpart FFFFF)
5. The permittee shall not use the Reladling North Operations (i.e. the North Hole) of the Basic Oxygen
Furnace Shop for emergency hot metal transfer, hot metal desulfurization, or beaching of molten iron, without installation and operation of appropriate control technology which prevents emissions in excess of the applicable Michigan SIP Rule or additional requirements that are promulgated under Section 112 of the Clean Air Act, 42 U.S.C. Section 7412, or are incorporated in a permit. (USEPA Civil Action Nos. 0075452 and 0075454 Consent Decree, Paragraph 16)
6. Unless necessary for emergency, health or safety reasons, including to allow for safe shutdown of
operations, the permittee shall not use the North Hole of the Basic Oxygen Furnace Shop for emergency hot metal transfer, hot metal desulfurization, or beaching of molten iron, without installation and operation of appropriate control technology which prevents emissions in excess of the applicable Michigan SIP Rule or additional requirements that are promulgated under Section 112 of the Clean Air Act, 42 U.S.C. Section 7412, or are incorporated in a permit. If the North Hole is used for emergency reasons, the permittee shall report any such use in its next semiannual report. The report shall include the following information for each such prohibited use of the North Hole without the appropriate control technology:
a. date b. start time c. stop time d. duration of use e. reason for use. (R336.1201(3)) 7. Upon routing the Reladling North Operations exhaust to the new BOF baghouse secondary dust collector,
the permittee may utilize the Reladling North Operations in compliance with the applicable requirements of Table E-01.06, and with the emission, monitoring, testing, and recordkeeping requirements of Table F-01.03 (40 CFR 63 Subpart FFFFF)
VI. OTHER REQUIREMENTS 1. The permittee shall comply with the emission limitations and operation and maintenance requirements from
40 CFR Part 63, Subpart FFFFF specified in Table E-01.06, except during periods of startup, shutdown and malfunction. (40 CFR 63.7810(a))
2. Records required under 40 CFR Part 63, Subpart FFFFF and specified in this table shall be retained for five
years. The records must be maintained onsite for the two most recent years of the five year period. Records from the remaining three years of the five year period may be keep offsite. (40 CFR 63.7843(b) and (c))

Severstal North America, Inc April 19, 2007 Permit No. 182-05B Page 36 of 83
TABLE E-01.07 DESULFURIZATION OPERATION EMISSION UNIT/PROCESS GROUP REQUIREMENTS EMISSION GROUP EUDESULFURIZATION Flexible Grouping ID NA I. DESIGN PARAMETERS A. Pollution Control Equipment
Baghouse
B. Stack/Vent Parameters NA Stack/Vent ID a. Minimum
Height (feet)
b. Maximum Exhaust Dimension
(inches)
c. Temp.
(°F)
d. Air Flow Rate
(acfm)
Applicable Requirement
SVDESULF 37 66 225 94,500 R336.1225 C. Other Design Parameters NA II. MATERIAL USAGE/EMISSION LIMITS
A. Material Maximum Usage Rate
B. Pollutant Maximum Emission Limit 1. Opacity from desulfurization stack.
20% (R336.1366(1))
2. Opacity from fugitive emissions from desulfurization operations.
20% (R336.1366(2))
3. Opacity from BOF Shop Building
20% (three minute average) (40 CFR 63.7790(a)(Table 1, Item 12))
4. PM 1. 0.01 grain per dry standard cubic foot from baghouse (40 CFR 52.21(b)(3), 40 CFR 63.7790(a)(Table 1, Item 10), R336.1331)
2. 2.09 lb/hr from baghouse (40 CFR 52.21(b)(3)) 3. 36.2 ton per 12-month rolling time period from roof monitors (40
CFR 52.21(b)(3)) 5. PM10 1. 0.0074 grain per dry standard cubic foot from baghouse
(R336.1205(1)(a) & (b)) 2. 1.55 lb/hr from baghouse (R336.1205(1)(a) & (b)) 3. 6.88 ton per 12-month rolling time period from roof monitors
(R336.1205(1)(a) & (b)) 6. Manganese 1. 0.00064 lb/hr from baghouse stack (R336.1225) 7. Pb 1. 0.000278 lb/hr from baghouse stack (40 CFR 52.21(d)) III. COMPLIANCE EVALUATION Records of all of the following shall be maintained on file for a period of 5 years.
A. MONITORING/RECORDKEEPING 1. Continuous Emission
Monitoring (CEM) System and Recordkeeping
NA

Severstal North America, Inc April 19, 2007 Permit No. 182-05B Page 37 of 83
TABLE E-01.07 DESULFURIZATION OPERATION EMISSION UNIT/PROCESS GROUP REQUIREMENTS 2. Process Monitoring System
and Recordkeeping NA
3. Other Monitoring and/or Recordkeeping
1. The permittee shall maintain a copy of each notification and report submitted under 40 CFR Part 63, Subpart FFFFF, including all documentation supporting the initial notification or notification of compliance status submitted according to 40 CFR 63.10(b)(2)(xiv)). (40 CFR 63.7842(a)(1))
2. The permittee shall maintain the records required for startup, shutdown
and malfunction under 63.6(e)(3)(iii) through (v). (40 CFR 63.7842(a)(2))
3. The permittee shall maintain records associated with performance tests
and performance evaluations as required by 40 CFR 63.10(b)(2)(viii). (40 CFR 63.7842(a)(3))
4. Except as allowed in S.C. 7, permittee shall install, operate, and
maintain a bag leak detection system meeting the following specifications on the baghouse control: (40 CFR 63.7831(f))
a. Certified by the manufacturer to be capable of detecting emissions
of particulate matter at concentrations of 10 milligrams per actual cubic foot (0.0044 grains per actual cubic foot). (40 CFR 63.7831(f)(1))
b. Provides output of relative changes in particulate matter loadings. (40 CFR 63.7831(f)(2))
c. Is equipped with an alarm, located such that it is heard by appropriate plant personnel, that sounds an alarm when an increase in relative particulate loadings is detected over a preset level. (40 CFR 63.7831(f)(3))
d. Initially adjusted by establishing the baseline output by adjusting the sensitivity (range) and the averaging period of the device and setting the alarm set points and alarm delay time. (40 CFR 63.7831(f)(5))
5. Following the initial adjustment of the bag leak detection system, the
permittee shall not adjust the sensitivity or range, averaging period, alarm set points or alarm delay time except as specified in the operation and maintenance plan. This requirement does not apply if the permittee installs a COMS as specified in S.C. 7. (40 CFR 63.7831(f)(6))
6. If the sensitivity of the bag leak detection system is changed beyond the
limits established pursuant to 40 CFR 63.7831(f)(6), a copy of a written certification by a responsible official shall be included in the semiannual compliance report for that period. This requirement does not apply if the permittee installs a COMS as specified in S.C. 7. (40 CFR 63.7833(c)(2))

Severstal North America, Inc April 19, 2007 Permit No. 182-05B Page 38 of 83
TABLE E-01.07 DESULFURIZATION OPERATION EMISSION UNIT/PROCESS GROUP REQUIREMENTS
7. If permittee does not install and operate a bag leak detection system, the permittee shall install, operate, and maintain a COMS according to the requirements in 40CFR Sec. 63.7831(h) and monitor the hourly average opacity of emissions exiting each control device stack according to the requirements in 40 CFR 63.7832. (40 CFR 63.7832)
8. The permittee shall monitor the pressure drop across each baghouse
compartment daily to ensure that the pressure drop is within the normal operating range identified in the manual. (40 CFR 63.7830(b)(1))
9. The permittee shall confirm that dust is being removed from hoppers on
a weekly basis through visual observations or other means of determining the proper functioning of the removal mechanisms. (40 CFR 63.7830(b)(2))
10. The permittee shall perform monthly visual checks of bag tension on
the shaker-type baghouse to ensure that bags are not kinked (kneed or bent) or lying on their sides. If the shaker-type baghouse uses self-tensioning (spring-loaded) devices, the visual checks are not required. (40 CFR 63.7830(b)(6))
11. The permittee shall monitor the cleaning cycles of the baghouse to
ensure proper operation using appropriate technology. (40 CFR 63.7830(b)(4))
12. The permittee shall check the bag cleaning mechanisms for proper
functioning through monthly visual inspections or equivalent means. (40 CFR 63.7830(b)(5))
13. The permittee shall inspect the baghouse to confirm the physical
integrity of the baghouse through quarterly inspections of the interior of the baghouse for air leaks. (40 CFR 63.7830(b)(7))
14. The permittee shall inspect fans for wear, material buildup, and
corrosion on a quarterly basis using visual inspections, vibration detectors, or equivalent means. (40 CFR 63.7830(b)(8))
15. The permittee shall monitor the process as required by this table, except
during monitoring malfunctions, out-of-control periods, associated repairs, and required quality assurance or control activities (including calibration checks and required zero and span adjustments). (40 CFR 63.7832(a))
16. Data recorded during monitoring malfunctions, associated repairs, and
required quality assurance or control activities shall not be used in data averages and calculations used to report emission or operating levels or to fulfill minimum data availability requirements. (40 CFR 7832(b))

Severstal North America, Inc April 19, 2007 Permit No. 182-05B Page 39 of 83
TABLE E-01.07 DESULFURIZATION OPERATION EMISSION UNIT/PROCESS GROUP REQUIREMENTS
17. The permittee shall obtain an analysis of the Desulfurization baghouse dust once per calendar month during the 1st year after the modification of C blast furnace and quarterly thereafter, or less frequently if approved in writing by the Air Quality Division. The analysis shall determine the percentage of Pb and Mn in the collected PM dust from the baghouse. The permittee shall submit an acceptable protocol for baghouse dust sampling and analysis methods to the Air Quality Division, at least 60 days prior the initial performance emission test. (R336.1225, R336.1228, 40 CFR 52.21(b)(3))
18. Using the method shown in Appendix 1.7, the permittee shall calculate
and record by the end of each calendar month the following from the BOF roof monitors: a. emissions of PM b. emissions of PM-10 (R336.1205(1)(a) & (b), 40 CFR 52.21(b)(3))
19. The permittee shall keep a daily record of the amount of iron
throughput to the Desulfurization Operations. (R336.1205(1)(a) & (b), R336.1225)
B. TESTING/RECORDKEEPING 1. Parameter to be Tested/
Recorded 1. Opacity 2. PM 3. PM-10 4. Mn 5. Pb
2. Method/Analysis Approved method. 3. Frequency and Schedule of
Testing/Recordkeeping
1. Sampling during the performance tests will occur only when the operations being controlled are in operation. (40 CFR 63.7822(h))
2. The permittee shall maintain records of the time corrective action was
initiated, the corrective action taken, and the date when corrective actions were completed in response to a bag leak detection system alarm. (40 CFR 63.7842(d) and 40 CFR 63.7833(c)(1))
3. The permittee shall demonstrate compliance with the opacity limitation
in II.B.3. with a certified observer of Method 9 visible emissions using Method 9 with the following exceptions: (40 CFR 63.7823(d)(1)(i))
a. Record observations to the nearest 5 percent at 15-second intervals
for at least three steel production cycles rather than using the procedure specified in Section 2.4 of Method 9. (40 CFR 63.7823(d)(1)(ii))
b. Determine the 3-minute block average opacity from the average of 12 consecutive observations recorded at 15-second intervals. (40 CFR 63.7823(d)(1)(iii))

Severstal North America, Inc April 19, 2007 Permit No. 182-05B Page 40 of 83
TABLE E-01.07 DESULFURIZATION OPERATION EMISSION UNIT/PROCESS GROUP REQUIREMENTS
4. Performance tests for visible emissions shall be conducted such that
the opacity observations overlap with the performance tests for particulate. (40 CFR 63.7823(b))
5. Within 60 days of achieving the maximum production rate, but not later
than 180 days after commencement of trial operation, the permittee shall verify and quantify Mn and Pb emission rates from the desulfurization operation and the ratio of Mn and Pb concentrations in the baghouse dust to the actual amount of Mn and Pb emitted from the desulfurization operation, by testing at owner's expense, in accordance with Department requirements. No less than 60 days prior to testing, the permittee shall submit a complete test plan to the AQD. The AQD must approve the final plan prior to testing. Verification of emission rates includes the submittal of a complete report of the test results to the AQD within 60 days following the last date of the test. (R336.1225, R336.1228, R336.2001, R336.2003, R336.2004, 40 CFR 52.21(b)(3))
6. Within 180 days after commencement of trial operation, the permittee
shall verify PM and PM10 emission rates from the Desulfurization operation by testing at owner's expense, in accordance with Department requirements. No less than 60 days prior to testing, the permittee shall submit a complete test plan to the AQD. The AQD must approve the final plan prior to testing. Verification of emission rates includes the submittal of a complete report of the test results to the AQD within 60 days following the last date of the test. (R336.1205(1)(a) & (b), R336.2001, R336.2003, R336.2004, 40 CFR 52.21(b)(3))
7. Permittee shall conduct performance tests for particulate matter
emissions and opacity at least once per permit term. (40 CFR 63.7821)
IV. REPORTING Reports and Schedules 1. Permittee shall submit a notification of intent to perform any
performance testing under 40 CFR Part 63, Subpart FFFFF at least 60 calendar days before testing is to begin. (40 CFR 63.7840(d))
2. When actions taken by the permittee during a startup, shutdown, or
malfunction of an affected source (including actions taken to correct a malfunction) are not consistent with the procedures in the startup, shutdown, and malfunction plan, the permittee shall comply with the requirements of 63.10(d)(5)(ii). (40 CFR Part 63.7841(c))
V. OPERATIONAL PARAMETERS 1. The permittee shall operate and maintain the desulfurization control system in a manner as to control
emissions from the desulfurization operation in compliance with the opacity limits. (R336.1910) 2. The Desulfurization Operation and the associated baghouse shall be operated and maintained in a manner
consistent with good air pollution control practices for minimizing emissions at least to the levels required by 40 CFR Part 63, Subpart FFFFF. (40 CFR 63.7800(a) and 40 CFR 63.6(e)(1)(i))

Severstal North America, Inc April 19, 2007 Permit No. 182-05B Page 41 of 83
TABLE E-01.07 DESULFURIZATION OPERATION EMISSION UNIT/PROCESS GROUP REQUIREMENTS
3. The permittee shall develop and implement a written startup, shutdown and malfunction plan for the
Desulfurization Operation and the associated emission control system and operate in accordance with the plan during periods of startup, shutdown, and malfunction. (40 CFR 63.7810(c), 40 CFR 63.7835(b), and 40 CFR 63.6(e)(3))
4. The permittee shall not operate the Desulfurization Operation unless the baghouse dust collector is installed,
maintained, and operated in a satisfactory manner. (R336.1205(1)(a) & (b), R336.1225, R336.1910, 40 CFR 52.21(b)(3))
VI. OTHER REQUIREMENTS 1. The permittee shall comply with the emission limitations and operation and maintenance requirements from
40 CFR Part 63, Subpart FFFFF specified in Table E-01.07, except during periods of startup, shutdown and malfunction. (40 CFR 63.7810(a))
2. Records required under 40 CFR Part 63, Subpart FFFFF and specified in this table shall be retained for five
years. The records must be maintained onsite for the two most recent years of the five year period. Records from the remaining three years of the five year period may be keep offsite. (40 CFR 63.7843(b) and (c))

Severstal North America, Inc April 19, 2007 Permit No. 182-05B Page 42 of 83
TABLE E-01.08 BASIC OXYGEN FURNACE (BOF) EMISSION UNIT/PROCESS GROUP REQUIREMENTS EMISSION GROUP EUBOF Flexible Grouping ID NA I. DESIGN PARAMETERS A. Pollution Control Equipment
Electrostatic Precipitator, Baghouse
B. Stack/Vent Parameters NA Stack/Vent ID a.
Minimum Height (feet)
b. Maximum Exhaust Dimension
(inches)
c. Temp.
(°F)
d. Air Flow Rate
(acfm)
Applicable Requirement
SVBOFESP 213 204 300 841,000 R336.1225 SVBOFBH 200 222 150 1,000,000 R336.1225 C. Other Design Parameters 1. Permittee shall not operate the basic oxygen furnace (BOF) controlled by an electrostatic precipitator
control system unless each transformer-rectifier set of the electrostatic precipitator is equipped with a saturable core reactor, silicon-controlled rectifier linear reactor, or equivalent type automatic control system approved by the AQD District Supervisor. (R336.1330(1))
2. Each automatic controller shall be set to provide maximum power, or optimal power if operating in a
sparking mode, from its respective transformer-rectifier set. (R336.1330(1)) 3. Each transformer-rectifier set shall be capable of operating in a spark-limited mode and shall meter and
display the primary RMS voltage and amperage, the average secondary amperage, and the average spark rate. (R336.1330(2))
II. MATERIAL USAGE/EMISSION LIMITS A. Material Maximum Usage Rate
NA NA B. Pollutant Maximum Emission Limit
1. PM.
1. 0.0152 gr/dscf from ESP stack (R336.1331, 40 CFR 63.7790(a), 40 CFR 52.21(b)(3))
2. 50.94 lb/hr from ESP stack (40 CFR 52.21(b)(3)) 3. 15.88 ton per 12-month rolling time period from roof monitors
(40 CFR 52.21(b)(3) 2. PM-10.
1. 0.0113 gr/dscf from ESP stack (R336.1205(1)(a) & (b)) 2. 37.70 lb/hr from ESP stack (R336.1205(1)(a) & (b)) 3. 7.25 ton per 12-month rolling time period from roof monitors
(R336.1205(1)(a) & (b) 3. Opacity from roof monitors 20% (R336.1364(2)) 4. Opacity from BOF Shop Building
20% (3 minute average) (R336.1364(2), (40 CFR 63.7790(a))
5. Opacity from ESP stack No greater than 10% on an hourly average basis (40 CFR 63.7790(b)(3)) 6. NOx 1. 52.94 lb/hr from the ESP stack. (R336.1205(1)(a) & (b)) 7. CO 1. 3,057.4 lb/hr from ESP stack (40 CFR 52.21(d))

Severstal North America, Inc April 19, 2007 Permit No. 182-05B Page 43 of 83
TABLE E-01.08 BASIC OXYGEN FURNACE (BOF) EMISSION UNIT/PROCESS GROUP REQUIREMENTS III. COMPLIANCE EVALUATION Records of all of the following shall be maintained on file for a period of 5 years.
A. MONITORING/RECORDKEEPING 1. Continuous Emission
Monitoring (CEM) System and Recordkeeping
1. Continuous opacity monitor on ESP stack. (R36.1301(1)(c), 40 CFR 63.7830(d))
2. Process Monitoring System and Recordkeeping
1. The permittee shall install, operate and maintain a continuous opacity monitor on the ESP stack and monitor the hourly average opacity of the stack continuously when the process is in operation. The COMS shall provide valid 1 hour averages for at least 95 percent of process operating hours for every quarterly reporting period. The permittee shall operate the COM system to meet the timelines, requirements and reporting detailed in Appendix 1.3.2. (R336.1301(1)(c), 40 CFR 63.7830(d), 40 CFR 63.7831(h), and 40 CFR 63.7832(a))
2. Data recorded during monitoring malfunctions, associated repairs, and
required quality assurance or control activities shall not be used in data averages and calculations used to report emission or operating levels or to fulfill minimum data availability requirements. All other data collected during all other periods must be used in assessing compliance. (40 CFR 63.7832(b))
3. Other Monitoring and/or Recordkeeping
1. Prior to installation of the BOF secondary emissions collection baghouse, the permittee shall perform a Method 9 certified visible emission observation of roof monitors at least once a week during BOF operation for a minimum of one complete heat. After installation of the BOF secondary emissions collection baghouse, the permittee shall perform non-certified visible emission observation for the BOF roof monitors (including reladling and desulfurization operations) at least once a week during BOF operations and a Method 9 certified visible emission observation of the BOF roof monitors (including reladling and desulfurization operations) at least once every month during BOF operations. The permittee shall initiate corrective action upon observation of visible emissions in excess of the applicable visible emission limitation and shall keep a written record of each required observation and corrective action taken. (R336.1364(2))
2. The permittee shall maintain a copy of each notification and report
submitted under 40 CFR Part 63, Subpart FFFFF, including all documentation supporting the initial notification or notification of compliance status submitted according to 40 CFR 63.10(b)(2)(xiv)). (40 CFR 63.7842(a)(1))
3. The permittee shall maintain the records required for startup, shutdown
and malfunction under 63.6(e)(3)(iii) through (v). (40 CFR 63.7842(a)(2))
4. The permittee shall maintain records associated with performance tests,
performance evaluations, and opacity observations as required by 40 CFR 63.10(b)(2)(viii). (40 CFR 63.7842(a)(3))

Severstal North America, Inc April 19, 2007 Permit No. 182-05B Page 44 of 83
TABLE E-01.08 BASIC OXYGEN FURNACE (BOF) EMISSION UNIT/PROCESS GROUP REQUIREMENTS
5. The permittee shall maintain records of the following for the
continuous opacity monitor: a. Periods when the monitor is malfunctioning or inoperative;
(40 CFR 63.7842(b)(1) and 40 CFR 63.10(b)(2)(vi)) b. All required measurements necessary to demonstrate compliance
with a standard (including, but not limited to, 15-minute averages of monitoring data, raw performance testing measurements, and raw performance evaluation measurements, that support data that the source is required to report); (40 CFR 63.7842(b)(1) and 40 CFR 63.10(b)(2)(vii))
c. All results of performance tests, monitor performance evaluations and opacity and visible emission observations;
(40 CFR 63.7842(b)(1) and 40 CFR 63.10(b)(2)(viii)) d. All measurements necessary to determine the conditions of
performance tests and evaluations; (40 CFR 63.7842(b)(1), 40 CFR 63.10(b)(2)(ix))
e. All monitor calibration checks; (40 CFR 63.7842(b)(1) and 40 CFR 63.10(b)(2)(x))
f. All adjustments and maintenance performed on the continuous monitor; (40 CFR 63.7842(b)(1) and 40 CFR 63.10(b)(2)(xi))
g. Monitoring data produced during performance testing; (40 CFR 63.7842(b)(2))
h. Superceded versions of the performance evaluation plan; and (40 CFR 63.7842(b)(3) and 40 CFR 63.8(d)(3))
i. The date and time each deviation started and stopped and whether the deviation occurred during a period of startup, shutdown, malfunction, or during another period. (40 CFR 63.7842(b)(4))
6. The permittee shall perform preventative maintenance on the ESP as
specified in the operation and maintenance plan for the ESP. (40 CFR 63.7834(a)(2))
7. The permittee shall comply with the recordkeeping requirement as
specified in 40 CFR Part 63 Subpart FFFFF 63.7842(a), (b), (c) and (d). (40 CFR 63.7842(a), (b), (c) and (d))
8. The permittee shall monitor the process as required by this table, except
during monitoring malfunctions, out-of-control periods, associated repairs, and required quality assurance or control activities (including calibration checks and required zero and span adjustments). (40 CFR 63.7832(a))
9. Data recorded during monitoring malfunctions, associated repairs, and
required quality assurance or control activities shall not be used in data averages and calculations used to report emission or operating levels or to fulfill minimum data availability requirements. (40 CFR 63.7832(b))

Severstal North America, Inc April 19, 2007 Permit No. 182-05B Page 45 of 83
TABLE E-01.08 BASIC OXYGEN FURNACE (BOF) EMISSION UNIT/PROCESS GROUP REQUIREMENTS
10. The permittee shall keep 12-month rolling time period records of the amount of scrap and fragmented scrap charged to the BOF. The permittee shall keep all records on file at the facility for a period of at least five years and make them available to the Department upon request. (R336.1201(3), R336.1225, R336.1228, R336.1901)
11. The permittee shall obtain an analysis of the BOF ESP dust once per
calendar month during the 1st year after the modification of C blast furnace and quarterly thereafter, or less frequently if approved in writing by the Air Quality Division. The analysis shall determine the percentage of Pb, Hg, and Mn in the collected PM dust from the ESP. The permittee shall submit an acceptable protocol for baghouse dust sampling and analysis methods to the Air Quality Division, at least 60 days prior the initial performance emission test. (R336.1225, R336.1228, 40 CFR 52.21(d))
12. Using the method shown in Appendix 1.7, the permittee shall calculate
and record by the end of each calendar month the following from the BOF roof monitors: a. emissions of PM b. emissions of PM-10 (R336.1205(1)(a) & (b), 40 CFR 52.21(b)(3))
13. The permittee shall keep a daily record of the amount of steel produced in the Basic Oxygen Furnace. (R336.1205(1)(a) & (b), R336.1225)
B. TESTING/RECORDKEEPING 1. Parameter to be Tested/
Recorded 1. Opacity 2. PM 3. PM-10 4. NOx 5. CO
2. Method/Analysis Approved method. 3. Frequency and Schedule of
Testing/Recordkeeping 1. The permittee shall demonstrate compliance with the opacity limitation
for the BOF Shop Building in II.B.4. with a certified observer of Method 9 visible emissions using Method 9 with the following exceptions: (40 CFR 63.7823(d)(1)(i)) a. Record observations to the nearest 5 percent at 15-second
intervals for at least three steel production cycles rather than using the procedure specified in Section 2.4 of Method 9. (40 CFR 63.7823(d)(1)(ii))
b. Determine the 3-minute block average opacity from the average of 12 consecutive observations recorded at 15-second intervals. (40 CFR 63.7823(d)(1)(iii))

Severstal North America, Inc April 19, 2007 Permit No. 182-05B Page 46 of 83
TABLE E-01.08 BASIC OXYGEN FURNACE (BOF) EMISSION UNIT/PROCESS GROUP REQUIREMENTS
2. Opacity observations from the roof monitors must cover at least three steel production cycles. A production cycle begins when scrap is charged and ends three minutes after slag is emptied from the vessel into the slag pot. (40 CFR 63.7823(d)(4))
3. Permittee shall determine and record the starting and stopping times of
the steel production cycle. (40 CFR 63.7823(d)(5)) 4. The permittee shall maintain a copy of the current operation and
maintenance plans required in this table onsite and available for inspection. (40 CFR 63.7834(b))
5. The permittee shall maintain records of the monitoring data from the
continuous opacity monitor. (40 CFR 63.7842(d)) 6. Within 180 days after commencement of trial operation, the permittee
shall verify PM, PM10, NOx, and CO emission rates from the ESP stack by testing at owner's expense, in accordance with Department requirements. No less than 60 days prior to testing, the permittee shall submit a complete test plan to the AQD. The AQD must approve the final plan prior to testing. Verification of emission rates includes the submittal of a complete report of the test results to the AQD within 60 days following the last date of the test. (R336.1205(1)(a) & (b), R336.2001, R336.2003, R336.2004, 40 CFR 52.21(b)(3), 40 CFR 52.21(d))
7. Permittee shall conduct overlapping performance tests for particulate
matter emissions and opacity from the BOF roof monitor at least twice per permit term. (40 CFR 63.7821)
IV. REPORTING Reports and Schedules 1. Permittee shall report the results of the initial performance test in the
notification of compliance status. (40 CFR 63.7820(a), 40 CFR 63.7825(c) and 40 CFR 63.7840(e))
2. Permittee shall submit a notification of intent to perform any
performance testing under 40 CFR Part 63, Subpart FFFFF at least 60 calendar days before testing is to begin. (40 CFR 63.7840(d))
3. Any time an action taken by the permittee during a startup, shutdown,
or malfunction of an affected source (including actions taken to correct a malfunction) is not consistent with the procedures in the startup, shutdown, and malfunction plan, the permittee shall comply with all requirements of 63.10(d)(5)(ii). (40 CFR Part 63.7841(c))
V. OPERATIONAL PARAMETERS 1. The permittee shall not operate the Basic Oxygen Furnace unless the electrostatic precipitator (ESP) dust
collector is installed and operating properly. (R336.1301, R336.1331(c), R336.1910) 2. After completion of C-FCE modification, the permittee shall not operate the Basic Oxygen Furnace unless
the baghouse secondary emission dust collector is installed, maintained, and operated in a satisfactory manner. (R336.1205(1)(a) & (b), R336.1225, R336.1910, 40 CFR 52.21(b)(3))

Severstal North America, Inc April 19, 2007 Permit No. 182-05B Page 47 of 83
TABLE E-01.08 BASIC OXYGEN FURNACE (BOF) EMISSION UNIT/PROCESS GROUP REQUIREMENTS 3. The Basic Oxygen Furnace off-gas conditioning system which provides additional air-atomized water spray,
shall be maintained as part of the off gas conditioning system. (R336.1910) 4. The BOF vessels and ESP shall be operated and maintained in a manner consistent with good air pollution
control practices for minimizing emissions at least to the levels required by 40 CFR Part 63, Subpart FFFFF. (40 CFR 63.7800(a) and 40 CFR 63.6(e)(1)(i))
5. The permittee shall operate the BOF vessels and ESP according to an operation and maintenance plan that
meets the requirements of 40 CFR 63.7800(b)(1)-(5). (40 CFR 63.7800(b) and 40 CFR 63.6(e)(3))
6. The permittee shall develop and implement a written startup, shutdown and malfunction plan for the BOF vessels and the associated emission control system. (40 CFR 63.7810(c), 40 CFR 63.7835(b) and 40 CFR 63.6(e)(3))
7. The permittee shall not produce more than 12,200 tons of steel per day based on a calendar week average
nor 4,052,230 tons of steel per 12-month rolling time period from the BOF (R336.1205(1)(a) & (b), R336.1225, 40 CFR 52.21(b)(3))
8. The permittee shall not charge more than 21,882 tons of fragmented scrap in the BOF per 12-month rolling
time period. (R336.1201(3), R336.1228, R336.1901) VI. OTHER REQUIREMENTS 1. The permittee shall comply with the emission limitations and operation and maintenance requirements from
40 CFR Part 63, Subpart FFFFF specified in Table E-01.08, except during periods of startup, shutdown and malfunction. (40 CFR 63.7810(a))
2. Records required under 40 CFR Part 63, Subpart FFFFF and specified in this table shall be retained for five
years. The records must be maintained onsite for the two most recent years of the five year period. Records from the remaining three years of the five year period may be keep offsite. (40 CFR 63.7843(b) and (c))
3. If the hourly average opacity of the electrostatic precipitator exceeds the operating limit in S.C. II.B.5, the
permittee shall implement the following procedures: (40 CFR 63.7833(g)) a. Permittee shall initiate corrective action to determine the cause of the exceedance within 1 hour. During
any period of corrective action, the permittee shall continue to monitor and record all required operating parameters for equipment that remains in operation. Within 24 hours of the exceedance, the permittee shall measure and record the hourly average operating parameter value for the emission unit on which corrective action was taken. If the hourly average parameter value meets the applicable operating limit, then the corrective action was successful and the emission unit is in compliance with the applicable operating limit. (40 CFR 63.7833(g)(1))
b. If the initial corrective action required in paragraph (a) of this condition was not successful, the permittee shall complete additional corrective action within the next 24 hours (48 hours from the time of the exceedance). During any period of corrective action, the permittee shall continue to monitor and record all required operating parameters for equipment that remains in operation. After this second 24-hour period, the permittee shall again measure and record the hourly average operating parameter value for the emission unit on which corrective action was taken. If the hourly average parameter value meets the applicable operating limit, then the corrective action was successful and the emission unit is in compliance with the applicable operating limit. (40 CFR 63.7833(g)(2))

Severstal North America, Inc April 19, 2007 Permit No. 182-05B Page 48 of 83
TABLE E-01.08 BASIC OXYGEN FURNACE (BOF) EMISSION UNIT/PROCESS GROUP REQUIREMENTS
c. For purposes of paragraphs (a) and (b) of this condition, in the case of an exceedance of the hourly average opacity operating limit for the electrostatic precipitator, measurements of the hourly average opacity based on visible emission observations in accordance with Method 9 (40 CFR part 60, appendix A) may be taken to evaluate the effectiveness of corrective action. (40 CFR 63.7833(g)(3))
d. If the second attempt at corrective action required in paragraph (b) of this condition was not successful, the permittee shall report the exceedance as a deviation in the next semiannual compliance report according to 40 CFR 63.7841(b). (40 CFR 63.7833(g)(4))
4. The permittee shall not increase the iron production rate of FGB&CCASTHOUSE to more than 8125 tons
of liquid iron per day based on a calendar week average unless the on-site screening procedure and material management plan, or alternate plan(s) are approved in writing by the AQD District Supervisor. The plan(s) shall be implemented and maintained immediately after approval. The on-site screening procedure and material management plan will facilitate the permittee’s efforts in controlling mercury and/or other toxics and VOC emissions by eliminating unacceptable scrap and eliminating or reducing scrap with mercury contaminated materials. The permittee shall require all suppliers document that mercury-containing devices and switches have been removed from the scrap. (R336.1201(3), R336.1228, R336.1901)
5. The permittee shall record the specific information as required in the on-site screening procedure and scrap
management plan. All such records shall be kept on file for a period of at least five years and made available to the Air Quality Division upon request. (R336.1201(3), R336.1228, R336.1901)

Severstal North America, Inc April 19, 2007 Permit No. 182-05B Page 49 of 83
TABLE E-01.09 BOF DESULFURIZATION BY-PRODUCTS “DESULF” PROCESS EMISSION UNIT/PROCESS GROUP REQUIREMENTS EMISSION GROUP EUDESULFWATERINGSTATION
BOF desulfurization by-product material “desulf” watering station located at the south end of the BOF building. Levy or any other winning bidder in the future for the service, digs the desulf materials with a front-end loader, brings them to an open area for cooling using water spray and for fugitive dust control. After thorough cooling, Levy or any other winning bidder in the future for the service, loads the materials into trucks for processing off site. Note: Levy currently has the contract to buy this material and, consequently, currently operates the Desulf Watering Station.
Flexible Grouping ID NA I. DESIGN PARAMETERS A. Pollution Control Equipment
Water spray system
B. Stack/Vent Parameters NA Stack/Vent ID a. Minimum
Height (feet)
b. Maximum Exhaust Dimension
(inches)
c. Temp.
(°F)
d. Air Flow Rate
(acfm)
Applicable Requirement
NA NA NA NA NA NA C. Other Design Parameters NA II. MATERIAL USAGE/EMISSION LIMITS
A. Material Maximum Usage Rate NA NA
B. Pollutant Maximum Emission Limit 1. Opacity of fugitive dust emissions from sources other than roads, lots, or storage pile
20% (3 minute average) (R324.5524(2))
2. Opacity of fugitive dust emissions from material handling activities at a storage pile and from building openings other than roof monitors
10% (3 minute average) (R324.5524(8), R336.1301(c))
3. Opacity of fugitive dust emissions from roof monitors
20% (R336.1301)
III. COMPLIANCE EVALUATION A. MONITORING/RECORDKEEPING
1. Continuous Emission Monitoring (CEM) System and Recordkeeping
NA
2. Process Monitoring System and Recordkeeping
NA

Severstal North America, Inc April 19, 2007 Permit No. 182-05B Page 50 of 83
TABLE E-01.09 BOF DESULFURIZATION BY-PRODUCTS “DESULF” PROCESS EMISSION UNIT/PROCESS GROUP REQUIREMENTS 3. Other Monitoring and/or
Recordkeeping The permittee shall perform a Method 9D certified visible emission ob servation of the desulf watering station at least once every two weeks for a minimum of 15 minutes during the dumping, watering and loading operation. The permittee shall initiate corrective action upon observation of visible emissions in excess of the applicable visible emission limitation and shall keep a written record of each required observation and corrective action taken. (R336.1213(3), R336.1910) B. TESTING/RECORDKEEPING
1. Parameter to be Tested/ Recorded
NA
2. Method/Analysis NA
3. Frequency and Schedule of Testing/Recordkeeping
NA
IV. REPORTING Reports and Schedules NA V. OPERATIONAL PARAMETERS To control fugitive dust when processing the desulf material, the permittee shall not process the desulf material outside the BOF building without cooling off the material thoroughly with the water spray system. (R336.1910, R336.1901) VI. OTHER REQUIREMENTS NA

Severstal North America, Inc April 19, 2007 Permit No. 182-05B Page 51 of 83
TABLE E-01.10 LADLE REFINING FACILITY No. 1 EMISSION UNIT/PROCESS GROUP REQUIREMENTS EMISSION GROUP EULADLEREFINE1 Flexible Grouping ID NA I. DESIGN PARAMETERS A. Pollution Control Equipment
Baghouse
B. Stack/Vent Parameters NA Stack/Vent ID a. Minimum
Height (feet)
b. Maximum Exhaust Dimension
(inches)
c. Temp.
(°F)
d. Air Flow Rate
(acfm)
Applicable Requirement
SVLADLEREFINE1 148 108 150 175,000 NA C. Other Design Parameters NA II. MATERIAL USAGE/EMISSION LIMITS
A. Material Maximum Usage Rate NA NA
B. Pollutant Maximum Emission Limit 1. Opacity from ladle refining facility roof monitors.
1. 0% (R336.1301(c), 40 CFR 63.7790(a))
2. Opacity from ladle refining facility baghouse.
5%. (R336.1301(c))
3. PM from ladle refining facility baghouse.
1. 0.005 grains per dry standard cubic foot (R336.1331(c), 40 CFR 52.21(b)(3), 40 CFR 63.7790(a)) 2. 6.8 lb/hr (R336.1331(c), 40 CFR 52.21(b)(3))
4. PM10 1. 0.005 grains per dry standard cubic foot (R336.1205(1)(a) & (b)) 2. 6.8 lb/hr. (R336.1205(1)(a) & (b))
5. Pb 1. 0.0224 lb/hr. (40 CFR 52.21(d)) III. COMPLIANCE EVALUATION Records of all of the following shall be maintained on file for a period of 5 years.
A. MONITORING/RECORDKEEPING 1. Continuous Emission
Monitoring (CEM) System and Recordkeeping
NA
2. Process Monitoring System and Recordkeeping
NA
3. Other Monitoring and/or Recordkeeping
1. The permittee shall maintain a copy of each notification and report submitted under 40 CFR Part 63, Subpart FFFFF, including all documentation supporting the initial notification or notification of compliance status submitted according to 40 CFR 63.10(b)(2)(xiv)). (40 CFR 63.7842(a)(1))
2. The permittee shall maintain the records required for startup, shutdown
and malfunction under 63.6(e)(3)(iii) through (v). (40 CFR 63.7842(a)(2))
3. The permittee shall maintain records associated with performance tests, and performance evaluations as required by 40 CFR 63.10(b)(2)(viii). (40 CFR 63.7842(a)(3))

Severstal North America, Inc April 19, 2007 Permit No. 182-05B Page 52 of 83
TABLE E-01.10 LADLE REFINING FACILITY No. 1 EMISSION UNIT/PROCESS GROUP REQUIREMENTS
4. Except as allowed in S.C. 7, permittee shall install, operate, and maintain a bag leak detection system meeting the following specifications on the baghouse control: (40 CFR 63.7831(f)) a. Certified by the manufacturer to be capable of detecting emissions
of particulate matter at concentrations of 10 milligrams per actual cubic foot (0.0044 grains per actual cubic foot). (40 CFR 63.7831(f)(1))
b. Provides output of relative changes in particulate matter loadings. (40 CFR 63.7831(f)(2)) c. Is equipped with an alarm, located such that it is heard by
appropriate plant personnel, that sounds an alarm when an increase in relative particulate loadings is detected over a preset level.
(40 CFR 63.7831(f)(3)) d. Initially adjusted by establishing the baseline output by adjusting
the sensitivity (range) and the averaging period of the device and setting the alarm set points and alarm delay time. (40 CFR 63.7831(f)(5))
5. Following the initial adjustment of the bag leak detection system, the
permittee shall not adjust the sensitivity or range, averaging period, alarm set points or alarm delay time except as specified in the operation and maintenance plan. This requirement does not apply if the permittee installs a COMS as specified in S.C. 7. (40 CFR 63.7831(f)(6))
6. If the sensitivity of the bag leak detection system is changed beyond
the limits established pursuant to 40 CFR 63.7831(f)(6), a copy of a written certification by a responsible official shall be included in the semiannual compliance report for that period. This requirement does not apply if the permittee installs a COMS as specified in S.C. 7. (40 CFR 63.7833(c)(2))
7. If permittee does not install and operate a bag leak detection system,
the permittee shall install, operate, and maintain a COMS according to the requirements in 40 CFR Sec. 63.7831(h) and monitor the hourly average opacity of emissions exiting each control device stack according to the requirements in 40 CFR 63.7832. (40 CFR 63.7832)
8. The permittee shall monitor the pressure drop across each baghouse
compartment daily to ensure that the pressure drop is within the normal operating range identified in the manual. (40 CFR 63.7830(b)(1))
9. The permittee shall confirm that dust is being removed from hoppers on
a weekly basis through visual observations or other means of determining the proper functioning of the removal mechanisms. (40 CFR 63.7830(b)(2))
10. The permittee shall confirm that the compressed air supply to the pulse-
jet baghouse is operating properly on a daily basis. (40 CFR 63.7830(b)(3))
11. The permittee shall monitor the cleaning cycles of the baghouse to
ensure proper operation using appropriate technology. (40 CFR 63.7830(b)(4))

Severstal North America, Inc April 19, 2007 Permit No. 182-05B Page 53 of 83
TABLE E-01.10 LADLE REFINING FACILITY No. 1 EMISSION UNIT/PROCESS GROUP REQUIREMENTS
12. The permittee shall check the bag cleaning mechanisms for proper functioning through monthly visual inspections or equivalent means. (40 CFR 63.7830(b)(5))
13. The permittee shall inspect the baghouse to confirm the physical integrity of the baghouse through quarterly inspections of the interior of the baghouse for air leaks. (40 CFR 63.7830(b)(7))
14. The permittee shall inspect fans for wear, material buildup, and
corrosion on a quarterly basis using visual inspections, vibration detectors, or equivalent means. (40 CFR 63.7830(b)(8))
15. The permittee shall monitor the process as required by this table, except
during monitoring malfunctions, out-of-control periods, associated repairs, and required quality assurance or control activities (including calibration checks and required zero and span adjustments). (40 CFR 63.7832(a))
16. Data recorded during monitoring malfunctions, associated repairs, and
required quality assurance or control activities shall not be used in data averages and calculations used to report emission or operating levels or to fulfill minimum data availability requirements. (40 CFR 63.7832(b))
B. TESTING/RECORDKEEPING 1. Parameter to be Tested/
Recorded 1. Opacity 2. PM 3. PM-10 4. Pb
2. Method/Analysis Approved method. 3. Frequency and Schedule of
Testing/Recordkeeping 1. Sampling during the performance tests will occur only when the
operations being controlled are in operation. (40 CFR 63.7822(h)) 2. The permittee shall maintain records of the time corrective action was
initiated, the corrective action taken, and the date when corrective actions were completed in response to a bag leak detection system alarm. (40 CFR 63.7842(d) and 40 CFR 63.7833(c)(1))
3. The permittee shall demonstrate compliance with the opacity limitation
in II.B.1 with a certified observer of Method 9 visible emissions using Method 9 with the following exceptions: (40 CFR 63.7823(d)(1)(i)) a. Record observations to the nearest 5 percent at 15-second
intervals for at least three steel production cycles rather than using the procedure specified in Section 2.4 of Method 9. (40 CFR 63.7823(d)(1)(ii))
b. Determine the 3-minute block average opacity from the average of 12 consecutive observations recorded at 15-second intervals. (40 CFR 63.7823(d)(1)(iii))
4. Performance tests for visible emissions shall be conducted such that the opacity observations overlap with the performance tests for particulate. (40 CFR 63.7823(b))

Severstal North America, Inc April 19, 2007 Permit No. 182-05B Page 54 of 83
TABLE E-01.10 LADLE REFINING FACILITY No. 1 EMISSION UNIT/PROCESS GROUP REQUIREMENTS
5. Within 180 days after commencement of trial operation, the permittee
shall verify PM, PM10, and Pb emission rates from the Ladle Refining Facility No. 1 by testing at owner's expense, in accordance with Department requirements. No less than 60 days prior to testing, the permittee shall submit a complete test plan to the AQD. The AQD must approve the final plan prior to testing. Verification of emission rates includes the submittal of a complete report of the test results to the AQD within 60 days following the last date of the test. (R336.1205(1)(a) & (b), R336.2001, R336.2003, R336.2004, 40 CFR 52.21(b)(3))
6. Permittee shall conduct performance tests for particulate matter
emissions and opacity at least once per permit term. (40 CFR 63.7821)
IV. REPORTING Reports and Schedules 1. Permittee shall submit a notification of intent to perform any
performance testing under 40 CFR Part 63, Subpart FFFFF at least 60 calendar days before testing is to begin. (40 CFR 63.7840(d))
2. When actions taken by the permittee during a startup, shutdown, or
malfunction of an affected source (including actions taken to correct a malfunction) are not consistent with the procedures in the startup, shutdown, and malfunction plan, the permittee shall comply with the requirements of 63.10(d)(5)(ii). (40 CFR Part 63.7841(c))
V. OPERATIONAL PARAMETERS 1. The Ladle Refining Facility No. 1 shall not be operated unless the main baghouse is installed and operating
properly. (R336.1331(c), R336.1910, R336.1201(3)) 2. Ladle Refining Facility No. 1 and associated baghouse shall be operated and maintained in a manner
consistent with good air pollution control practices for minimizing emissions at least to the levels required by 40 CFR Part 63, Subpart FFFFF. (40 CFR 63.7800(a) and 40 CFR 63.6(e)(1)(i))
3. The permittee shall develop and implement a written startup, shutdown and malfunction plan for the Ladle Refining Facility No. 1 and the associated emission control system and operate in accordance with the plan during periods of startup, shutdown, and malfunction. (40 CFR 63.7810(c), 40 CFR 63.7835(b), and 40 CFR 63.6(e)(3))
VI. OTHER REQUIREMENTS 1. The permittee shall comply with the emission limitations and operation and maintenance requirements from
40 CFR Part 63, Subpart FFFFF specified in Table E-01.10, except during periods of startup, shutdown and malfunction. (40 CFR 63.7810(a))
2. Records required under 40 CFR Part 63, Subpart FFFFF and specified in this table shall be retained for five
years. The records must be maintained onsite for the two most recent years of the five year period. Records from the remaining three years of the five year period may be keep offsite. (40 CFR 63.7843(b) and (c))

Severstal North America, Inc April 19, 2007 Permit No. 182-05B Page 55 of 83
TABLE E-01.11 LADLE REFINING FACILITY No.2 EMISSION UNIT/PROCESS GROUP REQUIREMENTS EMISSION GROUP EULADLEREFINE2 Flexible Grouping ID NA I. DESIGN PARAMETERS A. Pollution Control Equipment
Baghouse
B. Stack/Vent Parameters Exhaust gases shall be discharged unobstructed vertically upwards unless otherwise noted.
Stack/Vent ID a. Minimum Height (feet)
b. Maximum Exhaust Dimension
(inches)
c. Temp.
(°F)
d. Air Flow Rate
(acfm)
Applicable Requirement
1. SVLADLEREFINE2 150 72 150 100,000 R336.1225 C. Other Design Parameters NA II. MATERIAL USAGE/EMISSION LIMITS
A. Material Maximum Usage Rate NA NA
B. Pollutant Maximum Emission Limit 1. PM 1. 0.005 grains per dry standard cubic foot (R336.1331(c),
40 CFR 52.21(b)(3), 40 CFR 63.7790(a)) 2. 3.87 lb/hr (R336.1331(c), 40 CFR 52.21(b)(3))
2. Visible emissions from baghouse stack
1. Shall not exceed a 6-minute average of 5% opacity. (R336.1201(3))
3. Opacity from the Ladle Refining No. 2 Building
1. 0% (R336.1301(c), 40 CFR 63.7790(a))
4. PM10 1. 0.005 grains per dry standard cubic foot (R336.1205(1)(a) & (b)) 2. 3.87 lb/hr. (R336.1205(1)(a) & (b))
5. Pb 1. 0.0128 lb/hr. (40 CFR 52.21(d)) III. COMPLIANCE EVALUATION Records of all of the following shall be maintained on file for a period of 5 years.
A. MONITORING/RECORDKEEPING 1. Continuous Emission
Monitoring (CEM) System and Recordkeeping
NA
2. Process Monitoring System and Recordkeeping
NA
3. Other Monitoring and/or Recordkeeping
1. The permittee shall maintain a copy of each notification and report submitted under 40 CFR Part 63, Subpart FFFFF, including all documentation supporting the initial notification or notification of compliance status submitted according to 40 CFR 63.10(b)(2)(xiv)). (40 CFR 63.7842(a)(1))
2. The permittee shall maintain the records required for startup, shutdown
and malfunction under 63.6(e)(3)(iii) through (v). (40 CFR 63.7842(a)(2))
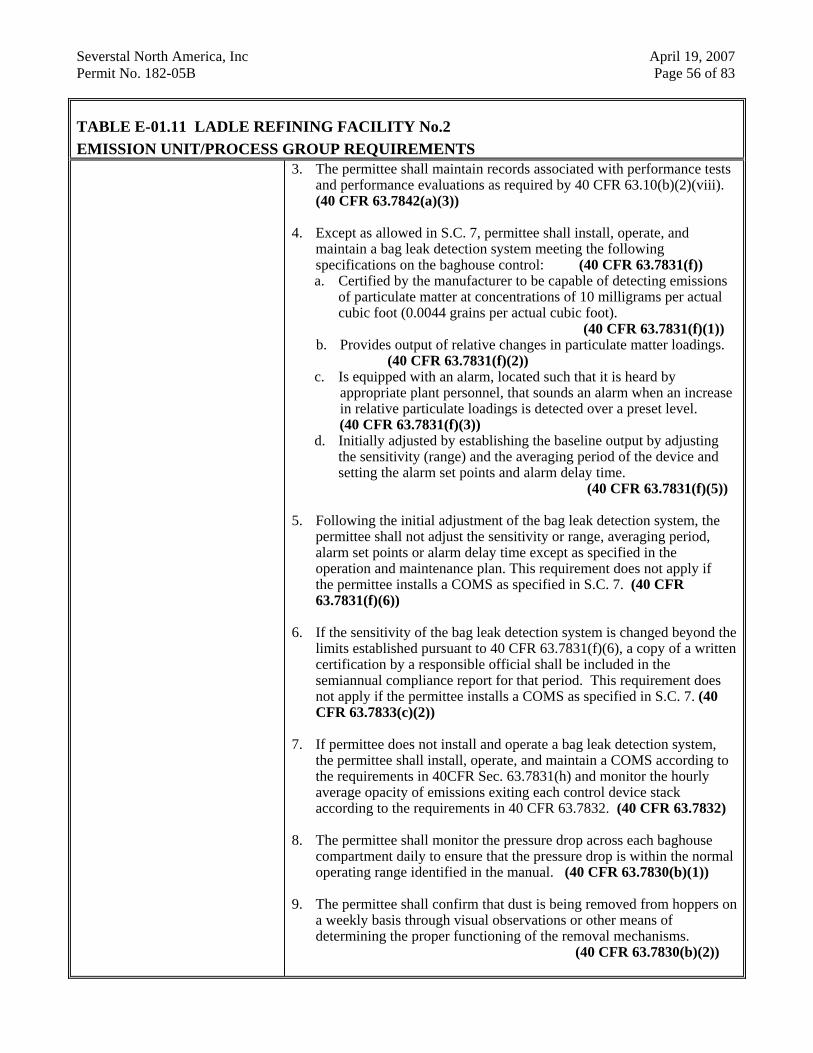
Severstal North America, Inc April 19, 2007 Permit No. 182-05B Page 56 of 83
TABLE E-01.11 LADLE REFINING FACILITY No.2 EMISSION UNIT/PROCESS GROUP REQUIREMENTS
3. The permittee shall maintain records associated with performance tests and performance evaluations as required by 40 CFR 63.10(b)(2)(viii). (40 CFR 63.7842(a)(3))
4. Except as allowed in S.C. 7, permittee shall install, operate, and maintain a bag leak detection system meeting the following specifications on the baghouse control: (40 CFR 63.7831(f)) a. Certified by the manufacturer to be capable of detecting emissions
of particulate matter at concentrations of 10 milligrams per actual cubic foot (0.0044 grains per actual cubic foot). (40 CFR 63.7831(f)(1))
b. Provides output of relative changes in particulate matter loadings. (40 CFR 63.7831(f)(2))
c. Is equipped with an alarm, located such that it is heard by appropriate plant personnel, that sounds an alarm when an increase in relative particulate loadings is detected over a preset level.
(40 CFR 63.7831(f)(3)) d. Initially adjusted by establishing the baseline output by adjusting
the sensitivity (range) and the averaging period of the device and setting the alarm set points and alarm delay time. (40 CFR 63.7831(f)(5))
5. Following the initial adjustment of the bag leak detection system, the
permittee shall not adjust the sensitivity or range, averaging period, alarm set points or alarm delay time except as specified in the operation and maintenance plan. This requirement does not apply if the permittee installs a COMS as specified in S.C. 7. (40 CFR 63.7831(f)(6))
6. If the sensitivity of the bag leak detection system is changed beyond the
limits established pursuant to 40 CFR 63.7831(f)(6), a copy of a written certification by a responsible official shall be included in the semiannual compliance report for that period. This requirement does not apply if the permittee installs a COMS as specified in S.C. 7. (40 CFR 63.7833(c)(2))
7. If permittee does not install and operate a bag leak detection system,
the permittee shall install, operate, and maintain a COMS according to the requirements in 40CFR Sec. 63.7831(h) and monitor the hourly average opacity of emissions exiting each control device stack according to the requirements in 40 CFR 63.7832. (40 CFR 63.7832)
8. The permittee shall monitor the pressure drop across each baghouse
compartment daily to ensure that the pressure drop is within the normal operating range identified in the manual. (40 CFR 63.7830(b)(1))
9. The permittee shall confirm that dust is being removed from hoppers on
a weekly basis through visual observations or other means of determining the proper functioning of the removal mechanisms. (40 CFR 63.7830(b)(2))

Severstal North America, Inc April 19, 2007 Permit No. 182-05B Page 57 of 83
TABLE E-01.11 LADLE REFINING FACILITY No.2 EMISSION UNIT/PROCESS GROUP REQUIREMENTS
10. The permittee shall confirm that the compressed air supply to the pulse-jet baghouse is operating properly on a daily basis. (40 CFR 63.7830(b)(3))
11. The permittee shall monitor the cleaning cycles of the baghouse to
ensure proper operation using appropriate technology. (40 CFR 63.7830(b)(4)
12. The permittee shall check the bag cleaning mechanisms for proper
functioning through monthly visual inspections or equivalent means. (40 CFR 63.7830(b)(5))
13. The permittee shall inspect the baghouse to confirm the physical
integrity of the baghouse through quarterly inspections of the interior of the baghouse for air leaks. (40 CFR 63.7830(b)(7))
14. The permittee shall inspect fans for wear, material buildup, and
corrosion on a quarterly basis using visual inspections, vibration detectors, or equivalent means. (40 CFR 63.7830(b)(8))
15. The permittee shall monitor the process as required by this table, except
during monitoring malfunctions, out-of-control periods, associated repairs, and required quality assurance or control activities (including calibration checks and required zero and span adjustments). (40 CFR 63.7832(a))
16. Data recorded during monitoring malfunctions, associated repairs, and
required quality assurance or control activities shall not be used in data averages and calculations used to report emission or operating levels or to fulfill minimum data availability requirements. (40 CFR 7832(b))
B. TESTING/RECORDKEEPING 1. Parameter to be Tested/
Recorded 1. Opacity 2. PM 3. PM-10 4. Pb
2. Method/Analysis Approved method. 3. Frequency and Schedule of
Testing/Recordkeeping 1. Sampling during the performance tests will occur only when the
operations being controlled are in operation. (40 CFR 63.7822(h))
2. The permittee shall maintain records of the time corrective action was initiated, the corrective action taken, and the date when corrective actions were completed in response to a bag leak detection system alarm. (40 CFR 63.7842(d) and 40 CFR 63.7833(c)(1))
3. The permittee shall demonstrate compliance with the opacity limitation
in II.B.3.1. with a certified observer of Method 9 visible emissions using Method 9 with the following exceptions: (40 CFR 63.7823(d)(1)(i))

Severstal North America, Inc April 19, 2007 Permit No. 182-05B Page 58 of 83
TABLE E-01.11 LADLE REFINING FACILITY No.2 EMISSION UNIT/PROCESS GROUP REQUIREMENTS
a. Record observations to the nearest 5 percent at 15-second intervals
for at least three steel production cycles rather than using the procedure specified in Section 2.4 of Method 9. (40 CFR 63.7823(d)(1)(ii))
b. Determine the 3-minute block average opacity from the average of 12 consecutive observations recorded at 15-second intervals. (40 CFR 63.7823(d)(1)(iii))
4. Performance tests for visible emissions shall be conducted such that
the opacity observations overlap with the performance tests for particulate. (40 CFR 63.7823(b))
5. Within 180 days after commencement of trial operation, the permittee
shall verify PM, PM10, and Pb emission rates from the Ladle Refining Facility No. 2 by testing at owner's expense, in accordance with Department requirements. No less than 60 days prior to testing, the permittee shall submit a complete test plan to the AQD. The AQD must approve the final plan prior to testing. Verification of emission rates includes the submittal of a complete report of the test results to the AQD within 60 days following the last date of the test. (R336.1205(1)(a) & (b), R336.2001, R336.2003, R336.2004, 40 CFR 52.21(b)(3))
6. Permittee shall conduct performance tests for particulate matter
emissions and opacity at least once per permit term. (40 CFR 63.7821)
IV. REPORTING Reports and Schedules 1. Permittee shall submit a notification of intent to perform any
performance testing under 40 CFR Part 63, Subpart FFFFF at least 60 calendar days before testing is to begin. (40 CFR 63.7840(d))
2. When actions taken by the permittee during a startup, shutdown, or
malfunction of an affected source (including actions taken to correct a malfunction) are not consistent with the procedures in the startup, shutdown, and malfunction plan, the permittee shall comply with the requirements of 63.10(d)(5)(ii). (40 CFR Part 63.7841(c))
V. OPERATIONAL PARAMETERS 1. The permittee shall not operate the Ladle Refining Facility No. 2 unless the 100,000 ACFM baghouse dust
collector is installed and operating properly. (R336.1201(3), R336.1331(c), R336.1910) 2. Ladle Refining Facility No. 2 and the associated baghouse shall be operated and maintained in a manner
consistent with good air pollution control practices for minimizing emissions at least to the levels required by 40 CFR Part 63, Subpart FFFFF. (40 CFR 63.7800(a) and 40 CFR 63.6(e)(1)(i))
3. The permittee shall develop and implement a written startup, shutdown and malfunction plan for the Ladle
Refining Facility No. 2 and the associated emission control system and operate in accordance with the plan during periods of startup, shutdown, and malfunction. (40 CFR 63.7810(c), 40 CFR 63.7835(b), and 40 CFR 63.6(e)(3))

Severstal North America, Inc April 19, 2007 Permit No. 182-05B Page 59 of 83
TABLE E-01.11 LADLE REFINING FACILITY No.2 EMISSION UNIT/PROCESS GROUP REQUIREMENTS VI. OTHER REQUIREMENTS 1. The permittee shall comply with the emission limitations and operation and maintenance requirements from
40 CFR Part 63, Subpart FFFFF specified in Table E-01.11, except during periods of startup, shutdown and malfunction. (40 CFR 63.7810(a))
2. Records required under 40 CFR Part 63, Subpart FFFFF and specified in this table shall be retained for five
years. The records must be maintained onsite for the two most recent years of the five year period. Records from the remaining three years of the five year period may be keep offsite. (40 CFR 63.7843(b) and (c))

Severstal North America, Inc April 19, 2007 Permit No. 182-05B Page 60 of 83
TABLE E-01.12 ANNEALING FURNACES FLEXIBLE GROUPING REQUIREMENTS FLEXIBLE GROUPING NA Emission Unit / Process Group EUANNEALFURNACES I. DESIGN PARAMETERS A. Pollution Control Equipment
NA
B. Stack/Vent Parameters NA Stack/Vent ID a. Minimum
Height (feet)
b. Maximum Exhaust Dimension
(inches)
c. Temp.
(°F)
d. Air Flow Rate
(acfm)
Applicable Requirement
NA NA NA NA NA NA C. Other Design Parameters NA II. MATERIAL USAGE/EMISSION LIMITS
A. Material Maximum Usage Rate NA NA
B. Pollutant Maximum Emission Limit Nitrogen Oxide 1. 140 lb/ MMscf natural gas fired (R336.1205(1)(a) & (b)) PM 1. 10 lb/MMscf natural gas fired. (40 CFR 52.21(b)(3)) PM10 1. 10 lb/MMscf natural gas fired. (R336.1205(1)(a) & (b)) III. COMPLIANCE EVALUATION Records of all of the following shall be maintained on file for a period of 5 years.
A. MONITORING/RECORDKEEPING 1. Continuous Emission
Monitoring (CEM) System and Recordkeeping
NA
2. Process Monitoring System and Recordkeeping
The permittee shall keep a record of the following for the annealing furnaces: 1. Total natural gas consumption per month. (R336.1205(1)(a) & (b)
3. Other Monitoring and/or Recordkeeping
NA
B. TESTING/RECORDKEEPING 1. Parameter to be Tested/
Recorded 1. NOx 2. PM 3. PM-10
2. Method/Analysis Approved method

Severstal North America, Inc April 19, 2007 Permit No. 182-05B Page 61 of 83
TABLE E-01.12 ANNEALING FURNACES FLEXIBLE GROUPING REQUIREMENTS 3. Frequency and Schedule of
Testing/Recordkeeping Within 180 days after commencement of trial operation, the permittee shall verify NOx, PM, and PM-10 emission rates from a representative annealing furnace from EUANNEALFURNACES by testing at owner's expense, in accordance with Department requirements. No less than 60 days prior to testing, the permittee shall submit a complete test plan to the AQD. The AQD must approve the final plan prior to testing. Verification of emission rates includes the submittal of a complete report of the test results to the AQD within 60 days following the last date of the test. (R336.1205(1)(a) & (b), R336.1331, R336.2001, R336.2003, R336.2004, 40 CFR 52.21(b)(3))
IV. REPORTING Reports and Schedules NA V. OPERATIONAL PARAMETERS 1. Oil shall not be used as fuel in the annealing furnaces. (R336.1205(1)(a) & (b)) VI. OTHER REQUIREMENTS NA

Severstal North America, Inc April 19, 2007 Permit No. 182-05B Page 62 of 83
TABLE F-01.01 B & C BLAST FURNACE CASTHOUSE OPERATIONS EMISSION UNIT/PROCESS GROUP REQUIREMENTS FLEXIBLE GROUPING FGB&CBFCASTHOUSES Emission Unit/Process Group EUBBFCASTHOUSE, EUCBFCASTHOUSE I. DESIGN PARAMETERS A. Pollution Control Equipment
Baghouse control of fugitive emissions (one for each operating casthouse)
B. Stack/Vent Parameters NA Stack/Vent ID a. Minimum
Height (feet)
b. Maximum Exhaust Dimension
(inches)
c. Temp.
(°F)
d. Air Flow Rate
(acfm)
Applicable Requirement
SVBBFROOFMONEAST 75.2 NA NA NA R336.1225 SVBBFROOFMONWEST 75.2 NA NA NA R336.1225 SVBFCE (baghouse) 200 111 150 250,000 R336.1225 SVCBFROOFMONEAST 75.2 NA NA NA R336.1225 SVCBFROOFMONWEST 75.2 NA NA NA R336.1225 SVCFCE (baghouse) 200 153 150 500,000 R336.1225 C. Other Design Parameters NA II. MATERIAL USAGE/EMISSION LIMITS
A. Material Maximum Usage Rate NA NA
B. Pollutant Maximum Emission Limit 1. PM 1. 19.93 tpy1 from roof monitors (40 CFR 52.21(b)(3)) 2. PM-10 1. 10.16 tpy1 from roof monitors (R336.1205(1)(a) & (b)) 3. SO2 from baghouse stacks 1. 29.94 lb/hr (40 CFR 52.21 (c) & (d), 40 CFR 52.21 (j))
2. 91.79 ton per 12-month rolling time period (40 CFR 52.21 (c), (d), & (j))
4. NOx from baghouse stacks 1. 3.19 lb/hr (R336.1205(1)(a) & (b)) 2. 9.77 ton per 12-month rolling time period (R336.1205(1)(a) & (b))
5. VOC from baghouse stacks 1. 8.81 lb/hr (R336.1702(a)) 6. Mn 1. 0.00385 lb/hr total from baghouse stacks (R336.1225)
2. 0.00602 lb/hr from roof monitors (R336.1225) 7. Pb 1. 0.000223 lb/hr total from baghouse stacks (40 CFR 52.21(d))
2. 0.0000871 lb/hr from roof monitors (40 CFR 52.21(d)) 1 These limits are based on a 12-month rolling time period. 2 This limit is based on a daily time period III. COMPLIANCE EVALUATION Records of all of the following shall be maintained on file for a period of 5 years.
A. MONITORING/RECORDKEEPING 1. Continuous Emission
Monitoring (CEM) System and Recordkeeping
NA
2. Process Monitoring System and Recordkeeping
NA

Severstal North America, Inc April 19, 2007 Permit No. 182-05B Page 63 of 83
TABLE F-01.01 B & C BLAST FURNACE CASTHOUSE OPERATIONS EMISSION UNIT/PROCESS GROUP REQUIREMENTS 3. Other Monitoring and/or
Recordkeeping 1. Using the method shown in Appendix 1.7, the permittee shall calculate
and record by the end of each calendar month the following from the casthouse roof monitors:
a. emissions of PM b. emissions of PM-10 c. emissions of Mn d. emissions of Pb
(R336.1205(1)(a) & (b), R336.1225, 40 CFR 52.21(b)(3), 40 CFR 52.21(d)) 2. The permittee shall keep a daily record of the amount of iron cast from
each furnace individually and combined. (R336.1205(1)(a) & (b), R336.1225)
3. Using the method shown in Appendix 1.7, the permittee shall calculate
records of SO2, NOx, VOC, Mn, and Pb emissions for FGB&CBFCASTHOUSES (baghouses) using emission factors developed during the testing required in S.C. III.B.3.1 and S.C. III.B.3.10 of Table E-01.04, and other factors, as specified in Appendix 1.7. The permittee shall keep all records on file at the facility for a period of at least five years and make them available to the Department upon request. (R336.1205(1)(a) & (b), 40 CFR 52.21(c) and (d))
B. TESTING/RECORDKEEPING 1. Parameter to be Tested/
Recorded NA
2. Method/Analysis NA 3. Frequency and Schedule of
Testing/Recordkeeping NA
IV. REPORTING Reports and Schedules 1. Permittee shall report the results of the initial performance test in the
notification of compliance status. (40 CFR 63.7820(a), 40 CFR 63.7825(c) and 40 CFR 63.7840(e))
V. OPERATIONAL PARAMETERS 1. The iron production from FGB&CBFCASTHOUSES shall not exceed a combined maximum of 10,000
ton/day based on a calendar week average. (R336.1205(1)(a) & (b), R336.1225, 40 CFR 52.21(b)(3)) 2. The iron production from FGB&CBFCASTHOUSES shall not exceed a combined maximum of 3,321,500
tons per 12-month rolling period. (R336.1205(1)(a) & (b), R336.1225, 40 CFR 52.21(b)(3)) VI. OTHER REQUIREMENTS NA

Severstal North America, Inc April 19, 2007 Permit No. 182-05B Page 64 of 83
TABLE F-01.02 B AND C BLAST FURNACE STOVES FLEXIBLE GROUPING REQUIREMENTS FLEXIBLE GROUPING FGB&CSTOVES Emission Unit/Process Group EUBFCESTOVE, EUCFCESTOVE I. DESIGN PARAMETERS A. Pollution Control Equipment
Low-NOx technology, mechanical collectors and scrubbers for blast furnace gas precleaning
B. Stack/Vent Parameters NA Stack/Vent ID a. Minimum
Height (feet)
b. Maximum Exhaust Dimension
(inches)
c. Temp.
(°F)
d. Air Flow Rate
(acfm)
Applicable Requirement
NA NA NA NA NA NA C. Other Design Parameters NA II. MATERIAL USAGE/EMISSION LIMITS
A. Material Maximum Usage Rate NA NA
B. Pollutant Maximum Emission Limit 1. NOx 439.18 ton/12-month rolling period (R336.1205(1)(a) & (b)) 2. SO2 1,096.1 ton/12-month rolling period (40 CFR 52.21(j)) 3. CO 8,760 ton/12-month rolling period. (40 CFR 52.21(d) & (j)) 4. PM 14.16 lb/hr (40 CFR 52.21(b)(3)) 5. PM-10 14.16 lb/hr (R336.1205(1)(a) & (b)) 6. Mn 0.0154 lb/hr (R336.1225) 7. Total Hg 0.000414 lb/hr (R336.1201(3), R336.1228, R336.1901) 8. Pb 0.0141 lb/hr (40 CFR 52.21(d)) III. COMPLIANCE EVALUATION Records of all of the following shall be maintained on file for a period of 5 years.
A. MONITORING/RECORDKEEPING 1. Continuous Emission
Monitoring (CEM) System and Recordkeeping
NA
2. Process Monitoring System and Recordkeeping
1. The permittee shall keep, in a satisfactory manner, daily fuel usage records for FGB&CSTOVES. The permittee shall keep all records on file at the facility for a period of at least five years and make them available to the Department upon request. (R336.1205(1)(a) & (b), 40 CFR 52.21(b)(3), (c), & (d))
2. Following the performance testing required in S.C. III.B.3.1 of Table
E-01.03 and S.C. III.B.3.1 of Table E-01.05, the permittee shall determine compliance with emission limits in S.C. II.B.1, II.B.3, II.B.4, II.B.5, II.B.6, II.B.7, and II.B.8 of this table by establishing emission factors based up on the BFCE and CFCE stove stack testing and applying these emission factors to the daily fuel usage recorded in S.C. III.A.2.1, as outlined in Appendix 1.7. (R336.1205(1)(a) & (b), R336.1225, R336.1228, R336.1901, 40 CFR 52.21(b)(3), (c), & (d))

Severstal North America, Inc April 19, 2007 Permit No. 182-05B Page 65 of 83
TABLE F-01.02 B AND C BLAST FURNACE STOVES FLEXIBLE GROUPING REQUIREMENTS
3. Utilizing the CEMS for SO2 emissions from the C Blast Furnace stoves, the permittee shall determine compliance with the emission limits in S.C. II.B.2 by determining daily emission factors and applying these emission factors to the daily fuel usage recorded in S.C. III.A.2.1, as outlined in Appendix 1.7. (40 CFR 52.21 (c), & (d))
3. Other Monitoring and/or Recordkeeping
NA
B. TESTING/RECORDKEEPING 1. Parameter to be Tested/
Recorded NA
2. Method/Analysis NA 3. Frequency and Schedule of
Testing/Recordkeeping NA
IV. REPORTING Reports and Schedules NA V. OPERATIONAL PARAMETERS NA VI. OTHER REQUIREMENTS NA

Severstal North America, Inc April 19, 2007 Permit No. 182-05B Page 66 of 83
TABLE F-01.03 BASIC OXYGEN FURNACE (BOF)/RELADLING SOUTH & NORTH BOF EMISSION UNIT/PROCESS GROUP REQUIREMENTS EMISSION GROUP EUBOF, EURELADLINGBOF Flexible Grouping ID FGBOFSHOP I. DESIGN PARAMETERS A. Pollution Control Equipment
Baghouse
B. Stack/Vent Parameters NA Stack/Vent ID a. Minimum
Height (feet)
b. Maximum Exhaust Dimension
(inches)
c. Temp.
(°F)
d. Air Flow Rate
(acfm)
Applicable Requirement
SVBOFESP 213 204 300 841,000 R336.1225 SVBOFBH 200 222 150 1,000,000 R336.1225 C. Other Design Parameters 1. NA II. MATERIAL USAGE/EMISSION LIMITS
A. Material Maximum Usage Rate NA NA
B. Pollutant Maximum Emission Limit 1. PM.
1. 0.003 gr/dscf from baghouse stack (R336.1331(c), 40 CFR 63.7790(a), 40 CFR 52.21(b)(3))
2. 7.45 lb/hr from baghouse stack (40 CFR 52.21(b)(3))
2. PM-10.
1. 0.00135 gr/dscf from baghouse stack. (R336.1205(1)(a) & (b)) 2. 3.35 lb/hr from baghouse stack (R336.1205(1)(a) & (b))
3. NOx 1. 10.17 lb/hr from the baghouse stack. (R336.1205(1)(a) & (b)) 4. Manganese 1. 0.101 lb/hr from baghouse and ESP stacks combined. (R336.1225)
2. 0.0709 lb/hr from the baghouse stack. (R336.1225)
5. Total Mercury 1. 0.0125 lb/hr from the baghouse and ESP stacks combined. (R336.1201(3), R336.1228, R336.1901)
6. Lead 1. 0.067 lb/hr from the baghouse and ESP stacks combined. (40 CFR 52.21(d))
7. Opacity from baghouse stack. 1. 20% (R336.1364(1), R336.1365(1)) III. COMPLIANCE EVALUATION Records of all of the following shall be maintained on file for a period of 5 years.
A. MONITORING/RECORDKEEPING 1. Continuous Emission
Monitoring (CEM) System and Recordkeeping
NA
2. Process Monitoring System and Recordkeeping
1. If applicable, the permittee shall install, maintain, and operate a Continuous Parametric Monitoring System (CPMS) for the baghouse capture system according to the requirements of 40 CFR 63.7830(a) and 40 CFR 63.7831(e). (40 CFR 63.7830(a))
3. Other Monitoring and/or Recordkeeping
1. The permittee shall maintain a copy of each notification and report submitted under 40 CFR Part 63, Subpart FFFFF, including all

Severstal North America, Inc April 19, 2007 Permit No. 182-05B Page 67 of 83
TABLE F-01.03 BASIC OXYGEN FURNACE (BOF)/RELADLING SOUTH & NORTH BOF EMISSION UNIT/PROCESS GROUP REQUIREMENTS
documentation supporting the initial notification or notification of compliance status submitted according to 40 CFR 63.10(b)(2)(xiv)). (40 CFR 63.7842(a)(1))
2. The permittee shall maintain the records required for startup, shutdown
and malfunction under 63.6(e)(3)(iii) through (v). (40 CFR 63.7842(a)(2)) 3. The permittee shall maintain records associated with performance tests,
performance evaluations, and opacity observations as required by 40 CFR 63.10(b)(2)(viii). (40 CFR 63.7842(a)(3))
4. The permittee shall comply with the recordkeeping requirement as
specified in 40 CFR Part 63 Subpart FFFFF 63.7842(a), (b), (c) and (d). (40 CFR 63.7842(a), (b), (c) and (d))
5. Except as allowed in S.C. 8, permittee shall install, operate, and maintain
a bag leak detection system meeting the following specifications on the baghouse control, if applicable: (40 CFR 63.7831(f)) a. Certified by the manufacturer to be capable of detecting emissions of
particulate matter at concentrations of 10 milligrams per actual cubic foot (0.0044 grains per actual cubic foot). (40 CFR 63.7831(f)(1))
b. Provides output of relative changes in particulate matter loadings. (40 CFR 63.7831(f)(2))
c. Is equipped with an alarm, located such that it is heard by appropriate plant personnel, that sounds an alarm when an increase in relative particulate loadings is detected over a preset level. (40 CFR 63.7831(f)(3))
d. Initially adjusted by establishing the baseline output by adjusting the sensitivity (range) and the averaging period of the device and setting the alarm set points and alarm delay time. (40 CFR 63.7831(f)(5))
6. Following the initial adjustment of the bag leak detection system, the
permittee shall not adjust the sensitivity or range, averaging period, alarm set points or alarm delay time except as specified in the operation and maintenance plan, if applicable. This requirement does not apply if the permittee installs a COMS as specified in S.C. 8. (40 CFR 63.7831(f)(6))
7. If the sensitivity of the bag leak detection system is changed beyond the
limits established pursuant to 40 CFR 63.7831(f)(6), a copy of a written certification by a responsible official shall be included in the semiannual compliance report for that period, if applicable. This requirement does not apply if the permittee installs a COMS as specified in S.C. 8. (40 CFR 63.7833(c)(2))
8. If permittee does not install and operate a bag leak detection system, the
permittee shall install, operate, and maintain a COMS according to the requirements in 40CFR Sec. 63.7831(h) and monitor the hourly average opacity of emissions exiting each control device stack according to the requirements in 40 CFR 63.7832. (40 CFR 63.7832)

Severstal North America, Inc April 19, 2007 Permit No. 182-05B Page 68 of 83
TABLE F-01.03 BASIC OXYGEN FURNACE (BOF)/RELADLING SOUTH & NORTH BOF EMISSION UNIT/PROCESS GROUP REQUIREMENTS
9. The permittee shall monitor the pressure drop across each baghouse compartment daily to ensure that the pressure drop is within the normal operating range identified in the manual, if applicable. (40 CFR 63.7830(b)(1))
10. The permittee shall confirm that dust is being removed from hoppers on a
weekly basis through visual observations or other means of determining the proper functioning of the removal mechanisms, if applicable. (40 CFR 63.7830(b)(2))
11. The permittee shall confirm that the compressed air supply to the pulse-jet
baghouse is operating properly on a daily basis, if applicable. (40 CFR 63.7830(b)(3))
12. The permittee shall monitor the cleaning cycles of the baghouse to ensure
proper operation using appropriate technology, if applicable. (40 CFR 63.7830(b)(4))
13. The permittee shall check the bag cleaning mechanisms for proper
functioning through monthly visual inspections or equivalent means, if applicable. (40 CFR 63.7830(b)(5))
14. The permittee shall inspect the baghouse to confirm the physical integrity
of the baghouse through quarterly inspections of the interior of the baghouse for air leaks, if applicable. (40 CFR 63.7830(b)(7))
15. The permittee shall inspect fans for wear, material buildup, and corrosion
on a quarterly basis using visual inspections, vibration detectors, or equivalent means, if applicable. (40 CFR 63.7830(b)(8))
16. The permittee shall monitor the process as required by this table, except
during monitoring malfunctions, out-of-control periods, associated repairs, and required quality assurance or control activities (including calibration checks and required zero and span adjustments). (40 CFR 63.7832(a))
17. Data recorded during monitoring malfunctions, associated repairs, and
required quality assurance or control activities shall not be used in data averages and calculations used to report emission or operating levels or to fulfill minimum data availability requirements. (40 CFR 63.7832(b))
18. The permittee shall obtain an analysis of the BOF baghouse dust once per
calendar month during the 1st year after the modification of C blast furnace and quarterly thereafter, or less frequently if approved in writing by the Air Quality Division. The analysis shall determine the percentage of Pb, Hg, and Mn in the collected PM dust from the baghouse. The permittee shall submit an acceptable protocol for baghouse dust sampling and analysis methods to the Air Quality Division, at least 60 days prior the initial performance emission test. (R336.1225, R336.1228, 40 CFR 52.21(d))

Severstal North America, Inc April 19, 2007 Permit No. 182-05B Page 69 of 83
TABLE F-01.03 BASIC OXYGEN FURNACE (BOF)/RELADLING SOUTH & NORTH BOF EMISSION UNIT/PROCESS GROUP REQUIREMENTS
19. The permittee shall prepare, and operate at all times according to, a written operation and maintenance plan for the baghouse capture system. The plan shall address each of the following: (40 CFR 63.7800(b)) a. Weekly inspections of the equipment that is important to the
performance of the total capture system, including, but not limited to, observations of the physical appearance of the equipment and requirements to repair any defect or deficiency in the capture system before the next scheduled inspection; (R336.1301, R336.1364(1), 40 CFR 63.7800(b)(1))
b. Operating limit parameters appropriate for the capture system design that are representative and reliable indicators of the performance of the capture system including, but not limited to, operating limit parameters that indicate the level of the ventilation draft and the damper position settings for the capture system when operating to collect emissions, including revised settings for seasonal variations. Appropriate operating limit parameters for ventilation draft include, but are not limited to, volumetric flow rate through each separately ducted hood, total volumetric flow rate at the inlet to the control device to which the capture system is vented, fan motor amperage, or static pressure. (40 CFR 63.7800(b)(3))
20. If applicable, the permittee shall monitor the hourly average actual
volumetric flow rate through each separately ducted hood for each steel production cycle and the average total volumetric flow rate at the inlet to the baghouse for each steel production cycle according to the requirements in 40 CFR 63.7832. (40 CFR 63.7830(a))
21. If applicable, the permittee shall develop and make available for
inspection upon request by AQD a site-specific monitoring plan that addresses all of the following requirements for the baghouse capture system: (40 CFR 63.7831(a)) a. Installation of the CPMS sampling probe or other interface at a
measurement location relative to each hooded emission point such that the measurement is representative of capture of the exhaust emissions; (40 CFR 63.7831(a)(1))
b. Performance and equipment specifications for the sample interface, the parametric signal analyzer, and the data collection and reduction system; (40 CFR 63.7831(a)(2))
c. Performance evaluation procedures and acceptance criteria; (40 CFR 63.7831(a)(3))
d. Ongoing operation and maintenance procedures in accordance with the general requirements of 40 CFR 63.8(c)(1), (c)(3), (c)(4)(ii), (c)(7), and (c)(8); (40 CFR 63.7831(a)(4))
e. Ongoing data quality assurance procedures in accordance with the general requirements of 40 CFR 63.8(d); and (40 CFR 63.7831(a)(5))
f. Ongoing recordkeeping and reporting procedures in accordance the general requirements of 40 CFR 63.10(c), (e)(1), and (e)(2)(i). (40 CFR 63.7831(a)(6))

Severstal North America, Inc April 19, 2007 Permit No. 182-05B Page 70 of 83
TABLE F-01.03 BASIC OXYGEN FURNACE (BOF)/RELADLING SOUTH & NORTH BOF EMISSION UNIT/PROCESS GROUP REQUIREMENTS
22. If applicable, the permittee shall operate and maintain the capture system
CPMS in continuous operation according to the site-specific monitoring plan. Unless otherwise specified, the CPMS shall: (40 CFR 63.7831(b)) a. Complete a minimum of one cycle of operation for each successive
15-minute period and collect a minimum of three of the required four data points to constitute a valid hour of data; (40 CFR 63.7831(b)(1))
b. Provide valid hourly data for at least 95 percent of every averaging period; and (40 CFR 63.7831(b)(2))
c. Determine and record the hourly average of all recorded readings. (40 CFR 63.7831(b)(3))
23. The permittee shall operate the baghouse capture system at or above the
lowest value or settings established for the operating limits in the operation and maintenance plan and collect, reduce, and record the monitoring data for each of the operating limit parameters. (40 CFR 63.7833(b))
B. TESTING/RECORDKEEPING 1. Parameter to be Tested/
Recorded 1. Opacity 2. PM 3. PM-10 4. NOx 5. Mn 6. Speciated Hg 7. Pb
2. Method/Analysis Approved method. 3. Frequency and Schedule of
Testing/Recordkeeping 1. The permittee shall conduct a performance test to demonstrate initial
compliance with the applicable emission and opacity limitations of 40 CFR Part 63, Subpart FFFFF contained in this table within 180 days of startup of the baghouse. (40 CFR 63.7820(a))
2. Performance tests shall occur when the operations are at maximum
routine operating conditions. (R336.2003, 40 CFR 63.7822(g) & (h)) 3. Permittee shall determine and record the starting and stopping times of
the steel production cycle. (40 CFR 63.7823(d)(5)) 4. The permittee shall maintain a copy of the current operation and
maintenance plans required in this table onsite and available for inspection. (40 CFR 63.7834(b))

Severstal North America, Inc April 19, 2007 Permit No. 182-05B Page 71 of 83
TABLE F-01.03 BASIC OXYGEN FURNACE (BOF)/RELADLING SOUTH & NORTH BOF EMISSION UNIT/PROCESS GROUP REQUIREMENTS
5. The permittee shall maintain records of the time corrective action was initiated, the corrective action taken, and the date when corrective actions were completed in response to a bag leak detection system alarm, if applicable. (40 CFR 63.7842(d) and 40 CFR 63.7833(c)(1))
6. Within 60 days of achieving the maximum production rate, but not later
than 180 days after commencement of trial operation, the permittee shall verify and quantify Mn, Pb, and speciated Hg emissions rates from the FGBOFSHOP (baghouse and ESP simultaneously) and the ratio of Mn, Pb, and Hg concentrations in both the ESP dust and the baghouse dust to the actual amount of Mn, Pb, and Hg emitted from the baghouse and ESP, by testing at owner's expense, in accordance with Department requirements. No less than 60 days prior to testing, the permittee shall submit a complete test plan to the AQD. The AQD must approve the final plan prior to testing. Verification of emission rates includes the submittal of a complete report of the test results to the AQD within 60 days following the last date of the test. (R336.1225, R336.1228, R336.2001, R336.2003, R336.2004, 40 CFR 52.21(d))
7. The permittee shall certify that the baghouse capture system operated
during the performance test at the site-specific operating limits established in the operation and maintenance plan using the following procedures: (40 CFR 63.7824(a)) a. Concurrent with all opacity observations, measure and record values
for each of the operating limit parameters in the capture system operation and maintenance plan according to the monitoring requirements specified in 40 CFR 63.7830(a). (40 CFR 63.7824(a)(1))
b. For any dampers that are manually set and remain at the same position at all times the capture system is operating, the damper position shall be visually checked and recorded at the beginning and end of each opacity observation period segment. (40 CFR 63.7824(a)(2))
c. Review and record the monitoring data and identify and explain any times the capture system operated outside the applicable operating limits. (40 CFR 63.7824(a)(3))
d. Certify in the performance test report that during all observation period segments, the capture system was operating at the values or settings established in the capture system operation and maintenance plan. (40 CFR 63.7824(a)(4))
8. The permittee may change the operating limits for the baghouse capture
system if the following requirements are met: (40 CFR 63.7824(d)) a. Submit a written notification to the Administrator requesting to
conduct a new performance test to revise the operating limit. (40 CFR 63.7824(d)(1))
b. Conduct a performance test to demonstrate compliance with the applicable operating limitation. (40 CFR 63.7824(d)(2))
c. Establish revised operating limits according to the applicable procedures in 40 CFR 63.7824, paragraphs (a) through (c) for a capture system. (40 CFR 63.7824(d)(3))

Severstal North America, Inc April 19, 2007 Permit No. 182-05B Page 72 of 83
TABLE F-01.03 BASIC OXYGEN FURNACE (BOF)/RELADLING SOUTH & NORTH BOF EMISSION UNIT/PROCESS GROUP REQUIREMENTS
9. Within 180 days after commencement of trial operation, the permittee
shall verify NOx, PM, and PM10 emission rates from the baghouse stack by testing at owner's expense, in accordance with Department requirements. No less than 60 days prior to testing, the permittee shall submit a complete test plan to the AQD. The AQD must approve the final plan prior to testing. Verification of emission rates includes the submittal of a complete report of the test results to the AQD within 60 days following the last date of the test. (R336.1205(1)(a) & (b), R336.2001, R336.2003, R336.2004, 40 CFR 52.21(b)(3))
10. Permittee shall conduct overlapping performance tests for particulate
matter emissions from the BOF secondary baghouse and opacity from the BOF roof monitor at least once per permit term. (40 CFR 63.7821)
IV. REPORTING Reports and Schedules 1. Permittee shall report the results of the initial performance test in the
notification of compliance status. (40 CFR 63.7820(a), 40 CFR 63.7825(c) and 40 CFR 63.7840(e))
2. Permittee shall submit a notification of intent to perform any performance
testing under 40 CFR Part 63, Subpart FFFFF at least 60 calendar days before testing is to begin. (40 CFR 63.7840(d))
3. Any time an action taken by the permittee during a startup, shutdown, or
malfunction of an affected source (including actions taken to correct a malfunction) is not consistent with the procedures in the startup, shutdown, and malfunction plan, the permittee shall comply with all requirements of 63.10(d)(5)(ii). (40 CFR Part 63.7841(c))
V. OPERATIONAL PARAMETERS 1. The permittee shall install a baghouse dust collector for BOF secondary emissions according to the following
schedule: a. Complete construction and place in operation by January 31, 2008, or startup of enhanced C-FCE,
whichever is sooner. (R336.1205(1)(a) & (b), 40 CFR 52.21(b)(3)) 2. After completion of C-FCE modification, the permittee shall not operate the Basic Oxygen Furnace or the
Reladling South Operation unless the baghouse secondary emission dust collector is installed, maintained, and operated in a satisfactory manner. (R336.1205(1)(a) & (b), R336.1225, R336.1331(c), R336.1910, 40 CFR 52.21(b)(3))
3. The permittee shall keep on file a copy of the BOF secondary baghouse capture system design plans and a
signed certification from the designer, certifying that the baghouse capture system is designed to achieve no less than 98% collection efficiency for both the BOF secondary emissions and the reladling south emissions. These design plans shall include a range of BOF vessel angles to achieve optimum emission capture. (R336.1205(1)(a) & (b), 40 CFR 52.21(b)(3))
VI. OTHER REQUIREMENTS 1. Records required under 40 CFR Part 63, Subpart FFFFF and specified in this table shall be retained for five
years. The records must be maintained onsite for the two most recent years of the five year period. Records from the remaining three years of the five year period may be keep offsite. (40 CFR 63.7843(b) and (c))

Severstal North America, Inc April 19, 2007 Permit No. 182-05B Page 73 of 83
TABLE F-01.04 SLAB REHEAT FURNACES 1, 2 & 3 AT HOT STRIP MILL BUILDING FLEXIBLE GROUPING REQUIREMENTS FLEXIBLE GROUPING FGSREHEATFURNACE123 Emission Unit / Process Group EUSREHEATFURNACE1, EUSREHEATFURNACE2,
EUSREHEATFURNACE3 I. DESIGN PARAMETERS A. Pollution Control Equipment
NA
B. Stack/Vent Parameters NA Stack/Vent ID a. Minimum
Height (feet)
b. Maximum Exhaust Dimension
(inches)
c. Temp.
(°F)
d. Air Flow Rate
(acfm)
Applicable Requirement
NA NA NA NA NA NA C. Other Design Parameters NA II. MATERIAL USAGE/EMISSION LIMITS
A. Material Maximum Usage Rate NA NA
B. Pollutant Maximum Emission Limit Opacity 20% (R336.1301) Nitrogen Oxide 1. 0.11 lb/mmBTU (R336.1205(1)(a) & (b), R336.1801(4)) PM 1. 10 lb/MMscf natural gas fired. (40 CFR 52.21(b)(3),
R336.1331(c)) PM10 1. 10 lb/MMscf natural gas fired. (R336.1205(1)(a) & (b)) III. COMPLIANCE EVALUATION Records of all of the following shall be maintained on file for a period of 5 years.
A. MONITORING/RECORDKEEPING 1. Continuous Emission
Monitoring (CEM) System and Recordkeeping
NA
2. Process Monitoring System and Recordkeeping
The permittee shall keep a record of the following for furnaces 1, 2, and 3: 1. Total natural gas consumption per month. (R336.1205(1)(a) & (b))
3. Other Monitoring and/or Recordkeeping
NA
B. TESTING/RECORDKEEPING 1. Parameter to be Tested/
Recorded 1. Opacity 2. NOx 3. PM 4. PM-10
2. Method/Analysis Approved method

Severstal North America, Inc April 19, 2007 Permit No. 182-05B Page 74 of 83
TABLE F-01.04 SLAB REHEAT FURNACES 1, 2 & 3 AT HOT STRIP MILL BUILDING FLEXIBLE GROUPING REQUIREMENTS 3. Frequency and Schedule of
Testing/Recordkeeping 1. Within 180 days after commencement of trial operation, the permittee
shall verify NOx, PM, and PM-10 emission rates from a representative furnace from Slab reheat furnaces 1, 2, and 3 by testing at owner's expense, in accordance with Department requirements. No less than 60 days prior to testing, the permittee shall submit a complete test plan to the AQD. The AQD must approve the final plan prior to testing. Verification of emission rates includes the submittal of a complete report of the test results to the AQD within 60 days following the last date of the test. (R336.1205(1)(a) & (b), R336.1331, R336.2001, R336.2003, R336.2004, 40 CFR 52.21(b)(3))
IV. REPORTING Reports and Schedules NA V. OPERATIONAL PARAMETERS 1. VI. OTHER REQUIREMENTS NA

Severstal North America, Inc April 19, 2007 Permit No. 182-05B Page 75 of 83
TABLE F-01.05 FGFACILITY FLEXIBLE GROUPING REQUIREMENTS FLEXIBLE GROUPING FGFACILITY Emission Unit / Process Group All equipment at the stationary source including equipment covered by
other permits, grandfathered equipment and exempt equipment. I. DESIGN PARAMETERS A. Pollution Control Equipment
NA
B. Stack/Vent Parameters NA Stack/Vent ID a. Minimum
Height (feet)
b. Maximum Exhaust Dimension
(inches)
c. Temp.
(°F)
d. Air Flow Rate
(acfm)
Applicable Requirement
NA NA NA NA NA NA C. Other Design Parameters NA II. MATERIAL USAGE/EMISSION LIMITS
A. Material Maximum Usage Rate NA NA
B. Pollutant Maximum Emission Limit NA NA III. COMPLIANCE EVALUATION Records of all of the following shall be maintained on file for a period of 5 years.
A. MONITORING/RECORDKEEPING 1. Continuous Emission
Monitoring (CEM) System and Recordkeeping
NA
2. Process Monitoring System and Recordkeeping
NA
3. Other Monitoring and/or Recordkeeping
NA
B. TESTING/RECORDKEEPING 1. Parameter to be Tested/
Recorded NA
2. Method/Analysis NA 3. Frequency and Schedule of
Testing/Recordkeeping NA
IV. REPORTING Reports and Schedules NA V. OPERATIONAL PARAMETERS NA VI. OTHER REQUIREMENTS This Permit to Install shall become effective on May 22, 2007, unless the permittee files a timely request for review with the Administrator of the United States Environmental Protection Agency pursuant to 40 CFR 124.15 and 124.19. (40 CFR 124.15 and 124.19)

Severstal North America, Inc April 19, 2007 Permit No. 182-05B Page 76 of 83
Appendix 1.3. Monitoring Requirements 1.3.1 SO2 Monitoring Continuous Emission Monitoring System (CEMS) Requirements 1. Within 60 calendar days of the issuance of this permit, the permittee shall submit two copies of a
Monitoring Plan to the AQD, for review and approval. The Monitoring Plan shall include drawings or specifications showing proposed locations and descriptions of the required CEMS.
2. Within 150 calendar days of the issuance of this permit, the permittee shall submit two copies of a
complete test plan for the CEMS to the AQD for approval. 3. Prior to restarting the blast furnace after completion of the CFCE modification, the permittee shall
complete the installation of the CEMS and complete testing within 180 days of restarting the blast furnace.
4. Within 60 days of completion of testing, the permittee shall submit to the AQD two copies of the final
report demonstrating the CEMS complies with the requirements of Performance Specification (PS) 2. 5. The span value shall be 2.0 times the lowest emission standard or as specified in the federal regulations. 6. The CEMS shall be installed, calibrated, maintained, and operated in accordance with the procedures set
forth in 40 CFR 60.13 and PS 2 of Appendix B, 40 CFR Part 60. 7. Each calendar quarter, the permittee shall perform the Quality Assurance Procedures of the CEMS set
forth in Appendix F of 40 CFR Part 60. Within 30 days following the end of each calendar quarter, the permittee shall submit the results to the AQD in the format of the data assessment report (Figure 1, Appendix F)
8. In accordance with 40 CFR 60.7(c) and (d), the permittee shall submit two copies of an excess emission
report (EER) and summary report in an acceptable format to the AQD, within 30 days following the end of each calendar quarter. The Summary Report shall follow the format of Figure 1 in 40 CFR 60.7(d). The EER shall include the following information:
a) A report of each exceedance above the limits specified in the conditions of this permit. This includes
the date, time, magnitude, cause and corrective actions of all occurrences during the reporting period.
b) A report of all periods of CEMS downtime and corrective action.
c) A report of the total operating time of the EUCFCESTOVE during the reporting period.
d) A report of any periods that the CEMS exceeds the instrument range.
e) If no exceedances or CEMS downtime occurred during the reporting period, the permittee shall report that fact.
All monitoring data shall be kept on file for a period of at least five years and made available to the AQD upon request.

Severstal North America, Inc April 19, 2007 Permit No. 182-05B Page 77 of 83
1.3.2 Continuous Opacity Monitoring System (COMS) Requirements 1. Within 30 calendar days of the issuance of this permit, the permittee shall submit two copies of a
Monitoring Plan to the AQD, for review and approval. 2. Within 150 calendar days of the issuance of this permit, the permittee shall submit two copies of a
complete test plan for the COMS to the AQD for approval. 3. Within 180 calendar days of the issuance of this permit, the permittee shall complete the testing of the
COMS. 4. Within 60 days of completion of testing, the permittee shall submit to the AQD two copies of the final
report demonstrating the COMS complies with the requirements of Performance Specification (PS) 1. 5. The span value shall be 2.0 times the lowest emission standard or as specified in the federal regulations. 6. The COMS shall be installed, calibrated, maintained, and operated in accordance with the procedures
set forth in 40 CFR 60.13 and PS 1 of Appendix B, 40 CFR Part 60. 7. The permittee shall perform an annual audit of the COMS using the procedures set forth in USEPA
Publication 450/4-92-010, “Performance Audits Procedures for Opacity Monitors”, or a procedure acceptable to AQD. Within 30 days after the completion of the audit, the results of the annual audit shall be submitted to the AQD.
8. In accordance with 40 CFR 60.7(c) and (d), the permittee shall submit two copies of an excess emission
report (EER) and summary report in an acceptable format to Air Quality Division, within 30 days following the end of each calendar quarter. The Summary Report shall follow the format of Figure 1 in 40 CFR 60.7(d). The EER shall include the following information:
a) A report of each exceedance above the hourly average limits as specified in the MACT
regulations, Section 63.7833(e) and (g). This includes the date, time, magnitude, cause and corrective actions of all occurrences during the reporting period.
b) A report of all periods of COMS downtime and corrective action.
c) A report of the total operating time of the EUBOF during the reporting period.
d) If no exceedances or COMS downtime occurred during the reporting period, the permittee shall report that fact.
9. Within 180 days of permit issuance, Severstal shall do the following: for each day that the ESP opacity monitor indicates a one hour average opacity above 10%, Severstal shall keep records of the total power input (voltage and secondary current) of the ESP fields and verify that the water flow to the evaporation chamber is within standard operating levels. For each day that the ESP opacity monitor indicates a one hour average opacity above 10%: if the total power input of the ESP fields exceeds 90% of the established baseline value, and water flow to the evaporation chamber is within standard operational levels, no further investigation of the cause of the exceedance is required. If the total power input of the ESP fields is less than 90% of the established baseline, or if the total power input of the ESP fields exceeds 90% of the established baseline value and water flow to the evaporation chamber is below standard operational levels, Severstal will initiate an investigation as to the cause of the exceedance. This investigation may include such factors as the reason for the lower total power input, the potential for condensation in the exhaust stack causing a false opacity exceedance (by checking parameters which may include the temperature of the exhaust gas at the COMS, the rate of water to the evaporation chamber, outside ambient temperature, operating stage of EUBOF) and performing method 9 opacity observations of the ESP stack. The ESP total power input baseline and standard operational evaporation

Severstal North America, Inc April 19, 2007 Permit No. 182-05B Page 78 of 83
chamber water input shall be established within 90 days of permit issuance. Upon approval by the MDEQ District Office, Severstal may change the parameter used to establish a baseline value, establish a new baseline value, and/or use a different trigger percentage of the baseline value to initiate the corrective actions described in this paragraph.
All monitoring data is shall be kept on file for a period of at least five years and made available to the AQD upon request.

Severstal North America, Inc April 19, 2007 Permit No. 182-05B Page 79 of 83
Appendix 1.7. Emission Calculations Any changes proposed to this Appendix shall be submitted to the AQD Southeast Michigan District Office and approved, in writing, before the change is implemented. The permittee shall use the following calculations to determine compliance with the recordkeeping requirements referenced in Table E-01.03 (B-FCE Stoves): NOx Monthly Stove emissions = BFGBM x NOx Test Factor (pound NOx per mmcf of BFG) / 2,000 lb/ton NOx Annual Stove emissions = BFGBA x NOx Test Factor (pound NOx per mmcf of BFG) / 2,000 lb/ton CO Hourly Stove emissions = BFGBD x CO Test Factor (pound CO per mmcf of BFG) / 24 hours Where: NOx Test Factor is an emission factor based upon site specific stack test data for B-FCE and the CO Test Factor is an emission factor based upon available site specific stack test data for C-FCE. Permit data will also be evaluated in determining the appropriateness of these factors. BFGBD = actual total Blast Furnace Gas combustion rate on a daily basis, based on a calendar week average, in mmcf BFG for B-FCE. BFGBM = actual total Blast Furnace Gas combustion rate for the previous month in mmcf BFG for B-FCE. BFGBA = actual total Blast Furnace Gas combustion rate for the previous 12-month rolling time period in mmcf BFG for B-FCE. The permittee shall use the following calculations to determine compliance with the recordkeeping requirements referenced in Table E-01.04 (C-FCE Casthouse): SO2 Monthly emissions from baghouse = CRCM x SO2 Test Factor (pound SO2 per ton of iron) / 2,000 lb/ton SO2 Annual emissions from baghouse = CRCA x SO2 Test Factor (pound SO2 per ton of iron) / 2,000 lb/ton NOx Monthly emissions from baghouse = CRCM x NOx Test Factor (pound NOx per ton of iron) / 2,000 lb/ton NOx Annual emissions from baghouse = CRCA x NOx Test Factor (pound NOx per ton of iron) / 2,000 lb/ton Where: SO2 and NOx Test Factors are emission factors based upon site specific stack test data for C-FCE Casthouse Baghouse. Permit data will also be evaluated in determining the appropriateness of these factors. CRCM = actual casting rate for the previous month in tons of iron for C-FCE. CRCA = actual casting rate for the previous 12-month rolling time period in tons of iron for C-FCE.

Severstal North America, Inc April 19, 2007 Permit No. 182-05B Page 80 of 83
The permittee shall use the following calculations to determine compliance with the recordkeeping requirements referenced in Table E-01.05 (C-FCE Stoves): NOx Monthly Stove emissions = BFGCM x NOx Test Factor (pound NOx per mmcf of BFG) / 2,000 lb/ton NOx Annual Stove emissions = BFGCA x NOx Test Factor (pound NOx per mmcf of BFG) / 2,000 lb/ton CO Monthly Stove emissions = BFGCM x CO Test Factor (pound CO per mmcf of BFG) / 2,000 lb/ton CO Annual Stove emissions = BFGCA x CO Test Factor (pound CO per mmcf of BFG) / 2,000 lb/ton Where: NOx and CO Test Factors are emission factors based upon site specific stack test data for C-FCE. Permit data will also be evaluated in determining the appropriateness of these factors. BFGCM = actual total Blast Furnace Gas combustion rate for the previous month in mmcf BFG for C-FCE. BFGCA = actual total Blast Furnace Gas combustion rate for the previous 12-month rolling time period in mmcf BFG for C-FCE. The permittee shall use the following calculations to determine compliance with the recordkeeping requirements referenced in Table E-01.06 (Reladling – BOF): PM roof monitor Annual emissions = RLD x 0.0038 pound PM per ton of iron / 2,000 lb/ton PM-10 roof monitor Annual emissions = RLD x 0.0019 pound PM-10 per ton of iron / 2,000 lb/ton Where: RLD = actual throughput for the previous 12-month rolling time period in tons of iron for reladling operations. The permittee shall use the following calculations to determine compliance with the recordkeeping requirements referenced in Table E-01.07 (Desulfurization Operation): PM roof monitor Annual emissions = DSF x 0.0218 pound PM per ton of iron / 2,000 lb/ton PM-10 roof monitor Annual emissions = DSF x 0.0041 pound PM-10 per ton of iron / 2,000 lb/ton Where: DSF = actual throughput for the previous 12-month rolling time period in tons of iron for desulfurization operations.

Severstal North America, Inc April 19, 2007 Permit No. 182-05B Page 81 of 83
The permittee shall use the following calculations to determine compliance with the recordkeeping requirements referenced in Table E-01.08 (EUBOF): PM roof monitor Annual emissions = BOFC x 0.006 pound PM per ton metal charged + BOFS x 0.0026 pound PM per ton slag tapped + BOFT x 0.0026 pound PM per ton steel tapped / 2,000 lb/ton PM-10 roof monitor Annual emissions = BOFC x 0.00276 pound PM-10 per ton metal charged + BOFS x 0.0012 pound PM-10 per ton slag tapped + BOFT x 0.0012 pound PM-10 per ton steel tapped / 2,000 lb/ton Where: BOFC = actual charging rate for the previous 12-month rolling time period in tons of metal for the BOF. BOFS = actual tapping rate for the previous 12-month rolling time period in tons of slag for the BOF. BOFT = actual tapping rate for the previous 12-month rolling time period in tons of steel for the BOF. The permittee shall use the following calculations to determine compliance with the recordkeeping requirements referenced in Table F-01.01 (FG B&C Furnace Casthouses): PM Roof Monitor emissions = CRTA x 0.012 pound PM per ton of iron / 2,000 lb/ton PM-10 Roof Monitor emissions = CRTA x 0.0061 pound PM-10 per ton of iron / 2,000 lb/ton Manganese Roof Monitor emissions = CRTD x 0.000011 pound manganese per ton of iron / 24 hours Lead Roof Monitor emissions = CRTA x 0.00000016 pound lead per ton of iron / 8760 hours per 12-month rolling time period SO2 Hourly baghouse emissions = CRTD x SO2 Test Factor (in pound SO2 per ton of iron) / 24 hours SO2 Monthly baghouse emissions = CRTM x SO2 Test Factor (pound SO2 per ton of iron) / 2,000 lb/ton SO2 Annual baghouse emissions = CRTA x SO2 Test Factor (pound SO2 per ton of iron) / 2,000 lb/ton NOx Hourly baghouse emissions = CRTD x NOx Test Factor (in pound NOx per ton of iron) / 24 hours NOx Monthly baghouse emissions = CRTM x NOx Test Factor (pound NOx per ton of iron) / 2,000 lb/ton NOx Annual baghouse emissions = CRTA x NOx Test Factor (pound NOx per ton of iron) / 2,000 lb/ton VOC Hourly baghouse emissions = CRTD x VOC Test Factor (in pound VOC per ton of iron) / 24 hours Manganese baghouse emissions = CRTD x Mn Test Factor (in pound manganese per ton of iron) / 24 hours

Severstal North America, Inc April 19, 2007 Permit No. 182-05B Page 82 of 83
Lead baghouse emissions = CRTA x Pb Test Factor (in pound lead per ton of iron) / 8760 hours per 12-month rolling time period Where: SO2, NOx, VOC, Mn and Pb Test Factors are the casthouse baghouse emission factors based upon available site specific stack test data for the C-FCE Casthouse Baghouse. Permit data will also be evaluated in determining the appropriateness of these factors. CRTD = actual total casting rate on a daily basis, based on a calendar week average, in tons of iron for B-FCE and C-FCE combined. CRTM = actual total casting rate for the previous month in tons of iron for B-FCE and C-FCE combined. CRTA = actual total casting rate for the previous 12-month rolling time period in tons of iron for B-FCE and C-FCE combined. The permittee shall use the following calculations to determine compliance with the recordkeeping requirements referenced in Table F-01.02 (FG B&C Furnace Stoves - except SO2): NOx Annual Stove emissions = [(BFGBA x B-FCE NOx Test Factor (lb NOx per mmcf of BFG)) + (BFGCA x C-FCE NOx Test Factor (lb NOx per mmcf of BFG))] / 2,000 lb/ton CO Annual Stove emissions = BFGTA x CO Test Factor (pound CO per mmcf of BFG) / 2,000 lb/ton PM Hourly Stove emissions = BFGTD x PM Test Factor (in pound PM per mmcf of BFG) / 24 hours PM-10 Hourly Stove emissions = BFGTD x PM10 Test Factor (in pound PM10 per mmcf of BFG) / 24 hours Manganese Hourly Stove emissions = BFGTD x Mn Test Factor (in pound Mn mmcf BFG) / 24 hours Mercury Hourly Stove emissions = BFGTA x Hg Test Factor (in pound mercury per mmcf BFG) / 8760 hours per 12-month rolling time period Lead Hourly Stove emissions = BFGTA x Pb Test Factor (in pound Pb per mmcf BFG) / 8760 hours per 12-month rolling time period Where: NOx Test Factors are individual stove emission factors based on B-FCE and C-FCE stack test results. CO, PM, PM-10, Mn, Pb, and Hg Test Factors are emission factors based upon available site specific stack test data for C-FCE. Permit data will also be evaluated in determining the appropriateness of these factors.

Severstal North America, Inc April 19, 2007 Permit No. 182-05B Page 83 of 83
BFGBA = actual total Blast Furnace Gas combustion rate for the previous 12-month rolling time period in mmcf BFG for B-FCE. BFGCA = actual total Blast Furnace Gas combustion rate for the previous 12-month rolling time period in mmcf BFG for C-FCE. BFGTD = actual total Blast Furnace Gas combustion rate on a daily basis, based on a calendar week average, in mmcf BFG for B-FCE and C-FCE combined. BFGTM = actual total Blast Furnace Gas combustion rate for the previous month in mmcf BFG for B-FCE and C-FCE combined. BFGTA = actual total Blast Furnace Gas combustion rate for the previous 12-month rolling time period in mmcf BFG for B-FCE and C-FCE combined. The permittee shall use the following calculations to determine compliance with the recordkeeping requirements referenced in Table F-01.02 (FG B&C Furnace Stoves - for SO2 emissions): SO2 Hourly Stove emissions = BFGTD x SO2 Daily Emission Factor / 24 hours
SO2 Annual Stove emissions = 365
1
n
T Di
(BFG x SO2 Daily Emission Factor)=
=∑ / 2,000 lb/ton
Where: BFGTD = actual daily total of BFG (in mmcf) combusted in B-FCE and C-FCE combined SO2 Daily Emission Factor = SO2 Emission Factor derived on a daily basis from the SO2 CEMS data provided by the SO2 CEMS on the C-FCE stoves.
The factor will be in pound SO2 per mmcf BFG and will be calculated either directly by the CEMS or by taking the daily pounds of SO2 from C-FCE stoves (from the CEMS) and dividing this by the amount of BFG (in mmcf) combusted in C-FCE in the same day.