appendix a detailed literature review (by …...appendix a: page a-2 this literature review is...
TRANSCRIPT

Appendix A: page A-1
APPENDIX A
DETAILED LITERATURE REVIEW (by project/study)

Appendix A: page A-2
This literature review is ordered on a study-by-study basis with the important aspects of each
study summarized in turn. There are two sections: those studies pertaining to both the safety
and operational characteristics of road diets and those pertaining primarily to the operational
characteristics. The listing below shows the order of the studies for easy reference if it is
desired to review a specific study. All page numbers shown below refer to this appendix.
SAFETY AND OPERATIONAL CHARACTERISTICS OF ROAD DIETS 4
The Conversion of Four Lane Undivided Urban Roadways to Three Lane Facilities ................................ 4
Guidelines for the Conversion of Urban Four-Lane Undivided Roadways to Three-Lane Two-Way Left-
Turn Lane Facilities ................................................................................................................................... 7
Evaluation of Lane Reduction “Road Diet” Measures on Crashes and Injuries ........................................ 9
Urban Minor Arterial Four-Lane Undivided to Three-Lane Conversion Feasibility: An Update ............. 10
The Effect of Four-Lane to Three-Lane Conversion on the Number of Crashes and Crash Rates in Iowa
Roads ....................................................................................................................................................... 12
Matched Pair Safety Analysis of Four-Lane to Three-Lane Roadway Conversions in Iowa .................... 13
Safety Impacts of “Road Diets” in Iowa .................................................................................................. 15
Iowa’s Experience with Road Diet Measures: Use of Bayesian Approach to Assess Impacts on Crash
Frequencies and Crash Rates .................................................................................................................. 18
Road Diet Handbook - Overview ............................................................................................................. 19
Four-Lane to Three-Lane Conversions: An Update and a Case Study .................................................... 21
Comparison of empirical Bayes and full Bayes approaches for before–after road safety evaluations .. 23
Evaluation of Lane Reduction “Road Diet” Measures on Crashes .......................................................... 24
Road Diets – Fixing the Big Road............................................................................................................. 26
Summary Report: Evaluation of Lane Reduction "Road Diet" Measures and Their Effects on Crashes
and Injuries ............................................................................................................................................. 27
Evaluation of Lane Reduction "Road Diet" Measures on Crashes and Injuries ...................................... 29
Complete Streets Technical Report ........................................................................................................ 31
City of University Place Traffic Safety ..................................................................................................... 33
Guidelines for 4-Lane to 3-Lane Conversions ......................................................................................... 34
Edgewater Drive Before & After Re-Striping Results .............................................................................. 36
Arterial Street Traffic Calming with Three-Lane Roads .......................................................................... 38
US-12 Downtown Sturgis Traffic Study: Final Report ............................................................................. 40
Safety and Operational Characteristics of Two-Way Left-Turn Lanes .................................................... 41

Appendix A: page A-3
Safer Streets: The Measured Effectiveness of Hartford’s Citywide Traffic Calming Program ................ 42
Technical Memorandum: Road Diet Project Review .............................................................................. 43
Stone Way N Rechannelization: Before and After study ........................................................................ 44
OPERATIONAL CHARACTERISTICS OF ROAD DIETS ................................................................ 45
Two-Way Left-Turn Lanes: State-of-the-Art Overview and Implementation Guide............................... 45
Using Roadway Conversions to Integrate Land Use and Transportation– The East Boulevard
Experience ............................................................................................................................................... 46
Road Diet Treatment – Ocean City, NJ .................................................................................................... 48
Using Road Diets to Integrate Land Use and Transportation – The East Boulevard Experience ............ 49
Multi-objective Optimization of a Road Diet Network Design ............................................................... 51

Appendix A: page A-4
SAFETY AND OPERATIONAL CHARACTERISTICS OF ROAD DIETS
The Conversion of Four Lane Undivided Urban Roadways to Three Lane Facilities
June 1999
Thomas M. Welch, P.E.
Office of Transportation Safety, Iowa DOT
http://contextsensitivesolutions.org/content/reading/conversion-of-four-
lane/resources/conversion-of-four-lane/
The intent of this report, prepared for the TRB/ITE Urban Street Symposium 1999, is to present
the state of the practice of “road diets”. The report illustrates the results of expanding two-lane
roadways to 4-lanes in a simple before-and-after analysis. Table 1 explains these implications.
Table 1: Results from converting a 4-lane roadway to a 3-lane roadway
The author discusses several “road diet” experiments that have taken place throughout the U.S.
17th St. West, Billings, Montana (1979) with ADT of 9,200 – 10,000 and speed limit of 35
mph had a decrease in accidents from 37 in the 20 months prior to treatment to 14 in
the 20 months following treatment.
US-71 (Flindt Dr.), Storm Lake, Iowa with ADT of 8,500 where a “very positive
community reactions” was received.
Clay Street, Muscatine, Iowa where “an immediate large reduction in accidents” was
reported.
US-12, Helena, Montana with ADT of 18,000 in a commercial area with numerous
commercial access points resulted in the “number of accidents decreased, good traffic
flow was maintained, and community residents prefer the three-lane facility over the
former four-lane roadway”.
21st ave. East, Duluth, Minnesota with ADT of 17,000 is another example discussed.

Appendix A: page A-5
Advantages and disadvantages of “road diet” treatments are identified. Advantages include
reduced crash rates, reduced speeds, pedestrian safety, traffic calming effects, and improved
emergency response time. Reduced crash rates result from the improved sight distance of the
design and reduced number of lanes for cross-traffic to navigate. Crash statistics on Minnesota
Trunk Highway 49 (Rice St), Minnesota with an ADT of 16,400 are summarized in Table 2.
Pedestrian safety is discussed with respect to using the TWLTL as a pedestrian refuge. The
inability of aggressive drivers to change lanes several times within a corridor resulted in a
decrease in 85th percentile speed where the flow speed is set by the lead drivers.
Table 2: Comparison of frequency of crash type for before and after road diet treatment
Additional “road diet” examples as well as collision reduction are presented in Table 3 for sites
in Seattle, Washington.
Table 3: Comparison of frequency of crash type for before and after road diet treatment

Appendix A: page A-6
Disadvantages include increased travel delay, increased delay at driveways, and loss of passing
opportunities. The author presents corridor LOS analyses as an example, where a section of an
Iowa roadway is analyzed with 4-Lane and 3-Lane TWLTL cross-sections. Results from this
analysis conclude that delay increases, however LOS is maintained when converting from a 4-
lane roadway to a 3-lane roadway.

Appendix A: page A-7
Guidelines for the Conversion of Urban Four-Lane Undivided Roadways to Three-Lane Two-
Way Left-Turn Lane Facilities
April 2001 Keith K. Knapp – Iowa State University
Center for Transportation Research Education (CTRE) Iowa Department of Transportation
http://www.intrans.iastate.edu/reports/4to3lane.pdf
This report presents a comprehensive summary of Road Diets by presenting past research, case
studies, and a simulated analysis of four-lane to three-lane conversions. Additionally, the report
presents feasibility determination factors to be used when assessing the alternatives to convert
a four-lane site as well as providing concluding recommendations.
Past research includes a study on the effectiveness of implementing TWLTLs while converting
from four-lanes to three-lanes (Nemeth, 1978). The study concluded that the reduction in
through lanes increased delay however access was improved. Further, traffic congestion was
increased significantly to a point where drivers used the TWLTL as a passing lane. Walton et al.
conducted a study to determine the limiting ADT at which a Road Diet should be implemented.
ADT in the range of 5,000 – 12,000 were suggested based on the results of the study. Hummer
and Lewis conducted a study to compare the safety of two-lane undivided, three-lane, and
four-lane undivided roadways. Results indicated that three-lane roadways had lower crash
rates in medium and high-density residential and commercial land use areas.
Case studies included two from Montana, two from Minnesota, five from California, one from
Washington, and six from Iowa. Limited data was presented for these case studies, however,
the sites with the most complete data are presented in the summary table. Specifically, the
sites in Iowa were considered in greater depth, including statistics on level-of-service, vehicle
speeds, delay, crashes, and public opinion surveys.
The presented traffic flow simulation is thorough including a simulation software comparison,
sensitivity analysis factors (e.g. total entering volume, access point density, and access point
left-turn volume), and methods of simulation. The resulting data included before-and-after
travel speeds, LOS, and crash frequencies.
Feasibility determination factors were presented with thorough descriptions including:
Roadway Function and Environment
Overall Traffic Volume and Level of Service
Turn Volumes and Patterns
Frequent-Stop and/or Slow-Moving Vehicles
Weaving, Speed, and Queues

Appendix A: page A-8
Crash Types and Patterns
Pedestrian and Bike Activity
Right-of-Way Availability, Cost, and Acquisition Impacts
General Characteristics: Parallel Roadways, Offset Minor Street Intersections, Parallel Parking, Corner Radii, and At-Grade Railroad Crossings
Final recommendations include:
Choosing alternatives on a case-by-case basis
Roadways with bi-directional peak-hour volumes less than 1,500 vph (15,000 ADT) should be considered and less than 1,750 vpd should be considered with caution
Roadways currently operating as a “defacto” three-lane roadway should be considered Methods:
Simple Before and After comparison.
CORSIM was used to analyze the LOS provided by four-lane undivided and three-lane
TWLTL roadways.
Fixed characteristics of the roadway included:
o The roadway segment was 1/4-mile long. o Through traffic volumes were equally distributed in each direction along the
major roadway segment (i.e., there was a 50/50 directional split). o Pretimed two-phase signalized intersections exist at each end of the roadway
segment. o The timing of the two-phase signals was optimized using the SYNCHRO software
approach (e.g., delay minimization) and assuming they comprised a two-signal system.
o No left- or right-turn lanes exist along the four-lane undivided roadway. o No right-turn lanes exist along the three-lane roadway. o Right- and left-turn volumes each represent 10 percent of the through volume at
each signalized intersection. o Right-turn volumes entering/exiting the number of access points used in an
individual simulation represented 10 percent of the traffic flow. o The turn volumes entering/exiting each access point and minor street are equal. o There were no through volumes at the four-leg access points (see Figure 3), and
the minor street approach volumes at the signalized intersections were assumed to be equal to 40 percent of the major roadway traffic flow at the intersection.
o A 30 mph travel speed was assumed for both cross sections. o Only four-leg intersections occur between the major roadway and the access
points and minor streets. o All minor street and access point approaches have a single lane.
Each cross section was simulated with various combinations of total entering volume, access point left-turn volumes, and access point densities.

Appendix A: page A-9
Evaluation of Lane Reduction “Road Diet” Measures on Crashes and Injuries
2002
H.F. Huang, C.V. Zegeer, J.R. Stewart
Viewed in hardcopy print
The intent of this study was to investigate the effects of road diets on crashes and injuries by
investigating 23 road diet sites in California and Washington. A four-group study design was
utilized by identifying road diet and comparison sites and compiling data for before and after
implementation of each road diet. Comparison sites were selected to be similar in terms of
roadway functional class, type of development, speed limit, intersection spacing, and access
control. For data purposes, a three-month transition period was defined as the month before
installation, month of installation, and month following installation. Crashes occurring during
this transition period were discarded from the study. Due to limited sample size, several road
diet sites were removed from the analysis of determining change in crashes per month. Of the
25 road diet sites, 8 sites were suitable to be incorporated in the analysis.
Following the traditional before and after analysis the following was concluded:
A 2% – 42% reduction in crashes took place.
Crash type remained the same between road diet and comparison sites.
Road diets accounted for a reduction in crash severity.
The study presents a literature review of additional road diet examples in California, Iowa,
Michigan, Minnesota, Montana, Canada, Pennsylvania, and Washington. This study seems to be
a precursor to the previous Huang et al. study.
Methods:
Crash variables of interest include date, location (intersection/midblock), crash type,
injuries, fatalities, time, number of vehicles, and various conditions.
A 3-month transition period was considered where no data was used.
The amount of data for before and after periods varied considerably.
Intersections at each end of the road diet were considered transition areas and were
not considered in the analysis.
Crashes per month were normalized so as to compare reductions of sites having
different lengths.

Appendix A: page A-10
Urban Minor Arterial Four-Lane Undivided to Three-Lane Conversion Feasibility: An Update
July 2003
K. K. Knapp, K. L. Giese, W. Lee
http://docs.google.com/viewer?a=v&q=cache:LiReHQ4b4kgJ:www.urbanstreet.info/2nd_sym_
proceedings/Volume%25202/Knapp.pdf+The+Safety+and+Operational+Effects+of+%22Road+Di
et%22+Conversions+in+Minnesota&hl=en&gl=us&pid=bl&srcid=ADGEESg4RotFMBPdrpg8QoV4
G2RdrIk7KEG9I_8tzKlVnyFm7EZ4lJPSQg1dbE0InTr2E4HmZxuYPmkGDQY50_YhG_dogKgtVZjyQq
V1jee01iJK-B9Rp-n2N86lurKDWb57Q2swmNT7&sig=AHIEtbRIeQGF3t5WCBSelZ6x-iNG0Yqssw
The intent of this paper is to provide information to the 2nd Urban Street Symposium in
Anaheim, California in 2003. The paper summarizes research, guidelines, previous case study
results and an analysis using CORSIM software to investigate traffic flow differences of similar
four-lane to three-lane conversions.
Case studies mentioned in this paper include sites located in Iowa, Montana, Minnesota,
California, and Washington. These road diet locations have been cited in numerous papers that
provide information on road diets. Results of each study indicate a reduction in 85th percentile
speed and 17% – 62% reduction and crashes. Again, these sites were reinvestigated by Huang
et al. with more rigorous statistical techniques where the reduction in crashes was found to be
6% and a negligible change in crash severity and type.
The paper continues by presenting and discussing feasibility determination factors as presented
by the Iowa Department of Transportation:
Roadway function and environment;
Overall traffic volume and level of service;
Turning volumes and patterns;
Frequent-stop and slow-moving vehicles;
Weaving, speed, and queues;
Crash type and patterns;
Pedestrian and bike activity;
Right-of-way availability, cost, and acquisition impacts; and
General characteristics; parallel roadways, offset minor street intersections, parallel
parking, corner radii, and at-grade railroad crossings.
As part of the Iowa Department of Transportation project, the overall traffic volume and “level
of service” feasibility determination factor was further investigate to determine the maximum
volume of vehicles that can be serviced before significant operational impacts take place. The
analysis compared the average arterial travel speed, arterial LOS, and intersection LOS of
similar four-lane undivided and three-lane roadways for peak-hour volumes of 500, 750, 875,

Appendix A: page A-11
and 1000 vph. The analysis concluded that minimal effects took place up to 750 vph and travel
speeds decreased by 1.9 mph at 1,000 vph. The arterial LOS was the same for each cross-
section up to 875 vph where a LOS D resulted for the three-lane roadway and a LOS C resulted
for the four-lane roadway. The analysis considered variables including total entering traffic
volumes, different levels of left-turn traffic, access point densities, heavy vehicles, and bus
stops.
Methods:
CORSIM was used to analyze the sensitivity of delay due to factors including entering
traffic volumes, different levels of left-turn traffic, access point densities, percent heavy
vehicles, and bus stop activities.

Appendix A: page A-12
The Effect of Four-Lane to Three-Lane Conversion on the Number of Crashes and Crash Rates
in Iowa Roads
June 2005
W. Li and A. Carriquiry
http://www.iowadot.gov/crashanalysis/pdfs/iowa4to3laneconversion_fullbayes_june2005.pdf
The intent of this study is to present findings of a statistical study on road diets and their
effectiveness in reducing the number of motor vehicle accidents. The study was conducted on
roadways in Iowa and provides an in-depth description of the statistical modeling approaches
used to determine the effectiveness of road diets.
The study uses 30 paired sites in Iowa, the same sites that have been the subject of several
studies conducted on behalf of the Iowa Department of Transportation. Several data
parameters were collected for each site including local population, AADT, and crashes. A
Bayesian approach was used to account for regression to the mean and seasonal effects were
also considered throughout the analysis. The study provides a great deal of statistical
information as far as the approach however lacks any information on site selection and specific
characteristics of each site.
The following were concluded through the study:
The reduction in the expected number of crashes per year and mile was 32.3% for a
treated site and 7.1% for a control site.
The estimated expected reduction in the number of crashes per year, mile, and
100,000,000 AADT were 44.3% and 25.5% respectively for treated and control sites.
The expected number of monthly crashes per mile tends to be higher during winter
months.
Methods:
Bayesian method.
Seasonal effects were accounted for by including smooth trigonometric functions with
three different periods representing the four seasons of the year.
15 treated and 15 comparison sites were analyzed where local population and traffic
volumes were accounted for.
Independent variables include the four seasons of the year, treatment type (road diet
or control), time, and interaction of treatment and time.

Appendix A: page A-13
Matched Pair Safety Analysis of Four-Lane to Three-Lane Roadway Conversions in Iowa
2006
Thomas B. Stout, P.E.
http://www.ctre.iastate.edu/mtc/papers/2005/stout.pdf
The intent of this paper is to conduct a statistical analysis on crash data compiled for 11 sites in
Iowa. The research was focused on evaluating the safety impacts of road diets using a Before-
and-After with Yoked Pairs (comparison sites) analysis. The data included five years of traffic
crash data for “before” and “after” the implementation of a road diet. Comparison sites were
identified by the following characteristics:
Volume (ADT) within 20% of the study roadway
City population within 20% of the study roadway’s city population (a nearby roadway was used in the Des Moines and Storm Lake studies; in all other cases it was necessary to find sites in other cities)
Similar “character” (aerial photography was used to assess type of development, number of access points, and physical limitations/topographic features)
Length within 20% of the study roadway. The purpose of the study was to determine safety-related impacts of Road Diets including changes in:
frequency of crashes
crash rate
nature/type of crashes
injury character or severity of the crashes
involvement of drivers 65 and older, 75 and older, and 25 and younger Conclusions of the study include a 58% reduction in fatal crashes, 40% reduction in major injury
crashes, 67% decrease in minor injury crashes, and 56% decrease in possible injury crashes.
Further, a decrease in crash rate per driveway density unit resulted following a road diet
conversion.
Successful Road Diet conversions are more likely under the following circumstances:
There is a history of crashes that are amenable to solution by providing a two-way
left-turn lane
Traffic volume is generally less than about 20,000 ADT
There is a high density of access points
There are large turning volumes
The benefits of conversion may include the following:
A reduction of 21 to 38 percent in the frequency and rate of crashes
A similar reduction in the number and severity of injury crashes

Appendix A: page A-14
Reductions in the involvement of age groups that are traditionally at risk, those 25
and under as well as those 65 and older
A significant reduction in the number of crash types related to left-turns and
stopped traffic.
Methods:
Before-and-After Yoked Pair Method
Driveway density was used to classify the “character” of the roadway (type of
development) and to find a relationship to the number of crashes.
Crash data was collected for a 5-year before and 5-year after period.
Control sites were selected based on: Volume (ADT) within 20% of the study roadway; city population within 20% of the study roadway’s city population; similar “character” (aerial photography was used to assess type of development, number of access points, and physical limitations/topographic features); and length within 20% of the study roadway.

Appendix A: page A-15
Safety Impacts of “Road Diets” in Iowa
2006 Thomas B. Stout, Michael Pawlovich, Reginald R. Souleyrette, and Alicia Carriquiry
http://www.iowadot.gov/crashanalysis/pdfs/ite_draft_4to3laneconversion_papersubmission_2005.pdf
The intent of this paper is to reanalyze data used in a previous study, Evaluation of Lane
Reduction “Road Diet” Measures on Crashes and Injuries conducted by Huang et al. The
previous study used a classical statistical approach and concluded that Road Diets reduced
crash frequencies by 6% and had minimal impacts on reducing crash rates. The Safety Impacts
of “Road Diets” in Iowa study used the same data, however the authors utilized a Before-and-
After (B/A) with “yoked-pairs” and the Full Bayes (FB) statistical approaches. The study
concluded that a Road Diet could account for 25% reduction in crash frequency per mile and a
19% reduction in crash rate.
This study analyzed the same 15 treatment and 15 control sites in Iowa that were used in the
previous study. Information to evaluate the effectiveness of Road Diets was compiled by the
Iowa Department of Transportation Office of Traffic and Safety. The sites were mostly located
in small urbanized areas with populations ranging from 1,169 to 198,682. The sites experienced
annual daily traffic in the range of 2,000 to 17,400 vehicles.
The B/A analysis included data collected for the 5 years previous to treatment and the following
5 years after treatment. Within the examined data, crash frequency, rate, severity, type, driver
age, and major cause were all considered. The study determined a 28% reduction in total crash
frequency and a 21% reduction in total crash rates when compared to city-wide crashes.
Further, major injury crashes were reduced by 11%, minor injury crashes reduced by 30%, and
possible injury crashes reduced by 31% compared to city-wide results. Results from the B/A
analysis are shown for each site in Table 1.

Appendix A: page A-16
Table 1: Percent change in Type of Crash for Study Segment
The FB analysis included data collected for 23 years (1982-2004) for the 30 site locations. Each
site having different treatment dates resulted in a variation of before and after crash data for
each site. The study determined a 25.2% reduction in crash frequency per mile and an 18.8%
reduction in crash rate.
Final Remarks:
A 25% reduction in crash frequency per mile and a 19% reduction in crash rate. This
differs from the Huang, et al. study which reported a 6% reduction in crash frequency
per mile.
A similar reduction in the number and severity of injury crashes
Reductions in the involvement of age groups that are traditionally at risk, those 25 and
under as well as those 65 and older
A significant reduction in the number of crashes types related to left-turns and stopped
traffic.
A 34% reduction in the number of injury crashes, as well as a reduction in the severity of
the crashes that do occur.
Methods:
Classical Before-and-After (B/A) with comparison sites and Full Bayes (FB) methods.
B/A used 5 years of data before and 5 years after while FB used 23 years total
independent of when the road diet was implemented.
The same comparison sites were selected for the FB and B/A analyses.

Appendix A: page A-17
For FB, given the random and rare nature of crash events, a hierarchical Poisson model
where the log mean was expressed as a function of time period, seasonal effects, and a
random effect corresponding to each site included was fitted to the crash frequencies.
FB was adopted for estimation of model parameters. In the Bayesian approach, model
parameters are treated as random variables and the goal is to estimate the distribution
of likely values of the parameters given prior values and data.
Appendix A: page A-18
Iowa’s Experience with Road Diet Measures: Use of Bayesian Approach to Assess Impacts on
Crash Frequencies and Crash Rates
February 2007
M.D. Pawlovich, L. Wen, A. Carriquiry, T. Welch
http://trb.metapress.com/content/488084n420265182/
The intent of this study was to investigate the safety effects a road diet has on Iowa roadways.
This study is the analytical document of which many papers and handbooks have been
developed from. The sites had volumes ranging from 2,030 to 15,350 and were located in
smaller urbanized areas in Iowa. The study employs a Bayesian method to estimate model
parameters and draw inferences from the data.
The study uses 15 road diet sites and 15 comparison sites in Iowa. Crash data was available for
each site from 1982 to 1994 however due to different intervention dates the available before
and after crash data varied. Comparison sites were identified based on traffic volumes,
geometry, and local population size each known to have effects on overall safety. It was noted
that crash frequency and rate decreased for all treated and non-treated sites during the
investigated period however treated sites showed a sharper decline. Following the Full
Bayesian analysis it was concluded that road diets in Iowa could account for a 23.2% – 27.8%
reduction in crash frequency per mile and a 17.9% – 20% decrease in crash rate.
Factors that have been controlled for include time effects, conversion month, and seasonal
effects on crash frequency and traffic volumes.
Methods:
Fully Bayesian data analysis.
15 treated and 15 comparison sites.
Seasonality effects were considered.
A comprehensive summary of statistical details are presented.
End-of-site treatments are not presented.

Appendix A: page A-19
Road Diet Handbook - Overview
2007
Jennifer A. Rosales, P.E., Professional Associate
http://www.oregonite.org/2007D6/paper_review/D4_201_Rosales_paper.pdf The intent of this paper is to provide an overview of the published book Road Diet Handbook:
Setting Trends for Livable Streets. The book presents advantages and disadvantages to road
diets with respect to safety effects, operational effects, and livability effects. The handbook is
intended to become a guide to local departments of transportation to determine the overall
feasibility of a road diet for a given roadway. The paper provides a brief overview of previous
studies, case studies, and practice guidelines.
Previous studies are summarized with respect to economic effects and walkability, safety,
operations, and road diet examples.
Six case studies are presented including sites in Dunedin, New Zealand; Toronta, Canada;
Athens, Georgia; Clear Lake, Iowa; and two in Vancouver, Washington. Supplemental to the
common road diet characteristics was a survey that was conducted in the local areas collecting
information on:
Household/business characteristics
Perceptions on the street’s traffic, safety, activities (street life) and friendliness
Recommended improvements
Reactions to the road diet
Comfort and safety for pedestrians, bicyclists, and transit users
Increased landscaping and beautification opportunities
Improved quality of life and street character
Results of the surveys were mixed and suggestions for improvement included reducing speeds,
prohibiting trucks, reducing traffic, and adding street trees and planters.
Both this paper and the corresponding handbook are summarized by lessons learned and road
diet guidelines. Guidelines are presented pertaining to feasibility factors, left-turn treatments,
transitions, bicycle facilities, on-street parking, and pedestrians.
Reading Road Diet Handbook: Setting Trends for Livable Streets would provide a more thorough
understanding of the implications related to road diets.
Methods:
Appendix A: page A-20
Simple Before and After analysis.
Safety (crashes, speeds, pedestrians) and operations (volumes, delay) were investigated.
Implementation:
Consider road diet projects when multiple opportunities arise such as a pavement
reconstruction project, presence of an adjacent parallel route, or jurisdictional roadway
transfer.
Consider community requests to evaluate and implement road diet projects. With
technical evaluation and community involvement with stakeholder groups, road diet
projects are more likely to be successful.
A public education campaign that goes along with a road diet project needs to
emphasize the notion that this is a safety enhancement project and that it may require
trade-offs in capacity and speed.
Increase public education regarding the use of the two-way left turn lane.
Manage community expectations with clear communication and documentation.
Identify project goals, performance measures, expectations and conduct follow-up
evaluations.
Coordinate road diet projects with concurrent pavement overlay projects, if possible. A
road diet striping plan on new pavement results in less driver confusion.
Install trees and planters to soften the landscape.

Appendix A: page A-21
Four-Lane to Three-Lane Conversions: An Update and a Case Study
June 2007
K.K. Knapp and J.A. Rosales
http://docs.google.com/viewer?a=v&q=cache:6GIuebHZ9x8J:www.urbanstreet.info/3rd_symp_
proceedings/Four-Lane%2520to%2520Three-
Lane.pdf+The+Safety+and+Operational+Effects+of+%22Road+Diet%22+Conversions+in+Minnes
ota&hl=en&gl=us&pid=bl&srcid=ADGEESiWvuhqgofRjX4jCUKTF2nZTpUAh3apmvecoyHhR6FuA
b6LkZOcCKkeNiihVqaOO6fsOAjafO_zalYdfTh74HSEsf8HnkLOLJ4XYUFBRyH4jaKu0SZ9VDlgQR3qA
Z1WsZsAnXYP&sig=AHIEtbQvD7GgjAdG0TNtgUzupddITewvrA
The intent of this paper was to provide information regarding road diets to the 3rd Urban Street
Symposium in Seattle, Washington in June 2007. The paper presents guideline
recommendations and some feasibility determination factors for potential road diet projects
and concludes with a case study of a road diet candidate in Wisconsin.
The feasibility determination factors were provided by the Iowa Department of Transportation
guidelines. The existing and expected status of all of the following factors should be evaluated
before determining if a road diet is suitable.
Match roadway environment with function.
Road diets have been successful on roadways up to 24,000 ADT however operational
impacts may be noticed for a roadway above 20,000 ADT.
Determine turning volumes and patterns.
Investigate the frequency of slow moving or large vehicles using the roadway.
Pedestrian and bicycle activity should be considered.
Right of Way, costs, and acquisition impacts should be investigated.
Recommendation guidelines set forth by the Iowa Department of Transportation are as follows:
The feasibility of implementing a road diet should be considered on a case-by-case
basis.
Both existing and expected characteristics of the roadway should be considered.
Simulation suggests that peak-hour volumes less than 750 vph may experience
negligible operational impacts, while caution should be used on roadways ranging from
750 – 875 vph, and above 875 vph indicated a more severe impact to operations.
The paper continues to address the livability benefits presented by Rosales:
Improved walkability and easier street crossing,
Increased pedestrian and bicycle use,

Appendix A: page A-22
Slower vehicle speeds,
Users feeling “safer” and more “comfortable” along the roadway,
Economic growth in adjacent and nearby businesses,
Increased new home and business improvement projects,
Redevelopment and renovation work at a quicker pace, and
Increased front yard activity.
The paper concludes with a case study in which the feasibility factors mentioned were applied
on a road diet candidate in Colby, Wisconsin. Because the roadway was only analyzed for
feasibility purposes, no before-after data were collected nor analyzed to determine the success
of the road diet.
Methods:
Presented an analysis of the suitability of a road diet candidate using the developed
feasibility determination factors.

Appendix A: page A-23
Comparison of empirical Bayes and full Bayes approaches for before–after road safety
evaluations
January 2010
B. Persaud, B. Lana, C. Lyon, and R. Bhim
http://www.cmfclearinghouse.org/study_detail.cfm?stid=192
This paper provides additional information on the Empirical Bayes and Full Bayes statistical
approaches to determine the effect a road diet has on reducing the number of crashes on a
treated roadway. This study is a follow-up to several studies conducted on road diet sites in
Iowa by Persaud et al., Pawlovich et al., and Stout. This study uses the identical data presented
in these other studies but identifies similarities and differences when using the Full Bayes
approach.
The paper provides substantial background to the Full-Bayes approach and utilizes 15 yoked-
pair sites for analysis. Following analysis it was concluded that the crash reduction rate ranged
from 49 – 55%. A crash modification factor (CMF) was determined to be 0.47 for the given data
set.
Methods:
Full Bayes (FB) and Empirical Bayes (EB) methods.
Used 15 treatment and 15 comparison sites from Iowa for FB while EB supplemented an
additional 296 comparison sites as required.
EB accounted for temporal effects in weather, demography, crash reporting, vehicle
technology, and design standard improvements.
FB accounted for temporal effects in weather, demography, crash reporting, vehicle
technology, and design standard improvements.
FB was a before-after approach that developed a crash rate model with traffic volume
as an independent variable.
Appendix A: page A-24
Evaluation of Lane Reduction “Road Diet” Measures on Crashes
June 2010
http://www.fhwa.dot.gov/publications/research/safety/10053/index.cfm
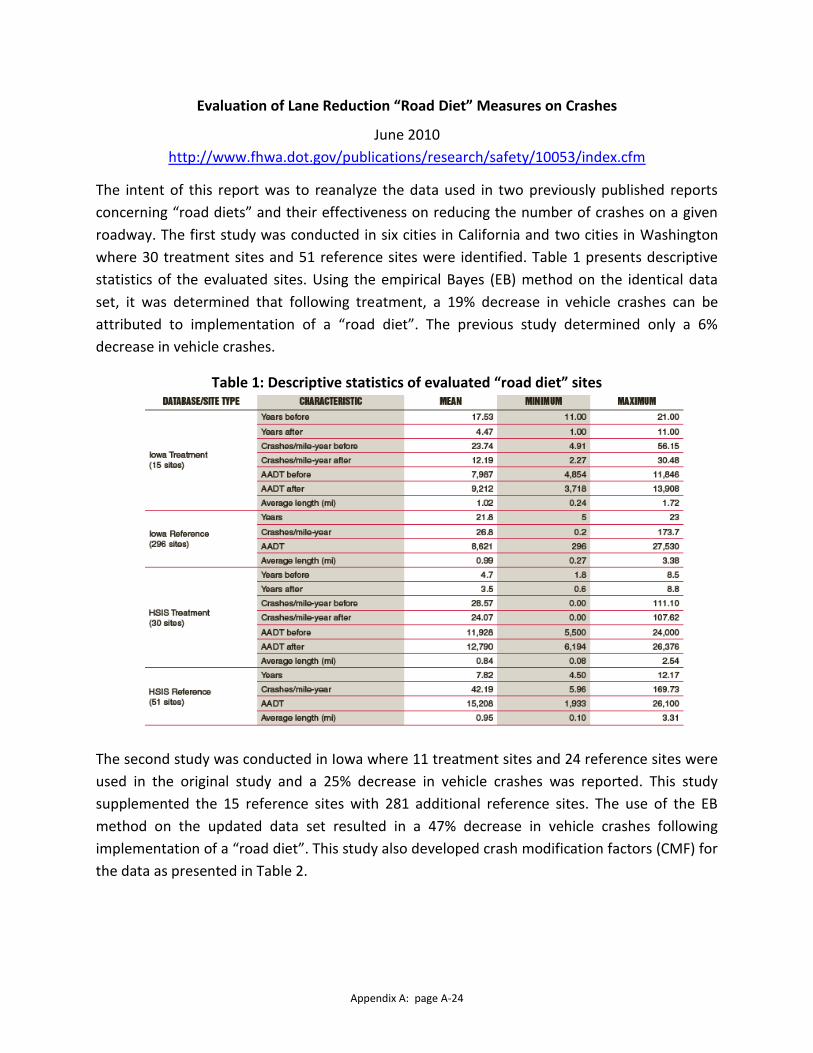
The intent of this report was to reanalyze the data used in two previously published reports
concerning “road diets” and their effectiveness on reducing the number of crashes on a given
roadway. The first study was conducted in six cities in California and two cities in Washington
where 30 treatment sites and 51 reference sites were identified. Table 1 presents descriptive
statistics of the evaluated sites. Using the empirical Bayes (EB) method on the identical data
set, it was determined that following treatment, a 19% decrease in vehicle crashes can be
attributed to implementation of a “road diet”. The previous study determined only a 6%
decrease in vehicle crashes.
Table 1: Descriptive statistics of evaluated “road diet” sites
The second study was conducted in Iowa where 11 treatment sites and 24 reference sites were
used in the original study and a 25% decrease in vehicle crashes was reported. This study
supplemented the 15 reference sites with 281 additional reference sites. The use of the EB
method on the updated data set resulted in a 47% decrease in vehicle crashes following
implementation of a “road diet”. This study also developed crash modification factors (CMF) for
the data as presented in Table 2.

Appendix A: page A-25
Table 2: Results of the EB method reanalysis of Iowa and HSIS data concerning “road diets”
Other findings:
A 4 – 5 mph reduction in the 85th percentile free flow and 30% reduction in vehicles traveling
more than 5 mph over the speed limit were found in an Iowa site. The authors speculate this
calming affect would be less likely in larger cities.
In the original Iowa study, 15 treatment sites and 30 reference sites were considered while only
11 treatment sites and 24 reference sites were used due to data being omitted due to small
sample sizes of crashes, short segments, short data history, and low AADT.
Methods:
Empirical Bayes Method
California and Washington (HSIS) 30 treatment and 51 reference sites matched by
functional class, type of development, speed limit, intersection spacing, and access
control.
The Iowa database included data from original 15 treatment and 15 reference
supplemented by 281 additional reference sites.
A model was developed with calibration factors accounting for accident reporting
practices, demography, and weather for Iowa. However calibration factors could not be
utilized in the study concerning “road diets” in California and Washington.
Sites of longer length were given more weight.

Appendix A: page A-26
Road Diets – Fixing the Big Road
1999
Dan Burden and Peter Lagerway
http://www.walkable.org/assets/downloads/roaddiets.pdf
The intent of this report is to summarize the state-of-practice of Road Diets as of 1999. The
report includes several examples of Road Diets from several states, territories, and countries
including: Washington, Pennsylvania, Michigan, Ontario Canada, California, Massachusetts,
Maryland, Texas, Ottawa Canada, Colorado, Oregon, and the United Kingdom.
The report presents examples of mobility and access improvement as well as safety
improvements. The report also includes examples of Road Diets being placed on roadways with
well over 20,000 ADT. For example, Lake Washington BLVD, Kirkland, Washington had 30,000
ADT before conversion with beneficial results.
The paper recommends characteristics of ideal Road Diet candidates including:
Moderate volumes (8-15,000 ADT)
Roads with safety issues
Transit corridors
Popular or essential bicycle routes/links
Commercial reinvestment areas
Economic enterprise zones
Historic streets
Scenic roads
Entertainment districts
Main streets
Methods:
Simple Before and After comparison focused on ADT and reason for road diet
treatment.
Implementation:
It is essential to involve the public through highly interactive processes (focus groups,
work shops, and interactive designs).

Appendix A: page A-27
Summary Report: Evaluation of Lane Reduction "Road Diet" Measures and Their Effects on
Crashes and Injuries
March 2004
Herman F. Huang, J. Richard Stewart, and Charles V. Zegeer
http://www.planning.kytc.ky.gov/congestion/RoadDiets/Road%20Diet%20Safety%20Study.pdf
The intent of this paper is to summarize a statistical study of road diets and their effectiveness
on reducing crash statistics in treated sites. The study includes several sites in California and
Washington as these states are involved in the Federal Highway Administration’s Safety
Information System where quality vehicle and crash data are available. Road Diets were
identified by local traffic engineers in 8 cities including: Bellevue, Wa, Seattle, Wa, Mountain
View, CA, Oakland, CA, Sacramento, CA, San Francisco, CA, San Leandro, CA, and Sunnyvale, CA.
Finally, 12 Road Diets and 25 comparison sites were included in the study.
The comparison sites had an average crash frequency of 41% compared to an average crash
frequency of 35.8% for road diet sites indicating road diets reduce the total number of crashes.
Crash rates were determined using 8 Road Diet sites and 14 comparison sites. The ADTs of Road
Diet sites ranged from 5,658 – 8,133 in the before period and from 8,300 – 16,482 in the after
period. ADTs of comparison sites ranged from 5,480 – 24,183 in the before period and from
7,006 – 26,100 in the after period. Both Road Diet and comparison sites experienced decreased
crash rates and had no significant difference between the treated and untreated sites.
Crash severity was nearly the same at Road Diet sites and comparison sites and the statistical
analysis determined that Road Diets had no significant affect on crash severity. An analysis by
crash type was found to have similar results.
Final Remarks:
Crash frequencies at road diets in the after period were approximately 6 percent lower
than at the corresponding comparison sites.
Crash rates did not change significantly from the before period to the after period.
Although crash rates were lower at road diets than at comparison sites, road diets did
not perform better or worse (from the before period to the after period) relative to
comparison sites.
Road diet conversions did not affect crash severity.
Road diet conversions did not result in a significant change in crash types.
This report is a summary of Study 11 located in this document.

Appendix A: page A-28
Methods:
Before and After with comparison sites method.
California and Washington (HSIS) 30 treatment and 51 reference sites matched by
functional class, type of development, speed limit, intersection spacing, and access
control. Reduced to 12 treatments and 25 comparisons.
Seasonal variations in crash data were taken into account. Variations in crash reporting
techniques were controlled for by selecting comparison sites in the same city as the
road diet site.
Crash Frequencies: A Cochran-Mantel-Haenszel test of overall significance was used to
show that the reduction in crashes was statistically significant.
Crash Rates: Negative binomial regression models were fit to the crash frequencies at
each site. The explanatory variables were traffic volume, city, site type (treated or
comparison), time period (before or after), and a site type-by-time-period interaction.
Segment length was included as a constant factor so the number of crashes on a
segment was proportional to its length.
Statistical analyses were conducted for crash severity and crash type as well.

Appendix A: page A-29
Evaluation of Lane Reduction "Road Diet" Measures on Crashes and Injuries
May 2005
Herman F. Huang, J. Richard Stewart, and Charles V. Zegeer
https://docs.google.com/viewer?a=v&q=cache:teqtEQ0DiiYJ:136.142.82.185/freshman/acade
mic/engr0715/Archives/y2008/Team8/research_lanereduc.pdf+&hl=en&gl=us&pid=bl&srcid=A
DGEESjdejW91b0eAdMOrvu4y8XpFmP4DbUUUMZTjqyNZDTWpcal_uJeXjMVRf7CFc9lPKyE-
f2OvFDIlADR6mBOShzTrsWpiV1kkb5yhPr_L_feJRYIdMMmletr_2D1qEGg1b2JGndl&sig=AHIEtbQ
zjp4MsCXIspcA84MhOb0sqjNTdw
This paper presents a statistical study on Road Diet sites in California and Washington. Data
were collected for before and after periods for both treated sites and comparison sites. A list of
30 Road Diet sites and 50 matching comparison sites were compiled for eight cities. Crash data
were compiled, in most cases, for 3 years before and 3 years after treatment for each site
including date of crash, crash type, number of injuries, and number of fatalities. A subset of 12
Road Diets and 25 comparison sites was chosen for statistical analysis.
Based on the results of the study the following was concluded:
Crashes at road diet and comparison sites were not significantly different indicating that
the comparison sites are viable.
Road Diets could be responsible for reducing the number of crashes by 6%.
Negligible reductions in crash severity and crashes by type were determined between
Road Diet and comparison sites.
Crash rates did not change significantly from before and after a Road Diet was
implemented.
Road diets did not result in a significant change in crash type.
Methods:
Yoked-Comparison before-and-after and a negative binomial of crashes per mile using
two groups.
Negative binomial allowed effects of treatment while controlling for ADT, city, and
length of study segment.
Crash data were characterized by date of crash, crash type, number of injuries and
number of fatalities.
A 3-month transition period was considered to separate the “before” and “after”
periods.
3-years of “before” and 3-years of “after” data were collected.
Intersections were taken as the transition area of the road diet and were excluded from
the study.

Appendix A: page A-30
Crash Rates: Negative binomial regression models were fit to the crash frequencies at
each site. The explanatory variables were traffic volume, city, site type (treated or
comparison), time period (before or after), and a site type-by-time-period interaction.
Segment length was included as a constant factor so the number of crashes on a
segment was proportional to its length.

Appendix A: page A-31
Complete Streets Technical Report
Genesee County Metropolitan Planning Commission
http://www.co.genesee.mi.us/gcmpc-plan/LRTPWeb/TechReports/CStreets.pdf
The intent of this report is to introduce an innovative approach to urban road design that The
Genesee County Metropolitan Alliance has adopted, Complete Streets. The Complete Streets
vision statement for Genesee County is summarized as, “Transportation improvements in
Genesee County are planned, designed and constructed to encourage walking, bicycling, and
transit use while promoting safety for all users”. The report summarizes the definition of a
Complete Street, identifies design elements of a Complete Street, and provides a list of benefits
of a Complete Streets program.
Although there are several approaches to complete a street, this report presents an in-depth
look at low-cost and simple techniques which includes road diets. The Genesee County
Metropolitan Planning Commission (GCMPC) identified candidate road diet roadways in
Genesee County to determine the feasibility of converting these roadways from four-lanes to
three-lanes. Data was collected for each four-lane roadway including crash data, lane widths,
speed limits, surface condition, ADT, number of traffic signals, and land uses. These data were
used to develop a rating scale to determine on a case-by-case basis whether the roadway was
suitable for a Road Diet. The recommendations of the GCMPC study were shared with local
road agencies to develop strategies for implementing Road Diets on ideal candidates. It should
be noted that these are all future sites that have not been converted as of the date of this
study.
Existing Road Diet sites were also studied to determine the effectiveness of Road Diets on
reducing crash frequencies and crash rates. The results are divided into type of crash as well as
total non-alcohol/non-deer related crashes. The results are somewhat misleading because the
before and after periods are generally different lengths of time. With this in mind, it was
determined that Road Diets reduced the total number of crashes by 15% – 47%. Total crashes
for these sites are presented in the summary table.
Methods:
Simple Before and After comparison.
Implementation:
Complete a sidewalk inventory of Genesee County.
Include questions about the need for Complete Streets in future transportation surveys.
Provide local training opportunities about Complete Streets for transportation planners,
road agencies and engineers on an annual basis.

Appendix A: page A-32
Provide technical assistance to road agencies when needed about implementing
Complete Streets in their communities.
Document and publicize success stories about implementation of Complete Streets.

Appendix A: page A-33
City of University Place Traffic Safety
http://docs.google.com/viewer?a=v&pid=gmail&attid=0.1&thid=12f35889d6a9b876&mt=application/vnd.ms-powerpoint&url=http://mail.google.com/mail/?ui%3D2%26ik%3D0c6430dfb7%26view%3Datt%26th%3D12f35889d6a9b876%26attid%3D0.1%26disp%3Dsafe%26zw&sig=AHIEtbRY_y5-dtkLssQFhYiZpWcHgHMC6Q
This presentation provides information on the varying effects that different traffic controlling
strategies have on average traveling speeds, traffic crashes, and injuries. Following
implementation of a road diet a 37% decrease in traffic accidents occurred and a 54% – 60%
decrease in injuries resulted.
Methods:
Simple before and after comparison of accidents, injuries, and speeds.

Appendix A: page A-34
Guidelines for 4-Lane to 3-Lane Conversions
September 2001
W.C. Taylor, I.K. Lim, M. Mahmood
Viewed in hardcopy print
The intent of this study was to develop guidelines for Michigan Department of Transportation
to use in reviewing requests from local communities to convert four-lane urban trunklines to
the three-lane configuration. The study also provides a literature review of documents that
have investigated the safety and operational impacts of a road diet. Objectives of the literature
review were to determine the change in traffic crashes, change in traffic characteristics such as
speeds, and characteristics of road segments that affect change in crashes or change in
characteristics.
The study provides an operational analysis to investigate the effects of road diets on vehicle
delay. The analysis tested various combinations of main street volumes, access volumes,
turning volumes, and driveway densities for a given site. Two variables were identified as
having impacts on the delay to vehicles entering from the minor street; the headway
distribution on the major street and the minor street volume. It was concluded that for the
given volume range on Abbott Rd. the headway distribution had little effect on the minor street
delay. It was also concluded that from 60 vph to 120 vph the queue time increased by 1 to 2
seconds however 180 vph creates a queue time greater than the gap acceptance time on the
major street. The author determined that in this high volume situation, traffic signal warrants
would be met and signals would be implemented. Major street delay was also shown to
increase due increasing volume and increasing left-turn movements.
A model was produced from the single site analysis to include several different scenarios.
Parameters to be used in the model include major street volumes, minor street volume, access
point average spacing, and percent of vehicles turning left from the major street. The model
encompasses major street volumes from 1000 to 2000 vph for 5 to 10% left turn volumes.
Final conclusions include:
A 27.6% average reduction in crashes following a road diet treatment
A decrease from 21 to 5 pedestrian and bicycle involvement crashes and reduction of
intersection crashes from 238 to 129.
Minor street delay increases as major street volume increases however delay is not
significant until minor street volumes approach 180 vph.
The number of injury crashes reduced.
Methods:
Simple before and after comparison.

Appendix A: page A-35
Nine sites were identified for use in analysis.
Pedestrian and bicycle related crashes were investigated at three of nine sites.
NETSIM was used to model the relationship between delay, headway distribution, minor
street volume, and left-turn volumes.
Appendix A: page A-36
Edgewater Drive Before & After Re-Striping Results
November 2002
City of Orlando – Transportation Planning Bureau
http://www.sacog.org/complete-
streets/toolkit/files/docs/City%20of%20Orlando_Edgewater%20Drive%20Before%20&%20Afte
r%20Re-Striping%20Results.pdf
The intent of this study is to analyze the effectiveness of a four-lane to three-lane conversion in
the City of Orlando. The conversion is part of the College Park “Neighborhood Horizon Plan”
which identifies 74 neighborhood improvement projects. One of these projects was to transfer
jurisdiction of Edgewater Drive from the Florida Department of Transportation to the City of
Orlando. This transfer would allow the City of Orlando to improve the section of roadway by
adding crosswalks, underground utilities, parking, and bicycle lanes.
The study considers crash and injury data, speed analysis, traffic volumes, parking volumes,
pedestrian and cycling volumes, travel times, property values, and community impacts. 3-years
of crash data were considered for the “before” period and 4-months of data were considered
for the “after” period. Due to the small sample size of “after” data, some conclusions may be
inaccurate. It was found that crash rates decreased 34% and injuries decreased 68%. Similarly, a
significant decrease in excessive speeds resulted while travel times within the corridor
increased in most cases. Further, the annual daily traffic reduced on average by 12% and the
utilization of parking increased from 29% to 41% on Edgewater Drive following treatment. It
was also noted that the number of pedestrians and cyclists using the corridor increased
significantly. Finally, property values were shown to increase at an annual rate of 8% – 10% and
1% – 2% for residential and commercial properties, respectively.
Unlike other studies, this study reported results from a community survey conducted “before”
and “after” implementation of the road diet. The community survey and traffic analysis were
used to assess whether the list of measures of effectiveness (MOEs) had been met. The list of
MOEs and whether they were achieved or not are as follows:
o Avoid Increasing Traffic On Neighborhood Streets - YES
o Reduce Speeding on Edgewater Dr - YES
o Increase Bicyclist Volumes - YES
o Increase Pedestrian Volumes - YES
o Reduce Crashes - YES
o Increase On-Street Parking Use Rates - YES
o Increase Pedestrian Satisfaction (Residents) - YES
o Increase Pedestrian Satisfaction (Merchants) - NO

Appendix A: page A-37
o Increase Parking Satisfaction (Residents) - YES
Methods:
Simple before and after comparison.
Implementation:
Advertised public meetings to discuss alternatives.
Development of measures of effectiveness to assess whether the project met intended
goals.

Appendix A: page A-38
Arterial Street Traffic Calming with Three-Lane Roads
2002
T. A. Sohrweide, B. Buck, and R. Wronski
http://www.ite.org/traffic/documents/AB02H5501.pdf
The intent of this report is to discuss the effects of converting two roadways from 4-lanes to 3-
lanes. The paper focuses on the both operational and safety effects due to road diets by
discussing reduction in speed and decreased number of crashes following conversion.
Portland Avenue in Burnsville, Minnesota was a four-lane undivided roadway. The city had been
receiving complaints of excessive speeds along the corridor as well as sight obstructions for left-
turning vehicles at a major intersection. To resolve the left-turning movement issue at the
intersection the City considered widening the roadway and incorporating left-turn lanes at the
intersection ($790,000). The second alternative the City considered was reducing the roadway
to three-lanes and a TWLTL ($250,000). Following implementation of the road diet it was noted
that traffic accidents at the major intersection reduced from 4.3 accidents per year to 2.8
accidents per year. Additionally, average speeds and 85th percentile speeds decreased.
North Main St. in River Falls, Wisconsin was being investigated to determine if the warrants
were met for a traffic signal. The warrants were met and a traffic signal was to be installed
however the City decided to implement additional changes at the same time. Additional issues
included the safety of pedestrians and motorists as well as excessive speeding. Engineers to the
city constructed a list of advantages and disadvantages for retaining the 4-lane cross-section or
implementing the 3-lane cross-section. The city moved forward with the road diet and the
following resulted:
Average and 85th percentile speeds decreased following conversion.
Minor road intersection delay was either maintained or reduced following conversion.
Total accidents reduced from 22 to 7 in the year following conversion, however it was
not determined whether the new traffic signal or road diet had a significant affect on
reduced accidents.
ADT reduced from 19,200 to 16,240 and it was assumed that traffic was using a
highway bypass and not local streets.
The City conducted a survey to gain insight on public opinion which was generally
negative.
Methods:
Simple before and after comparison of crashes and speeds.
Implementation:

Appendix A: page A-39
City handed out 246 surveys following treatment with 87 being returned.
o How would you say that the reconfiguration has affected stress experienced
when entering Main Street?
o How do you feel the average time it takes to enter Main Street from a side street
has changed?
o Would you say the conversion of Main Street from a four-lane to a three-lane
has a positive or negative impact on the ability of side street traffic to enter Main
Street?

Appendix A: page A-40
US-12 Downtown Sturgis Traffic Study: Final Report
December 2004
Prepared by URS
Viewed in hardcopy print
The intent of this report is to provide recommendations to Michigan Department of
Transportation (MDOT) and the City of Sturgis for the reconstruction of US-12 through the City
of Sturgis. MDOT proposed reconstructing US-12 as a five-lane cross-section including a two-
way left-turn lane (TWLTL) while the City of Sturgis proposed a three-lane cross-section with
bike lanes and parallel parking. Because the three-lane and five-lane reconstructions share
similar cross-sections, the three-lane can be expanded to five-lanes if this becomes necessary.
URS recommended the three-lane cross-section for reconstruction to provide safety to the
downtown. Because the three-lane alternative does not provide adequate level-of-service for
the future (year 2026), the roadway is recommended to be monitored and expanded to five-
lanes when necessary.
The report continues with a brief crash data analysis and current/future capacity analysis for
the different alternatives proposed for the roadway. No substantial information is given for the
before and after effects of the reconstruction.
Methods:
Analysis and comparison of three alternative geometry designs for existing and future
conditions (2026) considering a 2.5% growth rate.
2000 Highway Capacity Manual methods to determine peak-hour Levels of Service.

Appendix A: page A-41
Safety and Operational Characteristics of Two-Way Left-Turn Lanes
June 2006
David Noyce, Vijay Talada, Tim J. Gates
http://www.lrrb.org/pdf/200625.pdf
The purpose of this report was to evaluate the safety and operational impacts of converting a
four-lane undivided roadway to a three-lane roadway with a TWLTL in the State of Minnesota.
The report provides a comprehensive list of previous research conducted on road diets and the
effectiveness of TWLTLs. Nine road diet sites were identified in Minnesota based on sufficient
site information for the before and after periods of the treated site. These data included speed,
volume, driveway density, and crash statistics. Nine comparison sites were also identified to
account for factors such as changing ADT, seasonal trends, and other natural phenomenon.
Comparison sites were chosen based on similar cross-sections, ADT, speed limit, intersection
and driveway density, and land use.
Three statistical methods were used to analyze the data including traditional before-after
approach, yoked comparison/group comparison, and Empirical Bayes methods. Following each
analysis it was concluded that the change in ADT was insignificant for each site. Using the
traditional approach it was concluded that the percentage reduction in crashes ranged from
12.9% – 54.1%. Using the group comparison method it was concluded that the percentage
reduction in crashes ranged from 39.3% – 71.6% where two sites exhibited increases in crash
rates (9.8% and 50.5%). Using the Empirical Bayes method it was concluded that the percentage
reduction in crashes ranged from 37.3% – 54.3%.
Methods:
Simple before and after, Empirical Bayes, and Yoked-Paired comparison methods.
Investigated change in number, severity, and types of crashes as well as 85th percentile
speed and ADT.
Volume, speeds, geometric, and access data were collected for nine treatment and nine
comparison sites.
“ADT data were collected for one year prior to and after conversion.”
Five years of before and five years of after crash data were used.
No specifics on end-of-site treatment.

Appendix A: page A-42
Safer Streets: The Measured Effectiveness of Hartford’s Citywide Traffic Calming Program
2007
F. Clara Fang, Joseph H. Rimiller and Najib O. Habesch
http://www.ite.org/traffic/documents/AB07H3401.pdf
The intent of this paper is to investigate and discuss the effects due to implementing a road diet
in Hartford, Connecticut. Road diets have become part of Hartford, Connecticut’s
comprehensive traffic calming master plan and in an effort to study the effects, “before” and
“after” data have been collected and analyzed using the Before-and-After method and
Empirical Bayesian method.
Five road diets were implemented in Hartford within similar time frames including Wethersfield
Ave., Franklin Ave., Maple Ave., Tower Ave., and North Main St. Before and after data were
collected including ADT and total crashes. Twelve control sites were also identified and data
were collected enabling an Empirical Bayesian analysis to be conducted.
The following conclusions resulted due to implementation of road diets:
Crashes reduced between 7% and 57% except for one case where the crashes increased.
This increase is attributed to the low amount of crashes in the before period.
Reduction in crashes was attributed to the reduction in speeds up to 6 mph.
The before-and-after and Empirical Bayesian analysis resulted in similar conclusions
indicating that regression to the mean was not present.
Factors such as crash type and injuries were not analyzed however the authors urge that
these statistics be a point of analysis.
Methods:
Simple before and after comparison and Empirical Bayes method.
Five treated sites and 12 comparison sites.
Crashes and speeds were investigated.
No detailed information on data collection or end treatments.
Implementation:
Neighborhood Traffic Calming Master Plan.
Focus sessions with groups including emergency services, senior citizens, transit
personnel, merchants, and disabled.
Workshops where characteristics of their neighborhood were identified and chosen as
beneficial to enhance.
A final plan was developed and presented to the general public and stakeholders for
review.

Appendix A: page A-43
Technical Memorandum: Road Diet Project Review
April 2010
Cynthia Redinger, P.E. – Washtenaw County Road Commission
Viewed in hardcopy print
The intent of this technical memorandum is to provide information and data for a road diet site
in Washtenaw County. Washtenaw County Road Commission implemented road diets Grove
Road and Ford Boulevard. These roadways were four-lane cross-sections with high driveway
density, no dedicated left turn lanes, and no bike lanes which contradicted the non-motorized
plan for Washtenaw County. This memorandum presents before and after traffic volumes,
crash patterns, vehicular speed statistics, and quality of life concerns. The road diet
implemented on Grove Road was constructed in two phases (Phase I and Phase II) where Phase
I was completed in 2004 and Phase II was completed in 2006.
The before and after analysis of Ford Boulevard resulted in the following conclusions:
Traffic volumes were not significantly affected following implementation of a road diet
85th percentile speed reduced by 6 – 11 mph.
The annual number of total crashes was 8.45 for 4-years before treatment and 9 for 2-
years following treatment indicating that total crashes increased.
No information on pedestrian/cyclist volumes, however the memorandum indicates
that the public opinion was positive.
The before and after analysis of Grove Road resulted in the following conclusions:
Traffic volumes were not significantly affected although traffic volumes have been
decreasing citywide over the past decade.
The average annual number of total crashes per year for Phase I was 15.5 for the before
period and 8.1 for the after period indicating a significant reduction in crashes.
The average annual number of total crashes per year for Phase II was 16.2 for the before
period and 14.9 for the after period indicating a subtle decrease in crashes.
Methods:
Simple before and after comparison.

Appendix A: page A-44
Stone Way N Rechannelization: Before and After study
May 2010 City of Seattle – Department of Transportation
http://www.seattle.gov/transportation/docs/StoneWaybeforeafterFINAL.pdf
The report focuses on one treated roadway, Stone Way N, in Seattle, Washington. Stone Way N
was reduced from 4-lanes to 3-Lanes with a Two-way-left-turn-lane for 1.2. The roadway carries
13,000 ADT along with metro bus routes. The adjacent land is residential and commercial with
eight schools, two public libraries, and five parks. The study utilizes a simple before-and-after
approach and categorizes “before” as April 5, 2005 – August 6, 2007 and “after” as August 7,
2007 – December 4, 2009.
The study concludes that the 85th percentile speeds decreased following the “road diet”
treatment. The number of vehicles traveling over the speed limit by 10 mph or more was
reduced by 75% (150 vehicles per day to 25 vehicles per day).
Additionally, the ADT decreased by 6% while bicycle traffic increased by 35%. Peak flow
declined between 5% – 13% and off peak flow varied from a 2% increase to a 5% decrease.
However, the volume of motor vehicles also decreased citywide between 2006 and 2008.
Adjacent roadways averaged larger decreases in ADT and peak hour traffic volumes. Decreases
of ADT varied from 12 – 34% while decreases in peak volumes varied from 6 – 49%. However,
one roadway had a 2% increase in PM peak hour volumes and another had a 27% increase in
AM peak hour volumes.
Most collision types were reduced but the number of collisions involving cyclists remained
constant. However, due to the additional number of cyclists the collision rate decreased. The
rate of rear end collisions increased, however the majority of these crashes occurred in the
transition area from four-lanes to three-lanes.
Table 1: Reduction in collision type for before and after period

Appendix A: page A-45
OPERATIONAL CHARACTERISTICS OF ROAD DIETS
Two-Way Left-Turn Lanes: State-of-the-Art Overview and Implementation Guide
1978
Z. A. Nemeth
Viewed in hardcopy print
The intent of this study was to investigate the effectiveness of installing Two-Way Left-Turn
Lanes (TWLTL) on the operational and safety of a roadway. The research included a nationwide
expert opinion survey, literature review, and before-and-after field studies.
Ninety questionnaires were mailed and 70 were returned representing 36 states and one city in
Canada. The questionnaire contained questions to investigate the effect of the TWLTL on traffic
safety, the effect of the TWLTL on traffic flow characteristics, and conditions conducive to the
installation of such a median lane. The questionnaire addressed experience (length of time and
number of TWLTLs implemented) where most of the respondents had 1 – 10 years experience
with 1 – 10 uses. Significant improvement of operations was noticed by 66% of respondents.
Public reaction was noted as favorable by 62% of respondents while most of the controversy
developed from the lane markings and signage.
The report continues by presenting several warrants that would require installation of a TWLTL
as well as design details including number of lanes, lane widths, and treatment at intersections.
One case study that was presented was in fact a road diet example where a four-lane arterial
was restriped to three-lanes with a TWLTL. It was noted that the average speed decreased
however, due to unfamiliarity of the “new” TWLTL design, there seemed to be erratic (weaving)
driving conditions.
The paper concludes with a checklist that should be utilized when determining if a TWLTL
would be feasible and effective. Key components of the checklist include existing physical
conditions, existing traffic conditions, future development, and accident histories.
Methods:
Expert opinion survey and simple before-and-after comparison.

Appendix A: page A-46
Using Roadway Conversions to Integrate Land Use and Transportation– The East Boulevard
Experience
April 2007
Joshua E. Saak
http://sdite.org/presentations2007/2A-Saak-Road%20Diet%20Implementation%20in%20NC%20-
%20The%20East%20Blvd.%20Experience.pdf
This presentation was prepared for the SDITE annual meeting in Knoxville, TN on April 23, 2007.
The presentation presents a road diet that was implemented on East Boulevard in Charlotte,
North Carolina.
The presentation provides two population estimates of 651,000 and 1.6 million (metro-area).
The 651,000 may be the city population. East Boulevard is classified as an arterial traveling
through a neighborhood with 21,400 ADT traveling at “relatively high speeds”. The roadway
provides access to multiple land uses including parks, commercial, hospital, and residential. The
East Boulevard Pedscape Plan, adopted in 2002, was a significant reason that the roadway was
converted. The Pedscape Plan established guidelines for streetscape improvements, provided
standards for public properties, and made recommendations for public properties. Another
significant driver for implementation was public safety concerns.
The road diet consisted of over ½ mile of East Boulevard including three signalized intersections
of which two were one-way crossing streets. The conversion included changing signal timing,
surface milling, refuge island construction, resurfacing/striping, and landscaping. Following
implementation, the ADT of the roadway decreased from 21,400 to 18,400, however, it
increased to 22,000 a short time later. The 85th percentile speed was shown to decrease by
almost 3 mph and the crash rate reduced 34%.
The presentation concludes with outlining the objectives of the road diet implementation,
addressing public concerns, procedure in gaining support and approval from residents, and
lessons learned.
Methods:
Simple before and after comparison of pedestrians, ADT, speed, crash, and injury.
Implementation:
Residents wanted a more comfortable roadway for bike, pedestrians, transit patrons,
and motorists.

Appendix A: page A-47
Residents wanted to enhance pedestrian activity on sidewalks and to improve
pedestrian crossings (safety).
Residents wanted more sidewalk cafes, outdoor seating, landscaping, and to restore the
historic nature of the downtown.
Worked with residents regarding the proposed project and design details.
Conducted detailed Synchro analysis to show LOS would not significantly decrease.
Neighborhood voted unanimously to approve the project.
Road diets should begin at the neighborhood level and they are counterintuitive so
education is key.
Limiting the construction time reduces complaints.
Obtain support from city organizations.
Implement new signal timing before constructing road diet.
Retain the option to go back to the original condition.

Appendix A: page A-48
Road Diet Treatment – Ocean City, NJ
February 2007
Daniel Kueper
https://docs.google.com/viewer?a=v&q=cache:AvmAGpBC7UcJ:www.eugene-
or.gov/portal/server.pt%3Fopen%3D18%26objID%3D267728%26parentname%3DSearchResult
%26parentid%3D1%26mode%3D2%26in_hi_userid%3D2%26cached%3Dtrue+&hl=en&gl=us&pi
d=bl&srcid=ADGEEShaT9xhGfEpCMCM6ZTRnTdMOTe-2DwhFjsJgXH-dmO5-
YGz3nnLBaG46UBGnyfuN5hKep4lTPSv7VgOHbsYow8X_-nKED4x8on3z1mhgE-N3y9o9hTC6Jg-
JiSeeDvQAW0z_Au3&sig=AHIEtbRcy8td09kxcsawuyd_Qmv2KY_Zag
This report presents findings resulting from a Road Diet implemented on West Avenue in Ocean
City, NJ. Ocean City is a resort town with an annual population ranging from 15,000 in the
winter to 150,000 during the summer. The city received several complaints from pedestrians
regarding difficulty crossing the roadway. To resolve these complaints the city decided a road
diet was the best alternative. West Avenue is a minor arterial roadway that spans 6 miles. ADT’s
increase to a maximum of 15,000 in the summer season.
Implementation of the road diet resulted in a reduction in speeds by 1 mph for 50th-percentile
speeds (35 mph to 34 mph). Similarly, 85th-percentile speeds were reduced by 1 mph (38 mph
to 37 mph). Additionally, the number of motorists traveling 10 mph or more over the speed
limit of 30 mph was reduced from 12% to 4%. Motorist delay increased 3 seconds at both
intersections however a LOS B was maintained. The number of crashes remained unchanged,
however, the average number of crashes occurring each year was relatively low (2 crashes in
2004 and two crashes in 2005).
Methods:
Simple before and after comparison of speed characteristics

Appendix A: page A-49
Using Road Diets to Integrate Land Use and Transportation – The East Boulevard Experience
2007
Joshua E. Saak, P.E.
Viewed in hardcopy
The intent of this paper was to discuss the process of implementing a road diet on East
Boulevard in Charlotte, North Carolina. The paper provides a background of the local area and
roadway and discusses reasons for the change in roadway cross-section. The paper continues
by presenting characteristics of the collected data as well as the results from analyses using
Synchro and VISSIM. A conclusion of the results is provided followed by a brief before-and-after
study and finally, a brief list of lessons learned are presented.
The local area surrounding East Boulevard was interested in restoring a multi-modal
atmosphere through their Pedestrian Overlay District plan and the need for roadway
resurfacing provided the opportunity. In considering a road diet, the City decided to conduct a
traffic study to investigate the needs of the community with regard to East Boulevard. The City
collected traffic counts, spot speeds, and lane widths to be used in Synchro and VISSIM
analyses.
Synchro results indicated that delay and LOS would be negligibly affected. VISSIM results
indicated a more prominent change between the four-lane and three-lane alternatives where
speeds were shown to decrease, delay was shown to increase 31%, and travel time increased
13% during peak hours.
Although a formal before-and-after study was not conducted, results of continued data
collection concluded that ADT decreased from 21,400 to 18,400 and 85th percentile speeds
decreased between 1 – 5 mph.
Finally, several lessons were learned through this process including the following insight:
The project should begin at the neighborhood level
Road diets seem counterintuitive to citizens
Implementing new signal timing before construction is beneficial
The construction period is difficult especially in downtown districts
Before/after studies are important
Methods:
Synchro analysis to evaluate possible road diet effects with measures of effectiveness
including v/c ratio, level of service, and average control delay per intersection.
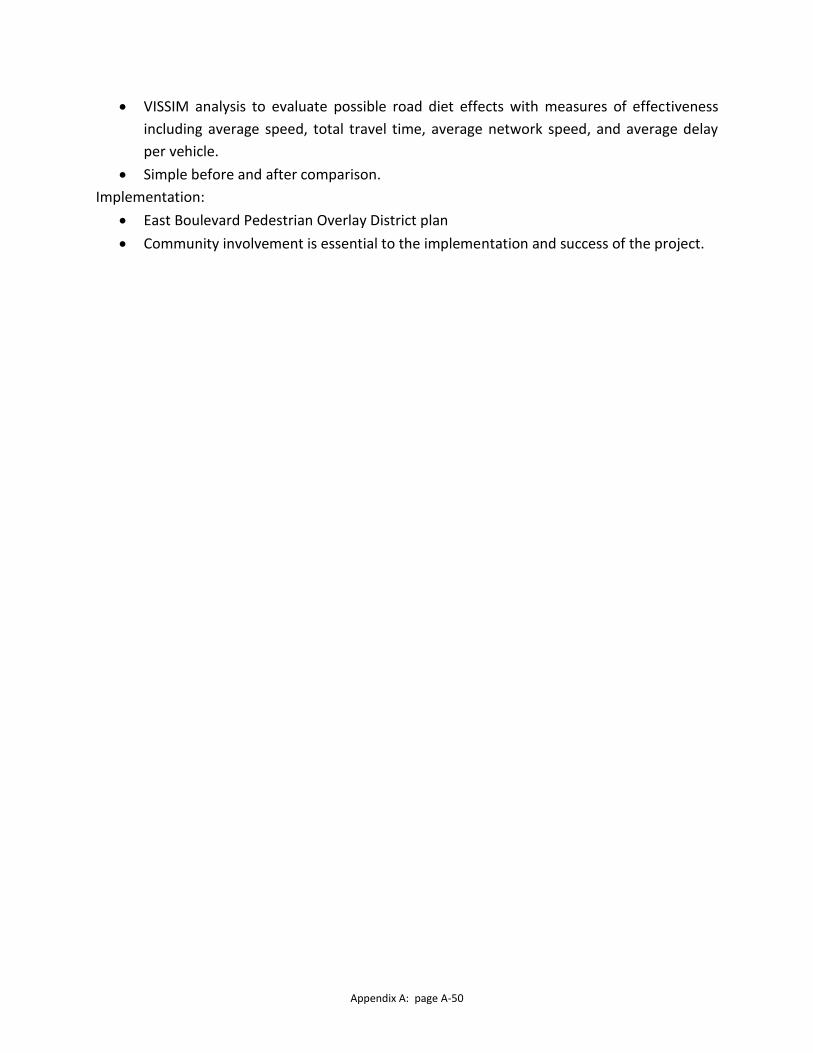
Appendix A: page A-50
VISSIM analysis to evaluate possible road diet effects with measures of effectiveness
including average speed, total travel time, average network speed, and average delay
per vehicle.
Simple before and after comparison.
Implementation:
East Boulevard Pedestrian Overlay District plan
Community involvement is essential to the implementation and success of the project.

Appendix A: page A-51
Multi-objective Optimization of a Road Diet Network Design
March 2011
Keemin Sohn
http://www.sciencedirect.com.proxy1.cl.msu.edu/science?_ob=MImg&_imagekey=B6VG7-
52NC4NM-2-
16&_cdi=6031&_user=1111158&_pii=S0965856411000516&_origin=search&_zone=rslt_list_ite
m&_coverDate=07%2F31%2F2011&_sk=999549993&wchp=dGLbVtb-
zSkzV&md5=37e07642a82329aa90796c869393d1e5&ie=/sdarticle.pdf
The intent of this paper is to present a computer algorithm to be used by decision makers to
determine the design and implementation of a road diet. The algorithm is comprised of two
models: a model where tradeoffs (capacity and delay) between motorists and cyclists took
place and a model where tradeoffs between motorists and society took place where variations
in mode choice were possible. Use of the algorithm provides a systematic approach to design
road diet projects where the primary concern is to provide adequate access for cyclists by
cautiously adjusting the capacity and delay of motorists. Although the models have
considerable downfalls considering the omission of several key variables, the algorithms
nonetheless provide an interesting approach to road diet design.

Appendix B: page B-1
APPENDIX B
DETAILED ON-SITE REVIEWS OF SELECTED SITES IN MICHIGAN

Appendix B: page B-2
The intent of this report is to summarize observations made at several road diet sites pertaining
to the operational and safety characteristics as they relate to pedestrians and cyclists. Road diet
sites were identified by Michigan Department of Transportation and selected by Michigan State
University. The investigated road diet sites were selected based on close proximity from site to
site as well as having “pedestrian/bicyclist safety” identified as a motivation for implementing
the road diet project in the MSU “road diet” project: project/implementation site data
request form (Road Diet Survey Form). The 8 sites investigated were located in the
northwestern part of Michigan and are briefly described as:
M-37 in Baldwin, MI from the US-10 junction extending approximately 200 ft. south of
9th St.
M-55/M-66 in Lake City, MI from W Beeler Rd. to Union St. (Davis Rd.)
M-37/M-115 in Mesick, MI from the M-115/M-37 junction to Clark St.
US-31 in Manistee, MI from M-55 junction extending approximately 300 ft. northeast of
M-110
M-116 in Ludington, MI from US-10 extending approximately 500 ft. north of Lowell St.
Burcham Rd. in East Lansing, MI from Abbot Rd. to Timberlane St.
Abbot Rd. in East Lansing, MI from Albert Ave. to Whitehills Dr.
M-43 in East Lansing, MI from Michigan Ave. to 200 ft. northwest of Audubon Rd.
For the 5 sites located within the Cadillac TSC area, visits were conducted during a major
holiday weekend to gain as much insight as possible regarding operational and safety
characteristics. For the sites located in East Lansing, visits were done in anticipation of peak
usage hours during the day. Primary focus was to investigate pedestrian/cyclist use and a
secondary focus was to investigate pedestrian/cyclist-motorist interactions. Observations will
be summarized on a site-by-site basis followed by concluding remarks on the general
characteristics of road diet conversions.

Appendix B: page B-3
SR 22: Baldwin, Michigan, Lake County – M-37
The village of Baldwin, Michigan had a population of 1,208 according to the 2010 Census, with
an estimated median household income of $15,811. As a tourist destination, it draws mainly
from camping, hunting, and fishing traffic, as the village is close to several rivers and within the
Manistee National Forest. During the visits made to Baldwinno one spoken to mentioned that
the pedestrian and bicycle traffic was unusual that day.
According to the Road Diet Survey Form, the primary motivations for implementing a road diet
along M-37, which acts as the major arterial road through town, included traffic calming, a
reduction of left-turn problems both mid-block and at intersections, and an improvement in
overall safety of the corridor, including that of pedestrians and bicyclists. A 5-lane road with
two-way left-turn lane (TWLTL) and a parking lane exists within the village commercial district
just south of the road diet site. Beginning just south of 9th St., the road diet continues to the
north for 0.2 miles ending at the M-37 junction with US-10, after which the road tapers into a 2-
lane road. At this point, the speed limit changes from 30 mph in town and along the site, to 40
mph, heading north out of town.
Visit #1: Friday, July 1 – arrival at 12:15 pm
Visit #2: Saturday, July 2 – arrival at 10:15 am
Geometric/Marking Observations:
Sidewalks are separated from the curb by about 10 feet; they extend the entire length
of the road diet and continue south into the village commercial center.
View of sidewalk facing south along M-37
There is an unsignalized crosswalk located on the north side of the 10th St. intersection.
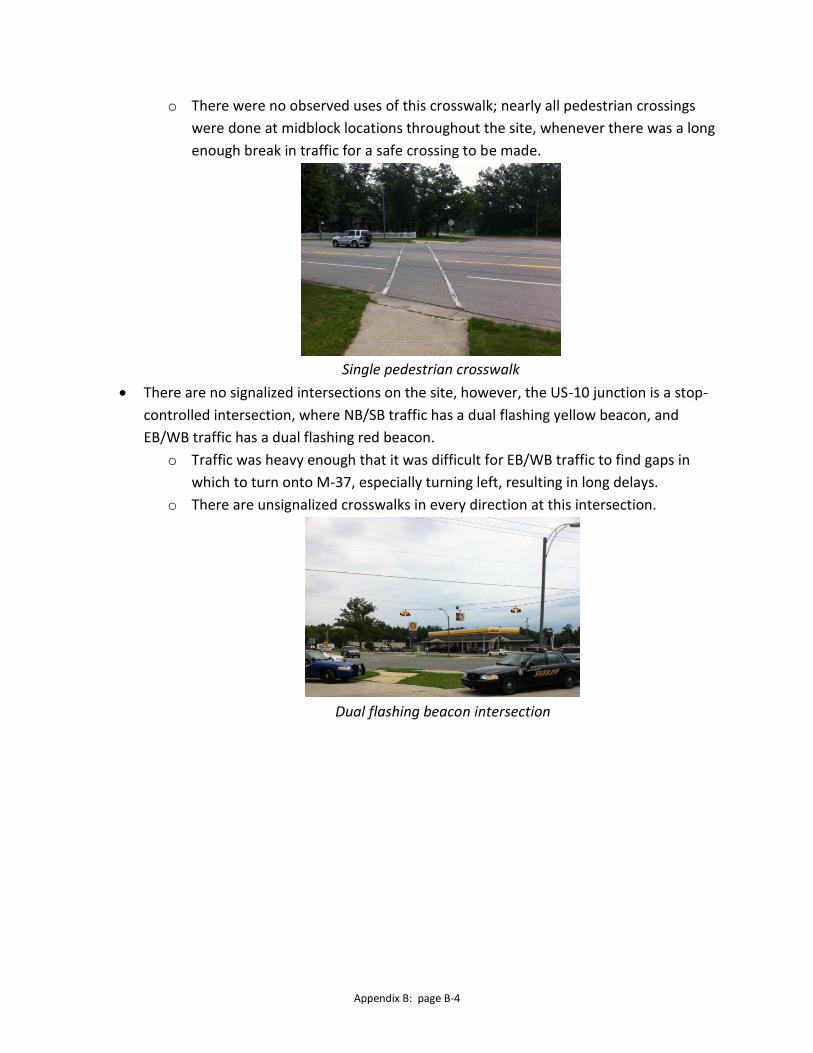
Appendix B: page B-4
o There were no observed uses of this crosswalk; nearly all pedestrian crossings
were done at midblock locations throughout the site, whenever there was a long
enough break in traffic for a safe crossing to be made.
Single pedestrian crosswalk
There are no signalized intersections on the site, however, the US-10 junction is a stop-
controlled intersection, where NB/SB traffic has a dual flashing yellow beacon, and
EB/WB traffic has a dual flashing red beacon.
o Traffic was heavy enough that it was difficult for EB/WB traffic to find gaps in
which to turn onto M-37, especially turning left, resulting in long delays.
o There are unsignalized crosswalks in every direction at this intersection.
Dual flashing beacon intersection

Appendix B: page B-5
There is a snowmobile crossing right at the south edge of the road diet site.
Snowmobile crossing
There are wide (~7 ft.) unmarked lanes on each shoulder, that are presumably intended
to be used as bike lanes.
o Lanes are wide enough that cars easily drift into them, especially at road curves;
they essentially create extra-wide moving lanes that allow cars to travel much
faster than the speed limit.
o There were also occasions witnessed where these lanes were used as right-turn
lanes.
View of wide shoulder facing south
Pedestrian/Bicyclist Observations:
30 minute count on Visit #1:
o 13 pedestrians (inc. skateboard, wheelchair, and stroller)
o 0 bicyclists
Appendix B: page B-6
15 minute count on Visit #2:
o 8 pedestrians
o 1 bicyclist
There was very little activity of either pedestrians or bicyclists along the site.
o No trends in type or purpose of pedestrian were noticeable.
Most pedestrian crossing occurred mid-block and often required a long wait to find a
safe gap in traffic.
During Visit #1, a wheelchair pedestrian was witnessed experiencing difficulty crossing
US-10 at the intersection with M-37; another pedestrian went into the road to direct
traffic in order to allow the wheelchair time to cross the road.
Resident Interactions:
The road diet was constructed in 1998, so no one was able to recall what the road was
like prior to construction.
In a conversation with a local pedestrian during Visit #1, the following comments were
made:
o The M-37/US-10 intersection is very dangerous.
o Several accidents occur per month.
o Waits to cross the street can be up to 30 minutes.
o Speeding is an issue, and cars have to take higher risks to turn into traffic.
In a conversation with a local pedestrian during Visit #2, the following comments were
made:
o It is easier to cross M-37 along the road diet than either at the US-10 intersection
or along the wider section of road south of the site.
Conclusions:
While there is infrastructure present (sidewalks, crosswalks, bike lanes), very little
pedestrian and bicyclist activity occurs along the road diet site. There appears to be
much more traffic just south of the site, where the heavier commercial district acts as a
pedestrian generator.
Vehicle traffic through the road diet seems to exceed the speed limit of 30 mph. It gives
the road more of a feel of a wide, fast-moving highway than of a pedestrian-friendly
road, making crossing difficult and forcing long delays.
The road diet did not seem to be successful in either calming traffic or in encouraging
safe pedestrian and bicycle traffic, even though these were stated reasons behind the
construction.
Appendix B: page B-7
SR 26: Lake City, Michigan, Missaukee County – M-55/M-66
The city of Lake City, Michigan had a population of 836 according to the 2010 Census, with an
estimated median household income of $29,130. It is a popular tourist destination, and is a
seasonal home for many more who own or rent cottages around Lake Missaukee. During the
two visits made, the town was heavily populated by tourists visiting for a local 4th of July
festival. One local business owner said that that weekend was the busiest that the town had
experienced and that throughout the rest of the year both traffic and pedestrian volumes were
relatively low.
According to the Road Diet Survey Form, the primary motivations for implementing a road diet
along M-55/M-66, which is the main arterial road through the city, included traffic calming, a
reduction of left-turn problems both mid-block and at intersections, and an improvement in
overall safety of the corridor, including that of pedestrians and bicyclists. South of the road
diet, M-55/M-66 is a 2-lane road. The road diet begins just south of 1st St. and continues for 0.6
miles until it becomes a 2-lane road with parking lanes on either side, just north of Union St.
The speed limit for the majority of the road diet is 35 mph, although it changes to 45 heading
south a short distance north of 1st St.
Visit #1: Friday, July 1 – arrival at 2:10 pm
Visit #2: Saturday, July 2 – arrival at 11:55 am
Geometric/Marking Observations:
There is a sidewalk on the east side of the road, which extends nearly the entire length
of the site (there are none between Union St. and Hill St.) and it is not separated from
the edge of the road.
o On the opposite side of the road, pedestrians used the bike lane for walking.

Appendix B: page B-8
Sidewalk directly adjacent to pavement
There are no crosswalks along the site.
o Traffic did not yield to pedestrians, and all crossing was done mid-block and
rushed through gaps in traffic.
There are unmarked bike lanes on both sides of the road diet.
o There were several instances where cars parked along the road diet in the bike
lanes, mostly on the side without the sidewalk.
View of bike lane facing north
On the west side of the road there were staircases that headed down the slope, towards
the boardwalk along the beach.
o Since there is no sidewalk along this side of the road, there is nowhere for
people using these staircases to go once they get to the top, forcing them to
either cross mid-block to reach the sidewalk across the street, or to walk in the
bike lane.
There were no signalized intersections along the road diet site.

Appendix B: page B-9
Vehicular Traffic Observations:
There was noticeable northbound traffic back-up during both visits, although it was
much worse during Visit #2. During that visit, traffic was backed up all the way to the
south end of the road diet site.
o Although this was likely an anomaly because of the 4th of July celebrations in
Lake City, it presented an example of the road diet not adequately dealing with
the traffic load.
o Many of the cars in the back-up were carrying kayaks and bicycles, suggesting a
high tourist population.
o To get around heavy traffic, motorcycles were seen using bike lanes as right turn
lanes.
Since the beach extends along the west side of the road diet, there are only turning
opportunities to use the TWLTL on one side of the road, and most of those are
residential driveways. Thus, the TWLTL was not used very often for turning.
o There were cars seen using the TWLTL for passing in traffic.
o Some cars used the TWLTL as a waiting lane to turn left onto M-55/M-66,
although that maneuver is not legal.
o Because of the heavy traffic in the northbound lane, there was occasionally
backup in the TWLTL as cars had to wait to find gaps to make the left turn.
Pedestrian/Bicyclist Observations:
15 minute count on Visit #1:
o 24 pedestrians
Almost all of these pedestrians were seen in large groups heading north
from either Union St. or the public beach parking lot near the north end
of the road diet site.
o 4 bicyclists
15 minute count on Visit #2:
o 7 pedestrians
o 1 bicyclist
There was significantly more pedestrian traffic along the commercial district just north
of the road diet, than there was along the more residential area where the road diet
was in place.
There was very little activity of either pedestrians or bicyclists along the site.
Most pedestrian crossings occurred mid-block and often required a long wait to find a
safe gap in traffic.
Appendix B: page B-10
o Because of the heavy traffic, pedestrian crossing was especially difficult, and
there were several occasions witnessed where pedestrians were forced to cross
in otherwise unsafe circumstances.
Although the road diet extends along the beach, most beachgoers park in the public lot
near the north end of the road diet and go straight along the boardwalk, avoiding
walking along the road.
Resident Interactions:
In a conversation with a local pedestrian walking her dog during Visit #1, the following
comments were made:
o An increase in pedestrian and bicyclist traffic was noticed when the road diet
was implemented, especially with tourists.
o She liked having the TWLTL to make the left turn into her driveway.
o She said she felt safer walking along the road since the change.
Conclusions:
The constant heavy stream of northbound traffic observed in the site visit was out of the
ordinary and put an abnormal strain on the road diet site.
With the single adjacent sidewalk, and the lack of crosswalks, pedestrian traffic does not
appear to be encouraged along the main portion of the road diet.
Pedestrians are forced to make mid-block crossings, through heavy traffic.
Most pedestrian and bicyclist traffic occurs north of the road diet, along the commercial
district of Lake City.

Appendix B: page B-11
SR 33: Mesick, Michigan, Wexford County – M-37/M-115
The village of Mesick, Michigan has a population of 394 according to the 2010 Census, with an
estimated median household income of $25,313. Although there are nearby fishing and
camping areas, even on a holiday weekend over which the two visits were made, there did not
appear to be much tourist traffic.
According to the Road Diet Survey Form, the primary motivations for implementing a road diet
along M-37/M-115, which is the main arterial road through the city, included traffic calming, a
reduction of left-turn problems both mid-block and at intersections, and an improvement in
overall safety of the corridor, including that of pedestrians and bicyclists. West of the junction
of M-37 and M-115, where the road diet begins, the road tapers into a 2-lane road, as it does
on the other end of the 0.7 mile long site, just east of Clark St. The speed limit is 35 mph
throughout the site, and it becomes 45 mph as you leave the road diet, heading in either
direction.
Visit #1: Friday, July 1 – arrival at 4:15 pm
Visit #2: Saturday, July 2 – arrival at 12:20 pm
Geometric/Marking Observations:
There are sidewalks that run nearly the entire length (but not further in either direction)
of the road diet, on both sides of the road.
o They are separated from the road/parking lanes, and are well landscaped and
look very clean; the road is clearly intended to encourage pedestrian activity.
View of landscaped sidewalk along M-37
There are crosswalks on both sides of nearly every intersection.

Appendix B: page B-12
o There are also several signs informing drivers of the location of the crosswalks,
as well as advanced signs warning them of upcoming crosswalks.
Crosswalk with warning road sign
Except for the far western portion of the road diet, in which there does not appear to be
as heavy a commercial presence, parking lanes line both sides of the road diet. They
appear to be used frequently as most storefronts do not have adjacent parking lots.
View of parking lanes facing west
There are unmarked bike lanes on both sides of the road diet site.

Appendix B: page B-13
View of bike lanes facing west
Pedestrian/Bicyclist Observations:
During Visit #1, after a 10 minute pedestrian count upon arrival witnessed no pedestrian
activity, the attempt for a longer formal data collection period was abandoned.
Throughout the approximately hour-long site visit there were perhaps a total of 5
pedestrians and 1 bicyclist seen.
20 minute count on Visit #2:
o 3 pedestrians
o 1 bicyclist
There was very little pedestrian activity to note during either visit – the only real
pedestrian activity witnessed was of people crossing the street (usually mid-block) to go
from their parked cars to storefronts and vice versa.
o At the west end of the road diet are both the Mesick public elementary, and
Jr./Sr. high school (The high school is located further south, behind the
elementary school, but still appears likely to supply significant pedestrian traffic
to the road diet.). It appeared as if the pedestrian infrastructure may have been
put in place to handle larger volumes from the schools, when it is in session.
Although there are crosswalks present throughout the site, most pedestrian crossing
witnessed was still done mid-block, especially when it was to get to a car parked in the
parking lanes.
o Crossing, either at the crosswalks, or mid-block, was not very difficult, as the
level of vehicle traffic was relatively low, though fairly constant.
o When there were interactions between crossing pedestrians and vehicles, the
vehicles correctly assumed right-of-way.

Appendix B: page B-14
The few bicyclists seen along the road diet used the sidewalks rather than the bike
lanes.
Resident Interactions:
In a conversation with a local pedestrian during Visit #2, the following comments were
made:
o Pedestrian crossing was noted as a problem as people cross mid-block.
o Pedestrians are hesitant to use the TWLTL as a refuge when crossing the street.
Conclusions:
This seems to be an example of a very well-functioning road diet. Vehicle traffic was
relatively calm, and there was never any back-up, and there didn’t seem to be any
problems regarding pedestrian safety or access.
The wide lanes, parking lanes, and well-landscaped sidewalks gave the town a very
quaint feel that would seem to encourage pedestrian and bicycle activity, however it
was not used very much.
o Presumably, there is heavier traffic from the nearby school when it is in session.

Appendix B: page B-15
SR 24: Manistee, Michigan, Manistee County – US-31
The city of Manistee, Michigan had a population of 6,226 according to the 2010 Census, with an
estimated median household income of $37,721. Located between Lake Michigan and
Manistee Lake, it is a popular camping, boating, and fishing tourist location, and, especially over
the 4th of July weekend when the visit was made, there is a lot of extra traffic from seasonal
visitors.
According to the Road Diet Survey Form, the primary motivations for implementing a road diet
along US-31, which is the main arterial road through the city, included traffic calming, a
reduction of left-turn problems both mid-block and at intersections, and an improvement in
overall safety of the corridor, including that of pedestrians and bicyclists. Just east of the
junction with M-55, the road tapers into a 2-lane road, and just east of Lakeshore Rd. it
becomes a 5-lane road with a TWLTL. The road diet goes through a commercial district, and
ends before the downtown part of town. The speed limit throughout the site is 40 mph.
Visit #1: Friday, July 1 – arrival at 6:00 pm
Geometric/Marking Observations:
There are no sidewalks, bike lanes, or cross walks along the road diet site. It is simply a
3-lane road with a TWLTL and no space between the moving lanes and the curb.
Lack of pedestrian or bicyclist infrastructure
Vehicular Traffic Observations:
Traffic was constant and heavy along the road diet site and there was congestion
throughout.
Appendix B: page B-16
o Turning left, both onto and off of the road diet site was very difficult because of
congestion, and forced cars to take bigger risks. Throughout the hour-long
observation, there were several occasions witnessed, where horns were
sounded, and squeeling tires were heard as vehicles made aggressive
maneuvers.
In one instance, a car attempting to turn left onto the site found a gap in the near lane,
and turned into the TWLTL and used it as a waiting lane to get into the far lane. An
oncoming truck, however, though that he was being cut off and slammed on the brakes
and sounded his horn.
Pedestrian/Bicyclist Observations:
There were very few pedestrians or bicyclists seen along the road diet site, which was
not surprising given the lack of sidewalks or bike lanes.
o One bicyclist was seen riding along the grass on the side of the road and
sometimes venturing onto the side of the road. When this happened, vehicles
had to swerve into the TWLTL to pass him.
The congestion of vehicles on the road and the fast, aggressive style made walking along
the side of the road seem unsafe.
Conclusions:
It is surprising that pedestrian safety was listed as a rationale for the road diet in
Manistee, since there is no infrastructure in place to accommodate pedestrians or
bicycles.

Appendix B: page B-17
SR 25: Ludington, Michigan, Mason County – M-116
The city of Ludington, Michigan had a population of 8,076 according to the 2010 Census, with
an estimated median household income of $33,369. Located along Lake Michigan, it is a very
popular tourist location, with a large campground and many hotels in the surrounding area.
Both visits were done over the 4th of July weekend, when the city was especially busy with
tourists.
According to the Road Diet Survey Form, the primary motivations for implementing a road diet
along M-116 included traffic calming, a reduction of left-turn problems both mid-block and at
intersections, and an improvement in overall safety of the corridor, including that of
pedestrians and bicyclists. The road diet site does not go through the main commercial district
of town, but is a 0.8 mile stretch of road that extends along the public beach in Ludington. The
road diet begins at US-10, and it ends just north of Lowell St., where it tapers into a 2-lane road.
The speed limit is 35 mph on M-116 where the road goes along the beach; north of this portion
of the road diet, the speed limit changes to 45 mph.
Visit #1: Friday, July 1 – arrival at 7:35 pm
Visit #2: Saturday, July 2 – arrival at 8:10 am
Geometric/Marking Observations:
There are sidewalks, separated from the road by about 5 feet, along the entirety of the
road diet site, on both sides of the road until just north of the beach, where it ends on
one side. These sidewalks join a larger network of sidewalks in the neighborhood east
of the site and along the main commercial district in Ludington.
View of sidewalk facing north
There are crosswalks at most of the cross streets.

Appendix B: page B-18
View of crosswalk on M-116
Because there is a public beach parking lot that runs parallel to the road diet, and only
has one entrance, there are no possible left turns from the northbound lane for the
majority of the road diet site. Therefore, the TWLTL is striped with a double solid line on
one side, essentially making it a one way turn lane and a waiting lane for cars making
left turns onto the road.
TWLTL with solid double line on one side

Appendix B: page B-19
There are unmarked bike lanes throughout the site on both sides of the road.
View of bike lane facing north
Vehicular Traffic Observations:
Although the speed limit is 35 mph, traffic seemed to always be traveling at even slower
speeds.
o There are lots of motorcycles that travel along M-116, and they all seem to travel
at speeds less than 35 mph as well.
Except for the driveway into the public beach parking lot, the rest of the driveways were
residential along the road diet site, and they were all on the side of the road opposite
the beach, meaning that the TWLTL was rarely occupied outside of the turn lane into the
beach parking lot.
The volume of vehicular traffic was obviously much higher during Visit #1 (Friday
evening) than during Visit #2 (Saturday morning), but it was never high enough that the
road was congested.
Some cars were seen making left turns out of the outside lane, rather than using the
TWLTL.
Pedestrian/Bicyclist Observations:
20 minute count on Visit #1 (south end of site):
o 17 pedestrians
o 6 bicyclists
15 minute count on Visit #1 (middle of site):
o 24 pedestrians
o 11 bicyclists
30 minute count on Visit #2 (middle of site):
o 46 pedestrians
o 9 bicyclists

Appendix B: page B-20
During both visits, most of the pedestrian traffic seems to be travel across the road and
to the beach. People seemed to walk along the beach rather than actually travelling on
the sidewalks along the road.
o Almost all pedestrians crossed at one of the crosswalks, rather than mid-block.
The highest frequency of these crossings occurred at the intersection of Haight
St. and Pere Marquette St., which, after conversation with a pedestrian, were
along the most direct path to the campground.
o Pedestrians and bicyclists typically crossed M-116 from the neighborhood to the
east towards the beach and back. Although some of the bicycle traffic was to
and from a skate park at the south end of the site. This usually meant that they
travelled on the sidewalks rather than in the bike lanes.
During Visit #1, most of the pedestrians and bicyclists travelled in groups to and from
the beach, and during Visit #2, most of them were morning exercisers (runners, etc.).
There was much less pedestrian and bicyclist traffic on the section of the site north of
the public beach, and on this portion of the site, they were mostly residents travelling
north and south along the road to and from the beach, using the sidewalks and bike
lanes.
o Even on the northern part of the site, bicyclists tend to use the sidewalks rather
than the bike lanes.
The vehicular traffic on M-116 was light enough that pedestrians and bicyclists so there
was never much delay.
Resident Interactions:
In a conversation with two local pedestrians during Visit #1, the following comments
were made:
o General perception of the road diet was that it was a very positive change.
o The change increased pedestrian traffic significantly.
o Lots of bikes are seen using the bike lanes.
o Their single complaint was that cars did not yield to pedestrians at crosswalks,
and that there is no designation informing drivers that pedestrians have the
right-of-way, indicating a lack of education on traffic law, since vehicles legally
have the right-of-way in such a situation.
In a conversation with a pair of bicyclists during Visit #1, the following comments were
made:

Appendix B: page B-21
o They came through the neighborhood to the east, from the campground, and
crossed to go to the beach. They followed a bike path network that goes from
the campground to the beach.
o They prefer to ride on sidewalks, which they can do in the neighborhood, and do
not like riding on “the road” on M-116.
They did not seem to be aware of the purpose of the bike lanes, which
may not be surprising given that they were tourists and that the bike
lanes were unmarked.
In a conversation with a local pedestrian walking his dog during Visit #2, the following
comments were made:
o General perception of the road diet was very positive and that was the case for
everyone he knew locally.
o The most positive change was that the road diet slowed down vehicles, making it
much safer for pedestrians to walk along the road and to cross it to go towards
the beach.
When it was a 4-lane road, there were lots of vehicles, especially
motorcycles, that would race alongside each other down M-116.
o He never noticed any times when traffic would back up.
o When the change was first announced, his wife was very skeptical, as were many
others, but after experiencing its effects, they were unanimously in favor of it.
Conclusions:
This seems to be an example of a very successful, well-functioning road diet. Traffic
seems to be very calm and safe for pedestrians and bicyclists. It seems that the road
diet has encouraged beachgoers to walk or bike to the beach rather than driving and
parking in the lot.
Of the visited sites, this site by far had the most pedestrian activity, although it did not
have the most vehicular traffic.

Appendix B: page B-22
SR 42: East Lansing, Michigan, Ingham County – Burcham Rd.
The city of East Lansing, Michigan had a population of 48,579 according to the 2010 Census,
with an estimated median household income of $27,898. As the location of Michigan State
University, it is home to a large student population, who are younger and more active than the
average population in non-college cities. There is, to be expected, a higher level of pedestrian
and bicycle traffic from this demographic than in other places studied. All visits to the sites in
East Lansing were done on weekdays during the school year, in order to witness the impact of
student traffic on the road diet sites.
According to the Road Diet Survey Form, the primary motivations for implementing a road diet
along Burcham Rd. included traffic calming, a reduction of left-turn problems both mid-block
and at intersections, a reduction in traffic volumes, and an improvement in overall safety of the
corridor, including that of pedestrians and bicyclists. Along Burcham Rd., in addition to a lot of
MSU student housing, are three East Lansing public schools (EL High School, MacDonald Middle
School, and Marble Elementary School), as well as a nearby private school, contributing high
volumes of pedestrian and bicyclist traffic to the corridor. The road diet begins at the western
end of Burcham Rd., at Abbot Rd. – across Abbot Rd., Burcham Rd. becomes a driveway for the
East Lansing Community Center. The road diet site is 1.6 miles long, and, at its eastern end, it
tapers into a 2-lane road. The speed limit for the entire length is 25 mph.
Visit: Tuesday, September 13 – arrival at 7:30 am
Geometric/Marking Observations:
There are sidewalks on both sides of the road that run nearly the entire length of the
site (on the north side of the road, there is no sidewalk for the easternmost 0.25 mi).
They vary in width of separation from the road throughout the road diet, depending on
the surrounding land use, and they connect with a larger network of sidewalks within
the surrounding residential neighborhoods.

Appendix B: page B-23
There are crosswalks throughout the site, especially around the schools, which are, in
general, used correctly.
View of crosswalk at Bailey St.
o Traffic, which was consistently heavy, did not always yield to pedestrians and
bicyclists waiting to cross the street around the high school. Pedestrians often
made aggressive crossing maneuvers, forcing traffic to wait for them to cross.
o Many of the crosswalks included traffic signs indicating their location and
purpose.
Pedestrian crossing sign
o Near the middle and elementary schools, there were crossing guards that would
stop traffic to allow the safe crossing of students in the crosswalks.
o There was a noticeable lack of crosswalks between school areas, where there are
large MSU student apartment complexes. Pedestrians at these destinations
crossed midblock at any gap in vehicular traffic.

Appendix B: page B-24
There are marked bike lanes on both sides of the road diet site.
Bike lane marking
There was a signalized intersection with Abbot Rd. at the western end of the road diet,
as well as one with Hagadorn Rd. in the middle of site.
Signalized intersection at Abbot Rd.
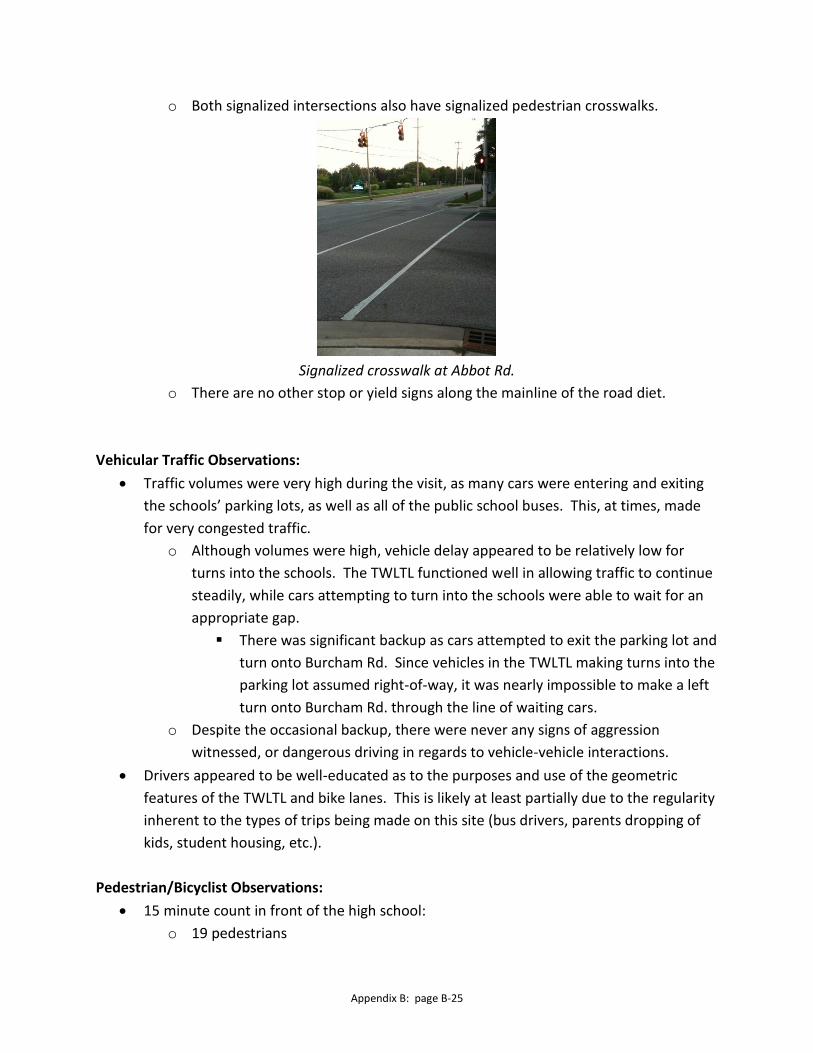
Appendix B: page B-25
o Both signalized intersections also have signalized pedestrian crosswalks.
Signalized crosswalk at Abbot Rd.
o There are no other stop or yield signs along the mainline of the road diet.
Vehicular Traffic Observations:
Traffic volumes were very high during the visit, as many cars were entering and exiting
the schools’ parking lots, as well as all of the public school buses. This, at times, made
for very congested traffic.
o Although volumes were high, vehicle delay appeared to be relatively low for
turns into the schools. The TWLTL functioned well in allowing traffic to continue
steadily, while cars attempting to turn into the schools were able to wait for an
appropriate gap.
There was significant backup as cars attempted to exit the parking lot and
turn onto Burcham Rd. Since vehicles in the TWLTL making turns into the
parking lot assumed right-of-way, it was nearly impossible to make a left
turn onto Burcham Rd. through the line of waiting cars.
o Despite the occasional backup, there were never any signs of aggression
witnessed, or dangerous driving in regards to vehicle-vehicle interactions.
Drivers appeared to be well-educated as to the purposes and use of the geometric
features of the TWLTL and bike lanes. This is likely at least partially due to the regularity
inherent to the types of trips being made on this site (bus drivers, parents dropping of
kids, student housing, etc.).
Pedestrian/Bicyclist Observations:
15 minute count in front of the high school:
o 19 pedestrians
Appendix B: page B-26
o 16 bicyclists
o Outside of one or two recreational runners, these pedestrians and bicyclists
were exclusively headed towards the high school from various surrounding
residential areas.
15 minute count on near the elementary school:
o 18 pedestrians
o 10 bicyclist
o While many of these pedestrians were students (and their parents), there
appeared to be more recreational traffic during this count (runners, recreational
bicyclists, walkers with strollers, etc.), but this was likely due to the fact that the
count was done about 30 minutes after the first one.
Most of the pedestrian and bicyclist traffic was associated with the nearby schools, and
was therefore most highly concentrated in those areas.
o Students often travelled in the neighborhoods south of Burcham Rd. and only
came to the road diet to cross to the high school, rather than walking along
Burcham Rd. for a majority of their trip.
As there were no crossing guards for traffic at the high school, pedestrians and bicyclists
were forced to find safe gaps in traffic on their own. This was often difficult with such
heavy vehicular traffic, and there was one incident witnessed where two pedestrians
crossed in a short gap and a car had to stop suddenly to avoid a collision.
Bicyclists often used sidewalks rather than bike lanes, despite the clear markings.
Runners often used the bike lanes rather than the sidewalks.
Several bicyclists were seen using the TWLTL to cross the street and make left turns off
of Burcham Rd. Although they were using the bike lanes while travelling along the road
diet site, they would enter vehicle traffic in order to make those left turns.
Resident Interactions:
In a conversation with a crossing guard during a period of low pedestrian traffic, the
following comments were made:
o Pedestrians are not as safe as they were before the implementation of the road
diet.
o There are fewer students who walk to school than there were before the
change.
o Vehicle speeds are still too high, and conditions are not safe for crossing without
the control of the crossing guard.
There used to be a guard at the crosswalk near Bailey St., where students
cross to the high school. There is not anymore, and it is an unsafe
location to cross.

Appendix B: page B-27
o Vehicles do not understand how to use the TWLTL; they often make left turns
out of the far lane and hold up other traffic.
Conclusions:
The road diet appeared to be successful at slowing down vehicular traffic. Despite the
comments of the crossing guard, there were never any excessive speeds noticed along
the site.
While the speed of traffic was fairly calm, volumes were high, and there was occasional
congestion and delay, especially in traffic turning onto Burcham Rd.
o Pedestrian crossing was occasionally difficult and forced people to attempt to
cross in unsafe gaps.
A large majority of traffic, vehicular, pedestrian, and bicyclist, was associated with the
schools along the corridor.
o Most vehicular traffic was between Abbot Rd. and Hagadorn Rd., where the
schools are located. Traffic along the road diet site east of Hagadorn Rd. was
significantly lower than it was west of the intersection.
Contrary to the observations of the interviewed crossing guard, there appeared to be a
reasonable level of understanding as to the proper use of the TWLTL, which contributed
to a better flow of traffic throughout the road diet, relative to some of the sites visited
in Northern Michigan.

Appendix B: page B-28
SR 43: East Lansing, Michigan, Ingham County – Abbot Rd.
The city of East Lansing, Michigan had a population of 48,579 according to the 2010 Census,
with an estimated median household income of $27,898. As the location of Michigan State
University, it is home to a large student population, who are younger and more active than the
average population in non-college cities. There is, to be expected, a higher level of pedestrian
and bicycle traffic from this demographic than in other places studied. All visits to the sites in
East Lansing were done on weekdays during the school year, in order to witness the impact of
student traffic on the road diets.
According to the Road Diet Survey Form, the primary motivations for implementing a road diet
along Abbot Rd. included traffic calming, a reduction of left-turn problems both mid-block and
at intersections, and an improvement in overall safety of the corridor, including that of
pedestrians and bicyclists. There is a mixture of residential (MSU student housing) and
commercial/institutional (including the East Lansing Library and Post Office) land uses along this
section of Abbot Rd. The road diet begins Albert Ave. and continues north for 0.6 mi. to
Whitehills Dr., where the road tapers into a 5-lane road with aTWLTL. The speed limit for the
entire length of the site is 25 mph.
Visit: Tuesday, September 13 – arrival at 7:30 am
Geometric/Marking Observations:
There are sidewalks on both sides of the road that run the entire length of the road diet
and are separated from the road by approximately 5 ft. They connect with a larger
network of sidewalks within the surrounding residential neighborhoods.
There are crosswalks throughout the road diet, located at nearly every intersection,
signalized or otherwise.
There are bike lanes on both sides of the road diet, with simple arrow markings
indicating proper direction, although the bicycle symbol is not present in the lanes.
There is a signalized intersection with Albert Ave. at the southern end of the road diet,
as well as with Burcham Rd. and Library Ln. in the middle of site.
o All three signalized intersections also have signalized pedestrian crosswalks.
o There are no other stop or yield signs along the mainline of the road diet.
Vehicular Traffic Observations:
Traffic volumes were high throughout the visit, and many of the vehicles were
associated with the public high school located nearby on Burcham Rd.

Appendix B: page B-29
There was significant delay (a queue of nearly 20 cars) at both the intersections of
Library Ln. and Burcham Rd.
o This queuing stopped at about 7:50, however, presumably, with the end of the
high school arrival and drop-off period.
Vehicles regularly used the TWLTL as a merging lane to make left turns onto Abbot Rd.
from the side streets and driveways.
Pedestrian/Bicyclist Observations:
15 minute count at Library Ln:
o 4 pedestrians
o 33 bicyclists
o There were significantly more bicyclists than pedestrians along this portion of
the site. Many of these bicyclists turned onto Burcham Rd. and headed toward
the high school.
15 minute count at Albert Ave:
o 27 pedestrians
o 37 bicyclist
o The majority of these pedestrians and bicyclists were college students, rather
than high school students, headed south towards the MSU campus.
There was a mixture of college (MSU) and high school (ELHS) students travelling along
this site during this morning period of study.
Bicyclists used both the bike lanes (sometimes using the wrong one according to
direction), and the sidewalks.
o A general trend was noticed that bicyclists headed towards the high school
tended to ride on the sidewalks, while college students rode in the bike lanes.
Pedestrians typically crossed appropriately at the crosswalks, while bicyclists would
cross mid-block, whenever there was a safe gap.
Conclusions:
The road diet appears to be successful at making pedestrian and bicycle travel
reasonably safe for both the local high school traffic and MSU student traffic.
This time period was one of high vehicular traffic volumes – perhaps temporarily above
the capacity of the road diet – causing significant backup at the signalized intersections.

Appendix B: page B-30
Grand River Ave: East Lansing, Michigan, Ingham County – M-43
The city of East Lansing, Michigan had a population of 48,579 according to the 2010 Census,
with an estimated median household income of $27,898. As the location of Michigan State
University, it is home to a large student population, who are younger and more active than the
average population in non-college cities. There is, to be expected, a higher level of pedestrian
and bicycle traffic from this demographic than in other places studied. All visits to the sites in
East Lansing were done on weekdays during the school year, in order to witness the impact of
student traffic on the road diets.
While this corridor was not a site included in this study, it was selected as a viable candidate for
a site visit due to its status as a recent, local road diet that is located in a heavy pedestrian area.
The road diet begins at Michigan Ave. and continues northwest for 0.9 mi until it tapers into a
2-lane road near Audubon Rd. There is some commercial land use at the east end of the road
diet, but the majority is residential. The speed limit is 25 mph throughout the site.
Visit: Thursday, September 15 – arrival at 12:45 pm
Geometric/Marking Observations:
There are sidewalks on both sides of the road that run the entire length of the road diet
and are separated from the road by approximately 5 ft. They connect with a larger
network of sidewalks within the surrounding residential neighborhoods.
There are crosswalks throughout the road diet, located at nearly every intersection,
signalized or otherwise.
o There are several signs located along the site indicating the location of
crosswalks and presence of pedestrians.
There are unmarked bike lanes on both sides of the road diet site.
There are signalized intersections at Hillcrest Ave., Harrison Ave., and Kensington Rd.
o All three signalized intersections also have signalized pedestrian crosswalks.
o There are no other stop or yield signs along the mainline of the road diet site.
Vehicular Traffic Observations:
There was delay at the intersection with Harrison Ave. that led to a queue of about 15
vehicles.
Pedestrian/Bicyclist Observations:
15 minute count at Harrison Ave:

Appendix B: page B-31
o 7 pedestrians
o 3 bicyclists
15 minute count at Hillcrest Ave:
o 13 pedestrians
o 8 bicyclist
The majority of all pedestrian and bicyclist traffic along this corridor was made up of
college students.
Bicyclists tended to use the sidewalks rather than ride in the designated bike lanes.
o When they did ride in the bike lanes, they managed to safely remain in view of
drivers at all times, leading to a minimization of bicyclist/vehicle conflict at
intersections.
Conclusions:
The bike lanes appeared to be successful in making bicyclist/vehicle interactions safer,
when bicyclists actually used them.
o There appeared to be either a lack of education regarding the use of the bike
lanes (they were unmarked, unlike others in East Lansing), or a lack of comfort
about using them among riders.

Appendix B: page B-32
Overall Summary/Conclusions
Unsurprisingly, a lack of pedestrian and bicyclist infrastructure along a road diet site
resulted in a very low amount of non-motorized use of the corridor.
The two most notable characteristics of a well-functioning road diet with significant
non-motorized use (besides simply having infrastructure) were:
o Placement along corridors with commercial and pedestrian attractions:
The site in Lake City was located along a residential corridor of the road,
just south of the city’s commercial core. Despite having the
infrastructure, and observations being made during the busiest weekend
of the year, there was very little pedestrian activity along the site, as
there was no pedestrian oriented attraction at this site; instead, all of the
pedestrian activity took place north of the site, along the commercial
strip of town.
The road diet in Baldwin ended just before reaching the main commercial
district in town, therefore it had no impact on the majority of pedestrian
traffic in Baldwin.
While there was little activity observed during the visits to Mesick, it
could be inferred, based on the signage, crosswalk locations, and location
of the public school, that when school is in session, there is a reason for
pedestrians and bicyclists to use the infrastructure present along the
road diet.
The site in Ludington was located along the public beach, which acted as
a significant pedestrian generator for the corridor. The Burcham Rd. and
Abbot Rd. sites in East Lansing both attracted lots of pedestrian and
bicycle use from students from the nearby schools and Michigan State
University.
o Successful traffic calming:
Based on observations and conversations with local residents, the main
cause of the increase in pedestrian usage along the Ludington site,
appeared to be the calming of traffic. While the area is largely residential
in land use, the adjacent public beach had always acted as an attraction
for pedestrians and bicyclists, and now that traffic was slower, the road
was easier to cross and walk along, encouraging beachgoers to walk or
bike there, rather than drive and use the parking lot.
Although the site in Baldwin was in a relatively commercial area, with
pedestrian destinations, the road diet was designed such that traffic still
sped through the corridor, making it appear unsafe to cross or bike along.

Appendix B: page B-33
Along the Mesick site, even though the observed pedestrian traffic was
low, the road diet had successfully calmed traffic, and, simply by walking
up and down the corridor, you could feel that it was safe for pedestrian
and bicyclist activity.
In several conversations with residents and in observations of interactions between
motorized and non-motorized vehicles, it could be seen that, at some locations, there
was a lack of proper education regarding the use of different aspects of the road diet
projects.
o Bikers were often seen riding on sidewalks rather than using the bike lanes,
which were never designated as such. Pedestrians were also occasionally
observed using bike lanes, even when there was an adjacent sidewalk. There
appeared to be a better understanding of the purpose of bike lanes at the sites
in East Lansing, where there were bicycle markings on the pavement.
o There seemed to be a lack of clarity regarding right-of-way at crosswalks along
the road diet sites. Typically, vehicles correctly assumed it; residents
complained, however, that crossing was difficult when vehicles did not yield to
pedestrians – most notably in Ludington.
o Vehicles occasionally used the TWLTL as a waiting lane in making left turns onto
the road diet; others did not, although it was unclear whether that was because
they were aware that it was an illegal maneuver or because they just felt
uncomfortable doing so.
On those occasions that the TWLTL was used as a waiting lane to turn
into the far moving lane, drivers in the far lane were uneasy, and thought
that they were being cut off.

Appendix C: page C-1
APPENDIX C
OPERATIONAL ANALYSIS—ADDITIONAL RESULTS

Appendix C: page C-2
0
10
20
30
40
50
60
70
80
90
750 1000 1250 1500 1750 2000
Ap
pro
ach
De
lay
(sec
/veh
)
Mainline Volume (vph)
Site 1a: SB
4-lane
3-lane

Appendix C: page C-3
0
20
40
60
80
100
120
140
750 1000 1250 1500 1750 2000
Ap
pro
ach
De
lay
(sec
/veh
)
Mainline Volume (vph)
Site 8a: from NE
4-lane
3-lane
0
20
40
60
80
100
120
140
750 1000 1250 1500 1750 2000
Ap
pro
ach
De
lay
(se
c/ve
h)
Mainline Volume (vph)
Site 8a: from SW
4-lane
3-lane

Appendix C: page C-4
0
20
40
60
80
100
120
140
160
180
750 1000 1250 1500 1750 2000
Ap
pro
ach
De
lay
(sec
/veh
)
Mainline Volume (vph)
Site 9a: NB
4-lane
3-lane
0
20
40
60
80
100
120
140
160
750 1000 1250 1500 1750 2000
Ap
pro
ach
De
lay
(se
c/ve
h)
Mainline Volume (vph)
Site 9a: SB
4-lane
3-lane

Appendix C: page C-5
0
50
100
150
200
250
300
750 1000 1250 1500 1750 2000
Ap
pro
ach
De
lay
(sec
/veh
)
Mainline Volume (vph)
Site 9b: NB
4-lane
3-lane
0
50
100
150
200
250
300
750 1000 1250 1500 1750 2000
Ap
pro
ach
De
lay
(se
c/ve
h)
Mainline Volume (vph)
Site 9b: SB
4-lane
3-lane
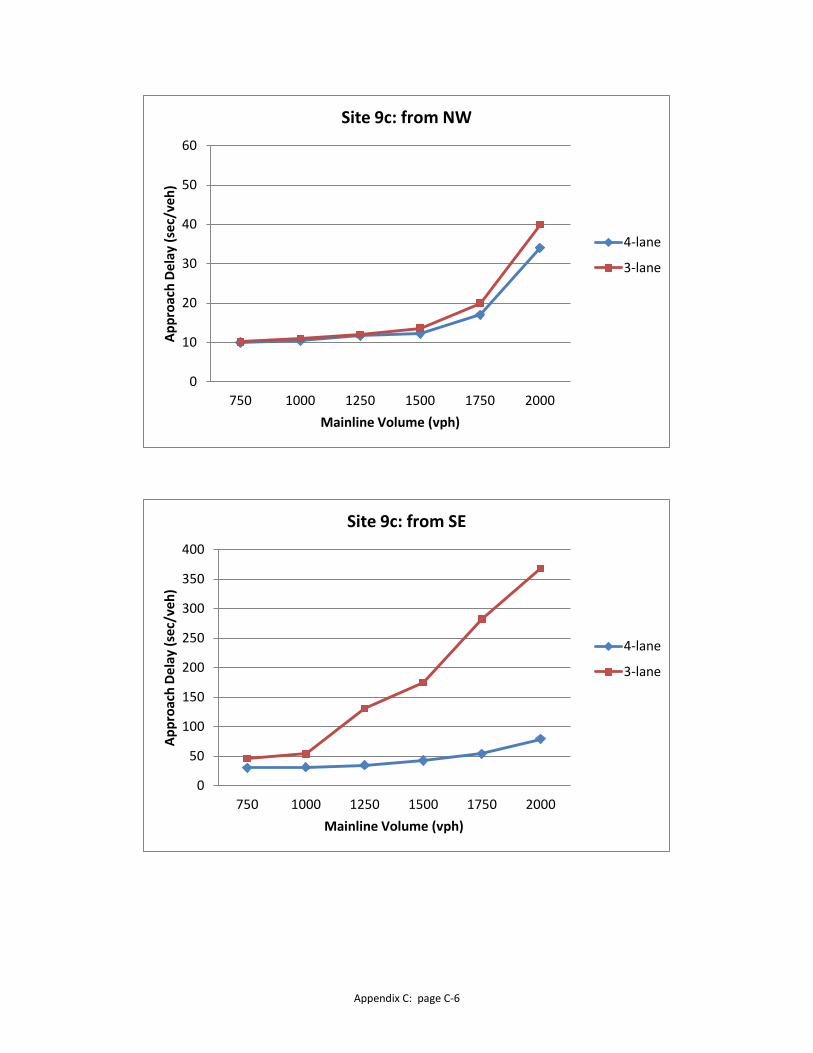
Appendix C: page C-6
0
10
20
30
40
50
60
750 1000 1250 1500 1750 2000
Ap
pro
ach
De
lay
(sec
/veh
)
Mainline Volume (vph)
Site 9c: from NW
4-lane
3-lane
0
50
100
150
200
250
300
350
400
750 1000 1250 1500 1750 2000
Ap
pro
ach
De
lay
(se
c/ve
h)
Mainline Volume (vph)
Site 9c: from SE
4-lane
3-lane

Appendix C: page C-7
0
50
100
150
200
250
300
350
750 1000 1250 1500 1750 2000
Ap
pro
ach
De
lay
(sec
/veh
)
Mainline Volume (vph)
Site 11a: EB
4-lane
3-lane
0
50
100
150
200
250
750 1000 1250 1500 1750 2000
Ap
pro
ach
De
lay
(se
c/ve
h)
Mainline Volume (vph)
Site 11a: EB
4-lane
3-lane

Appendix C: page C-8
0
50
100
150
200
250
300
750 1000 1250 1500 1750 2000
Ap
pro
ach
De
lay
(sec
/veh
)
Mainline Volume (vph)
Site 11b: WB
4-lane
3-lane
0
20
40
60
80
100
120
750 1000 1250 1500 1750 2000
Ap
pro
ach
De
lay
(se
c/ve
h)
Mainline Volume (vph)
Site 11b: WB
4-lane
3-lane

Appendix C: page C-9
0
50
100
150
200
250
750 1000 1250 1500 1750 2000
Ap
pro
ach
De
lay
(sec
/veh
)
Mainline Volume (vph)
Site 13a: EB
4-lane
3-lane
0
20
40
60
80
100
120
750 1000 1250 1500 1750 2000
Ap
pro
ach
De
lay
(se
c/ve
h)
Mainline Volume (vph)
Site 13a: WB
4-lane
3-lane
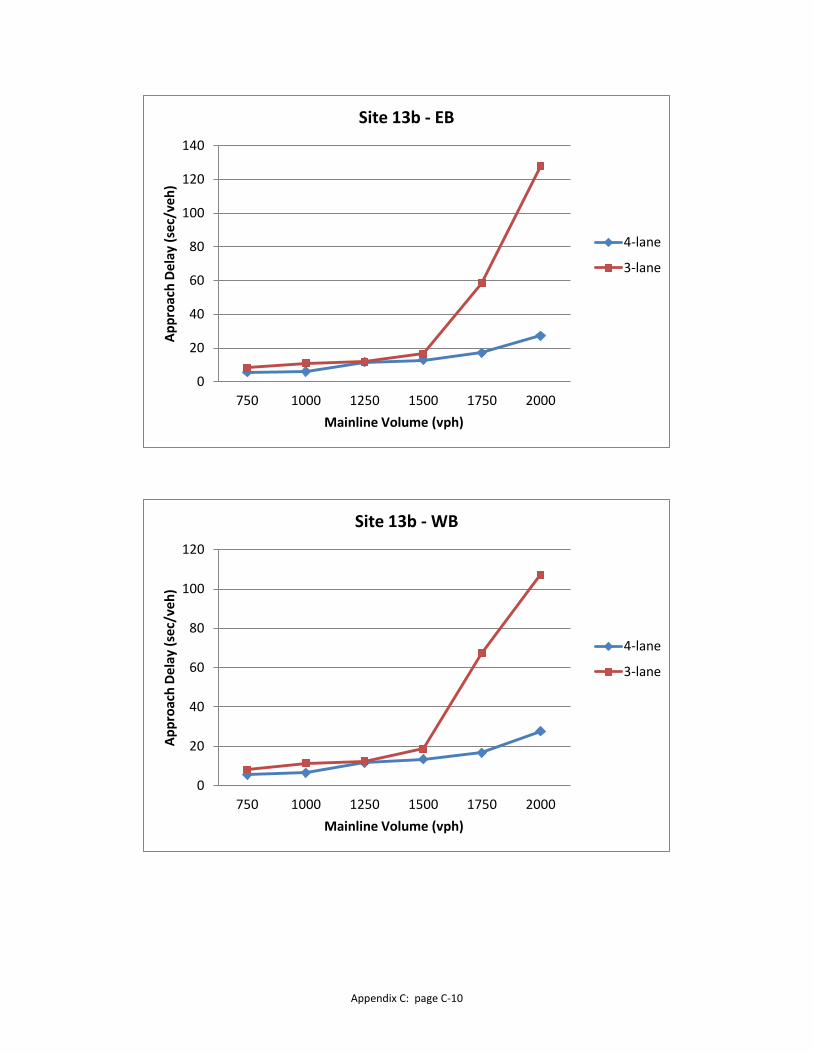
Appendix C: page C-10
0
20
40
60
80
100
120
140
750 1000 1250 1500 1750 2000
Ap
pro
ach
De
lay
(sec
/veh
)
Mainline Volume (vph)
Site 13b - EB
4-lane
3-lane
0
20
40
60
80
100
120
750 1000 1250 1500 1750 2000
Ap
pro
ach
De
lay
(se
c/ve
h)
Mainline Volume (vph)
Site 13b - WB
4-lane
3-lane

Appendix D: page D-1
APPENDIX D
SAFETY ANALYSIS—DETAILED SITE-BY-SITE INFORMATION

Appendix D: page D-2

Appendix D: page D-3
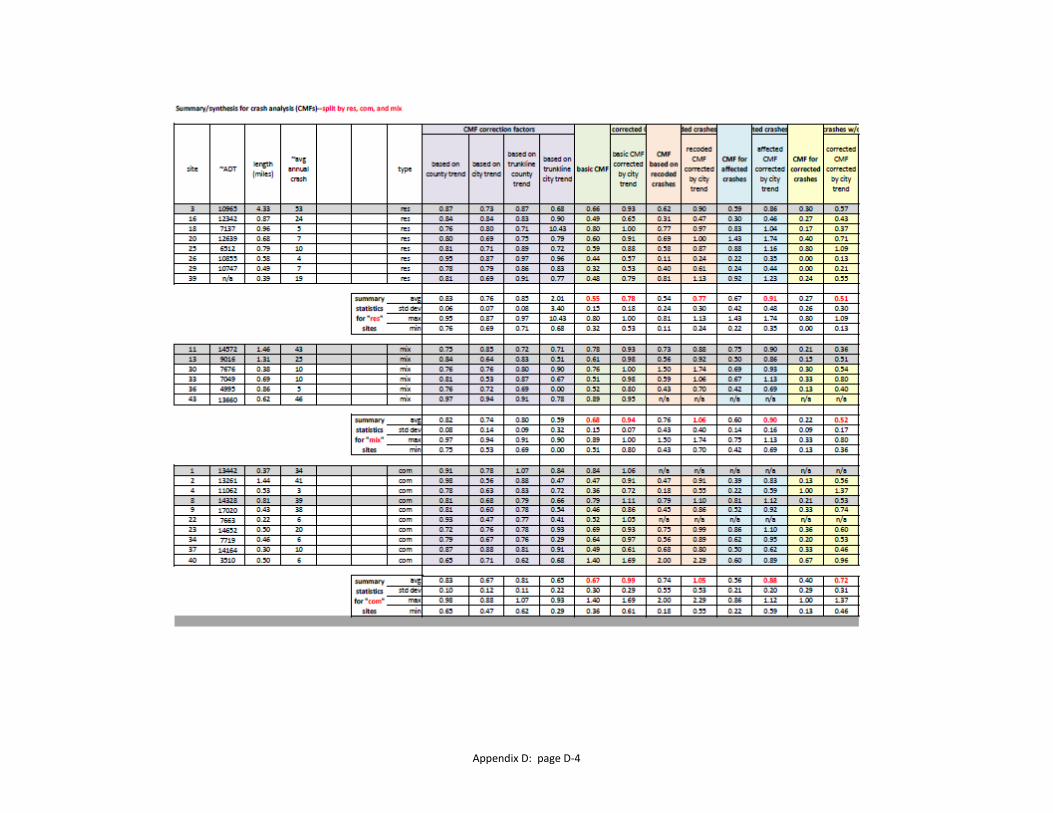
Appendix D: page D-4

Appendix D: page D-5

Appendix D: page D-6

Appendix D: page D-7

Appendix D: page D-8

Appendix D: page D-9

Appendix D: page D-10

Appendix D: page D-11

Appendix D: page D-12

Appendix D: page D-13

Appendix D: page D-14

Appendix D: page D-15

Appendix D: page D-16

Appendix D: page D-17
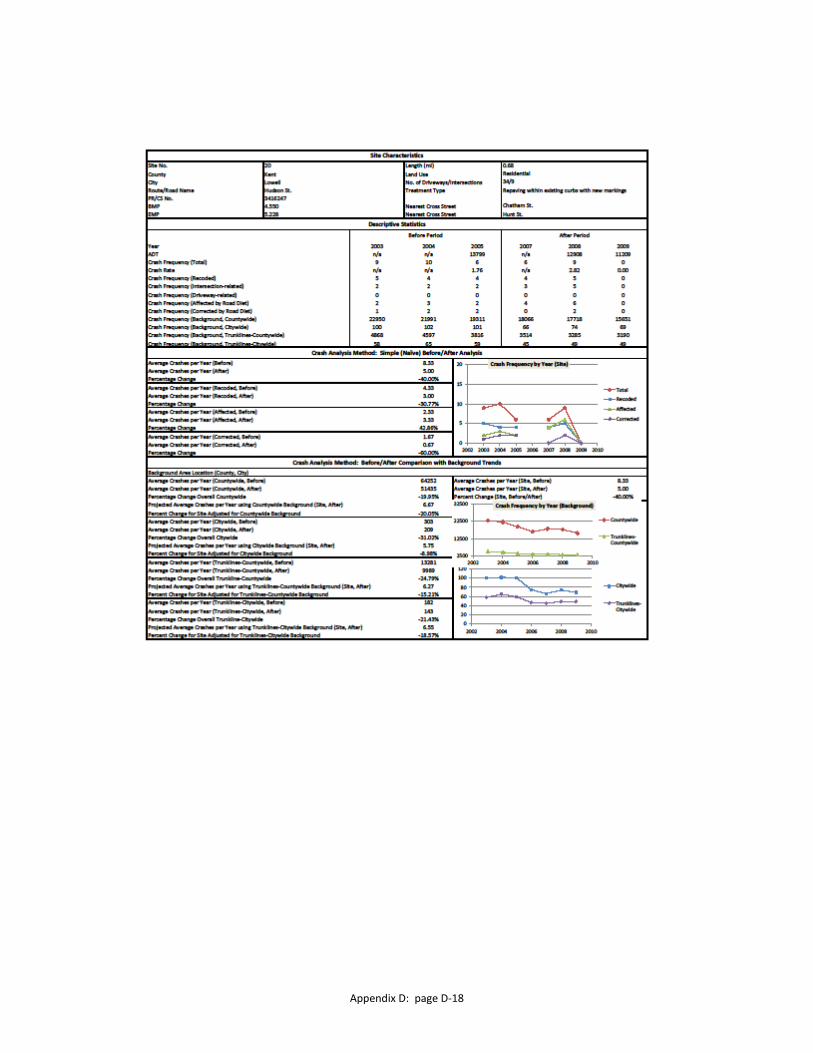
Appendix D: page D-18

Appendix D: page D-19

Appendix D: page D-20

Appendix D: page D-21

Appendix D: page D-22
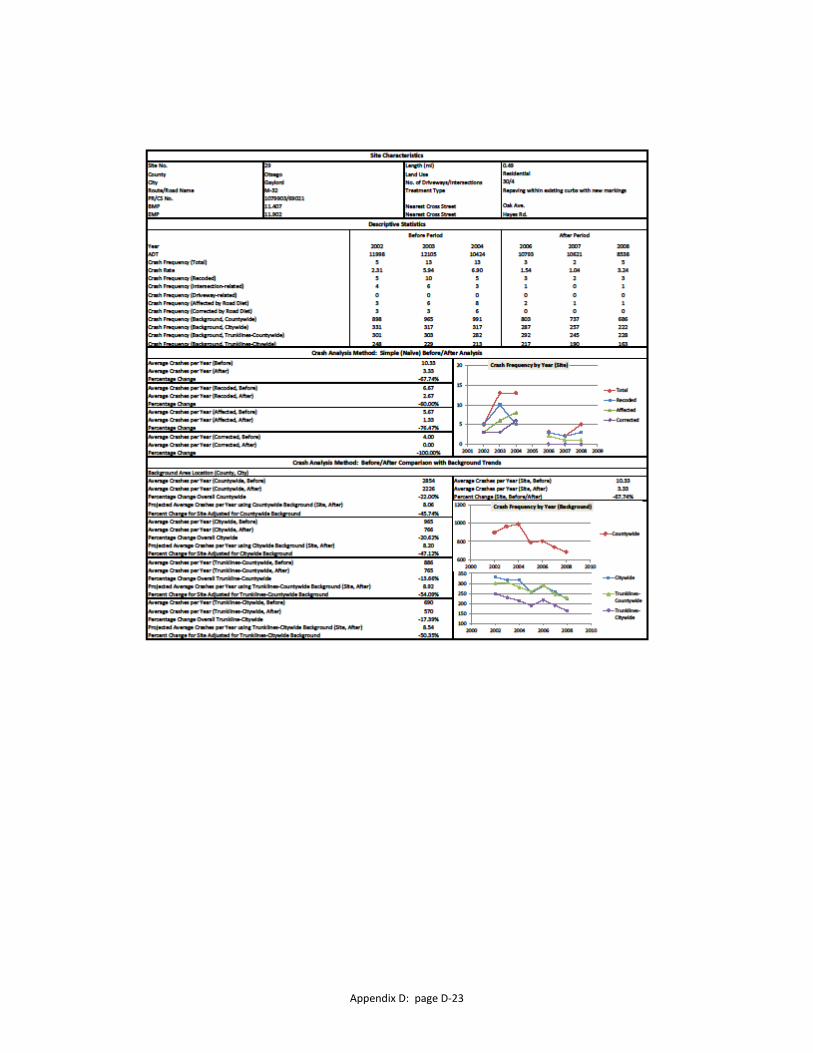
Appendix D: page D-23

Appendix D: page D-24

Appendix D: page D-25

Appendix D: page D-26

Appendix D: page D-27

Appendix D: page D-28

Appendix D: page D-29

Appendix D: page D-30

Appendix D: page D-31

Appendix E: page E-1
APPENDIX E
ADDITIONAL IMPLEMENTATION INFORMATION

Appendix E: page E-2
Road Diet Implementation – A community guide
Road diets have been gaining considerable attention as a relatively new roadway conversion
that promotes safety to all modes of transportation while maintaining the intended function of
the corridor. In many instances, conversion of a roadway by road diet has achieved positive
results. These results have been published and discussed by transportation officials and
researchers, however, the methods and techniques by which success has been achieved are
discussed only briefly. The intent of this section is to provide a complete guide to the
implementation of a road diet within a community.
Road diets have been implemented in several states including California, Washington, Iowa,
Minnesota, Michigan, Connecticut, and Florida. Many of these projects have extensively
evaluated the effects on crash reduction associated with road diets.1-8 However, for the
purpose of developing an implementation guide, studies that present information on the
process of implementing a road diet were further reviewed. These studies included advantages
and disadvantages of a road diet, motivating factors for conversion, and lessons learned
following the project.9-15
Although the implementation of road diets has generally had positive results, the new roadway
design can face many challenges which generally originate from resistance within a community.
Primarily, the dislike of road diets stems from the counter-intuitiveness of maintaining an
acceptable level of service while reducing the capacity of the roadway. To challenge the general
thinking, many agencies implementing road diets have experienced success by utilizing
techniques that both educate and involve the community.
A concise implementation guide, which organizes the project and gives community goals
primary importance, can assist in overcoming many of the challenges associated with road diet
implementation.
An implementation guide should encompass all aspects of the project in a beginning-to-end
fashion. Continuous community involvement should be maintained through each phase of the
road diet conversion. In general, the project can be divided into pre-construction (Phase I),
construction (Phase II), and post-construction (Phase III) with the following primary objectives
for each phase:
Phase I - Community education and acceptance for the road diet project.
Phase II - Mitigate any negative effects associated with construction and roadway
operations.
Phase III - Demonstrate how the road diet fulfilled community objectives while
highlighting the benefits of the new corridor.

Appendix E: page E-3
Success of a road diet project can be measured on several levels, however, when a road diet
fulfills the needs of a community while maintaining the necessary function of the corridor,
success is generally recognized.
Phase I – Community education and acceptance
Road diets can have lasting effects on a community, therefore it is essential to promote
community involvement from the beginning. In doing this, citizens gain a sense of ownership
for the road diet project and the decisions being made are felt as their own. Many agencies
implementing road diets have involved the public through town hall meetings, workshops, and
newspaper postings which detail the road diet project specifically.8,10 Others have found success
by implementing road diet projects through city master plans or other citywide initiatives such
as Complete Streets or a community bicycle plan. For example, the Michigan’s Genesee County
Metropolitan Alliance adopted a “Complete Streets” approach where “Transportation
improvements in Genesee County are planned, designed and constructed to encourage
walking, bicycling, and transit use while promoting safety for all users”.12 Another example
includes the pedscape plan adopted by the city of Charlotte, North Carolina.10 These techniques
provide an accepting atmosphere because residents are more receptive to change and look
forward to “reinventing” their community in a broader scope. Additionally, this groups a road
diet project with other beautification elements that aim to restore out-dated downtown
settings. The intent of public meetings should be as follows:
Gain an understanding of the needs of a community by generating a list of
transportation, economic, and safety objectives.
Develop a broad scope plan such as a master plan, which considers community
objectives and provides a list of projects which fulfill these objectives.
Consider supplemental redevelopment motifs such as complete streets, green streets,
or a community bicycle/walking plan.
Provide several alternatives to road diets and explain how elements of the alternatives
fail to meet the goals of corridor and the community.
Demonstrate how a road diet will affect all modes of transportation by providing equal
access to motorists, cyclists, and walkers while maintaining safety.
Provide both benefits and disadvantages of road diets – overstating the benefits of a
road diet sets the project up for failure in the public eye.
Public involvement could be in the form of focus sessions including emergency services, senior
citizens, transit personnel, merchants, and the disabled to identify areas of the community they
see as beneficial to improve.8 Once a list of clear objectives is established, several alternatives
which meet the objectives should be developed. Proposing several alternatives alongside a

Appendix E: page E-4
road diet provides the opportunity to make decisions about the project. A review of the
advantages and disadvantages of each alternative generally affirms that the road diet
alternative provides the most benefit to all users. Although a detailed preliminary analysis is not
always needed, demonstrating before and after level of service and similar corridor
characteristics can strengthen the argument.
Work with residents on the project and design details and reiterate that the roadway can be
restored to the original cross-section if the project is unsuccessful. Employing stamped
concrete, brick accents, planter boxes, curb out-crops, and other city beautification techniques
can also aid in gaining community approval. While there are a limited number of studies that
have focused on economic impacts of road diets, research has cited that economic activity has
increased along road diet sites accompanied by an increase in average residential housing
values.15
To maintain community involvement from beginning to end, many road diet projects have
utilized public forums such as blogs or social networking sites.16-19 A public forum allows citizens
to voice concerns, opinions, or praise concerning the process of the design and
implementation. In turn, this gives the implementing agency an opportunity to answer
questions which generally alleviate concerns voiced by community members. These sites also
provide a central hub for pertinent information regarding street closures, detours, and project
progress.
Phase II – Road diet construction
Public concern generally arises during the planning phase of the project however it can become
agitated when construction begins. The degree of discontent will largely be based on the extent
of the redesign. If a road diet is being converted simply by pavement remarking, negative
response will be minimal. If the project requires reconstruction, causing commuting to become
difficult, additional measures will be necessary to alleviate public concerns. Regardless of the
size of the project, any precautions that will lessen the stress associated with the road diet
should be taken. Based on past road diet experiences, the following techniques have been used
to maintain a positive attitude throughout the community during the construction phase:10
Reduce the impact of constructing the road diet on the community by shortening the
construction timeline.
Provide proper detours to maintain access and mobility through or around the project
site.
Consider public transportation options through the corridor.
Select a design which uses the existing curb width.

Appendix E: page E-5
Change signal timing before construction to allow motorists to become acquainted with
the new cycle lengths.
Implement a road diet when other projects are being considered such as installing new
utilities, repaving, new sidewalks, or new striping of the roadway.
Clearly, by reducing the construction timeline the negative effects of the new roadway design
will be reduced. Primary focus should be placed on restoring mobility to motorists as this is
generally where most discontent arises. In addition to motorist mobility, there is a need to
address access for motorists, cyclists, and walkers. This requires proper phasing of the project,
while roadway construction is the primary concern, sidewalks, cross-walks, planters, and
landscaping elements become secondary. Proper detours are necessary to redirect traffic
through or around the project. If possible, two-lanes should continuously remain available for
two-way through traffic. If this is not possible, one lane should remain open for through traffic
in one direction while a detour redirects the other direction of traffic around the site. Many
cases require signal timing to be changed due to the new traffic characteristics of the three-
lane roadway. It is important to change the signal timing prior to any construction taking place
to allow motorists to become acquainted with the new cycle lengths and intersection
operations.10 Additionally, this allows engineers to ensure proper cycle lengths have been
designed for the new three-lane TWTL and given level of traffic. Finally, just as a road diet
should be included in a community master plan, other updating elements should be included in
the construction phase to minimize any future reconstruction.
Again, the use of a blog or website can keep users up-to-date on the progress of the project
while relaying important detour and closure information.
Phase III – A follow-up demonstrating road diet success
A road diet is a substantial redesign of a roadway and therefore the resulting operational
characteristics should be studied to determine if the project was successful. This assessment
will be important to members of the community who will want to know if the project met the
intended objectives. Similarly, other agencies will be interested to know if this type of roadway
conversion would be successful in their own communities. Success of a road diet should not be
based solely on motorist delay and similar operational characteristics, but on the project in its
entirety including cyclists, walkers, and local businesses. The following aspects of the project
should be addressed as they relate to the road diet project:10,15
Level of service, intersection delay, and similar corridor characteristics including cross
street traffic.
Assessment of motorist speed characteristics.

Appendix E: page E-6
Overall safety of for walkers, cyclists, and motorists.
Operational difficulties such as improper use of the two-way left-turn lane.
Walker and cyclists volumes.
Resulting parking characteristics.
Economic activity for business and change in residential housing values.
It is important to demonstrate how the road diet maintains the function of the corridor even
though the capacity has been reduced. This can be accomplished by evaluating traffic
characteristics including level of service, delay, ADTs, and motorist’s speeds. In many cases,
level of service and ADTs have been reduced slightly while delay has slightly increased.
Similarly, it has been shown through several examples that conversion of a roadway by road
diet is successful in reducing the 85th percentile speed as well as the maximum speed.10
Although results may indicate that some of these characteristics have been negatively affected,
it is possible to provide the information in a positive light. Generally, a primary objective of a
road diet is to restore safety to all users. By reducing motorist’s speeds, fewer high-speed
accidents are expected to occur, and pedestrians and cyclists experience greater comfort in
cross-walks and bike lanes, respectively.10 At this point it is also necessary to remind community
members that the intent of a road diet is to provide benefits to all users of the corridor.
Another aspect of safety can be considered regarding the proper use of the updated roadway.
Following several site visits conducted in Michigan it was determined that problems exist with
the proper use of the two-way left-turn lane. Significant problems such as delay and accidents
can arise if the TWLTL is not being used by left-turning vehicles. For this reason, literature and
signage about the proper use of the TWLTL should be presented in various phases. Additionally,
a site visit of the updated roadway can determine if the message has been effectively
conveyed.
Another objective of a road diet may be to restore the city center of a community by providing
a safe and aesthetically pleasing atmosphere. Although this is somewhat subjective, by
evaluating the pedestrian/cyclists volumes, parking characteristics of the converted site, and
economic activity, one can gain some insight. If the corridor experiences higher walker/cyclist
volumes it can be presumed that a sense of safety has been restored to these modes of
transportation. If on-street parking is provided by the updated roadway, it should be
determined if parking is being utilized by employees or consumers of local businesses. In
general, on-street parking should provide access to consumers of local businesses. Additionally,
economic data from local businesses can be acquired to assess whether the road diet has
promoted business. Finally, a survey can be distributed to community members to assess
whether the road diet has had a positive influence on the city center. The survey should

Appendix E: page E-7
address whether motorist’s/walker’s/cyclist’s comfort levels have changed and how community
members have changed their use of the city center.
A follow-up evaluation of a road diet plays an important role in the success of the project. By
assessing many of the characteristics of the updated roadway and presenting findings to
community members, a sense of satisfaction and accomplishment can be instilled in the
community. Finally, information collected from a converted site can be of use to other agencies
considering a similar roadway conversion.
Additional comments
Several presentations, developed by transportation engineers around the country, have made it
evident that starting at the community level has many advantages when implementing a road
diet. The following list, presented by Joshua E. Saak in a presentation about the East Boulevard,
Charlotte, North Carolina road diet, suggests common questions that can be expected from
community members:
Where does the additional traffic go when the capacity is reduced by half?
When most communities are widening roadways, why are we narrowing ours?
How will bus stops be accommodated with a road diet?
How will emergency response units be affected?
What if it doesn’t work?
Responses for these questions should be developed to provide inquirers with the proper
information.
A list of objectives, or measures of effectiveness, should be developed in Phase I of the project.
The following list of possible MOEs was presented by the City of Orlando – Transportation
Planning Bureau for the Edgewater Drive road diet restriping plan:
Avoid increased traffic on neighboring streets
Reduce speeding
Increase bicyclist volumes
Increase pedestrian volumes
Reduce crashes
Increase on-street parking use rates
Increase resident and merchant pedestrian travel satisfaction
Increase parking satisfaction

Appendix E: page E-8
Although a list of MOEs will be specific to a community it is important that it represents the
ideals of the community. Further, the final road diet plan should aim to fulfill many of the MOEs
if success is to be expected.
The following list presents additional ways to be successful and gain community acceptance for
road diet projects. It also provides things the implementing agency should avoid when
proposing a road diet.
Conduct a thorough analysis of the corridor and make certain a road diet is a suitable
alternative for the roadway.
Avoid implementing a road diet without community involvement.
Develop a plan that not only encompasses the road diet project but the community as a
whole such as complete streets, a new bicycle/pedestrian initiative, or economic plan.
Avoid overstating the benefits of a road diet as this sets the project up for failure in the
public eye.
Publish other road diet success stories in local newspapers or blogs.
Use blogs or social networking sites to provide as much information as possible to
community members while providing a forum to express any concerns.
Provide an opportunity for additional beautification elements such as stamped
concrete, brick accents, planter boxes, curb out-crops, and added landscaping.
Although these techniques have been successful, they are not overarching. Road diet success
has been achieved by many implementing agencies following different approaches. Again,
success of a road diet project can be measured on several levels, however, when a road diet
fulfills the needs of a community while maintaining the necessary function of the corridor,
success is generally recognized.
References for road diet implementation (this appendix)
1. NCHRP Report 617 Accident Modification Factors for Traffic Engineering and Its
Improvements. National Cooperative Highway Research Program, 2008.
2. Summary Report: Evaluation of Lane Reduction "Road Diet" Measures on Crashes. McLean:
U.S. Department of Transportation Federal Highway Administration, 2010.
3. Huang, Herman F., J. Richard Stewart, and Charles V. Zegeer. "Evaluation of Lane Reduction
"Road Diet" Measures on Crashes and Injuries." Transportation Research Record 1784
(2002): 80-90.
4. Li, Wen, and Alicia Carriquiry. "The Effect of Four-Lane to Three-Lane Conversion on the
Number of Crashes and Crash Rates in Iowa Roads." (2005): 55.

Appendix E: page E-9
5. Pawlovich, Michael D., et al. "Iowa's Experience with Road Diet Measures: Use of Bayesian
Approach to Assess Impacts on Crash Frequencies and Crash Rates." Transportation
Research Record: Journal of the Transportation Research Board 1953.2006 (2006): 163-71.
6. Persaud, Bhagwant, et al. "Comparison of Empirical Bayes and Full Bayes Approaches for
before-after Road Safety Evaluations." Accident Analysis and Prevention 42.1 (2009): 38-43.
7. Stout, Thomas B., et al. Safety Impacts of "Road Diets" in Iowa, 2005.
8. Fang, F. Clara, et al. “Safer Streets: The Measure Effectiveness of Hartford’s Citywide Traffic
Calming Program.” Hartford CT.
9. Kueper, Daniel A., “Road Diet Treatment Ocean City, NJ, USA.” ITE Journal. (2008).
10. Saak, Joshua E., “Using Roadway Conversion to Integrate Land Use and Transportation – The
East Boulevard Experience.” SDITE Annual Meeting, Knoxville, TN. (2007).
11. City of University Place Traffic Safety, University Place, Washington.
12. Genesee County Metropolitan Planning Commission. “Complete Streets Technical Report.”
13. City of Orlando – Transportation Planning Bureau. “Edgewater Driver Before & After Re-
Striping Results.” (2002).
14. City of Seattle Department of Transportation. “Stone Way N Rechannelization – Before and
After Study.” (2010).
15. Rosales, Jennifer A. Road Diet Handbook - Overview. Portland, 2007.
16. Kazis, Noah. “Road Diet for Macombs Road Wins Unanimous Bronx Community Board
Vote.” (2011). http://www.streetsblog.org/2011/03/23/road-diet-for-macombs-road-wins-
unanimous-bronx-community-board-vote/
17. Klayko, Branden. “Brownsboro Road Diet Plans Detailed.” (2011).
http://brokensidewalk.com/2011/04/19/brownsboro-road-diet-plans-detailed/.
18. Support the Nickerson St. Road Diet. Facebook. http://www.facebook.com/pages/Support-
the-Nickerson-St-Road-Diet/123250077706499
19. Carlisle Road Diet. Facebook. http://www.facebook.com/pages/Carlisle-Road-
Diet/168422699878065.