appendix 4d ye 31 december 2017 …€¦ · ramsay health care limited abn 57 001 288 768 appendix...
TRANSCRIPT

RAMSAY HEALTH CARE LIMITED ABN 57 001 288 768
APPENDIX 4D
FOR THE HALF YEAR ENDED 31 DECEMBER 2017

1
RAMSAY HEALTH CARE LIMITED
INDEX
1 Results for Announcement to the Market
1.1 Highlights of Results
1.2 Earnings per Share
1.3 Dividend Information
1.4 Net Tangible Assets
1.5 Details of Joint Venture Entity
1.6 Commentary on Results
2 Financial Information for the Half Year ended 31 December 2017

2
SECTION 1
RESULTS FOR ANNOUNCEMENT
TO THE MARKET

3
RAMSAY HEALTH CARE LIMITED
RESULTS FOR ANNOUNCEMENT TO THE MARKET
1.1 HIGHLIGHTS OF RESULTS
6 months ended
31/12/2017 $000
6 months ended
31/12/2016 $000
% increase/ (decrease)
Revenue and other income (Core) (1) 4,447,950 4,318,064 3.0%
Revenue from services 4,445,795 4,317,566 3.0%
Profit before disposal of assets, finance costs, tax, depreciation, amortisation and non-core items (Core EBITDA)
663,806 648,879 2.3%
Profit before finance costs, tax and non-core items (Core EBIT) 470,422 463,526 1.5%
Core net profit after tax attributable to owners of the parent (1),(2) 287,974 267,824
7.5%
Non-core items after tax attributable to owners of the parent (1) (41,438) (11,879)
Net profit after tax for the period attributable to owners of the parent *
246,536
255,945
(3.7)%
Earnings per share (cents per share)
Diluted Core EPS (1),(2),(3) 139.0
128.9
7.8%
Diluted Statutory EPS 118.6 123.0
(3.6)%
* Inclusive of the dividends payable to holders of Convertible Adjustable Rate Equity Securities (CARES) 1. Refer to the Overview section of the Consolidated Half Year Financial Statements for further information. 2. Core net profit after tax and diluted core earnings per share are before non-core items. 3. Diluted core earnings per share (Diluted Core EPS) calculation is based upon Core net profit after tax adjusted for Preference
Dividends, using the weighted average number of ordinary shares adjusted for the effect of dilution.
1.2 EARNINGS PER SHARE 6 months
ended 31/12/2017
$000
6 months ended
31/12/2016 $000
Net profit after tax for the period attributable to the owners of the parent 246,536 255,945 Less: dividend paid on Convertible Adjustable Rate Equity Securities (CARES) (6,210) (6,670) Profit used in calculating basic and diluted earnings per share (after CARES dividend) 240,326 249,275
Number of Shares
Weighted average number of ordinary shares used in calculating basic earnings per share 201,623,455 201,380,948 Weighted average number of ordinary shares used in calculating diluted earnings per share 202,655,730 202,585,184
Earnings per share
6 months ended
31/12/2017 Cents per share
6 months ended
31/12/2016 Cents per share
% increase/ (decrease)
- basic (after CARES dividend) 119.2 123.8 (3.7)% - diluted (after CARES dividend) 118.6 123.0 (3.6)%

4
RAMSAY HEALTH CARE LIMITED
RESULTS FOR ANNOUNCEMENT TO THE MARKET
1.3 DIVIDEND INFORMATION Dividends – Ordinary Shares Amount per
security Franked amount per security
Current year - Interim dividend 57.5c 57.5c
Previous corresponding period - Interim dividend 53.0c 53.0c
Record date for determining entitlements to the interim dividend 7 March 2018
Date the current year interim dividend is payable 29 March 2018
Convertible Adjustable Rate Equity Securities (‘CARES’) Dividends
Record date for determining entitlements to the CARES interim dividend 5 April 2018
Date the interim CARES dividend is payable 20 April 2018
The proposed interim ordinary and CARES dividends will be franked at the rate of 30% (2016: 30%). 1.4 NET TANGIBLE ASSETS Net tangible assets (NTA) per share at 31 December 2017 is $1.13 (June 2017: $1.89). 1.5 DETAILS OF JOINT VENTURE ENTITY The detail of the joint venture entity which contributes to Ramsay Health Care Limited’s net profit is detailed below: Name of entity
Contribution to net profit Percentage of ownership interest
6 months ended
31/12/2017 $000
6 months ended
31/12/2016 $000
As at 31/12/2017
As at 31/12/2016
Equity accounted joint venture entity Ramsay Sime Darby Health Care Sdn Bhd
8,517
6,865
50%
50%
Total share of after tax profits of equity accounted investments
8,517
6,865
1.6 COMMENTARY ON RESULTS Commentary on results follows
5
ASX ANNOUNCEMENT
28 February 2018
RAMSAY HEALTH CARE REPORTS A 7.8% RISE IN FIRST HALF YEAR CORE EPS AND A 7.5% RISE
IN CORE NET PROFIT AFTER TAX
Financial Highlights
• Core net profit after tax1 (Core NPAT) up 7.5% to $288.0 million
• Core earnings per share2 (Core EPS) up 7.8% to 139.0 cents
• Group: o Revenue up 3.0% to $4.4 billion o EBIT up 1.5% to $470.4 million
• Australia/Asia: o Australia Revenue up 4.3% to $2.5 billion o Australia EBIT up 9.1% to $379.7 million o Equity accounted share of Asia joint venture net profits up 24.1% to $8.5 million
• United Kingdom: o Revenue down 4.8% to £206.2 million o EBITDAR down 4.6% to £49.4 million
• France: o Revenue down 1.1% to €1.1 billion o EBITDAR down 5.8% to €194.1 million
• Interim dividend 57.5 cents fully franked, up 8.5% on the previous corresponding period Overview
Australia’s largest private hospital operator, Ramsay Health Care, today announced a Group Core Net Profit After Tax (Core NPAT) of $288.0 million for the six months to 31 December 2017, a 7.5% increase on the previous corresponding period. Core NPAT delivered Core EPS of 139.0 cents for the half year, an increase of 7.8% on the 128.9 cents recorded in the previous corresponding period. The Company’s statutory net profit after tax, attributable to members of the parent (after adjusting for net non-core items after tax) of $246.5 million, was down 3.7% on the prior half, principally due to RGdS provisioning for a significant centralisation programme to be implemented over the next three years. Directors are pleased to announce a fully-franked interim dividend of 57.5 cents, up 8.5% on the previous corresponding period. The dividend Record Date is 7 March 2018 with payment on 29 March 2018.
1 Before net non-core items 2 Core net profit after CARES dividends
6
Commentary on Results Ramsay Health Care Managing Director Craig McNally said despite ongoing challenges in the operating environment in Europe, the Company achieved a solid first half result driven by a strong performance in its Australian business. “Our Australian operations delivered 9.1% EBIT growth on the previous corresponding period due to above market volume growth and the benefits of recent cost efficiency programmes. “We experienced solid growth in admissions and procedural volumes in Ramsay’s Australian business, which is underpinned by a rapidly ageing and growing population. “In addition, the increasing proportion of people with chronic disease and mental illness is also escalating and driving up treatment volumes.” He welcomed recent government reforms which aimed to improve affordability of private health insurance in Australia, and also demonstrated the government’s strong commitment to the country’s balanced public/private system. “In Europe, our operations held up well in an environment that is currently experiencing pricing constraints and volume pressures. “We are focused on achieving efficiencies in these businesses and, to this end, we are investing in a major transformation project in our French operations that will centralise non-core hospital resources and distinguish this business for the long term. He said the significant centralisation programme being undertaken by Ramsay Générale de Santé (RGdS) would see non-core hospital functions such as finance, administration and HR, located in a separate shared service centre in the outer suburbs of Paris. Once fully implemented, it will result in annual recurring gains to RGdS of €5M. This programme will commence in the second half and will take almost three years. RGdS has provided for a restructuring charge of €43.7M (net impact to Ramsay Group Statutory NPAT of $23.9M) which is mainly for future redundancies and has been expensed as a non-core item in the half year. “Despite the difficult tariff environment we were pleased with the above market volume growth that RGdS achieved during the period, thanks to the strength of our portfolio and the diversity and geographic spread of our business in France.” In the UK, he said while a positive tariff adjustment would take affect from 1 April 2018, NHS demand management strategies were currently impacting volumes significantly. “However, there are a burgeoning number of people waiting for treatment in the UK and we expect normal volume growth will return in the short to medium term.” Growth Strategy The Company’s brownfield development programme continues strongly reflecting the increasing demand for healthcare services. A further $146M in capacity expansions were approved by the Board during the six months to 31 December 2017. He said $57M worth of brownfields were completed late in the first half. “We are set to open $147M worth of developments in the second half FY18 and $156M in the first half FY19.
7
“Importantly, the pipeline for capacity expansions remains strong with over $500M in business cases currently under consideration including a major expansion of Joondalup Health Campus in Perth. Twenty-three retail pharmacies were added to the Ramsay Pharmacy franchise network in Australia during the first half FY18 bringing the total number in the network to 54. While the development of this network was slower than anticipated in the first half due to regulatory delays, it has gathered momentum recently following the finalisation of the Malouf transaction in Queensland in December 2017. “We are very pleased with the addition of the Malouf Pharmacy business to our pharmacy network. Before joining the Ramsay franchise network, Malouf was the largest privately owned pharmacy group in Queensland and one of Australia’s leading pharmacy brands with 18 stores and employing 450 staff.” Balance Sheet & Cash Flow
Ramsay’s robust balance sheet and strong cash flow generation continues to provide us with the flexibility to fund the
continuing demand for brownfield capacity expansion, future acquisitions and ongoing working capital needs. As at
31 December 2017, the Group Consolidated Leverage Ratio was 2.4 times, well within our internal parameters.
Outlook
Mr McNally said attractive demographic sector fundamentals combined with Ramsay’s geographic, casemix and
reimbursement diversification as well as a consistent execution of Company strategy, would underpin future growth
for the organisation.
“In addition to our brownfield development pipeline, we remain acquisitive and are actively investigating opportunities across all markets. “We operate in a sector that will continue to have enormous upside for many years to come. In all regions, health spending is rising as populations grow and age, technologies improve and patients become better informed. Demand for health care is rising in both traditional and non-traditional care settings. We are therefore looking at further out-of-hospital opportunities, including our pharmacy strategy, to deliver innovative, cost-effective and patient-centred care to the community.” He said Ramsay’s scale and diversity would ensure it continued to deliver earnings growth in a changing health economy. “The Company is also investing strategically in research and technology as well as shaping its workforce, to ensure it remains at the forefront of healthcare delivery in the future. “In summary, we expect the operating environment in Australia to remain positive and the environment in Europe to remain challenging. Barring unforeseen circumstances, we reaffirm our FY18 Core EPS growth of 8% to 10%.”
Contacts:
Craig McNally Carmel Monaghan Managing Director Chief of Staff Ramsay Health Care Ramsay Health Care + 61 2 9220 1000 + 61 438 646 273 Attachment: Summary of Financial Performance.

8
Attachment:
Summary of Financial Performance
Half Year Ended 31 December
$ millions
1st Half
FY2018
1st Half
FY2017
Group Group
%
Increase
Net Profit After Tax (NPAT)
Operating revenue
4,445.8 4,317.6 3.0%
EBITDAR
872.5 841.1 3.7%
EBITDA
663.8 648.9 2.3%
EBIT
470.4 463.5 1.5%
Profit attributable to members of the
parent
Core NPAT (1)
288.0 267.8 7.5%
Net non-core items, net of tax (2)
- Restructuring charge (RGdS) - Other
(23.9)
(17.6)
-
(11.9)
(41.5) (11.9)
Statutory NPAT
246.5 255.9 (3.7%)
Earnings Per Share, (EPS) cents
Core EPS (3)
139.0 128.9 7.8%
Statutory EPS
118.6 123.0 (3.6%)
Dividends Per Share, cents
Interim dividend, fully franked 57.5 53.0 8.5%
Notes
(1) ‘Core NPAT’ attributable to members of the parent is before net non-core items and from continuing operations. In accordance with the
accounting standards Ramsay Générale de Santé (RGdS) is consolidated. The non-controlling interest’s share of RGdS NPAT has been removed
in arriving at the Core NPAT attributable to members of the parent.
(2) Refer to Appendix 4D Note (a) (i) Reconciliation of net profit attributable to owners of the parent to core profit (segment result).
(3) ‘Core EPS‘is derived from core net profit after CARES Dividends.

9
SECTION 2
FINANCIAL INFORMATION
FOR THE HALF YEAR ENDED
31 DECEMBER 2017
10
RAMSAY HEALTH CARE LIMITED
AND CONTROLLED ENTITIES
A.B.N. 57 001 288 768
FINANCIAL INFORMATION
FOR THE HALF YEAR ENDED 31 DECEMBER 2017

11
RAMSAY HEALTH CARE LIMITED
AND CONTROLLED ENTITIES
A.B.N. 57 001 288 768
FINANCIAL REPORT
FOR THE HALF YEAR ENDED 31 DECEMBER 2017
CONTENTS PAGE
DIRECTORS’ REPORTEEEEEEEEEEEEEEEEEEEEEEEEEEEEE. 12
AUDITOR’S INDEPENDENCE DECLARATION TO THE DIRECTORS OF
RAMSAY HEALTH CARE LIMITEDEEEEEEEEEEEEEEEEEEEEEEEE 14
CONSOLIDATED INCOME STATEMENTEEEEEEEEEEEEEEEEEEEEE. 15
CONSOLIDATED STATEMENT OF COMPREHENSIVE INCOMEEEEEEEEEEE.. 16
CONSOLIDATED STATEMENT OF FINANCIAL POSITIONEEEEEEEEEEEEE. 17
CONSOLIDATED STATEMENT OF CHANGES IN EQUITYEEEEEEEEEEEEE. 18
CONSOLIDATED STATEMENT OF CASH FLOWS.EEEEEEEEEEEEEEEE.. 19
NOTES TO THE CONSOLIDATED HALF YEAR FINANCIAL STATEMENTSEEEEEE 20
DIRECTORS’ DECLARATIONEEEEEEEEEEEEEEEEEEEEEEEEEE. 30
INDEPENDENT AUDITORS’ REVIEW REPORTEEEEEEEEEEEEEEEEEE. 31
12
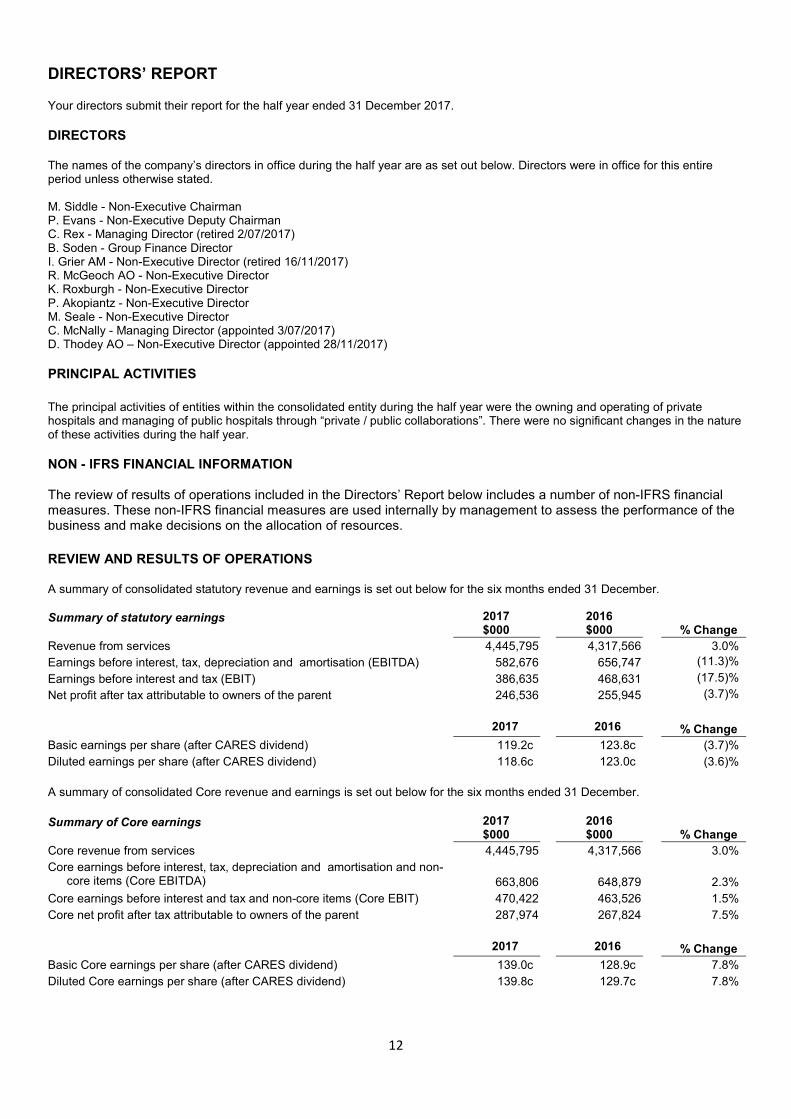
DIRECTORS’ REPORT
Your directors submit their report for the half year ended 31 December 2017.
DIRECTORS The names of the company’s directors in office during the half year are as set out below. Directors were in office for this entire period unless otherwise stated. M. Siddle - Non-Executive Chairman P. Evans - Non-Executive Deputy Chairman C. Rex - Managing Director (retired 2/07/2017) B. Soden - Group Finance Director I. Grier AM - Non-Executive Director (retired 16/11/2017) R. McGeoch AO - Non-Executive Director K. Roxburgh - Non-Executive Director P. Akopiantz - Non-Executive Director M. Seale - Non-Executive Director C. McNally - Managing Director (appointed 3/07/2017) D. Thodey AO – Non-Executive Director (appointed 28/11/2017)
PRINCIPAL ACTIVITIES
The principal activities of entities within the consolidated entity during the half year were the owning and operating of private hospitals and managing of public hospitals through “private / public collaborations”. There were no significant changes in the nature of these activities during the half year. NON - IFRS FINANCIAL INFORMATION The review of results of operations included in the Directors’ Report below includes a number of non-IFRS financial measures. These non-IFRS financial measures are used internally by management to assess the performance of the business and make decisions on the allocation of resources.
REVIEW AND RESULTS OF OPERATIONS A summary of consolidated statutory revenue and earnings is set out below for the six months ended 31 December.
Summary of statutory earnings 2017 $000
2016 $000
% Change
Revenue from services 4,445,795 4,317,566 3.0%
Earnings before interest, tax, depreciation and amortisation (EBITDA) 582,676 656,747 (11.3)% Earnings before interest and tax (EBIT) 386,635 468,631 (17.5)% Net profit after tax attributable to owners of the parent 246,536 255,945 (3.7)%
2017 2016 % Change
Basic earnings per share (after CARES dividend) 119.2c 123.8c (3.7)%
Diluted earnings per share (after CARES dividend) 118.6c 123.0c (3.6)%
A summary of consolidated Core revenue and earnings is set out below for the six months ended 31 December.
Summary of Core earnings 2017
$000 2016
$000
% Change
Core revenue from services 4,445,795 4,317,566 3.0%
Core earnings before interest, tax, depreciation and amortisation and non-core items (Core EBITDA) 663,806
648,879
2.3%
Core earnings before interest and tax and non-core items (Core EBIT) 470,422 463,526 1.5%
Core net profit after tax attributable to owners of the parent 287,974 267,824 7.5%
2017 2016 % Change
Basic Core earnings per share (after CARES dividend) 139.0c 128.9c 7.8%
Diluted Core earnings per share (after CARES dividend) 139.8c 129.7c 7.8%
13
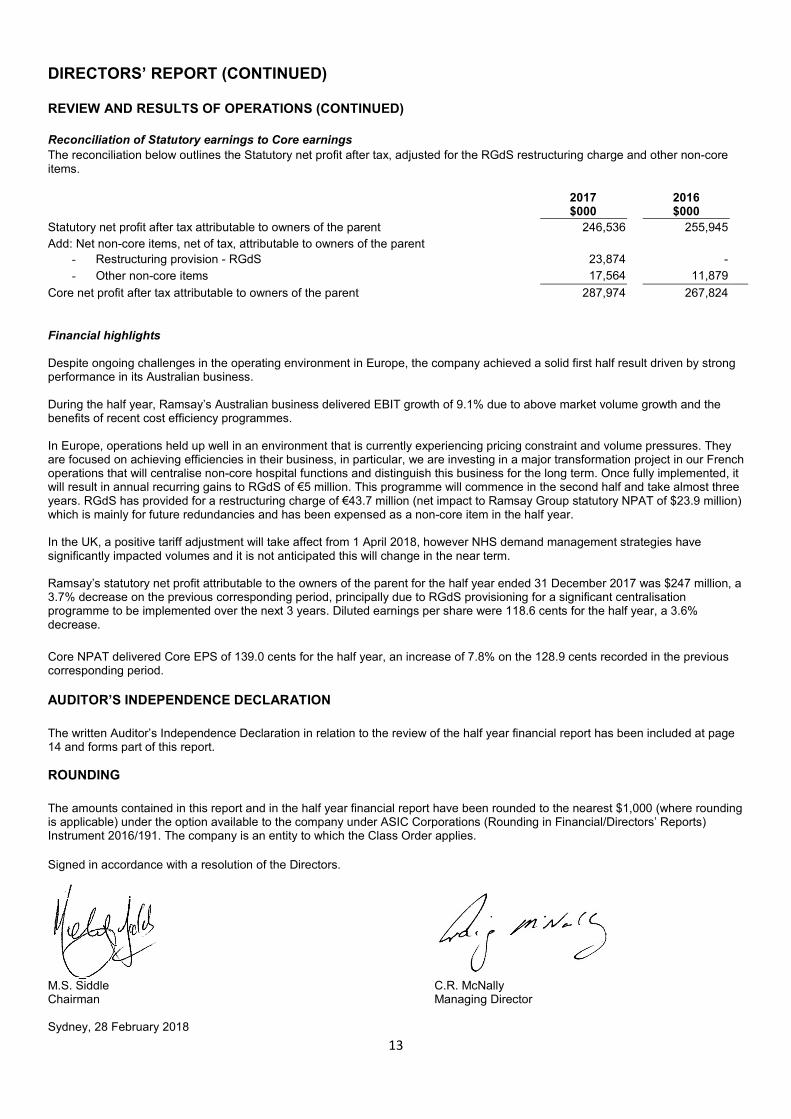
DIRECTORS’ REPORT (CONTINUED) REVIEW AND RESULTS OF OPERATIONS (CONTINUED) Reconciliation of Statutory earnings to Core earnings
The reconciliation below outlines the Statutory net profit after tax, adjusted for the RGdS restructuring charge and other non-core items. 2017
$000 2016
$000
Statutory net profit after tax attributable to owners of the parent 246,536 255,945
Add: Net non-core items, net of tax, attributable to owners of the parent
- Restructuring provision - RGdS 23,874
-
- Other non-core items 17,564 11,879
Core net profit after tax attributable to owners of the parent 287,974 267,824
Financial highlights Despite ongoing challenges in the operating environment in Europe, the company achieved a solid first half result driven by strong performance in its Australian business. During the half year, Ramsay’s Australian business delivered EBIT growth of 9.1% due to above market volume growth and the benefits of recent cost efficiency programmes. In Europe, operations held up well in an environment that is currently experiencing pricing constraint and volume pressures. They are focused on achieving efficiencies in their business, in particular, we are investing in a major transformation project in our French operations that will centralise non-core hospital functions and distinguish this business for the long term. Once fully implemented, it will result in annual recurring gains to RGdS of €5 million. This programme will commence in the second half and take almost three years. RGdS has provided for a restructuring charge of €43.7 million (net impact to Ramsay Group statutory NPAT of $23.9 million) which is mainly for future redundancies and has been expensed as a non-core item in the half year. In the UK, a positive tariff adjustment will take affect from 1 April 2018, however NHS demand management strategies have significantly impacted volumes and it is not anticipated this will change in the near term. Ramsay’s statutory net profit attributable to the owners of the parent for the half year ended 31 December 2017 was $247 million, a 3.7% decrease on the previous corresponding period, principally due to RGdS provisioning for a significant centralisation programme to be implemented over the next 3 years. Diluted earnings per share were 118.6 cents for the half year, a 3.6% decrease. Core NPAT delivered Core EPS of 139.0 cents for the half year, an increase of 7.8% on the 128.9 cents recorded in the previous corresponding period.
AUDITOR’S INDEPENDENCE DECLARATION
The written Auditor’s Independence Declaration in relation to the review of the half year financial report has been included at page 14 and forms part of this report.
ROUNDING
The amounts contained in this report and in the half year financial report have been rounded to the nearest $1,000 (where rounding is applicable) under the option available to the company under ASIC Corporations (Rounding in Financial/Directors’ Reports) Instrument 2016/191. The company is an entity to which the Class Order applies.
Signed in accordance with a resolution of the Directors.
M.S. Siddle C.R. McNally Chairman Managing Director Sydney, 28 February 2018

A member firm of Ernst & Young Global Limited Liability limited by a scheme approved under Professional Standards Legislation
14
Ernst & Young 200 George Street Sydney NSW 2000 Australia GPO Box 2646 Sydney NSW 2001
Tel: +61 2 9248 5555 Fax: +61 2 9248 5959 ey.com/au
Auditor’s Independence Declaration to the Directors of Auditor’s Independence Declaration to the Directors of Auditor’s Independence Declaration to the Directors of Auditor’s Independence Declaration to the Directors of Ramsay Health Care LimitedRamsay Health Care LimitedRamsay Health Care LimitedRamsay Health Care Limited
As lead auditor for the review of Ramsay Health Care Limited for the half-year ended 31 December 2017, I declare to the best of my
knowledge and belief, there have been:
a) no contraventions of the auditor independence requirements of the Corporations Act 2001 in relation to the review; and
b) no contraventions of any applicable code of professional conduct in relation to the review.
This declaration is in respect of Ramsay Health Care Limited and the entities it controlled during the financial period.
Ernst & Young
Douglas Bain
Partner
28 February 2018
15
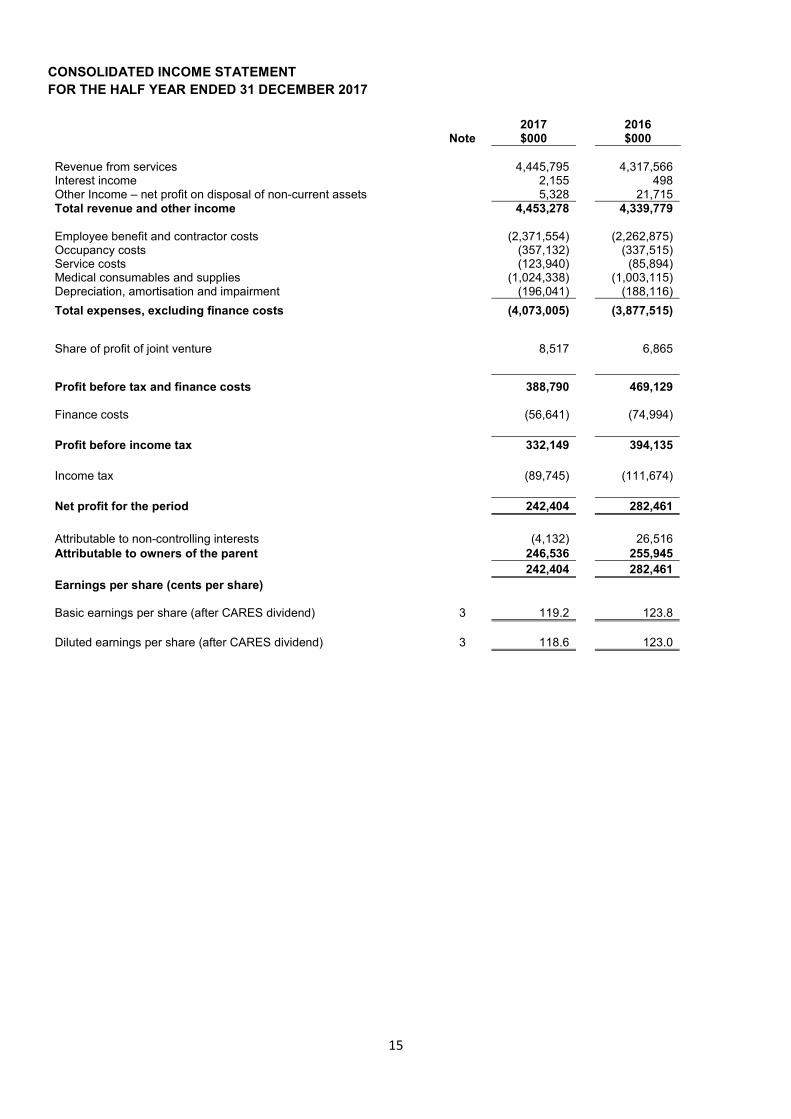
CONSOLIDATED INCOME STATEMENT
FOR THE HALF YEAR ENDED 31 DECEMBER 2017
Note 2017 $000
2016 $000
Revenue from services 4,445,795 4,317,566 Interest income 2,155 498 Other Income – net profit on disposal of non-current assets 5,328 21,715 Total revenue and other income 4,453,278 4,339,779 Employee benefit and contractor costs (2,371,554) (2,262,875) Occupancy costs (357,132) (337,515) Service costs (123,940) (85,894) Medical consumables and supplies (1,024,338) (1,003,115) Depreciation, amortisation and impairment (196,041) (188,116)
Total expenses, excluding finance costs (4,073,005) (3,877,515)
Share of profit of joint venture 8,517 6,865
Profit before tax and finance costs 388,790 469,129 Finance costs
(56,641) (74,994)
Profit before income tax 332,149 394,135
Income tax (89,745) (111,674)
Net profit for the period 242,404 282,461
Attributable to non-controlling interests (4,132) 26,516 Attributable to owners of the parent 246,536 255,945
242,404 282,461
Earnings per share (cents per share) Basic earnings per share (after CARES dividend) 3 119.2 123.8
Diluted earnings per share (after CARES dividend) 3 118.6 123.0
16
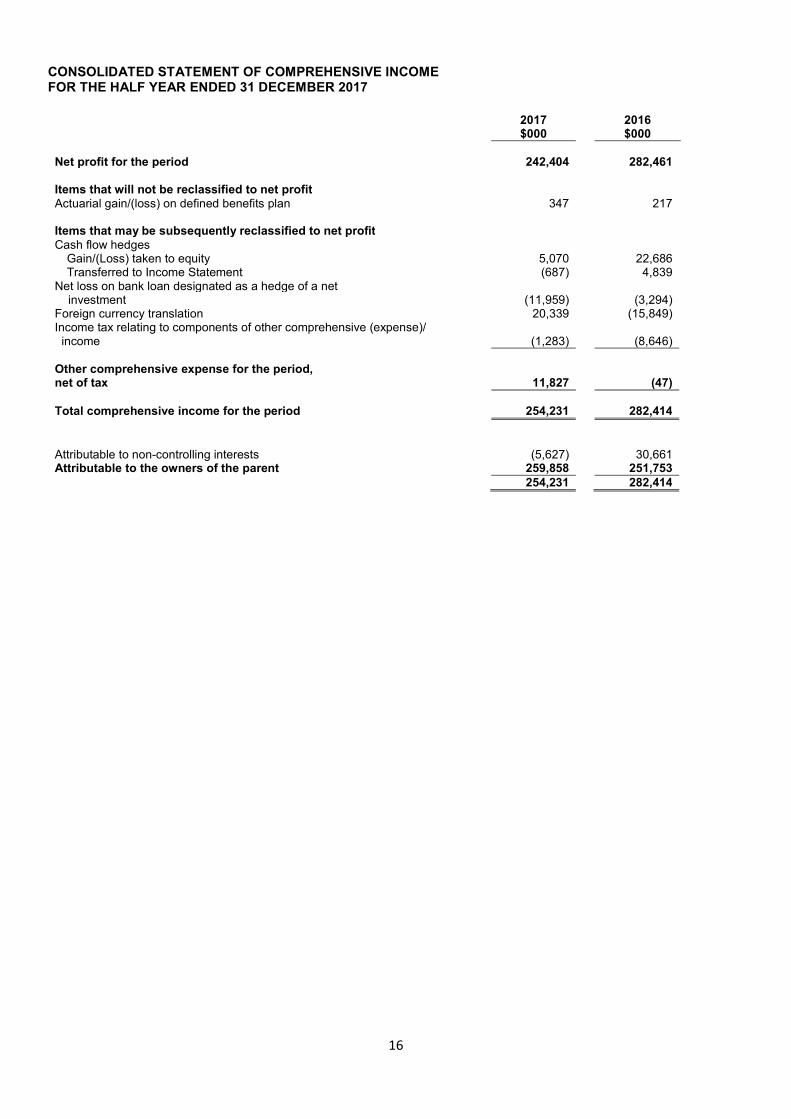
CONSOLIDATED STATEMENT OF COMPREHENSIVE INCOME FOR THE HALF YEAR ENDED 31 DECEMBER 2017
2017 $000
2016 $000
Net profit for the period 242,404 282,461 Items that will not be reclassified to net profit Actuarial gain/(loss) on defined benefits plan 347 217 Items that may be subsequently reclassified to net profit Cash flow hedges
Gain/(Loss) taken to equity 5,070 22,686 Transferred to Income Statement (687) 4,839
Net loss on bank loan designated as a hedge of a net investment (11,959) (3,294) Foreign currency translation 20,339 (15,849) Income tax relating to components of other comprehensive (expense)/ income (1,283) (8,646) Other comprehensive expense for the period, net of tax 11,827 (47) Total comprehensive income for the period 254,231 282,414
Attributable to non-controlling interests (5,627) 30,661 Attributable to the owners of the parent 259,858 251,753 254,231 282,414

17
CONSOLIDATED STATEMENT OF FINANCIAL POSITION AS AT 31 DECEMBER 2017
Note
As at 31/12/2017
$000
As at 30/06/2017
$000 ASSETS Current assets Cash and cash equivalents 4 436,531 419,519 Trade and other receivables 1,114,615 1,172,188 Inventories 249,505 226,261 Income tax receivable 76,556 8,931 Prepayments 83,295 97,226 Other current assets 14,779 22,817 1,975,281 1,946,942 Assets classified as held for sale 13,844 13,383 Total current assets 1,989,125 1,960,325
Non-current assets Other financial assets 39,749 34,515 Investment in joint venture 222,622 206,101 Property, plant and equipment 4,049,358 3,865,832 Intangible assets 2,233,476 2,037,361 Deferred tax asset 190,850 179,457 Prepayments 11,664 11,779 Derivative financial instruments 8 1,090 734 Receivables 41,103 39,257 Total non-current assets 6,789,912 6,375,036 TOTAL ASSETS 8,779,037 8,335,361
LIABILITIES Current liabilities Trade and other payables 1,709,794 1,694,889 Interest-bearing loans and borrowings 5 144,625 85,543 Derivative financial instruments 8 14,799 16,046 Provisions 73,652 69,348 Income tax payable 42,585 36,522 Total current liabilities 1,985,455 1,902,348 Non-current liabilities Interest-bearing loans and borrowings 5 3,505,670 3,261,816 Provisions 535,624 475,298 Defined employee benefit obligation 79,995 75,237 Derivative financial instruments 8 11,248 14,065 Other creditors 9,065 8,648 Deferred tax liability 231,282 239,263 Total non-current liabilities 4,372,884 4,074,327
TOTAL LIABILITIES 6,358,339 5,976,675
NET ASSETS 2,420,698 2,358,686
EQUITY Issued capital 713,523 713,523 Treasury shares (51,850) (70,608) Convertible Adjustable Rate Equity Securities (CARES) 252,165 252,165 Other reserves (42,615) (17,556) Retained earnings 1,474,642 1,398,664 Parent interests 2,345,865 2,276,188 Non-controlling interests 74,833 82,498 TOTAL EQUITY 2,420,698 2,358,686
18
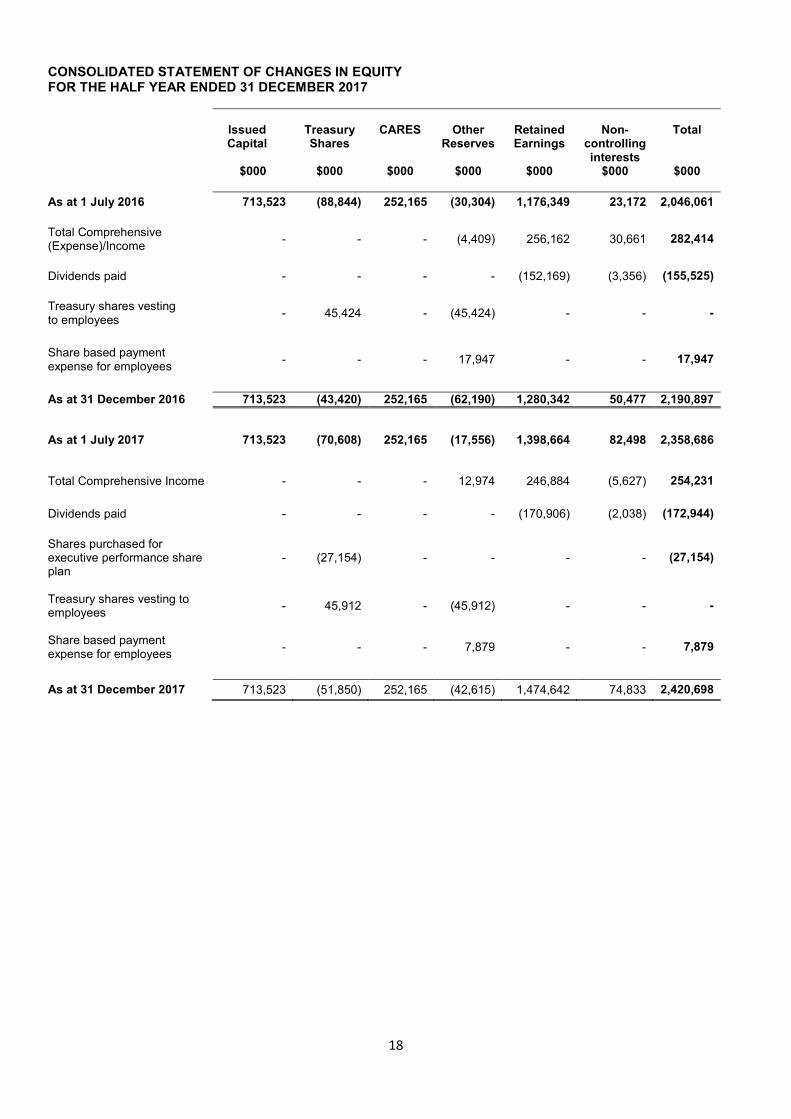
CONSOLIDATED STATEMENT OF CHANGES IN EQUITY FOR THE HALF YEAR ENDED 31 DECEMBER 2017
Issued Capital
$000
Treasury Shares
$000
CARES
$000
Other Reserves
$000
Retained Earnings
$000
Non-
controlling interests $000
Total
$000
As at 1 July 2016 713,523 (88,844) 252,165 (30,304) 1,176,349 23,172 2,046,061
Total Comprehensive (Expense)/Income
- - - (4,409) 256,162 30,661 282,414
Dividends paid - - - - (152,169) (3,356) (155,525)
Treasury shares vesting to employees
- 45,424 - (45,424) - - -
Share based payment expense for employees
- - - 17,947 - - 17,947
As at 31 December 2016 713,523 (43,420) 252,165 (62,190) 1,280,342 50,477 2,190,897
As at 1 July 2017 713,523 (70,608) 252,165 (17,556) 1,398,664 82,498 2,358,686
Total Comprehensive Income - - - 12,974 246,884 (5,627) 254,231
Dividends paid - - - - (170,906) (2,038) (172,944)
Shares purchased for executive performance share plan
- (27,154) - - - - (27,154)
Treasury shares vesting to employees
- 45,912 - (45,912) - - -
Share based payment expense for employees
- - - 7,879 - - 7,879
As at 31 December 2017 713,523 (51,850) 252,165 (42,615) 1,474,642 74,833 2,420,698
19
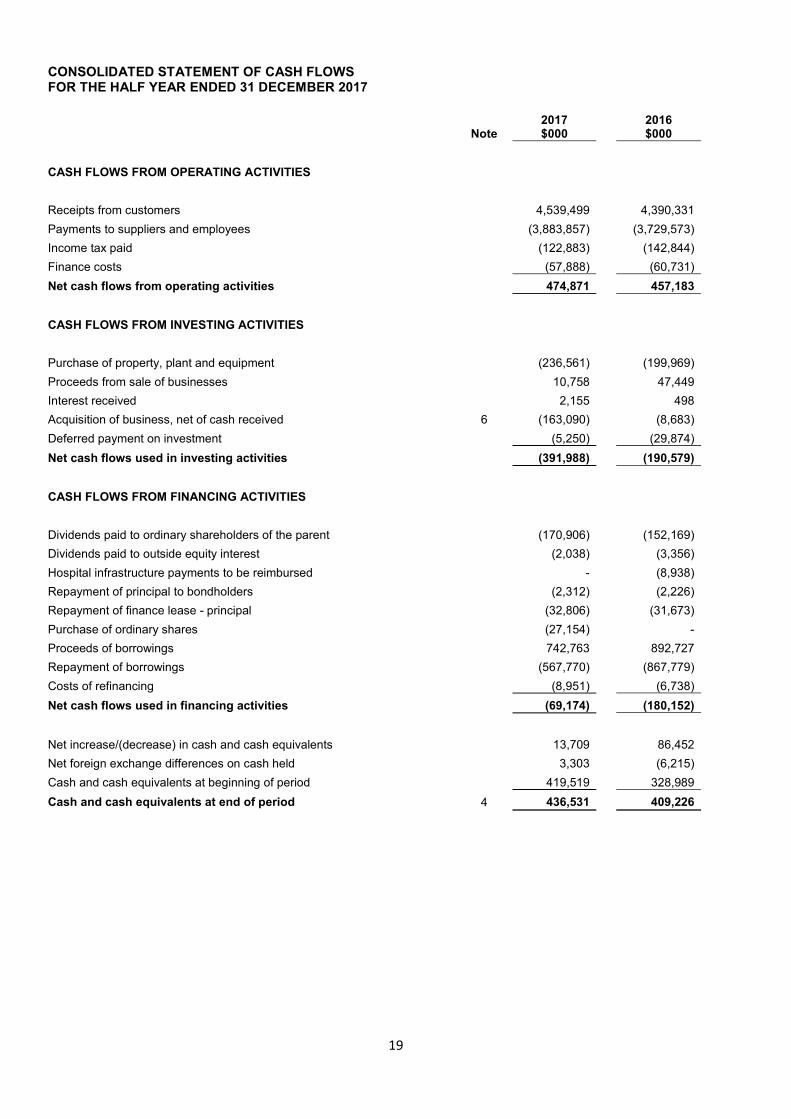
CONSOLIDATED STATEMENT OF CASH FLOWS FOR THE HALF YEAR ENDED 31 DECEMBER 2017
Note 2017 $000
2016 $000
CASH FLOWS FROM OPERATING ACTIVITIES
Receipts from customers 4,539,499 4,390,331
Payments to suppliers and employees (3,883,857) (3,729,573)
Income tax paid (122,883) (142,844)
Finance costs (57,888) (60,731)
Net cash flows from operating activities 474,871 457,183
CASH FLOWS FROM INVESTING ACTIVITIES
Purchase of property, plant and equipment (236,561) (199,969)
Proceeds from sale of businesses 10,758 47,449
Interest received 2,155 498
Acquisition of business, net of cash received 6 (163,090) (8,683)
Deferred payment on investment (5,250) (29,874)
Net cash flows used in investing activities (391,988) (190,579)
CASH FLOWS FROM FINANCING ACTIVITIES
Dividends paid to ordinary shareholders of the parent (170,906) (152,169)
Dividends paid to outside equity interest (2,038) (3,356)
Hospital infrastructure payments to be reimbursed - (8,938)
Repayment of principal to bondholders (2,312) (2,226)
Repayment of finance lease - principal (32,806) (31,673)
Purchase of ordinary shares (27,154) -
Proceeds of borrowings 742,763 892,727
Repayment of borrowings (567,770) (867,779)
Costs of refinancing (8,951) (6,738)
Net cash flows used in financing activities (69,174) (180,152)
Net increase/(decrease) in cash and cash equivalents 13,709 86,452
Net foreign exchange differences on cash held 3,303 (6,215)
Cash and cash equivalents at beginning of period 419,519 328,989
Cash and cash equivalents at end of period 4 436,531 409,226
20
NOTES TO THE CONSOLIDATED HALF YEAR FINANCIAL STATEMENTS FOR THE HALF YEAR ENDED 31 DECEMBER 2017
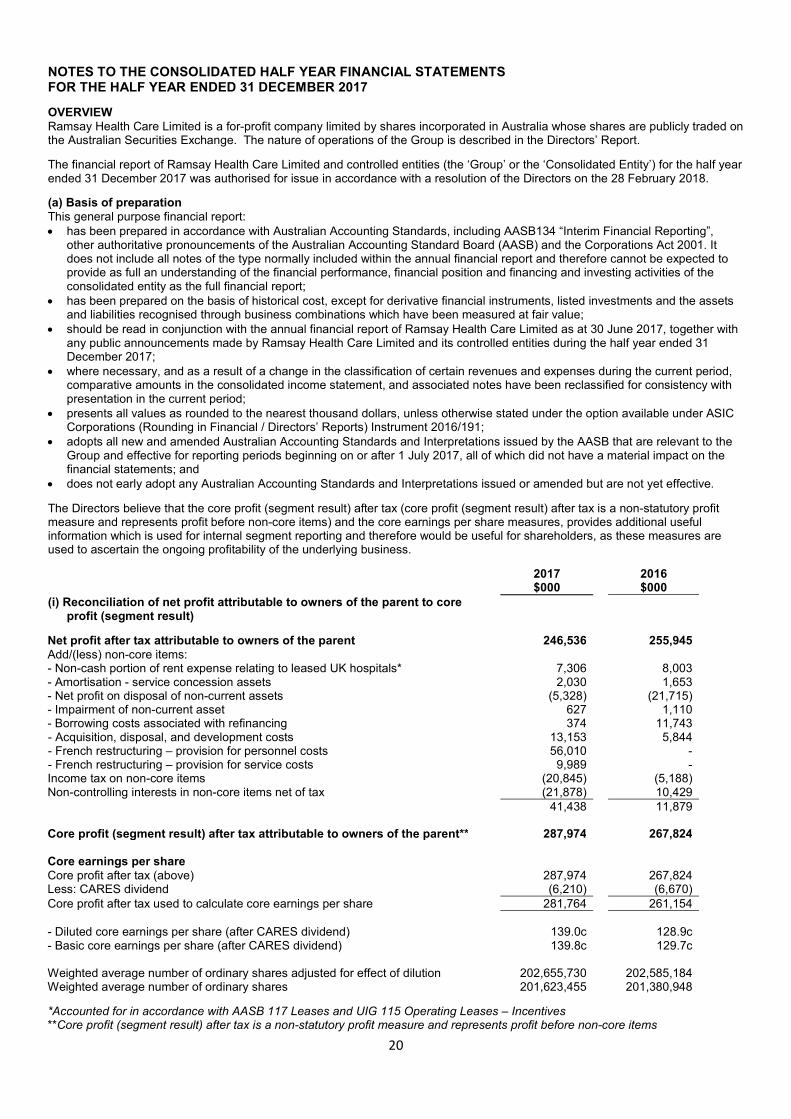
OVERVIEW Ramsay Health Care Limited is a for-profit company limited by shares incorporated in Australia whose shares are publicly traded on the Australian Securities Exchange. The nature of operations of the Group is described in the Directors’ Report.
The financial report of Ramsay Health Care Limited and controlled entities (the ‘Group’ or the ‘Consolidated Entity’) for the half year ended 31 December 2017 was authorised for issue in accordance with a resolution of the Directors on the 28 February 2018.
(a) Basis of preparation This general purpose financial report: • has been prepared in accordance with Australian Accounting Standards, including AASB134 “Interim Financial Reporting”,
other authoritative pronouncements of the Australian Accounting Standard Board (AASB) and the Corporations Act 2001. It does not include all notes of the type normally included within the annual financial report and therefore cannot be expected to provide as full an understanding of the financial performance, financial position and financing and investing activities of the consolidated entity as the full financial report;
• has been prepared on the basis of historical cost, except for derivative financial instruments, listed investments and the assets and liabilities recognised through business combinations which have been measured at fair value;
• should be read in conjunction with the annual financial report of Ramsay Health Care Limited as at 30 June 2017, together with any public announcements made by Ramsay Health Care Limited and its controlled entities during the half year ended 31 December 2017;
• where necessary, and as a result of a change in the classification of certain revenues and expenses during the current period, comparative amounts in the consolidated income statement, and associated notes have been reclassified for consistency with presentation in the current period;
• presents all values as rounded to the nearest thousand dollars, unless otherwise stated under the option available under ASIC Corporations (Rounding in Financial / Directors’ Reports) Instrument 2016/191;
• adopts all new and amended Australian Accounting Standards and Interpretations issued by the AASB that are relevant to the Group and effective for reporting periods beginning on or after 1 July 2017, all of which did not have a material impact on the financial statements; and
• does not early adopt any Australian Accounting Standards and Interpretations issued or amended but are not yet effective.
The Directors believe that the core profit (segment result) after tax (core profit (segment result) after tax is a non-statutory profit measure and represents profit before non-core items) and the core earnings per share measures, provides additional useful information which is used for internal segment reporting and therefore would be useful for shareholders, as these measures are used to ascertain the ongoing profitability of the underlying business.
2017 $000
2016 $000
(i) Reconciliation of net profit attributable to owners of the parent to core profit (segment result)
Net profit after tax attributable to owners of the parent 246,536 255,945 Add/(less) non-core items: - Non-cash portion of rent expense relating to leased UK hospitals* 7,306 8,003 - Amortisation - service concession assets 2,030 1,653 - Net profit on disposal of non-current assets (5,328) (21,715) - Impairment of non-current asset 627 1,110 - Borrowing costs associated with refinancing 374 11,743 - Acquisition, disposal, and development costs 13,153 5,844 - French restructuring – provision for personnel costs 56,010 - - French restructuring – provision for service costs 9,989 - Income tax on non-core items (20,845) (5,188) Non-controlling interests in non-core items net of tax (21,878) 10,429 41,438 11,879
Core profit (segment result) after tax attributable to owners of the parent** 287,974 267,824
Core earnings per share Core profit after tax (above) 287,974 267,824 Less: CARES dividend (6,210) (6,670) Core profit after tax used to calculate core earnings per share 281,764 261,154
- Diluted core earnings per share (after CARES dividend) 139.0c 128.9c - Basic core earnings per share (after CARES dividend) 139.8c 129.7c Weighted average number of ordinary shares adjusted for effect of dilution 202,655,730 202,585,184 Weighted average number of ordinary shares 201,623,455 201,380,948
*Accounted for in accordance with AASB 117 Leases and UIG 115 Operating Leases – Incentives **Core profit (segment result) after tax is a non-statutory profit measure and represents profit before non-core items
21
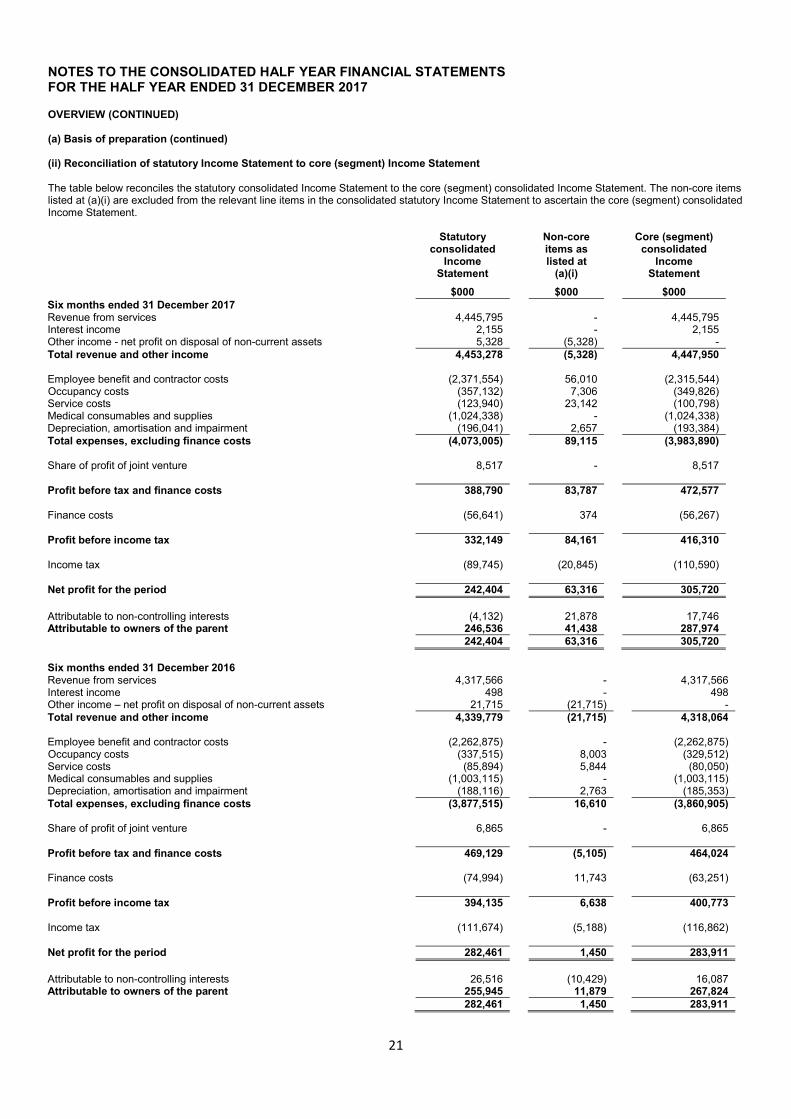
NOTES TO THE CONSOLIDATED HALF YEAR FINANCIAL STATEMENTS FOR THE HALF YEAR ENDED 31 DECEMBER 2017 OVERVIEW (CONTINUED) (a) Basis of preparation (continued) (ii) Reconciliation of statutory Income Statement to core (segment) Income Statement The table below reconciles the statutory consolidated Income Statement to the core (segment) consolidated Income Statement. The non-core items listed at (a)(i) are excluded from the relevant line items in the consolidated statutory Income Statement to ascertain the core (segment) consolidated Income Statement. Statutory
consolidated Income
Statement
Non-core items as listed at (a)(i)
Core (segment) consolidated
Income Statement
$000 $000 $000 Six months ended 31 December 2017 Revenue from services 4,445,795 - 4,445,795 Interest income 2,155 - 2,155 Other income - net profit on disposal of non-current assets 5,328 (5,328) - Total revenue and other income 4,453,278 (5,328) 4,447,950 Employee benefit and contractor costs (2,371,554) 56,010 (2,315,544) Occupancy costs (357,132) 7,306 (349,826) Service costs (123,940) 23,142 (100,798) Medical consumables and supplies (1,024,338) - (1,024,338) Depreciation, amortisation and impairment (196,041) 2,657 (193,384) Total expenses, excluding finance costs (4,073,005) 89,115 (3,983,890) Share of profit of joint venture 8,517 - 8,517 Profit before tax and finance costs 388,790 83,787 472,577 Finance costs (56,641) 374 (56,267) Profit before income tax 332,149 84,161 416,310 Income tax (89,745) (20,845) (110,590) Net profit for the period 242,404 63,316 305,720
Attributable to non-controlling interests (4,132) 21,878 17,746 Attributable to owners of the parent 246,536 41,438 287,974 242,404 63,316 305,720
Six months ended 31 December 2016 Revenue from services 4,317,566 - 4,317,566 Interest income 498 - 498 Other income – net profit on disposal of non-current assets 21,715 (21,715) - Total revenue and other income 4,339,779 (21,715) 4,318,064 Employee benefit and contractor costs (2,262,875) - (2,262,875) Occupancy costs (337,515) 8,003 (329,512) Service costs (85,894) 5,844 (80,050) Medical consumables and supplies (1,003,115) - (1,003,115) Depreciation, amortisation and impairment (188,116) 2,763 (185,353) Total expenses, excluding finance costs (3,877,515) 16,610 (3,860,905) Share of profit of joint venture 6,865 - 6,865 Profit before tax and finance costs 469,129 (5,105) 464,024 Finance costs (74,994) 11,743 (63,251) Profit before income tax 394,135 6,638 400,773 Income tax (111,674) (5,188) (116,862) Net profit for the period 282,461 1,450 283,911
Attributable to non-controlling interests 26,516 (10,429) 16,087 Attributable to owners of the parent 255,945 11,879 267,824 282,461 1,450 283,911
22
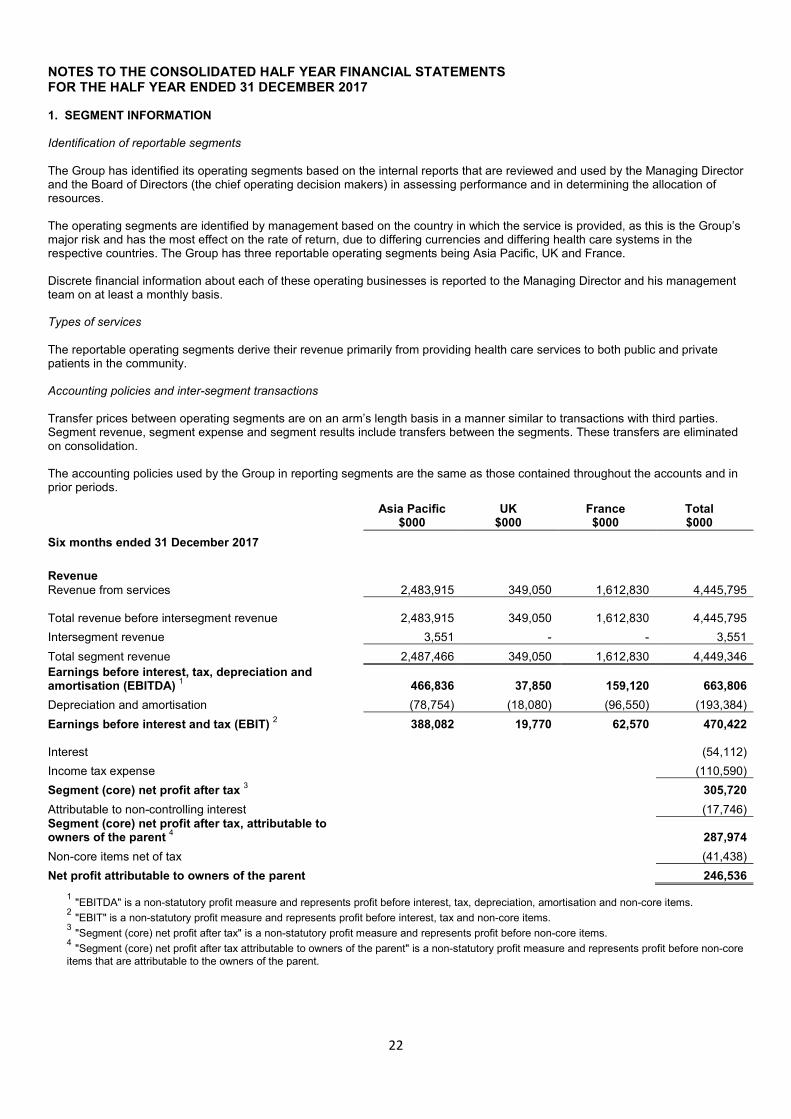
NOTES TO THE CONSOLIDATED HALF YEAR FINANCIAL STATEMENTS FOR THE HALF YEAR ENDED 31 DECEMBER 2017 1. SEGMENT INFORMATION Identification of reportable segments
The Group has identified its operating segments based on the internal reports that are reviewed and used by the Managing Director and the Board of Directors (the chief operating decision makers) in assessing performance and in determining the allocation of resources. The operating segments are identified by management based on the country in which the service is provided, as this is the Group’s major risk and has the most effect on the rate of return, due to differing currencies and differing health care systems in the respective countries. The Group has three reportable operating segments being Asia Pacific, UK and France. Discrete financial information about each of these operating businesses is reported to the Managing Director and his management team on at least a monthly basis. Types of services
The reportable operating segments derive their revenue primarily from providing health care services to both public and private patients in the community. Accounting policies and inter-segment transactions Transfer prices between operating segments are on an arm’s length basis in a manner similar to transactions with third parties. Segment revenue, segment expense and segment results include transfers between the segments. These transfers are eliminated on consolidation. The accounting policies used by the Group in reporting segments are the same as those contained throughout the accounts and in prior periods.
1 "EBITDA" is a non-statutory profit measure and represents profit before interest, tax, depreciation, amortisation and non-core items.
2 "EBIT" is a non-statutory profit measure and represents profit before interest, tax and non-core items.
3 "Segment (core) net profit after tax" is a non-statutory profit measure and represents profit before non-core items.
4 "Segment (core) net profit after tax attributable to owners of the parent" is a non-statutory profit measure and represents profit before non-core
items that are attributable to the owners of the parent.
Asia Pacific
$000 UK $000
France $000
Total $000
Six months ended 31 December 2017
Revenue Revenue from services 2,483,915 349,050 1,612,830 4,445,795
Total revenue before intersegment revenue 2,483,915
349,050 1,612,830 4,445,795
Intersegment revenue 3,551 - - 3,551
Total segment revenue 2,487,466 349,050 1,612,830 4,449,346
Earnings before interest, tax, depreciation and amortisation (EBITDA)
1 466,836 37,850 159,120 663,806
Depreciation and amortisation (78,754) (18,080) (96,550) (193,384)
Earnings before interest and tax (EBIT) 2
388,082 19,770 62,570 470,422
Interest
(54,112)
Income tax expense (110,590)
Segment (core) net profit after tax 3
305,720
Attributable to non-controlling interest (17,746) Segment (core) net profit after tax, attributable to owners of the parent
4 287,974
Non-core items net of tax (41,438)
Net profit attributable to owners of the parent 246,536
23
NOTES TO THE CONSOLIDATED HALF YEAR FINANCIAL STATEMENTS FOR THE HALF YEAR ENDED 31 DECEMBER 2017
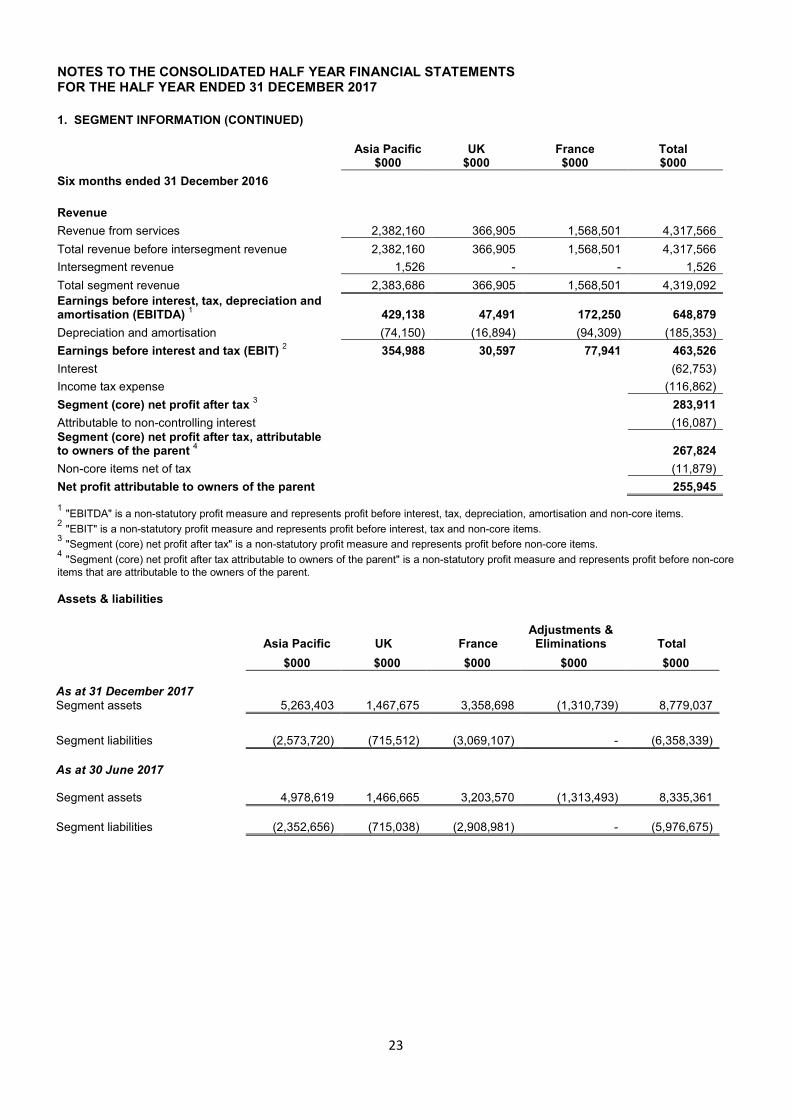
1. SEGMENT INFORMATION (CONTINUED)
1 "EBITDA" is a non-statutory profit measure and represents profit before interest, tax, depreciation, amortisation and non-core items.
2 "EBIT" is a non-statutory profit measure and represents profit before interest, tax and non-core items.
3 "Segment (core) net profit after tax" is a non-statutory profit measure and represents profit before non-core items.
4 "Segment (core) net profit after tax attributable to owners of the parent" is a non-statutory profit measure and represents profit before non-core
items that are attributable to the owners of the parent.
Assets & liabilities
Asia Pacific
$000 UK $000
France $000
Total $000
Six months ended 31 December 2016
Revenue
Revenue from services 2,382,160 366,905 1,568,501 4,317,566
Total revenue before intersegment revenue 2,382,160 366,905 1,568,501 4,317,566
Intersegment revenue 1,526 - - 1,526
Total segment revenue 2,383,686 366,905 1,568,501 4,319,092
Earnings before interest, tax, depreciation and amortisation (EBITDA)
1 429,138 47,491 172,250 648,879
Depreciation and amortisation (74,150) (16,894) (94,309) (185,353)
Earnings before interest and tax (EBIT) 2
354,988 30,597 77,941 463,526
Interest (62,753)
Income tax expense (116,862)
Segment (core) net profit after tax 3
283,911
Attributable to non-controlling interest (16,087) Segment (core) net profit after tax, attributable to owners of the parent
4 267,824
Non-core items net of tax (11,879)
Net profit attributable to owners of the parent 255,945
Asia Pacific UK France Adjustments & Eliminations Total
$000 $000 $000 $000 $000
As at 31 December 2017
Segment assets 5,263,403 1,467,675 3,358,698 (1,310,739) 8,779,037
Segment liabilities (2,573,720) (715,512) (3,069,107) - (6,358,339)
As at 30 June 2017
Segment assets
4,978,619
1,466,665
3,203,570
(1,313,493)
8,335,361
Segment liabilities
(2,352,656)
(715,038)
(2,908,981)
-
(5,976,675)

24
NOTES TO THE CONSOLIDATED HALF YEAR FINANCIAL STATEMENTS FOR THE HALF YEAR ENDED 31 DECEMBER 2017
1. SEGMENT INFORMATION (CONTINUED)
2017 $000
2016 $000
i) Segment revenue reconciliation to Income Statement
Total segment revenue 4,449,346 4,319,092
Intersegment sales elimination (3,551) (1,526)
Interest income 2,155 498
Other income – Profit on the disposal of non-current assets 5,328 21,715
Total revenue and other income per Income Statement 4,453,278 4,339,779
ii) Segment net profit after tax reconciliation to Income Statement The executive management committee meets on a monthly basis to assess the performance of each segment by analysing the segment’s core net profit after tax. A segment’s core net profit after tax excludes income and expenses from non-core items. Refer to the Overview section for the reconciliation of net profit attributable to owners of the parent to core profit (segment result) after tax.
2. DIVIDENDS PAID
31/12/2017 $000
31/12/2016 $000
(a) Dividends declared and paid during the period on ordinary shares:
Previous year final dividend paid Franked dividends - ordinary (81.5 cents per share) (2016: 72.0 cents) 164,696 145,499
(b) Dividends proposed and not recognised as a liability on ordinary shares: Interim dividend proposed Franked dividends - ordinary
(57.5 cents per share) (2016: 53.0 cents) 116,197 107,103
(c) Dividends declared and paid during the period on CARES: Previous year final dividend paid Franked dividends - CARES 6,210 6,670
(d) Dividends proposed and not recognised as a liability on CARES: Interim dividend proposed Franked dividends – CARES 6,117 6,207
The tax rate at which paid dividends have been franked is 30% (2016: 30%). 100% of the proposed dividends will be franked at the rate of 30% (2016: 30%).
25
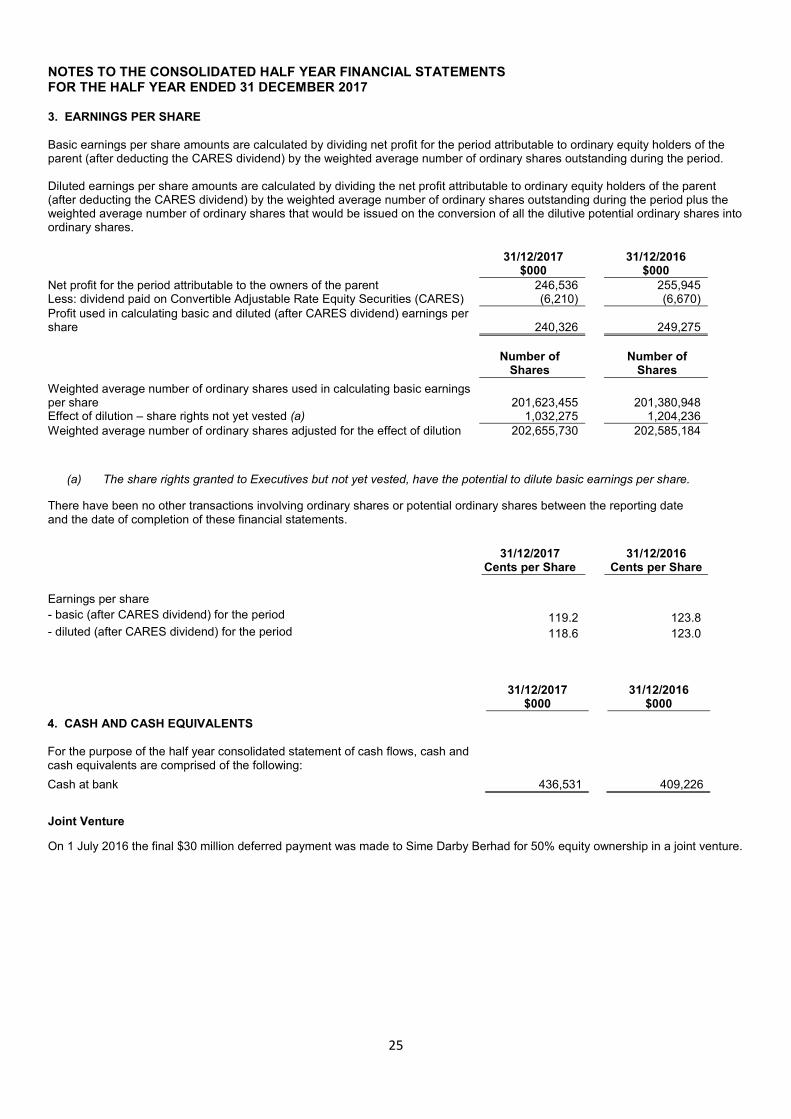
NOTES TO THE CONSOLIDATED HALF YEAR FINANCIAL STATEMENTS FOR THE HALF YEAR ENDED 31 DECEMBER 2017 3. EARNINGS PER SHARE Basic earnings per share amounts are calculated by dividing net profit for the period attributable to ordinary equity holders of the parent (after deducting the CARES dividend) by the weighted average number of ordinary shares outstanding during the period. Diluted earnings per share amounts are calculated by dividing the net profit attributable to ordinary equity holders of the parent (after deducting the CARES dividend) by the weighted average number of ordinary shares outstanding during the period plus the weighted average number of ordinary shares that would be issued on the conversion of all the dilutive potential ordinary shares into ordinary shares.
31/12/2017
$000
31/12/2016 $000
Net profit for the period attributable to the owners of the parent 246,536 255,945 Less: dividend paid on Convertible Adjustable Rate Equity Securities (CARES) (6,210) (6,670) Profit used in calculating basic and diluted (after CARES dividend) earnings per share 240,326
249,275
Number of Shares
Number of Shares
Weighted average number of ordinary shares used in calculating basic earnings per share 201,623,455
201,380,948 Effect of dilution – share rights not yet vested (a) 1,032,275 1,204,236 Weighted average number of ordinary shares adjusted for the effect of dilution 202,655,730 202,585,184
(a) The share rights granted to Executives but not yet vested, have the potential to dilute basic earnings per share.
There have been no other transactions involving ordinary shares or potential ordinary shares between the reporting date and the date of completion of these financial statements.
31/12/2017
Cents per Share
31/12/2016 Cents per Share
Earnings per share - basic (after CARES dividend) for the period 119.2 123.8 - diluted (after CARES dividend) for the period 118.6 123.0
31/12/2017 $000
31/12/2016 $000
4. CASH AND CASH EQUIVALENTS
For the purpose of the half year consolidated statement of cash flows, cash and cash equivalents are comprised of the following:
Cash at bank 436,531 409,226
Joint Venture
On 1 July 2016 the final $30 million deferred payment was made to Sime Darby Berhad for 50% equity ownership in a joint venture.
26
NOTES TO THE CONSOLIDATED HALF YEAR FINANCIAL STATEMENTS FOR THE HALF YEAR ENDED 31 DECEMBER 2017
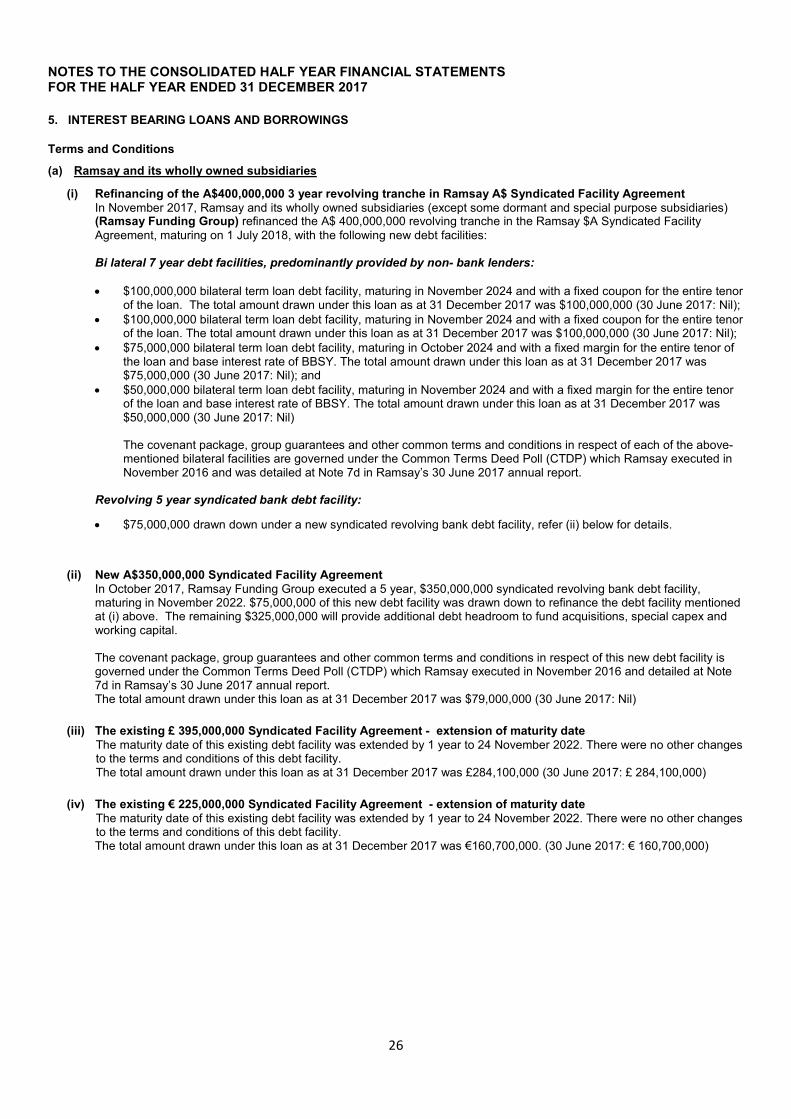
5. INTEREST BEARING LOANS AND BORROWINGS
Terms and Conditions
(a) Ramsay and its wholly owned subsidiaries
(i) Refinancing of the A$400,000,000 3 year revolving tranche in Ramsay A$ Syndicated Facility Agreement In November 2017, Ramsay and its wholly owned subsidiaries (except some dormant and special purpose subsidiaries) (Ramsay Funding Group) refinanced the A$ 400,000,000 revolving tranche in the Ramsay $A Syndicated Facility Agreement, maturing on 1 July 2018, with the following new debt facilities: Bi lateral 7 year debt facilities, predominantly provided by non- bank lenders: • $100,000,000 bilateral term loan debt facility, maturing in November 2024 and with a fixed coupon for the entire tenor
of the loan. The total amount drawn under this loan as at 31 December 2017 was $100,000,000 (30 June 2017: Nil); • $100,000,000 bilateral term loan debt facility, maturing in November 2024 and with a fixed coupon for the entire tenor
of the loan. The total amount drawn under this loan as at 31 December 2017 was $100,000,000 (30 June 2017: Nil); • $75,000,000 bilateral term loan debt facility, maturing in October 2024 and with a fixed margin for the entire tenor of
the loan and base interest rate of BBSY. The total amount drawn under this loan as at 31 December 2017 was $75,000,000 (30 June 2017: Nil); and
• $50,000,000 bilateral term loan debt facility, maturing in November 2024 and with a fixed margin for the entire tenor of the loan and base interest rate of BBSY. The total amount drawn under this loan as at 31 December 2017 was $50,000,000 (30 June 2017: Nil)
The covenant package, group guarantees and other common terms and conditions in respect of each of the above-mentioned bilateral facilities are governed under the Common Terms Deed Poll (CTDP) which Ramsay executed in November 2016 and was detailed at Note 7d in Ramsay’s 30 June 2017 annual report.
Revolving 5 year syndicated bank debt facility:
• $75,000,000 drawn down under a new syndicated revolving bank debt facility, refer (ii) below for details.
(ii) New A$350,000,000 Syndicated Facility Agreement In October 2017, Ramsay Funding Group executed a 5 year, $350,000,000 syndicated revolving bank debt facility, maturing in November 2022. $75,000,000 of this new debt facility was drawn down to refinance the debt facility mentioned at (i) above. The remaining $325,000,000 will provide additional debt headroom to fund acquisitions, special capex and working capital. The covenant package, group guarantees and other common terms and conditions in respect of this new debt facility is governed under the Common Terms Deed Poll (CTDP) which Ramsay executed in November 2016 and detailed at Note 7d in Ramsay’s 30 June 2017 annual report. The total amount drawn under this loan as at 31 December 2017 was $79,000,000 (30 June 2017: Nil)
(iii) The existing £ 395,000,000 Syndicated Facility Agreement - extension of maturity date
The maturity date of this existing debt facility was extended by 1 year to 24 November 2022. There were no other changes to the terms and conditions of this debt facility. The total amount drawn under this loan as at 31 December 2017 was £284,100,000 (30 June 2017: £ 284,100,000)
(iv) The existing € 225,000,000 Syndicated Facility Agreement - extension of maturity date
The maturity date of this existing debt facility was extended by 1 year to 24 November 2022. There were no other changes to the terms and conditions of this debt facility. The total amount drawn under this loan as at 31 December 2017 was €160,700,000. (30 June 2017: € 160,700,000)
27
NOTES TO THE CONSOLIDATED HALF YEAR FINANCIAL STATEMENTS FOR THE HALF YEAR ENDED 31 DECEMBER 2017
5. INTEREST BEARING LOANS AND BORROWINGS (CONTINUED)
Terms and Conditions (continued)
(a) Ramsay and its wholly owned subsidiaries (continued)
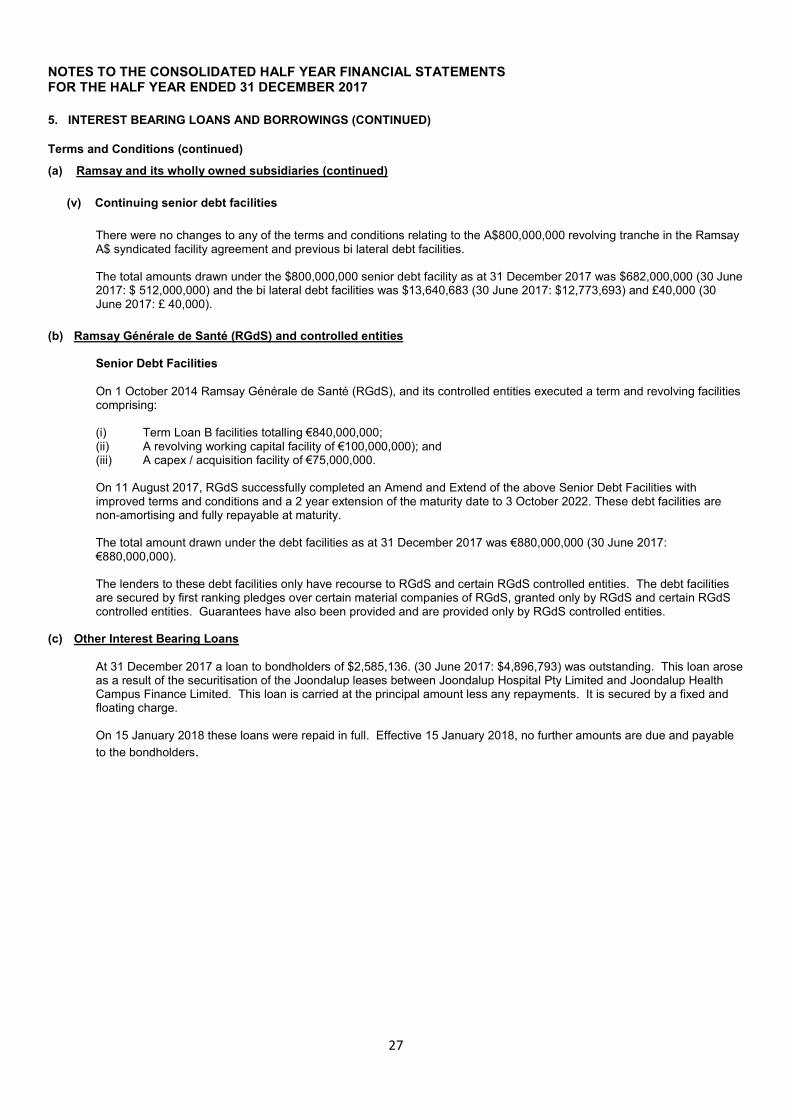
(v) Continuing senior debt facilities
There were no changes to any of the terms and conditions relating to the A$800,000,000 revolving tranche in the Ramsay A$ syndicated facility agreement and previous bi lateral debt facilities. The total amounts drawn under the $800,000,000 senior debt facility as at 31 December 2017 was $682,000,000 (30 June 2017: $ 512,000,000) and the bi lateral debt facilities was $13,640,683 (30 June 2017: $12,773,693) and £40,000 (30 June 2017: £ 40,000).
(b) Ramsay Générale de Santé (RGdS) and controlled entities
Senior Debt Facilities On 1 October 2014 Ramsay Générale de Santé (RGdS), and its controlled entities executed a term and revolving facilities comprising: (i) Term Loan B facilities totalling €840,000,000; (ii) A revolving working capital facility of €100,000,000); and (iii) A capex / acquisition facility of €75,000,000. On 11 August 2017, RGdS successfully completed an Amend and Extend of the above Senior Debt Facilities with improved terms and conditions and a 2 year extension of the maturity date to 3 October 2022. These debt facilities are non-amortising and fully repayable at maturity. The total amount drawn under the debt facilities as at 31 December 2017 was €880,000,000 (30 June 2017: €880,000,000). The lenders to these debt facilities only have recourse to RGdS and certain RGdS controlled entities. The debt facilities are secured by first ranking pledges over certain material companies of RGdS, granted only by RGdS and certain RGdS controlled entities. Guarantees have also been provided and are provided only by RGdS controlled entities.
(c) Other Interest Bearing Loans
At 31 December 2017 a loan to bondholders of $2,585,136. (30 June 2017: $4,896,793) was outstanding. This loan arose as a result of the securitisation of the Joondalup leases between Joondalup Hospital Pty Limited and Joondalup Health Campus Finance Limited. This loan is carried at the principal amount less any repayments. It is secured by a fixed and floating charge. On 15 January 2018 these loans were repaid in full. Effective 15 January 2018, no further amounts are due and payable
to the bondholders.

28
NOTES TO THE CONSOLIDATED HALF YEAR FINANCIAL STATEMENTS FOR THE HALF YEAR ENDED 31 DECEMBER 2017 6. BUSINESS COMBINATIONS
Acquisitions - 2018
Over the past six months, Ramsay has acquired other businesses within the healthcare sector. The amounts recognised for these business combinations in the financial statements for the half year ended 31 December 2017 have been determined on a provisional basis only.
$000 Fair value of identifiable net assets 2,685 Goodwill arising on acquisition 166,550 Acquisition date fair value of consideration transferred 169,235 The cash outflow on acquisition is as follows: Net cash acquired with the subsidiary 6,145 Cash paid (169,235) Net consolidated cash outflow (163,090)
Direct costs relating to the acquisitions – included within service costs 7,793 Acquisitions - 2017
In the six months to 31 December 2016, Ramsay acquired other businesses within the healthcare sector. The amounts recognised for these business combinations in the financial statements for the half year ended 31 December 2016 are as follows:
$000
Fair value of identifiable net assets 682 Goodwill arising on acquisition 8,001 Acquisition date fair value of consideration transferred 8,683 The cash outflow on acquisition is as follows Cash paid (8,683)
7. FAIR VALUES
Unless disclosed below, the carrying amount of the Group’s financial assets and liabilities approximate their fair value. The fair values have been calculated by discounting the expected future cash flows at prevailing market interest rates depending on the type of borrowings. At reporting date, the market interest rates vary from 1.710% to 1.795% (June 2017: 1.615% to 1.705%) for Australia, 0.4962% to 0.5211% (June 2017: 0.2524% to 0.3067%) for UK, and -0.368% to -0.329% (June 2017: -0.373% to -0.331%) for France respectively. As at
31/12/2017 As at
30/06/2017
Carrying Amount $000
Fair Value $000
Carrying Amount $000
Fair Value $000
Bank loans 3,344,145 3,420,062
3,096,950 3,143,184
Lease liabilities 303,460 333,340 245,512 273,225
Bondholders 2,691 2,691 4,897 4,993 3,650,296 3,756,093 3,347,359 3,421,402

29
NOTES TO THE CONSOLIDATED HALF YEAR FINANCIAL STATEMENTS FOR THE HALF YEAR ENDED 31 DECEMBER 2017 8. DERIVATIVE FINANCIAL INSTRUMENTS Instruments used by the Group Derivative financial instruments are used by the Group in the normal course of business in order to hedge exposure to fluctuations in interest and foreign exchange rates. Fair value The Group has available to it various methods in estimating the fair value of a derivative financial instrument. The methods comprise: Level 1 the fair value is calculated using quoted prices in active markets.
Level 2 the fair value is estimated using inputs other than quoted prices included in Level 1 that are observable for the asset or liability, either directly (as prices) or indirectly (derived from prices).
Level 3 the fair value is estimated using inputs for the asset or liability that are not based on observable market data.
The fair value of the financial instruments was estimated using the level 2 method valuation technique and is summarized in the table below.
As at 31/12/2017
$000
As at 30/06/2017
$000
Financial assets
Derivative instruments – interest rate swaps 1,090 734
Financial liabilities
Derivative instruments – interest rate swaps (26,047) (30,111)
The most frequently applied valuation techniques include forward pricing and swap models, using present value calculations. The models incorporate various inputs including the credit quality of counterparties, foreign exchange spot and forward rates and interest rate curves. The changes in counterparty credit risk had no material effect on the hedge effectiveness assessment for derivatives designated in hedge relationships. Transfer between categories There were no transfers between Level 1 and Level 2 or between Level 2 and Level 3 during the period.
30
DIRECTORS’ DECLARATION In accordance with a resolution of the directors of Ramsay Health Care Limited, we state that: In the opinion of the directors:
(a) the financial information and notes of the consolidated entity are in accordance with the Corporations Act 2001 including: (i) giving a true and fair view of the financial position as at 31 December 2017 and the performance for the
half year ended on that date of the consolidated entity; and (ii) complying with Accounting Standard AASB 134 “Interim Financial Reporting” and the Corporations
Regulations 2001. (b) there are reasonable grounds to believe that the company will be able to pay its debts as and when they become
due and payable. On behalf of the Board
M.S. Siddle C.R. McNally Chairman Managing Director
Sydney, 28 February 2018
A member firm of Ernst & Young Global Limited Liability limited by a scheme approved under Professional Standards Legislation
31
IndepeIndepeIndepeIndependent Auditor's ndent Auditor's ndent Auditor's ndent Auditor's Review Review Review Review Report to the Members of Report to the Members of Report to the Members of Report to the Members of Ramsay Health Care LimitedRamsay Health Care LimitedRamsay Health Care LimitedRamsay Health Care Limited
Report on the HalfReport on the HalfReport on the HalfReport on the Half----Year Financial ReportYear Financial ReportYear Financial ReportYear Financial Report
Conclusion
We have reviewed the accompanying half-year financial report of Ramsay Health Care Limited and its subsidiaries (collectively the Group), which comprises the consolidated statement of financial position as at 31 December 2017, the consolidated income statement, consolidated statement of comprehensive income, consolidated statement of changes in equity and consolidated statement of cash flows for the half-year ended on that date, notes comprising a summary of significant accounting policies and other explanatory information, and the directors’ declaration.
Based on our review, which is not an audit, nothing has come to our attention that causes us to believe that the half-year financial report of the Group is not in accordance with the Corporations Act 2001, including:
a) giving a true and fair view of the consolidated financial position of the Group as at 31 December 2017 and of its consolidated financial
performance for the half-year ended on that date; and
b) complying with Accounting Standard AASB 134 Interim Financial Reporting and the Corporations Regulations 2001.
Directors’ Responsibility for the Half-Year Financial Report
The directors of the Group are responsible for the preparation of the half-year financial report that gives a true and fair view in accordance with Australian Accounting Standards and the Corporations Act 2001 and for such internal control as the directors determine is necessary to enable the preparation of the half-year financial report that is free from material misstatement, whether due to fraud or error.
Auditor’s Responsibility
Our responsibility is to express a conclusion on the half-year financial report based on our review. We conducted our review in accordance with Auditing Standard on Review Engagements ASRE 2410 Review of a Financial Report Performed by the Independent Auditor of the Entity, in order to state whether, on the basis of the procedures described, anything has come to our attention that causes us to believe that the half-year financial report is not in accordance with the Corporations Act 2001 including: giving a true and fair view of the Group’s consolidated financial position as at 31 December 2017 and its consolidated financial performance for the half-year ended on that date; and complying with Accounting Standard AASB 134 Interim Financial Reporting and the Corporations Regulations 2001. As the auditor of the Group, ASRE 2410 requires that we comply with the ethical requirements relevant to the audit of the annual financial report.
A review of a half-year financial report consists of making enquiries, primarily of persons responsible for financial and accounting matters, and applying analytical and other review procedures. A review is substantially less in scope than an audit conducted in accordance with Australian Auditing Standards and consequently does not enable us to obtain assurance that we would become aware of all significant matters that might be identified in an audit. Accordingly, we do not express an audit opinion.
A member firm of Ernst & Young Global Limited Liability limited by a scheme approved under Professional Standards Legislation
32
Independence
In conducting our review, we have complied with the independence requirements of the Corporations Act 2001.
Ernst & Young
Douglas Bain
Partner
Sydney
28 February 2018