appendix 11.4 geophysical survey - home | … interpretation of seismic profiles below the first...
TRANSCRIPT

Appendix 11.4
Marine Geophysical Survey

Appendix 11.4 - MARINE GEOPHYSICAL SURVEY
1 INTRODUCTION
Additional marine geophysical survey was required to ensure 100% coverage of the study
area when combined with the results of the 2008 data. The survey was designed to meet the
requirements of the SI and MAI. The survey was carried out by EGS Asia and the data were
made available for the archaeological assessment.
The following techniques were deployed:
METHOD OBJECTIVE
Marine seismic profiling
survey
To identify the geological succession at and beneath
the link corridor.
Marine side scan sonar survey To locate objects at or above the sea bed, such as
shipwrecks, isolated artefacts, seabed disturbance
and dumped materials.
Marine magnetic survey To detect the existing pipelines, to record the
presence of ferrous metal objects at or close to the
sea bed such as cannons.
The survey was carried out under the Geophysical Survey Term Contract Works Order No.
GE/2010/02.50 dated 12th January 2012 issued by Civil Engineering and Development
Department.
1.1 Survey Period
The survey was carried out on 30th January 2012.
2 SITE DESCRIPTION
The survey area lies inside To Kwa Wan Typhoon shelter between To Kwa Wan ferry pier
and the Ex-Hong Kong International Airport (Kai Tak). An extraction from the Hong Kong
Chart No. HK0802 is provided below,
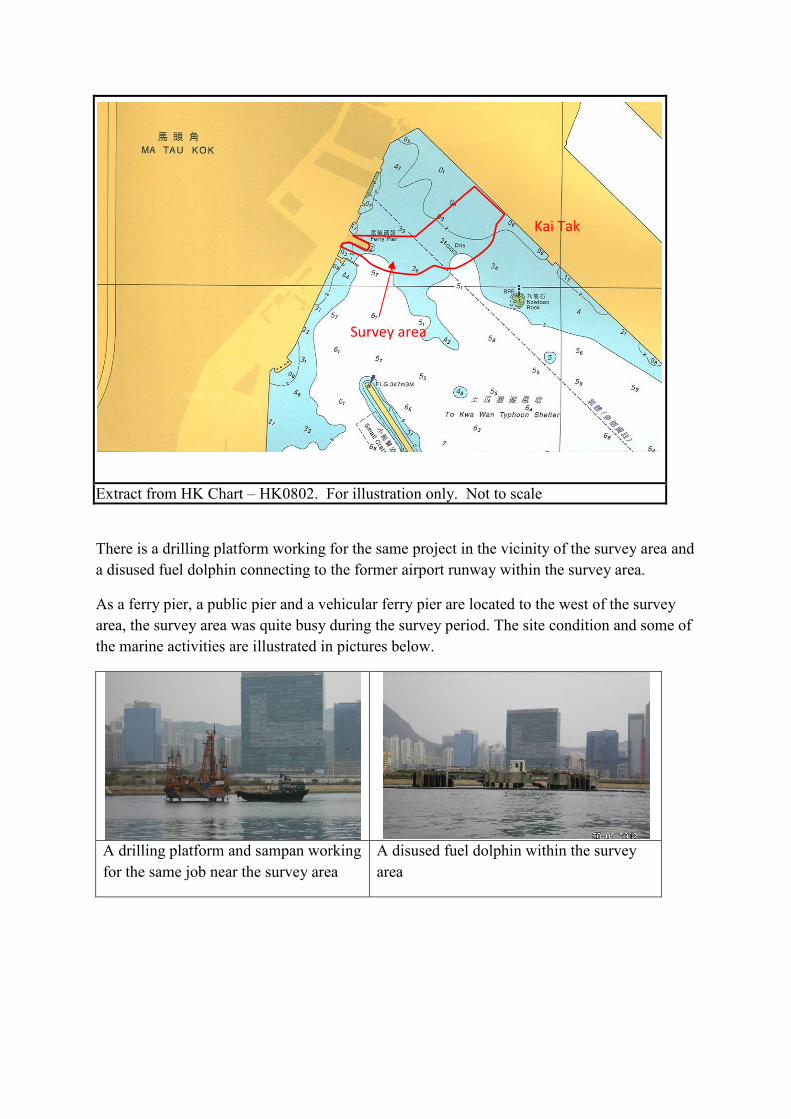
Extract from HK Chart – HK0802. For illustration only. Not to scale
There is a drilling platform working for the same project in the vicinity of the survey area and
a disused fuel dolphin connecting to the former airport runway within the survey area.
As a ferry pier, a public pier and a vehicular ferry pier are located to the west of the survey
area, the survey area was quite busy during the survey period. The site condition and some of
the marine activities are illustrated in pictures below.
A drilling platform and sampan working
for the same job near the survey area
A disused fuel dolphin within the survey
area
Survey area
Kai Tak

The disused fuel dolphin is enclosed by
its safety protection
A barge remained stationary to the north of
the survey area during the survey period
Boulders near seawall of Kai Tak Two ferries were berthed at the ferry pier
during survey period
First Ferry operates daily service
between North Point and Kowloon City
A sampan was berthed at the marker buoy
within survey area
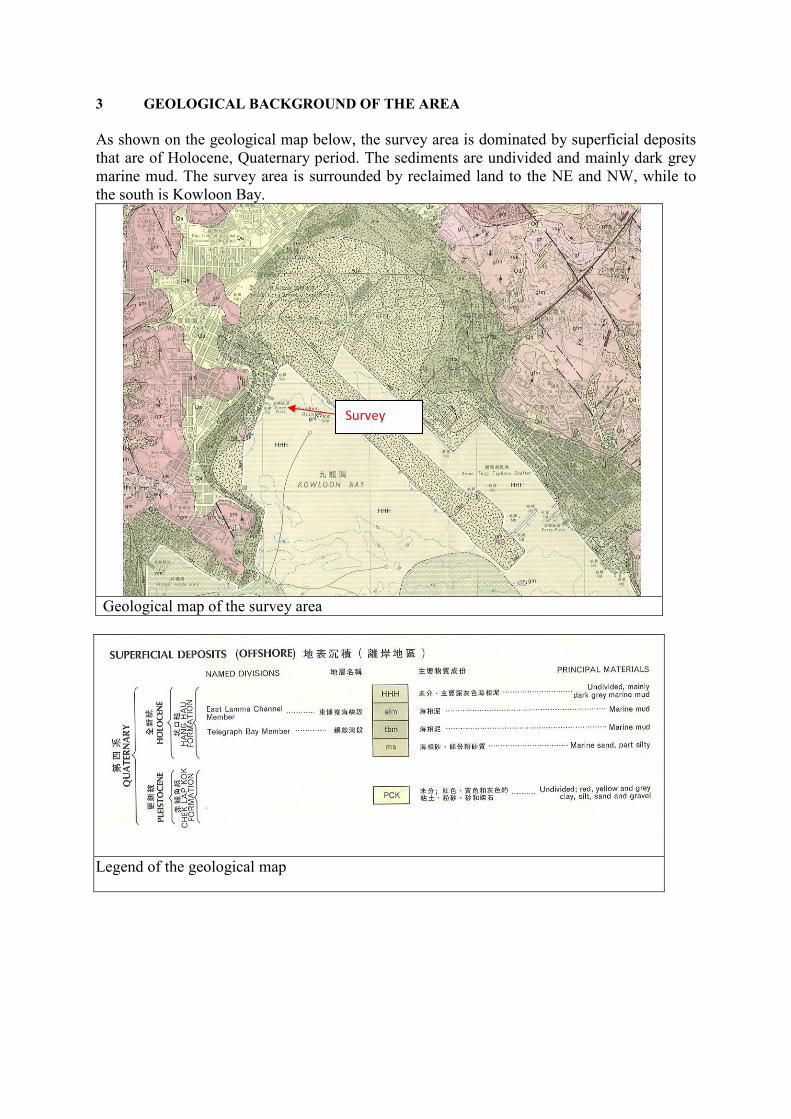
3 GEOLOGICAL BACKGROUND OF THE AREA
As shown on the geological map below, the survey area is dominated by superficial deposits
that are of Holocene, Quaternary period. The sediments are undivided and mainly dark grey
marine mud. The survey area is surrounded by reclaimed land to the NE and NW, while to
the south is Kowloon Bay.
Geological map of the survey area
Legend of the geological map
Survey
area
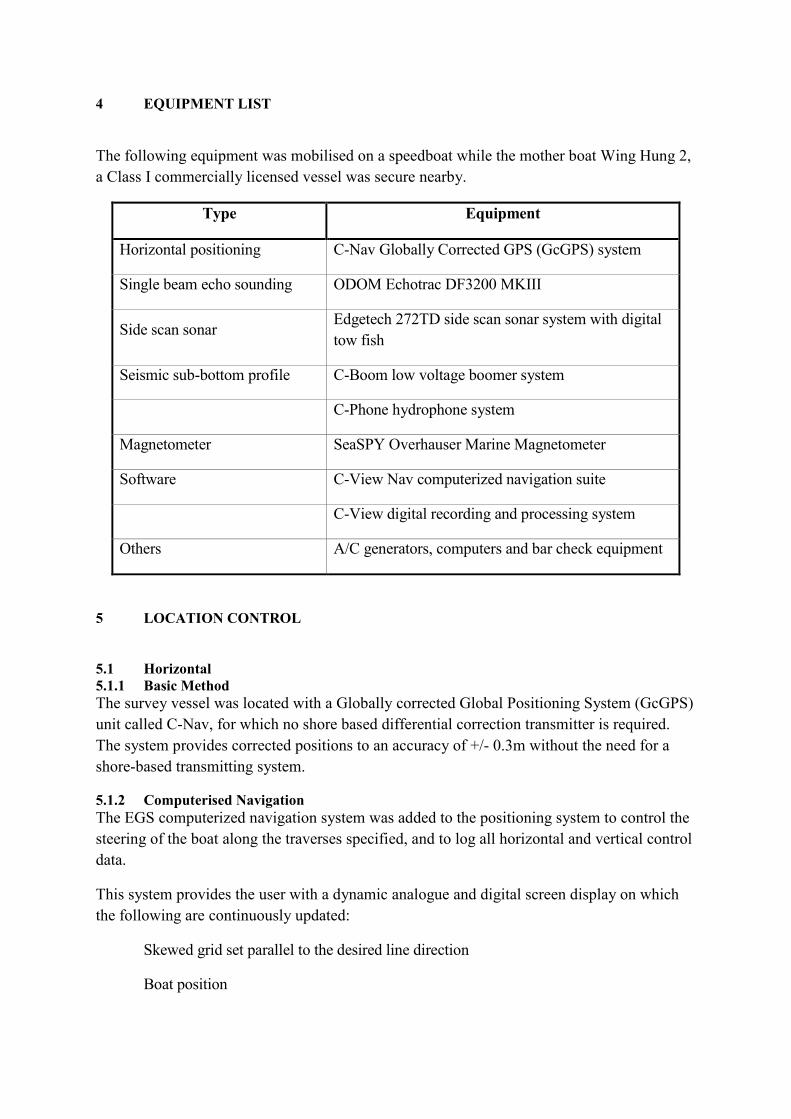
4 EQUIPMENT LIST
The following equipment was mobilised on a speedboat while the mother boat Wing Hung 2,
a Class I commercially licensed vessel was secure nearby.
Type Equipment
Horizontal positioning C-Nav Globally Corrected GPS (GcGPS) system
Single beam echo sounding ODOM Echotrac DF3200 MKIII
Side scan sonar Edgetech 272TD side scan sonar system with digital
tow fish
Seismic sub-bottom profile C-Boom low voltage boomer system
C-Phone hydrophone system
Magnetometer SeaSPY Overhauser Marine Magnetometer
Software C-View Nav computerized navigation suite
C-View digital recording and processing system
Others A/C generators, computers and bar check equipment
5 LOCATION CONTROL
5.1 Horizontal
5.1.1 Basic Method
The survey vessel was located with a Globally corrected Global Positioning System (GcGPS)
unit called C-Nav, for which no shore based differential correction transmitter is required.
The system provides corrected positions to an accuracy of +/- 0.3m without the need for a
shore-based transmitting system.
5.1.2 Computerised Navigation
The EGS computerized navigation system was added to the positioning system to control the
steering of the boat along the traverses specified, and to log all horizontal and vertical control
data.
This system provides the user with a dynamic analogue and digital screen display on which
the following are continuously updated:
Skewed grid set parallel to the desired line direction
Boat position
Water depth
Date and Time
GcGPS diagnostics enabling quality control
The information displayed for the assistance of the hydrographic surveyor includes, course,
speed, fixing status, and coordinates on the National Grid (in this case, the Hong Kong Metric
Grid), as well as a number of other user-defined options for marine surveying.
5.1.3 Calibration, Accuracy and Quality Assurance
The positioning system was calibrated by checking the co-ordinates displayed by the
navigation system at the previously co-ordinated point located at the Yau Ma Tei typhoon
shelter.
Carrying out the above quality assurance checking procedure ensured an accuracy of +/-1m
or better.
6 FIELD PROCEDURE
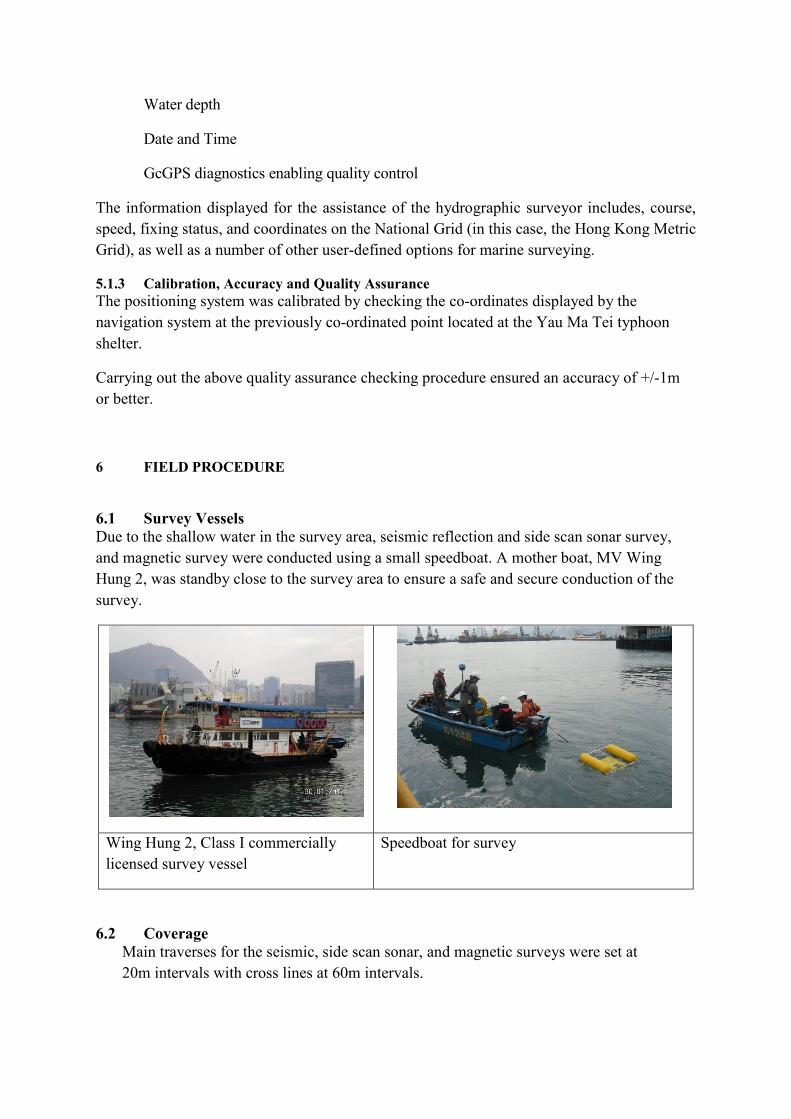
6.1 Survey Vessels
Due to the shallow water in the survey area, seismic reflection and side scan sonar survey,
and magnetic survey were conducted using a small speedboat. A mother boat, MV Wing
Hung 2, was standby close to the survey area to ensure a safe and secure conduction of the
survey.
Wing Hung 2, Class I commercially
licensed survey vessel
Speedboat for survey
6.2 Coverage
Main traverses for the seismic, side scan sonar, and magnetic surveys were set at
20m intervals with cross lines at 60m intervals.
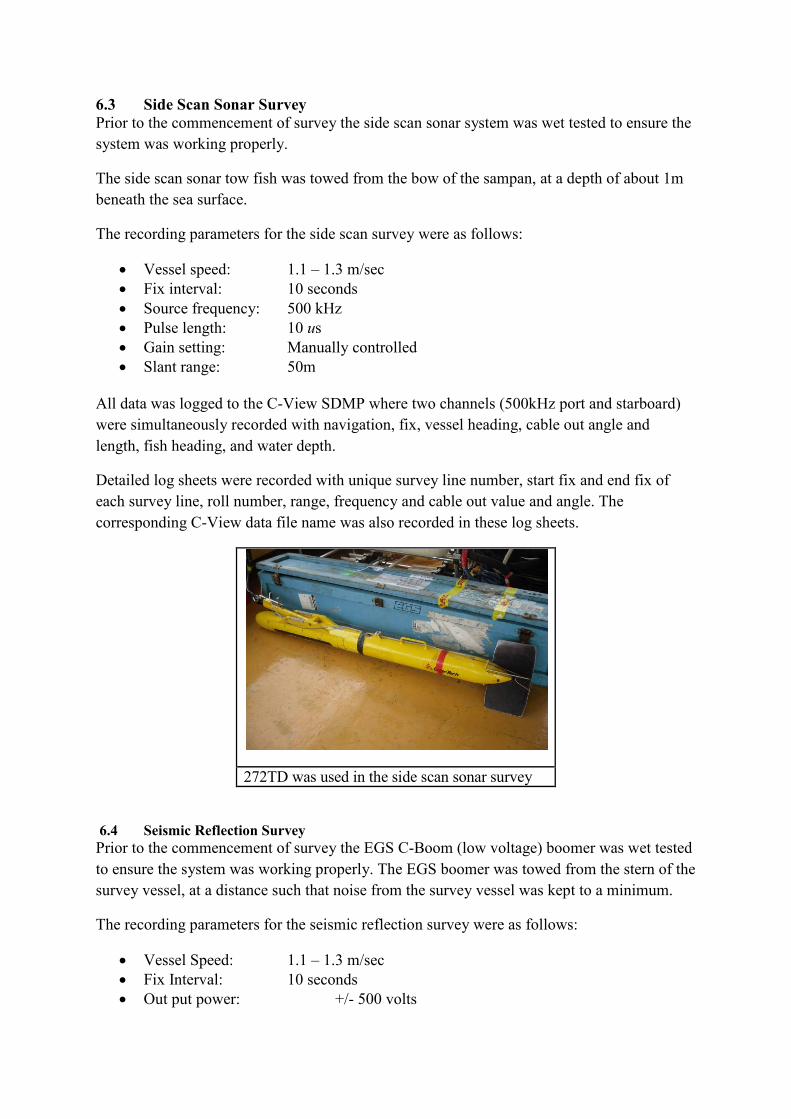
6.3 Side Scan Sonar Survey
Prior to the commencement of survey the side scan sonar system was wet tested to ensure the
system was working properly.
The side scan sonar tow fish was towed from the bow of the sampan, at a depth of about 1m
beneath the sea surface.
The recording parameters for the side scan survey were as follows:
• Vessel speed: 1.1 – 1.3 m/sec
• Fix interval: 10 seconds
• Source frequency: 500 kHz
• Pulse length: 10 us
• Gain setting: Manually controlled
• Slant range: 50m
All data was logged to the C-View SDMP where two channels (500kHz port and starboard)
were simultaneously recorded with navigation, fix, vessel heading, cable out angle and
length, fish heading, and water depth.
Detailed log sheets were recorded with unique survey line number, start fix and end fix of
each survey line, roll number, range, frequency and cable out value and angle. The
corresponding C-View data file name was also recorded in these log sheets.
272TD was used in the side scan sonar survey
6.4 Seismic Reflection Survey
Prior to the commencement of survey the EGS C-Boom (low voltage) boomer was wet tested
to ensure the system was working properly. The EGS boomer was towed from the stern of the
survey vessel, at a distance such that noise from the survey vessel was kept to a minimum.
The recording parameters for the seismic reflection survey were as follows:
• Vessel Speed: 1.1 – 1.3 m/sec
• Fix Interval: 10 seconds
• Out put power: +/- 500 volts

• Sweep: 250ms
• Delay: 0ms
• Gain setting: Manually controlled
6.5 The Magnetic Survey
A magnetic survey was conducted to locate any metal objects above or buried within the
seabed sediments. During the survey, the magnetometer transducer was towed astern of the
survey vessel. A depth sensor was attached to the magnetometer sensor and used to maintain
a sensor height above the seabed in the range 2m to 5m. In this case, the magnetometer
towfish was deployed at a distance of 20m at the stern of the survey vessel.
EGS has written software for the display of marine magnetic data in profile form on the PC
screen; there are two displays:
A large display within the range 100 to 500 nT
A smaller display to a scale of 10 times the above large display
It is necessary to monitor both displays as the data is collected, to be able to see the effects of
both large (regional) and small (local) anomalies.
The computer with C-NAV package for
navigation
The EGS boomer (left) and hydrophone
(right) were towed astern of the vessel for
sub-bottom seismic profiling

The marine magnetometer sensor
6.6 Site Safety
Safety was generally in accordance with the 'Marine Geophysical Operations Safety Manual'
(International Association of Geophysical Contractors, Ninth Edition, 2004).
In particular, site safety was assured by adopting the following measures:
All high voltage electrical devices were installed in steel containment boxes, and
operated well away from other site personnel.
Only Class I commercially licenced vessels were used, fitted with all prescribed safety
equipment.
The survey vessel was in contact with Port Control through the marine radio.
7 REDUCTION OF OBSERVATIONS AND INTERPRETATION
7.1 Side Scan Sonar Data
Processing and interpretation of side scan sonar data was carried out using the C-View
interpretation software. All features were individually marked or grouped into regions using
on- screen digitising. All offsets and laybacks were applied to the C-View system. The
subsequently generated interpretation files were then imported to the Auto CAD environment
on a line by line basis where the interpretation was reconciled and a detailed check was
performed.
The interpretation of the side scan sonar records in this area sought to quantify the following
elements and features on the seabed:
The interpretation of the side scan sonar records in this area sought to quantify the following elements
and features on the seabed:
• Indicators for the presence of intact or broken up shipwrecks
• Isolated objects which could have archaeological potential
• Areas of disturbed seabed attributed to anchored vessels
• Large area of debris or dumped materials
• Seafloor with pipeline/cable related scars
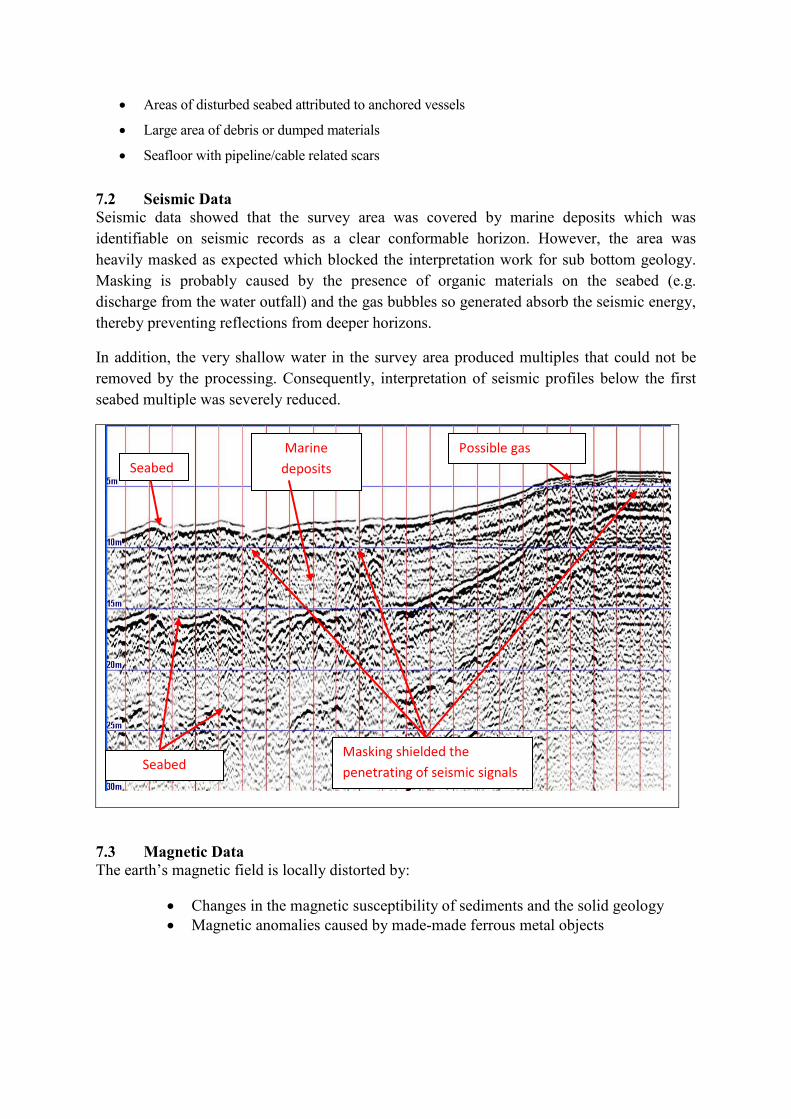
7.2 Seismic Data
Seismic data showed that the survey area was covered by marine deposits which was
identifiable on seismic records as a clear conformable horizon. However, the area was
heavily masked as expected which blocked the interpretation work for sub bottom geology.
Masking is probably caused by the presence of organic materials on the seabed (e.g.
discharge from the water outfall) and the gas bubbles so generated absorb the seismic energy,
thereby preventing reflections from deeper horizons.
In addition, the very shallow water in the survey area produced multiples that could not be
removed by the processing. Consequently, interpretation of seismic profiles below the first
seabed multiple was severely reduced.
7.3 Magnetic Data
The earth’s magnetic field is locally distorted by:
• Changes in the magnetic susceptibility of sediments and the solid geology
• Magnetic anomalies caused by made-made ferrous metal objects
Masking shielded the
penetrating of seismic signals
Marine
deposits Seabed
Possible gas
Seabed
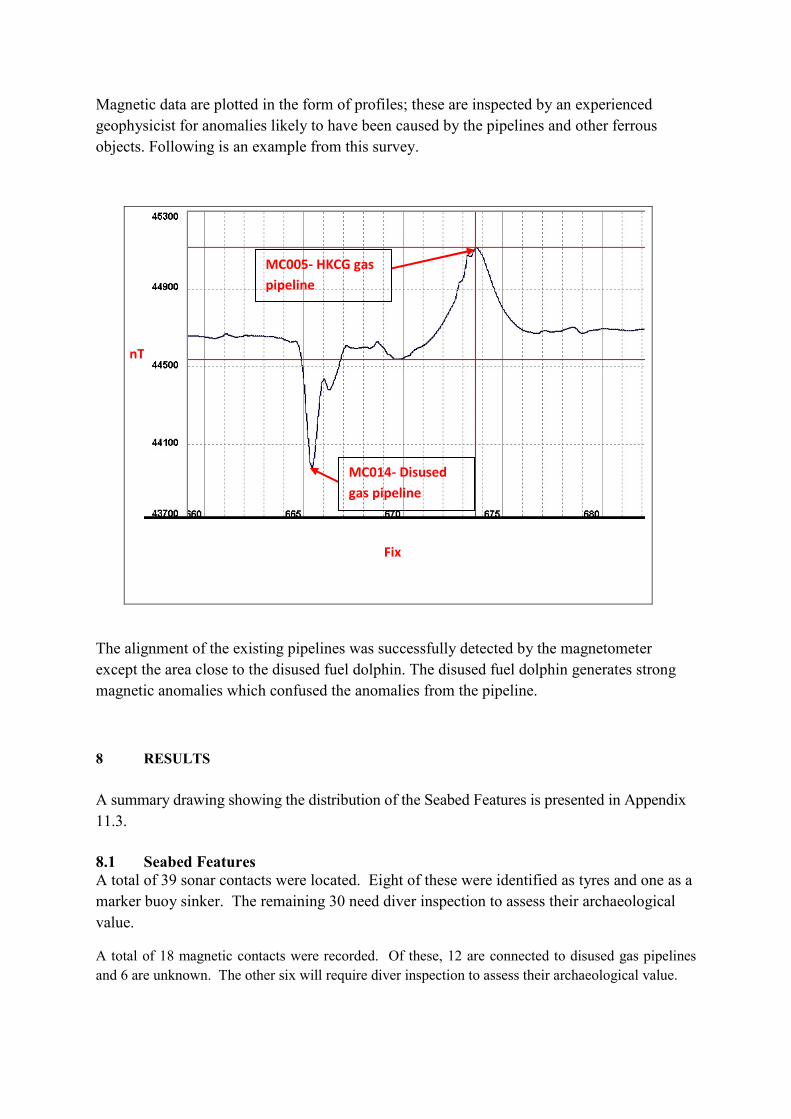
Magnetic data are plotted in the form of profiles; these are inspected by an experienced
geophysicist for anomalies likely to have been caused by the pipelines and other ferrous
objects. Following is an example from this survey.
The alignment of the existing pipelines was successfully detected by the magnetometer
except the area close to the disused fuel dolphin. The disused fuel dolphin generates strong
magnetic anomalies which confused the anomalies from the pipeline.
8 RESULTS
A summary drawing showing the distribution of the Seabed Features is presented in Appendix
11.3.
8.1 Seabed Features
A total of 39 sonar contacts were located. Eight of these were identified as tyres and one as a
marker buoy sinker. The remaining 30 need diver inspection to assess their archaeological
value.
A total of 18 magnetic contacts were recorded. Of these, 12 are connected to disused gas pipelines
and 6 are unknown. The other six will require diver inspection to assess their archaeological value.
Fix
MC014- Disused
gas pipeline
MC005- HKCG gas
pipeline
nT
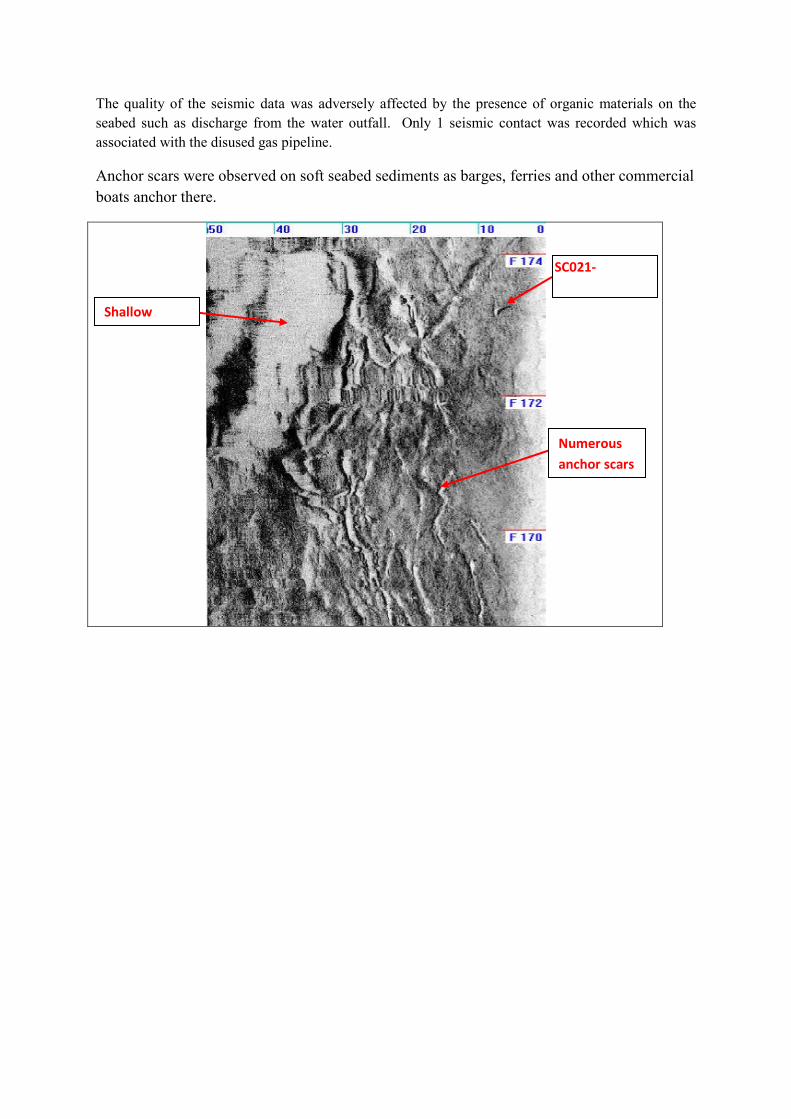
The quality of the seismic data was adversely affected by the presence of organic materials on the
seabed such as discharge from the water outfall. Only 1 seismic contact was recorded which was
associated with the disused gas pipeline.
Anchor scars were observed on soft seabed sediments as barges, ferries and other commercial
boats anchor there.
Numerous
anchor scars
Shallow
SC021-
Unknown object