apmp/tcri key comparison report of …i)-k1/...apmp/tcri key comparison report of measurement of air...
TRANSCRIPT

Metrologia 2013, 50, Tech. Suppl., 06011
1
APMP/TCRI Key Comparison Report of Measurement of Air Kerma for
60Co Gamma-Rays (APMP.RI(I)-K1)
K. J. Chune, D. J Butler
a, D. Webb
a, A. K. Mahant
b, A. Meghzifene
c, J. H. Lee
d, S. H. Hah
e,
T. B. Kadnif, Y. Zhang
g, T. Kurosawa
h, Z. L. M. Msimang
i, E. S. Caseria
j
a Australian Radiation Protection and Nuclear Safety Agency, Australia
b Bhabha Atomic Research Center, India
c International Atomic Energy Agency, Vienna
d Institute of Nuclear Energy Research, Taiwan
e Korea Research Institute of Standards and Science, Korea
f Malaysian Nuclear Agency, Malaysia
g National Institute of Metrology, P.R. China
h National Metrology Institute of Japan, Japan
i National Metrology Institute of South Africa, South Africa
j Philippine Nuclear Research Institute, Philippine
Corresponding author: Kook Jin Chun ( [email protected] )
Center for Ionizing Radiation, Division of Metrology for Quality of
Life, Korea Research Institute of Standards and Science,
Yuseong, Daejon City, Korea.

Metrologia 2013, 50, Tech. Suppl., 06011
2
Abstract
The APMP.RI(I)-K1 key comparison of the measurement standards of air kerma for 60
Co
gamma-rays was undertaken by the APMP/TCRI Dosimetry Working Group between 2004
and 2006, coordinated by the Korean Research Institute of Standards and Science (KRISS).
In total, 10 institutes took part in the comparison, among which 7 were APMP member
laboratories. Three Farmer-type commercial cavity chambers were used as transfer
chambers and circulated among the participants. All the participants carried out their
measurements according to the guidelines for the comparison established by the KRISS with
the cooperation of the ARPANSA. For each transfer chamber, an NMI calibration
coefficient was obtained and a ratio derived by dividing by the average result from the linking
laboratories, ARPANSA and NMIJ. The APMP comparison reference value for each chamber
was calculated as the mean of the NMI-determined calibration coefficients divided by the
average result from the linking laboratories. T he results showed that the maximum
difference between the APMP linked ratio of a participating NMI and the APMP reference
value was 1.76 %.
The measured ratios of the calibration coefficient BIPM NMI,R between the participating NMI
and the BIPM via the link laboratories for the transfer chambers were obtained. The maximum
expanded uncertainty of BIPM NMI,R for any participating laboratory was 2.0 %.
The degree of equivalence of each participating laboratory with respect to the key comparison
reference value was also evaluated. The expanded uncertainty of the difference between the
results ranged from 0.5 % to 1.2 %. The pair-wise degree of equivalence between each pair
of laboratories was also obtained and the largest difference of the expanded uncertainty of the
difference for any pair-wise degree of equivalence was within the expanded uncertainty of
the measurement for the pair of laboratories.
1. Introduction
The Ionizing Radiation Technical Committee (TCRI) of the Asia Pacific Metrology
Program (APMP) undertakes a program of dosimetry comparisons that is determined by its
Dosimetry Working Group. The Dosimetry Working Group has several comparison projects
that include the following five key comparisons:
Measurement of air kerma for 60
Co gamma-rays (APMP.RI(I)-K1)
Measurement of air kerma for low-energy x-rays (10 kV to 50 kV) (APMP.RI(I)-K2)
Measurement of air kerma for medium-energy x-rays (100 kV to 250 kV)

Metrologia 2013, 50, Tech. Suppl., 06011
3
(APMP.RI(I)-K3)
Measurement of absorbed dose to water for 60
Co gamma-rays (APMP.RI(I)-K4)
Measurement of air kerma for 137
Cs gamma-rays (APMP.RI(I)-K5)
This report presents the results of the regional comparison of standards for air kerma at 60
Co
carried out in 2004-5 (APMP.RI(I)-K1).
2. Plans for the APMP RI(I)-K1 key comparison
In 2001, the Korea Research Institute of Standards and Science (KRISS) was invited by
the TCRI chairperson to act as the coordinator of the APMP RI(I)-K1 key comparison
project and take the responsibility for planning and organizing the comparison programs for
the measurement of air kerma for 60
Co gamma-rays. Thus, in September 2002, the KRISS
drafted a guideline for the comparison and delivered it with a questionnaire to each member
laboratory to gauge their intentions with respect to this comparison. After several revisions of
the draft, the final guideline [1] was made with the agreement of the participating members
and the CCRI(I) by 16 August, 2004 and the comparison was initiated on 24 August, 2004 by
sending the transfer chambers to the NMIJ, Japan. The participating laboratories were seven
full members of the APMP, two associate members and one non-member of the APMP at the
time of the comparison. Table 1 gives more information on the participating laboratories
and the contact persons for this APMP.RI(I)-K1 key comparison.
2.1 Comparison methodology
The methods used in international comparisons for ionization radiation can be divided
into two types: direct comparisons (DC) and indirect comparisons (IC). Direct
comparisons mean that every participating laboratory brings its primary standard chamber to
a certain laboratory to participate in a measurement comparison. That is, every
participating laboratory performs the comparison in the same radiation fields using the same
environmental conditions and irradiation facilities. Indirect comparisons mean that all the
participating laboratories sequentially calibrate the same transfer chambers using similar
radiation fields. Considering that only four participants are primary dosimetry laboratories
and the rest are secondary dosimetry laboratories, it was not possible to have a direct
comparison. It was decided that this APMP.RI(I)-K1 key comparison be an indirect
comparison. A brief description of the comparison procedure [1] is as follows:
1) Transfer Chambers: Three Farmer-type chambers (two NE2571, one PTW30001).
2) The KRISS made the stability checks for the transfer chambers after each NMI finished its

Metrologia 2013, 50, Tech. Suppl., 06011
4
measurements.
3) Each NMI performed the measurements based on its status (either primary or secondary
standard laboratory).
4) Transfer chambers were passed to a participating NMI and returned to the KRISS after the
measurements were completed; the chambers were calibrated by the ARPANSA and the
NMIJ to obtain the ratio between each participating NMI and the BIPM, (NMI / BIPM).
The conditions of measurement for the transfer chambers were referenced to the calibration
conditions for the determination of air kerma rates for 60
Co gamma-rays at the BIPM. The
detailed measurement conditions are given in Table 2.
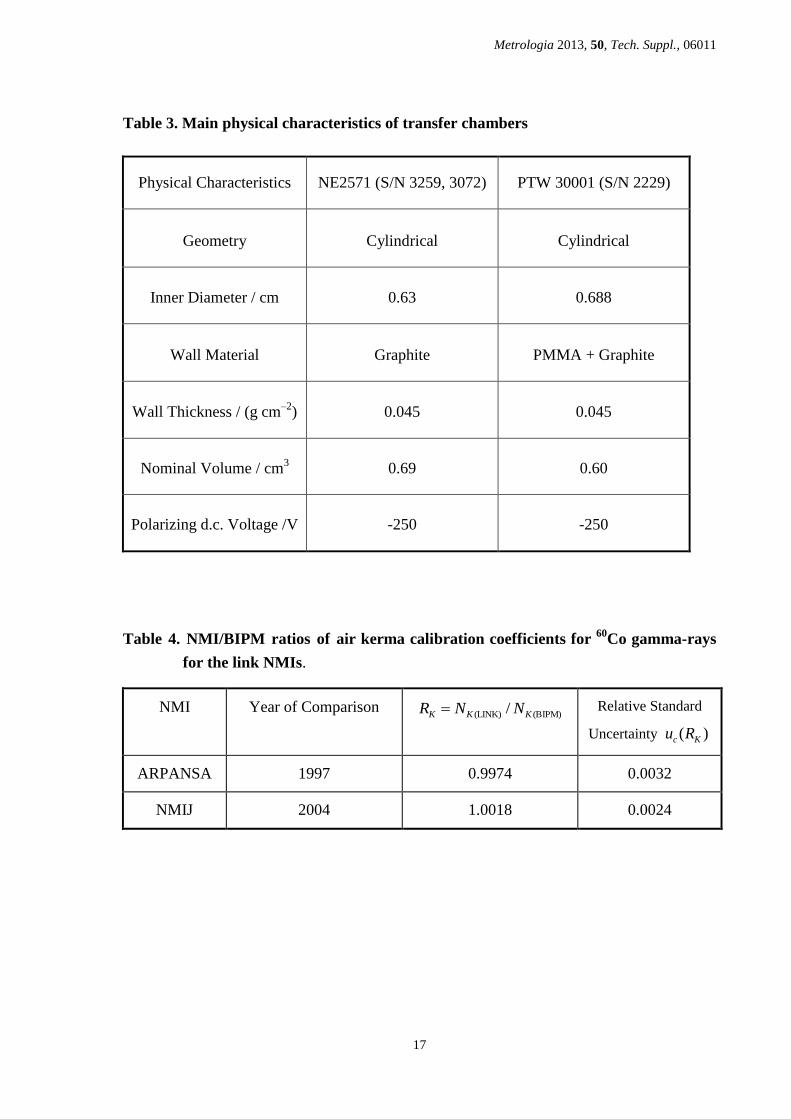
2.2 The transfer chambers used in the comparison
This comparison employed two NE2571 and one PTW30001 ionization chambers as
transfer chambers. The NE2571 chambers were donated by the ARPANSA and the INER
and one PTW30001 by the KRISS. These Farmer-type chambers are widely used in standards
laboratories and hospitals as transfer instruments for calibrations in terms of either air kerma
or absorbed dose to water. It was decided to circulate three transfer chambers with build-up
caps because a smaller uncertainty for the air kerma could be assigned by repeating the same
measurement with three instruments. Another reason was for redundancy in that if one
chamber changed during transport or handling, the remaining two could still be used. With
only two chambers, if one changes it may be difficult to have confidence in either result.
The characteristics of the transfer chambers are given in Table 3.
2.3 Schedule of the comparison
After discussions with all the participating laboratories, this comparison was scheduled
to begin in August 2004 and end in May 2006. Every laboratory was requested to finish its
calibrations within three weeks. In order to verify the stability and functioning of the
transfer chambers during the period of the comparison, every laboratory was required to
send these three chambers back to the KRISS for stability tests in 90
Sr/90
Y as soon as it
finished its calibrations 1. It took about a month for the round trip of these three transfer
chambers between the KRISS and each participating laboratory. The KRISS passed these
chambers onto the next laboratory for calibration when the stability tests were complete.

Metrologia 2013, 50, Tech. Suppl., 06011
5
2.4 Calibration certificate
All participating laboratories were expected to submit their calibration certificates, in
English, within a month of the calibrations. The content was to include at least the air
kerma calibration coefficients (mGy/nC) of the ionization chambers, air kerma rate of the
radiation field (mGy/s), calibration distance, field size at the calibration distance and the
expanded uncertainty (k = 2) of the calibration coefficients. Furthermore, it was required
that the relative humidity conditions at the time of calibration be stated on the certificate.
If the humidity of a participating laboratory at the time of measurement was not within the
range from 40 % to 70 %, a humidity correction would need to be applied [2].
2.5 Uncertainty estimation of the measurement
Each participating laboratory was required to estimate the percentage relative standard
uncertainty of their air kerma standard as outlined in the ISO document ‘Guide to the
Expression of Uncertainty in Measurement’, 2nd edition, 1995 [3]. As specified in this
document, all the contributing uncertainties were to be classified as either type A or type B
and their values tabulated. The Type A uncertainty is obtained by the statistical analysis of
series of observations; the Type B uncertainty is obtained by means other than the statistical
analysis of series of observations. In order to analyze the uncertainties and take correlation
into account for the BIPM KCDB degrees of equivalence, the BIPM recommended that the
participating laboratories submit their detailed uncertainty budgets to the pilot laboratory.
2.6 The final report of the comparison
When the comparison was completed, the KRISS combined all the measured calibration
coefficients NK(NMI) from the participating laboratories to obtain the APMP reference value
of the calibration coefficients ratios, whose expression is given as 10
10
1
Link) NMI,(i
KiR
, where
Link)() (NMI Link) NMI,( / KiKKi NNR are NMI ratios as given in the guideline [1]. This allowed the
production of a plot of the distribution of the measured calibration coefficients and the
production of a draft comparison report. The draft comparison report was sent to the
participating laboratories for confirmation of results and any additional comments. When
all participants had responded, the draft was further edited into a final report and submitted
to the APMP/TCRI chairperson. This report was accepted and the degrees of equivalence
were then calculated as presented in this report.

Metrologia 2013, 50, Tech. Suppl., 06011
6
3. Linking of the regional comparison to the BIPM key comparison
Two participating laboratories, the ARPANSA and the NMIJ, had participated in
comparisons previously with the BIPM for measurements of air kerma in 60
Co gamma-rays
and were used as “link laboratories” to link the APMP.RI(I)-K1 comparison with the
corresponding BIPM key comparison. According to the document published by the CCRI(I)
[6], a ratio is evaluated that represents the link between the participating NMI and the BIPM
and is given by
BIPM) LINK,(LINK) (NMI, BIPM) NMI,( KKK RRR , (1)
where
LINK)((NMI) LINK) NMI,( / KKK NNR is the ratio of the measurement value from a
participating NMI to the average for the two link laboratories
(BIPM)(LINK)BIPMLinkBIPM) LINK,( // KKK NNKKR is the average key comparison result
for the two link laboratories in the BIPM RI(I)-K1 key comparison
BIPM) (NMI,KR is the derived ratio of the participating laboratory and the BIPM.
The link laboratories, the ARPANSA (Australia) and the NMIJ (Japan), participated in a
comparison with the BIPM of 60
Co gamma-ray air kerma standards in 1997 4 and 2004
[5], respectively. The key comparison results of the ARPANSA and the NMIJ for the 60
Co
gamma-ray air kerma standards are given in Table 4. The ratio (BIPM)(LINK) / KK NN was
0.9974 for ARPANSA and 1.0018 for NMIJ, differing by 0.44 %. The average value of
these key comparison results was used as the linking ratio for this regional comparison.
Using these key comparison results in equation (1), the measurement results for each
participating laboratory could be linked to that of the BIPM. The results of the derived
ratios of the participating laboratory and the BIPM for this comparison via the link
laboratories are given in Table 7.
4. Results
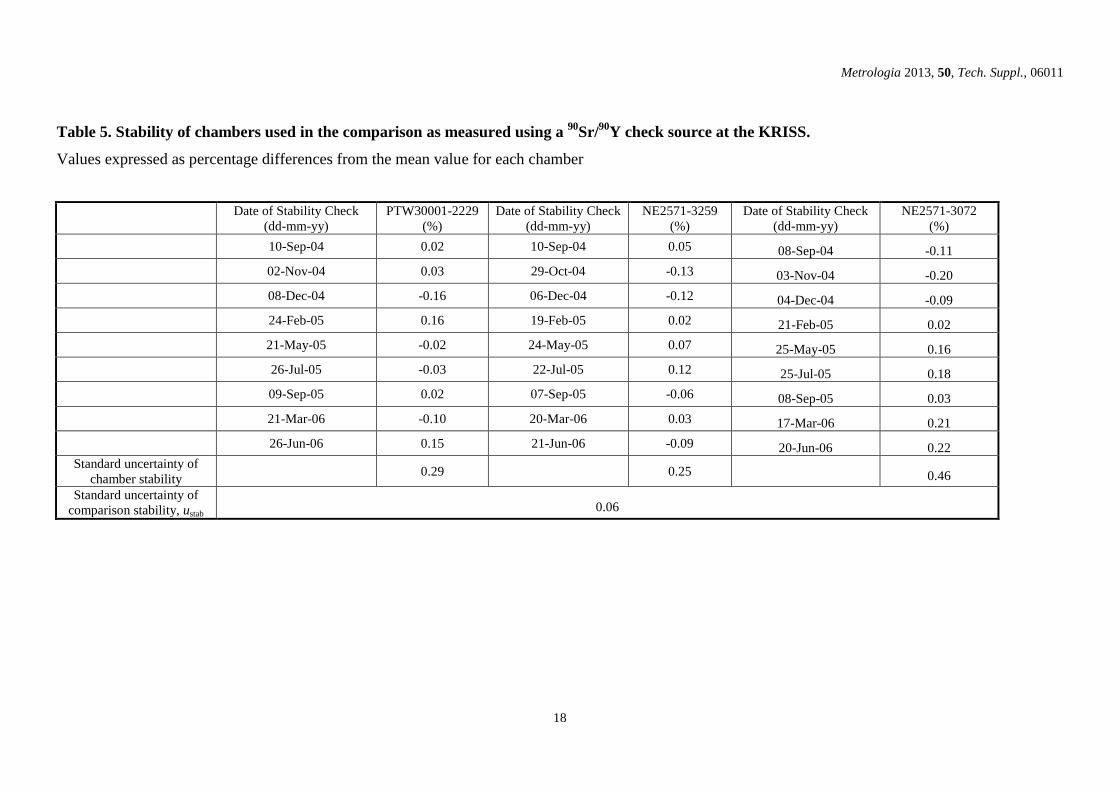
The results of transfer chamber stability tests made at the KRISS are given in Table 5 and
Figure 1, this stability being within the 0.23 % range. The final calibration results for the
transfer chambers are given in Tables 6 and 7. Figure 2 which was produced using the data
Metrologia 2013, 50, Tech. Suppl., 06011
7
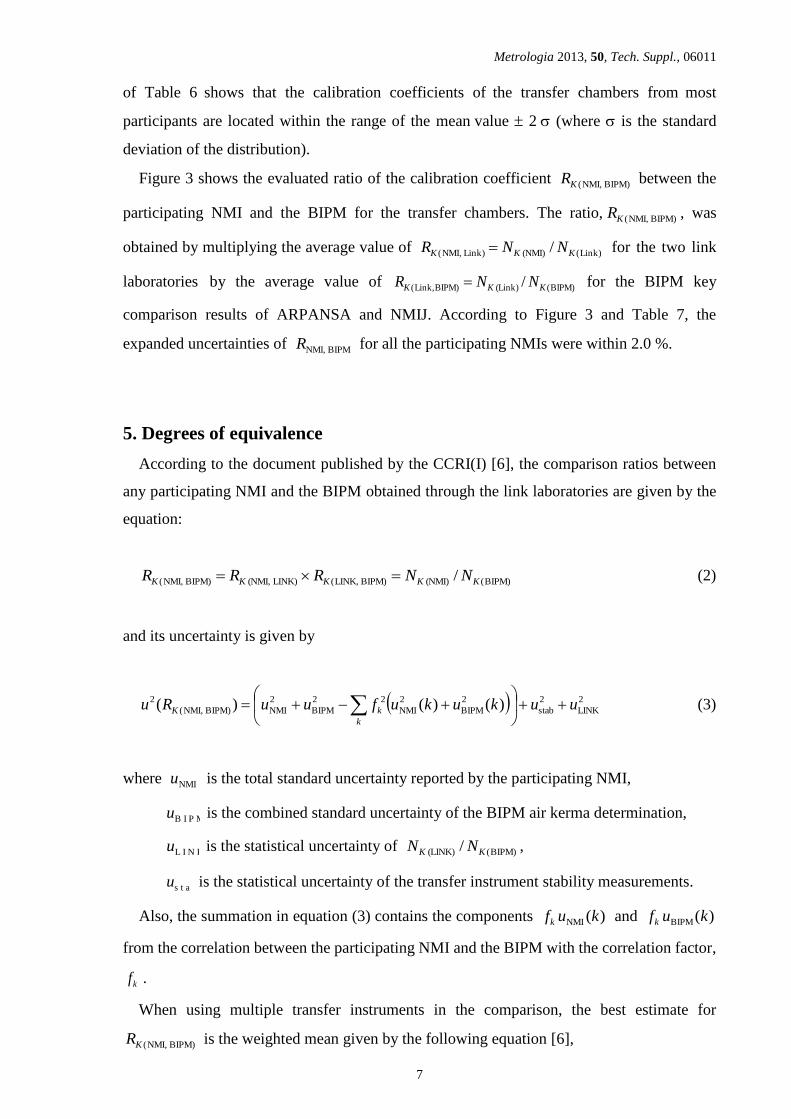
of Table 6 shows that the calibration coefficients of the transfer chambers from most
participants are located within the range of the mean value 2 (where is the standard
deviation of the distribution).
Figure 3 shows the evaluated ratio of the calibration coefficient BIPM) NMI,(KR between the
participating NMI and the BIPM for the transfer chambers. The ratio, BIPM) NMI,(KR , was
obtained by multiplying the average value of Link)((NMI) Link) NMI,( / KKK NNR for the two link
laboratories by the average value of BIPM)((Link) BIPM) Link,( / KKK NNR for the BIPM key
comparison results of ARPANSA and NMIJ. According to Figure 3 and Table 7, the
expanded uncertainties of BIPM NMI,R for all the participating NMIs were within 2.0 %.
5. Degrees of equivalence
According to the document published by the CCRI(I) [6], the comparison ratios between
any participating NMI and the BIPM obtained through the link laboratories are given by the
equation:
BIPM)((NMI) BIPM) LINK,(LINK) (NMI, BIPM) NMI,( / KKKKK NNRRR (2)
and its uncertainty is given by
2
LINK
2
stab
2
BIPM
2
NMI
22
BIPM
2
NMIBIPM) NMI,(
2 )()()( uukukufuuRuk
kK
(3)
where NMIu is the total standard uncertainty reported by the participating NMI,
B I P Mu is the combined standard uncertainty of the BIPM air kerma determination,
L I N Ku is the statistical uncertainty of BIPM)((LINK) / KK NN ,
s t a bu is the statistical uncertainty of the transfer instrument stability measurements.
Also, the summation in equation (3) contains the components )(NMI kufk and )(BIPM kufk
from the correlation between the participating NMI and the BIPM with the correlation factor,
kf .
When using multiple transfer instruments in the comparison, the best estimate for
BIPM) NMI,(KR is the weighted mean given by the following equation [6],

Metrologia 2013, 50, Tech. Suppl., 06011
8
n
n
K
Ku
uR
R2
n stab,
2
n stab,n BIPM),(NMI,
BIPM) NMI,(/1
/
(4)
and the combined standard uncertainty arising from the stability of the transfer chambers is
given as
n uu 2
n stab,
2
stab
11 (5)
The weighted mean value of the comparison ratio for each transfer chamber and thus the best
estimate for the three chambers, and its uncertainty, were estimated according to equations (4)
and (5), and the results are given in Table 9.
a) Degree of equivalence with respect to the key comparison reference value (KCRV)
The degree of equivalence for any NMI representing the consistency of the NMI with the
KCRV has two components. One component is the value of the difference Di between the
NMI result and the KCRV and the other is its uncertainty. Following the decision of the
CCRI to accept the BIPM air kerma determination as the reference value, the value of the
difference can be expressed by [6]
11BIPM), NMI( iiKi RRD , (6)
where the notation BIPM), NMI( iKi RR is adopted for laboratory i. The statistical uncertainty
associated with the KCRV, KCRVu is added to the comparison uncertainty iiK uRu )( NMI , to
give the relative combined uncertainty of the difference as
2/1 2
KCRV
2)( uuDu iii (7)
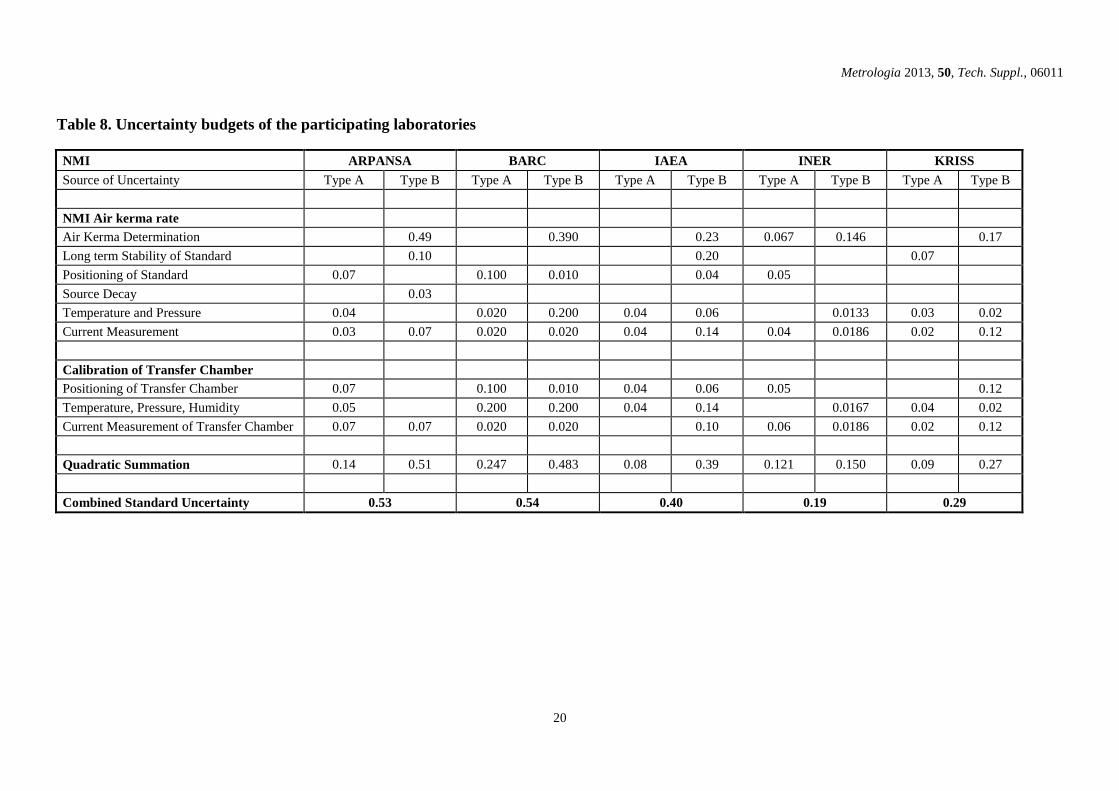
For the evaluation of the uncertainty, each laboratory submitted its uncertainty budget for
NMIu and these are summarized in Table 8. The uncertainty BIPMu given by the BIPM is
0.17 %. For the linking uncertainty LINKu in equation (3), the uncertainty of the linking
measurements is evaluated for each linking laboratory and the mean value taken. The
Metrologia 2013, 50, Tech. Suppl., 06011
9
components of LINKu are detailed in [6] and are essentially those associated with transfer
chamber positioning and ionization current measurements for the linking laboratory in both
the APMP and BIPM comparisons. The mean value for LINKu has been taken as 0.2 %.
There are several correlated quantities to be taken into consideration in this comparison.
Among the physical constants that enter into the determination of air kerma, the product of the
graphite to air stopping power ratio and the energy to create an ion pair is important because
all the NMIs with primary standards use the same value for this quantity. Therefore, this
quantity is fully correlated ( kf = 1) and the contribution of the quantity to the uncertainty is
0.11 %. The quantities such as the air to graphite mass-energy absorption coefficient ratio
and the loss of electron energy are also correlated. Unless the primary laboratory carried out
the evaluation of these physical constants by itself, these values are taken from the CCRI
agreed values and the uncertainties for these constants are 0.05 % and 0.02 %.
The correction factor for the humidity and the value of the dry air density are also fully
correlated because every laboratory takes these values from the reference data (ICRU 31).
The uncertainty for the humidity correction is 0.03 %, and 0.01 % for the air density.
The traceability of any participating secondary standard laboratory is also relevant. If a
secondary standard laboratory taking part in this comparison is traceable to the BIPM, the
uncertainty of the calibration coefficients obtained for the APMP comparison is fully
correlated with the BIPM uncertainty BIPMu of 0.17 %. Other quantities such as the wall
correction factor, the uniformity correction factor and the chamber volume are assumed to be
obtained by their experimental or theoretical evaluations and are not correlated.
In the comparison, three transfer chambers were sent to the participating laboratories with
regular return for the stability check at the pilot laboratory. The weighted mean for
BIPM) NMI,(KR varied from 0.9967 to 1.0146, as shown in Table 9, and 2
stabu is 0.06 %.
The relative combined uncertainty iu of the degree of equivalence with respect to the
KCRV was estimated by considering the above uncertainty components and the value ranged
from 0.2 % to 0.6 %. The expanded uncertainty of the difference Di for each participating
laboratory, )( 2 iii DuU was evaluated and the values for the degrees of equivalence for
each laboratory are given in Figure 4 and Table 10.

Metrologia 2013, 50, Tech. Suppl., 06011
10
b) Pair-wise degree of equivalence
For each pair of laboratories i and j, the pair-wise degree of equivalence is defined by the
difference [6],
jiij RRD (7)
and its uncertainty,
2
stab
222222
, 2)()( ukukufuuuk
jikjiji
(8)
where 2
iu and 2
ju are the uncertainties of NMI i and j and )(kuf ik and )(kuf jk are
correlated components between NMI i and j. The estimated relative combined uncertainty of
the pair-wise difference between any pair of the participating NMIs ranged from 0.28 % to
0.64 %. The value of pair-wise difference, ijD , and its expanded uncertainty, ijU , are given
in Table 10.
6. Conclusion
This comparison of the air kerma standards for 60
Co gamma-rays was the second dosimetry
comparison that was conducted in the Asia-Pacific region. The participating laboratories
consisted of seven APMP members, the IAEA, the NMISA (South Africa) and the PNRI
(Philippines) who was not a member of APMP when the measurements were performed.
Three Farmer-type ionization chambers (two NE2571 and one PTW30001) were used as
transfer chambers for the comparison and each laboratory was required to provide calibration
certificates and associated uncertainties for the chambers. The transfer chambers were sent
back to the KRISS for the stability check after the measurement was made at each NMI during
the comparison. The transfer chambers maintained their normal conditions during the
comparison showing stabilities within 0.23 %.
Two participating laboratories (ARPANSA and NMIJ) had made comparisons with the
BIPM for the 60
Co gamma-ray air kerma standards and acted as link laboratories. The
measurement results of the participating laboratories could be linked to the BIPM and
compared to the key comparison reference value of the BIPM through the link laboratories.

Metrologia 2013, 50, Tech. Suppl., 06011
11
The calibration coefficients of the transfer chambers were measured by each participating
laboratory and the distribution of the measurement results from most laboratories were
located within the range of the mean value 2 (standard deviation). The maximum
difference between the comparison ratios LINK) NMI,(KR of each NMI and the APMP reference
value for the transfer chambers (as given in Table 6) is 1.76 %.
The link ratios BIPM) (NMI,KR between the participating NMI and the BIPM for the transfer
chambers were obtained and the expanded uncertainties of BIPM) (NMI,KR for the participating
laboratory showed a variation from 0.74 % to about 1.9 %.
The degree of equivalence of each laboratory with respect to the KCRV was calculated.
The differences Di are generally smaller than the expanded uncertainty Ui for each
laboratory with the exception of the result from the PNRI which might indicate a problem
with the measurement in that laboratory. The pair-wise degree of equivalence between any
pair of laboratories was also obtained and the largest uncertainty of the pair-wise difference
was 1.3 %. Each participating laboratory in the comparison with the exception of the PNRI
demonstrated its measurement capability of 60
Co air kerma and achieved consistency with the
BIPM within the expanded uncertainties. The long-term measurement stability of the
transfer chambers, conducted by the KRISS, was always less than 0.5 % and so has no
significant effect on the uncertainties of pair-wise differences. Although each laboratory
could put more effort into improving their measurement capability for their 60
Co air kerma,
each has not only verified its own measurement capabilities but this comparison has also
strengthened the technical cooperation and exchange of ideas between all the participating
laboratories.
7. Table of abbreviations and full names of organizations
Abbreviation Full name
APMP Asia Pacific Metrology Program
ARPANSA Australian Radiation Protection and Nuclear Safety Agency
BARC Bhabha Atomic Research Centre, India
BIPM Bureau International des Poids et Mesures
CMC Calibration and Measurement Capabilities
IAEA International Atomic Energy Agency
INER Institute of Nuclear Energy Research, Taiwan
KCDB Key Comparison Database
KCRV Key Comparison Reference Value

Metrologia 2013, 50, Tech. Suppl., 06011
12
KRISS Korea Research Institute of Standards and Science
Nuclear Malaysia Malaysian Nuclear Agency
NE Nuclear Enterprise Co. Ltd.
NMIJ National Metrology Institute of Japan
NMISA National Metrology Institute of South Africa
NIM National Institute of Metrology, China
MRA Mutual Recognition Arrangement
PNRI Philippine Nuclear Research Institute
PTW Physikalisch-Technische Werkstätten Ltd.
TCRI Technical Committee on Ionizing Radiation (APMP)
8. Acknowledgement
The authors wish to record their sincere thanks Dr Carl Ross, National Research Council,
Canada, for reviewing the report and having helpful discussions with one of the authors, and
for his comments.
References
1 K. J. Chun et al., “Guideline for RMO Key comparison for Air kerma rate in 60
Co gamma
radiation”, KCDB (2004).
2 BOUTILLON M. ALLISY-ROBERTS P.J. and BURNS D.T., Measuring conditions
used for the calibration of ionization chambers at the BIPM, Rapport BIPM-01/04, 2001.
3 “Guide to The Expression of Uncertainty in Measurement,” International Organization
of Standards, Switzerland (1995).
4 P. J. Allisy-Roberts, M. Boutillon and J. F. Boas, R. B. Huntley, 1998, Comparison of
the standards for air kerma of the ARL and the BIPM 60
Co -rays, Rapport BIPM-98/4,
10 pp, BIPM.
5 P. J. Allisy-Roberts, D. T. Burns and N. Takata, Y. Koyama, T. Kurosawa, 2004,
Comparison of the standards for air kerma of the NMIJ and the BIPM 60
Co -rays,
Rapport BIPM-2004/11, 12 pp, BIPM.
[6] D. T. Burns and P. J. Allisy-Roberts, 2007, The evaluation of degrees of equivalence in
regional dosimetry comparisons, CCRI(I)/07-04, 3 pp, BIPM.
[7] P. J. Allisy-Roberts, D. T. Burns, C. Kessler, 2007, Summary of the BIPM.RI(I)-K1
comparison for air kerma in 60
Co gamma radiation, Metrologia, 2007, 44, Tech. Suppl.,
06006

Metrologia 2013, 50, Tech. Suppl., 06011
13
Figure 1. Stability of each transfer chamber
(a)
(b)
(c)
Stability of NE2571 (3259)
-0.5
-0.4
-0.3
-0.2
-0.1
0
0.1
0.2
0.3
0.4
0.5
08-01-04 12-01-04 04-01-05 08-01-05 12-01-05 04-01-06
Measurement Date (dd-mm-yy)
Dif
fere
nce
(%
)
Stability of NE2571 (3072)
-0.5
-0.4
-0.3
-0.2
-0.1
0
0.1
0.2
0.3
0.4
0.5
08-01-04 12-01-04 04-01-05 08-01-05 12-01-05 04-01-06
Measurement Date (dd-mm-yy)
Dif
fere
nce
(%
)
Stability of PTW30001 (2229)
-0.5
-0.4
-0.3
-0.2
-0.1
0
0.1
0.2
0.3
0.4
0.5
08-01-04 12-01-04 04-01-05 08-01-05 12-01-05 04-01-06
Measurement Date (dd-mm-yy)
Dif
fere
nce
(%
)

Metrologia 2013, 50, Tech. Suppl., 06011
14
Figure 2. The average values of the calibration coefficients and their distributions
(a) NE2571-3259: 41.680.40 mGy/nC
(b) NE2571-3072: 42.060.36 mGy/nC
(c) PTW 30001-2229: 49.740.58 mGy/nC
39.00
39.50
40.00
40.50
41.00
41.50
42.00
42.50
43.00
43.50
ARPANSA BARC IAEA INER KRISS Nuc.
Malaysia
NIM NMIJ NMISA PNRI
Ca
lib
ra
tio
n C
oeff
icie
nt
(mG
y/n
C)
National Metrology Institute
Comparison of Calibration Coefficient of NE2571 (3259)
39.50
40.00
40.50
41.00
41.50
42.00
42.50
43.00
43.50
44.00
ARPANSA BARC IAEA INER KRISS Nuc.
Malaysia
NIM NMIJ NMISA PNRI
Ca
lib
ra
tio
n C
oeff
icie
nt
(mG
y/n
C)
National Metrology Institute
Comparison of Calibration Coefficient of NE2571 (3072)
47.00
47.50
48.00
48.50
49.00
49.50
50.00
50.50
51.00
51.50
52.00
ARPANSA BARC IAEA INER KRISS Nuc.
Malaysia
NIM NMIJ NMISA PNRICa
lib
ra
tio
n C
oeff
icie
nt
(mG
y/n
C)
National Metrology Institute
Comparison of Calibration Coefficient of PTW 30001 (2229)
+2σ
-2σ
-2σ
+2σ
+2σ
-2σ

Metrologia 2013, 50, Tech. Suppl., 06011
15
Figure 3. BIPM) NMI,(KR of each NMI to the BIPM via the link laboratories for the three
transfer chambers (■: NE2571-3259, ▲: NE2571-3072 and ◆: PTW 30001-2229).
Figure 4. Degree of equivalence for the participating laboratories. The red points in the
graph represent the degrees of equivalence and uncertainties for the linking laboratories
reported in the KCDB.

Metrologia 2013, 50, Tech. Suppl., 06011
16
Table 1. Participating laboratories and their contact persons for APMP.RI(I)-K1 key
comparison
The traceability of the primary or secondary in each case is indicated.
Pa r t i c ip a t in g
L abo ra to r i e s C on t a ct Person s
S ta nda rd
T raceab i l i ty
ARPANSA, Australia Duncan Butler ARPANSA
BARC, India A. K. Mahant BIPM
IAEA Ahmed Meghzifene BIPM
INER, Taiwan Jeng-Hung Lee INER
KRISS, Korea Kook Jin Chun BIPM
Nuclear Malaysia, Malaysia Taiman Bin Kadni IAEA
NIM, China Yanli Zhang NIM
NMIJ, Japan Tadahiro Kurosawa NMIJ
NMISA, South Africa Zakithi LM Msimang BIPM
PNRI, Philippine Estrella S. Caseria IAEA
Table 2. Conditions of measurement for the determination of the air kerma calibration
coefficient
1. Beam Condition At SDD = 1 m with a size of 10 cm 10 cm in rectangular beam
or = 10 cm in circular beam.
2. Chamber Calibration The chambers were calibrated with the build-up cap in place.
3. Charge measurement Charge collected by the transfer chamber was measured using
the NMI’s electrometer.
4. Measurement Unit Measurement results were expressed in mGy/nC.
5. Experimental Conditions
a) Chamber Positioning
Axis of the chamber was in the reference plane at 1 m from
source. Chamber was oriented with the straight line inscribed
on the stem facing the source.
b) Collecting Voltage A collecting voltage of 250 V (negative polarity) was applied to
the outer shell of the chamber.
c) Ambient Conditions
Air temperature was required to be stable to better than
0.05 ℃. Measured current was normalized to T = 20 ℃ and p
= 101.325 kPa. Relative humidity was maintained between
40 % and 70 %.
d) Reproducibility of
Measurement
A set of at least ten measurements were taken for each
chamber.
Metrologia 2013, 50, Tech. Suppl., 06011
17
Table 3. Main physical characteristics of transfer chambers
Physical Characteristics NE2571 (S/N 3259, 3072) PTW 30001 (S/N 2229)
Geometry Cylindrical Cylindrical
Inner Diameter / cm 0.63 0.688
Wall Material Graphite PMMA + Graphite
Wall Thickness / (g cm–2
) 0.045 0.045
Nominal Volume / cm3 0.69 0.60
Polarizing d.c. Voltage /V -250 -250
Table 4. NMI/BIPM ratios of air kerma calibration coefficients for 60
Co gamma-rays
for the link NMIs.
NMI Year of Comparison (BIPM)(LINK) / KKK NNR Relative Standard
Uncertainty )( Kc Ru
ARPANSA 1997 0.9974 0.0032
NMIJ 2004 1.0018 0.0024
Metrologia 2013, 50, Tech. Suppl., 06011
18
Table 5. Stability of chambers used in the comparison as measured using a 90
Sr/90
Y check source at the KRISS.
Values expressed as percentage differences from the mean value for each chamber
Date of Stability Check
(dd-mm-yy)
PTW30001-2229
(%)
Date of Stability Check
(dd-mm-yy)
NE2571-3259
(%)
Date of Stability Check
(dd-mm-yy)
NE2571-3072
(%)
10-Sep-04 0.02 10-Sep-04 0.05 08-Sep-04 -0.11
02-Nov-04 0.03 29-Oct-04 -0.13 03-Nov-04 -0.20
08-Dec-04 -0.16 06-Dec-04 -0.12 04-Dec-04 -0.09
24-Feb-05 0.16 19-Feb-05 0.02 21-Feb-05 0.02
21-May-05 -0.02 24-May-05 0.07 25-May-05 0.16
26-Jul-05 -0.03 22-Jul-05 0.12 25-Jul-05 0.18
09-Sep-05 0.02 07-Sep-05 -0.06 08-Sep-05 0.03
21-Mar-06 -0.10 20-Mar-06 0.03 17-Mar-06 0.21
26-Jun-06 0.15 21-Jun-06 -0.09 20-Jun-06 0.22
Standard uncertainty of
chamber stability 0.29 0.25 0.46
Standard uncertainty of
comparison stability, ustab 0.06

Metrologia 2013, 50, Tech. Suppl., 06011
19
Table 6. The measured calibration coefficients (NMI) KN of three transfer chambers and
the APMP reference values for the APMP.RI(I)-K1 key comparison.
Participants Calibration coefficients / (Gy/nC) Combined
Standard
Uncertainty (%) NE2571(3259) NE2571(3072) PTW30001(2229)
ARPANSA 41.62 41.99 49.66 0.53
BARC 41.71 42.03 49.77 0.54
IAEA 41.52 41.93 49.57 0.40
INER 41.55 41.92 49.54 0.19
KRISS 41.62 41.99 49.64 0.29
Nuc. Malaysia 41.67 42.06 49.71 0.51
NIM 41.43 41.84 49.55 0.37
NMIJ 41.73 42.12 49.66 0.35
NMISA 41.72 42.17 49.71 0.46
PNRI 42.22 42.52 50.62 0.91
Average value of linked
NMIs: ave
Link)(KN 41.675 42.055 49.660 0.32
Average value of
NMIs: ave
(NMI) KN 41.679 42.057 49.743
APMP reference value
10
1
Link) NMI,(10
1
i
KiR 1.00010 1.00005 1.00167
Table 7. The comparison link ratios BIPM) NMI,(KR between any participating NMI and
the BIPM through the link laboratories (ARPANSA and NMIJ), and the
corresponding uncertainties.
Participants Calibration coefficient ratios Combined Standard
Uncertainty NE2571(3259) NE2571(3072) PTW 30001(2229)
ARPANSA 0.9983 0.9981 0.9996 0.62
BARC 1.0004 0.9990 1.0018 0.63
IAEA 0.9959 0.9966 0.9978 0.51
INER 0.9966 0.9964 0.9972 0.37
KRISS 0.9983 0.9981 0.9992 0.43
Nuc. Malaysia 0.9995 0.9997 1.0006 0.60
NIM 0.9937 0.9945 0.9974 0.49
NMIJ 1.0009 1.0011 0.9996 0.47
NMISA 1.0007 1.0023 1.0006 0.56
PNRI 1.0127 1.0107 1.0189 0.96
Metrologia 2013, 50, Tech. Suppl., 06011
20
Table 8. Uncertainty budgets of the participating laboratories
NMI ARPANSA BARC IAEA INER KRISS
Source of Uncertainty Type A Type B Type A Type B Type A Type B Type A Type B Type A Type B
NMI Air kerma rate
Air Kerma Determination 0.49 0.390 0.23 0.067 0.146 0.17
Long term Stability of Standard 0.10 0.20 0.07
Positioning of Standard 0.07 0.100 0.010 0.04 0.05
Source Decay 0.03
Temperature and Pressure 0.04 0.020 0.200 0.04 0.06 0.0133 0.03 0.02
Current Measurement 0.03 0.07 0.020 0.020 0.04 0.14 0.04 0.0186 0.02 0.12
Calibration of Transfer Chamber
Positioning of Transfer Chamber 0.07 0.100 0.010 0.04 0.06 0.05 0.12
Temperature, Pressure, Humidity 0.05 0.200 0.200 0.04 0.14 0.0167 0.04 0.02
Current Measurement of Transfer Chamber 0.07 0.07 0.020 0.020 0.10 0.06 0.0186 0.02 0.12
Quadratic Summation 0.14 0.51 0.247 0.483 0.08 0.39 0.121 0.150 0.09 0.27
Combined Standard Uncertainty 0.53 0.54 0.40 0.19 0.29

Metrologia 2013, 50, Tech. Suppl., 06011
21
NMI Nuclear Malaysia NIM NMIJ NMISA PNRI
Source of Uncertainty Type A Type B Type A Type B Type A Type B Type A Type B Type A Type B
NMI Air kerma rate
Air Kerma Determination 0.480 0.09 0.26 0.05 0.325 0.200 0.300
Long term Stability of Standard 0.100 0.18 0.250
Positioning of Standard 0.060 0.06 0.04 0.400
Source Decay 0.02
Temperature and Pressure 0.064 0.015 0.03 0.171 0.700
Current Measurement 0.020 0.040 0.08 0.04 0.01 0.01 0.02 0.200
Calibration of Transfer Chamber
Positioning of Transfer Chamber 0.060 0.06 0.05 0.231
Temperature, Pressure, Humidity 0.064 0.03 0.08 0.171 0.075
Current Measurement of Transfer Chamber 0.020 0.040 0.1 0.05 0.03 0.01 0.01 0.047 0.200
Quadratic Summation 0.028 0.509 0.253 0.271 0.06 0.34 0.022 0.463 0.047 0.909
Combined Standard Uncertainty 0.51 0.37 0.35 0.46 0.91

Metrologia 2013, 50, Tech. Suppl., 06011
22
Table 9. Values of the link ratio RK(NMI,BIPM) for individual transfer chambers and
the mean ratios unweighted and weighted by the stability of the chambers (ustab).
NMI BIPM) NMI,(KR
(PTW30001-2229)
BIPM) NMI,(KR
(NE2571-3259)
BIPM) NMI,(KR
(NE2571-3072)
Mean
BIPM) NMI,(KR
(Un-weighted)
Best Estimate for
BIPM) NMI,(KR
(Weighted Mean)
Standard Uncertainty of
BIPM) NMI,(KR
(Weighted Mean)
ARPANSA 0.9996 0.9983 0.9981 0.9986 0.9987 0.39 %
BARC 1.0018 1.0004 0.9990 1.0004 1.0007 0.38 %
IAEA 0.9978 0.9959 0.9966 0.9968 0.9967 0.32 %
INER 0.9972 0.9966 0.9964 0.9967 0.9968 0.27 %
KRISS 0.9992 0.9983 0.9981 0.9985 0.9986 0.28 %
Nuc. Malaysia 1.0006 0.9995 0.9997 0.9999 0.9999 0.37 %
NIM 0.9974 0.9937 0.9945 0.9952 0.9951 0.33 %
NMIJ 0.9996 1.0009 1.0011 1.0006 1.0005 0.32 %
NMISA 1.0006 1.0007 1.0023 1.0012 1.0009 0.35 %
PNRI 1.0189 1.0127 1.0107 1.0141 1.0146 0.57 %

Metrologia 2013, 50, Tech. Suppl., 06011
23
Table 10. Degree of equivalence of the participating NMIs with respect to KCRV and pair-wise degree of equivalence for each pair of NMIs.
NMI j
NMI i BIPM ARPANSA BARC IAEA INER KRISS
Di Ui
/(mGy/Gy)
Dij Uij
/(mGy/Gy)
Dij Uij
/(mGy/Gy)
Dij Uij
/(mGy/Gy)
Dij Uij
/(mGy/Gy)
Dij Uij
/(mGy/Gy)
ARPANSA -2.6 6.4 3.3 9.5 -0.7 8.6 -0.6 7.8 1.2 7.9
BARC 0.7 7.6 -3.3 9.5 -4.0 8.4 -3.9 7.6 -2.1 7.7
IAEA -3.3 6.4 0.7 8.6 4.0 8.4 0.1 6.4 1.9 6.5
INER -3.2 5.4 0.6 7.8 3.9 7.6 -0.1 6.4 1.8 5.6
KRISS -1.4 5.5 -1.2 7.9 2.1 7.7 -1.9 6.5 -1.8 5.6
Nuc. Malaysia -0.1 7.4 -2.5 9.3 0.8 9.1 -3.2 8.1 -3.1 7.3 -1.3 7.4
NIM -4.9 6.6 2.3 8.7 5.6 8.5 1.6 7.3 1.7 6.6 3.5 6.7
NMIJ 1.8 4.8 -4.4 8.6 -1.1 8.4 -5.1 7.2 -5.0 6.4 -3.2 6.5
NMISA 0.9 6.9 -3.5 9.0 -0.2 8.8 -4.2 7.7 -4.1 6.9 -2.3 7.0
PNRI 14.6 11.4 -17.2 12.7 -13.9 12.6 -17.9 12.1 -17.8 11.6 -16.0 11.4
Nuclear Malaysia NIM NMIJ NMISA PNRI
NMI Dij Uij
/(mGy/Gy)
Dij Uij
/(mGy/Gy)
Dij Uij
/(mGy/Gy)
Dij Uij
/(mGy/Gy)
Dij Uij
/(mGy/Gy)
ARPANSA 2.5 9.3 -2.3 8.7 4.4 8.6 3.5 9.0 17.2 12.7
BARC -0.8 9.1 -5.6 8.5 1.1 8.4 0.2 8.8 13.9 12.6
IAEA 3.2 8.1 -1.6 7.3 5.1 7.2 4.2 7.7 17.9 12.1
INER 3.1 7.3 -1.7 6.6 5.0 6.4 4.1 6.9 17.8 11.6
KRISS 1.3 7.4 -3.5 6.7 3.2 6.5 2.3 7.0 16.0 11.4
Nuc. Malaysia -4.8 8.2 1.9 8.1 1.0 8.5 14.7 12.6
NIM 4.8 8.2 6.7 7.4 5.8 7.8 19.5 12.2
NMIJ -1.9 8.1 -6.7 7.4 -0.9 7.7 12.8 12.1
NMISA -1.0 8.5 -5.8 7.8 0.9 7.7 13.7 12.2
PNRI -14.7 12.6 -19.5 12.2 -12.8 12.1 -13.7 12.2