api 5l x70 pipe joint heat-affected zone of gas metal arc
TRANSCRIPT

Page 1/25
Effect of the Interpass Temperature on SimulatedHeat-Affected Zone of Gas Metal Arc WeldedAPI 5L X70 Pipe JointPaulo Henrique Grossi Dornelas ( [email protected] )
Universidade Federal do Rio de JaneiroJoão da Cruz Payão Filho
Universidade Federal do Rio de JaneiroVictor Hugo Pereira Moraes e Oliveira
Universidade Federal do Rio de JaneiroDiogo de Oliveira Moraes
São José dos Campos – SP, BrazilPetrônio Zumpano Júnior
São José dos Campos – SP, Brazil
Research Article
Keywords: coarse grain heat-affected zone, intercritically reheated coarse-grain heat-affected zone, �niteelement method, thermodynamic simulation, physical simulation
Posted Date: September 3rd, 2021
DOI: https://doi.org/10.21203/rs.3.rs-864136/v1
License: This work is licensed under a Creative Commons Attribution 4.0 International License. Read Full License

Page 2/25
AbstractWelding costs associated with the laying of pipes for deepwater oil and gas extraction can be reducedusing high interpass temperatures (ITs). However, a high IT can decrease the mechanical properties of theheat-affected zone (HAZ) of welded joints. With the use of high strength-toughness stees, this decreasemay be an acceptable trade-off. Therefore, it is necessary to evaluate the in�uence of high ITs on theHAZ. The in�uence of the IT on the coarse grain HAZ (CGHAZ) and intercritically reheated coarse-grainHAZ (ICCGHAZ) of an API 5L X70 pipe joint welded by gas metal arc welding was investigated. Thewelding was numerically simulated using �nite element method software. The microstructure of the HAZwas predicted using thermodynamic simulation software. The CGHAZ and ICCGHAZ were also physicallysimulated and evaluated via optical microscopy and scanning electron microscopy, dilatometry, andVickers microhardness and Charpy V-notch (CVN) impact tests. The increase in IT led to a decrease inCGHAZ microhardness, but did not affect the ICCGHAZ. The CVN energies obtained for all ITs (CGHAZand ICCGHAZ) were higher than that set by the DNVGL-ST-F101 standard (50 J). These results show thatincreasing the IT is an interesting and effective method to reduce welding costs. In addition,thermodynamic simulation proved to be a valid method for predicting the phases in the HAZ of API 5LX70 pipe welded joints.
1. IntroductionTo strengthen their position in a highly competitive market, oil and gas companies have funded researchprojects aimed at developing solutions to reduce their process costs. The exploration of oil and gas inhigh-deep-water requires the use of longer rigid risers. These pipes are initially welded on support ships(~ US $650,000/day rent) and then laid by the J-lay method. One way to reduce the costs of installingpipes in deep water is to reduce the welding time. The reduction of the welding time can be achieved bydeveloping welding parameters, such as high heat input [1] and welding current [2]. However, this candecrease the hardness and impact toughness [3–4] of the heat-affected zone (HAZ) of high-strength low-alloy (HSLA) steels because of the formation of brittle regions, such as a coarse grain HAZ (CGHAZ) [5]and an intercritically reheated coarse-grain HAZ (ICCGHAZ) [6], which increase the risk of welded jointfailure [7].
Another method that has been studied is the use of a high welding interpass temperature (IT), whichreduces the time required for joint cooling, thus increasing productivity. Sirin et al. [8] observed thatintermittent welding (with interruptions for joint cooling) increased the fracture toughness of the weldedjoint by approximately 18% compared with a continuous process. They concluded that the IT directlyin�uenced the toughness of the HAZ of an API 5L X65 pipe. However, Neves and Loureiro [9] reported thata high IT reduces the HAZ fracture toughness, compromising the performance of the welded joint inservice. The increase in IT reduces the cooling rate of the welded joint owing to the lower temperaturegradient in the HAZ [10]. Shi and Han [11] reported a drop in the HAZ toughness owing to the amount ofmartensite-austenite (M-A) constituents formed at lower cooling rates. Dornelas et al. [12] observed thatthe increase in the IT signi�cantly changed in the microstructure, and consequently decreased the CGHAZ

Page 3/25
hardness and fracture toughness of a Cr-Mo low-alloy steel. On the other hand, Wang et al. [13] reportedan improvement in the HAZ toughness due to an increase in IT between 80°C and 130°C; however, a dropwas observed when the IT increased beyond 130°C. Therefore, the use of a higher IT seems to be criticalin alloys sensitive to the cooling rate, justifying its control to ensure good fracture toughness. Steels withhigh fracture toughness may lose some of their properties without compromising their performanceduring service, thus reducing production costs. Thus, it is necessary to study the in�uence of an increasein IT on the CGHAZ and ICCHAZ of these alloys.
In welding with different parameters from those speci�ed by the welding procedure (e.g., higher IT), it isnecessary to perform a series of tests to evaluate the mechanical behavior of the welded joint, followedby a requali�cation of the new parameters, which is expensive. In this case, computer simulations of thewelding process and thermodynamic simulations can be used to predict the HAZ thermal cycles andmicrostructures under different welding conditions (e.g., IT); this speed up the analysis and makes it lessexpensive. Computer simulations of welding (�nite element method, FEM) [14–18] and thermodynamics(Calphad method) [12, 19–20] have developed in recent years.
To reduce welding costs, this paper examines the effects of welding at IT ≥ 300°C on the microstructuresand impact toughness of the simulated CGHAZ and ICCGHAZ of a high strength-toughness API 5L X70pipe. The welding thermal cycles of the CGHAZ and ICCGHAZ were simulated using a commercial FEMsoftware. Then, the CGHAZ and ICCGHAZ were evaluated by optical microscopy (OM), scanning electronmicroscopy (SEM), and Vickers microhardness and Charpy V-notch (CVN) impact tests. The simulatedwelding thermal cycles were also reproduced in dilatometry tests. A commercial thermodynamicsimulation software (Calphad method) was used to predict the CGHAZ and ICCGHAZ microstructures. Acomparative study was performed to evaluate the accuracy of the predictions.
2. Materials And Methods
2.1. MaterialsA hot-rolled (seamless, Mannesmann process) HSLA API 5L X70 pipe with a ferritic microstructure (Fig. 1)was welded in this work. Table 1 lists the chemical compositions (wt. %) of the pipe and weld metal.Table 2 lists the mechanical properties of the pipe. The carbon equivalent (CEIIW) was calculated fromEq. 1.

Page 4/25
Table 1Chemical compositions (wt. %) of the API 5L X70 pipe
and weld metal analyzed by optical emissionspectroscopy, and the carbon equivalent (CEIIW) of the
API 5L X70 pipe.Chemical element Material
API 5L X70 pipe Weld metal
C 0.019 0.071
Mn 1.397 1.430
Si 0.254 0.710
P 0.010 0.015
S 0.002 0.011
Cr 0.023 0.048
Mo 0.057 0.017
Ni 0.148 0.027
Nb + V + Ti 0.080 < 0.012
Al 0.028 0.004
Cu 0.475 0.106
CEIIW 0.32
1
Table 2Mechanical properties of the API 5L X70 pipe and weld metal.
Mechanical property Pipe Weld metal
(speci�ed)
Ultimate tensile strength, UTS [MPa] 575 583
Yield strength, YS [MPa] 540 483
Elongation, El. [%] 61 26
Charpy V-notch impact energy (at − 30 °C), CVN [J] 293
Vickers microhardness, HV1 193
CEIIW = C + + +Mn
6
(Cr + Mo + V)
5
(Cu + Ni)
15

Page 5/25
2.2. Gas metal arc weldingThe API 5L X70 pipe was gas metal arc girth welded to obtain the data to be used as input in thenumerical simulation and to perform its validation. Table 3 presents the parameters adopted for gasmetal arc welding. Figure 2 shows the groove con�guration and a schematic of the weld passesperformed.
Table 3
Parameters adopted in the gas metal arc welding of the API 5L X70 pipe.Parameter Welding pass
Root Hot Fill Cap
Arc voltage, U [V] 13–19 25–31 25–31 14–22
Welding current, I [A] 132–180 239–337 239–298 126–220
Welding speed, WS [cm . min− 1] 22–30 34–42 32–47 35–44
Heat input, HI [kJ . mm− 1] 0.6–1.0 1.0–1.6 0.9–1.4 0.3–0.7
Welding current type and polarity DC +
Welding position 2G
Filler metal AWS A5.18 ER70S-6
Shielding gas type 80% Ar + 20% CO2
Shielding gas �ow rate [L . min− 1] 20–33
Preheating temperature, To [°C] 90
Interpass temperature, IT [°C] 245
2.3. Welding modelingTo describe the HAZ thermal cycles, the physical welding thermal cycle simulators used simpli�edanalytical models such as Rosenthal [21] and Rykalin 2D [22]. These models simpli�ed some factors; forexample, the physical properties are temperature-independent, the metals are solid during welding, nosolid phase transformation occurs, there is no heat loss by radiation and convection, and the heat sourcehas zero volume (point or line) [23]. However, these simpli�cations lead to errors in the HAZ thermal cyclesimulation. Numerical simulation methods (e.g., FEM) have been used to overcome these limitations andmake the physical simulation more realistic [24–25]. The commercial FEM software Sysweld® was usedto accurately describe the CGHAZ and ICCGHAZ thermal cycles. The weld metal elements were simulatedusing the birth and death technique. The procedures for executing, documenting, and validating thewelding simulations followed the ISO 18166 standard.

Page 6/25
The welding was modeled using the principle of energy conservation [26]. The fundamental equation ofheat conduction in multiphase solids is expressed as Eq. 2, where the temperature distribution (T) is afunction of the time (t) and position (x, y, z). k is the thermal conductivity, cp is the speci�c heat, ρ is the
density, T is the temperature distribution, P is the phase proportion, and is the heat generated pervolume. i and j are phases indexes, Aij is the proportion of phase transformation per unit time, and Lij(T) isthe latent heat of the phase transformation. cp, k, and ρ (Table 4) are obtained from the chemical
composition-based thermodynamic simulation of the pipe using the JMatPro® software. The sameproperties were used for the base and weld metals during the simulation because their chemicalcompositions were similar.
$$\frac{\partial }{\partial x}\left(\left(\sum _{i}{P\left(T\right)}_{i}{k\left(T\right)}_{i}\right)\frac{\partial T}{\partial x}\right)+\frac{\partial }{\partial y}\left(\left(\sum _{i}{P\left(T\right)}_{i}{k\left(T\right)}_{i}\right)\frac{\partial T}{\partial y}\right)+\frac{\partial }{\partial z}\left(\left(\sum _{i}{P\left(T\right)}_{i}{k\left(T\right)}_{i}\right)\frac{\partial T}{\partial z}\right)+\dot{Q}-\sum _{icript>$$2,
˙

Page 7/25
Table 4Density (ρ), thermal conductivity (k), and speci�c heat (cp) of the HSLA API 5L
X70 pipe at a constant pressure and various temperatures (T).Temperature, T
[°C]
Density, ρ
[g∙. cm− 3]
Thermal conductivity, k
[W. (m∙. k)−1]
Speci�c heat, cp
[J. (g∙. K)−1]
2000 6.58 42.92 0.82
1900 6.67 41.07 0.82
1800 6.75 39.23 0.82
1700 6.84 37.38 0.82
1600 6.92 35.54 0.82
1500 7.25 35.45 0.73
1400 7.33 34.33 0.69
1300 7.38 33.11 0.67
1200 7.44 31.89 0.66
1100 7.49 30.66 0.64
1000 7.55 29.45 0.63
900 7.60 28.23 0.61
800 7.59 30.38 0.96
700 7.61 32.81 0.98
600 7.64 35.01 0.82
500 7.68 37.54 0.69
400 7.72 40.03 0.62
300 7.75 42.03 0.56
200 7.78 43.15 0.52
100 7.82 43.10 0.48
25 7.84 42.21 0.45
The initial condition of the model assumed an IT of 245°C at 25 mm away from the groove (a commonmeasurement location in welding). The IT is heterogeneous in the joint owing to the localized heatinginduced by the electric arc [27]; hence, the model considers the temperature distribution as the initialcondition. The boundary condition considers the heat �ow due to convection and radiation in the weldedjoint according to Eq. 3, where q is the energy supplied by the heat source, ε is the emissivity coe�cient

Page 8/25
(0.8), σ is the Stefan–Boltzmann constant (5.6704∙10− 8 Wm− 2K− 4), T0 is the room temperature (20°C),
and h is the convective heat transfer coe�cient (25 Wm− 2K− 4). The latent heat of the phasetransformation is also considered.
3,The moving Goldak double-ellipsoid model [28] was adopted to represent the welding heat source. Thismodel is a combination of two ellipsoids, one in front and the other at the rear, as described by Eq. 4. a, b,and ci are the semi-axes of the double ellipsoid (Table 5); ν, qi, and t are the welding speed (Table 3),power density distribution in the double ellipsoid, and time, respectively. U is the electric arc voltage, η isthe thermal e�ciency of welding (0.86), and I is the welding current (Table 3). r and f are the rear andfront quadrants of the Goldak double ellipsoid; ff and fr are the fractions of the heat at the rear (fr,Table 5) and front (ff = 2 − fr), respectively. Table 5 presents the dimensions of Goldak's heat source (I andII) used to simulate the weld passes 7–8 (I) and 5–6 (II). Figure 2 shows the weld pass numbers 5–8.
4
Table 5Goldak's heat source parameters.
Heat source a b cf cr ff
I 3.50 2.50 6.00 6.00 1.09
II 3.00 1.00 1.15 3.85 1.20
The accuracy of an FEM model is in�uenced by the mesh density used in the physical analysis. Thus, it isnecessary to perform mesh re�nement in the study regions (CGHAZ and ICCGHAZ) because theyexperienced severe temperature gradients during welding. The adequate meshing for the problem wasbased on the literature [29] and the authors’ simulation experience. Figure. 3 presents the FEM modelmesh and a macrograph of the welded joint. Figure. 4 shows the thermal pro�le during the weldingsimulation of the sixth pass (forming a CGHAZ – left) and the eighth pass (forming a CGHAZ andICCGHAZ – right). The ICCGHAZ was formed because of the intercritical reheating (900–773°C) of theprevious CGHAZ.
2.4. Physical simulation of the CGHAZ and ICCGHAZ
− + + = − 4 − 40 − ( − 0)
∂
∂
∂
∂
∂
∂
( , , , ) = −3 − 3 − 3 , =6√3
√
2
2
2
2
( − )2
2
Page 9/25
The simulated CGHAZ and ICCGHAZ welding thermal cycles (Sect. 3.1) were reproduced in the specimensusing a Gleeble® 3800 physical simulator. The specimens (11 mm × 11 mm × 80 mm) were removedalong the longitudinal direction of the pipe. After the physical simulation, these were subjected tomicroscopy, Vickers microhardness measurements, and Charpy V-notch impact testing.
2.5. Thermodynamic simulationThermodynamic simulation was performed using the JMatPro® software to obtain the physicalproperties of the API 5L X70 pipe (Table 4) and the continuous cooling transformation (CCT) diagram(Fig. 5). To predict the microstructures, simulations of the phase contents during cooling for all ITs(CGHAZ and ICCGHAZ) using the average cooling rate as the input data were performed. The averagecooling rate was calculated as 1350–300°C (CGHAZ) for IT = 300, 350, 400, and 425°C (9, 4.6, 2.9, and2.6°C/s, respectively) from the simulated thermal welding cycles (Sect. 3.1). For the ICCGHAZ, theaverage cooling rate was similar for all conditions (1°C/s, owing to the lower peak temperature, 850°C);hence, only a single simulation was performed for all ITs. All the previously mentioned simulations werebased on the chemical composition of the base metal (Table 1).
2.6. DilatometryDilatometry tests were performed using the CGHAZ and ICCGHAZ simulated welding thermal cycles(Sect. 3.1) in a Gleeble 3800 physical simulator. The well-known tangent method [30] was applied todetermine the phase formation starting temperatures during cooling.
2.7. Microstructural characterizationThe physically simulated specimens were microstructurally characterized by OM (Zeiss Axio ImagerM2m) and SEM (Tescan VEJA 3). The OM and SEM specimens were ground (sandpaper from 100 to1200 grade), polished (diamond paste from 3 to 1 µm), and etched with 2% nital followed by 2% picralsolutions.
2.8. Mechanical testingFull-size CVN impact testing was performed using a JBW-300 pendulum impact tester at -30°C, inaccordance with ASTM A370. The microhardness test was performed using an HV-1000 Digimethardness tester with a load of 1 kgf, in accordance with ASTM E92.
3. Results And Discussion
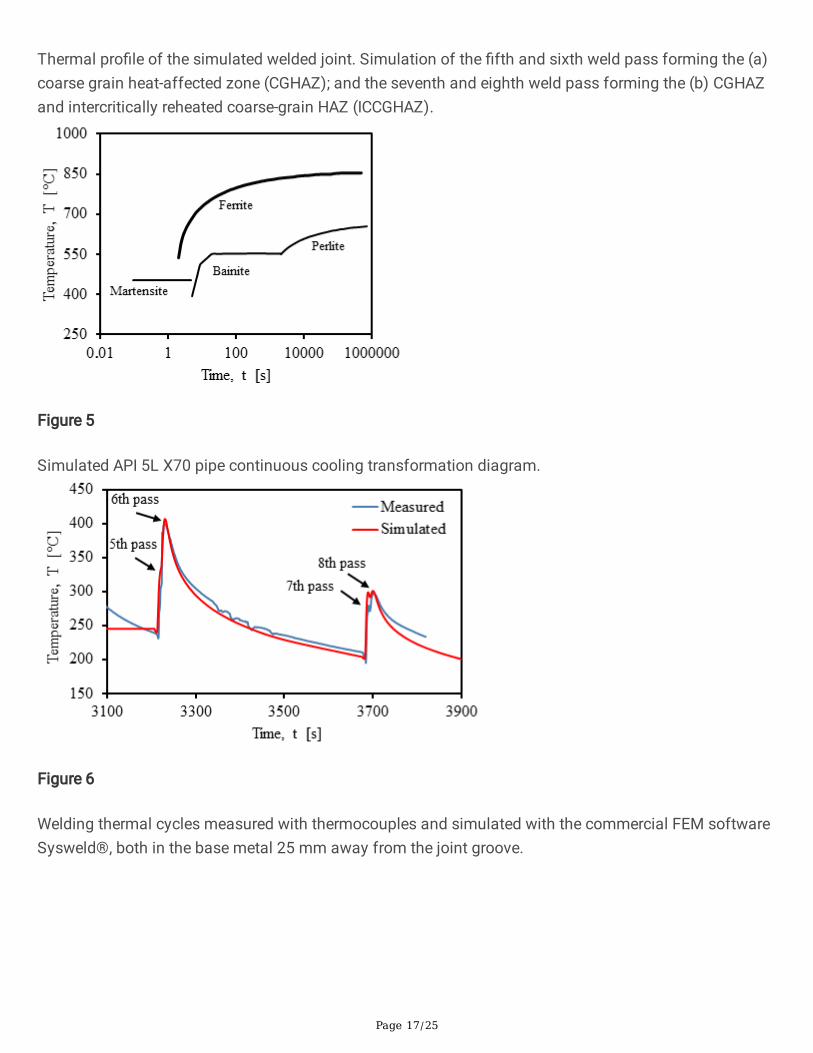
3.1. FEM model and its validationThe welding simulation was validated by comparing the simulated welding thermal cycles (Sysweld®) inthe last four weld passes with the actual thermal cycles measured with thermocouples; both wereobtained from the base metal 25 mm away from the joint groove. A similar validation procedure isspeci�ed in ISO 18166, which has been used by other authors in the literature [4, 12, 31]. Figure 6 shows
Page 10/25
the excellent correlation between the simulated and measured welding thermal cycles. After validation ofthe FEM model, welding simulations were performed considering the ITs of 300, 350, 400, and 425°C.Figure 7 shows the thermal cycles obtained for the CGHAZ and ICCGHAZ.
3.2. Microstructural characterizationFigure 8 shows the macrographs of the simulated CGHAZ. For IT = 300°C, the CGHAZ was formed byneedle ferrite and massive and slender aligned martensite-austenite-carbide (M-A-C) morphologies, whichwere also observed by Di et al. [32] and Zhu et al. [33]. For IT ≥ 350°C, the ferritic grains were larger andonly massive M-A-C formed compared with IT = 300°C. Needle ferrite was formed for IT = 300°C becauseof the shorter time available (i.e., with thermodynamically favorable conditions) for the diffusion ofalloying elements, and consequently grain growth. This behavior occurred because of the higher coolingrate of the alloy during its phase transformation at 850–400°C (CCT diagram in Fig. 6) for IT = 300°Ccompared with the other ITs (Fig. 9). According to the literature [34–36], the increase in heat inputchanges the M-A-C morphology from slender to massive owing to the decrease in the cooling rate.Figures 8 and 9 show that the IT increase decreased the cooling rate, creating the necessarythermodynamic conditions for the formation of a massive instead of slender M-A-C. The microstructuresobserved in the CGHAZ were similar to those observed by other researchers [32–33, 37–38], althoughsome have also identi�ed the formation of granular bainite [37, 39]. The phase content during cooling,obtained from the thermodynamic simulation (Fig. 10), indicate the presence of ferrite for all ITs. For IT ≥ 350°C, the minor formation of perlite and bainite was predicted (< 1%). The formation of ferrite for all ITswas con�rmed by dilatometry tests (Fig. 11).
Figure 12 shows micrographs of the simulated ICCGHAZ. For IT = 300°C, ferrite and massive M-A-C wereformed. However, owing to intercritical reheating, the ferritic grains were equiaxial and larger than those inthe CGHAZ. For IT ≥ 350°C, M-A-C formation was observed at the grain boundaries of the prior austenite,which was also observed by other authors [40–41]. The grain boundary M-A-C observed for IT ≥ 350°Cmay be related to the lower cooling rate after intercritical reheating (Fig. 9), which can produce thethermodynamically favorable conditions for the diffusion of alloying elements over a longer period. Theformation of ferrite for all ITs was con�rmed by dilatometry tests (Fig. 13). The thermodynamicsimulation (JMatPro®) indicated the major presence of ferrite (Fig. 14) and minor perlite (< 1%) for all ITs.
From the microstructural analysis and dilatometry, it was possible to obtain good agreement between theobserved and predicted microstructures in the CGHAZ and ICCGHAZ for all ITs. These results show thatthermodynamic simulation for phase prediction is a valid and powerful method for analyzing the weldingof API 5L X70 pipes.
3.3. Mechanical testingFigure 15 shows the Vickers microhardness values of the CGHAZ and ICCGHAZ. For the CGHAZ, theincrease in IT led to a decrease in microhardness owing to the reduction of the cooling rate (Fig. 9). Suchthermodynamically favorable conditions promoted greater diffusion of the alloying elements, thusdecreasing the hardening by solid solution in the resulting ferritic microstructure. This difference in

Page 11/25
diffusion explains the change in the needle to equiaxial ferrite, as previously reported (Sect. 3.2). Thedecrease in microhardness with the reduction in cooling rate was also observed in other studies [4, 37,42]. For the ICCGHAZ, the increase in IT did not strongly in�uence the Vickers microhardness because thecooling rates arising from the different ITs are similar (Fig. 9b).
The CVN energies for all ITs, for both the CGHAZ and ICCGHAZ, reached the maximum value of theequipment (300 J), i.e., the specimens did not fracture. The high CVN energies are attributed to themaintenance of the ferritic microstructure in all cases. Figures 8 and 12 show that in both the CGHAZ andICCGHAZ, M-A-C was formed with slender and massive morphologies [34, 43]. Several studies haveinvestigated the in�uence of the M-A-C morphology on the toughness. Despite the controversy overwhether the slender [34, 44] or massive [45–46] morphology is more detrimental to toughness, all studiesagree that both morphologies can cause the HAZ of the API 5L X70 pipe to become brittle [32, 40, 47].Because of the high CVN energies obtained, it was not possible to assess the in�uence of M-A-Cformation. However, even if this in�uence is negative, the obtained CVN energies were considerably higherthan the limit set by the DNVGL-ST-F101 standard (50 J). Thus, all the investigated ITs do not jeopardizethe fracture toughness of the HAZ.
4. ConclusionsIn this study, the in�uence of the IT on the numerically and physically simulated CGHAZ and ICCGHAZ ofan API 5L X70 pipe was studied. The increase in IT decreased the Vickers microhardness of the CGHAZowing to lower cooling rates. For the ICCGHAZ, the in�uence of the IT was weaker. Despite the formationof M-A-C in the CGHAZ and ICCGHAZ, the CVN impact energies in these regions were considerably higherthan the limit set by the DNVGL-ST-F101 standard (50 J). These results show that a high IT can reducethe welding time and increase productivity. Moreover, the thermodynamic simulation proved to be ane�cient method for predicting the HAZ microstructure of API 5L X70 pipe, reducing costs through testsand analyses.
DeclarationsAuthors' contributions: Formal analysis, P.H.G.D., V.H.P.M.O., and J.d.C.P.F.; funding acquisition, D.O.M.,P.Z.J., and J.d.C.P.F.; investigation: P.H.G.D.; method: P.H.G.D.; and V.H.P.M.O.; project administration:D.O.M., P.Z.J., and J.d.C.P.F.; supervision, D.O.M., P.Z.J., and J.d.C.P.F.; original draft, P.H.G.D. andV.H.P.M.O.; writing-review and editing, P.H.G.D., J.d.C.P.F., V.H.P.M.O., D.O.M., and P.Z.J.
Funding: This work was funded by Petróleo Brasileiro S. A. (Petrobras) and Agência Nacional do Petróleo,Gás Natural e Biocombustíveis (ANP) – grant 2016/00335-0.
Con�ict of interest: The authors declare no con�ict of interest.
Data availability: The raw/processed data required to reproduce these �ndings cannot be shared at thistime as the data also forms part of an ongoing study.

Page 12/25
References1. Barbosa LHS, Modenesi PJ, Godefroid LB, Arias AR (2019) Fatigue crack growth rates on the weld
metal of high heat input submerged arc welding. Int J Fatigue 119:43–51.doi:10.1016/j.ijfatigue.2018.09.020
2. Layus P, Kah P, Martikainen J, Gezha VV, Bishokov RV (2014) Multi-wire SAW of 640 MPa Arcticshipbuilding steel plates. Int J Adv Manuf Technol 75:771–782. doi:10.1007/s00170-014-6147-2
3. Li L, Han T, Han B (2018) Embrittlement of intercritically reheated coarse grain heat-affected zone ofASTM 4130 steel. Metall Mater Trans A Phys Metall Mater Sci 49:1254–1263. doi:10.1007/s11661-018-4480-z
4. Dornelas PHG, Farias FWC, Oliveira VHPM, Moraes DO, Zumpano Júnior P, Payão Filho JC (2020)In�uence of welding interpass temperature on Charpy V-notch impact energy of coarse-grain heat-affected zone of AISI 4130 steel pipe. Int J Adv Manuf Technol 108:2197–2211.doi:10.1007/s00170-020-05542-0
5. Arora KS, Pandu SR, Shajan N, Pathak P, Shome M (2018) Microstructure and impact toughness ofreheated coarse grain heat affected zones of API X65 and API X80 linepipe steels. Int J Press VesselPip 163:36–44. doi:10.1016/j.ijpvp.2018.04.004
�. Qi X, Di H, Wang X, Liu Z, Misra RDK (2020) Effect of secondary peak temperature on microstructureand toughness in ICCGHAZ of laser-arc hybrid welded X100 pipeline steel joints. Integr Med Res9:7838–7849. doi:10.1016/j.jmrt.2020.05.016
7. Shackleton DN (2006) Reducing failure risk in welded components. Riv Ital della Saldatura 58:79–83. doi:10.1007/BF03263449
�. Sirin K, Sirin SY, Kaluc E (2016) In�uence of the interpass temperature on t8/5 and the mechanicalproperties of submerged arc welded pipe. J Mater Process Technol 238:152–159.doi:10.1016/j.jmatprotec.2016.07.008
9. Neves J, Loureiro A (2004) Fracture toughness of welds - Effect of brittle zones and strengthmismatch. J Mater Process Technol 153:537–543. doi:10.1016/j.jmatprotec.2004.04.120
10. Muthupandi V, Srinivasan PB, Seshadri SK, Sundaresan S (2003) Effect of weld metal chemistry andheat input on the structure and properties of duplex stainless steel welds. Mater Sci Eng A 358:9–16.doi:10.1016/S0921-5093(03)00077-7
11. Shi Y, Han Z (2008) Effect of weld thermal cycle on microstructure and fracture toughness ofsimulated heat-affected zone for a 800 MPa grade high strength low alloy steel. J Mater ProcessTechnol 207:30–39. doi:10.1016/j.jmatprotec.2007.12.049
12. Dornelas PHG, Farias FWC, Oliveira VHPM, Moraes DO, Zumpano Júnior P, Payão Filho JC (2020)FEM-thermodynamic simulation methodology to predict the in�uence of t8/5 on the coarse grainheat-affected zone of a Cr-Mo low-alloy steel pipe. 60:520–529. doi: 10.1016/j.jmapro.2020.10.082
13. Wang XL, Tsai YT, Yang JR, Wang ZQ, Li XC, Shang CJ, Misra RDK (2017) Effect of interpasstemperature on the microstructure and mechanical properties of multi-pass weld metal in a 550-MPa-
Page 13/25
grade offshore engineering steel. Weld World 61:1155–1168. doi:10.1007/s40194-017-0498-x
14. Toyoda M, Mochizuki M (2004) Control of mechanical properties in structural steel welds bynumerical simulation of coupling among temperature, microstructure, and macro-mechanics. SciTechnol Adv Mater 5:255–266. doi:10.1016/j.stam.2003.10.027
15. Wongpanya P, Boellinghaus T, Lothongkum G, Kannengiesser T (2008) Effects of preheating andinterpass temperature on stresses in S 1100 QL multi-pass butt-welds. Weld World 52:79–92.doi:10.1007/BF03266634
1�. Novotný L, Abreu HFG, Miranda HC, Béreš M (2016) Simulations in multipass welds using lowtransformation temperature �ller material. Sci Technol Weld Join 21:680–687.doi:10.1080/13621718.2016.1177989
17. Dai H, Moat RJ, Withers PJ (2011) Modelling the interpass temperature effect on residual stress inlow transformation temperature stainless steel welds. Am Soc Mech Eng Press Vessel Pip Div PVP6:1451–1458. doi:10.1115/PVP2011-57329
1�. Zubairuddin M, Albert SK, Vasudevan M, Mahadevan S, Chaudhri V, Suri VK (2016)Thermomechanical analysis of preheat effect on grade P91 steel during GTA welding. Mater ManufProcess 31:366–371. doi:10.1080/10426914.2015.1025964
19. Miettinen J, Koskenniska S, Visuri V (2020) Thermodynamic, kinetic, and microstructure data formodeling solidi�cation of Fe-Al-Mn-Si-C alloys. 51: 2946–2962. doi: 10.1007/s11663-020-01973-y
20. Kohler ML, Kunz J, Herzog S, Kaletsch A, Broeckmann C (2021) Microstructure analysis of novelLPBF-processed duplex stainless steels correlated to their mechanical and corrosion properties.801:140432. doi: 10.1016/j.msea.2020.140432
21. Rosenthal D (1941) Mathematical theory of heat distribution during welding and cutting. Weld J20:220–234
22. Goldak J, Bibby M, Moore J, House R, Patel B (1986) Computer modeling of heat �ow in welds.Metall Trans B 17:587–600. doi:10.1007/BF02670226
23. Myers PS (1976) Fundamentals of heat �ow in welding. Welding Research Council
24. Anca A, Cardona A, Risso J, Fachinotti VD (2011) Finite element modeling of welding processes. ApplMath Model 35:688–707. doi:10.1016/j.apm.2010.07.026
25. Pozo-Morejón JA, Souza LF, Guerra T, Morales EV, Bott IDS, Cruz-Crespo A, Pérez OR (2018) Ajuste delos calores de entrada que se corresponden con los tiempos de enfriamiento de la ZAT en soldaduraGMAW sobre acero dúplex 2205 empleando la simulación por elementos �nitos. Sold Insp 23:413–422. doi:10.1590/0104-9224/si2303.10
2�. Kik T, Górka J (2019) Numerical simulations of laser and hybrid S700MC T-joint welding. Materials12:516. doi:10.3390/ma12030516
27. Geng H, Li J, Xiong J, Lin X (2017) Optimisation of interpass temperature and heat input for wire andarc additive manufacturing 5A06 aluminium alloy. Sci Technol Weld Join 22:472–483.doi:10.1080/13621718.2016.1259031

Page 14/25
2�. Goldak J, Chakravarti A, Bibby M (1984) A new �nite element model for welding heat sources. MetallTrans 15:299–305. doi:10.1007/BF02667333
29. Heinze C, Schwenk C, Rethmeier M (2011) In�uences of mesh density and transformation behavioron the result quality of numerical calculation of welding induced distortion. Simul Model PractTheory 19:1847–1859. doi:10.1016/j.simpat.2011.05.001
30. Harrison PL, Farrar RA (1989) Application of continuous cooling transformation diagrams forwelding of steels. Int Mater Rev 34:35–51. doi:10.1179/imr.1989.34.1.35
31. Bate SK, Charles R, Warren A (2009) Finite element analysis of a single bead-on-plate specimenusing Sysweld. Int J Press Vessels Pip 86:73–78. doi:10.1016/j.ijpvp.2008.11.006
32. Di XJ, An X, Cheng FJ, Wang DP, Guo XJ, ue ZK (2016) Effect of martensite–austenite constituent ontoughness of simulated inter-critically reheate coarse-grained heat-affected zone in X70 pipelinesteel. Sci Technol Weld Join 21:366–373. doi:10.1080/13621718.2015.1118814
33. Zhu Z, Han J, Li H (2015) Effect of alloy design on improving toughness for X70 steel duringwelding. Mater Des 88:1326–1333. doi:10.1016/j.matdes.2015.09.073
34. Luo X, Chen X, Wang T, Pan S, Wang Z (2017) Effect of morphologies of martensite–austeniteconstituents on impact toughness in intercritically reheated coarse-grained heat-affected zone ofHSLA steel. Mater Sci Eng A 710:192–199. doi:10.1016/j.msea.2017.10.079
35. Yang X, Di X, Liu X, Wang D, Li C (2019) Effects of heat input on microstructure and fracturetoughness of simulated coarse-grained heat affected zone for HSLA steels. Mater Charact155:109818. doi:10.1016/j.matchar.2019.109818
3�. Zhuangfei W, Minghao SHI, Shuai T, Guodong W (2017) Effect of heat input and M-A constituent onmicrostructure evolution and mechanical properties of heat affected zone in low carbon steel. JWuhan Univ Technol Mater Sci Ed 32:1163–1170. doi:10.1007/s11595-017-1726-3
37. Li C, Wang Y, Han T (2011) Microstructure and toughness of coarse grain heat-affected zone ofdomestic X70 pipeline steel during in-service welding. J Mater Sci 46:727–733. doi:10.1007/s10853-010-4803-y
3�. Li CW, Wang Y, Han T (2012) Toughness improvement in coarse grain heat affected zone of X70pipeline steel by accelerated cooling. Mater Sci Technol 28:92–94.doi:10.1179/1743284711Y.0000000002
39. Li C, Wang Y, Chen Y (2011) In�uence of peak temperature during in-service welding of API X70pipeline steels on microstructure and fracture energy of the reheated coarse grain heat-affectedzones. J Mater Sci 19:6424–6431. doi:10.1007/s10853-011-5592-7
40. Zhu Z, Kuzmikova L, Li H, Barbaro F (2014) Effect of inter-critically reheating temperature onmicrostructure and properties of simulated inter-critically reheated coarse grained heat affected zonein X70 steel. Mater Sci Eng A 605:8–13. doi:10.1016/j.msea.2014.03.034
41. Mandal M, Poole W, Militzer M, Collins L (2021) Mechanical properties of intercritically annealed X80line pipe steels. Metall Mater Trans A 52:1336–1352. doi:10.1007/s11661-021-06152-5

Page 15/25
42. Kostin VA, Grigorenko GM, Poznyakov VD (2020) Structural transformations of the metal of of heat-affected zone of welded joints of high-strength armor steels. J Mater Sci 55:78–83.doi:10.1007/s11003-020-00380-7
43. Ramachandran DC, Moon J, Lee CH, Kim SD, Chung JH, Biro E, Park YD (2021) Role of bainiticmicrostructures with MA constituent on the toughness of an HSLA steel for seismic resistantstructural applications. Mater Sci Eng A 801:140390. doi:10.1016/j.msea.2020.140390
44. Kumar S, Nath SK (2016) Effect of weld thermal cycles on microstructures and mechanicalproperties in simulated heat-affected zone of a HY 85 steel. Trans Indian Inst Met 70:239–250.doi:10.1007/s12666-016-0880-1
45. Bayraktar E, Kaplan D (2004) Mechanical and metallurgical investigation of martensite–austeniteconstituents in simulated welding conditions. J Mater Process Technol 154:87–92.doi:10.1016/j.jmatprotec.2004.04.021
4�. Li Y, Crowther DN, Green MJW, Mitchell PS, Baker TN (2001) The effect of vanadium and niobium onthe properties and microstructure of the intercritically reheated coarse grained heat-affected zone inlow carbon steel. ISIJ international 41:46–55. doi:10.2355/isijinternational.41.46
47. Mohammadijoo M, Kenny S, Collins L, Henein H, Ivey DG (2017) Characterization of HAZ of API X70microalloyed steel welded by cold-wire tandem submerged arc welding. Metall Mater Trans A48:2247–2259. doi:10.1007/s11661-017-4041-x
Figures
Figure 1
Optical (a) and scanning electron (b) micrographs of the �ne-grained ferritic steel API 5L X70 pipe.

Page 16/25
Figure 2
Groove con�guration (left) and schematic of the weld pass sequence (right).
Figure 3
Macrograph of the welded joint (top) and the �nite element method model mesh (bottom).
Figure 4
Page 17/25
Thermal pro�le of the simulated welded joint. Simulation of the �fth and sixth weld pass forming the (a)coarse grain heat-affected zone (CGHAZ); and the seventh and eighth weld pass forming the (b) CGHAZand intercritically reheated coarse-grain HAZ (ICCGHAZ).
Figure 5
Simulated API 5L X70 pipe continuous cooling transformation diagram.
Figure 6
Welding thermal cycles measured with thermocouples and simulated with the commercial FEM softwareSysweld®, both in the base metal 25 mm away from the joint groove.

Page 18/25
Figure 7
Simulated welding thermal cycles in the (a) coarse grain heat-affected zone (CGHAZ) and (b)intercritically reheated coarse-grain HAZ (ICCGHAZ) for different interpass temperatures (IT)

Page 19/25
Figure 8
Optical (left) and scanning electron (right) micrographs of the simulated coarse grain heat-affected zonefor the following interpass temperatures: (a) 300 °C, (b) 350 °C, (c) 400 °C, and (d) 425 °C.

Page 20/25
Figure 9
The coarse grain heat-affected zone (CGHAZ) (a) and intercritically reheated coarse-grain HAZ (ICCGHAZ)(b) cooling rates for interpass temperatures (IT) of 300, 350, 400, and 425 °C.

Page 21/25
Figure 10
Simulated phase contents of the coarse grain heat-affected zone during cooling for interpasstemperatures (IT) of 300, 350, 400, and 425 °C. CR means cooling rate.
Page 22/25
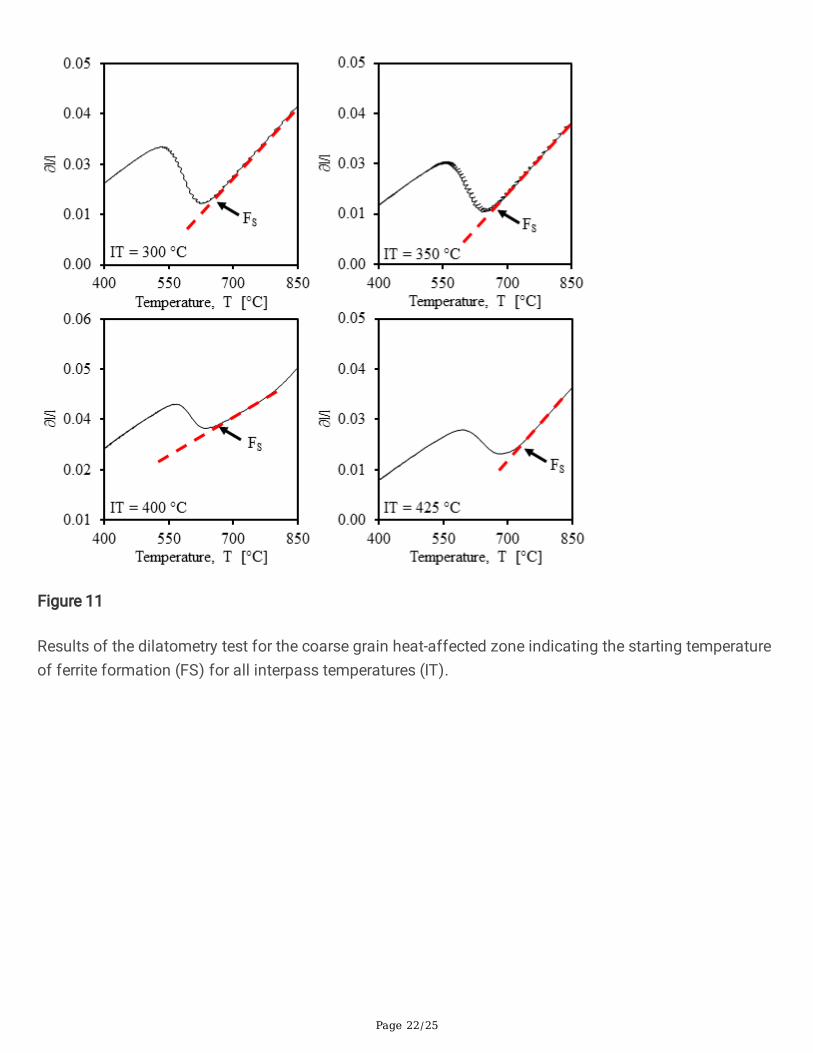
Figure 11
Results of the dilatometry test for the coarse grain heat-affected zone indicating the starting temperatureof ferrite formation (FS) for all interpass temperatures (IT).

Page 23/25
Figure 12
Optical (left) and scanning electron (right) micrographs of simulated intercritically reheated coarse-grainHAZ (ICCGHAZ) for interpass temperatures (IT) of (a) 300 °C, (b) 350 °C, (c) 400 °C, and (d) 425 °C.

Page 24/25
Figure 13
Results of the dilatometry test indicating the starting temperature of ferrite formation (FS) for theintercritically reheated coarse-grain heat-affected zone.

Page 25/25
Figure 14
Simulated phase contents of the intercritically reheated coarse-grain heat-affected zone during coolingfor all interpass temperatures (cooling rate = 1 °C/s).
Figure 15
Vickers microhardness of the coarse grain heat-affected zone (CGHAZ) and intercritically reheatedcoarse-grain heat-affected zone (ICCGHAZ) for the interpass temperatures of 300, 350, 400, and 425 °C.