aphria - q2 2018 fs v5 · other current assets 5 8,783 5,571 inventory 6 8,706 3,887 ... land...
TRANSCRIPT
Aphria Inc.
CONDENSED INTERIM CONSOLIDATED FINANCIAL STATEMENTS FOR THE THREE MONTHS AND SIX MONTHS ENDED NOVEMBER 30, 2017 AND NOVEMBER 30, 2016
(Unaudited, expressed in Canadian Dollars, unless otherwise noted)

Aphria Inc. Condensed Interim Consolidated Statements of Financial Position (Unaudited – In thousands of Canadian dollars)
The accompanying notes are an integral part of these condensed interim consolidated financial statements
2
Nature of operations (Note 1) Commitments (Note 28) Subsequent events (Note 29)
Approved on behalf of the Board:
“John Cervini” “Cole Cacciavillani” Signed: Director Signed: Director
NoteNovember 30,
2017May 31, 2017
Assets
Current assets
Cash and cash equivalents 116,087$ 79,910$
Marketable securities 4 55,855 87,347
Accounts receivable 2,666 826
Other current assets 5 8,783 5,571
Inventory 6 8,706 3,887
Biological assets 7 1,398 1,363
Due from related parties 8 -- 464
Land available for sale 9 3,160 --
Current portion of convertible notes receivable 11 2,578 --
199,233 179,368
Capital assets 9 134,251 72,500
Intangible assets 10 1,579 1,891
Convertible notes receivable 11 8,996 1,361
Embedded derivatives 11 5,251 173
Interest in equity investee 12 27,493 28,376
Long-term investments 13 60,088 27,788
Deferred tax asset 14 1,511 3,315
Goodwill 1,200 1,200
439,602$ 315,972$
Liabi l i ties
Current l iabi l i ties
Accounts payable and accrued liabilities 15,709$ 5,874$
Income taxes payable 14 851 --
Deferred gain on sale of intellectual property 2,333 2,800
Current portion of promissory note payable 16 768 878
Current portion of long-term debt 17 790 765
20,451 10,317
Long-term l iabi l i ties
Promissory note payable 16 -- 366
Long-term debt 17 31,022 31,420
51,473 42,103
Shareholders’ equity
Share capital 18 363,479 274,317
Warrants 19 445 445
Share-based payment reserve 7,633 3,230
Accumulated other comprehensive loss (801) --
Retained earnings (deficit) 17,373 (4,123)
388,129 273,869
439,602$ 315,972$
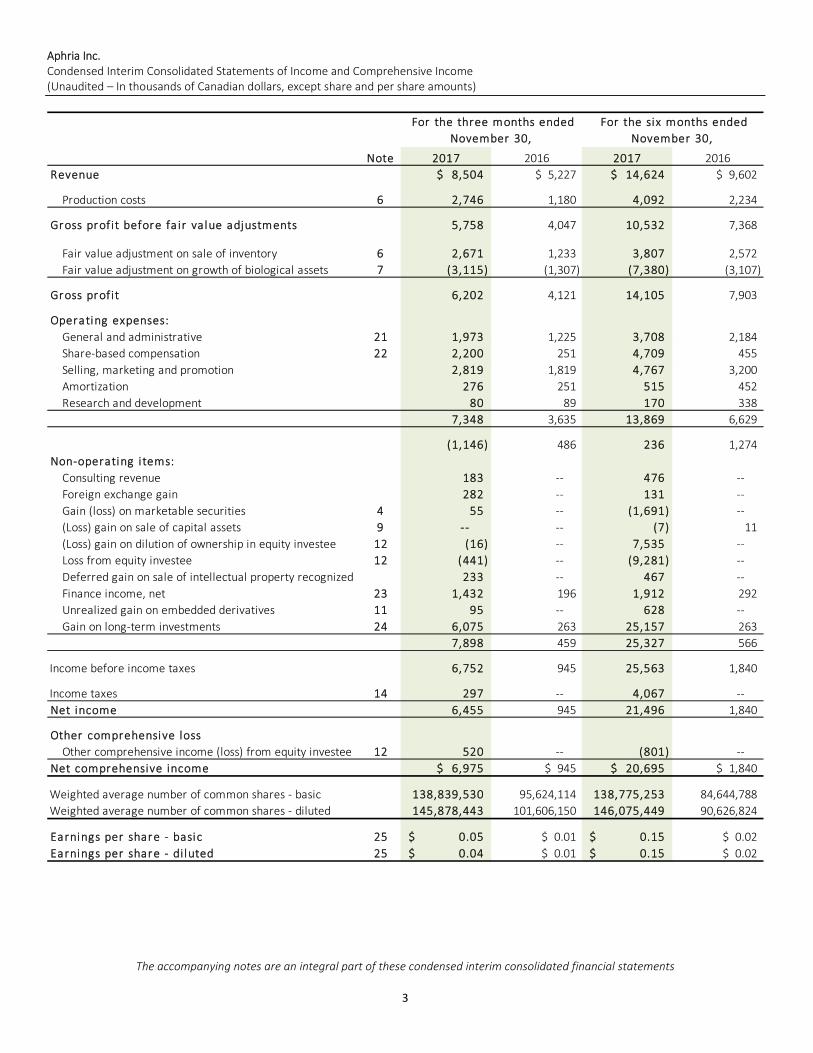
Aphria Inc. Condensed Interim Consolidated Statements of Income and Comprehensive Income (Unaudited – In thousands of Canadian dollars, except share and per share amounts)
The accompanying notes are an integral part of these condensed interim consolidated financial statements
3
Note 2017 2016 2017 2016
Revenue 8,504$ 5,227$ 14,624$ 9,602$
Production costs 6 2,746 1,180 4,092 2,234
Gross profit before fa ir value adjustments 5,758 4,047 10,532 7,368
Fair value adjustment on sale of inventory 6 2,671 1,233 3,807 2,572
Fair value adjustment on growth of biological assets 7 (3,115) (1,307) (7,380) (3,107)
Gross profit 6,202 4,121 14,105 7,903
Operating expenses:
General and administrative 21 1,973 1,225 3,708 2,184
Share-based compensation 22 2,200 251 4,709 455
Selling, marketing and promotion 2,819 1,819 4,767 3,200
Amortization 276 251 515 452
Research and development 80 89 170 338
7,348 3,635 13,869 6,629
(1,146) 486 236 1,274
Non-operating i tems:
Consulting revenue 183 -- 476 --
Foreign exchange gain 282 -- 131 --
Gain (loss) on marketable securities 4 55 -- (1,691) --
(Loss) gain on sale of capital assets 9 -- -- (7) 11
(Loss) gain on dilution of ownership in equity investee 12 (16) -- 7,535 --
Loss from equity investee 12 (441) -- (9,281) --
Deferred gain on sale of intellectual property recognized 233 -- 467 --
Finance income, net 23 1,432 196 1,912 292
Unrealized gain on embedded derivatives 11 95 -- 628 --
Gain on long-term investments 24 6,075 263 25,157 263
7,898 459 25,327 566
Income before income taxes 6,752 945 25,563 1,840
Income taxes 14 297 -- 4,067 --
Net income 6,455 945 21,496 1,840
Other comprehensive loss
Other comprehensive income (loss) from equity investee 12 520 -- (801) --
Net comprehensive income 6,975$ 945$ 20,695$ 1,840$
Weighted average number of common shares - basic 138,839,530 95,624,114 138,775,253 84,644,788
Weighted average number of common shares - diluted 145,878,443 101,606,150 146,075,449 90,626,824
Earnings per share - basic 25 0.05$ 0.01$ 0.15$ 0.02$
Earnings per share - di luted 25 0.04$ 0.01$ 0.15$ 0.02$
For the three months ended
November 30,
For the six months ended
November 30,
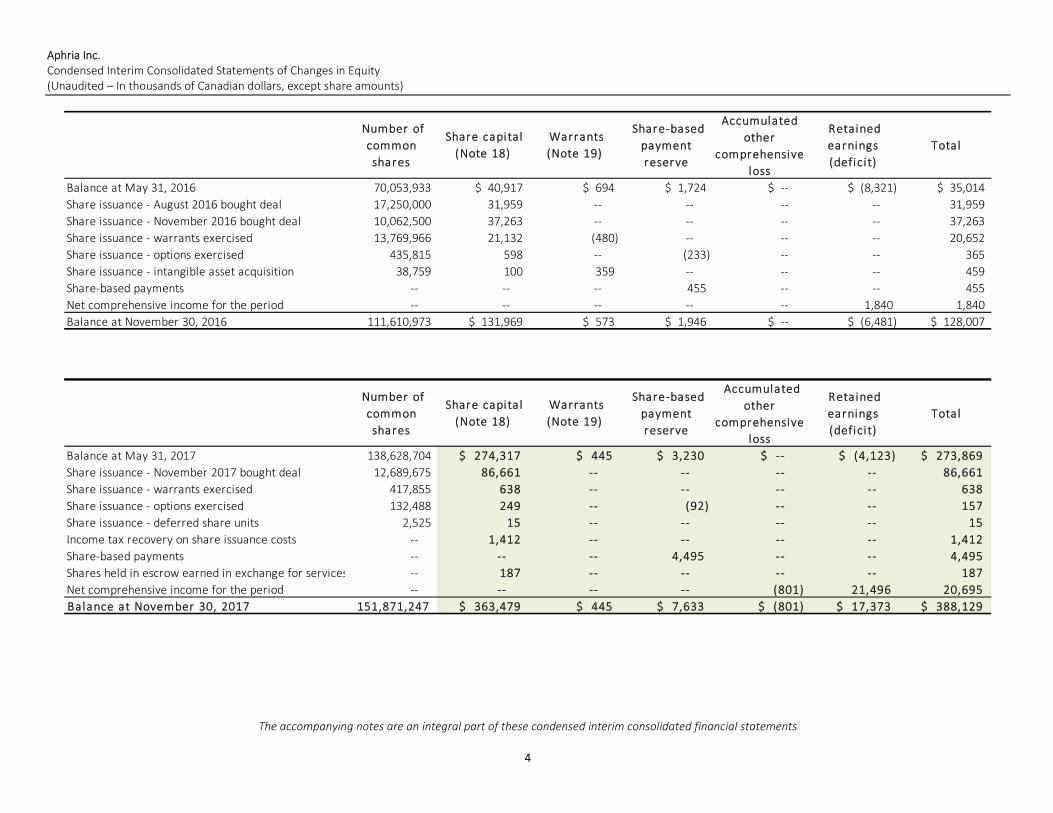
Aphria Inc. Condensed Interim Consolidated Statements of Changes in Equity (Unaudited – In thousands of Canadian dollars, except share amounts)
The accompanying notes are an integral part of these condensed interim consolidated financial statements
4
Balance at May 31, 2016 70,053,933 40,917$ 694$ 1,724$ --$ (8,321)$ 35,014$
Share issuance - August 2016 bought deal 17,250,000 31,959 -- -- -- -- 31,959
Share issuance - November 2016 bought deal 10,062,500 37,263 -- -- -- -- 37,263
Share issuance - warrants exercised 13,769,966 21,132 (480) -- -- -- 20,652
Share issuance - options exercised 435,815 598 -- (233) -- -- 365
Share issuance - intangible asset acquisition 38,759 100 359 -- -- -- 459
Share-based payments -- -- -- 455 -- -- 455
Net comprehensive income for the period -- -- -- -- -- 1,840 1,840
Balance at November 30, 2016 111,610,973 131,969$ 573$ 1,946$ --$ (6,481)$ 128,007$
Balance at May 31, 2017 138,628,704 274,317$ 445$ 3,230$ --$ (4,123)$ 273,869$
Share issuance - November 2017 bought deal 12,689,675 86,661 -- -- -- -- 86,661
Share issuance - warrants exercised 417,855 638 -- -- -- -- 638
Share issuance - options exercised 132,488 249 -- (92) -- -- 157
Share issuance - deferred share units 2,525 15 -- -- -- -- 15
Income tax recovery on share issuance costs -- 1,412 -- -- -- -- 1,412
Share-based payments -- -- -- 4,495 -- -- 4,495
Shares held in escrow earned in exchange for services -- 187 -- -- -- -- 187
Net comprehensive income for the period -- -- -- -- (801) 21,496 20,695
Balance at November 30, 2017 151,871,247 363,479$ 445$ 7,633$ (801)$ 17,373$ 388,129$
Total
Number of
common
shares
Share capital
(Note 18)
Warrants
(Note 19)
Share-based
payment
reserve
Accumulated
other
comprehensive
loss
Retained
earnings
(deficit)
Total
Number of
common
shares
Share capital
(Note 18)
Warrants
(Note 19)
Share-based
payment
reserve
Accumulated
other
comprehensive
loss
Retained
earnings
(deficit)

Aphria Inc. Condensed Interim Consolidated Statements of Cash Flows (Unaudited – In thousands of Canadian dollars)
The accompanying notes are an integral part of these condensed interim consolidated financial statements
5
Note 2017 2016
Cash generated from (used in) operating ac tiv ities:
Net income for the period 21,496$ 1,840$
Adjustments for:
Income taxes 14 4,067 --
Fair value adjustment on sale of inventory 6 3,807 2,572
Fair value adjustment on growth of biological assets 7 (7 ,380) (3,107)
Loss on marketable securities 4 1 ,691 --
Unrealized foreign exchange gain on convertible notes receivable 11 (77) --
Amortization 9,10 1,404 934
Loss (gain) on sale of capital assets 9 7 (11)
Disposition and usage of bearer plants 9 3 47
Accretion interest on convertible note receivable 11 (585) --
Unrealized gain on embedded derivatives 11 (628) --
Loss from equity investee 12 9,281 --
Gain on dilution of ownership in equity investee 12 (7 ,535) --
Deferred gain on sale of intellectual property recognized 12 (467) --
Consulting revenue 16 (476) --
Amortization of finance fees on long-term debt 2 2
Share-based compensation 22 4,709 455
Gain on long-term investments 24 (25,157) (256)
Change in non-cash working capital 26 (3 ,747) (318)
415 2,158
Cash prov ided by f inanc ing ac tiv ities:
Share capital issued, net of cash issuance costs 86 ,661 69,222
Share capital issued on warrants exercised 638 20,652
Share capital issued on share-based compensation exercised 172 365
Advances from related parties 8 2,823 267
Repayment of amounts due to related parties 8 (2 ,327) (267)
Proceeds from long-term debt 17 -- 7,825
Repayment of long-term debt 17 (375) (277)
87,592 97,787
Cash used in investing activ ities:
Repayment of promissory notes receivable -- 440
Investment in capital assets 9 (59 ,014) (11,153)
Proceeds from disposal of capital asssets 9 200 33
Investment in intangible assets, net of shares issued 10 (9) (1,306)
Convertible notes advances 11 (14,001) --
Investment in marketable securities 4 (5 ,000) --
Proceeds from disposal of marketable securities 4 34,801 --
Investment in long-term investments 13 (10,897) (6,418)
Proceeds from disposal of long-term investments 13 2,090 601
(51,830) (17,803)
Net increase in cash and cash equivalents 36,177 82,142
Cash and cash equivalents, beginning of period 79,910 16,473
Cash and cash equivalents, end of period 116,087$ 98,615$
For the six months ended
November 30 ,

Aphria Inc. Notes to the Condensed Interim Consolidated Financial Statements For the three months and six months ended November 30, 2017 and November 30, 2016 (Unaudited – In thousands of Canadian dollars, except share and per share amounts)
6
1. Nature of operations
Aphria Inc. (the "Company" or “Aphria”) was continued in Ontario.
Pure Natures Wellness Inc. (o/a Aphria) (“PNW”), a wholly-owned subsidiary of the Company, is licensed to produce and sell medical marijuana under the provisions of the Access to Cannabis for Medical Purposes Regulations (“ACMPR”). The registered office is located at 5300 Commerce Court West, 199 Bay Street, Toronto, Ontario.
The Company’s common shares are listed under the symbol “APH” on the Toronto Stock Exchange (“TSX”) and under the symbol “APHQF” on the United States OTCQB Venture Market exchange.
These condensed interim consolidated financial statements were approved by the Company’s Board of Directors on January 9, 2018.
2. Basis of preparation
(a) Statement of compliance
The Company’s condensed interim consolidated financial statements have been prepared in accordance with IAS 34, “Interim Financial Reporting”. These condensed interim consolidated financial statements do not include all notes of the type normally included within the annual financial report and should be read in conjunction with the audited financial statements of the Company for the year ended May 31, 2017, which have been prepared in accordance with International Financial Reporting Standards (“IFRS”) as issued by the International Accounting Standards Board and Interpretations of the IFRS Interpretations Committee.
(b) Basis of measurement
These condensed interim consolidated financial statements have been prepared on the going concern basis, under the historical cost convention except for certain financial instruments that are measured at fair value and biological assets that are measured at fair value less costs to sell, as detailed in the Company’s accounting policies.
(c) Functional currency
The Company and its subsidiaries’ functional currency, as determined by management is Canadian dollars. These condensed interim consolidated financial statements are presented in Canadian dollars.
(d) Basis of consolidation
Subsidiaries are entities controlled by the Company. Control exists when the Company has the power, directly and indirectly, to govern the financial and operating policies of an entity and be exposed to the variable returns from its activities. The financial statements of subsidiaries are included in the condensed interim consolidated financial statements from the date that control commences until the date that control ceases.
Wholly owned subsidiaries Jurisdiction of incorporation
Pure Natures Wellness Inc. (o/a Aphria) Ontario 1974568 Ontario Ltd. Ontario Aphria (Arizona) Inc. Arizona
Intragroup balances, and any unrealized gains and losses or income and expenses arising from transactions with jointly controlled entities are eliminated to the extent of the Company’s interest in the entity.
Aphria Inc. Notes to the Condensed Interim Consolidated Financial Statements For the three months and six months ended November 30, 2017 and November 30, 2016 (Unaudited – In thousands of Canadian dollars, except share and per share amounts)
7
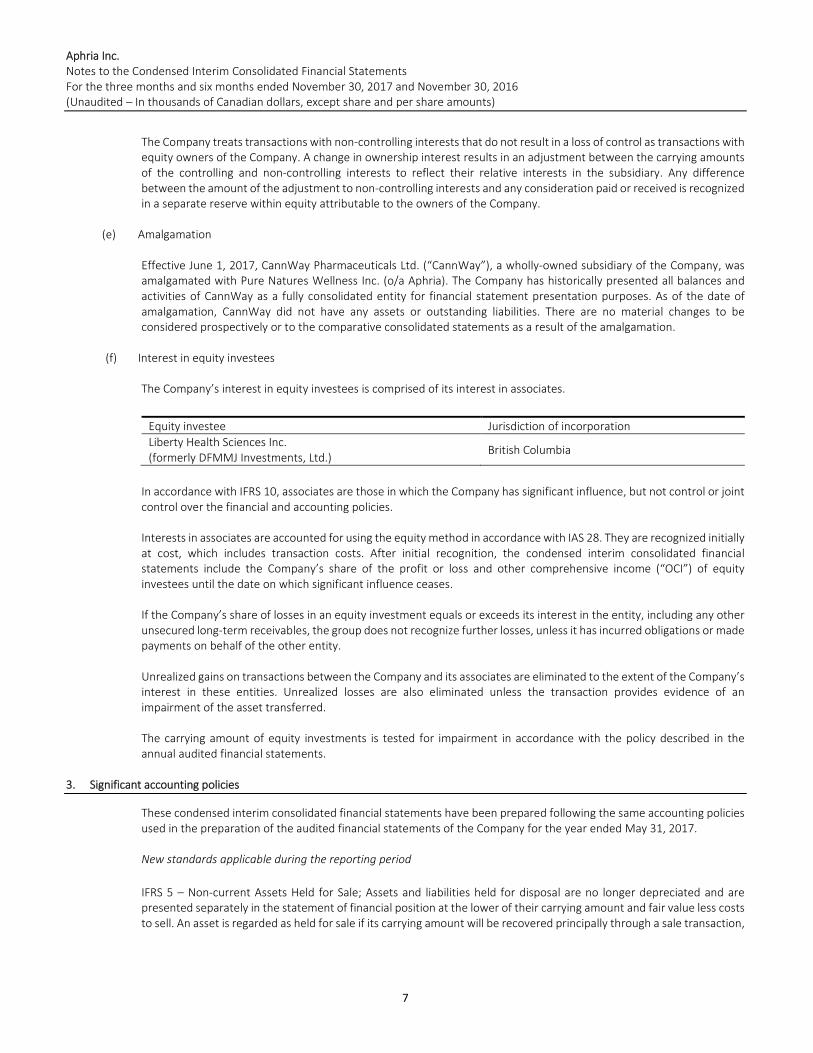
The Company treats transactions with non-controlling interests that do not result in a loss of control as transactions with equity owners of the Company. A change in ownership interest results in an adjustment between the carrying amounts of the controlling and non-controlling interests to reflect their relative interests in the subsidiary. Any difference between the amount of the adjustment to non-controlling interests and any consideration paid or received is recognized in a separate reserve within equity attributable to the owners of the Company.
(e) Amalgamation
Effective June 1, 2017, CannWay Pharmaceuticals Ltd. (“CannWay”), a wholly-owned subsidiary of the Company, was amalgamated with Pure Natures Wellness Inc. (o/a Aphria). The Company has historically presented all balances and activities of CannWay as a fully consolidated entity for financial statement presentation purposes. As of the date of amalgamation, CannWay did not have any assets or outstanding liabilities. There are no material changes to be considered prospectively or to the comparative consolidated statements as a result of the amalgamation.
(f) Interest in equity investees
The Company’s interest in equity investees is comprised of its interest in associates.
Equity investee Jurisdiction of incorporation
Liberty Health Sciences Inc. (formerly DFMMJ Investments, Ltd.)
British Columbia
In accordance with IFRS 10, associates are those in which the Company has significant influence, but not control or joint control over the financial and accounting policies.
Interests in associates are accounted for using the equity method in accordance with IAS 28. They are recognized initially at cost, which includes transaction costs. After initial recognition, the condensed interim consolidated financial statements include the Company’s share of the profit or loss and other comprehensive income (“OCI”) of equity investees until the date on which significant influence ceases.
If the Company’s share of losses in an equity investment equals or exceeds its interest in the entity, including any other unsecured long-term receivables, the group does not recognize further losses, unless it has incurred obligations or made payments on behalf of the other entity.
Unrealized gains on transactions between the Company and its associates are eliminated to the extent of the Company’s interest in these entities. Unrealized losses are also eliminated unless the transaction provides evidence of an impairment of the asset transferred.
The carrying amount of equity investments is tested for impairment in accordance with the policy described in the annual audited financial statements.
3. Significant accounting policies
These condensed interim consolidated financial statements have been prepared following the same accounting policies used in the preparation of the audited financial statements of the Company for the year ended May 31, 2017.
New standards applicable during the reporting period
IFRS 5 – Non-current Assets Held for Sale; Assets and liabilities held for disposal are no longer depreciated and are presented separately in the statement of financial position at the lower of their carrying amount and fair value less costs to sell. An asset is regarded as held for sale if its carrying amount will be recovered principally through a sale transaction,
Aphria Inc. Notes to the Condensed Interim Consolidated Financial Statements For the three months and six months ended November 30, 2017 and November 30, 2016 (Unaudited – In thousands of Canadian dollars, except share and per share amounts)
8
rather than through continuing use. For this to be the case, the asset must be available for immediate sale and its sale must be highly probable.
New standards and interpretations issued but not yet adopted:
IFRS 9 - Financial Instruments; Classification and Measurement, effective for annual periods beginning on or after January 1, 2018, with early adoption permitted, introduces new requirements for the classification, measurement and derecognition of financial instruments and introduces a new impairment model for financial assets. The Company is assessing the impact of the standard on its convertible notes receivable and its investments where it holds less than significant influence. The Company has determined that no significant impact is anticipated from the new standard.
The new standard also introduces expanded disclosure requirements and changes in presentation. These are expected to change the nature and extent of the Company’s disclosures about its financial instruments particularly in the period of the adoption of the new standard.
The Company will apply the new rules retrospectively from June 1, 2018 with the practical expedients permitted under the standards. Comparatives will not be restated.
IFRS 15 - Revenue from Contracts with Customers; effective for annual periods beginning on or after January 1, 2018, with early adoption permitted, specifies how and when to recognize revenue and enhances relevant disclosures to be applied to all contracts with customers. The Company continues to assess the impact of the standard, with a focus on consulting contracts and royalty fees.
The Company is still considering the impact on its customer loyalty programme, which is currently under reconsideration. The new standard will require that the total consideration received be allocated to the points and goods based on relative stand-alone selling prices rather than based on the residual method.
The Company intends to adopt the standard using the modified retrospective approach which means that the cumulative impact of adoption will be recognized in retained earnings as of June 1, 2018 and that comparatives will not be restated.
IFRS 16 – Leases; in January 2016, the IASB issued IFRS 16, which specifies how an IFRS reporter will recognise, measure, present and disclose leases. The standard provides a single lessee accounting model, requiring lessees to recognise assets and liabilities for all leases unless the lease term is 12 months or less or the underlying asset has a low value. Lessors continue to classify leases as operating or finance, with IFRS 16’s approach to lessor accounting substantially unchanged from its predecessor, IAS 17. IFRS 16 is effective for annual reporting periods beginning on or after January 1, 2019, and a lessee shall either apply IFRS 16 with full retrospective effect or alternatively not restate comparative information but recognise the cumulative effect of initially applying IFRS 16 as an adjustment to opening equity at the date of initial application. Early adoption is permitted if IFRS 15 has also been adopted. Based on its current assets, interests and investments, no significant impact is anticipated from the new standard.
There are no other standards that are not yet effective and that would be expected to have a material impact on the Company in the current or future reporting periods and on foreseeable future transactions.
The Company has reclassified certain immaterial items on the comparative consolidated statements of income and comprehensive income to improve clarity.

Aphria Inc. Notes to the Condensed Interim Consolidated Financial Statements For the three months and six months ended November 30, 2017 and November 30, 2016 (Unaudited – In thousands of Canadian dollars, except share and per share amounts)
9
4. Marketable securities
Marketable securities are classified as fair value through profit or loss, and are comprised of:
The cost of marketable securities as at November 30, 2017 was $56,276 (May 31, 2017 – $87,138). During the three and six months ended November 30, 2017, the company divested of certain marketable securities in its Canadian portfolio for proceeds of $24,702 and $34,801, resulting in a loss on disposal of $256 and $387 (2016 - $nil and $nil), and re-invested $nil and $5,000 (2016 - $nil and $nil). During the three and six months ended November 30, 2017, the Company recognized a gain (loss) of $55 and ($1,691) on its marketable securities portfolio, of which $311 and ($1,304) (2016 - $nil and $nil) represented unrealized fair value adjustments.
S&P rating
at purchase
Interest
rate
Maturity
date
November 30,
2017May 31, 2017
Fixed Income:
Molson Coors Brewing Company BBB- 3.950% 10/06/17 -- 1,116
Ford Motor Credit Co. LLC BBB 3.320% 12/19/17 2,032 1,988
Goldman Sachs & Co. LLC A+ 3.375% 2/01/18 -- 5,078
The Manufacturer's Life Insurance Company AA- 2.819% 2/26/18 1,465 1,472
Canadian Western Bank A- 2.531% 3/22/18 3,023 3,039
Ford Motor Credit Co. LLC BBB 3.700% 8/02/18 1,024 1,037
Sobeys Inc. BB+ 3.520% 8/08/18 3,055 3,078
Royal Bank of Canada AA- 2.770% 12/11/18 -- 5,180
Canadian Western Bank A- 3.077% 1/14/19 1,536 1,535
Sun Life Financial Inc. A 2.770% 5/13/19 3,029 3,064
Ford Motor Credit Co. LLC BBB 3.140% 6/14/19 5,145 5,207
Canadian Natural Resources Ltd. BBB+ 3.050% 6/19/19 -- 2,054
Canadian Western Bank A- 3.463% 12/17/19 1,028 1,028
Laurentian Bank of Canada BBB 2.500% 1/23/20 3,038 6,099
Enercare Solutions Inc. BBB 4.600% 2/03/20 4,007 4,008
Enbridge Inc. BBB+ 4.530% 3/09/20 5,290 5,395
Central 1 Credit Union A 1.870% 3/16/20 -- 5,020
Choice Properties REIT BBB 3.600% 4/20/20 5,163 5,237
Penske Truck Leasing Co., L.P. BBB 2.950% 6/12/20 -- 5,145
Westcoast Energy Inc. BBB+ 4.570% 7/02/20 5,387 5,430
Bank of Montreal (USD) A+ 1.400% 4/10/18 3,874 4,052
Citigroup Inc. (USD) BBB+ 2.050% 12/17/18 3,904 4,081
Royal Bank of Canada (USD) AA- 1.625% 4/15/19 3,855 4,040
Wells Fargo & Company (USD) A 2.150% 1/30/20 -- 3,964
55,855$ 87,347$

Aphria Inc. Notes to the Condensed Interim Consolidated Financial Statements For the three months and six months ended November 30, 2017 and November 30, 2016 (Unaudited – In thousands of Canadian dollars, except share and per share amounts)
10
5. Other current assets
Other current assets are comprised of:
6. Inventory
Inventory is comprised of:
During the three and six months ended November 30, 2017, the Company recorded $2,746 and $4,092 (2016 - $1,180 and $2,234) related to production costs. Included in production costs for the three and six months ended November 30, 2017 is $54 and $95 of cannabis oil conversion costs (2016 - $15 and $43) and $61 and $98 related to the cost of accessories (2016 - $nil and $nil). Included in cost of sales is amortization of $500 and $889 (2016 - $228 and $482) related to capital assets utilized in production. During the three and six months ended November 30, 2017, the Company expensed $2,671 and $3,807 (2016 – $1,233 and $2,572) of fair value adjustments on the sale of its biological assets included in inventory.
The Company holds 1,382.4 kilograms of harvested cannabis (May 31, 2017 – 668.5 kgs), 688.9 kilograms of harvested cannabis trim (May 31, 2017 – 140.1 kgs) and 1,646.6 litres of cannabis oils or 274.4 kilograms equivalent (May 31, 2017 – 1,091.3 litres or 181.9 kilograms equivalent) at November 30, 2017.
7. Biological assets
Biological assets are comprised of:
The Company values medical cannabis plants at cost from the date of initial clipping from mother plants until the end of the twelfth week of its growing cycle. Measurement of the biological asset at fair value less costs to sell and costs to complete begins at the thirteenth week until harvest. The Company has determined the fair value less costs to sell of harvested cannabis
November 30,
2017May 31, 2017
HST receivable 5,970$ 3,675$
Accrued interest 1,088 701
Credit card receivable 188 103
Prepaid assets 605 1,060
Other 932 32
8,783$ 5,571$
Capitalized
cost
Fair value
adjustment
November 30,
2017May 31, 2017
Harvested cannabis 1,712$ 3,472$ 5,184$ 2,507$
Harvested cannabis trim 651 1,416 2,067 421
Cannabis oil 518 511 1,029 682
Packaging and supplies 426 -- 426 277
3,307$ 5,399$ 8,706$ 3,887$
Amount
Balance as at May 31, 2017 1,363$
Changes in fair value less costs to sell due to biological transformation 7,380
Production costs capitalized 3,642
Transferred to inventory upon harvest (10,956)
Transferred to capital assets (31)
Balance as at November 30, 2017 1,398$

Aphria Inc. Notes to the Condensed Interim Consolidated Financial Statements For the three months and six months ended November 30, 2017 and November 30, 2016 (Unaudited – In thousands of Canadian dollars, except share and per share amounts)
11
to be $3.75 per gram. The Company has determined the fair value less costs to sell of its harvested cannabis trim to be $3.00 per gram, upon harvest.
The net effect of the fair value less cost to sell over and above historical cost was an increase in non-cash value of biological assets and inventory of $3,115 and $7,380 during the three and six months ended November 30, 2017 (2016 – increase of $1,307 and $3,107). In determining the fair value of biological assets, management is required to make several estimates, including: the expected cost required to grow the cannabis up to the point of harvest; harvesting costs; selling costs; sales price; and, expected yields for the cannabis plant. All of which represent Level 3 on the fair value hierarchy. These estimates are subject to volatility in market prices and several uncontrollable factors, which could significantly affect the fair value of biological assets in future periods.
8. Related party transactions
Prior to going public, the Company funded operations through the support of related parties. Since going public, the Company has continued to leverage the purchasing power of these related parties for certain of its operating expenditures. The balance owing from related parties as at November 30, 2017 was $nil (May 31, 2017 - $464). These parties are related as they are corporations that are controlled by certain officers and directors of the Company.
During the three and six months ended November 30, 2017, related party corporations charged or incurred expenditures on behalf of the Company (including rent) totaling $54 and $93 (2016 - $72 and $267). Included in this amount was rent of $9 and $17 charged during the three and six months ended November 30, 2017 (2016 - $8 and $33).
The Company funded the start-up costs and operations of Liberty Health Sciences Inc. (formerly DFMMJ Investments, Ltd.), a related party through an equity investment.
During the period, the Company purchased capital assets for $995 from a company controlled by a director. During the prior year, the Company purchased 36 acres of farm land, with 9 acres of greenhouses located thereon, from F.M. and Cacciavillani Farms Ltd., a company controlled by a director, for $6,100. The purchase price was allocated as follows: (i) $1,300 to land; (ii) $3,550 to greenhouse infrastructure; and, (iii) $1,250 to licenses and permits – intangible assets.
Key management personnel compensation was comprised of:
Directors and officers of the Company control 11.1% or 16,858,264 of the voting shares of the Company.
Amount
Balance due to (from) related parties as at May 31, 2017 (464)$
Related party charges in the period 93
Payments to related parties in the period (93)
Non-cash payments made on behalf of related parties in the period (32)
Payments made on behalf of related parties in the period (2,234)
Repayments made by related parties in the period 2,730
Balance as at November 30, 2017 --$
2017 2016
Salaries 660$ 417$
Short-term employment benefits (included in office and general) 36 19
Share-based compensation 2,217 265
2,913$ 701$
For the six months ended
November 30,
Aphria Inc. Notes to the Condensed Interim Consolidated Financial Statements For the three months and six months ended November 30, 2017 and November 30, 2016 (Unaudited – In thousands of Canadian dollars, except share and per share amounts)
12
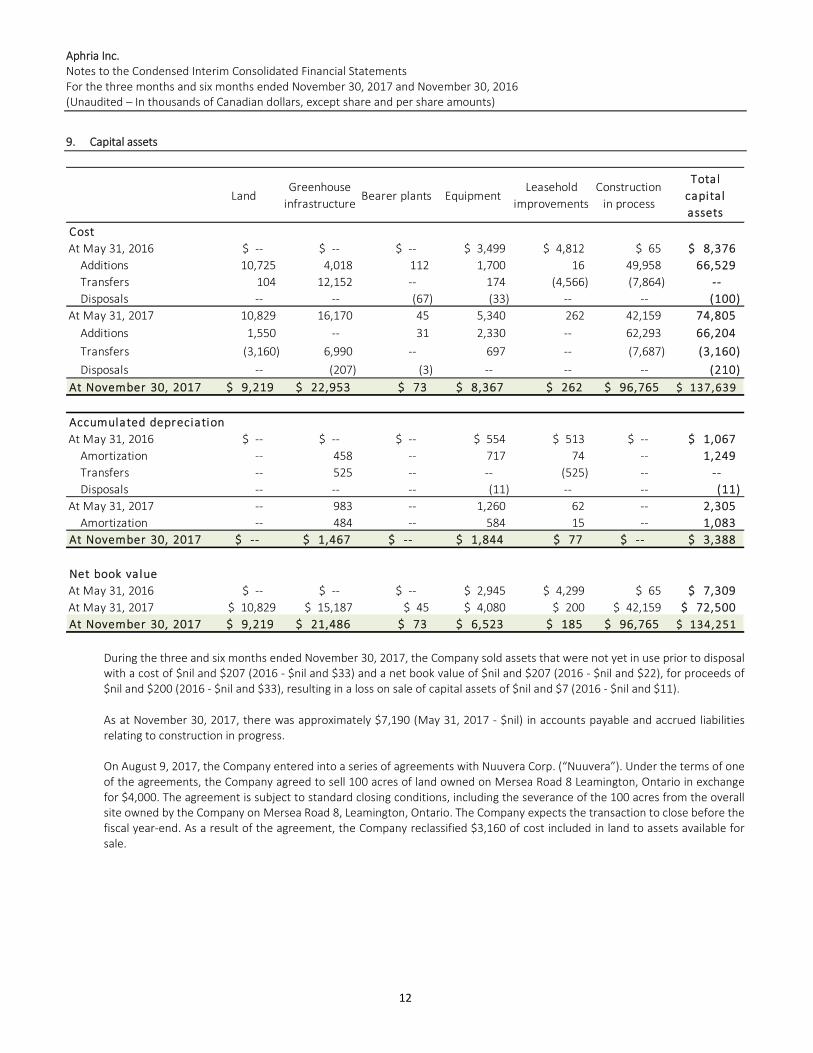
9. Capital assets
During the three and six months ended November 30, 2017, the Company sold assets that were not yet in use prior to disposal with a cost of $nil and $207 (2016 - $nil and $33) and a net book value of $nil and $207 (2016 - $nil and $22), for proceeds of $nil and $200 (2016 - $nil and $33), resulting in a loss on sale of capital assets of $nil and $7 (2016 - $nil and $11).
As at November 30, 2017, there was approximately $7,190 (May 31, 2017 - $nil) in accounts payable and accrued liabilities relating to construction in progress.
On August 9, 2017, the Company entered into a series of agreements with Nuuvera Corp. (“Nuuvera”). Under the terms of one of the agreements, the Company agreed to sell 100 acres of land owned on Mersea Road 8 Leamington, Ontario in exchange for $4,000. The agreement is subject to standard closing conditions, including the severance of the 100 acres from the overall site owned by the Company on Mersea Road 8, Leamington, Ontario. The Company expects the transaction to close before the fiscal year-end. As a result of the agreement, the Company reclassified $3,160 of cost included in land to assets available for sale.
LandGreenhouse
infrastructureBearer plants Equipment
Leasehold
improvements
Construction
in process
Total
capital
assets
Cost
At May 31, 2016 --$ --$ --$ 3,499$ 4,812$ 65$ 8,376$
Additions 10,725 4,018 112 1,700 16 49,958 66,529
Transfers 104 12,152 -- 174 (4,566) (7,864) --
Disposals -- -- (67) (33) -- -- (100)
At May 31, 2017 10,829 16,170 45 5,340 262 42,159 74,805
Additions 1,550 -- 31 2,330 -- 62,293 66,204
Transfers (3,160) 6,990 -- 697 -- (7,687) (3,160)
Disposals -- (207) (3) -- -- -- (210)
At November 30, 2017 9,219$ 22,953$ 73$ 8,367$ 262$ 96,765$ 137,639$
Accumulated depreciation
At May 31, 2016 --$ --$ --$ 554$ 513$ --$ 1,067$
Amortization -- 458 -- 717 74 -- 1,249
Transfers -- 525 -- -- (525) -- --
Disposals -- -- -- (11) -- -- (11)
At May 31, 2017 -- 983 -- 1,260 62 -- 2,305
Amortization -- 484 -- 584 15 -- 1,083
At November 30, 2017 --$ 1,467$ --$ 1,844$ 77$ --$ 3,388$
Net book value
At May 31, 2016 --$ --$ --$ 2,945$ 4,299$ 65$ 7,309$
At May 31, 2017 10,829$ 15,187$ 45$ 4,080$ 200$ 42,159$ 72,500$
At November 30, 2017 9,219$ 21,486$ 73$ 6,523$ 185$ 96,765$ 134,251$
Aphria Inc. Notes to the Condensed Interim Consolidated Financial Statements For the three months and six months ended November 30, 2017 and November 30, 2016 (Unaudited – In thousands of Canadian dollars, except share and per share amounts)
13
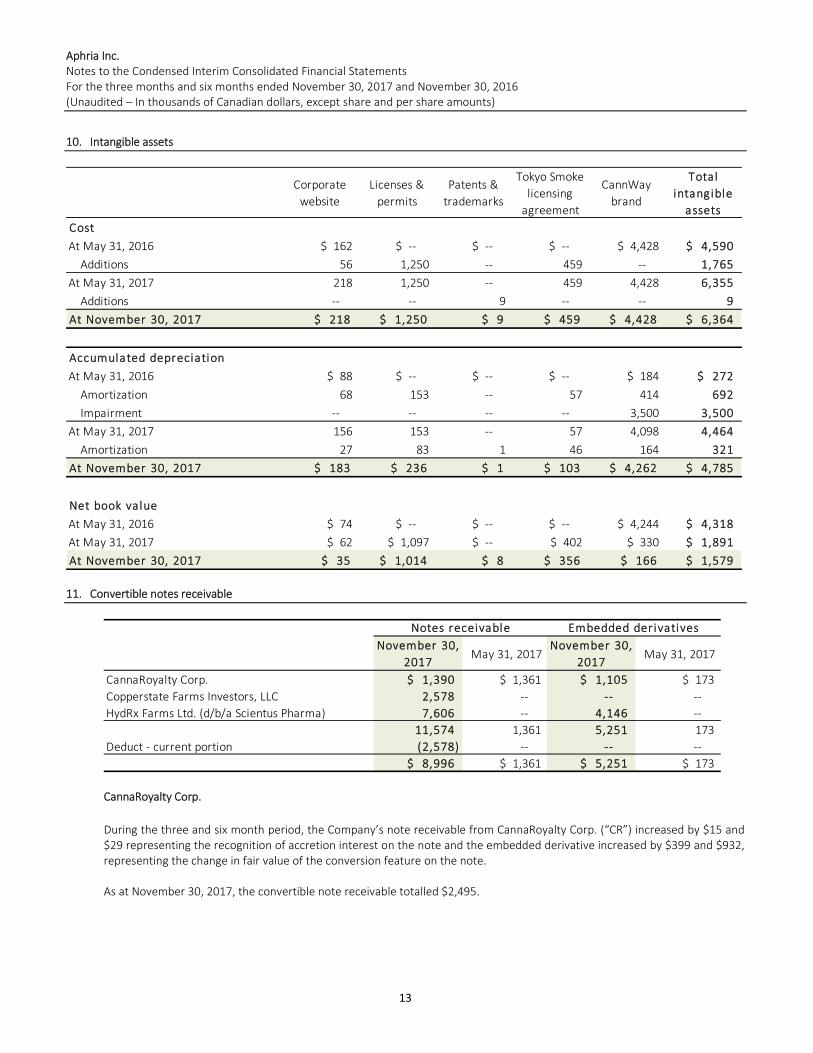
10. Intangible assets
11. Convertible notes receivable
CannaRoyalty Corp.
During the three and six month period, the Company’s note receivable from CannaRoyalty Corp. (“CR”) increased by $15 and $29 representing the recognition of accretion interest on the note and the embedded derivative increased by $399 and $932, representing the change in fair value of the conversion feature on the note.
As at November 30, 2017, the convertible note receivable totalled $2,495.
Corporate
website
Licenses &
permits
Patents &
trademarks
Tokyo Smoke
licensing
agreement
CannWay
brand
Total
intangible
assets
Cost
At May 31, 2016 162$ --$ --$ --$ 4,428$ 4,590$
Additions 56 1,250 -- 459 -- 1,765
At May 31, 2017 218 1,250 -- 459 4,428 6,355
Additions -- -- 9 -- -- 9
At November 30, 2017 218$ 1,250$ 9$ 459$ 4,428$ 6,364$
Accumulated depreciation
At May 31, 2016 88$ --$ --$ --$ 184$ 272$
Amortization 68 153 -- 57 414 692
Impairment -- -- -- -- 3,500 3,500
At May 31, 2017 156 153 -- 57 4,098 4,464
Amortization 27 83 1 46 164 321
At November 30, 2017 183$ 236$ 1$ 103$ 4,262$ 4,785$
Net book value
At May 31, 2016 74$ --$ --$ --$ 4,244$ 4,318$
At May 31, 2017 62$ 1,097$ --$ 402$ 330$ 1,891$
At November 30, 2017 35$ 1,014$ 8$ 356$ 166$ 1,579$
November 30,
2017 May 31, 2017
November 30,
2017 May 31, 2017
CannaRoyalty Corp. 1,390$ 1,361$ 1,105$ 173$
Copperstate Farms Investors, LLC 2,578 -- -- --
HydRx Farms Ltd. (d/b/a Scientus Pharma) 7,606 -- 4,146 --
11,574 1,361 5,251 173
Deduct - current portion (2,578) -- -- --
8,996$ 1,361$ 5,251$ 173$
Notes receivable Embedded derivatives
Aphria Inc. Notes to the Condensed Interim Consolidated Financial Statements For the three months and six months ended November 30, 2017 and November 30, 2016 (Unaudited – In thousands of Canadian dollars, except share and per share amounts)
14
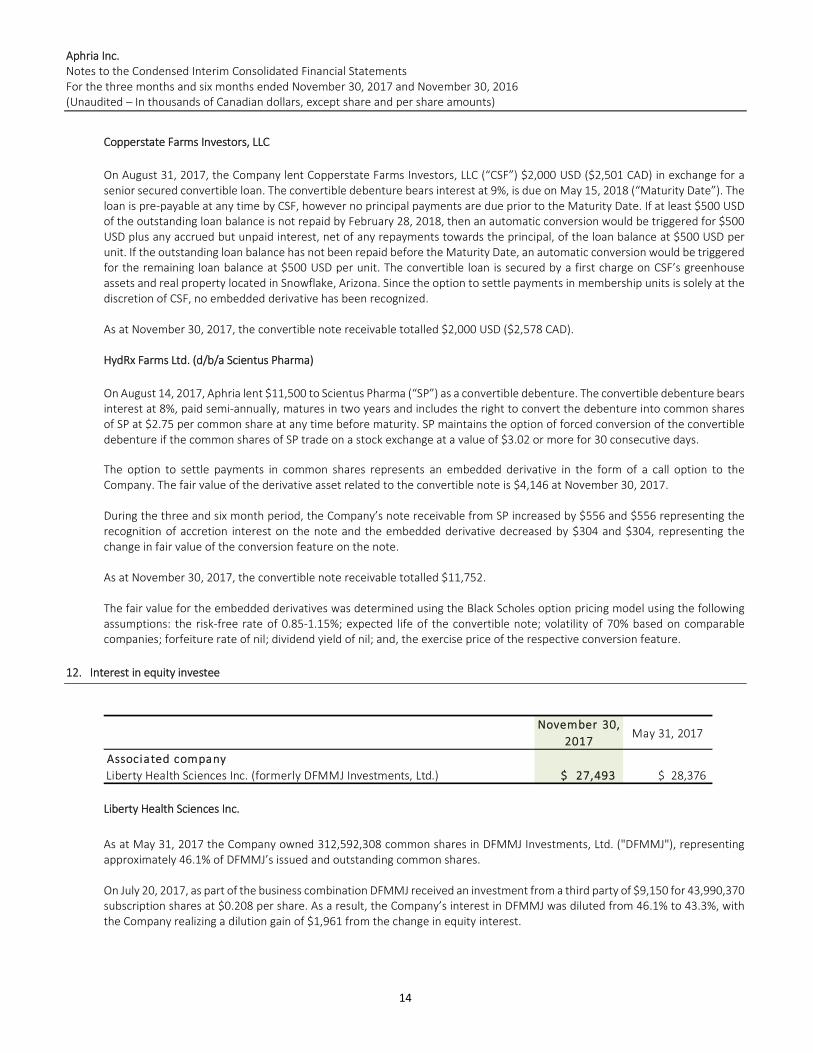
Copperstate Farms Investors, LLC
On August 31, 2017, the Company lent Copperstate Farms Investors, LLC (“CSF”) $2,000 USD ($2,501 CAD) in exchange for a senior secured convertible loan. The convertible debenture bears interest at 9%, is due on May 15, 2018 (“Maturity Date”). The loan is pre-payable at any time by CSF, however no principal payments are due prior to the Maturity Date. If at least $500 USD of the outstanding loan balance is not repaid by February 28, 2018, then an automatic conversion would be triggered for $500 USD plus any accrued but unpaid interest, net of any repayments towards the principal, of the loan balance at $500 USD per unit. If the outstanding loan balance has not been repaid before the Maturity Date, an automatic conversion would be triggered for the remaining loan balance at $500 USD per unit. The convertible loan is secured by a first charge on CSF’s greenhouse assets and real property located in Snowflake, Arizona. Since the option to settle payments in membership units is solely at the discretion of CSF, no embedded derivative has been recognized.
As at November 30, 2017, the convertible note receivable totalled $2,000 USD ($2,578 CAD).
HydRx Farms Ltd. (d/b/a Scientus Pharma)
On August 14, 2017, Aphria lent $11,500 to Scientus Pharma (“SP”) as a convertible debenture. The convertible debenture bears interest at 8%, paid semi-annually, matures in two years and includes the right to convert the debenture into common shares of SP at $2.75 per common share at any time before maturity. SP maintains the option of forced conversion of the convertible debenture if the common shares of SP trade on a stock exchange at a value of $3.02 or more for 30 consecutive days.
The option to settle payments in common shares represents an embedded derivative in the form of a call option to the Company. The fair value of the derivative asset related to the convertible note is $4,146 at November 30, 2017.
During the three and six month period, the Company’s note receivable from SP increased by $556 and $556 representing the recognition of accretion interest on the note and the embedded derivative decreased by $304 and $304, representing the change in fair value of the conversion feature on the note.
As at November 30, 2017, the convertible note receivable totalled $11,752.
The fair value for the embedded derivatives was determined using the Black Scholes option pricing model using the following assumptions: the risk-free rate of 0.85-1.15%; expected life of the convertible note; volatility of 70% based on comparable companies; forfeiture rate of nil; dividend yield of nil; and, the exercise price of the respective conversion feature.
12. Interest in equity investee
Liberty Health Sciences Inc.
As at May 31, 2017 the Company owned 312,592,308 common shares in DFMMJ Investments, Ltd. ("DFMMJ"), representing approximately 46.1% of DFMMJ’s issued and outstanding common shares.
On July 20, 2017, as part of the business combination DFMMJ received an investment from a third party of $9,150 for 43,990,370 subscription shares at $0.208 per share. As a result, the Company’s interest in DFMMJ was diluted from 46.1% to 43.3%, with the Company realizing a dilution gain of $1,961 from the change in equity interest.
November 30,
2017May 31, 2017
Associated company
Liberty Health Sciences Inc. (formerly DFMMJ Investments, Ltd.) 27,493$ 28,376$
Aphria Inc. Notes to the Condensed Interim Consolidated Financial Statements For the three months and six months ended November 30, 2017 and November 30, 2016 (Unaudited – In thousands of Canadian dollars, except share and per share amounts)
15
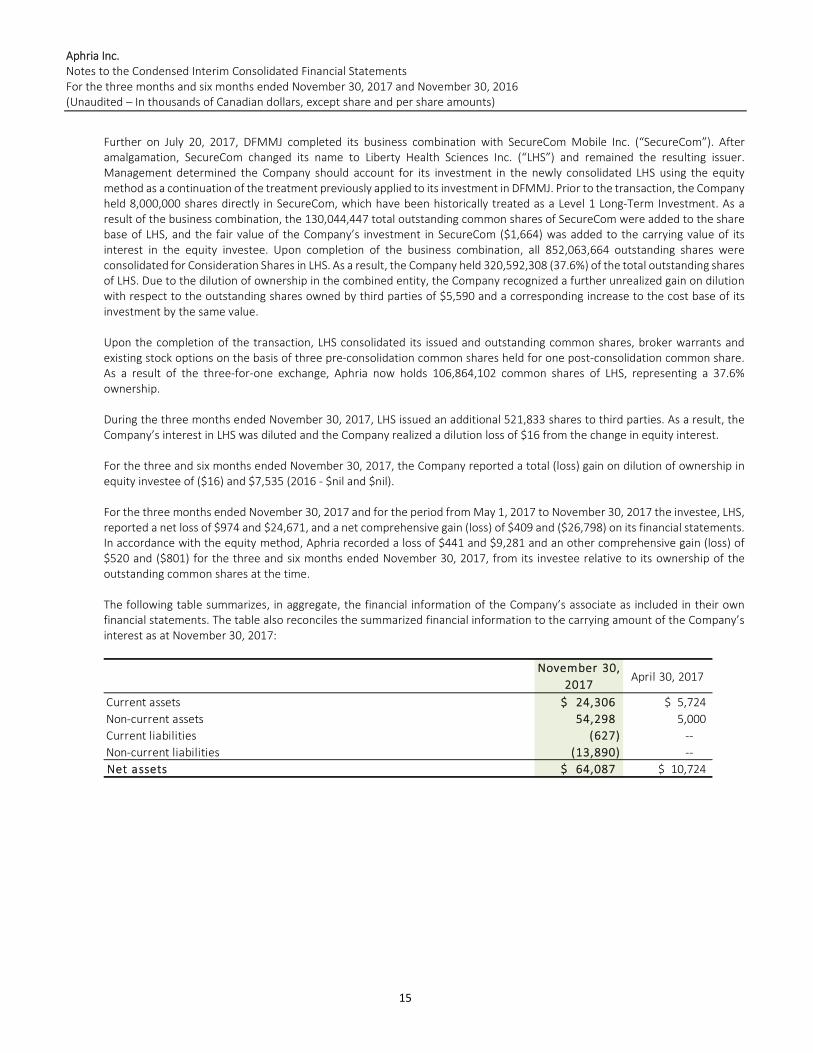
Further on July 20, 2017, DFMMJ completed its business combination with SecureCom Mobile Inc. (“SecureCom”). After amalgamation, SecureCom changed its name to Liberty Health Sciences Inc. (“LHS”) and remained the resulting issuer. Management determined the Company should account for its investment in the newly consolidated LHS using the equity method as a continuation of the treatment previously applied to its investment in DFMMJ. Prior to the transaction, the Company held 8,000,000 shares directly in SecureCom, which have been historically treated as a Level 1 Long-Term Investment. As a result of the business combination, the 130,044,447 total outstanding common shares of SecureCom were added to the share base of LHS, and the fair value of the Company’s investment in SecureCom ($1,664) was added to the carrying value of its interest in the equity investee. Upon completion of the business combination, all 852,063,664 outstanding shares were consolidated for Consideration Shares in LHS. As a result, the Company held 320,592,308 (37.6%) of the total outstanding shares of LHS. Due to the dilution of ownership in the combined entity, the Company recognized a further unrealized gain on dilution with respect to the outstanding shares owned by third parties of $5,590 and a corresponding increase to the cost base of its investment by the same value.
Upon the completion of the transaction, LHS consolidated its issued and outstanding common shares, broker warrants and existing stock options on the basis of three pre-consolidation common shares held for one post-consolidation common share. As a result of the three-for-one exchange, Aphria now holds 106,864,102 common shares of LHS, representing a 37.6% ownership.
During the three months ended November 30, 2017, LHS issued an additional 521,833 shares to third parties. As a result, the Company’s interest in LHS was diluted and the Company realized a dilution loss of $16 from the change in equity interest.
For the three and six months ended November 30, 2017, the Company reported a total (loss) gain on dilution of ownership in equity investee of ($16) and $7,535 (2016 - $nil and $nil).
For the three months ended November 30, 2017 and for the period from May 1, 2017 to November 30, 2017 the investee, LHS, reported a net loss of $974 and $24,671, and a net comprehensive gain (loss) of $409 and ($26,798) on its financial statements. In accordance with the equity method, Aphria recorded a loss of $441 and $9,281 and an other comprehensive gain (loss) of $520 and ($801) for the three and six months ended November 30, 2017, from its investee relative to its ownership of the outstanding common shares at the time.
The following table summarizes, in aggregate, the financial information of the Company’s associate as included in their own financial statements. The table also reconciles the summarized financial information to the carrying amount of the Company’s interest as at November 30, 2017:
November 30,
2017April 30, 2017
Current assets 24,306$ 5,724$
Non-current assets 54,298 5,000
Current liabilities (627) --
Non-current liabilities (13,890) --
Net assets 64,087$ 10,724$
Aphria Inc. Notes to the Condensed Interim Consolidated Financial Statements For the three months and six months ended November 30, 2017 and November 30, 2016 (Unaudited – In thousands of Canadian dollars, except share and per share amounts)
16
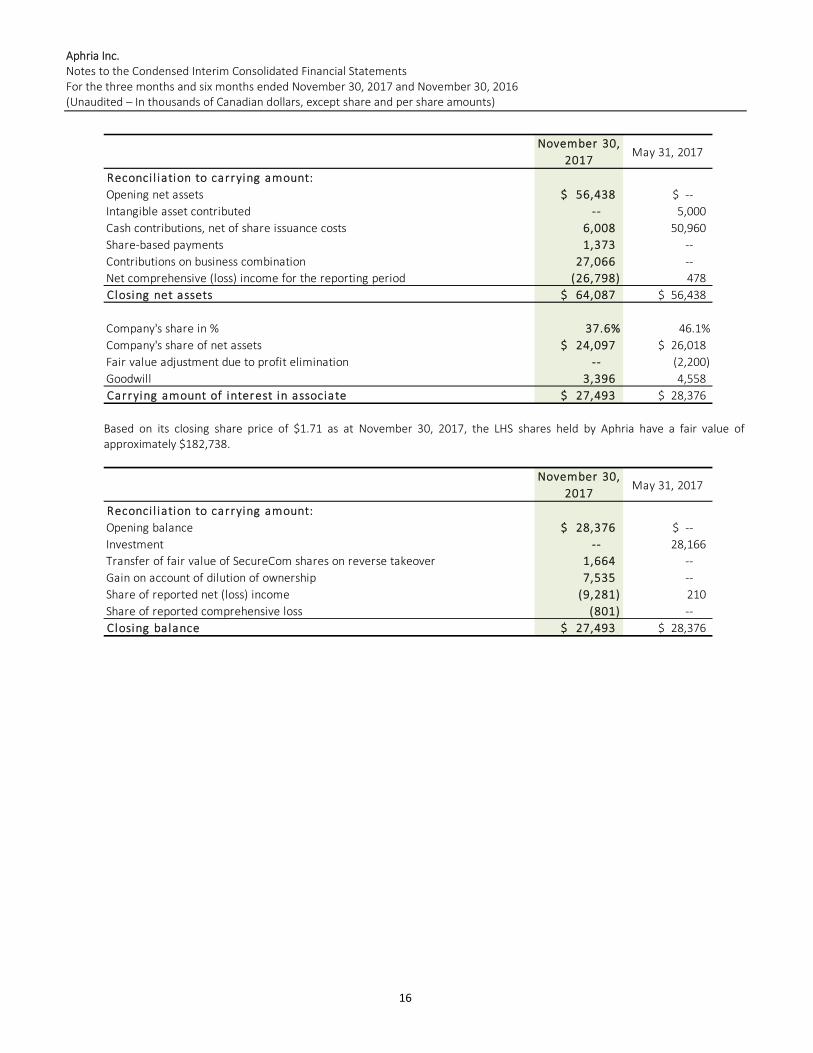
Based on its closing share price of $1.71 as at November 30, 2017, the LHS shares held by Aphria have a fair value of approximately $182,738.
November 30,
2017May 31, 2017
Reconci l iation to carrying amount:
Opening net assets 56,438$ --$
Intangible asset contributed -- 5,000
Cash contributions, net of share issuance costs 6,008 50,960
Share-based payments 1,373 --
Contributions on business combination 27,066 --
Net comprehensive (loss) income for the reporting period (26,798) 478
Closing net assets 64,087$ 56,438$
Company's share in % 37.6% 46.1%
Company's share of net assets 24,097$ 26,018$
Fair value adjustment due to profit elimination -- (2,200)
Goodwill 3,396 4,558
Carrying amount of interest in associate 27,493$ 28,376$
November 30,
2017May 31, 2017
Reconci l iation to carrying amount:
Opening balance 28,376$ --$
Investment -- 28,166
Transfer of fair value of SecureCom shares on reverse takeover 1,664 --
Gain on account of dilution of ownership 7,535 --
Share of reported net (loss) income (9,281) 210
Share of reported comprehensive loss (801) --
Closing balance 27,493$ 28,376$

Aphria Inc. Notes to the Condensed Interim Consolidated Financial Statements For the three months and six months ended November 30, 2017 and November 30, 2016 (Unaudited – In thousands of Canadian dollars, except share and per share amounts)
17
13. Long-term investments
The fair value attached to warrants in both Level 1 and Level 3 were determined using the Black-Scholes option pricing model.
CannaRoyalty Corp.
The Company holds 1,100,000 common shares at a cost of $1,380, with a fair value of $3,234 as at November 30, 2017.
Kalytera Therapeutics, Inc.
During the period, the Company sold its 6,172,000 common shares in Kalytera Therapeutics, Inc. (note 24).
MassRoots, Inc.
During the period, the Company sold 350,000 common shares in MassRoots, Inc. (note 24). The Company holds 500,000 common shares at a cost of $251 USD ($304 CAD), with a fair value of $107 USD ($138 CAD) as at November 30, 2017.
SecureCom Mobile Inc. (“SecureCom”)
In July 2017, SecureCom amalgamated with DFMMJ and was re-named LHS. As a result, the Company transferred the fair value of its investment in SecureCom into its investment in LHS recognized as Interest in equity investee (note 12).
Tetra Bio-Pharma Inc.
The Company owns 10,000,000 common shares at a cost of $2,300, with a fair value of $6,900 as at November 30, 2017.
Canabo Medical Inc.
The Company owns 800,000 common shares with a cost of $1,160 and a fair value of $520 as at November 30, 2017.
Cost
May 31,
2017
Fair va lue
May 31,
2017
Investment Divesture/
Transfer
Subtotal
November 30,
2017
Change in
fair va lue
Fa ir value
November 30,
2017
Level 1 on fa ir value hierarchy
CannaRoyalty Corp. 1,380$ 1,793$ --$ --$ 1,793$ 1,441$ 3,234$
Kalytera Therapeutics, Inc. 3,014 1,111 -- (1,111) -- -- --
MassRoots, Inc. 508 562 -- (232) 330 (192) 138
SecureCom Mobile Inc. 520 1,664 -- (1,664) -- -- --
Tetra Bio-Pharma Inc. 2,300 9,500 -- -- 9,500 (2,600) 6,900
Canabo Medical Inc. 1,160 316 -- -- 316 204 520
8,882 14,946 -- (3,007) 11,939 (1,147) 10,792
Level 3 on fa ir value hierarchy
Copperstate Farms, LLC 1,755 1,755 -- -- 1,755 5,691 7,446
Copperstate Farms Investors, LLC 7,539 7,560 1,868 -- 9,428 17,434 26,862
Resolve Digital Health Inc. 718 1,000 -- -- 1,000 (282) 718
Resolve Digital Health Inc. 282 242 -- -- 242 (42) 200
Green Acre Capital Fund 300 285 400 -- 685 45 730
Scythian Biosciences Inc. 2,000 2,000 -- (2,000) -- -- --
TS BrandCo Holdings Inc. -- -- 1,000 -- 1,000 1,746 2,746
Nuuvera Corp. -- -- 6,979 -- 6,979 2,971 9,950
Green Tank Holdings Corp. -- -- 650 -- 650 (6) 644
12,594 12,842 10,897 (2,000) 21,739 27,557 49,296
21,476$ 27,788$ 10,897$ (5,007)$ 33,678$ 26,410$ 60,088$
Aphria Inc. Notes to the Condensed Interim Consolidated Financial Statements For the three months and six months ended November 30, 2017 and November 30, 2016 (Unaudited – In thousands of Canadian dollars, except share and per share amounts)
18
Scythian Biosciences Inc. (“Scythian”)
In August 2017, the Company’s subscription receipts converted to common shares. As part of the conversion, Scythian consolidated its shares on a 20:1 basis. On August 8, 2017, Scythian began trading on the TSX-Venture Exchange. During the period, the Company sold its 250,000 common shares in Scythian Biosciences Inc. (note 24).
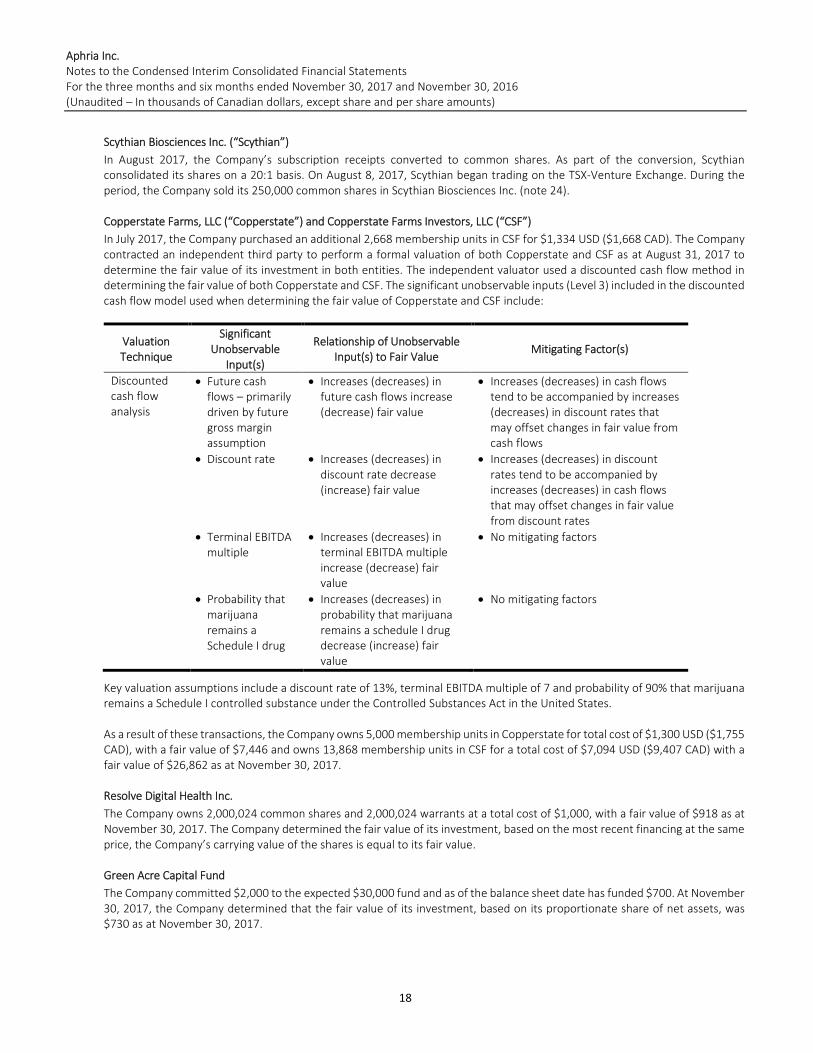
Copperstate Farms, LLC (“Copperstate”) and Copperstate Farms Investors, LLC (“CSF”)
In July 2017, the Company purchased an additional 2,668 membership units in CSF for $1,334 USD ($1,668 CAD). The Company contracted an independent third party to perform a formal valuation of both Copperstate and CSF as at August 31, 2017 to determine the fair value of its investment in both entities. The independent valuator used a discounted cash flow method in determining the fair value of both Copperstate and CSF. The significant unobservable inputs (Level 3) included in the discounted cash flow model used when determining the fair value of Copperstate and CSF include:
Valuation Technique
Significant Unobservable
Input(s)
Relationship of Unobservable Input(s) to Fair Value
Mitigating Factor(s)
Discounted cash flow analysis
Future cash flows – primarily driven by future gross margin assumption
Increases (decreases) in future cash flows increase (decrease) fair value
Increases (decreases) in cash flows tend to be accompanied by increases (decreases) in discount rates that may offset changes in fair value from cash flows
Discount rate Increases (decreases) in discount rate decrease (increase) fair value
Increases (decreases) in discount rates tend to be accompanied by increases (decreases) in cash flows that may offset changes in fair value from discount rates
Terminal EBITDA multiple
Increases (decreases) in terminal EBITDA multiple increase (decrease) fair value
No mitigating factors
Probability that marijuana remains a Schedule I drug
Increases (decreases) in probability that marijuana remains a schedule I drug decrease (increase) fair value
No mitigating factors
Key valuation assumptions include a discount rate of 13%, terminal EBITDA multiple of 7 and probability of 90% that marijuana remains a Schedule I controlled substance under the Controlled Substances Act in the United States.
As a result of these transactions, the Company owns 5,000 membership units in Copperstate for total cost of $1,300 USD ($1,755 CAD), with a fair value of $7,446 and owns 13,868 membership units in CSF for a total cost of $7,094 USD ($9,407 CAD) with a fair value of $26,862 as at November 30, 2017.
Resolve Digital Health Inc.
The Company owns 2,000,024 common shares and 2,000,024 warrants at a total cost of $1,000, with a fair value of $918 as at November 30, 2017. The Company determined the fair value of its investment, based on the most recent financing at the same price, the Company’s carrying value of the shares is equal to its fair value.
Green Acre Capital Fund
The Company committed $2,000 to the expected $30,000 fund and as of the balance sheet date has funded $700. At November 30, 2017, the Company determined that the fair value of its investment, based on its proportionate share of net assets, was $730 as at November 30, 2017.
Aphria Inc. Notes to the Condensed Interim Consolidated Financial Statements For the three months and six months ended November 30, 2017 and November 30, 2016 (Unaudited – In thousands of Canadian dollars, except share and per share amounts)
19
TS BrandCo Holdings Inc.
In June 2017, the Company entered into a subscription agreement with TS BrandCo Holdings Inc. (“Tokyo Smoke”) for the purchase of 140,845 common shares, for a total cost of $1,000. The Company has determined that, due to the recent merger with a third party public company (note 29), the fair value was $2,746 as at November 30, 2017.
Nuuvera Corp.
In August 2017, the Company entered into a subscription agreement with Nuuvera Corp. for the purchase of 2,000,000 common shares, for a total cost of $2,029. In November 2017, the Company purchased an additional 1,980,000 common shares for $4,950. The Company has determined that, due to the recent equity financing with third parties, the fair value was $9,950 as at November 30, 2017.
Green Tank Holdings Corp.
In November 2017, the Company entered into a subscription agreement with Green Tank Holdings Corp. for the purchase of 98,425 preferred shares, for a total cost of $500 USD ($650 CAD). The Company determined the fair value of its investment, based on the most recent financing at the same price, is equal to its carrying value. The Company recognized a loss from the change in fair value of $6 due to changes in the foreign exchange rate.
14. Income taxes and deferred income taxes
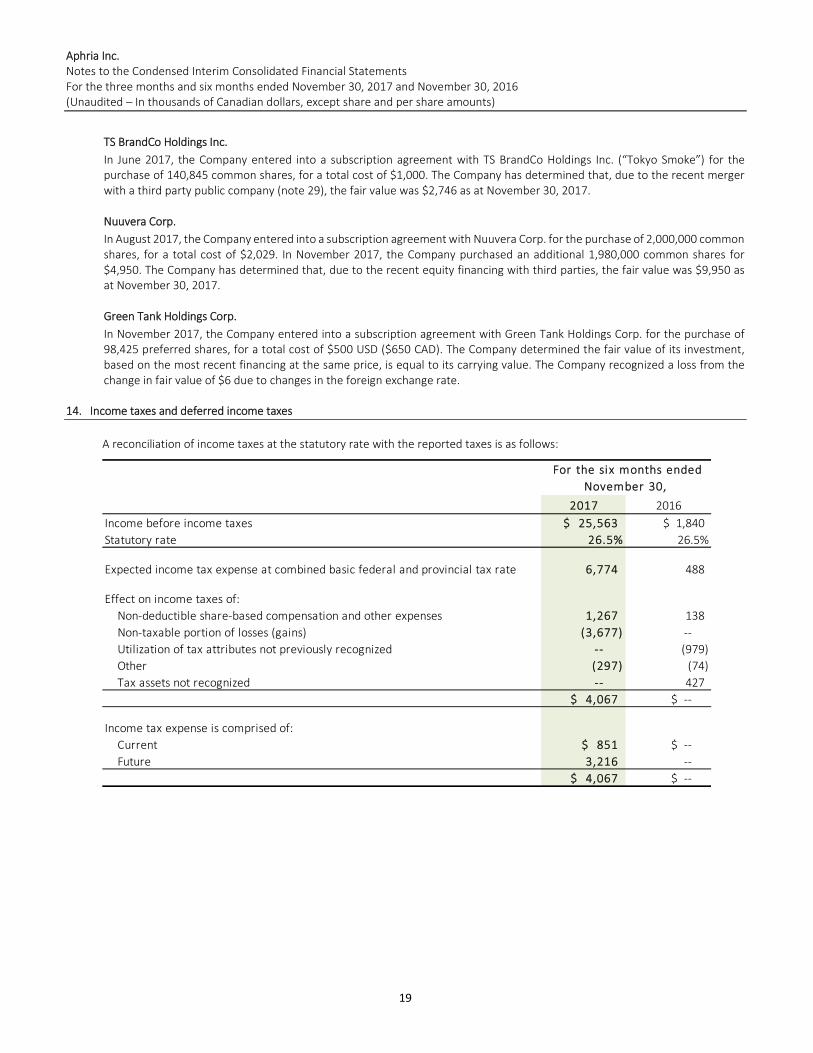
A reconciliation of income taxes at the statutory rate with the reported taxes is as follows:
2017 2016
Income before income taxes 25,563$ 1,840$
Statutory rate 26.5% 26.5%
Expected income tax expense at combined basic federal and provincial tax rate 6,774 488
Effect on income taxes of:
Non-deductible share-based compensation and other expenses 1,267 138
Non-taxable portion of losses (gains) (3,677) --
Utilization of tax attributes not previously recognized -- (979)
Other (297) (74)
Tax assets not recognized -- 427
4,067$ --$
Income tax expense is comprised of:
Current 851$ --$
Future 3,216 --
4,067$ --$
For the six months ended
November 30,
Aphria Inc. Notes to the Condensed Interim Consolidated Financial Statements For the three months and six months ended November 30, 2017 and November 30, 2016 (Unaudited – In thousands of Canadian dollars, except share and per share amounts)
20
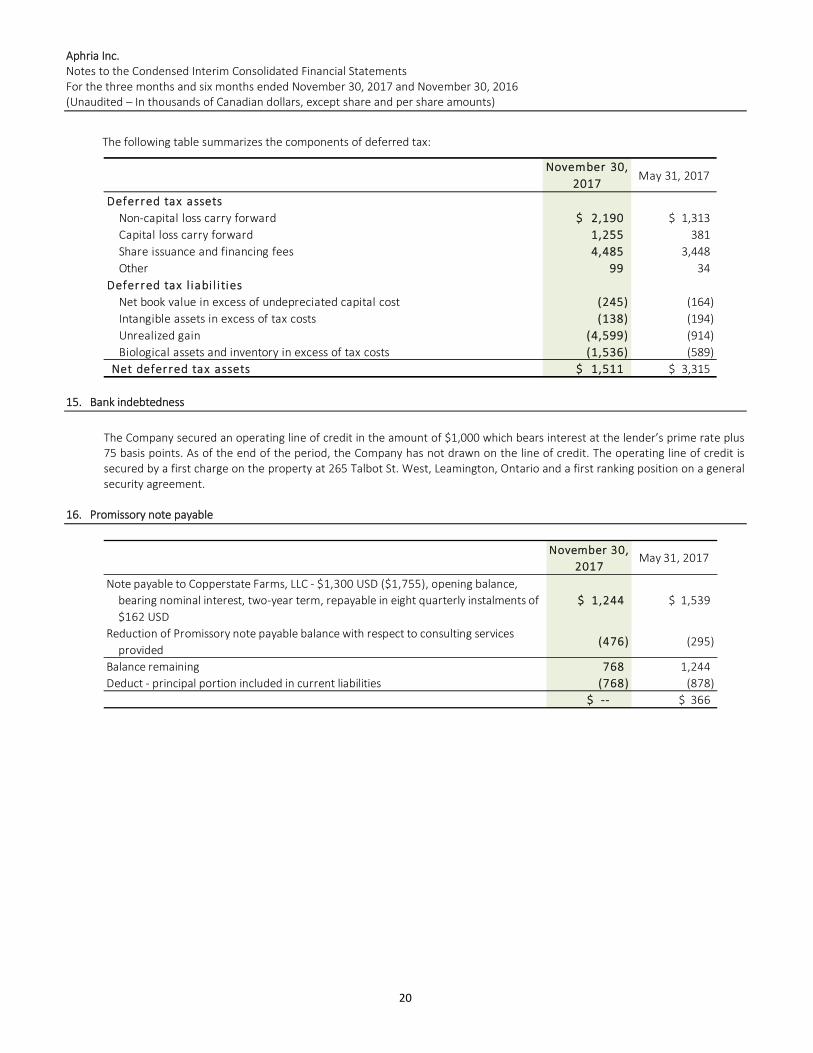
The following table summarizes the components of deferred tax:
15. Bank indebtedness
The Company secured an operating line of credit in the amount of $1,000 which bears interest at the lender’s prime rate plus 75 basis points. As of the end of the period, the Company has not drawn on the line of credit. The operating line of credit is secured by a first charge on the property at 265 Talbot St. West, Leamington, Ontario and a first ranking position on a general security agreement.
16. Promissory note payable
November 30,
2017May 31, 2017
Deferred tax assets
Non-capital loss carry forward 2,190$ 1,313$
Capital loss carry forward 1,255 381
Share issuance and financing fees 4,485 3,448
Other 99 34
Deferred tax l iabi l i ties
Net book value in excess of undepreciated capital cost (245) (164)
Intangible assets in excess of tax costs (138) (194)
Unrealized gain (4,599) (914)
Biological assets and inventory in excess of tax costs (1,536) (589)
Net deferred tax assets 1,511$ 3,315$
November 30,
2017May 31, 2017
Note payable to Copperstate Farms, LLC - $1,300 USD ($1,755), opening balance,
1,244$ 1,539$
Reduction of Promissory note payable balance with respect to consulting services
provided
Balance remaining 768 1,244
Deduct - principal portion included in current liabilities (768) (878)
--$ 366$
bearing nominal interest, two-year term, repayable in eight quarterly instalments of
$162 USD
(295)(476)
Aphria Inc. Notes to the Condensed Interim Consolidated Financial Statements For the three months and six months ended November 30, 2017 and November 30, 2016 (Unaudited – In thousands of Canadian dollars, except share and per share amounts)
21
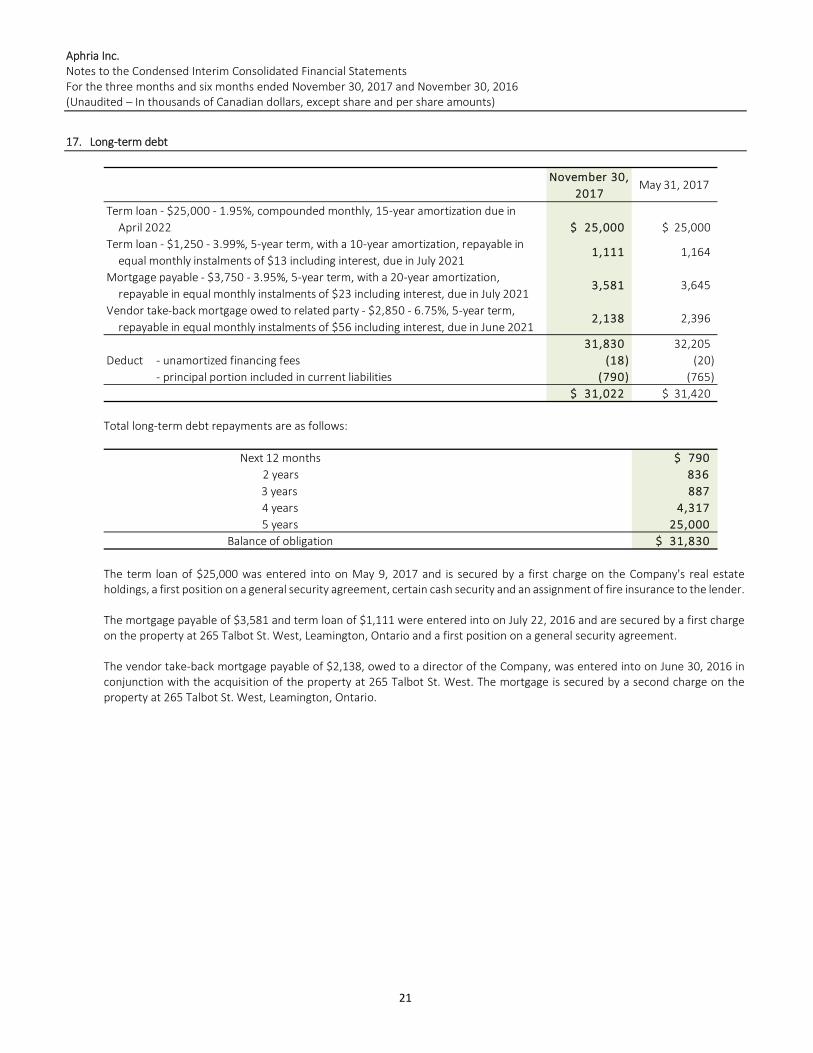
17. Long-term debt
Total long-term debt repayments are as follows:
The term loan of $25,000 was entered into on May 9, 2017 and is secured by a first charge on the Company's real estate holdings, a first position on a general security agreement, certain cash security and an assignment of fire insurance to the lender.
The mortgage payable of $3,581 and term loan of $1,111 were entered into on July 22, 2016 and are secured by a first charge on the property at 265 Talbot St. West, Leamington, Ontario and a first position on a general security agreement.
The vendor take-back mortgage payable of $2,138, owed to a director of the Company, was entered into on June 30, 2016 in conjunction with the acquisition of the property at 265 Talbot St. West. The mortgage is secured by a second charge on the property at 265 Talbot St. West, Leamington, Ontario.
November 30,
2017May 31, 2017
Term loan - $25,000 - 1.95%, compounded monthly, 15-year amortization due in
April 2022 25,000$ 25,000$
Term loan - $1,250 - 3.99%, 5-year term, with a 10-year amortization, repayable in
equal monthly instalments of $13 including interest, due in July 2021
Mortgage payable - $3,750 - 3.95%, 5-year term, with a 20-year amortization,
Vendor take-back mortgage owed to related party - $2,850 - 6.75%, 5-year term,
repayable in equal monthly instalments of $56 including interest, due in June 2021
31,830 32,205
Deduct - unamortized financing fees (18) (20)
- principal portion included in current liabilities (790) (765)
31,022$ 31,420$
repayable in equal monthly instalments of $23 including interest, due in July 20213,6453,581
1,1641,111
2,3962,138
Next 12 months 790$
2 years 836
3 years 887
4 years 4,317
5 years 25,000
Balance of obligation 31,830$
Aphria Inc. Notes to the Condensed Interim Consolidated Financial Statements For the three months and six months ended November 30, 2017 and November 30, 2016 (Unaudited – In thousands of Canadian dollars, except share and per share amounts)
22
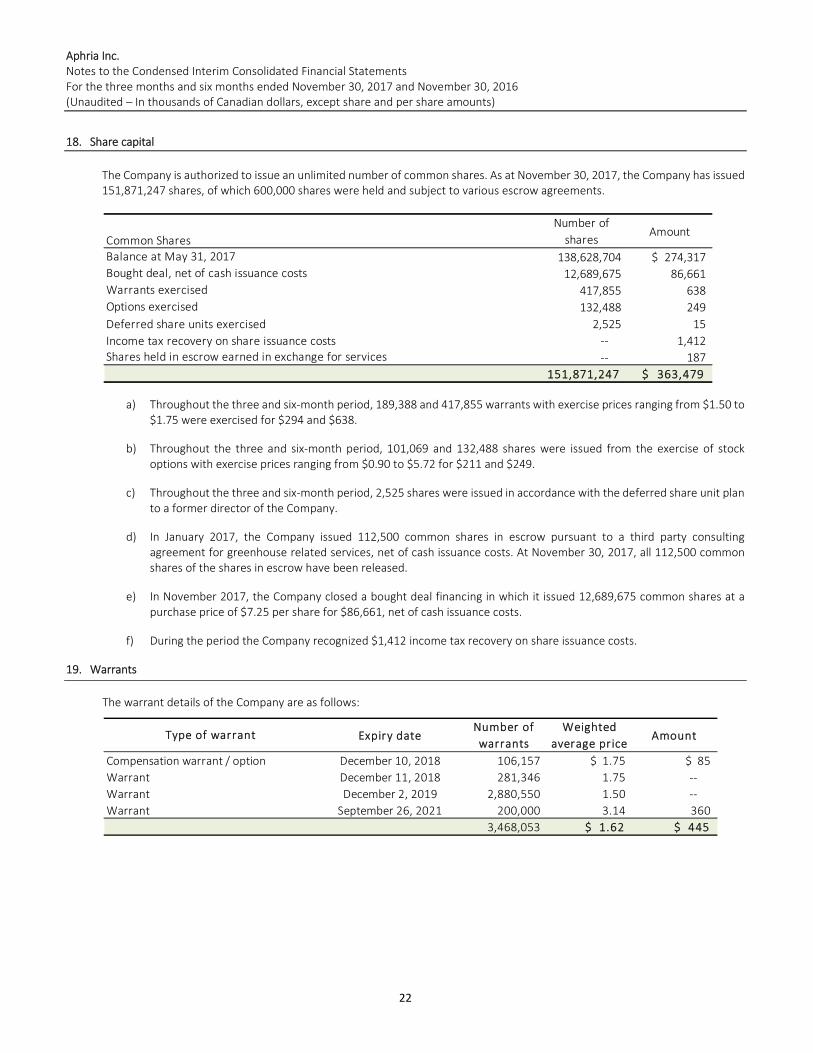
18. Share capital
The Company is authorized to issue an unlimited number of common shares. As at November 30, 2017, the Company has issued 151,871,247 shares, of which 600,000 shares were held and subject to various escrow agreements.
a) Throughout the three and six-month period, 189,388 and 417,855 warrants with exercise prices ranging from $1.50 to $1.75 were exercised for $294 and $638.
b) Throughout the three and six-month period, 101,069 and 132,488 shares were issued from the exercise of stock options with exercise prices ranging from $0.90 to $5.72 for $211 and $249.
c) Throughout the three and six-month period, 2,525 shares were issued in accordance with the deferred share unit plan to a former director of the Company.
d) In January 2017, the Company issued 112,500 common shares in escrow pursuant to a third party consulting agreement for greenhouse related services, net of cash issuance costs. At November 30, 2017, all 112,500 common shares of the shares in escrow have been released.
e) In November 2017, the Company closed a bought deal financing in which it issued 12,689,675 common shares at a purchase price of $7.25 per share for $86,661, net of cash issuance costs.
f) During the period the Company recognized $1,412 income tax recovery on share issuance costs.
19. Warrants
The warrant details of the Company are as follows:
Common Shares
Number of
sharesAmount
138,628,704 274,317$
12,689,675 86,661
417,855 638
132,488 249
Deferred share units exercised 2,525 15
Income tax recovery on share issuance costs -- 1,412
-- 187
151,871,247 363,479$
Shares held in escrow earned in exchange for services
Balance at May 31, 2017
Bought deal, net of cash issuance costs
Warrants exercised
Options exercised
Expiry dateNumber of
warrants
Weighted
average priceAmount
Compensation warrant / option December 10, 2018 106,157 1.75$ 85$
Warrant December 11, 2018 281,346 1.75 --
Warrant December 2, 2019 2,880,550 1.50 --
Warrant September 26, 2021 200,000 3.14 360
3,468,053 1.62$ 445$
Type of warrant
Aphria Inc. Notes to the Condensed Interim Consolidated Financial Statements For the three months and six months ended November 30, 2017 and November 30, 2016 (Unaudited – In thousands of Canadian dollars, except share and per share amounts)
23
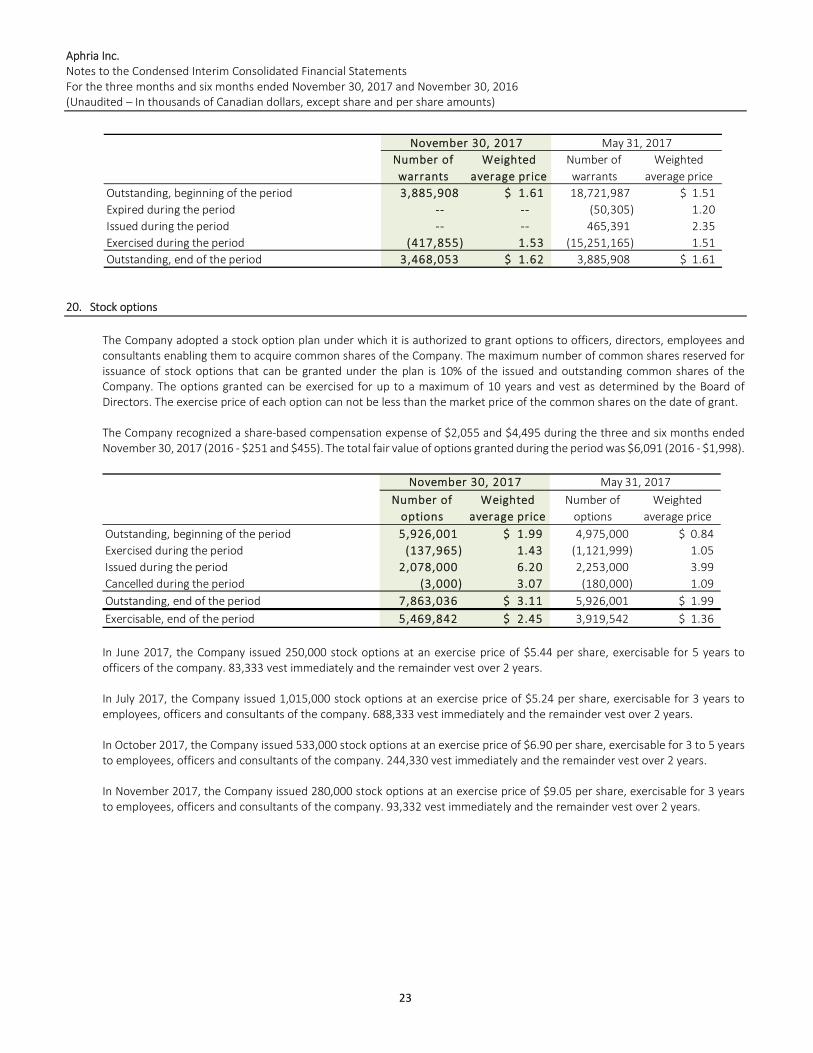
20. Stock options
The Company adopted a stock option plan under which it is authorized to grant options to officers, directors, employees and consultants enabling them to acquire common shares of the Company. The maximum number of common shares reserved for issuance of stock options that can be granted under the plan is 10% of the issued and outstanding common shares of the Company. The options granted can be exercised for up to a maximum of 10 years and vest as determined by the Board of Directors. The exercise price of each option can not be less than the market price of the common shares on the date of grant.
The Company recognized a share-based compensation expense of $2,055 and $4,495 during the three and six months ended November 30, 2017 (2016 - $251 and $455). The total fair value of options granted during the period was $6,091 (2016 - $1,998).
In June 2017, the Company issued 250,000 stock options at an exercise price of $5.44 per share, exercisable for 5 years to officers of the company. 83,333 vest immediately and the remainder vest over 2 years.
In July 2017, the Company issued 1,015,000 stock options at an exercise price of $5.24 per share, exercisable for 3 years to employees, officers and consultants of the company. 688,333 vest immediately and the remainder vest over 2 years.
In October 2017, the Company issued 533,000 stock options at an exercise price of $6.90 per share, exercisable for 3 to 5 years to employees, officers and consultants of the company. 244,330 vest immediately and the remainder vest over 2 years.
In November 2017, the Company issued 280,000 stock options at an exercise price of $9.05 per share, exercisable for 3 years to employees, officers and consultants of the company. 93,332 vest immediately and the remainder vest over 2 years.
Number of
warrants
Weighted
average price
Number of
warrants
Weighted
average price
Outstanding, beginning of the period 3,885,908 1.61$ 18,721,987 1.51$
Expired during the period -- -- (50,305) 1.20
Issued during the period -- -- 465,391 2.35
Exercised during the period (417,855) 1.53 (15,251,165) 1.51
Outstanding, end of the period 3,468,053 1.62$ 3,885,908 1.61$
November 30, 2017 May 31, 2017
Number of
options
Weighted
average price
Number of
options
Weighted
average price
Outstanding, beginning of the period 5,926,001 1.99$ 4,975,000 0.84$
Exercised during the period (137,965) 1.43 (1,121,999) 1.05
Issued during the period 2,078,000 6.20 2,253,000 3.99
Cancelled during the period (3,000) 3.07 (180,000) 1.09
Outstanding, end of the period 7,863,036 3.11$ 5,926,001 1.99$
Exercisable, end of the period 5,469,842 2.45$ 3,919,542 1.36$
November 30, 2017 May 31, 2017

Aphria Inc. Notes to the Condensed Interim Consolidated Financial Statements For the three months and six months ended November 30, 2017 and November 30, 2016 (Unaudited – In thousands of Canadian dollars, except share and per share amounts)
24
The outstanding option details of the Company are as follows:
The Company used the Black Scholes option pricing model to determine the fair value of options granted using the following assumptions: risk-free rate of 0.75-1.70% on the date of grant; expected life of 3 and 5 years; volatility of 70% based on comparable companies; forfeiture rate of 0%; dividend yield of nil; and, the exercise price of the respective option.
21. General and administrative expenses
Weighted
average
exercise price
Number of
options
Vested and
exercisable
December 2017 1.10$ 600,000 133,560
October 2018 1.17$ 20,000 20,000
November 2018 1.49$ 20,000 20,000
December 2018 1.30$ 165,000 165,000
April 2019 1.67$ 30,000 30,000
June 2019 0.60$ 2,500,000 2,500,000
September 2019 3.00$ 75,000 52,633
October 2019 $ 3.47 - 3.70 63,400 56,733
November 2019 3.90$ 986,967 655,624
December 2019 5.25$ 500,000 133,332
January 2020 5.72$ 44,000 13,998
April 2020 7.92$ 140,000 54,999
July 2020 5.24$ 1,014,000 704,642
September 2020 0.85$ 185,000 185,000
November 2020 1.19$ 50,000 50,000
June 2021 1.40$ 266,669 173,333
June 2021 1.48$ 30,000 30,000
June 2022 5.44$ 250,000 83,333
July 2021 1.64$ 110,000 69,993
October 2020 6.90$ 533,000 244,330
November 2020 9.05$ 280,000 93,332
Outstanding, end of the period 3.11$ 7,863,036 5,469,842
Expiry date
2017 2016 2017 2016
Executive compensation 354$ 205$ 660$ 417$
Consulting fees 63 35 158 79
Office and general 567 417 1,119 708
Professional fees 480 134 697 240
Salaries and wages 317 263 725 488
Travel and accomodation 168 146 304 219
Rent 24 25 45 33
1,973$ 1,225$ 3,708$ 2,184$
For the three months ended
November 30,
For the six months ended
November 30,

Aphria Inc. Notes to the Condensed Interim Consolidated Financial Statements For the three months and six months ended November 30, 2017 and November 30, 2016 (Unaudited – In thousands of Canadian dollars, except share and per share amounts)
25
22. Share-based compensation
Share-based compensation is comprised of:
During the period, the Company issued 7,119 deferred share units to certain directors of the Company, under the terms of the Company’s Deferred Share Unit Plan.
23. Finance income, net
Finance income, net, is comprised of:
24. Gain on long-term investments
Gain on long-term investments for the three and six months ended November 30, 2017 is comprised of:
2017 2016 2017 2016
Amounts charged to share-based payment reserve
Share-based compensation accrued in the prior
period
Share-based compensation issued on behalf of a
related party
Shares for services compensation 74 -- 187 --
Deferred share units expensed in the period 71 -- 103 --
2,200$ 251$ 4,709$ 455$
--
--
--
in respect of share-based compensation
For the three months ended
November 30,
For the six months ended
November 30,
(44)
(32)
4,495$ 251$ 455$ 2,055$
--
--
--
2017 2016 2017 2016
Interest income 1,763$ 291$ 2,579$ 436$
Interest expense (331) (95) (667) (144)
1,432$ 196$ 1,912$ 292$
For the three months ended
November 30,
For the six months ended
November 30,
Investment Proceeds Fair value
May 31, 2017
Gain (loss) on
disposal
Change in fair
valueTotal
Level 1 on fair value hierarchy
Kalytera Therapeutics, Inc. - shares 763$ 1,111$ (348)$ --$ (348)$
MassRoots, Inc. - shares 102 232 (130) -- (130)
Scythian Biosciences Inc. - shares 1,225 2,000 (775) -- (775)
Long-term investments (Note 13) -- -- -- 26,410 26,410
Six months ended
November 30, 20172,090$ 3,343$ (1,253)$ 26,410$ 25,157$
Less transactions in previous quarters:
August 31, 2017 -- -- -- 19,082 19,082
Three months ended
November 30, 20172,090$ 3,343$ (1,253)$ 7,328$ 6,075$
Aphria Inc. Notes to the Condensed Interim Consolidated Financial Statements For the three months and six months ended November 30, 2017 and November 30, 2016 (Unaudited – In thousands of Canadian dollars, except share and per share amounts)
26
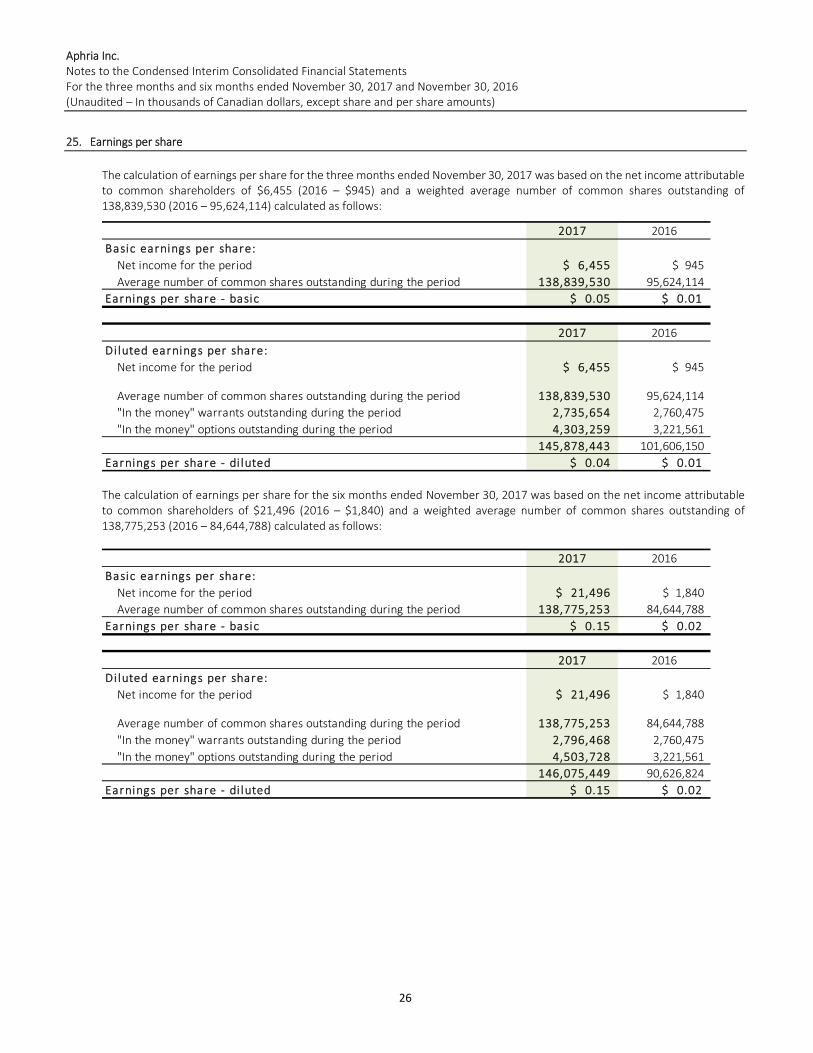
25. Earnings per share
The calculation of earnings per share for the three months ended November 30, 2017 was based on the net income attributable to common shareholders of $6,455 (2016 – $945) and a weighted average number of common shares outstanding of 138,839,530 (2016 – 95,624,114) calculated as follows:
The calculation of earnings per share for the six months ended November 30, 2017 was based on the net income attributable to common shareholders of $21,496 (2016 – $1,840) and a weighted average number of common shares outstanding of 138,775,253 (2016 – 84,644,788) calculated as follows:
2017 2016
Basic earnings per share:
Net income for the period 6,455$ 945$
Average number of common shares outstanding during the period 138,839,530 95,624,114
Earnings per share - basic 0.05$ 0.01$
2017 2016
Di luted earnings per share:
Net income for the period 6,455$ 945$
Average number of common shares outstanding during the period 138,839,530 95,624,114
"In the money" warrants outstanding during the period 2,735,654 2,760,475
"In the money" options outstanding during the period 4,303,259 3,221,561
145,878,443 101,606,150
Earnings per share - di luted 0.04$ 0.01$
2017 2016
Basic earnings per share:
Net income for the period 21,496$ 1,840$
Average number of common shares outstanding during the period 138,775,253 84,644,788
Earnings per share - basic 0.15$ 0.02$
2017 2016
Di luted earnings per share:
Net income for the period 21,496$ 1,840$
Average number of common shares outstanding during the period 138,775,253 84,644,788
"In the money" warrants outstanding during the period 2,796,468 2,760,475
"In the money" options outstanding during the period 4,503,728 3,221,561
146,075,449 90,626,824
Earnings per share - di luted 0.15$ 0.02$
Aphria Inc. Notes to the Condensed Interim Consolidated Financial Statements For the three months and six months ended November 30, 2017 and November 30, 2016 (Unaudited – In thousands of Canadian dollars, except share and per share amounts)
27
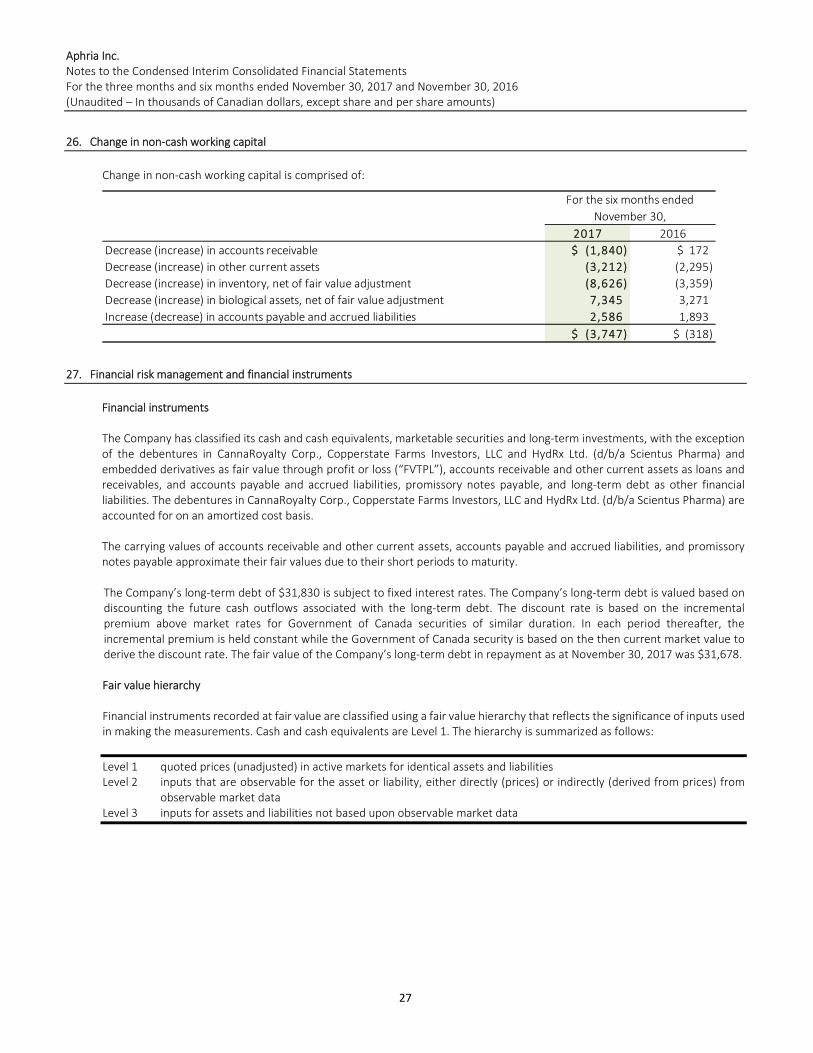
26. Change in non-cash working capital
Change in non-cash working capital is comprised of:
27. Financial risk management and financial instruments
Financial instruments
The Company has classified its cash and cash equivalents, marketable securities and long-term investments, with the exception of the debentures in CannaRoyalty Corp., Copperstate Farms Investors, LLC and HydRx Ltd. (d/b/a Scientus Pharma) and embedded derivatives as fair value through profit or loss (“FVTPL”), accounts receivable and other current assets as loans and receivables, and accounts payable and accrued liabilities, promissory notes payable, and long-term debt as other financial liabilities. The debentures in CannaRoyalty Corp., Copperstate Farms Investors, LLC and HydRx Ltd. (d/b/a Scientus Pharma) are accounted for on an amortized cost basis.
The carrying values of accounts receivable and other current assets, accounts payable and accrued liabilities, and promissory notes payable approximate their fair values due to their short periods to maturity.
The Company’s long-term debt of $31,830 is subject to fixed interest rates. The Company’s long-term debt is valued based on discounting the future cash outflows associated with the long-term debt. The discount rate is based on the incremental premium above market rates for Government of Canada securities of similar duration. In each period thereafter, the incremental premium is held constant while the Government of Canada security is based on the then current market value to derive the discount rate. The fair value of the Company’s long-term debt in repayment as at November 30, 2017 was $31,678.
Fair value hierarchy
Financial instruments recorded at fair value are classified using a fair value hierarchy that reflects the significance of inputs used in making the measurements. Cash and cash equivalents are Level 1. The hierarchy is summarized as follows:
Level 1 quoted prices (unadjusted) in active markets for identical assets and liabilities Level 2 inputs that are observable for the asset or liability, either directly (prices) or indirectly (derived from prices) from
observable market data Level 3 inputs for assets and liabilities not based upon observable market data
2017 2016
Decrease (increase) in accounts receivable (1,840)$ 172$
Decrease (increase) in other current assets (3,212) (2,295)
Decrease (increase) in inventory, net of fair value adjustment (8,626) (3,359)
Decrease (increase) in biological assets, net of fair value adjustment 7,345 3,271
Increase (decrease) in accounts payable and accrued liabilities 2,586 1,893
(3,747)$ (318)$
For the six months ended
November 30,
Aphria Inc. Notes to the Condensed Interim Consolidated Financial Statements For the three months and six months ended November 30, 2017 and November 30, 2016 (Unaudited – In thousands of Canadian dollars, except share and per share amounts)
28
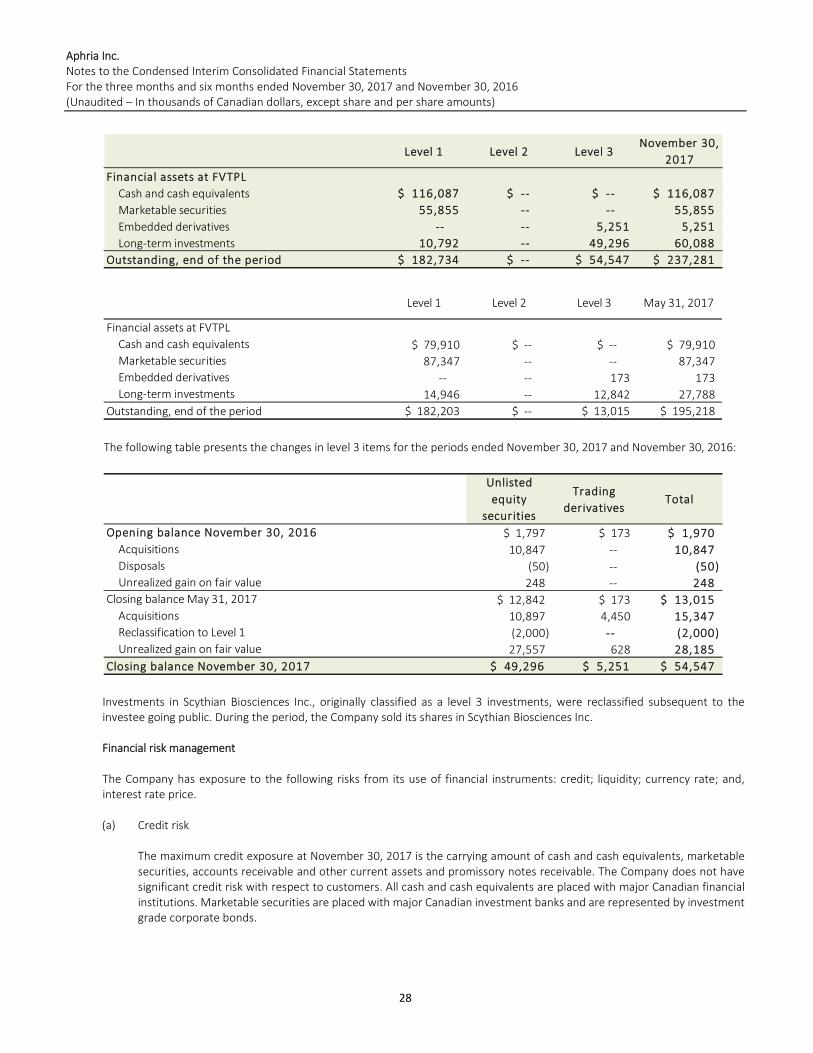
The following table presents the changes in level 3 items for the periods ended November 30, 2017 and November 30, 2016:
Investments in Scythian Biosciences Inc., originally classified as a level 3 investments, were reclassified subsequent to the investee going public. During the period, the Company sold its shares in Scythian Biosciences Inc.
Financial risk management
The Company has exposure to the following risks from its use of financial instruments: credit; liquidity; currency rate; and, interest rate price.
(a) Credit risk
The maximum credit exposure at November 30, 2017 is the carrying amount of cash and cash equivalents, marketable securities, accounts receivable and other current assets and promissory notes receivable. The Company does not have significant credit risk with respect to customers. All cash and cash equivalents are placed with major Canadian financial institutions. Marketable securities are placed with major Canadian investment banks and are represented by investment grade corporate bonds.
Level 1 Level 2 Level 3November 30,
2017
Financial assets at FVTPL
Cash and cash equivalents 116,087$ --$ --$ 116,087$
Marketable securities 55,855 -- -- 55,855
Embedded derivatives -- -- 5,251 5,251
Long-term investments 10,792 -- 49,296 60,088
182,734$ --$ 54,547$ 237,281$ Outstanding, end of the period
Level 1 Level 2 Level 3 May 31, 2017
79,910$ --$ --$ 79,910$
87,347 -- -- 87,347
-- -- 173 173
14,946 -- 12,842 27,788
182,203$ --$ 13,015$ 195,218$ Outstanding, end of the period
Long-term investments
Embedded derivatives
Marketable securities
Cash and cash equivalents
Financial assets at FVTPL
Unlisted
equity
securities
Trading
derivativesTotal
1,797$ 173$ 1,970$
10,847 -- 10,847
(50) -- (50)
248 -- 248
12,842$ 173$ 13,015$
10,897 4,450 15,347
(2,000) -- (2,000)
27,557 628 28,185
49,296$ 5,251$ 54,547$
Acquisitions
Reclassification to Level 1
Unrealized gain on fair value
Closing balance November 30, 2017
Closing balance May 31, 2017
Opening balance November 30, 2016
Acquisitions
Disposals
Unrealized gain on fair value
Aphria Inc. Notes to the Condensed Interim Consolidated Financial Statements For the three months and six months ended November 30, 2017 and November 30, 2016 (Unaudited – In thousands of Canadian dollars, except share and per share amounts)
29
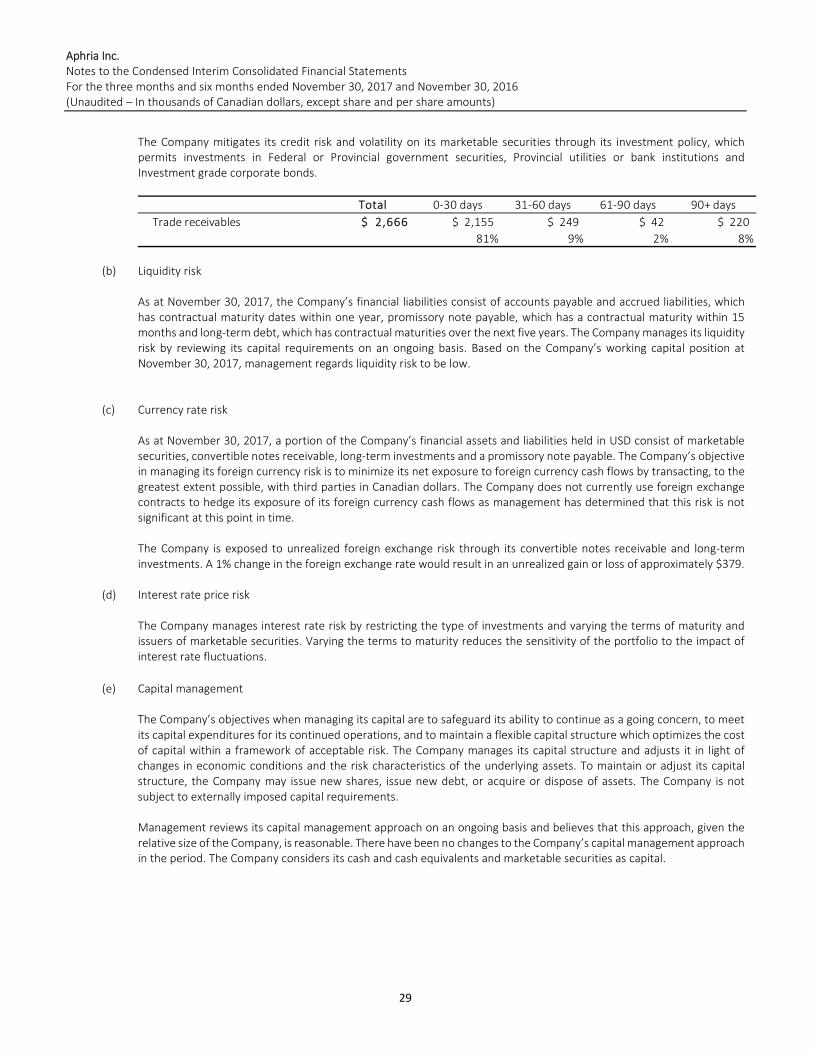
The Company mitigates its credit risk and volatility on its marketable securities through its investment policy, which permits investments in Federal or Provincial government securities, Provincial utilities or bank institutions and Investment grade corporate bonds.
(b) Liquidity risk
As at November 30, 2017, the Company’s financial liabilities consist of accounts payable and accrued liabilities, which has contractual maturity dates within one year, promissory note payable, which has a contractual maturity within 15 months and long-term debt, which has contractual maturities over the next five years. The Company manages its liquidity risk by reviewing its capital requirements on an ongoing basis. Based on the Company’s working capital position at November 30, 2017, management regards liquidity risk to be low.
(c) Currency rate risk
As at November 30, 2017, a portion of the Company’s financial assets and liabilities held in USD consist of marketable securities, convertible notes receivable, long-term investments and a promissory note payable. The Company’s objective in managing its foreign currency risk is to minimize its net exposure to foreign currency cash flows by transacting, to the greatest extent possible, with third parties in Canadian dollars. The Company does not currently use foreign exchange contracts to hedge its exposure of its foreign currency cash flows as management has determined that this risk is not significant at this point in time.
The Company is exposed to unrealized foreign exchange risk through its convertible notes receivable and long-term investments. A 1% change in the foreign exchange rate would result in an unrealized gain or loss of approximately $379.
(d) Interest rate price risk
The Company manages interest rate risk by restricting the type of investments and varying the terms of maturity and issuers of marketable securities. Varying the terms to maturity reduces the sensitivity of the portfolio to the impact of interest rate fluctuations.
(e) Capital management
The Company’s objectives when managing its capital are to safeguard its ability to continue as a going concern, to meet its capital expenditures for its continued operations, and to maintain a flexible capital structure which optimizes the cost of capital within a framework of acceptable risk. The Company manages its capital structure and adjusts it in light of changes in economic conditions and the risk characteristics of the underlying assets. To maintain or adjust its capital structure, the Company may issue new shares, issue new debt, or acquire or dispose of assets. The Company is not subject to externally imposed capital requirements.
Management reviews its capital management approach on an ongoing basis and believes that this approach, given the relative size of the Company, is reasonable. There have been no changes to the Company’s capital management approach in the period. The Company considers its cash and cash equivalents and marketable securities as capital.
Total 0-30 days 31-60 days 61-90 days 90+ days
Trade receivables 2,666$ 2,155$ 249$ 42$ 220$
81% 9% 2% 8%

Aphria Inc. Notes to the Condensed Interim Consolidated Financial Statements For the three months and six months ended November 30, 2017 and November 30, 2016 (Unaudited – In thousands of Canadian dollars, except share and per share amounts)
30
28. Commitments
The Company has a lease commitment until December 31, 2018 for rental of office space from a related party. The Company has an option to extend this lease for two additional 5 year periods. The Company has lease commitments for the use of two motor vehicles expiring September 2019 and August 2020 in the amounts payable of $9 and $20, respectively. In April of 2017, the Company indemnified the landlord of the office space leased by Liberty Health Sciences Inc. (formerly DFMMJ Investments, Ltd.). The Company has agreed to contribute an additional $1,300 to Green Acre Capital Fund. The Company has committed purchase orders outstanding at November 30, 2017 related to capital asset expansion of $53,093, of which $33,731 are expected to be paid within the next year. Minimum payments payable over the next five years are as follows:
Years ending November 30,
2018 $ 34,597 2019 19,392 2020 13
$ 54,002
29. Subsequent events
Subsequent to quarter-end, TS BrandCo Holdings Inc. announced that it merged with DOJA Cannabis Company Ltd. and was to rename the reporting issuer Hiku Brands Company Ltd. The Company contributed $10,000 as an equity investment in Hiku Brand Company Ltd. on the same date.
Subsequent to quarter-end, the Company entered a purchase and sale agreement to acquire land, buildings and greenhouses at 225 and 231 Talbot Street West, Leamington, Ontario for $5,250. The Company anticipates the transaction closing before the end of the next quarter.
Subsequent to quarter-end, the Company closed a bought deal and issued 8,363,651 common shares for gross proceeds of $115,000.
Subsequent to quarter-end, the Company entered a strategic relationship with Double Diamond Farms to form a corporation, internally identified as GrowCo. GrowCo is to be capitalized with $10,200 of seed capital from Aphria and $9,800 of seed capital from Double Diamond Farms. GrowCo is to enter into a purchase and sale agreement with Double Diamond Farms to acquire 100 acres of land, including almost 32 acres of greenhouses. GrowCo is expected to require $80,000 to $100,000 of capital to complete the purchase and sale agreement and the necessary retrofits of the greenhouses to legally grow cannabis. GrowCo anticipates securing bank financing for a portion of the capital required. Any remaining capital needs will be loaned by Aphria to GrowCo.
Subsequent to quarter-end, the Company funded an additional $500 of its $2,000 commitment to Green Acre Capital Fund. Cumulative contributions to Green Acre Capital Fund is $1,200.