aphasia-accessible survey: descriptive data and analysis
TRANSCRIPT
Aphasia-accessible survey:
descriptive data and analysis of the survey
findings
There were 16 responses to the aphasia survey. There were 23 questions across the 4
sections of the aphasia survey. For some questions, responses were received from all
16 respondents. For other questions, responses from a smaller sample of less than 16.
The number of respondents completing each question is given in the description of the
results. The design of the survey meant for some questions respondents were able to
select more than one option, often selecting 2 or 3 responses. The descriptive results
are described in detail for each question.
The questions and the results are grouped into five sections and the questions
addressed in each section are given.
● Section 1 gives the demographic data about the respondents who completed the
survey.
● Section 2 describes the respondents' background history of receiving SLT.
● Section 3 describes the respondents' experiences of SLT during lockdown
(March to June 2021).
● Section 4 describes the delivery of SLT during lockdown (March to June 2020)
and the respondents' experiences of this.
● Section 5 details the respondents' experiences of SLT during and after the end of
lockdown.
The quantitative descriptive data is given along with the qualitative data. Qualitative
data originates from the free text comments for some of the questions. These
comments have been grouped into categories for ease of reference.

2
Section 1: Demographic data of the respondents
The demographic data is presented first. This data was obtained from the following
questions;
Question 1: My postcode is.
Question 2: Look at the map. Where do you live?
Question 21: How old are you?
Question 22: How would you describe your gender?
Question 32: What is your ethnicity?
Who were the respondents?
All 16 respondents were individuals with aphasia.
Country
● 10 of the 16 respondents (63%) were living in England.
● 3 (19%) in Northern Ireland.
● 2 (13%) in Scotland.
● 1 (6%) in Wales.

3
Gender
With respect to gender:
● 12 (75%) identified as male.
● 4 (25%) identified as female.
Age
With respect to age:
● 8 respondents (50%) were aged 65 years or over.
● 5 (31%) were between 55 and 64 years.
● 3 (19%) were aged 45 to 54 years.
4
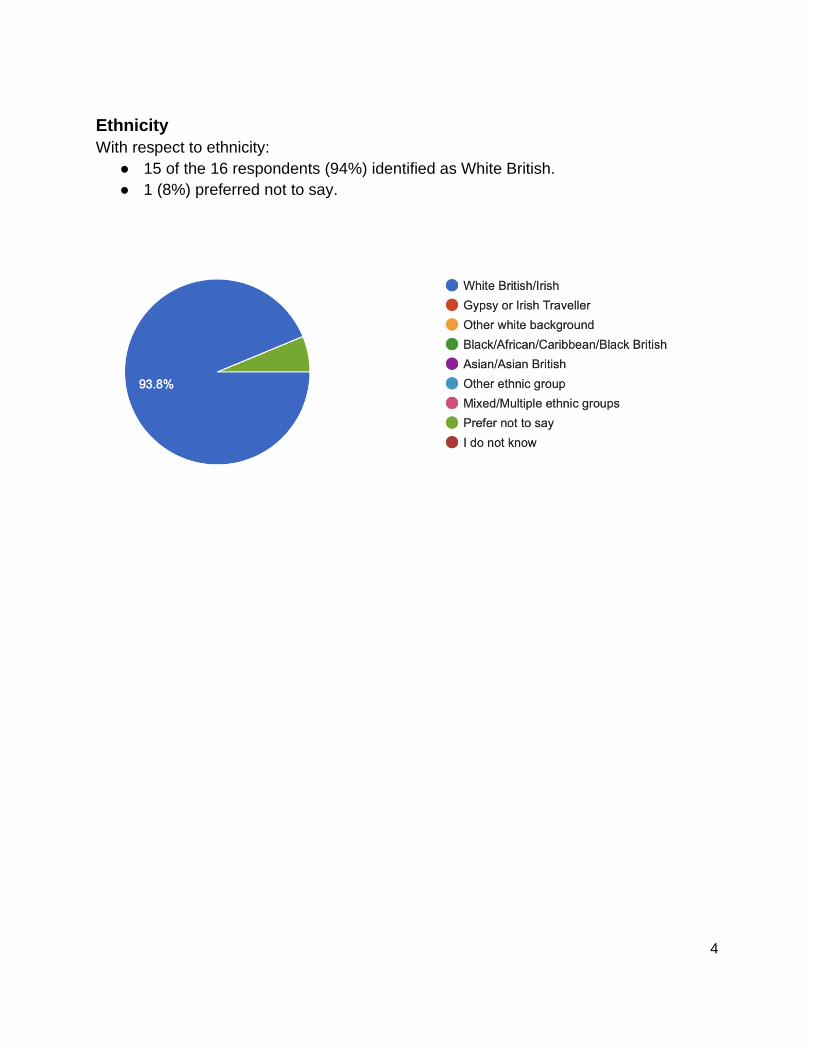
Ethnicity
With respect to ethnicity:
● 15 of the 16 respondents (94%) identified as White British.
● 1 (8%) preferred not to say.
5
Section 2: Background history of receiving SLT
In this section, the reasons for having SLT and when SLT started are presented. This
covers the following survey questions:
Question 7: Why did you need to have SLT?
Question 17: Does SLT help you?
Question 4: What does SLT help you with?
Question 3: When did you start having SLT?
Question 6: Think about your SLT before lockdown.
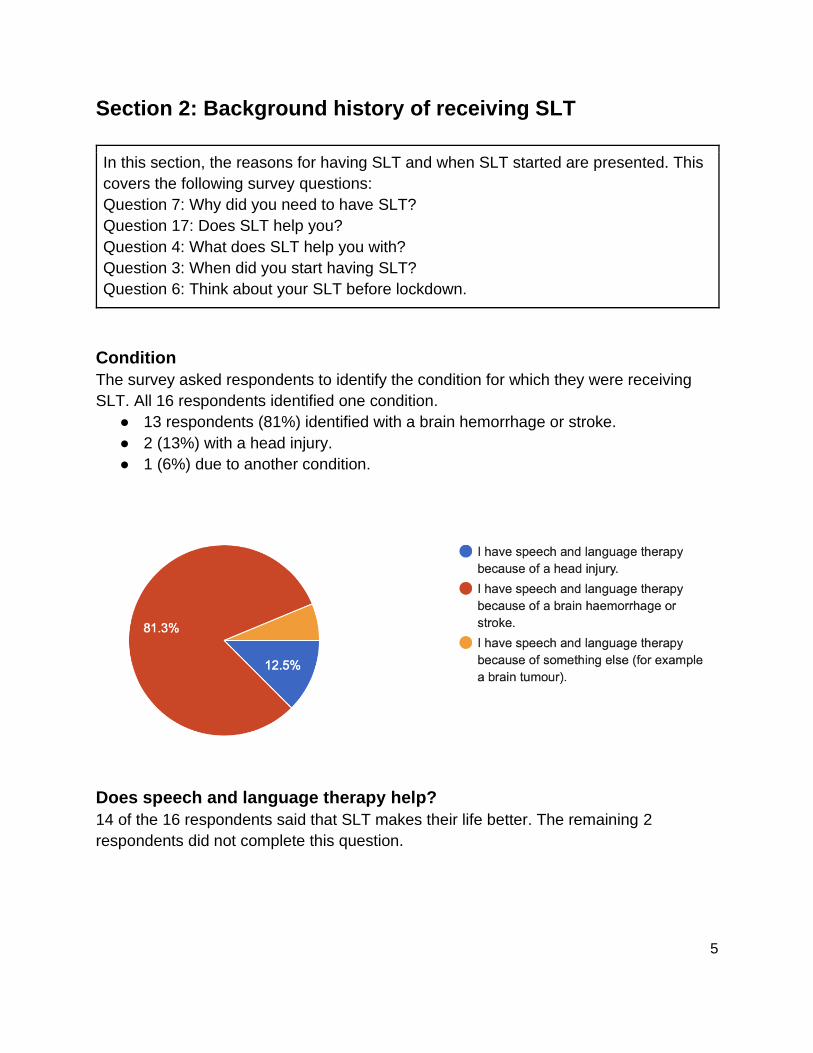
Condition
The survey asked respondents to identify the condition for which they were receiving
SLT. All 16 respondents identified one condition.
● 13 respondents (81%) identified with a brain hemorrhage or stroke.
● 2 (13%) with a head injury.
● 1 (6%) due to another condition.
Does speech and language therapy help?
14 of the 16 respondents said that SLT makes their life better. The remaining 2
respondents did not complete this question.

6
What speech and language therapy helps with
All 16 respondents confirmed they received SLT for help with speech, language and
communication.
When people started having speech and language therapy
Of the 16 respondents:
● 6 (38%) were in receipt of SLT before February 2019.
● 9 (56%) started receiving SLT from the start of lockdown (March 2020 onwards).
● 1 respondent (6%) received SLT between February 2019 and February 2020.

7
Experience of speech and language therapy before lockdown
14 of the 16 respondents reported on the delivery of their SLT before lockdown (March
2020). Respondents selected more than one response.
● 9 of these 14 respondents (64%) received SLT in person outside of the home.
● 8 (57%) by video call.
● 4 (29%) in person at home.
● 1 (7%) by phone.
8
Section 3: Experiences of SLT during lockdown (March-June
2020)
In this section, the experiences of receiving SLT during lockdown are presented. This
covers the survey questions of:
Question 7: Tell us how much SLT you had during lockdown?
Question 8: Did your SLT change during lockdown?
Question 9: Think about your SLT during the lockdown.
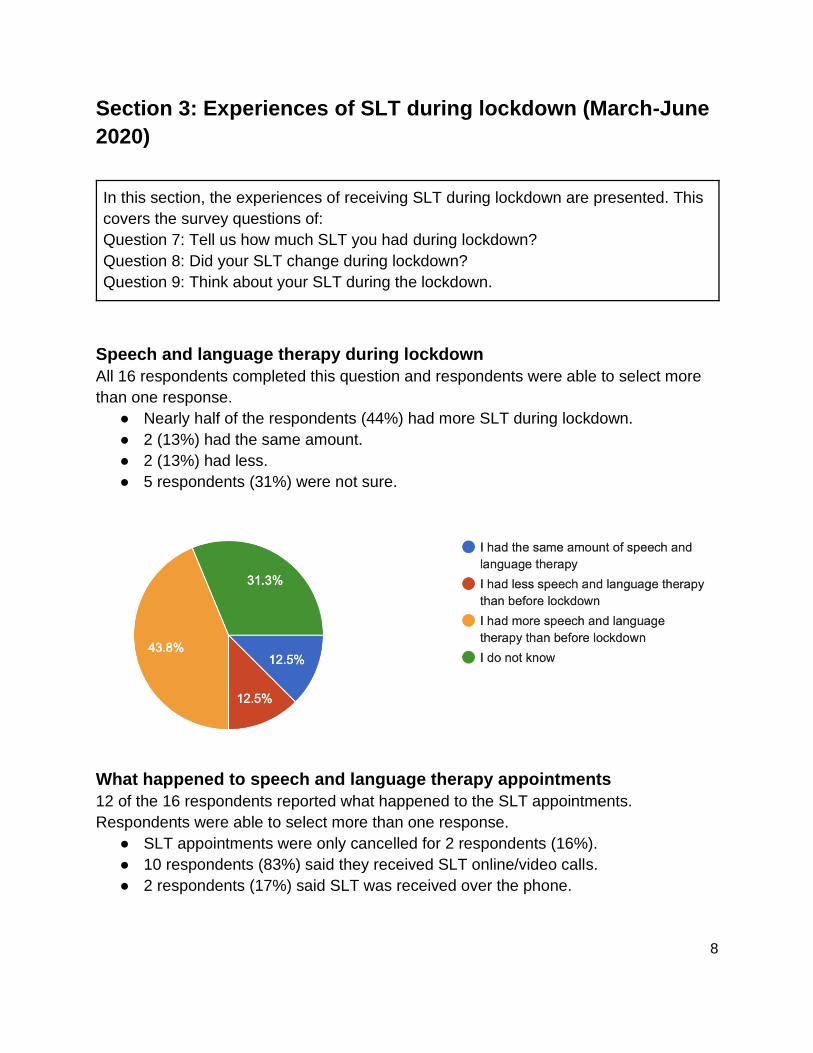
Speech and language therapy during lockdown
All 16 respondents completed this question and respondents were able to select more
than one response.
● Nearly half of the respondents (44%) had more SLT during lockdown.
● 2 (13%) had the same amount.
● 2 (13%) had less.
● 5 respondents (31%) were not sure.
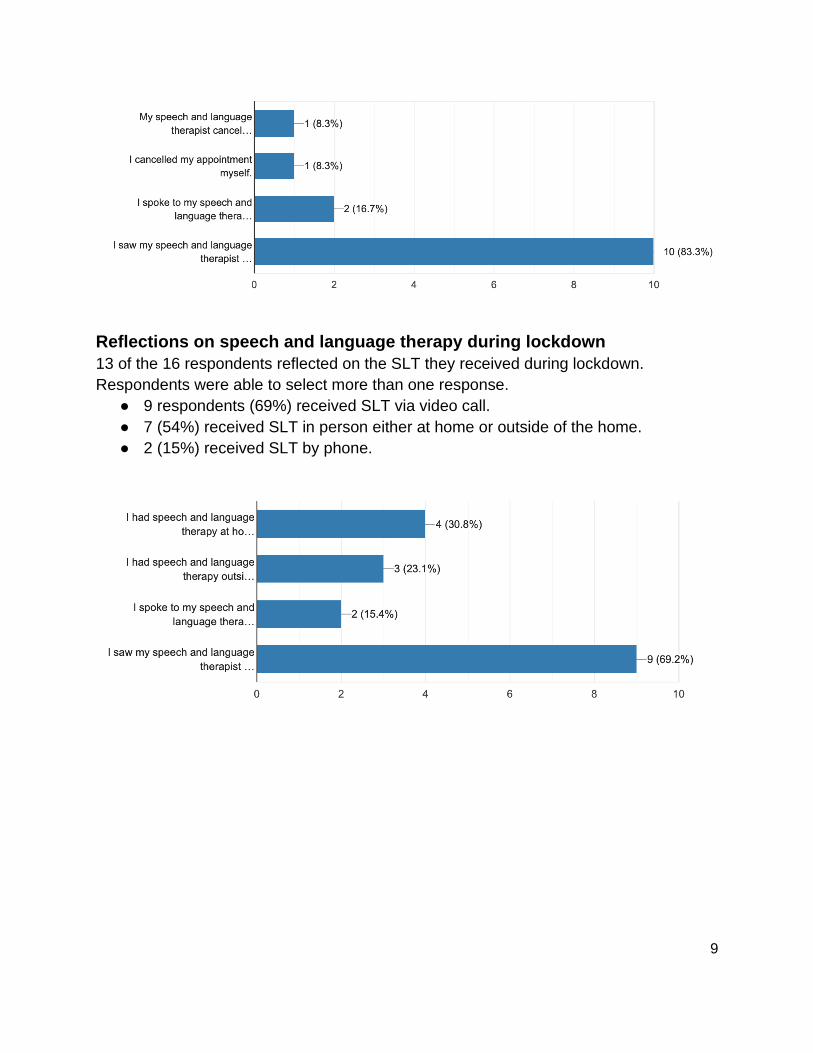
What happened to speech and language therapy appointments
12 of the 16 respondents reported what happened to the SLT appointments.
Respondents were able to select more than one response.
● SLT appointments were only cancelled for 2 respondents (16%).
● 10 respondents (83%) said they received SLT online/video calls.
● 2 respondents (17%) said SLT was received over the phone.
9
Reflections on speech and language therapy during lockdown
13 of the 16 respondents reflected on the SLT they received during lockdown.
Respondents were able to select more than one response.
● 9 respondents (69%) received SLT via video call.
● 7 (54%) received SLT in person either at home or outside of the home.
● 2 (15%) received SLT by phone.

10
Section 4: Delivery of SLT and experiences of SLT delivery
during the lockdown (March to June 2020)
In this section, how SLT was delivered during lockdown is presented. This covers the
survey questions of:
Question 10: How do you feel about SLT on the phone?
Question 11: How do you feel about SLT using a video call?
Question 12: Is SLT on a video call hard or easy?
Question 13: What do you think about wearing a mask during your SLT?
Question 14: What do you think about your SLT wearing a mask during your SLT?
Speech and language therapy over the phone
14 of the 16 respondents described their experiences of receiving SLT by phone. Of
these 14 respondents:
● 5 (36%) were positive.
● 3 (21%) were negative.
● 3 (21%) were neutral.
● 3 (21%) did not know.
Speech and language therapy by video
All 16 respondents reported on their experiences of receiving SLT by video call.
● The majority (n=9) (56%) were positive.
● 3 (19%) were negative.
● 2 (13%) were neutral.
● 2 (13%) did not know.

11
Of these 16 respondents:
● 6 (38%) found video calls easy.
● 3 (19%) found them hard.
● 5 (31%) were neutral.
● 1 (13%) did not know.
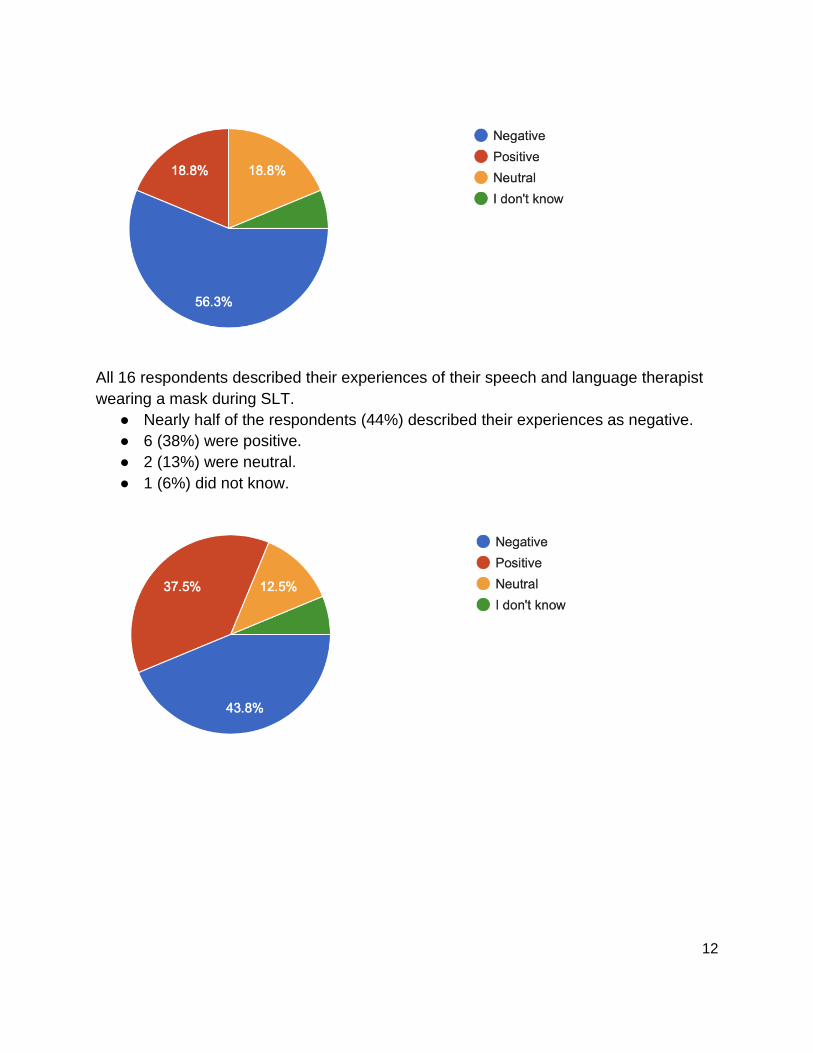
Face masks
All 16 respondents described their experiences of wearing a mask during SLT.
● More than half (n=9) (56%) of respondents were negative about mask wearing.
● 3 (19%) were positive.
● 3 (19%) were neutral.
● 1 (6%) did not know.
12
All 16 respondents described their experiences of their speech and language therapist
wearing a mask during SLT.
● Nearly half of the respondents (44%) described their experiences as negative.
● 6 (38%) were positive.
● 2 (13%) were neutral.
● 1 (6%) did not know.

13
Section 5: Experiences of SLT during and after the end of
lockdown
In this section, data on people’s experiences of SLT during and after lockdown is
presented. This covers the survey questions of:
Question 15: Tell us about your communication during lockdown.
Question 16: Tell us about your swallowing during lockdown.
Question 18: This question is for people who had less SLT during lockdown.
Question 19: Look at the different options.
Question 20: Look at the different options.
Impact on communication and swallowing
15 of the 16 respondents described their communication during lockdown.
● More than half the 15 respondents (53%) described their communication as
better.
● Only 3 (20%) described it as worse.
● 3 respondents (20%) found their communication the same.
● 1 (7%) did not know.
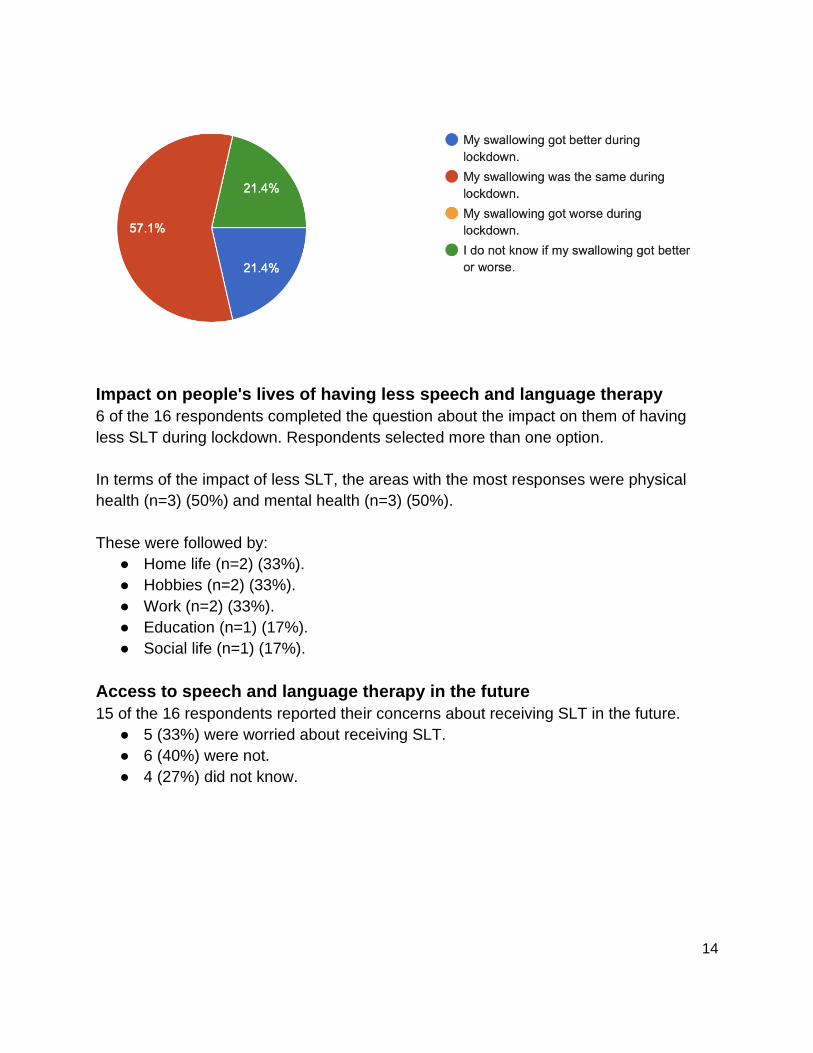
14 of these 15 respondents described their swallowing during lockdown.
● Only 3 respondents (21%) described their swallowing was better.
● More than half of the respondents (n=8) (57%) described their swallowing as the
same.
● For 3 respondents (20%), their swallowing was worse.
1 respondent (7%) did not know.
14
Impact on people's lives of having less speech and language therapy
6 of the 16 respondents completed the question about the impact on them of having
less SLT during lockdown. Respondents selected more than one option.
In terms of the impact of less SLT, the areas with the most responses were physical
health (n=3) (50%) and mental health (n=3) (50%).
These were followed by:
● Home life (n=2) (33%).
● Hobbies (n=2) (33%).
● Work (n=2) (33%).
● Education (n=1) (17%).
● Social life (n=1) (17%).
Access to speech and language therapy in the future
15 of the 16 respondents reported their concerns about receiving SLT in the future.
● 5 (33%) were worried about receiving SLT.
● 6 (40%) were not.
● 4 (27%) did not know.

15
Of the 15 respondents, 11 reported on the potential impact of not receiving SLT in the
future. Respondents were able to select more than one response.
The areas with the most responses were physical health (n=7) (64%) and social life
(n=7) (64%).
These were followed by:
● Mental health (n=3) (27%).
● Hobbies (n=3) (27%).
● Work (n=2) (18%).
● Home life (n=1) (9%),
● Education (n=1) (9%).
Considerations for the descriptive analysis
Response rates varied across the 23 questions in the survey with some questions
receiving a complete response rate of 16 responses and others a minimum of 11
responses. This variation in responses did limit the extent of the descriptive analysis
completed. Some of the questions in the survey overlapped in content, which meant
there was not always a consistent response rate across these questions. This means
there were some differences in the responses received to questions asking the same
content.