apes year in review part ii 2011, the year everyone gets a 5! food production-industrial agriculture...
TRANSCRIPT

APES year in reviewPart II
2011, The year everyone gets a 5!
Food Production-Industrial Agriculture
Water source…water pollution
Atmosphere…. Pollution
Solid Waste… disposal
Indoor air… pollution

• Figure 9-1 Earth’s water supply
Ch 9: Water

Water Facts
• The primary use for fresh water in U.S. is for agriculture.
• In our homes, we use the most fresh water to wash, clean and flush.
• The typical person in an industrialized nation uses 700-1000 gallons per week!
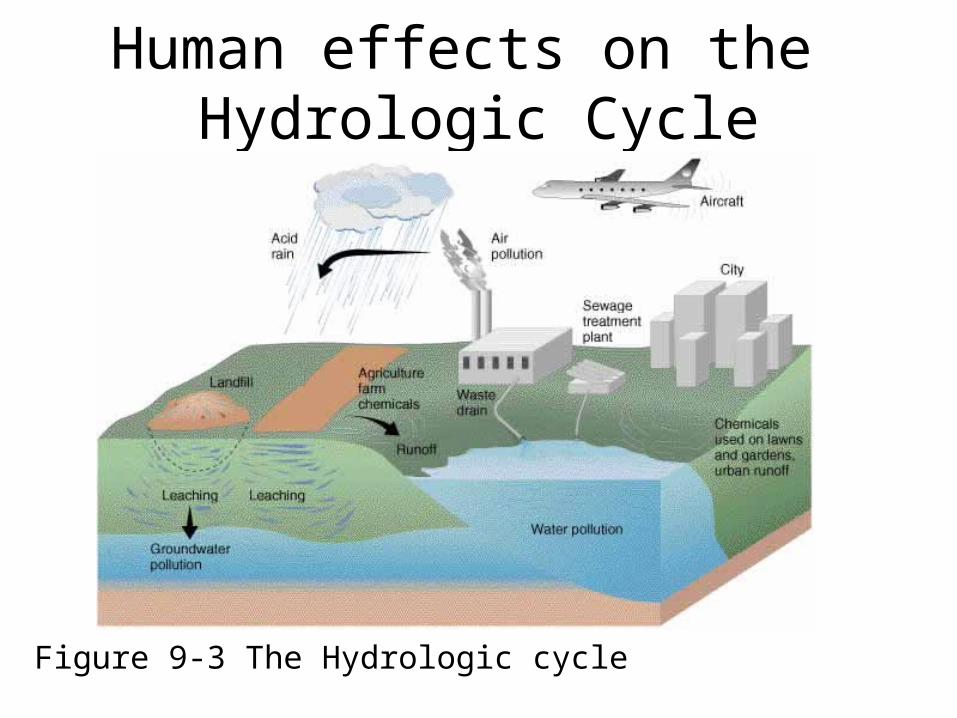
Human effects on the Hydrologic Cycle
Figure 9-3 The Hydrologic cycle

The River Is A ContinuumThe River Is A ContinuumHeadwaters Mid-Reach Lower Reach
DetritusDetritus
PhotosynthesisPhotosynthesis
SedimentSediment
Collectors & Shredders
Collectors & Grazers
Collectors
ProducerProducerss
ProducerProducerss
FPOMFPOM
CPOCPOMM
CPOCPOMM
FPOMFPOM

A watershed is a drainage basin
• Otherwise known as a Catchment is a region of interconnected rivers and streams which functions as a unified system for water transport.

The actions we take
affect our downstre
am rivers,
lakes and estuaries

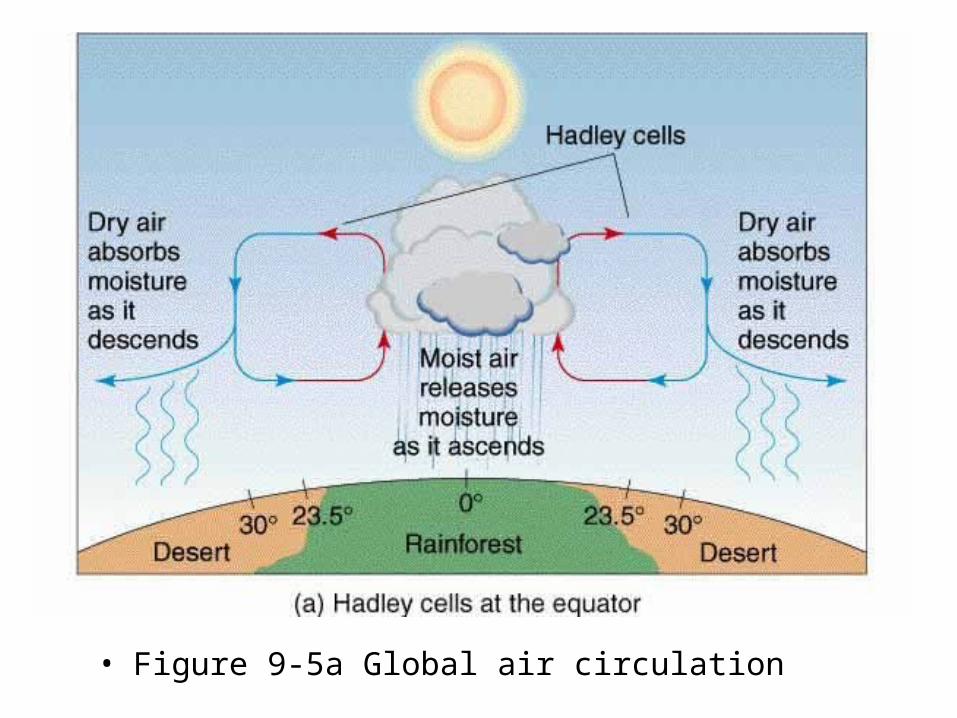
• Figure 9-5a Global air circulation
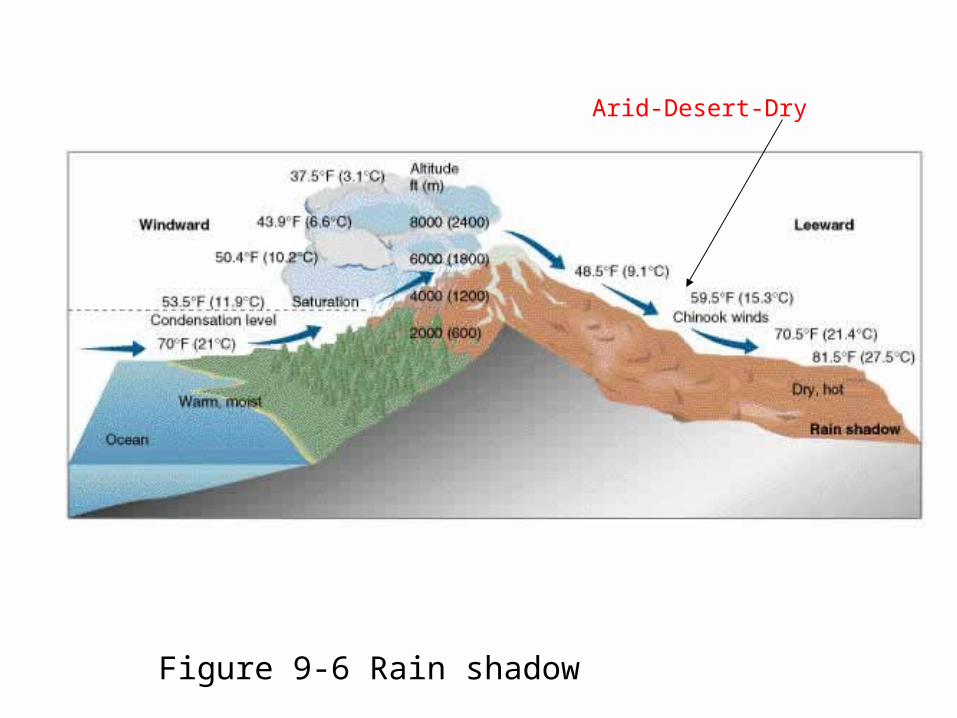
Rain shadow
Figure 9-6 Rain shadow
Arid-Desert-Dry

The Ogallala Aquifer
Figure 9-16 Exploitation of an aquifer

Mono Lake• Excellent example of human interference with
the water supply.• The water in the lake was diverted from the
lake to the city of Los Angeles. It became a salt bed.
• ↑ Salt concentration due to evaporationThree Gorges Dam in China• China needs to meet the growing demand for
energy• Huge environmental impact• Hundreds of thousands of people will be
displaced (not to mention the ecosystems which will be flooded)
The Ogallala Aquifer
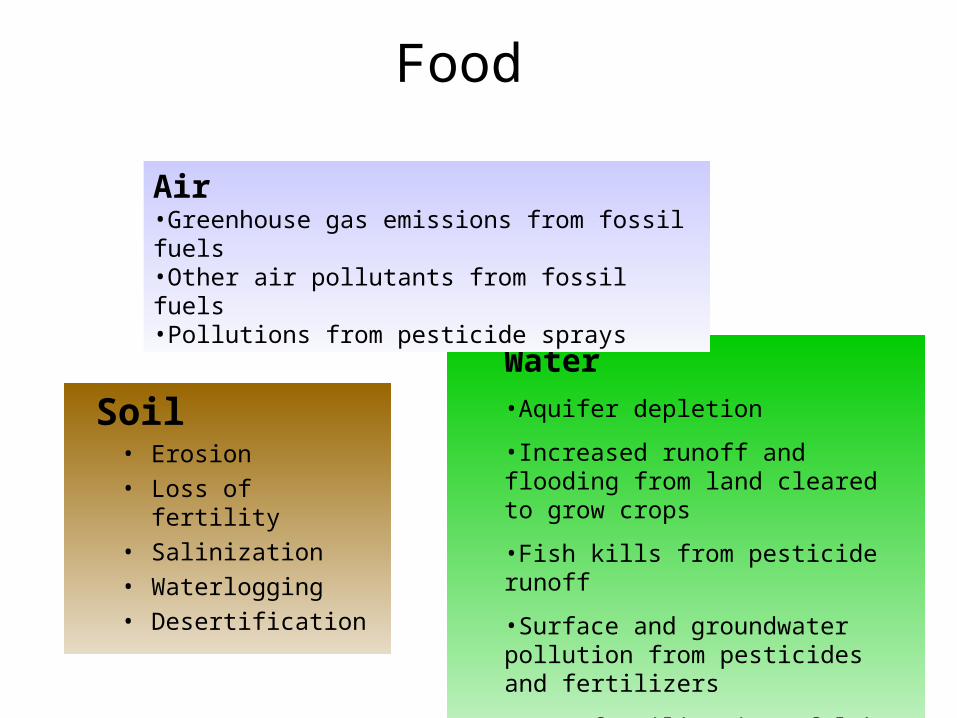
Soil• Erosion• Loss of fertility• Salinization• Waterlogging• Desertification
Water•Aquifer depletion
•Increased runoff and flooding from land cleared to grow crops
•Fish kills from pesticide runoff
•Surface and groundwater pollution from pesticides and fertilizers
•Over fertilization of lakes >> eutrophication
Air•Greenhouse gas emissions from fossil fuels•Other air pollutants from fossil fuels•Pollutions from pesticide sprays
Food

Major Environmental Effects of Food Production
Biodiversity Loss• Loss and degradation of
habitat from clearing grasslands and forests and draining wetlands
• Fish kills from pesticide runoff• Killing of wild predators to
protect live stock• Loss of genetic diversity from
replacing thousands of wild crop strains with a few monoculture strains
Human Health•Nitrates in drinking water
•Pesticide residues in drinking water, food, and air
•Contamination of drinking and swimming water with disease organisms from livestock wastes

Types, Effects, Sources of Water Pollution
– water is polluted by infectious bacteria, inorganic and organic chemicals, and excess heat
• water pollution: any chemical, biological, or physical change in water quality that has a harmful effect on living organisms
• the WHO estimates that 3.4 million people/yr people die prematurely from waterborne diseases
• an estimated 1.5 million people/yr in U.S. become ill from infectious agents

Fecal coliform bacteria

Water quality and dissolved oxygen
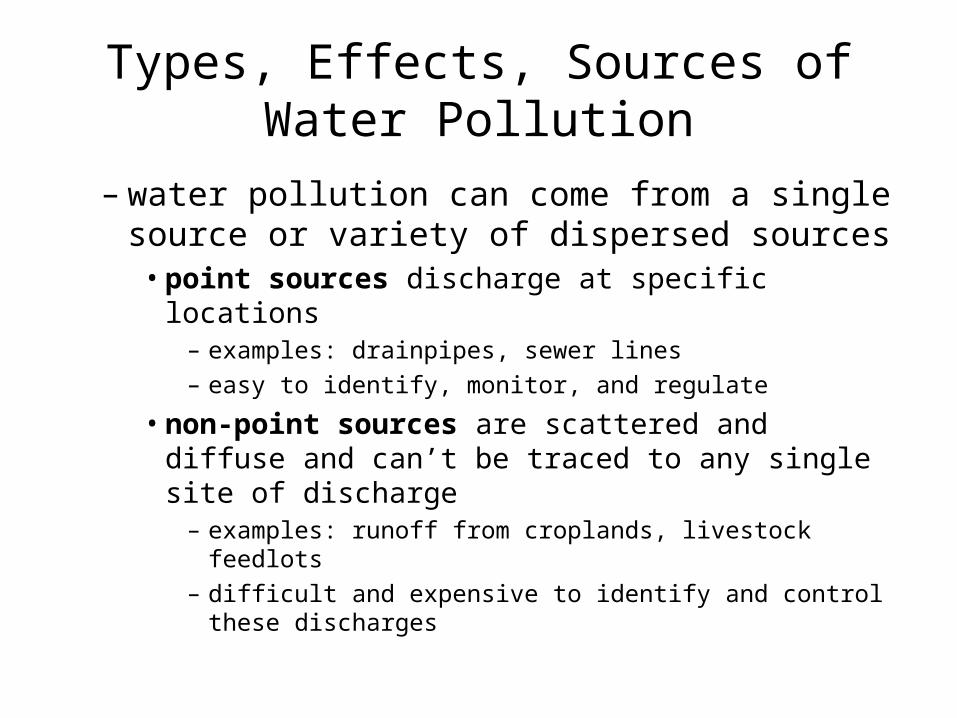
Types, Effects, Sources of Water Pollution
– water pollution can come from a single source or variety of dispersed sources
• point sources discharge at specific locations– examples: drainpipes, sewer lines– easy to identify, monitor, and regulate
• non-point sources are scattered and diffuse and can’t be traced to any single site of discharge
– examples: runoff from croplands, livestock feedlots– difficult and expensive to identify and control these
discharges

Point and nonpoint sources
Types, Effects, Sources of Water Pollution
– sources of water pollution, cont.• leading sources: agriculture, industries, mining
– agricultural activities: » erosion» overgrazing» fertilizers» pesticides» excess salt from irrigated soils

Types, Effects, Sources of Water Pollution
– too much rain and too little rain can increase water pollution
• increased moisture with more intense rains can flush harmful chemicals, plant nutrients, and microorganisms into waterways
• Prolonged rains reduce solar energy and reduce photosynthesis
• prolonged drought can reduce river flows so there is less dilution available
• warmer water contains less dissolved oxygen

Causes of Acid Rain
• Sulfur dioxide (SO2) and nitrogen oxides (NOx) are the primary causes of
acid rain.
• In the US, about 2/3 of all SO2 and 1/4 of all NOx comes from electric
power generation that relies on burning fossil fuels like coal.

Pollution of Freshwater Streams
– streams can recover from moderate levels of degradable water pollutants if the flows are not reduced
• dilution and biodegradation can allow recovery of stream pollution if:
– they are not overloaded– do not have reduced flow due to damming, agricultural
diversion, or drought

Pollution of Freshwater Streams
– stream recovery, cont.• breakdown of pollutants by bacteria creates an
oxygen sag curve– organisms with a high oxygen demand can’t survive in
the curve– factors in size of curve:
» volume of the stream» volume of wastes entering» flow rate» temperature» pH levels

Know this Oxygen sag Curve Dilution and decay of wastes

yeast
Color Indicator
Distilled water
Pollutant (milk)
Investigating BOD Amount of dissolved oxygen needed by aerobic decomposers to break down the organic materials in a given volume of water at a certain temperature over a specified time period
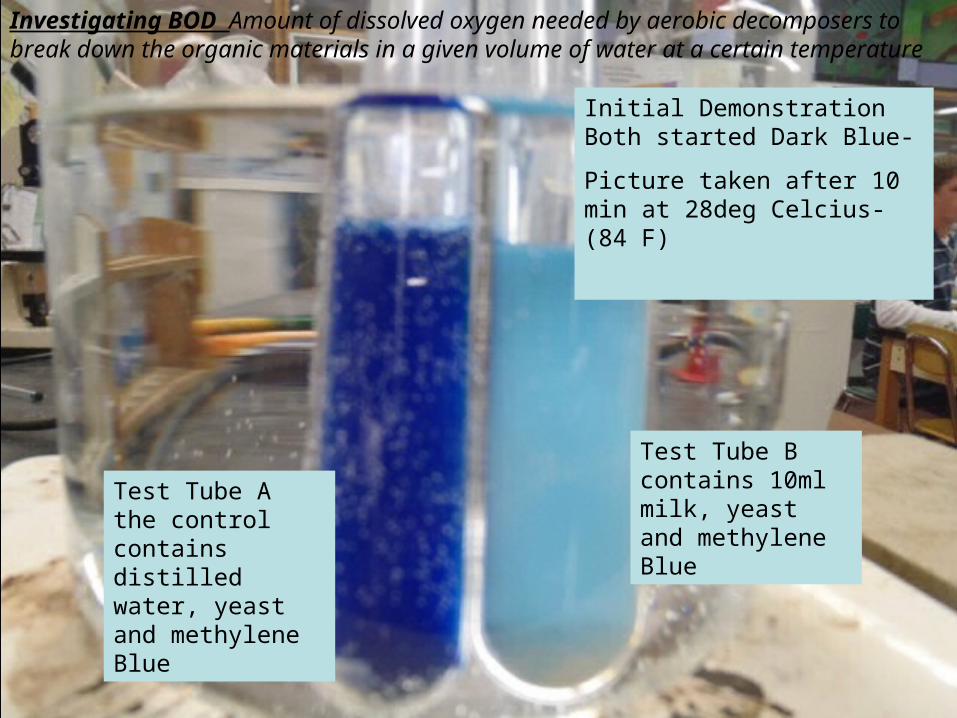
Investigating BOD Amount of dissolved oxygen needed by aerobic decomposers to break down the organic materials in a given volume of water at a certain temperature
Test Tube B contains 10ml milk, yeast and methylene Blue
Test Tube A the control contains distilled water, yeast and methylene Blue
Initial Demonstration Both started Dark Blue-
Picture taken after 10 min at 28deg Celcius-(84 F)

Initial Demonstration Both started Dark Blue-
Picture taken after 20 min at 28deg Celcius-(84 F)


After about 1 hr the tubes began to change color.
Why are those to the left darker?
(BOD) Control 1/16 1/8 ¼ ½ full concentrationm
milk

Ultimate results BOD level obvious G
Greater the BOD stronger the reattion…
More white… the more oxygen present
(BOD) Control 1/16 1/8 ¼ ½ full concentration
milk

Pollution of Freshwater Streams
– most developed countries have reduced point source pollution, but toxic chemicals and pollution from non-point sources are still problems
• the U.S. has avoided increases in pollution from point sources in most streams
• cleanup of rivers: Cuyahoga River in Ohio and the Thames River in Great Britain
• there are sometimes large fish kills, and contamination of drinking water from industry, mining, and non-point runoff of fertilizers and pesticides

Pollution of Freshwater Streams
– stream pollution in most developing countries is a serious and growing problem
• half of the world’s 500 major rivers are heavily polluted
• many run through developing countries where waste treatment is minimal or nonexistent

Pollution of Freshwater Streams
– the Ganges River in India is severally polluted• ~350 million people live in the Ganges River basin
with little treatment of sewage• Hindu beliefs compound problem
– air pollution from cremated bodies– water pollution from bodies thrown in river
• government solutions:– waste treatment plants in the 29 large cities along the
Ganges– electric crematoriums on its banks– introduction of snapping turtles as body scavengers

Pollution of Freshwater Lakes
– lakes are less effective at diluting pollutants that enter them
• often stratified with little vertical mixing• very little flow occurring• may take from 1–100 years to flush and change
water in lakes and reservoirs• much more vulnerable to runoff contamination of
all kinds of materials• chemical concentrations build up as they pass
through the food webs in lakes

Biomagnification of PCBs
Pollution of Freshwater Lakes
– human activities can reduce dissolved oxygen and kill some aquatic species
• natural eutrophication: nutrient enrichment of lakes from runoff
– depends on composition of the surrounding drainage basin
– can enrich abundance of desirable organisms
• cultural eutrophication occurs due to runoff– usually near urban or agricultural areas and in coastal
water, enclosed estuaries, and bays– can lead to serious pollution problems
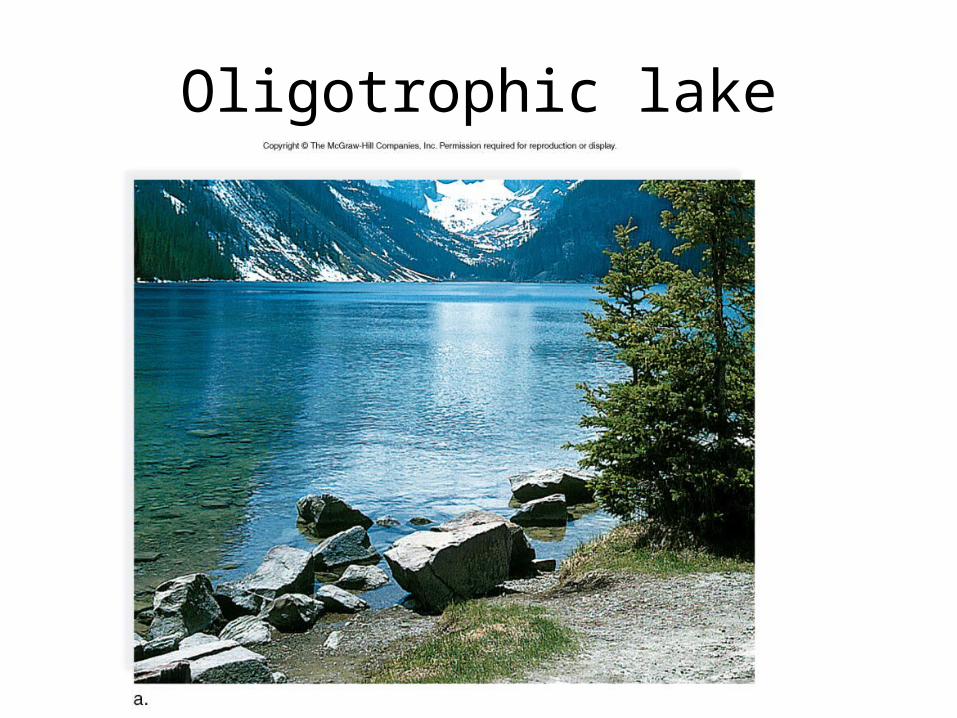
Oligotrophic lake

Eutrophic lake

Cultural eutrophication

Pollution of Freshwater Lakes
– human activities, cont.• cultural eutrophication, cont.
– the EPA states that 85% of large lakes near major population centers in U.S. have some amount of cultural eutrophication
– can be reduced or prevented by:» banning or limiting phosphates in detergents» advanced treatment methods to remove nitrates and
phosphates from wastewater» use of soil conservation to reduce runoff
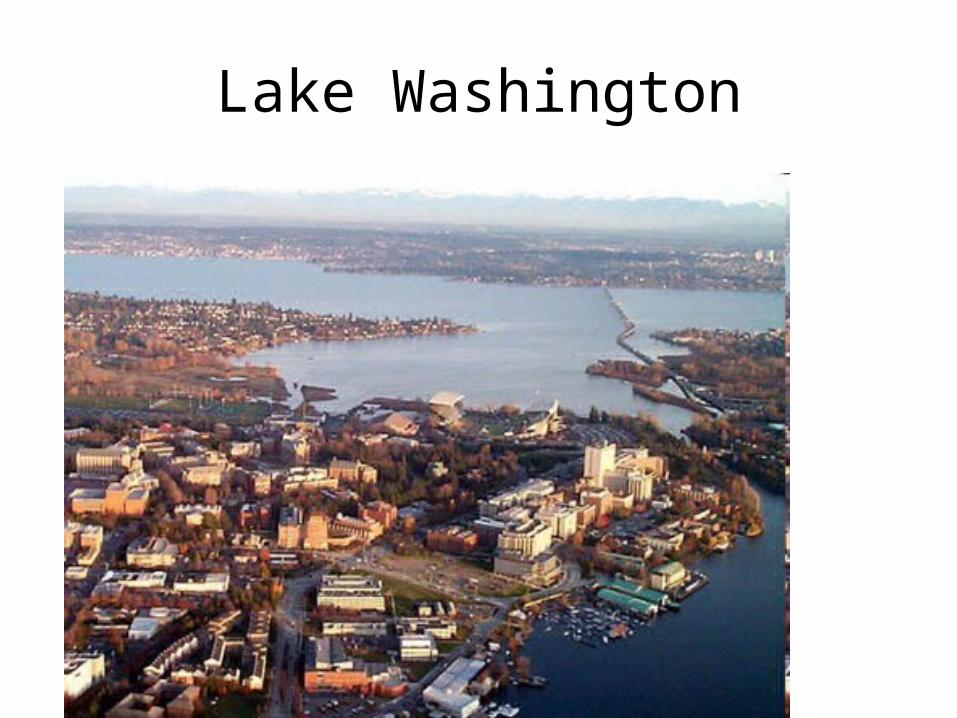
Lake Washington

Pollution of Groundwater
– the extent of groundwater contamination is generally unknown
• EPA and U.S. Geological Survey figures state that one or more organic chemicals contaminate about 45% of municipal groundwater supplies in the U.S.
• ~26,000 industrial waste ponds and lagoons in U.S. do not have a liner to prevent seepage
• many underground storage tanks have leaks• determining the extent of a leak is costly, and the
cost of cleanup is more costly yet

Groundwater contamination
20-4 Pollution of Groundwater
– groundwater contamination, cont.• nitrates can contaminate groundwater, esp. in
agricultural areas; form nitrites in the body• arsenic is released into drinking water when a well
is drilled into arsenic-rich soils and rock– WHO estimates that more than 112 million people drink
water containing 5–100 times the recommended level of 10 parts/billion
– Bangladesh has a serious problem with arsenic, but the UN and several NGOs have begun to assess wells and tag them

20-4 Pollution of Groundwater
– prevention is the most effective and affordable way to protect groundwater from pollutants
• underground tanks in the U.S. and some other developed countries are now strictly regulated
• old, leaky tanks are being removed, and the surrounding soils are being treated

Fig. 20-10 Groundwater pollution

20-6 Preventing Surface Water Pollution
– reduce non-point pollution by preventing it from reaching bodies of surface water
• agricultural non-point pollution can be reduced by:– reducing soil erosion– reducing fertilizer use; slow-release fertilizer– reforestation of watersheds– keeping cover crops on farmland– planting buffer zones between farmland and surface water
nearby– relying more on bio controls than pesticides
• EPA required to require 15,500 of the largest feedlots to apply for EPA permits
20-6 Preventing Surface Water Pollution
– most developing countries do not have laws to set water pollution standards
• most cities in developing countries discharge 80–90% of untreated sewage water used for drinking, bathing, and washing clothes
• in U.S., the Clean Water Act sets standards for allowed levels of key water pollutants and requires polluters to obtain permits to discharge pollutants into aquatic systems
• EPA is experimenting with a discharge trading policy using credits

20-6 Preventing Surface Water Pollution
– septic tanks and sewage treatment can reduce point-source water pollution
• ~1/4 of homes in U.S. served by septic tanks• most urban areas served by sewage treatment
plants• some 1,200 cities have combined storm runoff and
sewer lines because it is cheaper; can overflow• sewer systems in the U.S. are estimated to cost
$10 billion a year for 10 years to install, expand, and repair the aging sewer network

20-6 Preventing Surface Water Pollution
– water pollution laws have significantly improved water quality in U.S.
• improvements:– 1992 to 2002, communities served by water systems
meeting federal guidelines increased from 79% to 94%– fishable and swimmable streams increased from 36% to
60% of those tested– topsoil loss through runoff was cut by 111 billion metric
tons annually (%?)– annual wetland losses decreased by 80%

20-6 Preventing Surface Water Pollution
– water pollution laws have significantly improved water quality in U.S., cont.
• problem areas:– in 2000, 40% of streams and 45% of lakes surveyed
were too polluted for swimming or fishing– animal waste and waste lagoons– fish unsafe to eat (pesticides, Hg, etc.)– in 2003, the EPA found that >50% of the 6,000 largest
industrial facilities have been illegally discharging wastes into waterways

20-6 Preventing Surface Water Pollution
– a 2001 report by EPA’s inspector general calls for strengthening the Clean Water Act
• increased funding, increased authority to control non-point pollution, modernizing monitoring system, increasing compliance with the law
• integrating watershed and airshed planning to protect ground and surface water sources
• halt the loss of wetlands; increase standards for wetland restoration; and create new wetlands before filling existing ones
• farmers feel they should be compensated for property value losses that result from federal regulations protecting wetlands

20-7 Drinking Water Quality
– 20% of people lack safe drinking water• 95% of people in developed countries and 74% of
people in developing countries have access to clean drinking water
• the UN estimates $23 billion/yr for 8–10 yr to bring clean drinking water to those lacking it
– centralized water treatment plants can provide safe drinking water; water is settled, filtered, and chlorinated

20-7 Drinking Water Quality
– the U.S. is upgrading water purification and delivery systems
• hard to secure• also difficult to adequately poison• both chemical and biological indicators are being
developed to indicate contamination

20-7 Drinking Water Quality
– several simple, inexpensive ways for individuals and villages to purify drinking water have been developed
• exposure of contaminated water to intense sunlight in a clear plastic bottle kills bacteria
• filtering water through cloth reduces risk of cholera• a small amount of chlorine in a plastic or clay
storage vessel cuts the rate of diarrheal disease in half

20-7 Drinking Water Quality
– about 54 countries have standards for safe drinking water
• levels have been established called maximum contaminant levels for any pollutants that may adversely affect human health
• privately owned wells don’t have to meet these standards
• some want the standards to be strengthened• certain industries want to weaken the Safe
Drinking Water Act (which industries?)
20-7 Drinking Water Quality
– some bottled water is not as pure as tap water and costs much more
• bottled water is vastly more expensive than tap water
– 1/4 is tap water– 1/3 is contaminated with bacteria– 1/5 is contaminated with organic chemicals
• creates lots of waste• manufacture releases toxic gases and liquids• have home water tested• be wary of companies claiming EPA approval

20-7 Drinking Water Quality
– we need to shift priorities to preventing and reducing water pollution
• bottom-up political pressure on elected officials has reduced point-source water pollution
• a shift needs to be made to how we can prevent water pollution in the first place
• prevention of water pollution will take action from individuals and groups to pressure elected officials

The Green Revolution• To eliminate hunger by improving crop performance• Movement to increase yields by using:
– New crop cultivars– Irrigation– Fertilizers– Pesticides– Mechanization
Results:• Did not eliminate famine• Population still increasing• Increase cost of production• An increased negative environmental impact• Didn’t work for everyone

Coal-several (400) hundred years
Oil- Peak Oil passed
Natural Gas – at least a 50 year supply in the United States
Chapter 13: Fossil Fuels
Exxon Valdez, Drilling in ANWR
More Energy Facts
• We get 50% of our crude oil from foreign sources
• Alaska pipeline built to help increase production of domestic crude oil
• Types of coal:• Peat (not coal) Lignite (brown coal)
Bituminous coal (soft coal with high sulfur)
Anthracite (hard coal with low sulfur)
1. Energy Resources 2. Oil
3. Natural Gas4. Coal5. Nuclear Energy
www.bio.miami.edu/beck/esc101/Chapter14&15.ppt

Important energy facts
• Brief history of energy*1700-1800 Fire wood*1900-1920 Coal*1950- now crude oil
• “production of crude oil” = with drawing it from reserves
• OPEC (pg 319) organization of petroleum exporting countries (Mid-east countries mainly)

Changes in U.S. Energy Use
www.bio.miami.edu/beck/esc101/Chapter14&15.ppt

Electricity
1. Electricity is a secondary energy source because it relies on another energy source to create the electricity.
2. Basic production of electricity-boil water to produce steam to turn turbines to generate electron flow through a wire.
3. Examples of primary sources for electrical production
1. 20% from nuclear
2. 57% from coal
3. Oil, geothermal, solar, wind, hydroelectric (no boiling water required for these sources)
Is electricity a clean energy source?

Coal
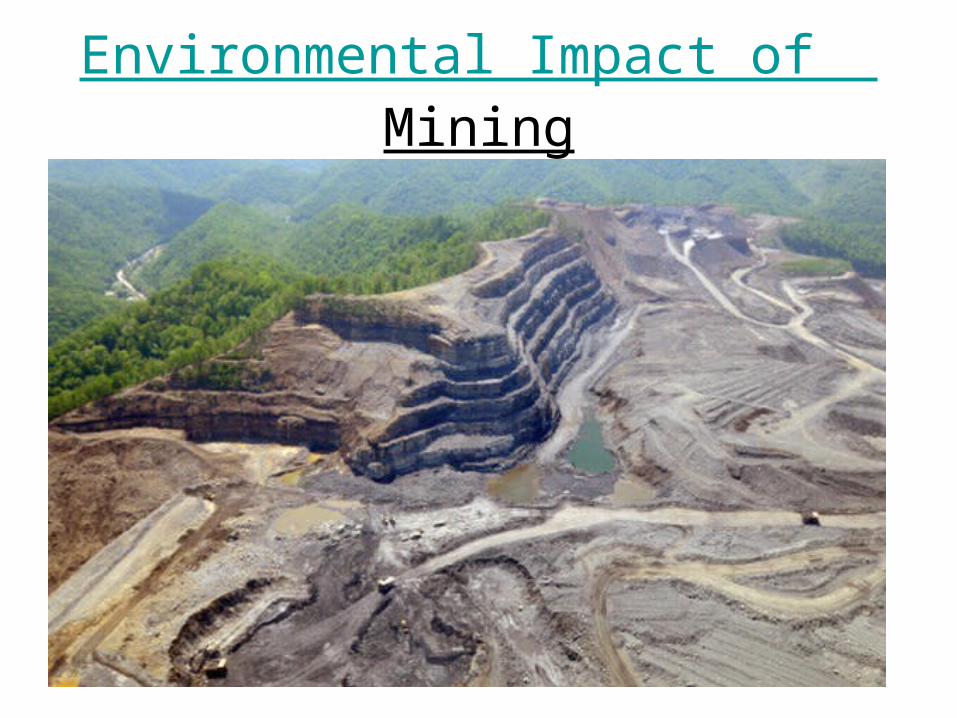
• Environmental Consequences1. Production: ecosystem damage, reclamation
difficult, acid mine runoff, mine tailings, erosion, black lung, radon
2. Transport: energy intensive because of weight and number of train cars needed
3. Use: fossil fuel with largest source of carbon dioxide and greatest quantity of contaminants, large volume of waste, acid precipitation
Coal: Supply and Demand
• Coal exists in many forms therefore a chemical formula cannot be written for it.
• Coalification: After plants died they underwent chemical decay to form a product known as peat– Over many years, thick peat layers formed. – Peat is converted to coal by geological events
such as land subsidence which subject the peat to great pressures and temperatures.
www.lander.edu/rlayland/Chem%20103/chap_12.ppt

Ranks of Coal• Lignite: A brownish-black coal of low quality (i.e., low
heat content per unit) with high inherent moisture and volatile matter. Energy content is lower 4000 BTU/lb.
• Subbituminous: Black lignite, is dull black and generally contains 20 to 30 percent moisture Energy content is 8,300 BTU/lb.
• Bituminous: most common coal is dense and black (often with well-defined bands of bright and dull material). Its moisture content usually is less than 20 percent. Energy content about 10,500 Btu / lb.
• Anthracite :A hard, black lustrous coal, often referred to as hard coal, containing a high percentage of fixed carbon and a low percentage of volatile matter. Energy content of about 14,000 Btu/lb.
www.uvawise.edu/philosophy/Hist%20295/ Powerpoint%5CCoal.ppt
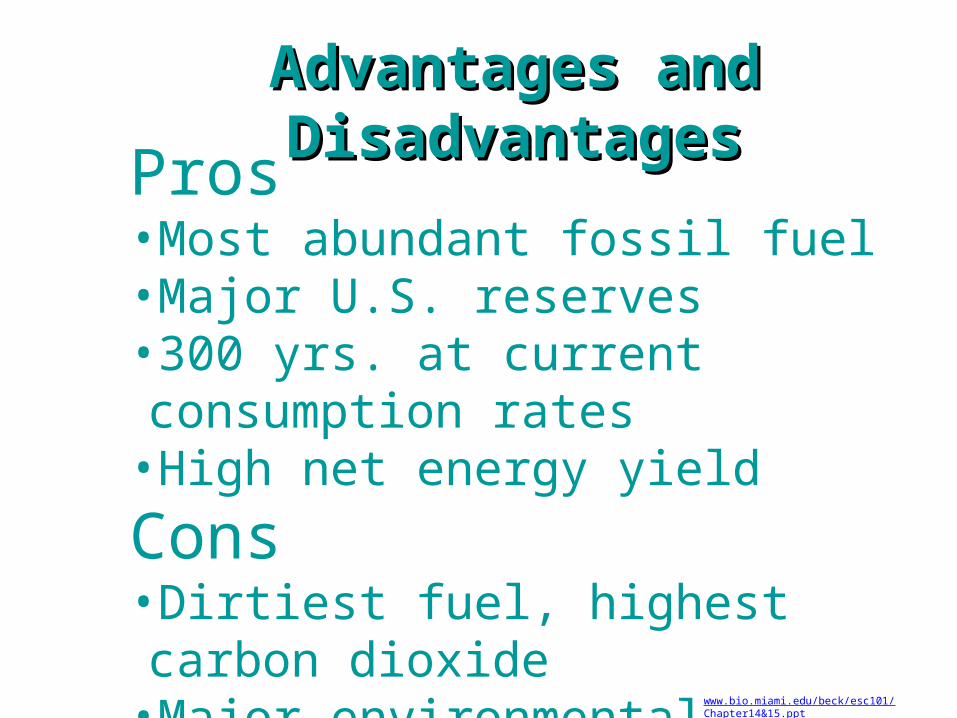
Advantages and DisadvantagesAdvantages and Disadvantages
Pros•Most abundant fossil fuel•Major U.S. reserves•300 yrs. at current consumption rates•High net energy yield
Cons•Dirtiest fuel, highest carbon dioxide•Major environmental degradation•Major threat to health © Brooks/Cole Publishing Company / ITP
www.bio.miami.edu/beck/esc101/Chapter14&15.ppt

Sulfur in Coal• When coal is burned, sulfur is released
primarily as sulfur dioxide (SO2 - serious pollutant)
– Coal Cleaning - Methods of removing sulfur from coal include cleaning, solvent refining, gasification, and liquefaction Scrubbers are used to trap SO2 when coal is burned
– Two chief forms of sulfur is inorganic (FeS2 or CaSO4) and organic (Sulfur bound to Carbon)
www.lander.edu/rlayland/Chem%20103/chap_12.ppt

Acid Mine Drainage
The impact of mine drainage on a lake after
receiving effluent from an
abandoned tailings
impoundment for over 50
years

Mine effluent discharging from the bottom of a waste rock pile

Oil: The Most Important Fossil Fuel in the American Economy
Environmental Consequences
1. Production: local ecosystems damage possible
2. Transport: oil spills cause local and regional ecosystem damage
3. Use: photochemical smog, particulates, acid precipitation, carbon dioxide

Natural Gas
• Environmental Consequences:
1. Production: local ecosystem damage possible if oil or coal is part of the deposit
2. Transport: can be explosive3. Use: produces the least air
pollutants of all the fossil fuels
Possibly a transition fuel between fossil fuel and alternative energy sources.

Sources of Natural Gas•Russia & Kazakhstan - almost 40% of world's supply.
•Iran (15%), Qatar (5%), Saudi Arabia (4%), Algeria (4%), United States (3%), Nigeria (3%), Venezuela (3%);
•90–95% of natural gas in U.S. domestic (~411,000 km = 255,000 miles of pipeline).
www.bio.miami.edu/beck/esc101/Chapter14&15.ppt

billion cubic metres
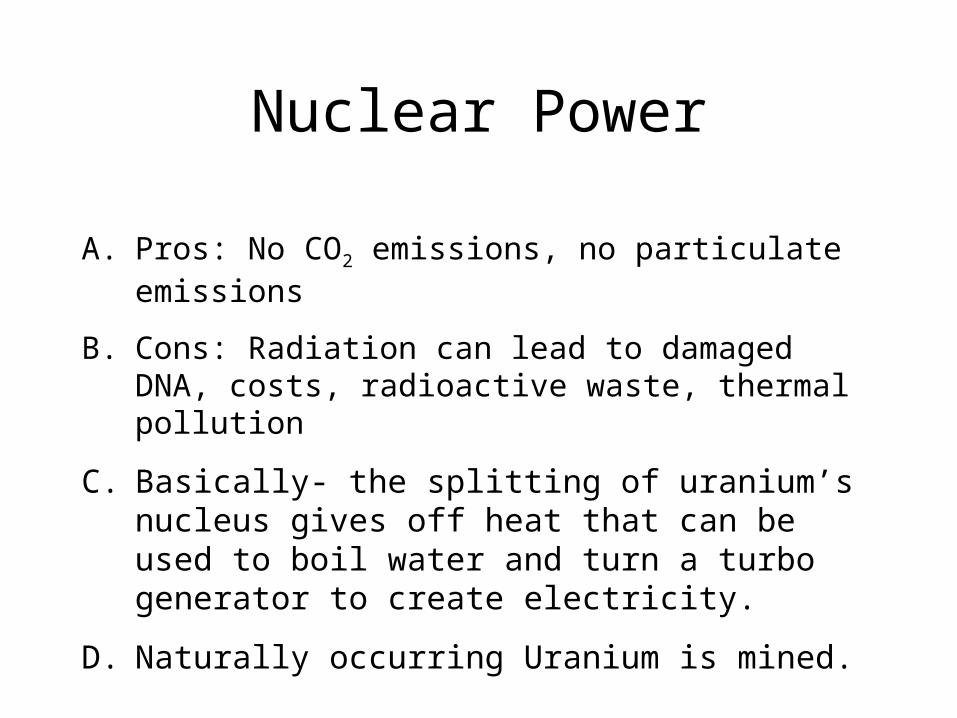
A. Pros: No CO2 emissions, no particulate emissions
B. Cons: Radiation can lead to damaged DNA, costs, radioactive waste, thermal pollution
C. Basically- the splitting of uranium’s nucleus gives off heat that can be used to boil water and turn a turbo generator to create electricity.
D. Naturally occurring Uranium is mined.
Nuclear Power

Nuclear important facts
• Fusion- the combination of 2 atoms to form a larger atom
• Fission- splitting an atom• Nuclear Regulatory Commission is the US
governmental Agency that regulates nuclear power plants
• Radioisotope= unstable radioactive isotope
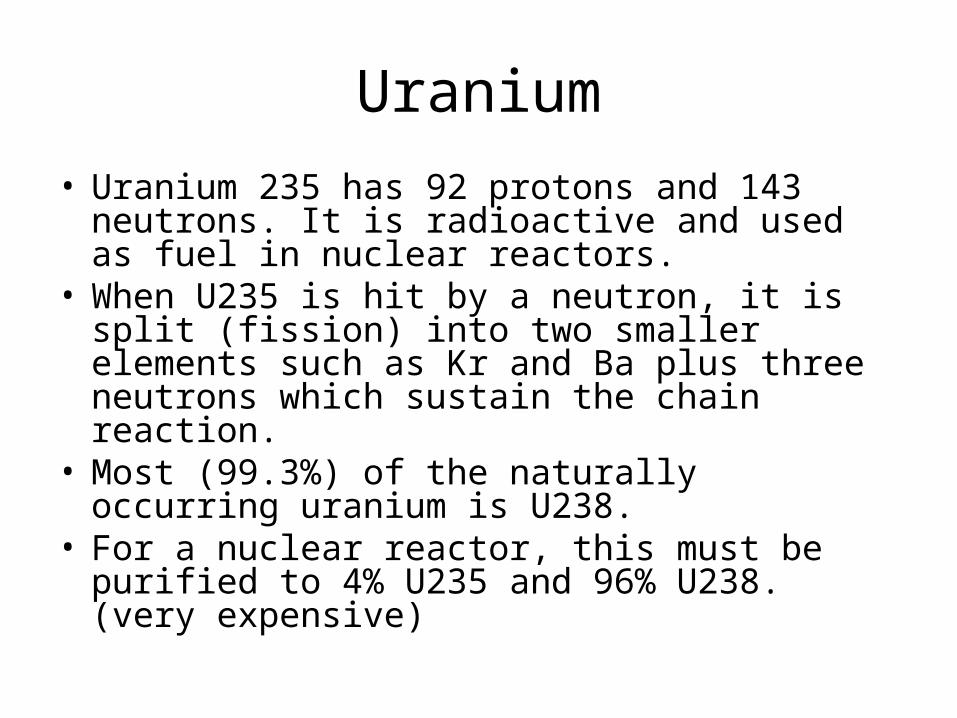
Uranium
• Uranium 235 has 92 protons and 143 neutrons. It is radioactive and used as fuel in nuclear reactors.
• When U235 is hit by a neutron, it is split (fission) into two smaller elements such as Kr and Ba plus three neutrons which sustain the chain reaction.
• Most (99.3%) of the naturally occurring uranium is U238.
• For a nuclear reactor, this must be purified to 4% U235 and 96% U238. (very expensive)

a. Water moderator: slows down neutrons
b. Neutron-absorbing material- control rod
c. Fuel Rods- approximately one third replaced each year
d. Heat transfer system
e. Cooling system
f. Redundant safety systems
D. How does a Power Plant Operate?

Waste Disposal
All fuel rods are still in cooling ponds at commercial nuclear facilities
Proposed site for disposal - Yucca Mountain in SE Nevada
Concerns: Geological active area, Intrusion of water table, distances for wastes travel, radioactive decay and half-lives

Accidents
• Chernobyl: – 4/26/86 – Ukraine – complete meltdown.
• Three Mile Island: – 3/28/79 – Pennsylvania (Harrisburg) – partial meltdown, no one known to be hurt.
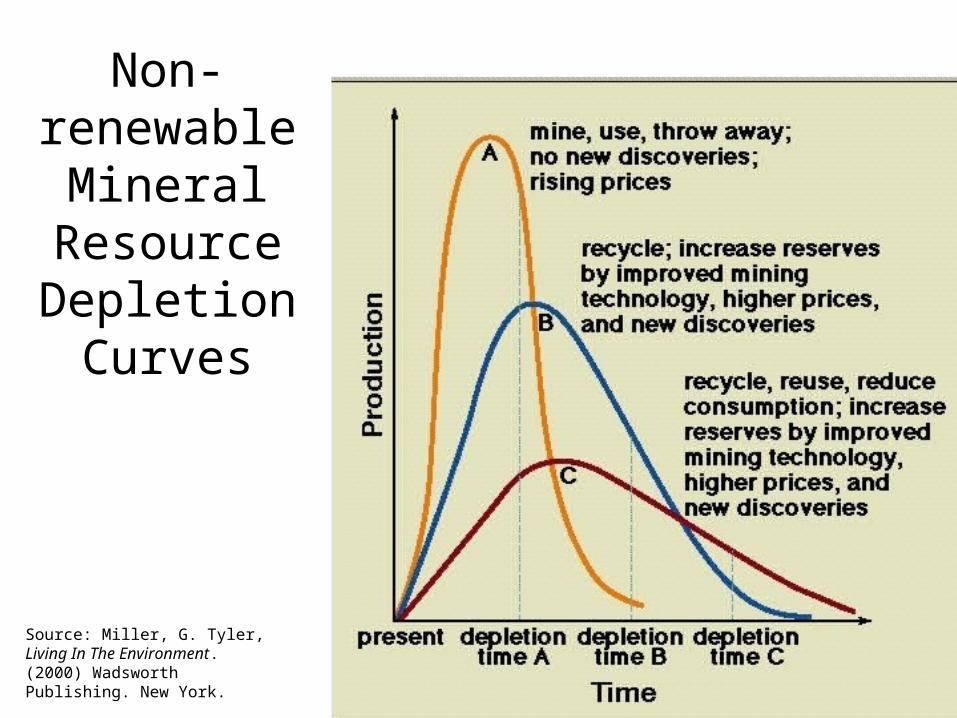
Non-renewable
Mineral Resource Depletion Curves
Source: Miller, G. Tyler, Living In The Environment. (2000) Wadsworth Publishing. New York.

Nuclear Energy
•In a conventional nuclear power plant–a controlled nuclear fission chain reaction
–heats water–produce high-pressure steam –that turns turbines –generates electricity.
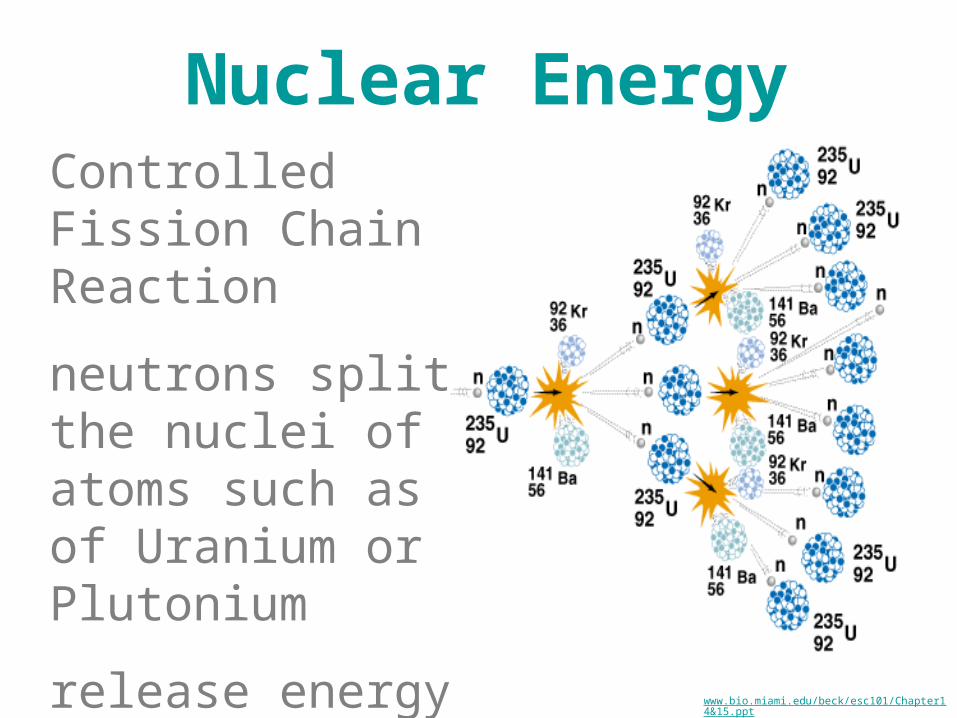
Nuclear EnergyControlled Fission Chain Reaction
neutrons split the nuclei of atoms such as of Uranium or Plutonium
release energy (heat)
www.bio.miami.edu/beck/esc101/Chapter14&15.ppt

www.bio.miami.edu/beck/esc101/Chapter14&15.ppt
UtubeVideo

• Types• Alpha particles consist of 2 protons and 2 neutrons,
and therefore are positively charged• Beta particles are negatively charged (electrons)• Gamma rays have no mass or charge, but are a form
of electromagnetic radiation (similar to X-rays)
• Sources of natural radiation• Soil• Rocks• Air• Water• Cosmic rays
RadioactivityRadioactivity
www.bio.miami.edu/beck/esc101/Chapter14&15.ppt

1. Low-level radiation (Gives of low amount of radiation)• Sources: nuclear power plants, hospitals &
universities• 1940 – 1970 most was dumped into the ocean• Today deposit into landfills
2. High-level radiation (Gives of large amount of radiation)• Fuel rods from nuclear power plants• Half-time of Plutonium 239 is 24000 years• No agreement about a safe method of storage
Radioactive WasteRadioactive Waste
www.bio.miami.edu/beck/esc101/Chapter14&15.ppt


Chernobyl• April 26, 1986, reactor explosion (Ukraine) flung radioactive debris into atmosphere
• Health ministry reported 3,576 deaths
• Green Peace estimates32,000 deaths;
• About 400,000 people were forced to leave their homes
• ~160,000 sq km (62,00 sq mi) contaminated
• > Half million people exposed to dangerous levels of radioactivity
• Cost of incident > $358 billionwww.bio.miami.edu/beck/esc101/Chapter14&15.ppt


Protection of Biodiversity and Ecosystems
• Threatened – if the trend continues, the species will be endangered.•Endangered – if the trend continues, the species will go extinct.•Pharmaceuticals and native plants Approximately 25% of drugs used as medicines come from natural plant sources.•The Exxon Valdez Oil Spill (1989) 300,000 birds died as a result of that particular oil spill. The area, Prince William Sound, is still recovering.
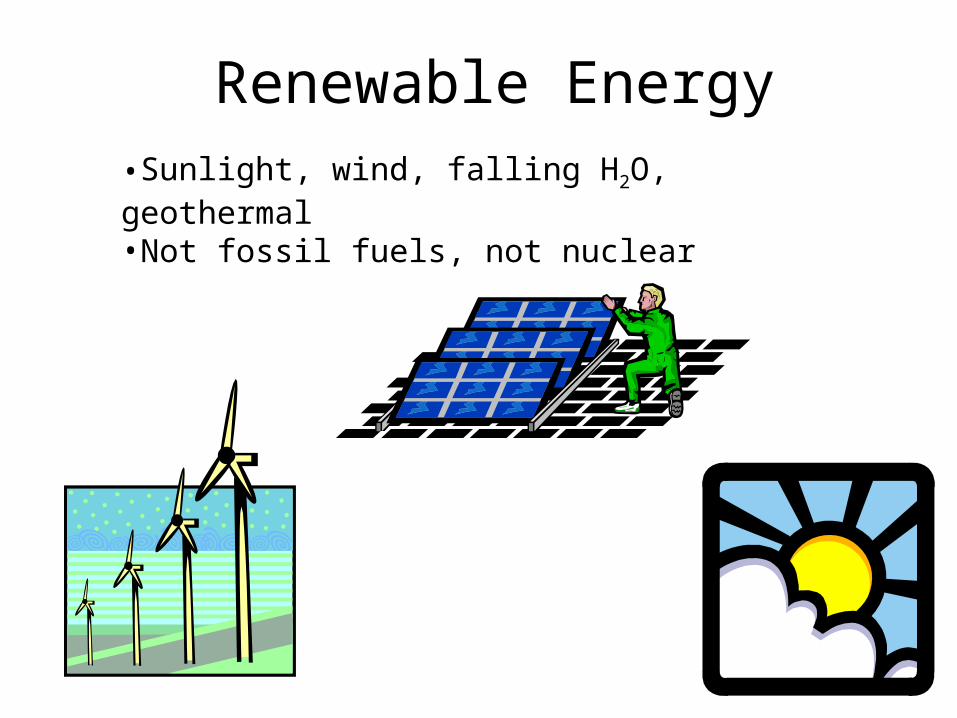
Renewable Energy•Sunlight, wind, falling H2O, geothermal•Not fossil fuels, not nuclear
Indirect Solar power
• How does it affect…
• Wind?
• Hydropower?
• Firewood?
• Hydro carbon fuels?
• Nuclear and Geothermal are not indirect solar

Solar Energy
Passive solar• Large south-facing windows, heavy drapes to trap
heat at night, interior bricks to trap heat• Shade windows in summer• Even though back up systems are required, and solar
heating may only lessen the need for heating oil a few %, it will help us adapt to diminishing oil supplies.
Active solar• Photovoltaic (PV) panels can be used to convert the
energy from the sun into electricity.• Electrons from the silicon in the PV panel are
“pushed” through a wire by photons from the sun creating an electric current.

Risks and Pests Borneo (DDT), MTBE
Hazard - Anything that causes:1. Injury, disease, or death to humans2. Damage to property3. Destruction of the environment
Cultural hazard - a risk that a person chooses to engage inRisk
The probability of suffering (1, 2, or 3) as a result of a hazard
Perception What people think the risks are

Cigarette Smoking
• Leading cause of cancer in U.S.
• Can cause cancer, lung disease, a bigger risk of death in addition with other types of air pollution.
• Highest health risk in U.S.

Insecticides/Pesticides
• Integrated pest management includes: – adjusting environmental conditions – chemical pesticides – disease resistant varieties – crop rotation– biological controls
• Insecticides kills plants, mammals, fish, birds
• A broad spectrum pesticide is effective towards many types of pests
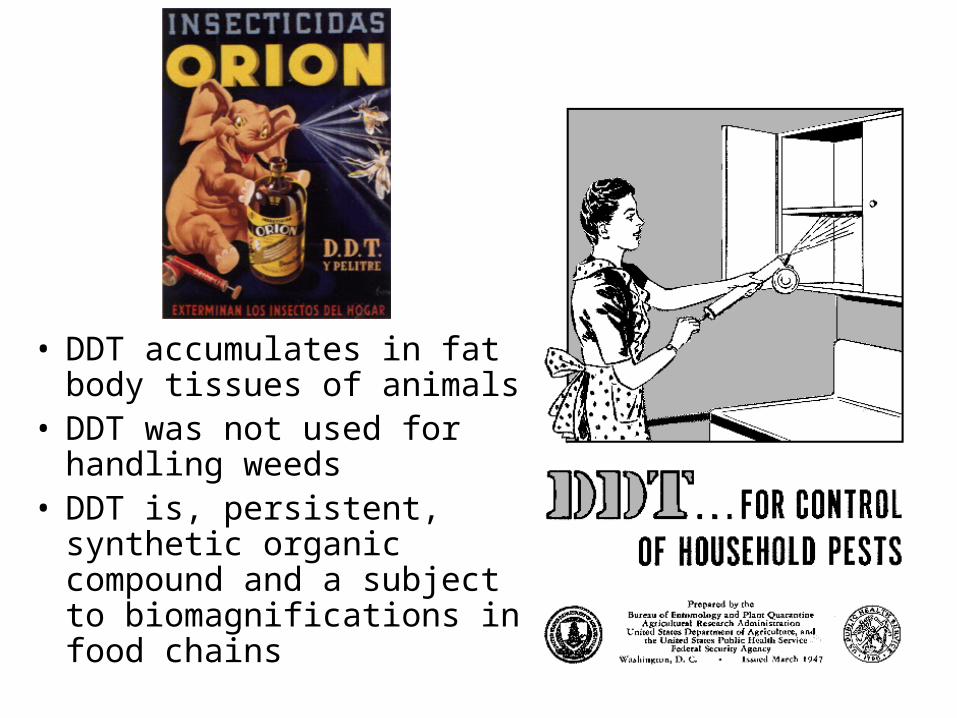
• DDT accumulates in fat body tissues of animals
• DDT was not used for handling weeds
• DDT is, persistent, synthetic organic compound and a subject to biomagnifications in food chains
Diseases
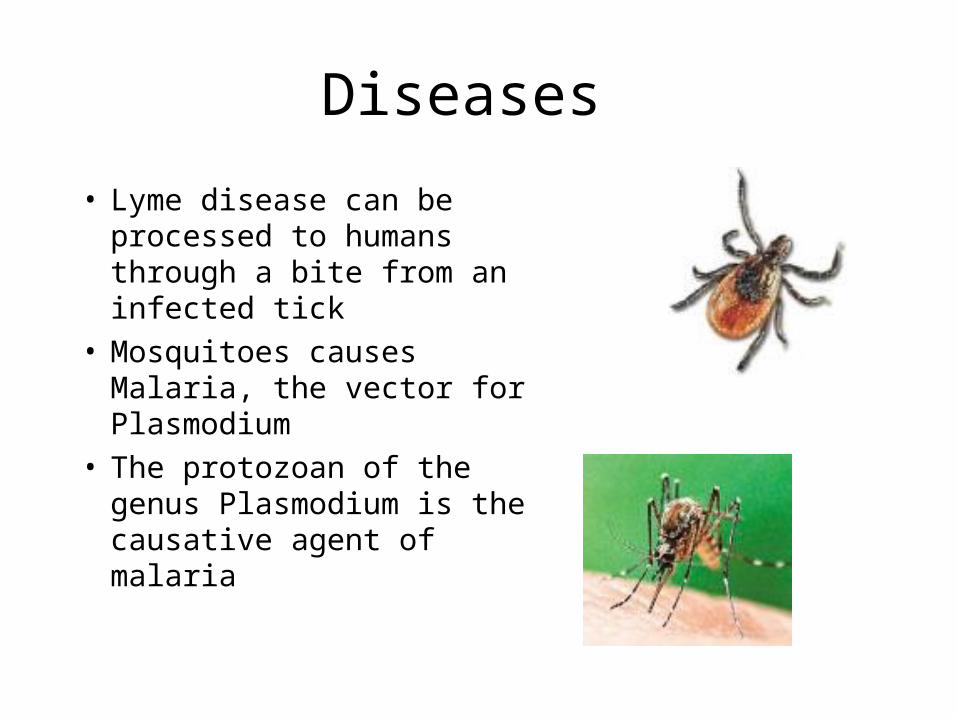
• Lyme disease can be processed to humans through a bite from an infected tick
• Mosquitoes causes Malaria, the vector for Plasmodium
• The protozoan of the genus Plasmodium is the causative agent of malaria

Diseases cont’d
• Lack of access to safe drinking water is a major cause of disease transmission in developing countries.
• Epidemiology is the study of the presence, distribution and control of a diseases in a population
• Morbidity is the incidence of disease in a population
• Mortality is the incidence of death in a population

Water Pollution
• Sewage treatment is a common practice
• In the 1970’s many cities were still dumping raw sewage into waterways
• In 1972, the Clean water act provided funding for upgrading sewage treatment plants
• Currently water ways are the much better
• 1°, 2° use preliminary but no more
• Test for sewage contamination in drinking H2O Fecal Coliform test

Sewage Treatment
• Raw sewage (99% H2O)Preliminary Treatment- allow grit to settle1° separating Raw Sludge from H2O2° AKA Biological Treatment- bacteria
feeds on the organic materialTrickling filters contain bacteria
remove raw sludge from the H2O• Raw Sludge May contain heavy metals
If it does it needs 3° treatment, to remove the toxic chemicals
Home Septic Systems:
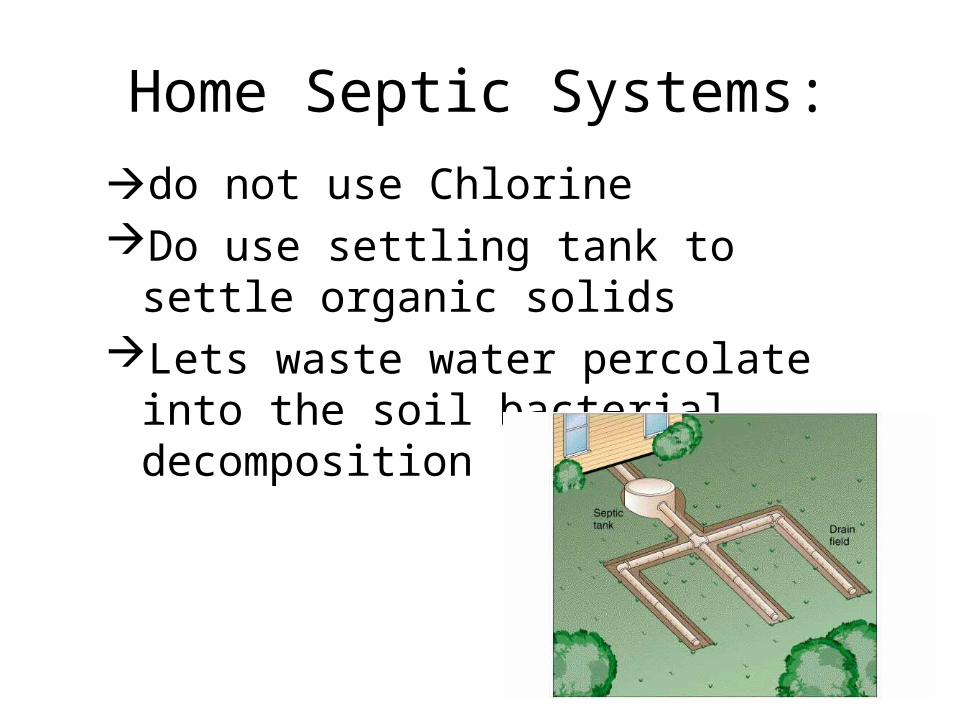
do not use Chlorine Do use settling tank to settle organic
solidsLets waste water percolate into the
soil bacterial decomposition
Municipal Solid Waste
• 210,000,000 tons of municipal solid waste (MSW) are disposed of annually in the United States.
• Most of that waste is paper.• Fifty-five percent of MSW is disposed of in landfills. • 17% of MSW is combusted, mostly in waste-to-energy
(WTE) combustion facilities. What are the advantages and disadvantages of WTE combustion?
• The best solution to solid waste problems is to reduce waste at its source.
• More than 75% of MSW is recyclable. What role is recycling playing in waste management, and how is recycling best promoted?
• Much more can be done to move MSW management in a more sustainable direction. What are some recommendations to improve MSW management?

Ch 20: Hazardous Waste
Halogenated hydrocarbons• Organic compounds with a halogen
(bromine, iodine, ect.) replacing a hydrogen
• Used as pesticides
• Used to make plastic
• Resistant to biodegradation

Chlorinated hydrocarbons
• Chlorinated hydrocarbons
• Are synthetic organic compounds
• Dioxin
• Mainly caused by burning PVC pipe (medical waste)
• Linked to cancer.
• Also an endocrine disruptor.
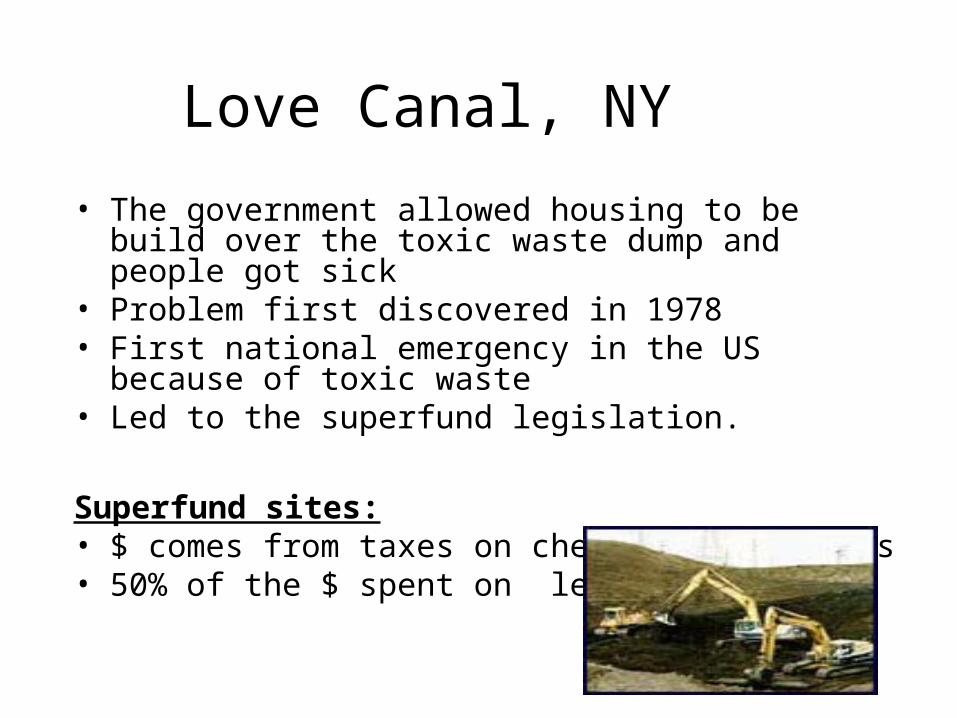
Love Canal, NY
• The government allowed housing to be build over the toxic waste dump and people got sick
• Problem first discovered in 1978• First national emergency in the US because of toxic
waste• Led to the superfund legislation.
Superfund sites:• $ comes from taxes on chemical industries• 50% of the $ spent on legal costs
Pollution
Air, Solid, Water

Animation of CO2Emmission
• Climate Change Video

Composition of the troposphere
• 78% N2
• 20% O2
• Less than 2%• H2O vapor (.01%-4%)
• Argon gas (1%)
• CO2 (0.04%)
• Trace gases

The star pollutants mentioned are sulfur dioxide, nitrogen dioxide and particulates caused by an assortment of methods such as burning fossil fuels, bi products of power plants or even particles that include lead, dust ammonia and other harmful substances

Major Outdoor Air Pollutants
• Primary – direct products of combustion and evaporation
• Secondary – when primary pollutants undergo further reactions in atmosphere
1. Suspended particulate matter (primary)
2. Volatile Organic Compounds (secondary)
3. Carbon Monoxide (primary)
4. Nitrogen Oxides (can be both)
5. Sulfur Oxides(primary from combustion of coal)
6. Ozone and other photochemical oxidants (secondary)
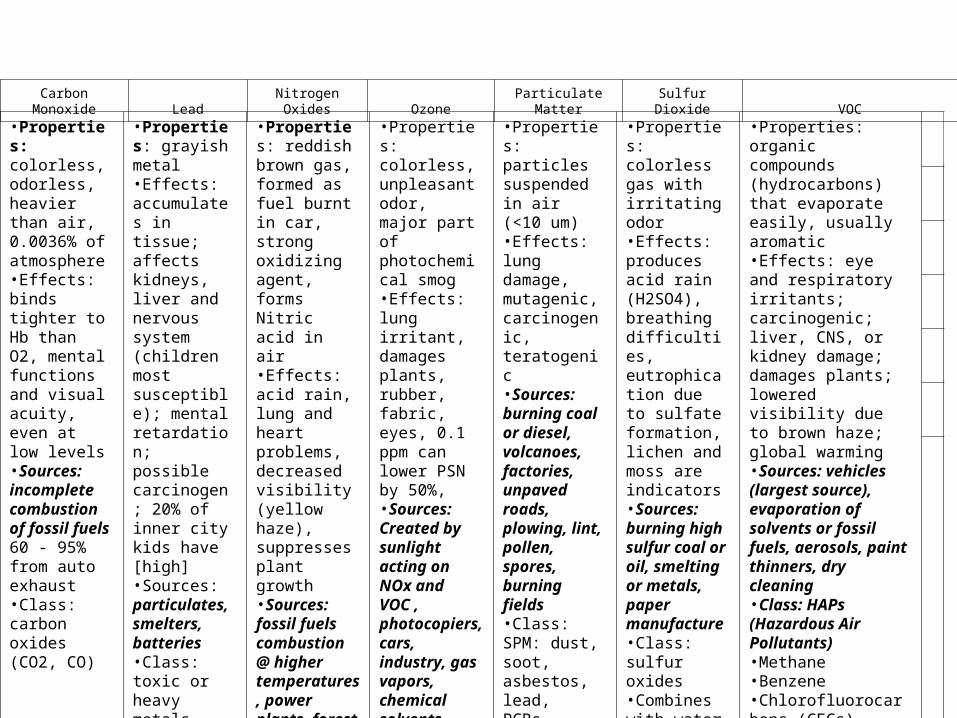
•Properties: colorless, odorless, heavier than air, 0.0036% of atmosphere•Effects: binds tighter to Hb than O2, mental functions and visual acuity, even at low levels•Sources: incomplete combustion of fossil fuels 60 - 95% from auto exhaust•Class: carbon oxides (CO2, CO)
•Properties: grayish metal•Effects: accumulates in tissue; affects kidneys, liver and nervous system (children most susceptible); mental retardation; possible carcinogen; 20% of inner city kids have [high]•Sources: particulates, smelters, batteries•Class: toxic or heavy metals
•Properties: reddish brown gas, formed as fuel burnt in car, strong oxidizing agent, forms Nitric acid in air•Effects: acid rain, lung and heart problems, decreased visibility (yellow haze), suppresses plant growth•Sources: fossil fuels combustion @ higher temperatures, power plants, forest fires, volcanoes, bacteria in soil•Class: Nitrogen oxides (NOx)
•Properties: colorless, unpleasant odor, major part of photochemical smog•Effects: lung irritant, damages plants, rubber, fabric, eyes, 0.1 ppm can lower PSN by 50%, •Sources: Created by sunlight acting on NOx and VOC , photocopiers, cars, industry, gas vapors, chemical solvents, incomplete fuel combustion products•Class: photochemical oxidants
•Properties: particles suspended in air (<10 um)•Effects: lung damage, mutagenic, carcinogenic, teratogenic•Sources: burning coal or diesel, volcanoes, factories, unpaved roads, plowing, lint, pollen, spores, burning fields•Class: SPM: dust, soot, asbestos, lead, PCBs, dioxins, pesticides
•Properties: colorless gas with irritating odor•Effects: produces acid rain (H2SO4), breathing difficulties, eutrophication due to sulfate formation, lichen and moss are indicators•Sources: burning high sulfur coal or oil, smelting or metals, paper manufacture•Class: sulfur oxides•Combines with water and NH4 to increase soil fertility
•Properties: organic compounds (hydrocarbons) that evaporate easily, usually aromatic •Effects: eye and respiratory irritants; carcinogenic; liver, CNS, or kidney damage; damages plants; lowered visibility due to brown haze; global warming•Sources: vehicles (largest source), evaporation of solvents or fossil fuels, aerosols, paint thinners, dry cleaning•Class: HAPs (Hazardous Air Pollutants) •Methane•Benzene•Chlorofluorocarbons (CFCs), etc.
Carbon Monoxide Lead Nitrogen Oxides Ozone Particulate Matter Sulfur Dioxide VOC

NASA Video on Ozone Hole

Stratospheric ozone depletion
1 Cl atom can split many O3 molecules
CFCs persist in the stratosphere. They split oxygen atoms off ozone (O3) to form oxygen (O2).

Ozone (O3)
Stratospheric ozone is GOOD– It shields us from the harmful UVB rays of the sun.– Ozone depletion is the thinning of the
stratospheric ozone shield (mostly over the South Pole, Australia story)
– Analogy – Stratospheric O3 is like sunscreen for the earth.
Tropospheric ozone is BAD•If we breath it, it causes lung damage•It is also a greenhouse gas

Primary PollutantsPrimary Pollutants
Secondary PollutantsSecondary Pollutants
SourcesSourcesNaturalNaturalStationaryStationary
COCO COCO22
SOSO22 NONO NONO22
Most hydrocarbonsMost hydrocarbons
Most suspendedMost suspendedparticlesparticles
SOSO33
HNOHNO33 HH22SOSO44
HH22OO22 OO33 PANsPANs
MostMost andand saltssaltsNONO33––
MobileMobile
SOSO4422 ––

More
H+
More
OH-
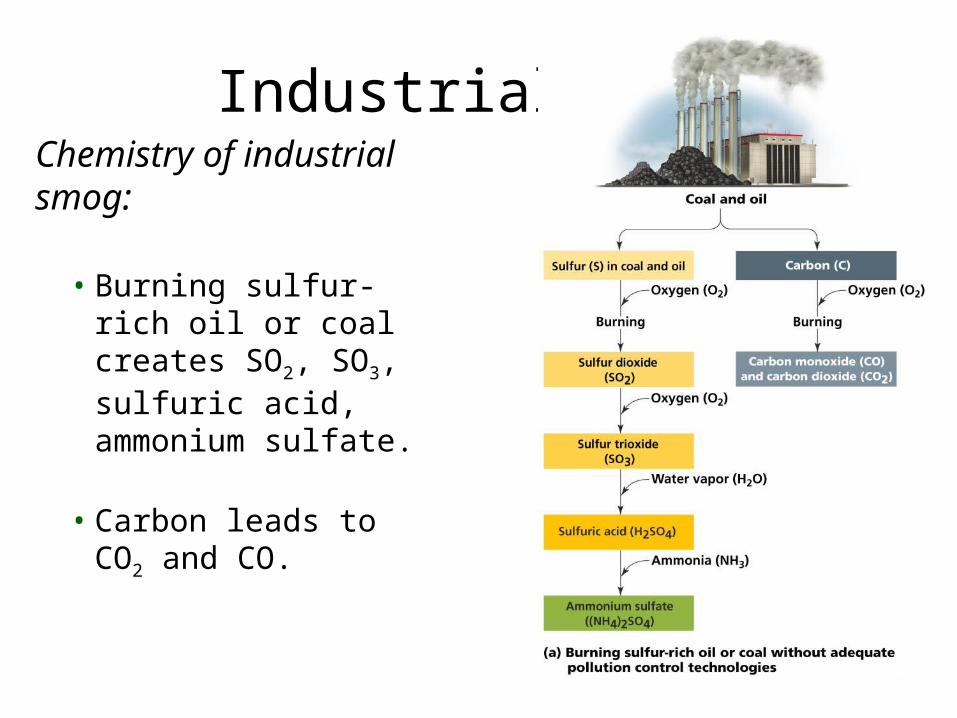
Industrial smogChemistry of industrial smog:
• Burning sulfur-rich oil or coal creates SO2, SO3, sulfuric acid, ammonium sulfate.
• Carbon leads to CO2 and CO.

Photochemical Smog
Primary Pollutants
NO2 + Hydrocarbons
Auto Emissions
UV radiation
H2O + O2
Secondary Pollutants
HNO3 O3
nitric acid ozone
Photochemical Smog

...when polluted air is stagnant (weather conditions, geographic location)
Los Angeles, CA
Smog Forms

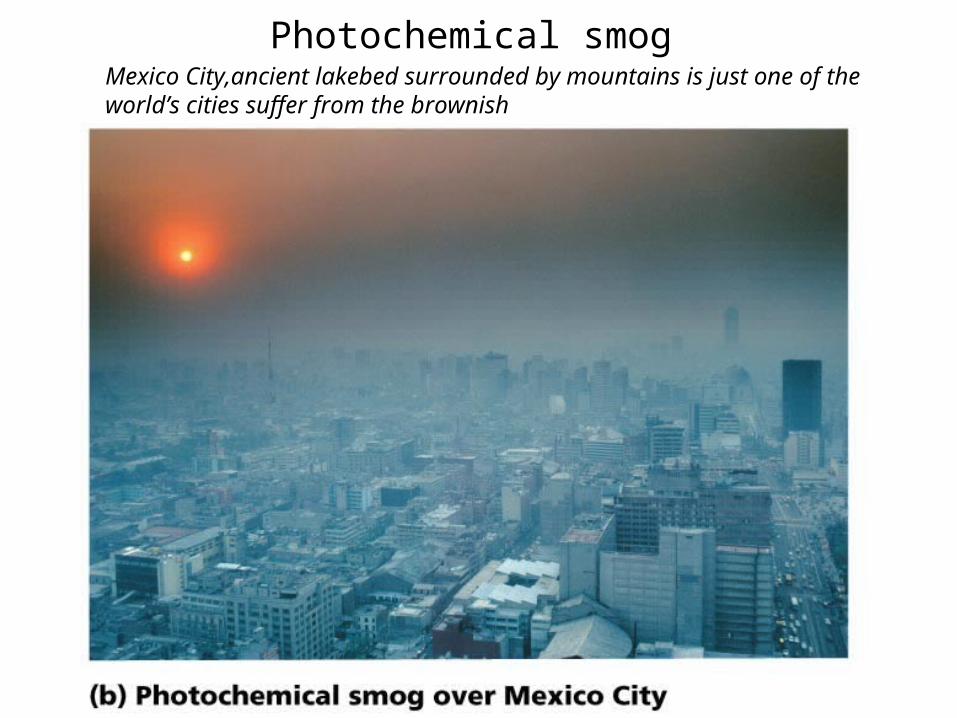
Photochemical smogMexico City,ancient lakebed surrounded by mountains is just one of the world’s cities suffer from the brownish

Air pollution
• Expensive: health care costs, human lives• -acute - Chronic - Carcinogenic • Damages buildings, bridges, statues, books• Aesthetics• Damage to Plants - Agriculture – crops loss ~$5 billion/year - Forests

Sources of air pollution• Natural: a. Sulfur: Volcanoes, sea spray, microbialb. Nitrogen oxides: lightening, forest fires,
microbial• Anthropogenic (human caused) a. Sulfur oxides: coal burning plants, industry,
fossil fuels.b. Nitrogen oxides: power plants, industrial fuel
combustion, transportationc. Effect areas hundreds of miles from the source
of emissions, generally not the whole globe

Household Hazardous Waste
• Common household items such as paints, cleaners, oils, batteries, and pesticides contain hazardous components
• Labels – danger, warning, caution, toxic, corrosive, flammable, or poison identify products that might contain hazardous materials
• Leftover portions of these products are called household hazardous waste (HHW)
• These products, if mishandled, can be dangerous to your health and the environment
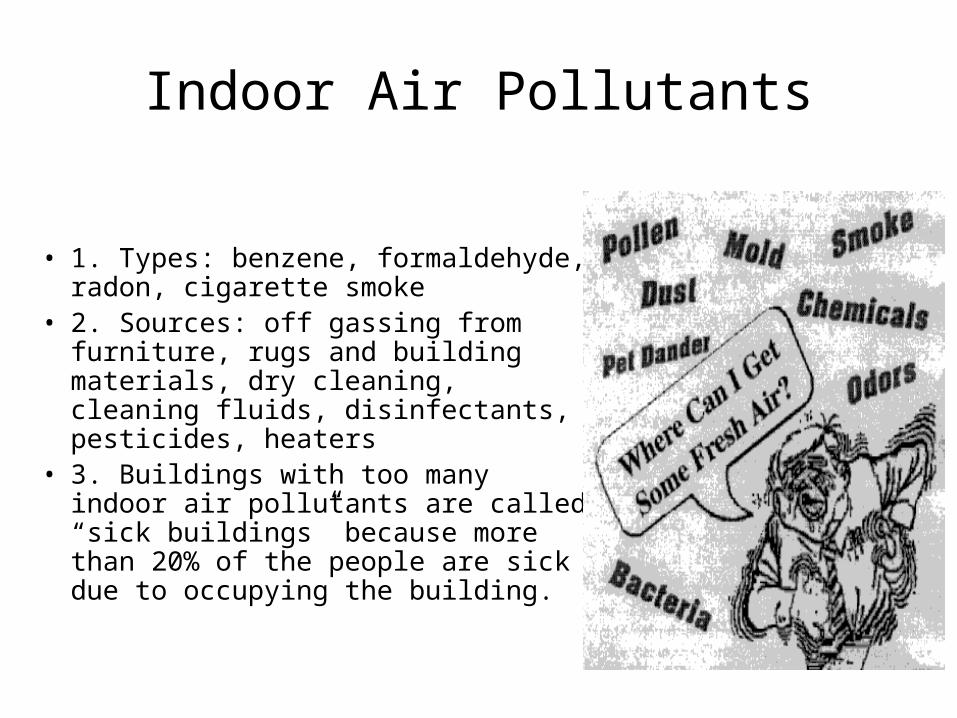
Indoor Air Pollutants
• 1. Types: benzene, formaldehyde, radon, cigarette smoke
• 2. Sources: off gassing from furniture, rugs and building materials, dry cleaning, cleaning fluids, disinfectants, pesticides, heaters
• 3. Buildings with too many indoor air pollutants are called “sick buildings” because more than 20% of the people are sick due to occupying the building.


Factors Effecting Climate Change
• Wobble of the planet
• Albedo-reflectiveness
• Cloud cover
• Pollution- Aerosols and particulates
• Ocean absorbing heat, absorbing CO2…

Earth’s climate system

Milankovitch cyclesThese 3 types of cycles also affect climate in the long term.
Wobble of Earth’s axis
Variation of Earth’s orbit
Variation of Earth’s tilt

Oceans and climatevideo from NasaIf global warming causes enough of Greenland’s ice sheet to melt, freshwater runoff into the north Atlantic could shut down current and abruptly
change the climate of Europe and eastern North America.

El Niño and La NiñaNormal conditions
In an El Niño event, winds weaken, warm water sloshes to the east, and prevents the cold upwelling.
La Niña is the opposite: Cold water spreads west.

Jakata Sudan
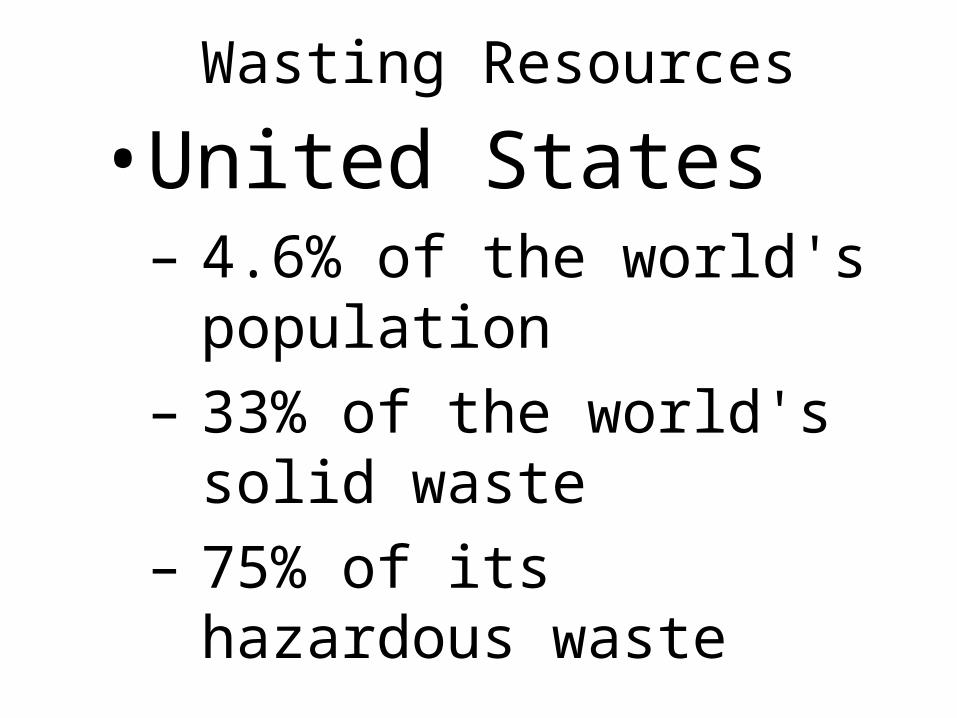
Wasting Resources
•United States – 4.6% of the world's
population– 33% of the world's
solid waste – 75% of its hazardous
waste

Agriculture Waste
• Livestock produce sewage– 200,000 hens, 1200 head of cattle in a
feedlot, & 10,500 hogs may produce as much waste as 20,000 people
– In the U.S., there are 337 million hen, 96.1 million head of cattle & 58.7 million hogs which produce twice as much sewage as all the humans in the U.S.

Solid WasteStory of Stuff Video
•98.5% is from–1. Mining–2. Oil and gas production–3. Agriculture–4. Sewage treatment–5. Industry
•1.5% is municipal solid waste (MSW)

Municipal Solid Waste
• MSW—more commonly known as trash or garbage—consists of everyday items– Product packaging– Grass clippings– Furniture– Clothing– Bottles– Food scraps– Newspapers– Appliances– Paint– Batteries
http://www.epa.gov/epaoswer/non-hw/muncpl/facts.htm
What do we do with it?
A Modern Landfill Incineration

Landfill DesignLandfill Design

Superfund Legislation
• Comprehensive Environmental Response, Compensation, and Liabilities Act (CERCLA); 1980– “Superfund” to clean up abandoned
sites
– Hazard Ranking System (HRS)
– National Priority List (NPL)
– Reauthorized in 1986 (SARA)
Love Canal Part 1 and Part 2

Global warming
• Global warming occurs when humans contribute too much of these greenhouse gases leading to a small (1-3 degree C) but significant rise in the global average temperature.
• Analogy – Car on a sunny day
The greenhouse effect is natural and important to deep the earth warm enough for
life to exist

Acids and Bases
pH-log of hydrogen ions in a solution. Therefore each number higher on the pH scale is 10X more basic
• Basic- OH- (hydroxyl ions) over 7 on the pH scale
• Acidic-H+ ions under 7 on the pH scale• Neutral- pure water is 7 on the pH scale• Normal rain is slightly acidic-pH 6.4• Acid rain is defined as less than a pH of
5.5

Solutions: Reducing Emissions
• Best way = Conservation, just use less!
Input Control
a. Cleaner burning gasolineb. increased fuel efficiencyc. alternative modes of
transportationd. decrease the number of miles
drivene. changes in land use decisionsf. catalytic converter

Output Control
A. Scrubbers: exhaust fumes through a spray of H2O containing lime (CaCO3) SO2 CaSO3
B. Coal washing to get rid of sulfur
C. Fluidized bed combustion (produces a waste ash that must be disposed of)