ap student success at the college level · · 2018-03-29biology calculus ab calculus bc ... or...
TRANSCRIPT

AP Student Success at the College LevelKEY RESEARCH

CO L L E G E BOA RD .O RG /A P H I G H E R E D
2
ARTSArt HistoryMusic TheoryStudio Art: 2-D DesignStudio Art: 3-D DesignStudio Art: Drawing
AP CAPSTONE™
ResearchSeminar
ENGLISHEnglish Language and CompositionEnglish Literature and Composition
HISTORY AND SOCIAL SCIENCE Comparative Government and PoliticsEuropean HistoryHuman GeographyMacroeconomics MicroeconomicsPsychologyUnited States Government and PoliticsUnited States HistoryWorld History
STEMBiologyCalculus ABCalculus BCComputer Science AComputer Science PrinciplesChemistryEnvironmental SciencePhysics 1Physics 2 Physics C: Electricity and MagnetismPhysics C: MechanicsStatistics
WORLD LANGUAGES AND CULTURES Chinese Language and CultureFrench Language and CultureGerman Language and CultureItalian Language and CultureJapanese Language and CultureLatinSpanish Language and CultureSpanish Literature and Culture
AP Courses and Exams

A P S T U D E N T S U C C E S S AT T H E C O L L E G E L E V E L
AP® programs in high schools, coupled with evidence-based AP policies at colleges and universities, support positive outcomes for students.
Multiple studies confirm that students who earn a 3 or higher on an AP Exam:
Perform well in subsequent college courses in the discipline
Are more likely to major in their AP subject or a related discipline, particularly in STEM subjects
Take more—not less—college coursework in the discipline
Are more likely to graduate within four years
Find opportunities that lead to success (especially true of underrepresented students)
RESEARCH FINDINGS
AP student success at the college level
3

CO L L E G E BOA RD .O RG /A P H I G H E R E D
4
1. Morgan, R., & Klaric, J., (2007). AP Students in College: An Analysis of Five-Year Academic Careers. New York: The College Board.
Students who took an AP Exam perform well in subsequent college courses in the discipline.
KEY FINDINGA 2007 study1 revealed AP participation is related to positive outcomes for students earning a score of 3 or higher on an AP Exam. In most AP subjects, they performed the same as or better in the intermediate-level college course than students who took the college’s introductory course, controlling for prior achievement.
SAMPLE70,000 students at 27 institutions, followed for five years
OUTCOMES ANALYZEDIntermediate course GPA, college majors
CONTROL VARIABLES SAT® scores
FULL REPORTbit.ly/WnOQBn
0.0
0.5
1.0
1.5
2.0
2.5
3.0
3.5
4.0
Biology Calculus AB Chemistry EnglishLanguage
and Literature
Psychology SpanishLanguage
U.S. Governmentand Politics
U.S. History
2.8 2.83 2.
97 3.23
2.88
2.8 2.
91 2.99 3.04 3.
26 3.32
3.63
2.43 2.
64 2.78
3.15
2.9 3.
012.
993.
53
2.76 2.84 2.
98 3.02
2.87 3.
04 3.3 3.
44
3.11 3.
23 3.26
3.87
Intro course (Non-AP) AP score – 3 AP score – 4 AP score – 5 Adapted from Morgan and Klaric, 2007
FIGURE 1GPA in the subsequent college course, by performance

A P S T U D E N T S U C C E S S AT T H E C O L L E G E L E V E L
5
2. Mattern, K. D., Shaw, E. J., and Ewing, M. (2011). Is AP Exam Participation and Performance Related to Choice of College Major? New York: The College Board.
Students who took an AP Exam are more likely to major in their AP subject or a related discipline, particularly in STEM subjects.
KEY FINDINGA 2011 study2 revealed that the likelihood of majoring in a particular discipline increased with AP Exam taking in that discipline, the number of AP Exams taken in the discipline, and AP performance in the discipline. The effect was strongest for STEM majors. Also, students who took AP Exams were more likely to have declared a major than non-AP students. AP is a strong indicator of interest in a discipline, providing an opportunity for colleges to identify potential majors.
FIGURE 2Percentage of students majoring in a specific domain by AP participation
SAMPLE40,000 students at 39 colleges
OUTCOMES ANALYZEDCollege major
CONTROL VARIABLES SAT scores, demographic variables, highest parental education
FULL REPORTbit.ly/YWbtTg
Biological and Biomedical Sciences
Computer and Information Sciences
Foreign Languages, Literatures,and Linguistics
Mathematics, Statistics, Engineering, and Physical Sciences
Social Sciences
Humanities and Liberal Arts
Students who did not take an AP Exam Students who took an AP Exam in a related subject area
20.3%
Examined major at beginning of third year in college, not major upon graduation. Does not account for prior interest or motivation.
6.1%
1.9%
0% 5% 10% 15% 20% 25% 30%
17.9%
1.1%5.1%
13.0%15.1%
12.1%18.1%
9.6%29.1%
Adapted from Mattern, Shaw, and Ewing, 2011
CO L L E G E BOA RD .O RG /A P H I G H E R E D
6
Calculus BC
0
5
10
15
20
Biology Calculus AB Chemistry English Languageand Comp
English Lit and Comp
U.S. Governmentand Politics
SpanishLanguage
U.S. History
11.2
5
17.2
1
10.9
2
14.7
9.64
16.9
1
10.8
9 13.1
2
7.69 8.
74
7.41 8.
29
7.06
9.71
14.9
4
18.5
3
7.3 8.
46
5.54
8.73
Non-AP students AP students Adapted from Murphy and Dodd, 2009
Macro-economics
3. Murphy, D. and Dodd, B. (2009). A Comparison of College Performance of Matched AP and Non-AP Student Groups. New York: The College Board.
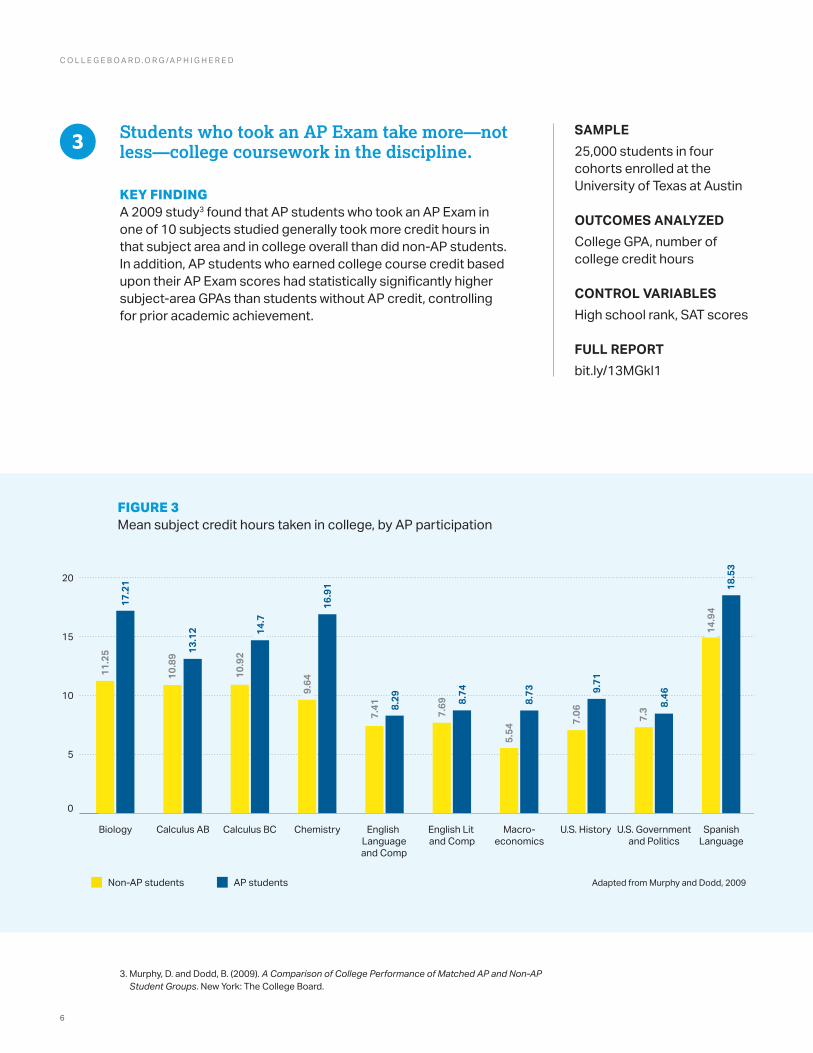
Students who took an AP Exam take more—not less—college coursework in the discipline.
KEY FINDINGA 2009 study3 found that AP students who took an AP Exam in one of 10 subjects studied generally took more credit hours in that subject area and in college overall than did non-AP students. In addition, AP students who earned college course credit based upon their AP Exam scores had statistically significantly higher subject-area GPAs than students without AP credit, controlling for prior academic achievement.
SAMPLE25,000 students in four cohorts enrolled at the University of Texas at Austin
OUTCOMES ANALYZEDCollege GPA, number of college credit hours
CONTROL VARIABLES High school rank, SAT scores
FULL REPORTbit.ly/13MGkl1
FIGURE 3Mean subject credit hours taken in college, by AP participation

A P S T U D E N T S U C C E S S AT T H E C O L L E G E L E V E L
7
0% 10% 20% 30% 40% 50% 60% 70% 80%
No AP
AP Exam
AP Score of 2
AP Score of 1
AP Score of 4
AP Score of 5
AP Score of 3
Underrepresented minority White or Asian Adapted from Mattern, Marini, and Shaw, 2013
45%
AP P
erfo
rman
ceAP
Par
ticip
atio
n
36%
54%45%
47%39%
53%45%
59%50%
64%56%
69%62%
Note: Expected graduation rates were computed based on Sample 1 models. These values are associated with non-first generation status females with an average PSAT/NMSQT score attending a public institution of average selectivity. Please see research report for all results.
4. Mattern, K. D., Marini, J. P., and Shaw, E. J., (2013) Are AP Students More Likely to Graduate on Time? New York: The College Board.
Students who took an AP Exam are more likely to graduate within four years.
KEY FINDINGA 2013 study4 found that students who took one or more AP Exams, regardless of what score was earned, were more likely to graduate from college in four years compared to non-AP students, controlling for prior academic achievement, demographic variables, and school-level variables. In addition, students who earned higher scores on AP Exams had a higher likelihood of graduating in four years compared with students who earned lower scores, controlling for relevant variables.
SAMPLESample 1: 112,000 students at 77 colleges and universities (2007 college freshmen)Sample 2: 678,000 students (2008 college freshmen who had taken AP, PSAT/NMSQT®, or SAT; matched to National Student Clearinghouse graduation data)
OUTCOMES ANALYZEDCollege graduation in four years
CONTROL VARIABLES College selectivity, college control (public or private), PSAT/NMSQT scores, gender, underrepresented minority status, first-generation college-going status
FULL REPORTbit.ly/1kT0JPu
FIGURE 4Expected four-year graduation rate by AP participation and performance

CO L L E G E BOA RD .O RG /A P H I G H E R E D
8
5. Dougherty, C., Mellor, L., and Jian, S. (2006). The Relationship Between Advanced Placement and College Graduation. National Center for Educational Accountability.
AP provides opportunities for underserved students to succeed.
KEY FINDINGA 2006 study5 found that, controlling for prior academic achievement, student-level variables, and school-level variables, traditionally underrepresented students who earned a score of 3 or higher on at least one AP Exam had a higher probability of graduating from college in five years or less than non-AP students of the same ethnicity/socioeconomic status.
FIGURE 5Increase in probability of college graduation within five years or less compared with students not participating in AP, by ethnicity and socioeconomic status
SAMPLE67,000 students at Texas public colleges and universities
OUTCOMES ANALYZEDCollege graduation in four years
CONTROL VARIABLES Eighth-grade math test scores, school-level characteristics
FULL REPORTbit.ly/VRyzFK
Black/African American
Hispanic/Latino
White
Non-Low Income
Low Income
0% 5% 10% 15% 20% 25% 30% 35%
Adapted from Dougherty, Mellor, and Jian, 2006
+34%
+26%
+33%
+28%
+28%

A P S T U D E N T S U C C E S S AT T H E C O L L E G E L E V E L
9
The following resources are available from the College Board and can be requested at collegeboard.org/aphighered.
1. AP course and exam descriptions or curriculum frameworks: These documents contain information important to developing a credit and placement policy, including the learning objectives for AP courses and exams; how AP Exams are scored; considerations on using and interpreting scores; and sample performance tasks, exams, and items.
2. Released AP Exams: Because they are considered to be secure material, these may be obtained only by contacting a College Board representative at [email protected].
3. Current research on student outcomes: Research includes both independent studies led by institutions across the country and College Board–sponsored research. Several of these research studies focus on placement validity, evaluating the success of AP students as they place into subsequent courses related to their AP Exam scores.
4. Summary of AP Scores Reported for your college: You can order this report, which includes participation and performance data for the AP students who sent scores to your college or university.
5. National references: American Council on Education issues credit and placement recommendations and the recommendations of national academic associations.
6. Placement validity studies and data services: The College Board offers a free service—the Admitted Class Evaluation Service™ (ACES™)—to help facilitate a review of AP performance in subsequent courses. Visit collegeboard.org/aces for more information. The College Board also regularly works with institutional researchers at colleges to develop and implement local, customized validity studies. To learn more, contact [email protected].
Essential AP Resources

CO L L E G E BOA RD .O RG /A P H I G H E R E D
10
College Subject PerformanceSadler, P. M., & Sonnert, G. (2010). High school Advanced Placement and success in college in the sciences. In P. M. Sadler, G. Sonnert, R. H. Tai, & K. Klopfenstein (Eds.), AP: A Critical Examination of the Advanced Placement Program (pp. 119–137). Cambridge, MA: Harvard Education Press.Key finding: AP students perform at least as well as similar non-AP students in introductory courses.
Overall PerformanceScott, T. P., Tolson, H., & Lee, Y., T. (2010). Assessment of Advanced Placement participation and university academic success in the first semester: Controlling for selected high school academic abilities. Journal of College Admission, 208, 26–30.Key finding: Students who received AP credit outperformed non-AP students on first-year GPA.
Geiser, S., & Santelices, V. (2004). The role of Advanced Placement and honors courses in college admissions. Center for Studies in Higher Education, University of California, Berkeley.Key finding: AP Exam scores are among the very best predictors of college performance.
Mattern, Shaw, and Xiong, 2009Key finding: The odds of returning for a second year of college are greater for AP Exam takers who scored a 3 or higher compared to non-AP students, controlling for high school GPA and SAT scores.
Additional Research on AP Outcomes

A P S T U D E N T S U C C E S S AT T H E C O L L E G E L E V E L
11
College CompletionDougherty, C, Mellor, L, & Jian, S. (2006). The relationship between Advanced Placement and college graduation. National Center for Educational Accountability.Key finding: Students who earn a 3 or higher on one or more AP Exams are more likely to graduate from college in five years or less even when controlling for prior academic achievement, demographic variables, and school-level variables.
Tai, R. H., Liu, C. Q., Almarode, J. T., & Fan, X. (2010). Advanced Placement course enrollment and long-range educational outcomes. In P. M. Sadler, G. Sonnert, R. H. Tai, & K. Klopfenstein (Eds.), AP: A Critical Examination of the Advanced Placement Program (pp. 109–137). Cambridge, MA: Harvard Education Press.Key finding: AP participants are more likely to graduate from college than nonparticipants.
Hargrove, Godin, and Dodd, 2008Key finding: AP Exam takers who scored a 3 or higher earned higher first- and fourth-year college GPAs than non-AP students and had higher four-year graduation rates, controlling for prior academic achievement.
MajorsTai, R. H., Liu, C. Q., Almarode, J. T., & Fan, X. (2010). Advanced Placement course enrollment and long-range educational outcomes. In P. M. Sadler, G. Sonnert, R. H. Tai, & K. Klopfenstein (Eds.), AP: A Critical Examination of the Advanced Placement Program (pp. 109–137). Cambridge, MA: Harvard Education Press.Key finding: AP participants are more likely to major in a related discipline than nonparticipants, particularly in STEM subjects.
Ackerman, P. L., Kanfer, R., & Calderwood, C. (2011). Optimal AP Portfolios with Special Reference to Science, Technology, Engineering, and Math (STEM) Majors and Gender Differences. Key finding: AP participants are more likely to major in a related discipline than nonparticipants.

© 2016 The College Board. College Board, Advanced Placement Program, AP, SAT, and the acorn logo are registered trademarks of the College Board. AP Capstone, ACES, and Admitted Class Evaluation Service are trademarks owned by the College Board. PSAT/NMSQT is a registered trademark of the College Board and National Merit Corporation. All other marks are the property of their respective owners. Visit the College Board on the web: collegeboard.org. 00551-019 160851179
About APThe College Board’s Advanced Placement Program® (AP®) enables willing and academically prepared students to pursue college-level studies—with the opportunity to earn college credit, advanced placement, or both—while still in high school.
For further information, visit collegeboard.org/aphighered or contact [email protected].
About the College BoardThe College Board is a mission-driven not-for-profit organization that connects students to college success and opportunity. Founded in 1900, the College Board was created to expand access to higher education. Today, the membership association is made up of more than 6,000 of the world’s leading educational institutions and is dedicated to promoting excellence and equity in education. Each year, the College Board helps more than seven million students prepare for a successful transition to college through programs and services in college readiness and college success—including the SAT® and the Advanced Placement Program®. The organization also serves the education community through research and advocacy on behalf of students, educators, and schools.
For further information, visit collegeboard.org.