ap stats exploring data and planning a study...
TRANSCRIPT
AP Stats
Exploring Data and Planning a Study HW
Circle the correct answer.
1. If the largest value of a data set is doubled, which of the following is not true? A. The mean increases B. The standard deviation increases
C. The interquartile range increases D. The range increases
E. The median remains unchanged
2. If the test scores of a class of 30 students have a mean of 75.6 and the test scores of another class of 24
students have a mean of 68.4, then the mean of the combined group is
A. 72 B. 72.4 C. 72.8
D. 74.2 E. None of these
3. Who makes more mistakes on their income tax forms: accountants or taxpayers who prepare the forms
themselves? A random sample of income tax forms that were prepared by accountants was drawn from IRS
records. An equal number of forms that were self-prepared by taxpayers were also drawn. The average number of
errors per form was compared to determine if one group tends to make more mistakes than the other. What type
of study is this?
A. Census B. Experiment
C. Voluntary Response Survey D. Observational Study
E. Matched-Pair Study
4. The baggage handling services of On-Time Airlines is interested in how many baggage handlers they need on duty
at various time of the day to ensure that passengers do not wait an unreasonable amount of time for their baggage.
An airport executive performed a study and found that there is a correlation between the number of passengers
arriving at given times and the number of baggage handlers needed. She sampled various times during the day and
different days of the week including weekend. She recorded the number of passengers arriving within any 1-hour
time block. The computer output from the regression equation analysis is shown below.
Predicted Baggage Handlers = 2.86 + 0.00408 (number of passengers)
Predictor Coef StDev T P
Constant 2.860 1.324 2.16 0.083
Passengers 0.004081 0.001168 3.49 0.017
S = 1.562 R-sq = 70.9% R-sq (adj) = 65.1%
What is the value of the correlation coefficient for the number of baggage handlers and number of arriving
passengers?
A. -0.842 B. 0.651 C. 0.709 D. 0.842 E. 1.562
5. The student council wants to survey students at the school to see what brands of soda pop they want in the school
machines. They randomly sampled 30 freshmen, 30 sophomores, 30 juniors, and 30 seniors. The sampling method
they used is a
A. Simple Random Sample B. Stratified Random Sample
C. Cluster Sample D. Systematic Random Sample
E. Convenience Sample
6. Some AP Statistics students were interested in finding out if there was a relationship between the number of
hours of study for a chapter test and the score on that test. On the basis of the number of hours their
classmates studied for the Chapter 3 test and the scores on the test (out of 100), the least-squares regression
line calculated was �� = 72.53 + 5.88�, where x is the number of hours studied and �� is the predicted score on the
test. Which statement correctly interprets the meaning of the slope of this regression line?
A. For each additional hour studied, the predicted score on the test increases by approximately 73%.
B. For each additional hour studied, the predicted score on the test increases by approximately 6%.
C. For each additional percent of increase on the test, the predicted score on the test increases approximately
73%.
D. For each additional percent of increase on the test, the predicted score on the test increases approximately
6%.
E. We cannot use this regression equation, since cause-effect has not been proven.
7. A baseball coach wants to compare the number of hits by two groups of batters each using a different type of bat.
Which type of graphical display would NOT be appropriate?
A. Parallel Boxplots B. Dotplots drawn on the same scale
C. Back-to-Back Stemplots D. Histograms drawn on the same scale
E. Scatterplot
8. A distribution of scores has a mean of 60 and a standard deviation of 18. If each score is doubled, and then 5 is
subtracted from the result, what will be the mean and standard deviation of the new scores?
A. Mean = 115, Standard Deviation = 31 B. Mean = 115, Standard Deviation = 36
C. Mean = 120, Standard Deviation = 6 D. Mean = 120, Standard Deviation = 31
E. Mean = 120, Standard Deviation = 36
9. A new medication has been developed to cure a certain disease. The disease progresses in three stages, stages I,
II, and III, each progressively worse than the one before it. Ninety volunteers are gathered to test the new
medication, 30 in each of the three stages of the disease. The mediation will be administered to subjects daily in
one of three dosages: 100 mg for each subject in stage I of the disease, 200 mg to each subject in stage II, and
400 mg to each subject in stage III. After 8 weeks, the proportion of subjects cured of the disease will be
recorded. Why is this NOT a good experimental design?
I. Because experiments of this type should only use one dosage level of medication.
II. Because disease stage is potentially confounded with dosage level.
III. Because the experiment lacks a control group.
A. I only B. II only C. I and II only
D. II and III only
E. I, II, and III
10. The traffic safety officer of a local police force was trying to see if there was an association between the number
of cars that did not use a main intersection in town because the traffic light and the number of tickets written for
speeding on the alternate route. The correlation between these two variables was found to be 0.58. Which of the
following statements is true?
A. About 58% of the variation in the number of speeding tickets can be explained by the linear relationship
between the number of speeding tickets issues and the number of cars that did not use the main intersection
in town.
B. Any potential linear relationship between the number of cars not using the main intersection in town and the
number of speeding tickets written on an alternate route would be positive.
C. If one uses the main intersection through town, one is 58% more likely to receive a ticket tan using the
alternate route.
D. Since the correlation is not close to 1, there cannot be a linear relationship between the number of cars not
using the main intersection in town and the number of speeding tickets written on an alternate route.
E. Getting a speeding ticket is a direct cause of taking the alternate route.
11. A major automobile manufacturer is trying to improve its customer service at its dealerships across the United
States. A survey of 200 customers in Arizona who recently purchased a vehicle from this manufacturer were
asked if they were satisfied with the customer service at the dealership. Is it reasonable to generalize the
conclusion to the population of all customers in the United States that purchased from this manufacturer?
A. No, because customers were only sampled in one state.
B. No, because 200 is not a large enough sample.
C. No, because only one sample was taken.
D. Yes, because the sample size is more than 30.
E. Yes, because the population of all new vehicles owners by this manufacturer is more than 2,000.
12. A politician is considering running for public office. He wants to measure his name recognition by doing a survey of
voters in his district. Which of the following survey methods would produce unbiased results?
A. The politician stands in front of a grocery store in his district on Saturday morning and asking each person
entering the store if he or she recognizes the politician’s name.
B. Placing pollsters in front of every grocery store in his district on Saturday morning and asking each person
entering the store if he or she recognizes the politician’s name.
C. Sending a survey card to all registered voters in the district asking them to call a phone number to state
whether or not they recognize the politician’s name.
D. Calling people from his district listed in the phone book and asking each if he or she recognizes the politician’s
name.
E. None of these would produce unbiased results.
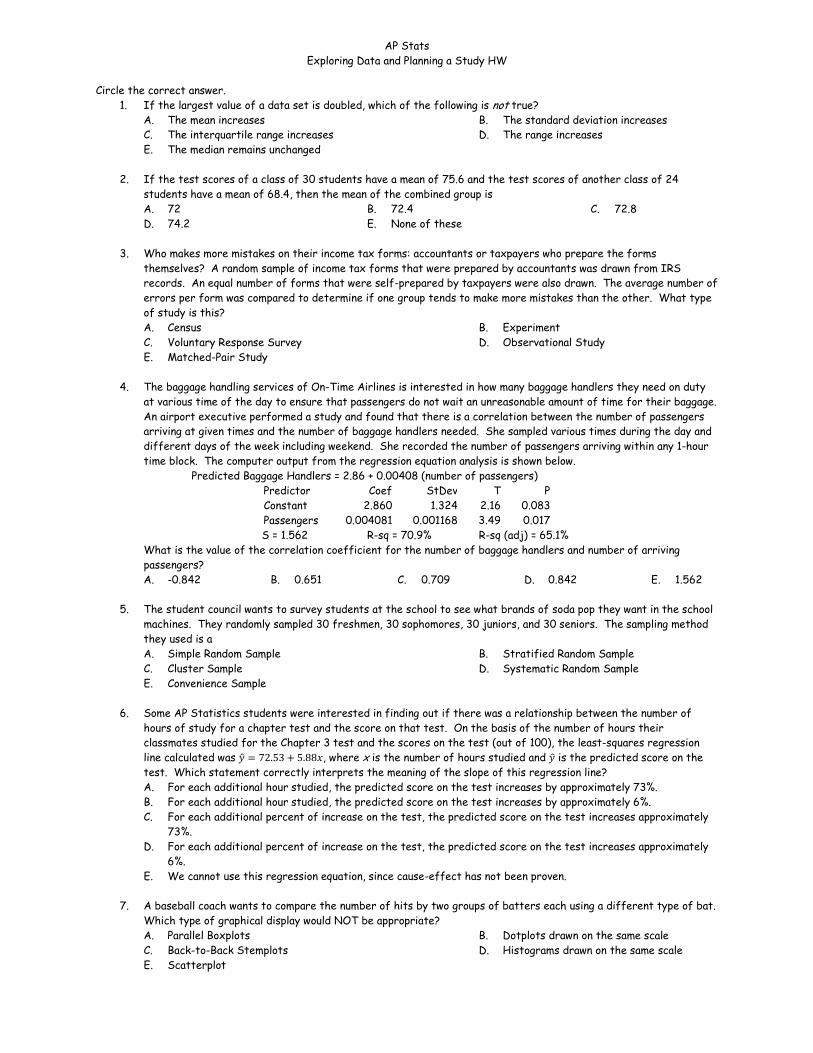
13. A garage door manufacturer has developed a new type of door for houses in the Southeast part of the United
States. Doors in this area of the country are particularly susceptible to damage from salty ocean spray and the
sun’s rays, which tend to shine mainly on o the north side of the house. An experiment will test the new type of
garage door against the existing type of door on eight houses in a particular residential area. An overhead view of
the area is shown below. The location of the garage door on each home is marked with an “X”.
Which of the following blocking schemes is most appropriate to account for variables in this study other than the
type of door?
A. Form the houses into two blocks: {1, 2, 3, 4} and {5, 6, 7, 8}.
B. Form the houses into two blocks: {1, 3, 5, 7} and {2, 4, 6, 8}.
C. Form the houses into four blocks: {1, 5}, {2, 6}, {3, 7}, and {4, 8}.
D. Form the houses into four blocks: {1, 3}, {2, 4}, {5, 7}, and {6, 8}.
E. No blocking is necessary in this experiment.
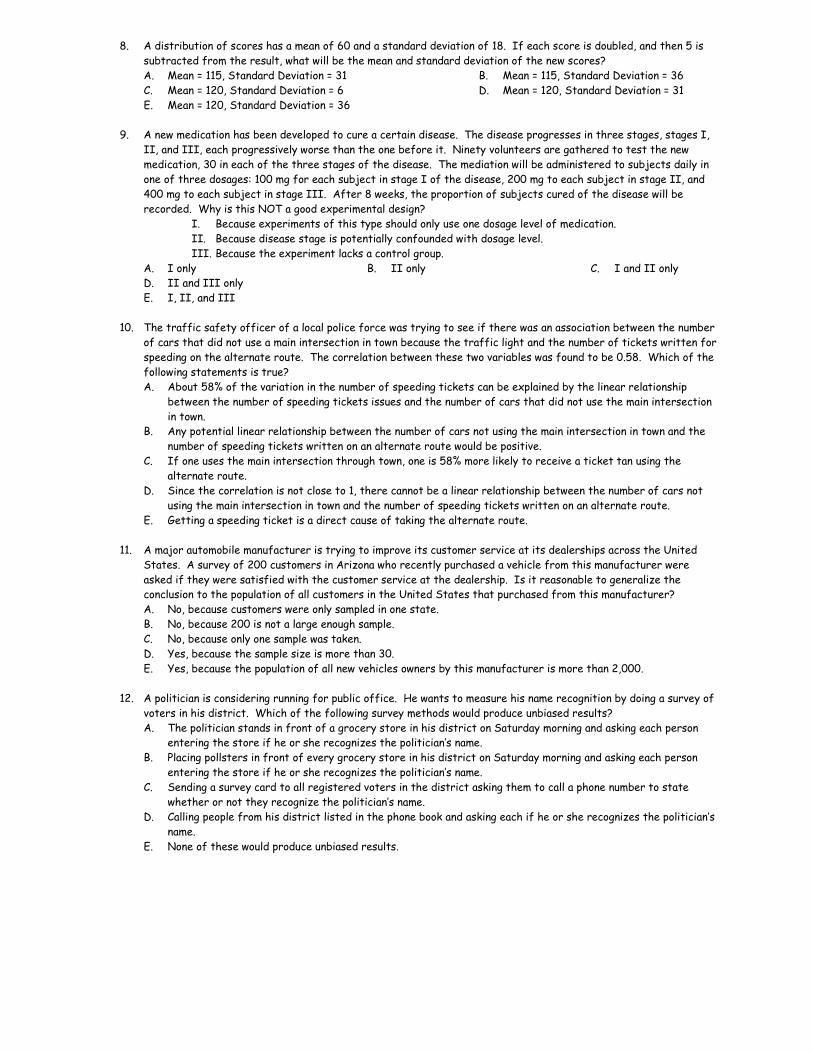
14. What is the approximate residual of the data point “A” on the scatterplot with the least square regression line
shown below?
A. 11 B. 29 C. 39 D. 58 E. 68

15. The distribution of the population by age in a particular country is represented by the given cumulative relative
frequency plot.
Which of the following statements about the population is true?
A. The median age is about 46 years.
B. The interquartile range of ages is about 27 ages.
C. The mean age is greater than the median age.
D. There are more people younger than 65 years of age than those older than 30 years of age.
E. Seventy-five percent of people are older than 50 years of age.
16. A statistics class randomly surveyed 200 boys and 200 girls at their school and asked each respondent how many
movies they saw in theaters over summer break. The results are shown in the frequency table below. (Example: 15
boys saw no movies.)
Number of Movies Frequency of Boys Frequency of Girls
0 15 6
1 31 8
2 32 15
3 37 18
4 20 23
5 18 30
6 17 37
7 13 30
8 11 23
9 3 8
10 3 2
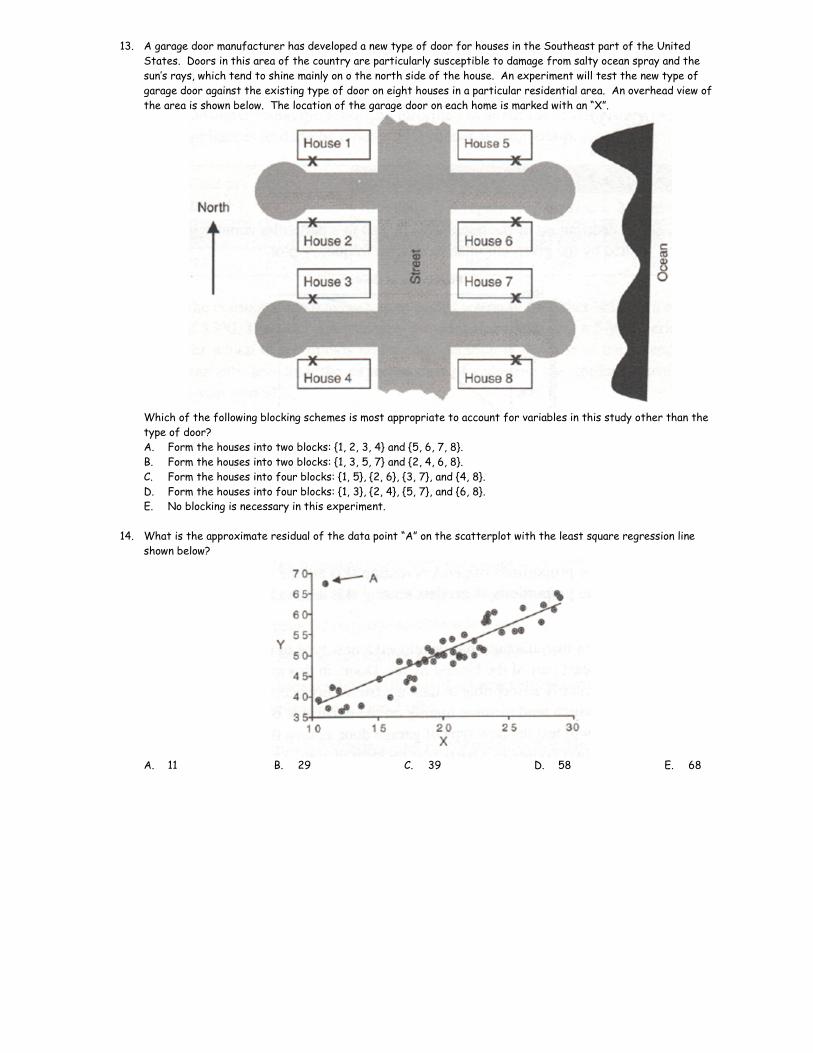
Which of the following graphs is appropriate to compare the number of movies seen by boys and girls over summer
break?
A.
B.
C.
D.
E.
Free Response Questions
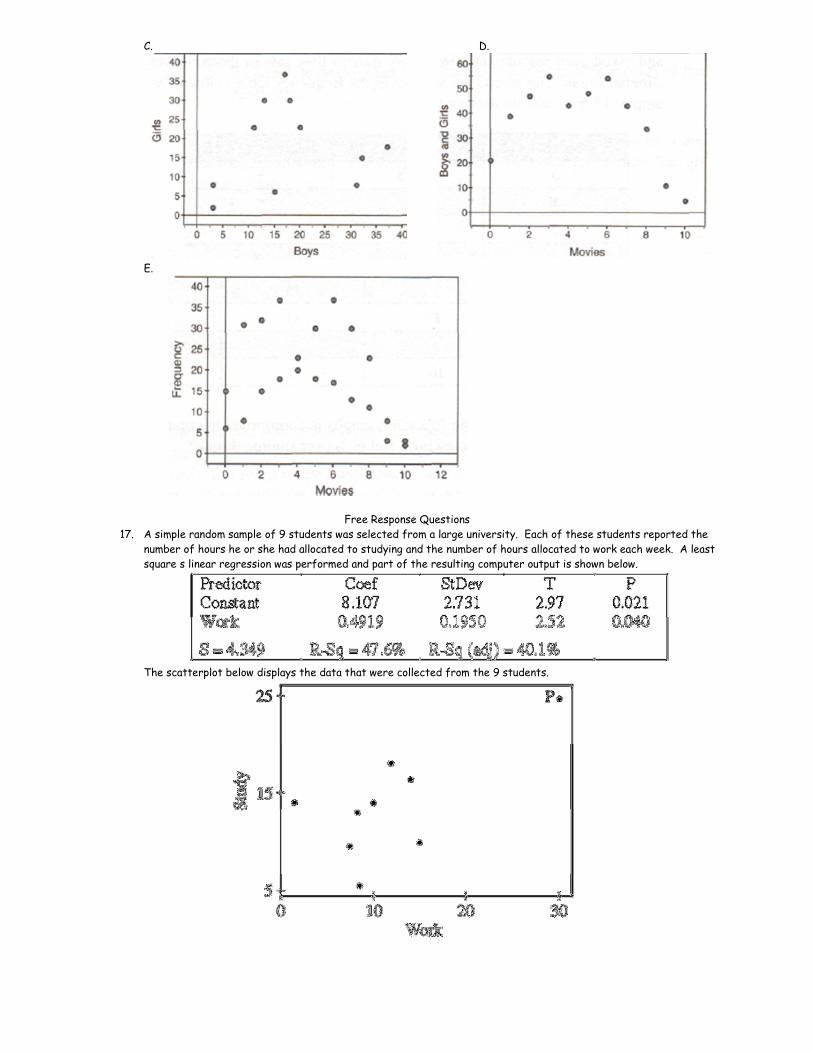
17. A simple random sample of 9 students was selected from a large university. Each of these students reported the
number of hours he or she had allocated to studying and the number of hours allocated to work each week. A least
square s linear regression was performed and part of the resulting computer output is shown below.
The scatterplot below displays the data that were collected from the 9 students.
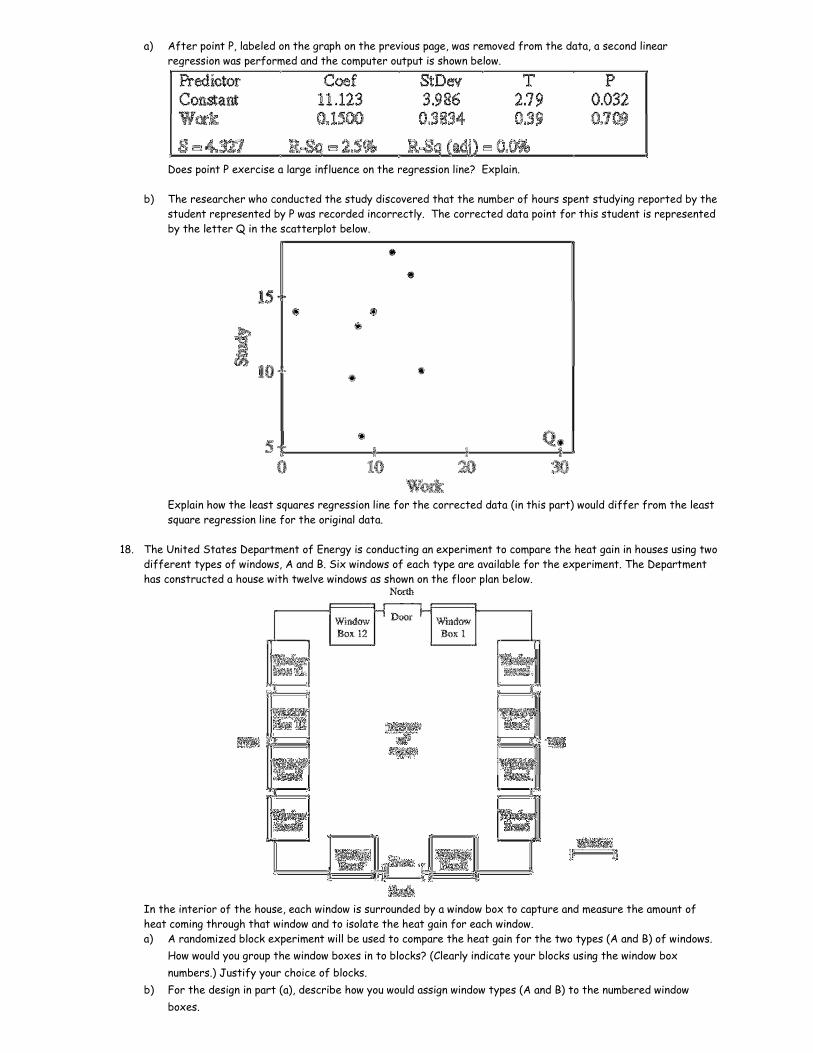
a) After point P, labeled on the graph on the previous page, was removed from the data, a second linear
regression was performed and the computer output is shown below.
Does point P exercise a large influence on the regression line? Explain.
b) The researcher who conducted the study discovered that the number of hours spent studying reported by the
student represented by P was recorded incorrectly. The corrected data point for this student is represented
by the letter Q in the scatterplot below.
Explain how the least squares regression line for the corrected data (in this part) would differ from the least
square regression line for the original data.
18. The United States Department of Energy is conducting an experiment to compare the heat gain in houses using two
different types of windows, A and B. Six windows of each type are available for the experiment. The Department
has constructed a house with twelve windows as shown on the floor plan below.
In the interior of the house, each window is surrounded by a window box to capture and measure the amount of
heat coming through that window and to isolate the heat gain for each window.
a) A randomized block experiment will be used to compare the heat gain for the two types (A and B) of windows.
How would you group the window boxes in to blocks? (Clearly indicate your blocks using the window box
numbers.) Justify your choice of blocks.
b) For the design in part (a), describe how you would assign window types (A and B) to the numbered window
boxes.