ap capstone™ participation, high school learning, and college … · 2020-05-28 · executive...
TRANSCRIPT

AP Capstone ™ Participation, High School Learning, and College Outcomes: Early Evidence
Sanja Jagesic
Maureen Ewing
Jing Feng
Jeff Wyatt
1
Executive Summary
The AP Capstone Diploma ™
program was launched in 2014 to offer high school students an
opportunity to learn interdisciplinary critical thinking and collaboration skills and complete
college-level academic research by means of two Advanced Placement®
(AP®) courses: AP
Seminar and AP Research. Students earning AP Exam scores of 3 or higher in AP Seminar
and AP Research, collectively known as the AP Capstone ™
courses, and in four additional AP
subjects, receive the AP Capstone Diploma. It should be noted at the onset that AP Seminar
and AP Research Certificate ™
, awarded for a 3 or higher in the Capstone courses but not in
four additional AP courses, is not within the scope of this current study. This study deals
solely with outcomes of students who participated in AP Seminar, AP Research, or earned the
AP Capstone Diploma.
AP Seminar and AP Research are different from traditional AP courses in that students
determine which content to explore and are assessed on their ability to apply critical thinking,
research, and collaboration skills. In these early years of the AP Capstone program, students
and teachers have reached out to report that skills learned in AP Capstone courses help
students succeed in other AP courses as well as help prepare them for college. This feedback
from students and teachers was a catalyst for this study, which is an opportunity for us to
understand specific relationships between AP Capstone participation and student secondary
and postsecondary educational outcomes.
The findings summarized in this report indicate that after taking into account student
background and prior achievement, students who take AP Seminar, or both AP Capstone
courses, have higher scores on concurrent and future AP Exams in the English, history,
politics, and—in some cases, social sciences and sciences—subject areas. The effect sizes
are greatest for students scoring a 3 or higher on the AP Seminar or AP Research cumulative
AP Exam. For the most part, AP Seminar and AP Research participation does not have a
statistically significant relationship with concurrent or future performance in math and
computer science AP Exams.
We also find that students taking an AP Seminar Exam or students earning an AP Capstone
Diploma have significantly higher first-year college grades, first-to-second year college
retention, and probability of participating in academic research, internships, and honors
programs in the first year of college than similar students who did not take any AP Exams in
high school. Additionally, taking AP Seminar or earning the AP Capstone Diploma provides a
larger boost than comparable content-specific AP exposure with respect to internship, honors
program, and research participation. This finding indicates that the specific skills taught in the
AP Capstone program help students engage in college learning opportunities that lead to
positive college and career outcomes down the line.
The AP Capstone Diploma program is a relatively new offering from College Board at the time
of this publication. These early findings may help implementing schools determine how best to
position AP Seminar and AP Research in course schedules to maximize student outcomes.
2
Table of Contents
Background...............................................................................................................6
Features of AP Seminar and AP Research.............................................................6
Research Questions.................................................................................................7
High School Outcomes .............................................................................................. 7
College Outcomes ..................................................................................................... 8
Data............................................................................................................................9
High School Outcomes .............................................................................................. 9
College Outcomes ................................................................................................... 10
Measures .................................................................................................................12
Control Variables Used in All Analyses.................................................................... 12
Control Variables Used in High School Analyses Only ............................................ 13
Control Variables Used in College Analyses Only ................................................... 13
Outcome Variables .................................................................................................. 14
Analyses..................................................................................................................15
Analysis 1 Results: Relationship Between AP Seminar/AP Research
Participation and Concurrent and Future AP Exam Performance......................16
Results for AP Seminar ........................................................................................... 16
Results for AP Research ......................................................................................... 21
Analysis 2 Results: Relationship Between AP Seminar, AP Capstone Diploma,
and College Outcomes...........................................................................................25
Summary .................................................................................................................29
Bibliography/References .......................................................................................31
Appendix: Sensitivity Analyses ............................................................................33
About College Board ..............................................................................................36
3

List of Tables
Table 1: Student Sample Descriptive Characteristics, by Grade of AP Seminar/AP Research Participation
for High School Samples 10 ………………………….………………………………………………………………
Table 2: Student Sample Descriptive Characteristics, by AP Seminar Participation for College
Samples 11 ……………………………………………………………………………………………………………
Table 3: AP Exam Groupings for AP Exam Performance Outcome 14 …………………….………………….....
Table 4: AP Seminar and Performance on Concurrent AP Exams 20 ………………………………….………..
Table 5: AP Seminar and Performance on Future AP Exams 21 ……………………………………..…………
Table 6: AP Research and Performance on Concurrent AP Exams 24 ……………….…………….……….…
Table 7: AP Research and Performance on Future AP Exams 25 ……….………………………….…...….….
Table A1. AP Seminar Participation and AP Exam Performance Using Matching Methodology, Seminar
11th Grade, AP English 11th Grade 33 ……………………………………………………………………..………
Table A2. AP Seminar Participation and AP Exam Performance Using Matching Methodology, Seminar
11th Grade, AP History 12th Grade 34 ……………………………………………………………………...………
Table A3. AP Seminar Participation and AP Exam Performance Using Matching Methodology, Seminar
11th Grade, AP Math 11th Grade 35 …………………………………………………………………...……………
4

List of Figures
Figure 1: AP Seminar and Performance on Concurrent AP Exams 18 …………………….……………………
Figure 2: AP Seminar and Performance on Future AP Exams 19 …………………………………………….…
Figure 3: AP Research and Performance on Concurrent AP Exams 23 ……………………………….……….
Figure 4: AP Research and Performance on Future AP Exams 23 ………………………………………….….
Figure 5: AP Seminar Participation, AP Capstone Diploma Earning, and First-Year College Grades 26 ……...
Figure 6: AP Seminar Participation, AP Capstone Diploma Earning, and Retention to the Second Year 27 ….
Figure 7: AP Seminar Participation, AP Capstone Diploma Earning, and Internship Participation 27 …………
Figure 8: AP Seminar Participation, AP Capstone Diploma Earning, and Academic Research
Participation 28 …………………………………………………………………………………………………...
Figure 9: AP Seminar Participation, AP Capstone Diploma Earning, and Honors Program
Participation 29 ………………………………………………………………………………………….…………
5

Background There is an extensive literature base around the relationship between AP participation, AP
performance, and student outcomes. Studies tracking the performance of AP students in
college find AP students are more likely to persist to the second year of college (Mattern,
Shaw, & Xiong, 2009), earn higher course grades (Kaliski & Godfrey, 2014; Mattern, Shaw,
& Xiong, 2009; Patterson, Packman, & Kobrin, 2011; Wyatt, Patterson, & Di Giacomo, 2015)
and ultimately earn college degrees (Mattern, Marini, & Shaw, 2013) than similar students
who do not take AP Exams in high school. Research aiming to understand the casual effect
of AP credit policies on student outcomes finds that earning credit-granting AP scores
increases the probability of on-time degree attainment in four years or less (Smith, Hurwitz,
& Avery, 2017). In addition to a positive relationship with college grades, persistence, and
graduation, there is evidence that taking AP Exams in high school helps students use their
college years more productively. For instance, research shows AP students take more
advanced lab science and math courses and are more likely to double major, compared to
similar students who did not take AP Exams (Ewing, Jagesic, Wyatt, 2018; Evans, 2018).
In an effort to continuously advance and improve offerings of the AP Program, College
Board launched the AP Capstone Diploma program in 2014. AP Capstone offers high
school students an opportunity to learn and develop college-level academic research skills
through two interdisciplinary courses: AP Seminar and AP Research. AP Seminar and AP
Research are different from traditional AP courses in that they focus on developing cross-
curricular skills rather than acquiring subject-specific content knowledge. AP Seminar and
AP Research students determine which content to explore and are assessed on their ability
to apply critical thinking, research, and collaboration skills. AP assessments in both courses
are project-based and differentiated from traditional AP subject exams. Because AP
Seminar and AP Research are substantially different from other AP courses, schools must
apply and be approved to offer the AP Capstone Diploma program.
Features of AP Seminar and AP Research AP Seminar aims to equip students with the skills to analyze and evaluate information with
accuracy and precision so they can develop the ability to craft and communicate compelling
evidence-based arguments. Using an inquiry framework, students practice reading and
analyzing articles, research studies, and foundational literary and philosophical texts;
listening to and viewing speeches, broadcasts, and personal accounts; and experiencing
artistic works and performances. Throughout their AP Seminar course, students learn to
synthesize information from multiple sources and develop their own perspectives based on
those sources while also learning to share those perspectives in research-based written
essays and oral and visual presentations. An important component of the AP Seminar
experience is that students work on assignments both individually and as part of a team.
The teamwork component further develops students’ ability to evaluate other viewpoints and
communicate with a varied audience.
6

AP Research is a follow-up course to AP Seminar that allows students to continue honing
skills acquired through AP Seminar in greater depth. For the duration of their AP Research
experience, students design, plan, and conduct a yearlong research-based investigation
addressing a research question on a topic of their choosing. In doing so, students deepen
the skills acquired in AP Seminar by understanding research methodology, employing
ethical research practices, and accessing, analyzing, and synthesizing information as they
address a research question.
AP Seminar and AP Research are project-based courses with project-based assessments.
The assessment structure for AP Seminar involves two through-course performance tasks
and one end-of-course exam. The first performance task includes a team presentation and
an individual research report and represents 20% of the AP Seminar Exam score. The
second performance task includes an individual written argument, multimedia presentation,
or oral defense, and determines 35% of the AP Seminar Exam score. The final assessment
piece is a two-hour exam in which students must demonstrate how well they understand the
reasoning and analysis that goes into an argument, as well as the ability to synthesize
information to develop an evidence-based argument themselves. The AP Research Exam
consists of an academic paper of 4,000 to 5,000 words, which counts for 75% of the exam
score and a presentation with an oral defense, which counts for 25% of the score.
AP Seminar is a prerequisite to AP Research. Both courses are required for students to
have successfully completed the AP Capstone program. Students who earn scores of 3 or
higher in both AP Seminar and AP Research and on four additional AP Exams of their
choosing receive the AP Capstone Diploma. Students who earn scores of 3 or higher in AP
Seminar and AP Research, but not on four additional AP Exams, receive the AP Seminar
and Research Certificate. AP Capstone lets students choose to participate to varying
extents. Some students only complete the AP Seminar course, while others complete both
AP Seminar and AP Research, as well as additional AP Exams, to earn the AP Capstone
Diploma. Because students engage in the AP Capstone program at different levels, we have
structured our research to understand the outcomes for students who elect to participate in
just the AP Seminar course as well as students who complete the entire program. The Data
section of this report provides a thorough description of comparison groups used.
Research Questions High School Outcomes
Qualitative accounts from AP Seminar and AP Research students and teachers suggest that
the skills taught in these two courses positively impact student performance in other content-
specific AP courses. To see if this observation from high school AP Seminar and AP
Research students and teachers is supported by student AP Exam performance, we asked
these research questions.
Taking into account student background, grade, prior achievement, prior AP experience,
and high school attended, do students who complete AP Seminar or both AP Seminar and
AP Research Exams earn higher AP Exam scores on:
7

(1) AP Exams completed in the same year as AP Seminar or AP Research, compared to
AP students who do not take AP Seminar or both AP Capstone courses?
(2) AP Exams completed in the year after AP Seminar or AP Research, compared to AP
students who do not take AP Seminar or both AP Capstone courses?
College Outcomes
To understand the relationship between AP Seminar participation, earning the AP Capstone
Diploma, and college outcomes, we examined two types of outcomes. We focused on
traditional college outcomes such as first-year grades and retention to the second year. We
also focused on college outcomes that provide an insight into the richness of the student’s
college experience, such as whether or not the student participated in internships, academic
research, or honors programs in the first year of college.
Because AP Seminar is a prerequisite to AP Research, the college outcomes analyses
focus on AP Seminar students (the entry point to AP Capstone) and AP Capstone Diploma
recipients (the finishing point of AP Capstone) to understand how partial and complete
experiences in the AP Capstone Diploma relate to college outcomes. We compared AP
Seminar participants and AP Capstone Diploma earners not only to similar groups of non-
AP students but also to similar groups of AP students with comparable levels of AP
exposure in content-specific AP Exams. We did this in an effort to understand if there is a
unique added benefit that students acquire when they participate in AP Seminar or complete
the AP Capstone Diploma program as opposed to other content-specific AP courses. These
are the research questions we asked.
Taking into account student background, prior achievement, and postsecondary institution
attended, do students who take AP Seminar or complete the requirements for the AP
Capstone Diploma:
(1) Earn higher first-year grades, have higher retention to the second year, and a higher
probability of participating in internships, academic research, and honors programs than
students who do not take any AP Exams?
(2) Earn higher first-year grades, have higher retention to the second year, and a higher
probability of participating in internships, academic research, and honors programs than
students who have a comparable level of content-specific AP exposure but have never
taken AP Seminar or AP Research?
8

Data High School Outcomes
Data for the high school outcome analyses come from the College Board database of
students who have participated in at least one of the College Board assessments—AP,
SAT®, and/or PSAT/NMSQT®. We limited the sample to students attending high schools
where AP Seminar or AP Research were offered (academic years 2014-15, 2015-16, and
2016-17 for AP Seminar; 2015-16 and 2016-17 for AP Research) to make sure that all the
students in our sample had the opportunity to participate in the courses. 1 In that way, we can
adequately compare students who did participate in AP Seminar or both AP Capstone
courses and students who did not. The sample descriptive characteristics of students for the
high school outcome analyses are provided in Table 1.
The descriptive statistics indicate that students who have taken AP Seminar or both AP
Capstone courses are more likely to be female, Asian or white, have parents who have
earned a college degree, and have on average higher academic preparation as measured
by PSAT/NMSQT scores and high school grades. While each high school outcome analysis
drew students from this sample, due to different outcomes requiring students to have
completed different AP Exams, the student sample in each analysis was a subset of the
larger data set described in Table 1. For the analyses focusing on the relationship between
AP Seminar/AP Research participation and concurrent and future AP Exam performance,
the students in both the AP Seminar/AP Research group and the No AP Seminar/No AP
Research group are students who have participated in the AP Exams that are of interest
(see Table 3). As such, both groups of students are AP students.
A majority of the AP Program’s research is designed to compare outcomes of students who have taken AP Exams in high school and outcomes of students who have not. The research
presented here is different in that it focuses on comparing outcomes for AP students who
have taken skills-based AP Exams (AP Seminar and AP Research) to students who have
taken content-based AP Exams (e.g., AP English Language and Composition). We hope
that this line of research may help schools that are implementing AP Capstone determine
how best to position AP Seminar and AP Research in course schedules to maximize student
performance.
1 It is important to note that we do not know the AP course enrollment policies at the schools included in the sample. As such,
we cannot identify specific students who did and who did not have access to the courses.
9
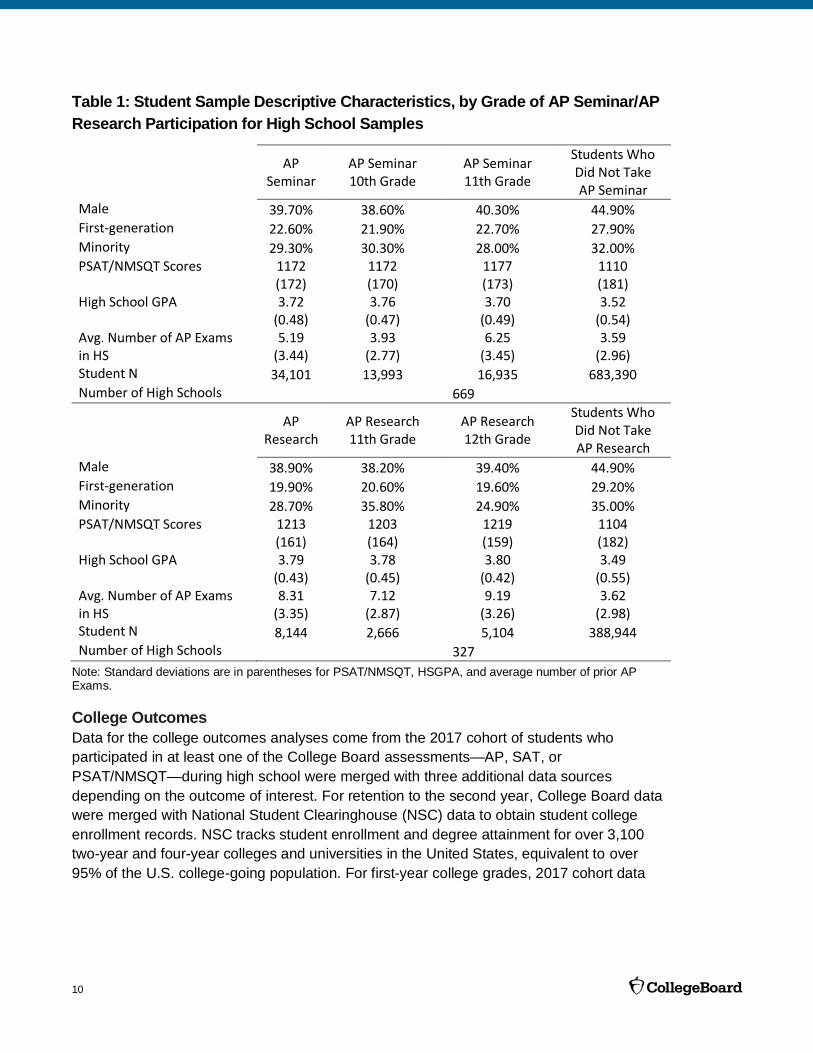
Table 1: Student Sample Descriptive Characteristics, by Grade of AP Seminar/AP
Research Participation for High School Samples
AP Seminar
AP Seminar 10th Grade
AP Seminar 11th Grade
Students Who Did Not Take AP Seminar
Male 39.70% 38.60% 40.30% 44.90% First-generation 22.60% 21.90% 22.70% 27.90% Minority 29.30% 30.30% 28.00% 32.00% PSAT/NMSQT Scores 1172 1172 1177 1110
(172) (170) (173) (181) High School GPA 3.72 3.76 3.70 3.52
(0.48) (0.47) (0.49) (0.54) Avg. Number of AP Exams in HS
5.19 3.93 6.25 3.59 (3.44) (2.77) (3.45) (2.96)
Student N 34,101 13,993 16,935 683,390 Number of High Schools 669
AP Research
AP Research 11th Grade
AP Research 12th Grade
Students Who Did Not Take AP Research
Male 38.90% 38.20% 39.40% 44.90% First-generation 19.90% 20.60% 19.60% 29.20% Minority 28.70% 35.80% 24.90% 35.00% PSAT/NMSQT Scores 1213 1203 1219 1104
(161) (164) (159) (182) High School GPA 3.79 3.78 3.80 3.49
(0.43) (0.45) (0.42) (0.55) Avg. Number of AP Exams in HS
8.31 7.12 9.19 3.62 (3.35) (2.87) (3.26) (2.98)
Student N 8,144 2,666 5,104 388,944 Number of High Schools 327
Note: Standard deviations are in parentheses for PSAT/NMSQT, HSGPA, and average number of prior AP Exams.
College Outcomes
Data for the college outcomes analyses come from the 2017 cohort of students who
participated in at least one of the College Board assessments—AP, SAT, or
PSAT/NMSQT—during high school were merged with three additional data sources
depending on the outcome of interest. For retention to the second year, College Board data
were merged with National Student Clearinghouse (NSC) data to obtain student college
enrollment records. NSC tracks student enrollment and degree attainment for over 3,100
two-year and four-year colleges and universities in the United States, equivalent to over
95% of the U.S. college-going population. For first-year college grades, 2017 cohort data
10
NSC Data
No AP
Validity Transcript Data
No AP
Student Survey Data
No AP
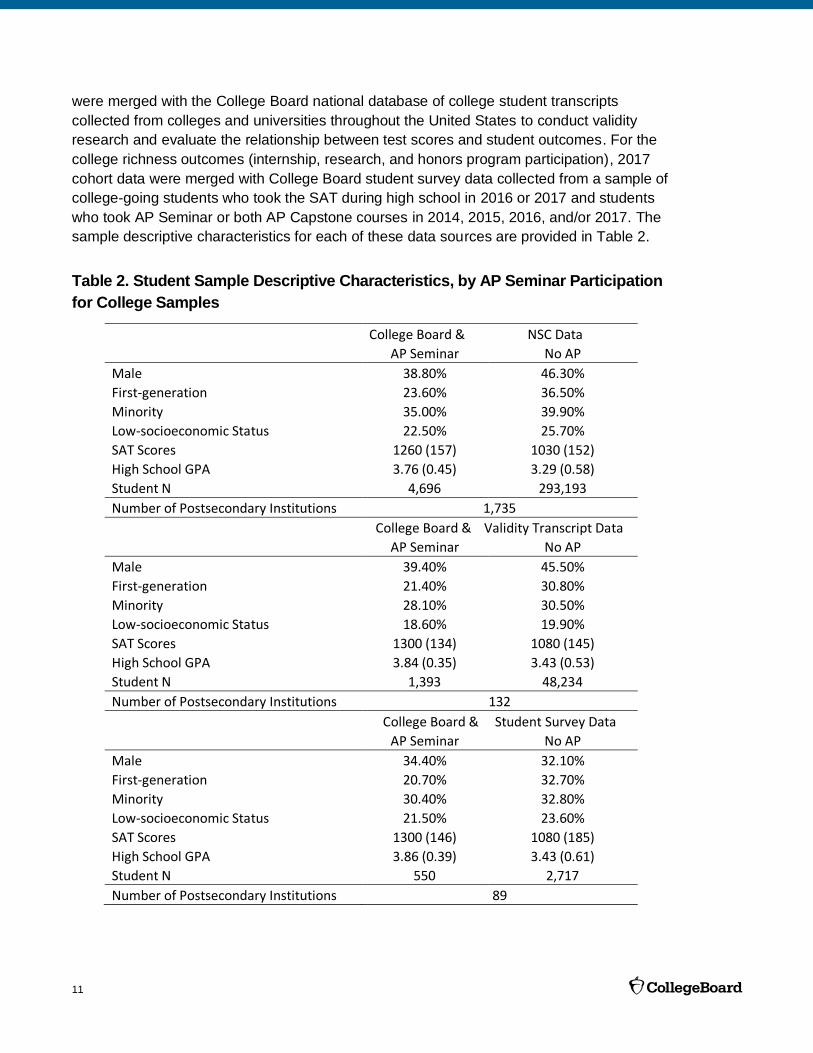
were merged with the College Board national database of college student transcripts
collected from colleges and universities throughout the United States to conduct validity
research and evaluate the relationship between test scores and student outcomes. For the
college richness outcomes (internship, research, and honors program participation), 2017
cohort data were merged with College Board student survey data collected from a sample of
college-going students who took the SAT during high school in 2016 or 2017 and students
who took AP Seminar or both AP Capstone courses in 2014, 2015, 2016, and/or 2017. The
sample descriptive characteristics for each of these data sources are provided in Table 2.
Table 2. Student Sample Descriptive Characteristics, by AP Seminar Participation
for College Samples
College Board &
AP Seminar
Male 38.80% 46.30%
First-generation 23.60% 36.50%
Minority 35.00% 39.90%
Low-socioeconomic Status 22.50% 25.70%
SAT Scores 1260 (157) 1030 (152)
High School GPA 3.76 (0.45) 3.29 (0.58)
Student N 4,696 293,193
Number of Postsecondary Institutions 1,735
College Board &
AP Seminar
Male 39.40% 45.50%
First-generation 21.40% 30.80%
Minority 28.10% 30.50%
Low-socioeconomic Status 18.60% 19.90%
SAT Scores 1300 (134) 1080 (145)
High School GPA 3.84 (0.35) 3.43 (0.53)
Student N 1,393 48,234
Number of Postsecondary Institutions 132
College Board &
AP Seminar
Male 34.40% 32.10%
First-generation 20.70% 32.70%
Minority 30.40% 32.80%
Low-socioeconomic Status 21.50% 23.60%
SAT Scores 1300 (146) 1080 (185)
High School GPA 3.86 (0.39) 3.43 (0.61)
Student N 550 2,717
Number of Postsecondary Institutions 89
11

Analyses focusing on AP Capstone Diploma recipients use a subset of AP Seminar students
who have scores of 3 or higher on AP Seminar, AP Research, and four additional AP
Exams. Descriptive statistics in Table 2 indicate that students who take AP Seminar in high
school are less likely to be male, minority, first-generation, and low-income than students
who did not take any AP Exams. AP Seminar students also, on average, have higher
academic achievement as measured by SAT scores and high school grades.
Measures Control Variables Used in All Analyses
High School GPA (HSGPA). Students are asked to report their HSGPA on the
PSAT/NMSQT and SAT questionnaires. The range of values available is 0.00 to 4.33.
Gender. Students were asked to report their gender when registering for the AP,
PSAT/NMSQT, or SAT exams. We use the most recently reported response. Students are
asked to select between “Male” and “Female.” The reference category is male students.
Race/Ethnicity. Students were asked to report their race/ethnicity when registering for the
AP, PSAT/NMSQT, or SAT exams. We use the most recently reported response. The final
variable was dichotomized into “non-minority,” which includes white and Asian students, and “minority,” which includes American Indian or Alaska Native; Black or African American;
Mexican or Mexican American; Puerto Rican; Other Hispanic, Latino or Latin American;
Native American; Pacific Islander; and Other. The reference category is nonminority
students.
First-generation Status. Students were asked to select their mother’s highest level of
education and their father’s highest level of education separately when registering for the AP, PSAT/NMSQT, or SAT exams. We use the most recently reported response. Students
select from the following options: grade school, some high school, high school diploma,
business school, some college, associate degree, bachelor’s degree, some graduate education, or graduate degree. The mother and father education variables were combined
to make one highest level of parental education variable. First-generation students were
defined as students whose parents’ combined highest education completed was a high
school diploma. Students whose parents’ combined highest education was associate
degree, bachelor’s degree, or graduate degree were coded as not first-generation students.
The reference category is students who are not first-generation.
AP Seminar/AP Research Participation. Students who participated in AP Seminar are
those who had an AP Seminar Exam assessment score on record.2 Students who had an
AP Research Exam assessment score on record were marked as AP Research participants.
We were unable to identify students who may have participated in either AP Seminar or AP
Research courses without completing all required assignments to earn an AP Exam
assessment score.
2 See the Features of AP Seminar and AP Research section above for a list of assignments and tests that constitute the AP
Seminar and AP Research Exam score. Students must complete all assignments to get a final AP Exam score.
12

AP Capstone Diploma Earning. College Board AP Exam score records were used to
identify students who earned the AP Capstone Diploma. Students had to have scored a 3 or
higher on AP Seminar, AP Research, and a minimum of four other AP Exams to be
designated as AP Capstone Diploma earners.
Control Variables Used in High School Analyses Only
PSAT/NMSQT Performance. PSAT/NMSQT scores were obtained from official College
Board records. If a student took the old version of the PSAT/NMSQT that was last
administered in October 2014, scores were concorded to the new PSAT/NMSQT for
analysis. Only the student’s most recent PSAT/NMSQT score was used for analysis.
Number of AP Exams Completed Prior to Outcome of Interest. AP Exam participation
was obtained from College Board records. We counted the number of AP Exam scores the
student had on record, only including the AP Exams that were completed prior to or at the
same time as the outcome of interest. In that way, we can ensure that the relationships we
observe are not a result of AP learning in courses outside of AP Seminar or AP Research.
The number of AP Exams a student completed is also an indirect control for student
motivation because more motivated students likely complete more AP Exams in high school.
Note that we did not control for the performance on AP Exams. We only counted the total
number of AP Exams completed.
AP Seminar/AP Research Exam Performance. AP Exam performance was obtained from
College Board records. Performance in AP Seminar and AP Research is not measured by
one end-of-year exam. Instead, the various performance tasks students complete are
objectively scored and contribute to an overall assessment score that reflects the criterion
developed by the AP Program for all AP Exams. A score of 1 represents “No
recommendation for college credit”; 2 represents “Possibly qualified for college credit”; 3
represents “Qualified for college credit”; 4 represents “Well-qualified for college credit”; and
5 represents “Extremely well-qualified for college credit.” Many postsecondary institutions
award college credit to students who score a 3 or higher on an AP Exam. Thus, for the
purposes of the analyses in this study, AP Seminar or AP Research Exam success was
operationalized as a score of 3 or higher.
Control Variables Used in College Analyses Only
SAT Performance. SAT scores were obtained from official College Board records. If a
student took the old version of the SAT that was last administered in 2015, scores were
concorded to the new SAT for analysis. Only the student’s most recent SAT score was used for analysis.
Low-Socioeconomic Status.3 . The low-socioeconomic status indicator is determined
based on the mean reported income for the census block in which the student lives.
3 The variable low-socioeconomic status was only used in college outcome analyses because it was not available at the time
high school analyses were conducted.
13

Students who live in a census block where the mean household income is equal to or less
than $45,000 are considered low-socioeconomic status.
Outcome Variables
AP Exam Performance (high school outcome). AP Exam performance was obtained from
College Board records. To examine performance on future and concurrent AP Exams of the
subject group in question, we grouped individual AP Exams. Table 3 outlines the groups of
AP Exams used to measure AP subject performance. A student had to have taken at least
one of the exams in the group to be included in the analysis. If the student completed more
than one exam in a subject group in the same academic year, we averaged the performance
in all AP Exams in that subject group and used the average as the outcome. We looked at
concurrent AP Exam performance (AP Exams taken in same year as AP Seminar or AP
Research) and future AP Exam performance (AP Exams taken in the academic year after
AP Seminar or AP Research) separately to allow us to understand whether or not the timing
at which the AP Seminar or AP Research course was taken made a difference in student
results.
Table 3: AP Exam Groupings for AP Exam Performance Outcome
English Language and Composition, English Literature and Composition
AP English Exams
European History, United States History, World History, Art History
AP History Exams
Comparative Government and Politics, United States Government and Politics
AP Politics Exams
AP Math Exams Calculus AB, Calculus BC, Statistics
AP Computer Science Exams Computer Science Principles, Computer Science A
Chemistry, Biology, Environmental Science, Physics 1, Physics 2, Physics B, Physics C: Electricity and Magnetism, Physics C: Mechanics
AP Science Exams
Macroeconomics, Microeconomics, Psychology, Human Geography
AP Social Science Exams
First-year grades (college outcome). Student’s first-year grades were obtained from
transcripts provided by colleges and universities participating in the College Board national
validity study. The range is 0.00 to 4.33.
Retention to the second year (college outcome). Student retention information was
obtained from NSC records. A student was considered retained to the second year if there
was a record of enrollment in the same postsecondary institution in the fall of 2017 and fall
of 2018.
Internship, academic research, and honors college participation (college outcome).
College internship, academic research, and honors program information was obtained from
a student survey administered by College Board. In the College Board Student Survey and
the College Board AP Capstone Survey, students are asked: Do you currently participate or
14
have you participated in any of the following since you began college? The activities listed
are internship, academic research, study abroad, and honors program. Students can select
the answers: Yes, No, Not offered at my college/university. Students who select “Yes” for an option are marked as having participated. Students who select “No” are marked as not having participated, and students choosing “Not offered at my college/university” are excluded from analysis.
Analyses To understand the relationship between AP Seminar or AP Research participation and
concurrent and future AP Exam scores, we used a hierarchical linear modeling approach.
To confirm that this analysis required such an approach, we computed an unconditional
model with a random intercept only and calculated the generalized interclass correlation
coefficient (ICC) as recommended by Snijders and Bosker (1999).4 The resulting test
statistic was significant (p<.0001) for all data sets, which indicates that the null hypothesis of
homogeneity of AP Exam and SAT score performance across high schools can be rejected
and that a hierarchical model will provide more accurate results. In our hierarchical models,
we grand-mean centered all continuous variables at the student level as recommended by
Raudenbush and Bryk (2002, p. 35).
At the student level, we controlled for student first-generation status, minority status, gender,
PSAT/NMSQT scores, HSGPA, and number of AP Exams taken in the same year and years
prior to AP Exams considered in outcome. Our main variable of interest was AP Seminar or
AP Research participation and performance. Students who had any missing control
variables were removed from the analysis.
To understand the relationship between participating in AP Seminar, earning an AP
Capstone Diploma, and college outcomes, we used a hierarchical linear modeling approach
when the data were clustered by higher education institution (first-year grades, retention to
the second year) and a logistic regression approach when the data was not clustered
(internships, academic research, and honors program participation). The data on internship,
academic research, and honors program participation was not clustered because it was
collected via an online survey that was sent to students who agreed to be contacted by
College Board and was thus not collected on an institution-wide scale like the retention and
first-year transcript data. In our hierarchical models, we grand-mean centered all continuous
variables at the student level.
For all college outcome analyses we controlled for student first-generation and minority
status, gender, SAT scores, HSGPA, and low-income status. Our primary variables of
interest were participating in AP Seminar and earning the AP Capstone Diploma. Students
who had any missing control variables were removed from the analysis.
4 Multiple linear regressions were run for all analyses using HLM models. Regression results indicated larger effects of AP
Seminar and AP Research participation on concurrent and future AP Exam scores than HLM results. HLM takes into account
the variation in AP Exam scores within schools, which reduces the influence of high school quality on estimates.
15

It is important to highlight that the methodological approaches used in this study— hierarchical linear modeling and linear or logistic regression—are designed to indicate the
extent to which variables, such as AP Exam scores and AP Seminar participation, have a
correlational relationship. These methods do not allow for causal claims. For example,
hierarchical linear regression results do not allow for the claim that AP Seminar participation
is the cause for AP Seminar students’ higher scores in AP English Language Exams that
are completed in the same academic year.
Causal claims cannot be made because regression-based methods do not consider
unobserved selection bias. It is possible that students who decide to take AP Seminar are
exceptional in some way that is not captured by the extensive control variables used in our
hierarchical linear models or linear regression models. Although we cannot eliminate issues
of unobserved selection bias altogether using the observational data at our disposal, we
conducted a few sensitivity analyses to understand to what extent our results remain robust
when we take a different methodological approach. In our second approach described in
Appendix 1, we used a matching methodology to compare outcomes of AP Seminar
students matched to similar students who attended the same schools in a prior cohort. The
comparison group could not self-select into AP Seminar or AP Research because the
courses were not offered at the time of their high school enrollment. Results from our
matching analyses summarized in Appendix Tables A1, A2, and A3 indicate that the
direction of the statistically significant results presented hold even when a different
methodology is applied to the research question.
Analysis 1 Results: Relationship Between AP Seminar/AP
Research Participation and Concurrent and Future AP Exam
Performance Results for AP Seminar
Figure 1 and Table 4 present the results for the relationship between AP Seminar
participation and performance on AP Exams taken in the same year as AP Seminar. Figure
2 and Table 5 present the results for the relationship between AP Seminar participation and
performance on AP Exams taken in the academic year following AP Seminar. Column 1 in
both tables shows the average AP Exam score in each subject area for AP students who did
not take an AP Seminar Exam. We include both the mean AP Exam score of those students
as well as the sample size for all the groups included in analysis. The second column in both
tables shows the extent to which the average AP Exam score in that subject area is higher
or lower for AP students who participated in AP Seminar versus similar AP students who did
not participate. The third and final column shows the extent to which the average AP Exam
score in that subject area is higher or lower for students who participated in AP Seminar and
earned a 3 or higher on the AP Seminar Exam versus similar AP students who did not take
an AP Seminar Exam.
Results in Figure 1 show the strongest relationships among AP Seminar participation and
students who take English, history, politics, and social science AP Exams. AP Seminar
16
students score 0.08 to 0.20 points higher on AP Exams in those subject areas than similar
AP students who did not take AP Seminar. In other words, their AP Exam score on
concurrent AP Exams in those subjects is about 3%–7% higher, with increases being
statistically significant.
When focusing in on the performance of AP Seminar students on AP Exams taken the year
after AP Seminar (see Table 5 or Figure 2), the results remain similarly positive for English,
history, and politics. AP Seminar students score 0.08 to 0.19 points higher on AP Exams in
those subject areas than similar AP students who did not take AP Seminar, which again
translates to a score that is 3% higher, with increases being statistically significant.
The percent increase or decrease in concurrent and future AP Exam scores for students
who participate in AP Seminar in their sophomore, junior, or senior year of high school is
similar. This indicates that the relationship between AP Seminar participation and AP Exam
performance is not sensitive to the student’s decision on when to take AP Seminar in their high school career. Furthermore, the similarity of effects in performance gains between
concurrent and future AP Exams in each subject area suggests that the increase in AP
Exam score for AP Seminar participants is not primarily driven by AP Seminar helping
students who take the course understand their own interests and abilities in a way that helps
them self-select into a future AP course that matches their interests and skills. If this were
the case, we would expect to see the effect to be larger for AP Exams taken in the year after
AP Seminar than AP Exams taken in the same year as AP Seminar. Because we see similar
effects in both AP Exams taken in the same year as well as AP Exams taken in future years,
it is likely that the skills learned in AP Seminar are positively related to performance in other
AP Exams.
While there is a positive relationship between English, history, and politics AP Exam scores
and AP Seminar participation, the relationship between math, computer science, and
science AP Exam scores and AP Seminar participation is most often near zero and
statistically insignificant.
For the 15 results summarizing the relationship between AP Seminar participation and
performance on AP Exams in math, computer science, and science shown in Column 2 of
Tables 4 and 5, 9 results indicate that there is no statistically significant relationship present.
This finding that there is often either no statistically significant or a negative relationship
between AP Seminar participation and AP Exam performance in math, computer science ,
and science is not surprising as the activities students enrolled in AP Seminar engage in— reading and analyzing articles, research studies, and foundational literary and philosophical
texts; listening to and viewing speeches, broadcasts, and personal accounts; and
experiencing artistic works and performances—are more often used in English, history,
politics, and social science courses.
17
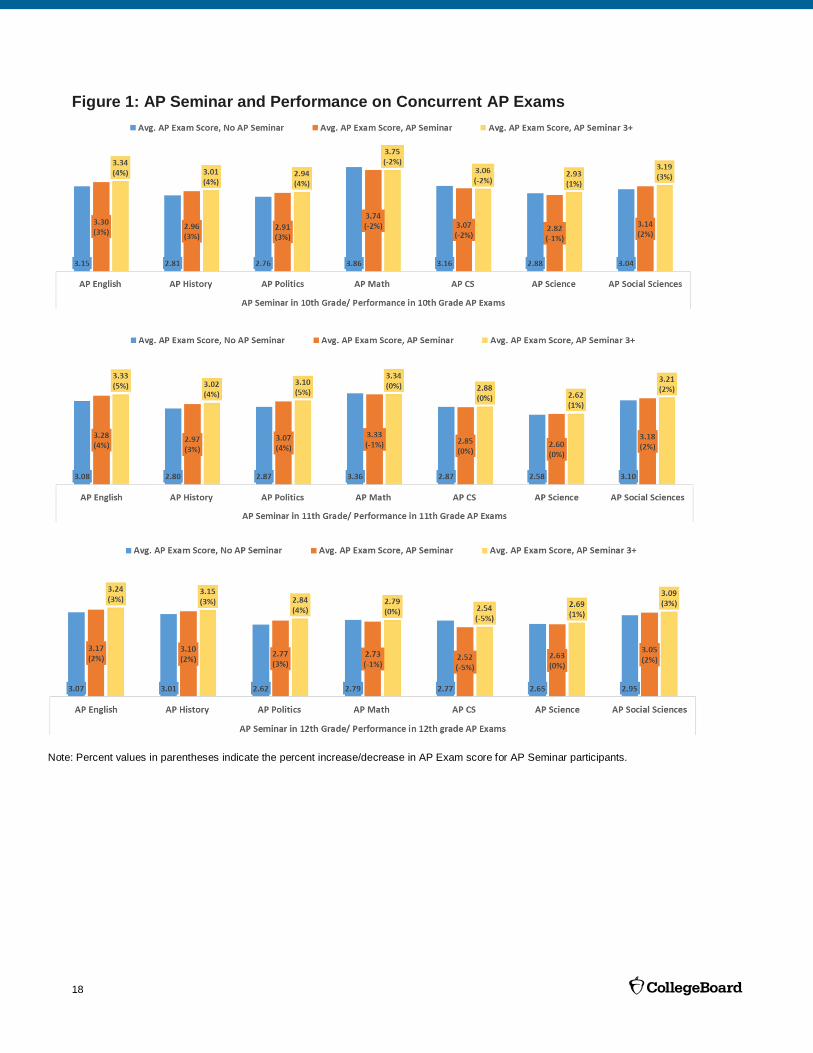
Note: Percent values in parentheses indicate the percent increase/decrease in AP Exam score for AP Seminar participants.
Figure 1: AP Seminar and Performance on Concurrent AP Exams
18

Note: Percent values in parentheses indicate the percent increase/decrease in AP Exam score for AP Seminar participants.
Figure 2: AP Seminar and Performance on Future AP Exams
It is important to note, however, that the results do indicate that students who take AP
Seminar have higher AP science exam scores than AP students who did not take AP
Seminar when that AP science exam is taken in the academic year after the AP Seminar
course. This suggests that the benefits of AP Seminar participation on AP science exam
performance may be variable rather than insignificant across the board.
As would be expected, students who earn a score of 3 or higher on the AP Seminar Exam
on average have higher AP Exam scores in both concurrent and subsequent AP Exams.
However, even those high scoring AP Seminar students are not more likely to earn higher
scores on AP Exams in math, computer science and, to some extent, science, compared to
AP students who did not take the AP Seminar Exam.
19

AP
Sem
inar
in 1
0th
Gra
de
A
P S
emin
ar in
11t
h G
rad
e
A
P S
emin
ar in
12t
h G
rad
e
Table 4: AP Seminar and Performance on Concurrent AP Exams
AP Seminar, Score 3+ Outcome No AP Seminar AP Seminar, Overall
AP English Exams in 10th Grade Mean 3.15 0.15*** 0.19*** N 5,679 405 351
AP History Exams in 10th Grade Mean 2.81 0.15*** 0.20*** N 101,723 7,467 6,270
AP Politics Exams in 10th Grade Mean 2.76 0.15*** 0.18***
N 8,014 374 343
AP Math Exams in 10th Grade Mean 3.86 -0.12*** -0.11**
N 5,857 515 486
AP CS Exams in 10th Grade Mean 3.16 -0.09 -0.10 N 6,295 273 252
AP Science Exams in 10th Grade Mean 2.88 -0.06** 0.05**
N 22,745 1,862 1,601 AP Social Sciences Exams in 10th Grade Mean 3.04 0.10** 0.15***
N 24,060 1,653 1,329
AP English Exams in 11th Grade Mean 3.08 0.20*** 0.25*** N 125,182 11,057 9,637
AP History Exams in 11thGrade Mean 2.80 0.17*** 0.22*** N 107,472 8,161 7,006
AP Politics Exams in 11th Grade Mean 2.87 0.20*** 0.23*** N 9,309 879 803
AP Math Exams in 11th Grade Mean 3.36 -0.03 -0.02 N 38,333 3,867 3,597
AP CS Exams in 11th Grade Mean 2.87 -0.02 0.01 N 7,771 462 420
AP Science Exams in 11th Grade Mean 2.58 0.02 0.04*** N 91,822 7,431 6,674
AP Social Sciences Exams in 11th Grade Mean 3.10 0.08*** 0.11***
N 55,153 3,172 2,851
AP English Exams in 12th Grade Mean 3.07 0.10*** 0.17***
N 91,594 839 619
AP History Exams in 12th Grade Mean 3.01 0.09 0.14
N 12,739 153 125 AP Politics Exams in 12th Grade Mean 2.62 0.15*** 0.22***
N 66,364 579 428
AP Math Exams in 12th Grade Mean 2.79 -0.06 0.00
N 102,809 759 584 AP CS Exams in 12th Grade Mean 2.77 -0.25* -0.23
N 9,687 65 52 AP Science Exams in 12th Grade Mean 2.65 -0.02 0.04
N 85,831 660 512
AP Social Sciences Exams in 12th Grade Mean 2.95 0.10** 0.14***
N 89,958 617 456
Note: Averages are based on HLM model controlling for student demographics, academic achievement, prior AP exposure,
and high school effects. P < 0.1*, 0.05**, 0.01***
20

Table 5: AP Seminar and Performance on Future AP Exams
Outcome No AP Seminar AP Seminar, Overall AP Seminar, Score 3+
AP English Exams in 11th Grade Mean 3.07 0.10*** 0.17***
N 125,182 4,023 3,163
AP History Exams in 11th Grade Mean 2.79 0.12*** 0.20***
N 107,472 3,185 2,453
AP Politics Exams in 11th Grade Mean 2.86 0.19*** 0.24***
N 9,309 355 307
AP Math Exams in 11th Grade Mean 3.35 -0.09*** -0.06**
N 38,333 1,392 1,171
AP CS Exams in 11th Grade Mean 2.87 -0.04 0.01
N 7,771 222 170
AP Science Exams in 11th Grade Mean 2.56 0.06*** 0.09***
N 91,822 2,710 2,170
AP Social Sciences Exams in 11th Grade Mean 3.10 0.01 0.06*
N 55,153 1,157 895
AP English Exams in 12th Grade Mean 3.07 0.08*** 0.12***
N 91,594 3,849 3,224
AP History Exams in 12th Grade Mean 3.02 0.15*** 0.19***
N 12,739 557 505
AP Politics Exams in 12th Grade Mean 2.62 0.13*** 0.18***
N 66,364 2,400 2,050
AP Math Exams in 12th Grade Mean 2.80 -0.04** -0.02 N 102,809 3,974 3,483
AP CS Exams in 12th Grade Mean 2.78 -0.02 0.00
N 9,687 431 382
AP Science Exams in 12th Grade Mean 2.65 0.01 0.03
N 85,831 3,121 2,728
AP Social Sciences Exams in 12th Grade Mean 2.96 -0.04** 0.00
N 89,958 3,348 2,843
A
P S
emin
ar in
11t
h G
rad
e
AP
Sem
inar
in 1
0th
Gra
de
Note: Averages are based on HLM model controlling for student demographics, academic achievement, prior AP exposure,
and high school effects. P < 0.1*, 0.05**, 0.01***
Results for AP Research
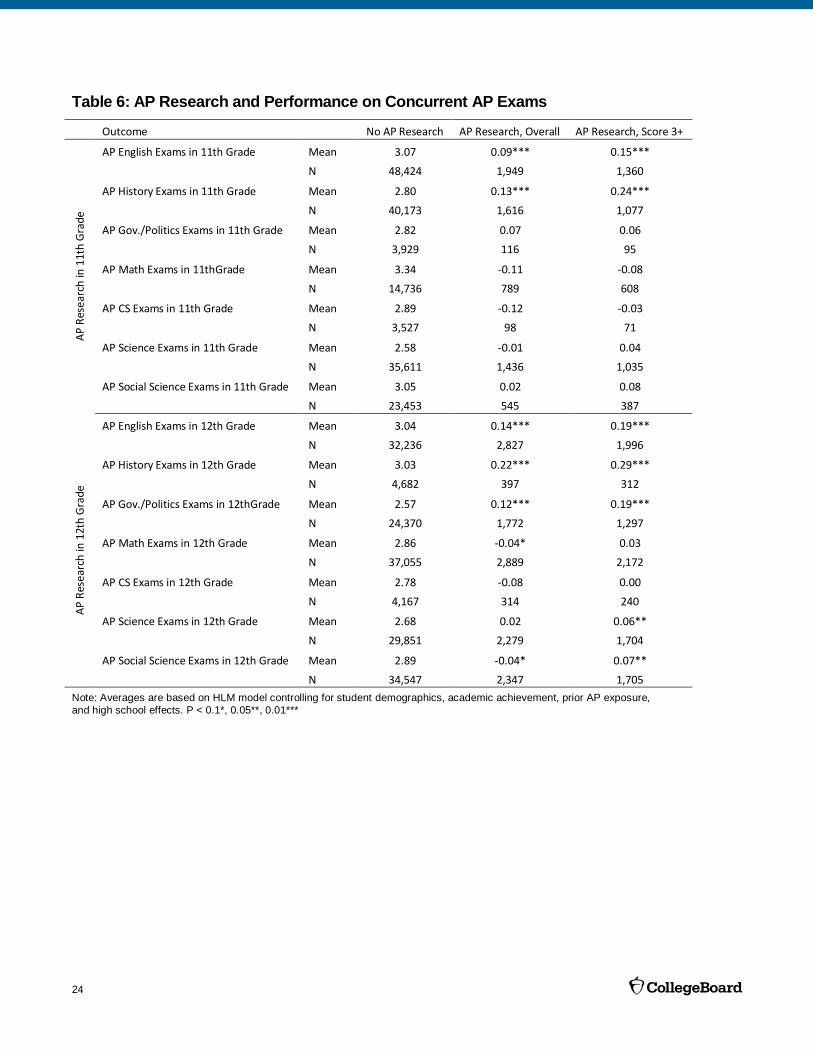
Figure 3 and Table 6 present the results of our analysis on the relationship between AP
Research participation and performance in concurrent AP Exams, and Figure 4 and Table 7
present the results of our analysis on the relationship between AP Research participation
and performance on AP Exams taken the following year. The tables and figures have the
same layout as those described in the Results for AP Seminar section.
It is important to note that the sample sizes for the AP Research analysis are significantly
smaller than those for the AP Seminar analysis. This is because students can, and often do,
take AP Seminar without subsequently taking AP Research. AP Research students,
however, must take AP Seminar as a prerequisite. Furthermore, AP Research was instituted
21

in high schools one year after AP Seminar, which means that some high schools may have
offered AP Seminar, but not AP Research, at the time of this analysis.
The AP Research results are like AP Seminar results in that the relationship between AP
Research participation and performance on concurrent and future AP Exams differs by
subject area. AP Research participation has the most positive relationship with AP Exam
scores in the English, history, and politics subject areas. Students who take the AP
Research Exam score 0.07 to 0.22 points higher on their English, history, and politics AP
Exams taken in the same year as AP Research, compared to AP Students who did not take
AP Research (see Figure 3 and Table 6). This translates to a score that is 2%–7% higher, a
statistically significant difference in all cases except AP politics exams. Students who score
a 3 or higher on the AP Research Exam see even greater increases of up to 0.29 points.
Focusing on performance in AP Exams taken in the year after AP Research participation
(see Figure 4 and Table 7), students who take AP Research score 0.03 to 0.40 points higher
on their English, history, and politics AP Exams taken in the year following AP Research,
compared to similar AP Students who did not take AP Research. In this case, the
differences are not statistically significant for English and politics. It is important to note,
however, that most students take AP Research as senior. Consequently, the sample sizes
for studying the relationships of AP Research students who completed the Research Exam
in 11th grade and went on to take further AP Exams in the 12th grade is smaller than what
we observe in other analyses.
As with AP Seminar, the relationship with participation in AP Research and performance in
math, computer science, and science is most often near zero and not statistically significant.
For the nine results summarizing the relationship between AP Research participation and
performance on AP Exams in math, computer science, and science shown in Column 2 of
Tables 6 and 7, six results indicate that there is no statistically significant relationship
present. AP Research participants do, however, have on average statistically significant
higher AP Exam scores in science exams that are taken in the year following AP Research
than similar AP students who did not take AP Research.
22

Note: Percent values in parentheses indicate the percent increase/decrease in AP Exam score for AP Research participants.
Note: Percent values in parentheses indicate the percent increase/decrease in AP Exam score for AP Research participants.
Figure 3: AP Research and Performance on Concurrent AP Exams
Figure 4: AP Research and Performance on Future AP Exams
23
0.05**, 0.01***
Table 6: AP Research and Performance on Concurrent AP Exams
Outcome No AP Research AP Research, Overall AP Research, Score 3+
AP English Exams in 11th Grade Mean 3.07 0.09*** 0.15***
N 48,424 1,949 1,360
AP History Exams in 11th Grade Mean 2.80 0.13*** 0.24***
N 40,173 1,616 1,077
AP Gov./Politics Exams in 11th Grade Mean 2.82 0.07 0.06
N 3,929 116 95
AP Math Exams in 11thGrade Mean 3.34 -0.11 -0.08
N 14,736 789 608
AP CS Exams in 11th Grade Mean 2.89 -0.12 -0.03
N 3,527 98 71
AP Science Exams in 11th Grade Mean 2.58 -0.01 0.04
N 35,611 1,436 1,035
AP Social Science Exams in 11th Grade Mean 3.05 0.02 0.08
N 23,453 545 387
AP English Exams in 12th Grade Mean 3.04 0.14*** 0.19***
N 32,236 2,827 1,996
AP History Exams in 12th Grade Mean 3.03 0.22*** 0.29***
N 4,682 397 312
AP Gov./Politics Exams in 12thGrade Mean 2.57 0.12*** 0.19***
N 24,370 1,772 1,297
AP Math Exams in 12th Grade Mean 2.86 -0.04* 0.03
N 37,055 2,889 2,172
AP CS Exams in 12th Grade Mean 2.78 -0.08 0.00
N 4,167 314 240
AP Science Exams in 12th Grade Mean 2.68 0.02 0.06**
N 29,851 2,279 1,704
AP Social Science Exams in 12th Grade Mean 2.89 -0.04* 0.07**
N 34,547 2,347 1,705
A
P R
esea
rch
in 1
2th
Gra
de
A
P R
esea
rch
in 1
1th
Gra
de
Note: Averages are based on HLM model controlling for student demographics, academic achievement, prior AP exposure,
and high school effects. P < 0.1*,
24
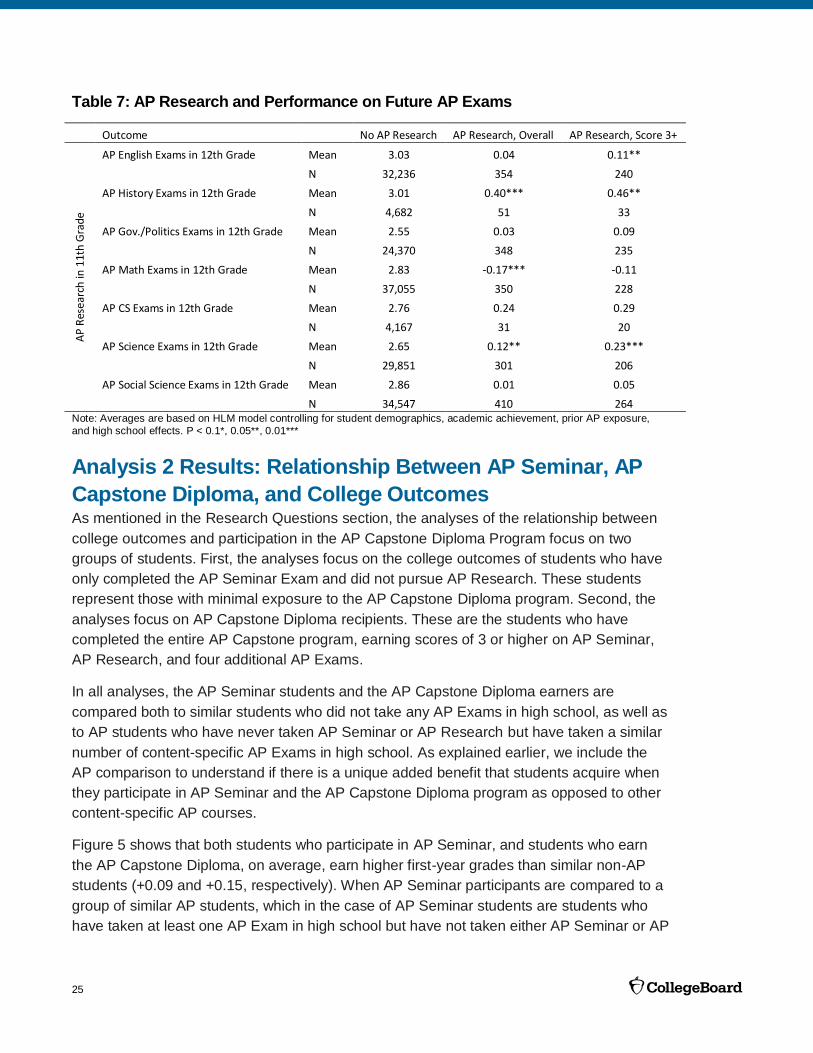
Table 7: AP Research and Performance on Future AP Exams
Outcome No AP Research AP Research, Overall AP Research, Score 3+
AP English Exams in 12th Grade Mean
N
3.03
32,236
0.04
354
0.11**
240
AP History Exams in 12th Grade Mean
N
3.01
4,682
0.40***
51
0.46**
33
AP Gov./Politics Exams in 12th Grade Mean
N
2.55
24,370
0.03
348
0.09
235
AP Math Exams in 12th Grade Mean 2.83 -0.17*** -0.11
N 37,055 350 228
AP CS Exams in 12th Grade Mean 2.76 0.24 0.29
N 4,167 31 20
A
P R
esea
rch
in 1
1th
Gra
de
AP Science Exams in 12th Grade Mean 2.65 0.12** 0.23***
N 29,851 301 206
AP Social Science Exams in 12th Grade Mean 2.86 0.01 0.05
N 34,547 410 264 Note: Averages are based on HLM model controlling for student demographics, academic achievement, prior AP exposure,
and high school effects. P < 0.1*, 0.05**, 0.01***
Analysis 2 Results: Relationship Between AP Seminar, AP
Capstone Diploma, and College Outcomes As mentioned in the Research Questions section, the analyses of the relationship between
college outcomes and participation in the AP Capstone Diploma Program focus on two
groups of students. First, the analyses focus on the college outcomes of students who have
only completed the AP Seminar Exam and did not pursue AP Research. These students
represent those with minimal exposure to the AP Capstone Diploma program. Second, the
analyses focus on AP Capstone Diploma recipients. These are the students who have
completed the entire AP Capstone program, earning scores of 3 or higher on AP Seminar,
AP Research, and four additional AP Exams.
In all analyses, the AP Seminar students and the AP Capstone Diploma earners are
compared both to similar students who did not take any AP Exams in high school, as well as
to AP students who have never taken AP Seminar or AP Research but have taken a similar
number of content-specific AP Exams in high school. As explained earlier, we include the
AP comparison to understand if there is a unique added benefit that students acquire when
they participate in AP Seminar and the AP Capstone Diploma program as opposed to other
content-specific AP courses.
Figure 5 shows that both students who participate in AP Seminar, and students who earn
the AP Capstone Diploma, on average, earn higher first-year grades than similar non-AP
students (+0.09 and +0.15, respectively). When AP Seminar participants are compared to a
group of similar AP students, which in the case of AP Seminar students are students who
have taken at least one AP Exam in high school but have not taken either AP Seminar or AP
25
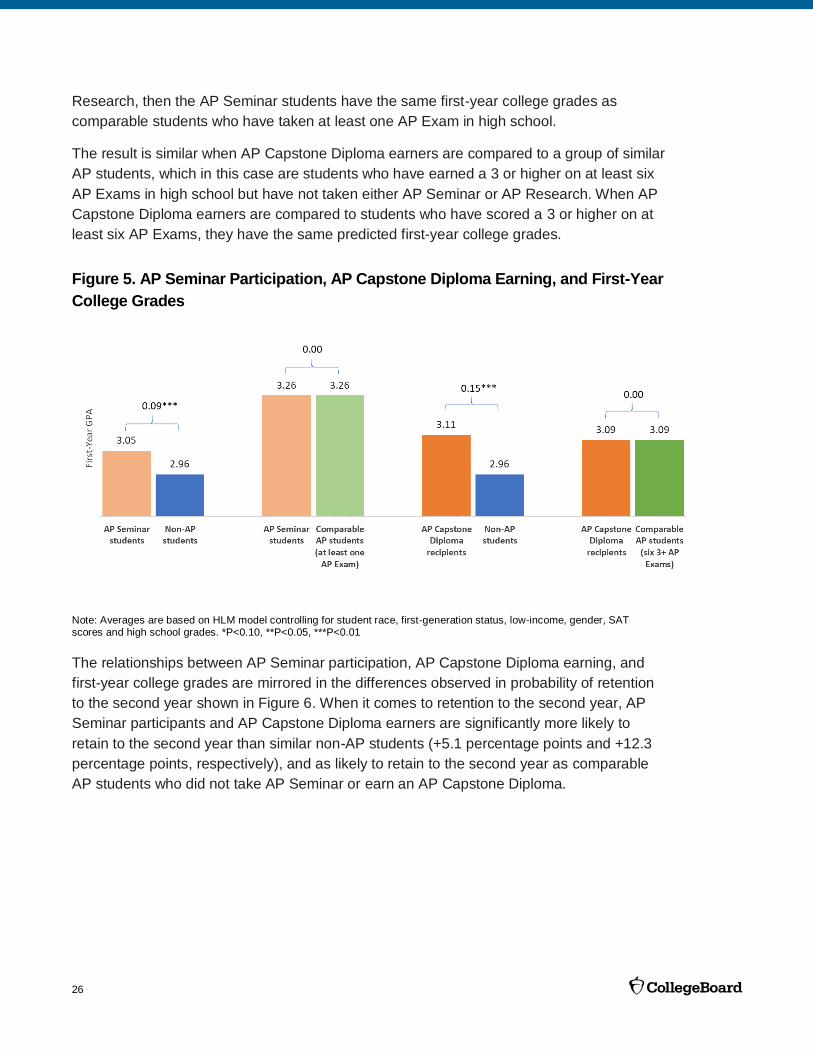
Research, then the AP Seminar students have the same first-year college grades as
comparable students who have taken at least one AP Exam in high school.
The result is similar when AP Capstone Diploma earners are compared to a group of similar
AP students, which in this case are students who have earned a 3 or higher on at least six
AP Exams in high school but have not taken either AP Seminar or AP Research. When AP
Capstone Diploma earners are compared to students who have scored a 3 or higher on at
least six AP Exams, they have the same predicted first-year college grades.
Figure 5. AP Seminar Participation, AP Capstone Diploma Earning, and First-Year
College Grades
Note: Averages are based on HLM model controlling for student race, first-generation status, low-income, gender, SAT scores and high school grades. *P<0.10, **P<0.05, ***P<0.01
The relationships between AP Seminar participation, AP Capstone Diploma earning, and
first-year college grades are mirrored in the differences observed in probability of retention
to the second year shown in Figure 6. When it comes to retention to the second year, AP
Seminar participants and AP Capstone Diploma earners are significantly more likely to
retain to the second year than similar non-AP students (+5.1 percentage points and +12.3
percentage points, respectively), and as likely to retain to the second year as comparable
AP students who did not take AP Seminar or earn an AP Capstone Diploma.
26

Figure 6. AP Seminar Participation, AP Capstone Diploma Earning, and Retention
to the Second Year
Note: Probabilities are calculated for the average student who is white /Asian, female, not first-generation, not low-income,
and has average SAT scores and high school grades. Differences in probability of retention are similar when considering first-generation, minority, and low-SES students.*P<0.10, **P<0.05, ***P<0.01
Figure 7 shows that AP Seminar participants and AP Capstone Diploma earners are
significantly more likely to participate in internships in the first year of college than similar
non-AP students (+15.4 percentage points and +9.3 percentage points, respectively). They
are also significantly more likely to participate in internships than comparable AP students
who did not take AP Seminar or earn an AP Capstone Diploma (+13.4 percentage points
and +4.9 percentage points, respectively).
Figure 7. AP Seminar Participation, AP Capstone Diploma Earning, and Internship
Participation
Note: Probabilities are calculated for the average student who is white /Asian, female, not first-generation, not low-income,
and has average SAT scores and high school grades. Differences in probability of internship participation are similar when considering first-generation, minority, and low-SES students. *P<0.10, **P<0.05, ***P<0.01
27
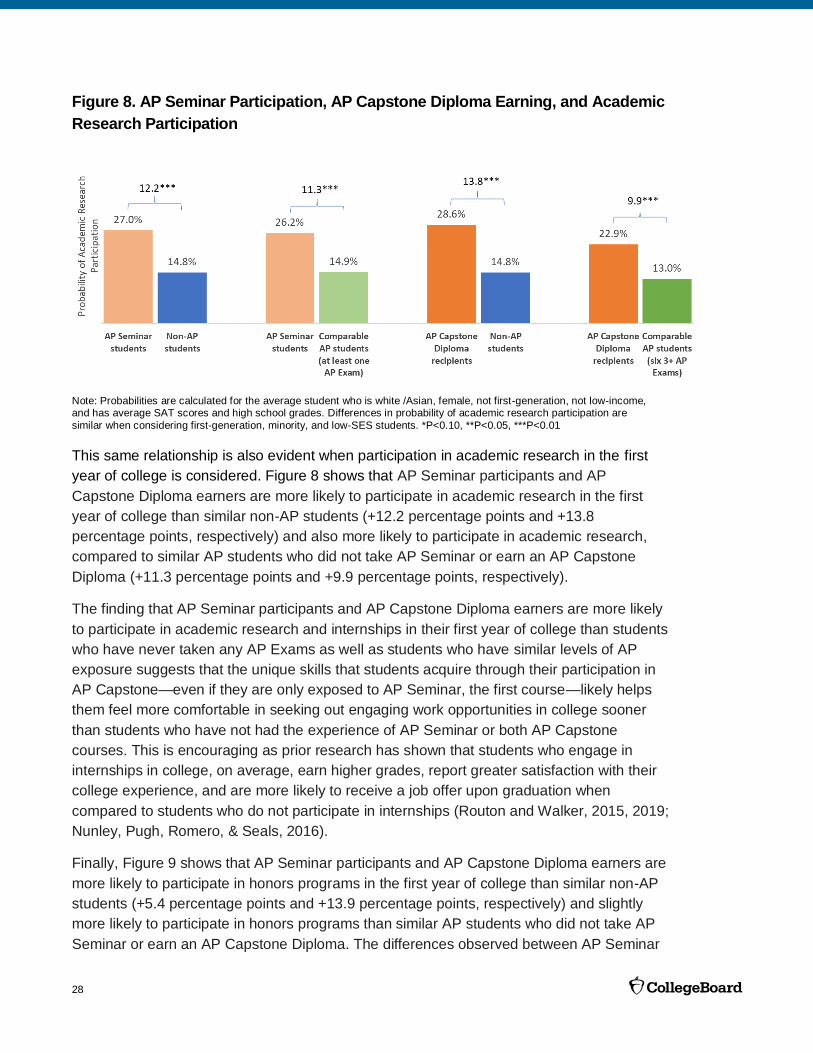
Figure 8. AP Seminar Participation, AP Capstone Diploma Earning, and Academic
Research Participation
Note: Probabilities are calculated for the average student who is white /Asian, female, not first-generation, not low-income, and has average SAT scores and high school grades. Differences in probability of academic research participation are
similar when considering first-generation, minority, and low-SES students. *P<0.10, **P<0.05, ***P<0.01
This same relationship is also evident when participation in academic research in the first
year of college is considered. Figure 8 shows that AP Seminar participants and AP
Capstone Diploma earners are more likely to participate in academic research in the first
year of college than similar non-AP students (+12.2 percentage points and +13.8
percentage points, respectively) and also more likely to participate in academic research,
compared to similar AP students who did not take AP Seminar or earn an AP Capstone
Diploma (+11.3 percentage points and +9.9 percentage points, respectively).
The finding that AP Seminar participants and AP Capstone Diploma earners are more likely
to participate in academic research and internships in their first year of college than students
who have never taken any AP Exams as well as students who have similar levels of AP
exposure suggests that the unique skills that students acquire through their participation in
AP Capstone—even if they are only exposed to AP Seminar, the first course—likely helps
them feel more comfortable in seeking out engaging work opportunities in college sooner
than students who have not had the experience of AP Seminar or both AP Capstone
courses. This is encouraging as prior research has shown that students who engage in
internships in college, on average, earn higher grades, report greater satisfaction with their
college experience, and are more likely to receive a job offer upon graduation when
compared to students who do not participate in internships (Routon and Walker, 2015, 2019;
Nunley, Pugh, Romero, & Seals, 2016).
Finally, Figure 9 shows that AP Seminar participants and AP Capstone Diploma earners are
more likely to participate in honors programs in the first year of college than similar non-AP
students (+5.4 percentage points and +13.9 percentage points, respectively) and slightly
more likely to participate in honors programs than similar AP students who did not take AP
Seminar or earn an AP Capstone Diploma. The differences observed between AP Seminar
28

participants and comparable AP students and AP Capstone Diploma earners and
comparable AP students are not statistically significant.
Figure 9. AP Seminar Participation, AP Capstone Diploma Earning, and Honors
Program Participation
Note: Probabilities are calculated for the average student who is white /Asian, female, not first-generation, not low-income,
and has average SAT scores and high school grades. Differences in probability of honors program participation are similar when considering first-generation, minority, and low-SES students. *P<0.10, **P<0.05, ***P<0.01
Because AP Seminar and the AP Capstone Diploma program are new offerings at the time
of publication, we currently only have one year of college outcome data for students who
have had the opportunity to participate in the program. This limitation of data availability
likely affects studying honors program participation because many universities have college
honors programs that do not start until later in a student’s college career. Future work
should revisit this analysis with additional years of data as they become available and
should also add further college outcomes such as college persistence, major choice, and
college completion.
Summary The results in this report show that AP Seminar and AP Research participation is related to
higher scores on concurrent and future AP Exams in the subject areas of English, history,
politics and, in some cases, social sciences and science. This is true for all AP Seminar or
AP Capstone participants but especially those who score a 3 or higher on the Capstone
exams.
AP Seminar or AP Research participation in most cases does not have a statistically
significant relationship with concurrent or future AP Exam performance in math and
computer science fields. This finding is not surprising in light of the fact that the type of skills
students develop in AP Seminar are more directly applicable to subjects such as English,
history, and politics, as opposed to math and computer science. The learning that takes
place in AP Research is highly individualized and can focus on any subject area from
science to humanities. For schools implementing the AP Capstone Diploma program, the
29

high school outcome evidence presented in this report may help with scheduling AP
Seminar and AP Research to optimize future or concurrent learning in other AP courses.
Results on the relationship between taking an AP Seminar Exam or completing the AP
Capstone Diploma and college outcomes show that students taking an AP Seminar Exam or
students earning an AP Capstone Diploma have significantly higher first-year grades,
second-year retention, and probability of participating in academic research, internships,
and honors programs than students who did not take any AP Exams in high school.
Furthermore, while AP Seminar students and AP Capstone Diploma earners have similar
first-year grades and retention as AP students with a comparable number of AP Exams,
taking AP Seminar or earning the AP Capstone Diploma provides a larger predicted boost
than comparable content-specific AP exposure with respect to internship, honors program,
and research participation in the first year of college. This finding suggests that the specific
skills taught in the AP Capstone program help students engage in college learning
opportunities that lead to positive college and career outcomes down the line.
Overall, the results presented in this report provide early evidence of the effectiveness of AP
Seminar and AP Research courses in preparing students for success in other AP
coursework, particularly in English, history, and politics, as well as for success in college.
Future research should continue to track student outcomes as more high schools adopt AP
Capstone and more students participate in the program in order for the generalizability of
these findings to be evaluated beyond early-adopter high schools.
30
Bibliography/References
Ewing, M., Jagesic, S., & Wyatt, J. (2018). Choosing Double: The Relationship Between
Successful AP Exams and College Double Major. (College Board Research Report).
New York: College Board.
Evans, B. (2018). How College Students Use Advanced Placement Credit. American
Educational Research Journal. Online first available November 13, 2018. DOI:
10.3102/0002831218807428
Godfrey, K. (2016). Creating Matched Samples Using Exact Matching. (College Board
Research Report No. 2016-3). New York: College Board.
Kaliski, P. K., & Godfrey, K. E. (2014). Does the Level of Rigor of a High School Science
Course Matter? (College Board Research Report No. 2014-2). New York: College
Board.
Mattern, K. D., Marini, J. P., & Shaw, E. J. (2013). Are AP Students More Likely to Graduate
from College on Time? (College Board Research Report No. 2013-5). New York:
College Board.
Mattern, K. D., Shaw, E. J., & Xiong, X. (2009). The Relationship Between AP Exam
Performance and College Outcomes. (College Board Research Report No. 2009-4).
New York: College Board.
Nunley, J. M., Pugh, A., Romero, N., & Seals, R. A. (2016). College Major, Internship
Experience, and Employment Opportunities: Estimates from a Résumé Audit. Labour
Economics 38: 37–46.
Patterson, B. F., Packman, S., & Kobrin, J. L. (2011). Advanced Placement Exam Taking
and Performance: Relationships with First-Year Subject Area College Grades.
(Research Report, 2011-4). New York: College Board.
Raudenbush, S., & Bryk, A. (2002). Hierarchical linear models: Applications and data
analysis methods. Thousand Oaks: Sage Publications.
Routon, P. W., &. Walker, J. (2015). A Smart Break? College Tenure Interruption and
Graduating Student Outcomes. Education Finance and Policy 10 (2): 244–276.
Routon, P. W., & Walker, J. (2019). College internships, tenure gaps, and student
outcomes: a multiple-treatment matching approach. Education Economics, 27 (4):
383–400.
Smith, J., Hurwitz, M., & Avery, C. (2017). Giving college credit where it is due: Advanced
Placement exam scores and college outcomes. Journal of Labor Economics 35 (1):
67–147.
31

Snijders, T., & Bosker, R. (1999). Multilevel analysis: An introduction to basic and advanced
multilevel modeling. Thousand Oaks: Sage Publications.
Wyatt, J., Patterson, B. F., & Di Giacomo, F. T. (2015). A Comparison of the College
Outcomes of AP and Dual Enrollment Students. (College Board Research Report
2015-3). New York: College Board.
32
4.02 30.78
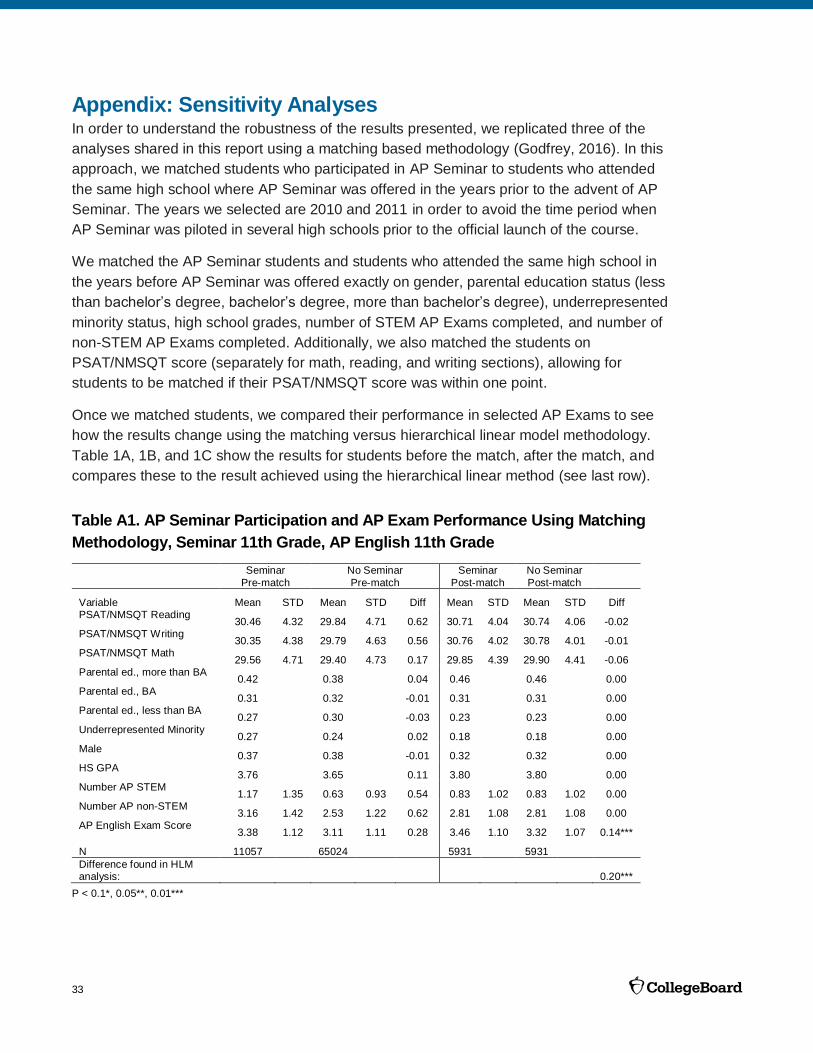
Appendix: Sensitivity Analyses In order to understand the robustness of the results presented, we replicated three of the
analyses shared in this report using a matching based methodology (Godfrey, 2016). In this
approach, we matched students who participated in AP Seminar to students who attended
the same high school where AP Seminar was offered in the years prior to the advent of AP
Seminar. The years we selected are 2010 and 2011 in order to avoid the time period when
AP Seminar was piloted in several high schools prior to the official launch of the course.
We matched the AP Seminar students and students who attended the same high school in
the years before AP Seminar was offered exactly on gender, parental education status (less
than bachelor’s degree, bachelor’s degree, more than bachelor’s degree), underrepresented
minority status, high school grades, number of STEM AP Exams completed, and number of
non-STEM AP Exams completed. Additionally, we also matched the students on
PSAT/NMSQT score (separately for math, reading, and writing sections), allowing for
students to be matched if their PSAT/NMSQT score was within one point.
Once we matched students, we compared their performance in selected AP Exams to see
how the results change using the matching versus hierarchical linear model methodology.
Table 1A, 1B, and 1C show the results for students before the match, after the match, and
compares these to the result achieved using the hierarchical linear method (see last row).
Table A1. AP Seminar Participation and AP Exam Performance Using Matching
Methodology, Seminar 11th Grade, AP English 11th Grade
Seminar
Pre-match
No Seminar
Pre-match
Seminar
Post-match
No Seminar
Post-match
Variable Mean STD Mean STD Diff Mean STD Mean STD Diff PSAT/NMSQT Reading
30.46 4.32 29.84 4.71 0.62 30.71 4.04 30.74 4.06 -0.02 PSAT/NMSQT Writing
30.35 4.38 29.79 4.63 0.56 30.76 4.01 -0.01 PSAT/NMSQT Math
29.56 4.71 29.40 4.73 0.17 29.85 4.39 29.90 4.41 -0.06 Parental ed., more than BA
0.42 0.38 0.04 0.46 0.46 0.00 Parental ed., BA
0.31 0.32 -0.01 0.31 0.31 0.00 Parental ed., less than BA
0.27 0.30 -0.03 0.23 0.23 0.00 Underrepresented Minority
0.27 0.24 0.02 0.18 0.18 0.00 Male
0.37 0.38 -0.01 0.32 0.32 0.00 HS GPA
3.76 3.65 0.11 3.80 3.80 0.00 Number AP STEM
1.17 1.35 0.63 0.93 0.54 0.83 1.02 0.83 1.02 0.00 Number AP non-STEM
3.16 1.42 2.53 1.22 0.62 2.81 1.08 2.81 1.08 0.00 AP English Exam Score
3.38 1.12 3.11 1.11 0.28 3.46 1.10 3.32 1.07 0.14***
N 11057 65024 5931 5931
Difference found in HLM analysis: 0.20***
P < 0.1*, 0.05**, 0.01***
33
0.05**, 0.01***
HLM results in Table 4 show that students who took AP Seminar in the 11th grade scored
0.20 points higher on their 11th-grade AP English Exams, compared to students who did not
take AP Seminar. The matching results for that analysis show that AP Seminar students
scored 0.14 points higher on their 11th-grade AP English Exams, compared to matched
students who attended the high school prior to the year that AP Seminar was offered (See
Table A1). Both the 0.20 and the 0.14 are statistically significant at alpha 0.01. This
comparison indicates that the HLM results are robust.
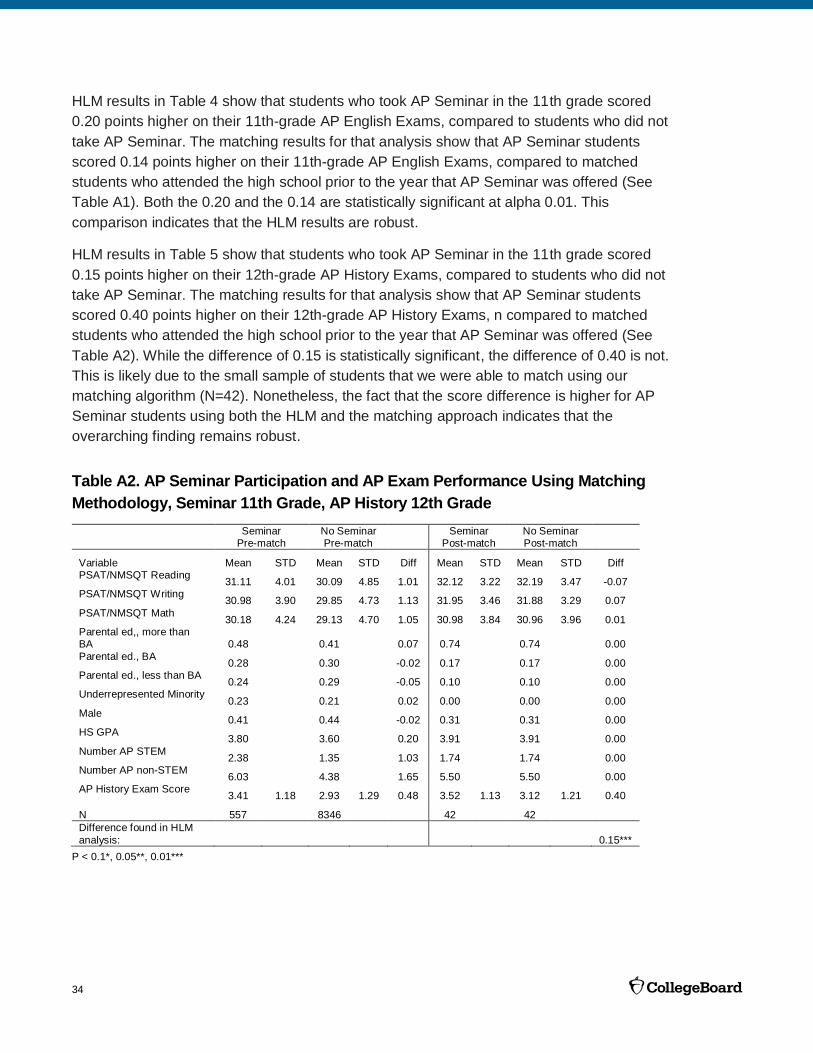
HLM results in Table 5 show that students who took AP Seminar in the 11th grade scored
0.15 points higher on their 12th-grade AP History Exams, compared to students who did not
take AP Seminar. The matching results for that analysis show that AP Seminar students
scored 0.40 points higher on their 12th-grade AP History Exams, n compared to matched
students who attended the high school prior to the year that AP Seminar was offered (See
Table A2). While the difference of 0.15 is statistically significant, the difference of 0.40 is not.
This is likely due to the small sample of students that we were able to match using our
matching algorithm (N=42). Nonetheless, the fact that the score difference is higher for AP
Seminar students using both the HLM and the matching approach indicates that the
overarching finding remains robust.
Table A2. AP Seminar Participation and AP Exam Performance Using Matching
Methodology, Seminar 11th Grade, AP History 12th Grade
Seminar Pre-match
No Seminar Pre-match
Seminar Post-match
No Seminar Post-match
Variable Mean STD Mean STD Diff Mean STD Mean STD Diff PSAT/NMSQT Reading
31.11 4.01 30.09 4.85 1.01 32.12 3.22 32.19 3.47 -0.07 PSAT/NMSQT Writing
30.98 3.90 29.85 4.73 1.13 31.95 3.46 31.88 3.29 0.07
PSAT/NMSQT Math 30.18 4.24 29.13 4.70 1.05 30.98 3.84 30.96 3.96 0.01
Parental ed,, more than BA 0.48 0.41 0.07 0.74 0.74 0.00
Parental ed., BA 0.28 0.30 -0.02 0.17 0.17 0.00
Parental ed., less than BA 0.24 0.29 -0.05 0.10 0.10 0.00
Underrepresented Minority 0.23 0.21 0.02 0.00 0.00 0.00
Male 0.41 0.44 -0.02 0.31 0.31 0.00
HS GPA 3.80 3.60 0.20 3.91 3.91 0.00
Number AP STEM 2.38 1.35 1.03 1.74 1.74 0.00
Number AP non-STEM 6.03 4.38 1.65 5.50 5.50 0.00
AP History Exam Score 3.41 1.18 2.93 1.29 0.48 3.52 1.13 3.12 1.21 0.40
N 557 8346 42 42
Difference found in HLM
analysis: 0.15***
P < 0.1*,
34
3.28
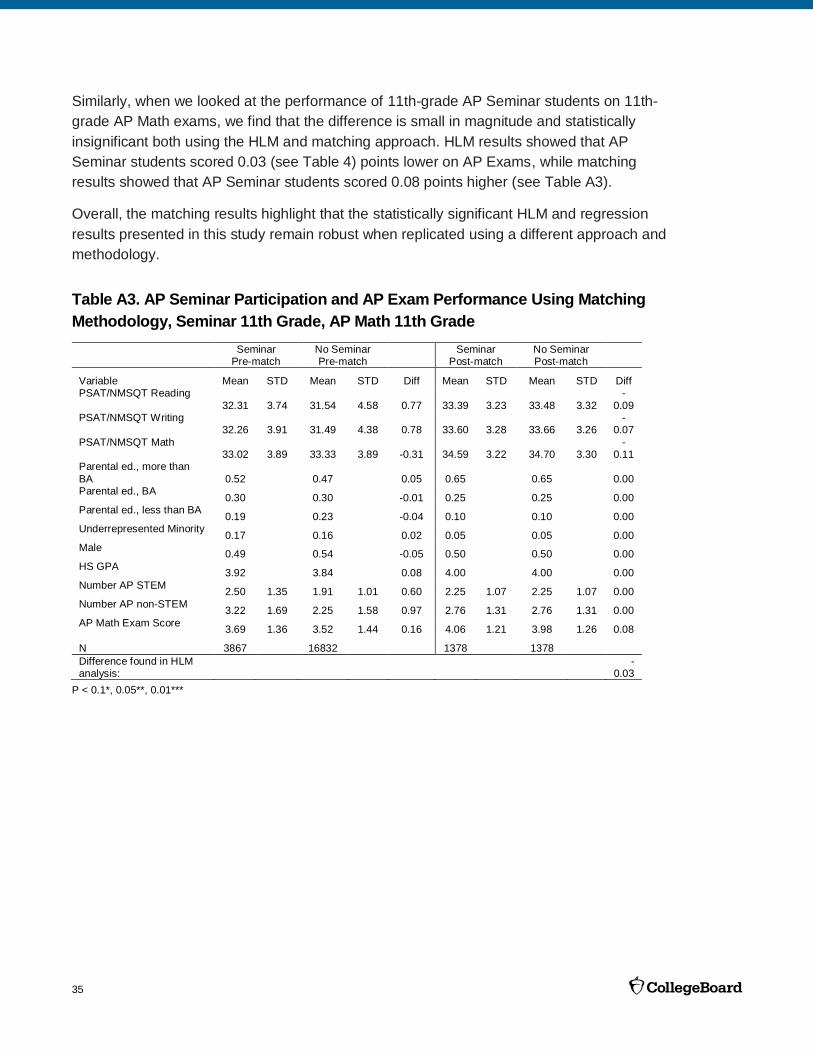
Similarly, when we looked at the performance of 11th-grade AP Seminar students on 11th-
grade AP Math exams, we find that the difference is small in magnitude and statistically
insignificant both using the HLM and matching approach. HLM results showed that AP
Seminar students scored 0.03 (see Table 4) points lower on AP Exams, while matching
results showed that AP Seminar students scored 0.08 points higher (see Table A3).
Overall, the matching results highlight that the statistically significant HLM and regression
results presented in this study remain robust when replicated using a different approach and
methodology.
Table A3. AP Seminar Participation and AP Exam Performance Using Matching
Methodology, Seminar 11th Grade, AP Math 11th Grade
Seminar Pre-match
No Seminar Pre-match
Seminar Post-match
No Seminar Post-match
Variable Mean STD Mean STD Diff Mean STD Mean STD Diff PSAT/NMSQT Reading -
0.09 32.31 3.74 31.54 4.58 0.77 33.39 3.23 33.48 3.32 PSAT/NMSQT Writing -
0.07 32.26 3.91 31.49 4.38 0.78 33.60 33.66 3.26
PSAT/NMSQT Math -0.11 33.02 3.89 33.33 3.89 -0.31 34.59 3.22 34.70 3.30
Parental ed., more than
BA 0.52 0.47 0.05 0.65 0.65 0.00 Parental ed., BA
0.30 0.30 -0.01 0.25 0.25 0.00 Parental ed., less than BA
0.19 0.23 -0.04 0.10 0.10 0.00 Underrepresented Minority
0.17 0.16 0.02 0.05 0.05 0.00 Male
0.49 0.54 -0.05 0.50 0.50 0.00
HS GPA 3.92 3.84 0.08 4.00 4.00 0.00
Number AP STEM 2.50 1.35 1.91 1.01 0.60 2.25 1.07 2.25 1.07 0.00
Number AP non-STEM 3.22 1.69 2.25 1.58 0.97 2.76 1.31 2.76 1.31 0.00
AP Math Exam Score 3.69 1.36 3.52 1.44 0.16 4.06 1.21 3.98 1.26 0.08
N 3867 16832 1378 1378
Difference found in HLM analysis:
-0.03
P < 0.1*, 0.05**, 0.01***
35

About College Board College Board is a mission-driven not-for-profit organization that connects students to
college success and opportunity. Founded in 1900, College Board was created to expand
access to higher education. Today, the membership association is made up of over 6,000 of
the world’s leading educational institutions and is dedicated to promoting excellence and equity in education. Each year, College Board helps more than seven million students
prepare for a successful transition to college through programs and services in college
readiness and college success—including the SAT® and the Advanced Placement®
Program. The organization also serves the education community through research and
advocacy on behalf of students, educators, and schools. For further information, visit
collegeboard.org.
36