ap-42 12.4 final background document for ferroalloy production
TRANSCRIPT
i
BACKGROUND REPORT
AP-42 SECTION 12.4
FERROALLOY PRODUCTION
Prepared for
U.S. Environmental Protection AgencyOAQPS/TSD/EIB
Research Triangle Park, NC 27711
1-103
Pacific Environmental Services, Inc.P.O. Box 12077
Research Triangle Park, NC 27709

ii
919/941-0333
1-103
AP-42 Background Report
TECHNICAL SUPPORT DIVISION
U.S. ENVIRONMENTAL PROTECTION AGENCY

iii
Office of Air Quality Planning and StandardsResearch Triangle Park, NC 27711
This report has been reviewed by the Technical Support Division of the Office of Air QualityPlanning and Standards, EPA. Mention of trade names or commercial products is not intended toconstitute endorsement or recommendation for use. Copies of this report are available through theLibrary Services Office (MD-35), U.S. Environmental Protection Agency, Research Triangle Park,NC 27711.
iv
TABLE OF CONTENTS
1.0 INTRODUCTION . . . . . . . . . . . . . . . . . . . . . . . . . . . . . . . . . . . . . . . . . . . . . . . . . 1
2.0 INDUSTRY DESCRIPTION . . . . . . . . . . . . . . . . . . . . . . . . . . . . . . . . . . . . . . . . . 22.1 GENERAL . . . . . . . . . . . . . . . . . . . . . . . . . . . . . . . . . . . . . . . . . . . . 22.2 PROCESS DESCRIPTION . . . . . . . . . . . . . . . . . . . . . . . . . . . . . . . . 22.3 EMISSIONS AND CONTROLS . . . . . . . . . . . . . . . . . . . . . . . . . . . . 92.4 REVIEW OF REFERENCES . . . . . . . . . . . . . . . . . . . . . . . . . . . . . 162.5 REFERENCES FOR CHAPTER 2 . . . . . . . . . . . . . . . . . . . . . . . . . 17
3.0 GENERAL EMISSION DATA REVIEW AND ANALYSIS PROCEDURES . . . . . . . . . . . . . . . . . . . . . . . . . . . . . . . . . . . . . . . . . . . . . . . . . . . . . . 20
3.1 LITERATURE SEARCH AND SCREENING . . . . . . . . . . . . . . . . . 203.2 EMISSION DATA QUALITY RATING SYSTEM . . . . . . . . . . . . . 213.3 EMISSION FACTOR QUALITY RATING SYSTEM . . . . . . . . . . 233.4 REFERENCES FOR CHAPTER 3 . . . . . . . . . . . . . . . . . . . . . . . . . 25
4.0 POLLUTANT EMISSION FACTOR DEVELOPMENT . . . . . . . . . . . . . . . . . . . 264.1 CRITERIA POLLUTANT EMISSIONS DATA . . . . . . . . . . . . . . . 264.2 NONCRITERIA POLLUTION EMISSION DATA . . . . . . . . . . . . . 344.3 REVIEW OF SPECIFIC DATA SETS . . . . . . . . . . . . . . . . . . . . . . 344.4 DATA GAP ANALYSIS . . . . . . . . . . . . . . . . . . . . . . . . . . . . . . . . . 364.5 REFERENCES FOR CHAPTER 4 . . . . . . . . . . . . . . . . . . . . . . . . . 39

v
LIST OF TABLES
TABLE 2.2-1: FERROALLOY PROCESSES AND RESPECTIVE PRODUCT GROUPS . . . . . . . . . . . . . . . . . . . . . . . . . . . . . . . . . . . . . . . . . . . . . . . . . . . . . . . . . . . 5
TABLE 2.3-1. (METRIC): EMISSION FACTORS FOR PARTICULATE FROM SUBMERGED ARC FERROALLOY FURNACES . . . . . . . . . . . . . . . . . . . 11
TABLE 2.3-1. (ENGLISH): EMISSION FACTORS FOR PARTICULATE FROM SUBMERGED ARC FERROALLOY FURNACES . . . . . . . . . . . . . . . . . . . . . . . . . . 13
TABLE 4.1-1 (METRIC): SIZE-SPECIFIC EMISSION FACTORS FOR SUBMERGED ARC FERROALLOY FURNACES . . . . . . . . . . . . . . . . . . . . . . . . . . 28
TABLE 4.1-1 (ENGLISH): SIZE-SPECIFIC EMISSION FACTORS FOR SUBMERGED ARC FERROALLOY FURNACES . . . . . . . . . . . . . . . . . . . . . . . . . . 31
TABLE 4-4: LIST OF CONVERSION FACTORS . . . . . . . . . . . . . . . . . . . . . . . . . . . . . . . . 38
LIST OF FIGURES
FIGURE 2.2-1 . . . . . . . . . . . . . . . . . . . . . . . . . . . . . . . . . . . . . . . . . . . . . . . . . . . . . . . . . . . . . 3FIGURE 2.2-2 . . . . . . . . . . . . . . . . . . . . . . . . . . . . . . . . . . . . . . . . . . . . . . . . . . . . . . . . . . . . . 7
1
1.0 INTRODUCTION
The document "Compilation of Air Pollutant Emission Factors" (AP-42) has been published
by the U.S. Environmental Protection Agency (the EPA) since 1972. Supplements to AP-42 have
been routinely published to add new emission source categories and to update existing emission
factors. AP-42 is routinely updated by the EPA to respond to new emission factor needs of the
EPA, State, and local air pollution control programs and industry.
An emission factor relates the quantity (weight) of pollutants emitted to a unit of activity of
the source. The uses for the emission factors reported in AP-42 include:
1. Estimates of area-wide emissions;
2. Emission estimates for a specific facility; and
3. Evaluation of emissions relative to ambient air quality.
The purpose of this report is to provide background information from process information
obtained from industry comment and four test reports to support revision of emission factors for
ferroalloys.
Including the introduction (Chapter 1) this report contains four chapters. Chapter 2 gives a
description of the ferroalloy industry. It includes a characterization of the industry, an overview of
the different process types, a description of emissions, a description of the technology used to
control emissions resulting from manufacturing ferroalloys, and a review of specific data sets.
Chapter 3 is a review of emissions data collection and analysis procedures. It describes the
literature search, the screening of emission data reports, and the quality rating system for both
emission data and emission factors. Chapter 4 details criteria and noncriteria pollutant emission
factor development. It includes the review of specific data sets and the results of data analysis.
Particle size determination and particle size data analysis methodology are described.
2
2.0 INDUSTRY DESCRIPTION
2.1 GENERAL
Ferroalloy is an alloy of iron with some element other than carbon. Ferroalloy is used to
physically introduce or "carry" that element into molten metal, usually during steel manufacture.
Ferroalloy has been further defined by the American Society for Metals and the Bureau of Mines
as "an alloy of iron that contains a sufficient amount of one or more other chemical elements to be
useful as an agent for introducing these elements into molten metal, usually steel."
In practice, the term "ferroalloy" is used to include any alloys which introduce reactive
elements into alloy systems, such as nickel and cobalt based aluminum systems. Silicon metal is
consumed in the aluminum industry as an alloying agent and in the chemical industry as a raw
material in silicon-based chemical manufacturing.
The ferroalloy industry is associated with the iron and steel industries, its largest customers.
Ferroalloys impart distinctive qualities to steel and cast iron and serve important functions during
iron and steel production cycles. The principal ferroalloys are those of chromium, manganese, and
silicon. Chromium provides corrosion resistance to stainless steels. Manganese is essential to
counteract the harmful effects of sulfur in the production of virtually all steels and cast iron.
Silicon is used primarily for deoxidation in steel and as an alloying agent in cast iron. Boron,
cobalt, columbium, copper, molybdenum, nickel, phosphorus, titanium, tungsten, vanadium,
zirconium, and the rare earths impart specific characteristics and are usually added as ferroalloys.
Ferroalloy production in the U.S. in 1989 was approximately 892,000 megagrams (985,000
tons), substantially less than the 1975 production of approximately 1,603,000 megagrams
(1,770,000 tons). In 1989, ferroalloys were produced in the U.S. by 28 companies, although five of
those produced only ferrophosphorous as a byproduct of elemental phosphorous production.
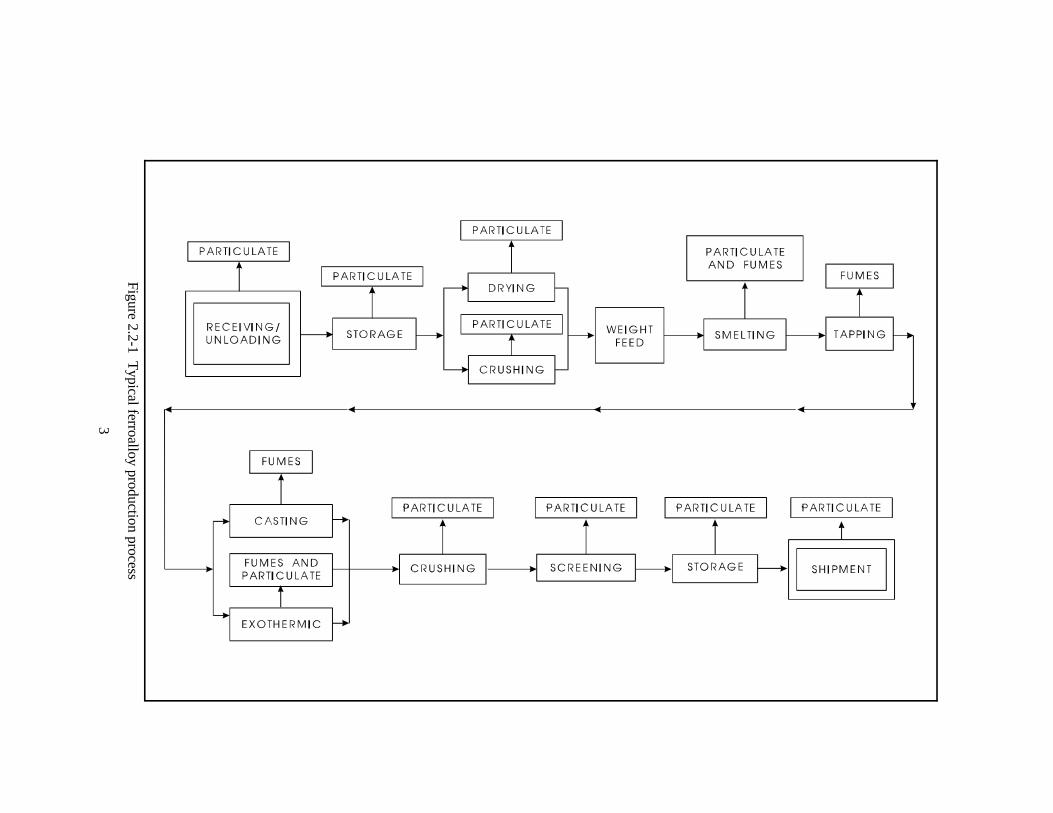
2.2 PROCESS DESCRIPTION
A variety of furnace types, including submerged electric arc furnaces, exothermic (metallothermic)
reaction furnaces and electrolytic cells can be used to produce ferroalloys. Furnace descriptions
and their ferroalloy products are given in Table 2.2-1. Vacuum and induction furnaces are not
discussed because they have few emissions and are not widely used.
3
Figure 2.2-1 Typical ferroalloy production process
4
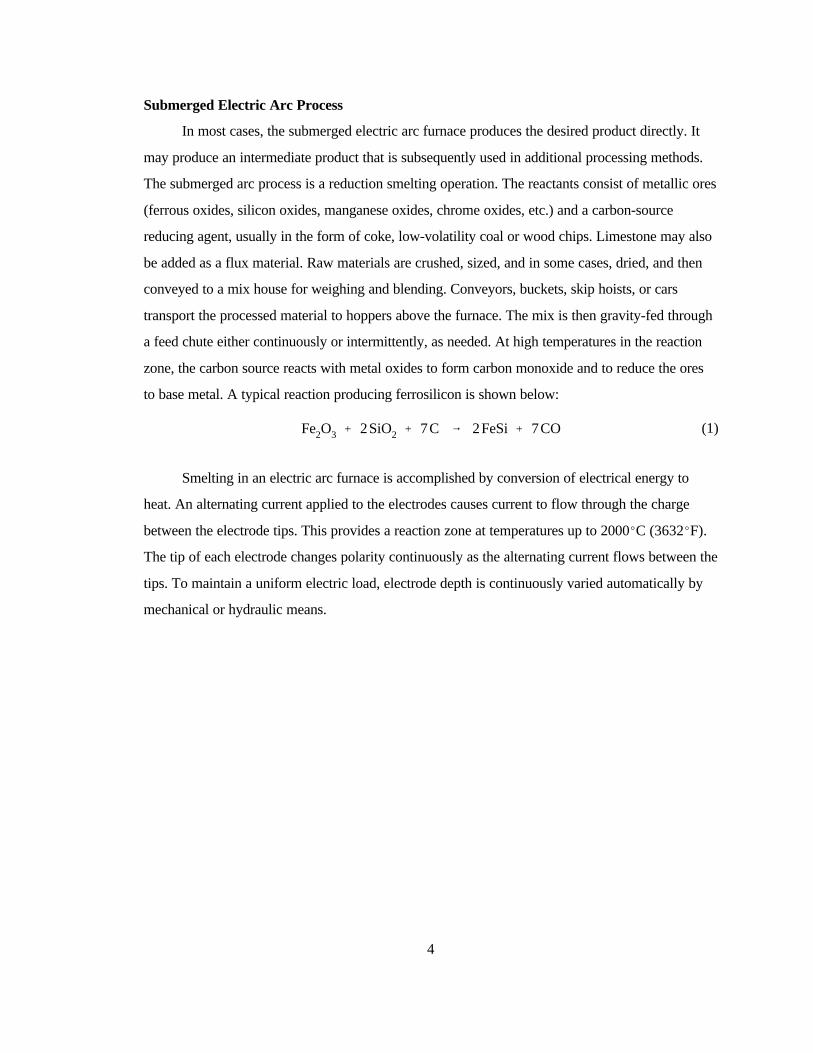
Submerged Electric Arc Process
In most cases, the submerged electric arc furnace produces the desired product directly. It
may produce an intermediate product that is subsequently used in additional processing methods.
The submerged arc process is a reduction smelting operation. The reactants consist of metallic ores
(ferrous oxides, silicon oxides, manganese oxides, chrome oxides, etc.) and a carbon-source
reducing agent, usually in the form of coke, low-volatility coal or wood chips. Limestone may also
be added as a flux material. Raw materials are crushed, sized, and in some cases, dried, and then
conveyed to a mix house for weighing and blending. Conveyors, buckets, skip hoists, or cars
transport the processed material to hoppers above the furnace. The mix is then gravity-fed through
a feed chute either continuously or intermittently, as needed. At high temperatures in the reaction
zone, the carbon source reacts with metal oxides to form carbon monoxide and to reduce the ores
to base metal. A typical reaction producing ferrosilicon is shown below:
(1)Fe2O3 % 2SiO2 % 7C 6 2FeSi % 7CO
Smelting in an electric arc furnace is accomplished by conversion of electrical energy to
heat. An alternating current applied to the electrodes causes current to flow through the charge
between the electrode tips. This provides a reaction zone at temperatures up to 2000EC (3632EF).
The tip of each electrode changes polarity continuously as the alternating current flows between the
tips. To maintain a uniform electric load, electrode depth is continuously varied automatically by
mechanical or hydraulic means.
5
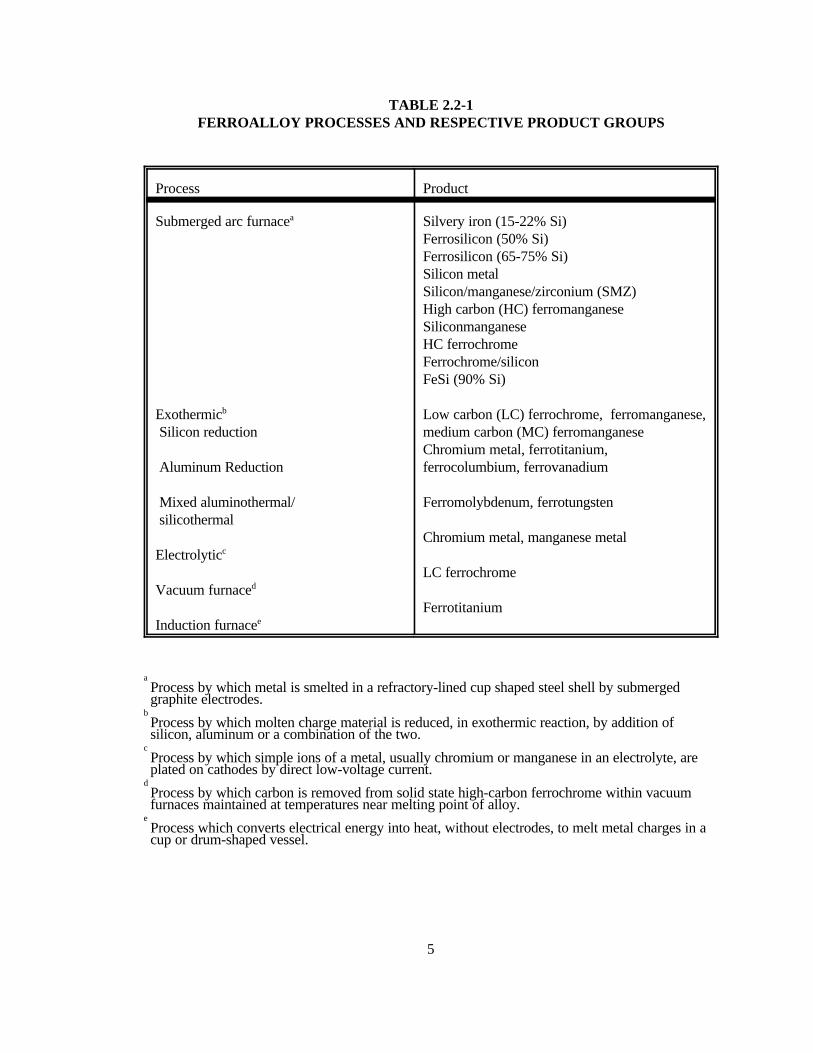
TABLE 2.2-1FERROALLOY PROCESSES AND RESPECTIVE PRODUCT GROUPS
Process Product
Submerged arc furnacea
Exothermicb
Silicon reduction
Aluminum Reduction
Mixed aluminothermal/ silicothermal
Electrolyticc
Vacuum furnaced
Induction furnacee
Silvery iron (15-22% Si)Ferrosilicon (50% Si)Ferrosilicon (65-75% Si)Silicon metalSilicon/manganese/zirconium (SMZ)High carbon (HC) ferromanganeseSiliconmanganeseHC ferrochromeFerrochrome/siliconFeSi (90% Si)
Low carbon (LC) ferrochrome, ferromanganese,medium carbon (MC) ferromanganeseChromium metal, ferrotitanium, ferrocolumbium, ferrovanadium
Ferromolybdenum, ferrotungsten
Chromium metal, manganese metal
LC ferrochrome
Ferrotitanium
aProcess by which metal is smelted in a refractory-lined cup shaped steel shell by submergedgraphite electrodes.
bProcess by which molten charge material is reduced, in exothermic reaction, by addition ofsilicon, aluminum or a combination of the two.
cProcess by which simple ions of a metal, usually chromium or manganese in an electrolyte, areplated on cathodes by direct low-voltage current.
dProcess by which carbon is removed from solid state high-carbon ferrochrome within vacuumfurnaces maintained at temperatures near melting point of alloy.
eProcess which converts electrical energy into heat, without electrodes, to melt metal charges in acup or drum-shaped vessel.
6
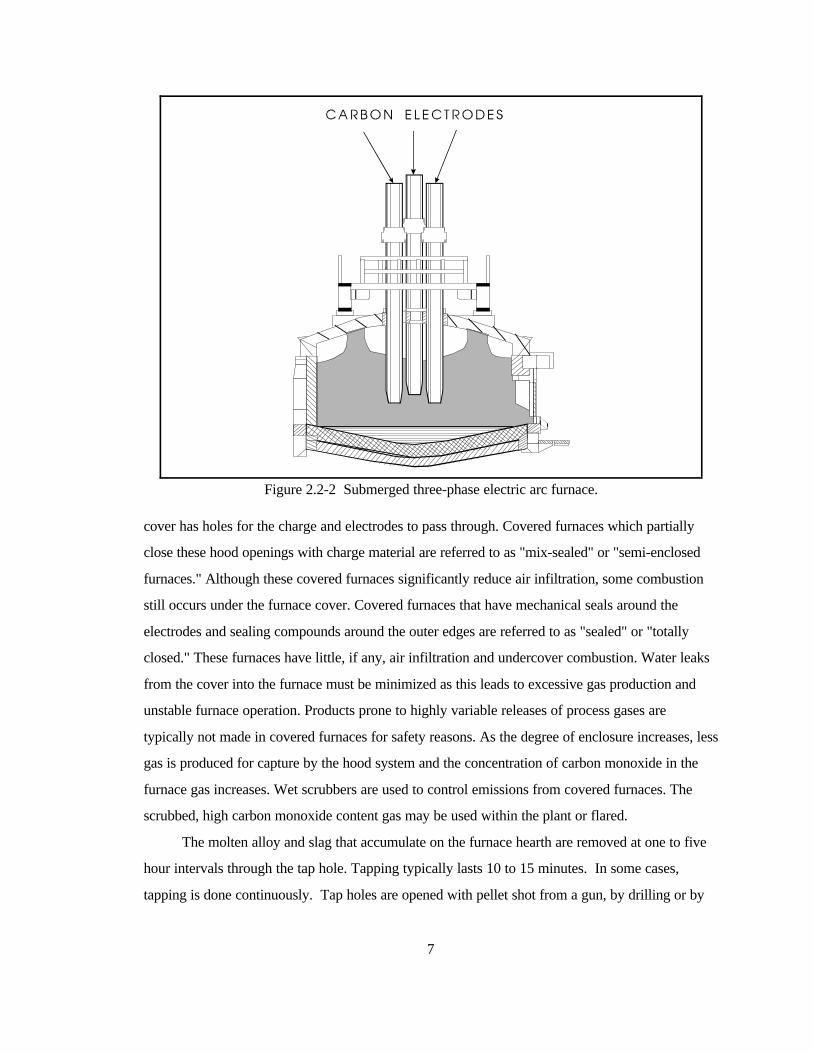
A typical submerged electric arc furnace design is depicted in Figure 2.2-2. The lower part
of the submerged electric arc furnace is composed of a cylindrical steel shell with a flat bottom or
hearth. The interior of the shell is lined with two or more layers of carbon blocks. The furnace shell
is water cooled to protect it from the heat of the process. A water-cooled cover and fume collection
hood are mounted over the furnace shell. Normally, three carbon electrodes arranged in a triangular
formation extend through the cover and into the furnace shell opening. Prebaked or self-baking
(Soderberg) electrodes ranging from 76 to over 100 centimeters (30 to over 40 inches) in diameter
are typically used. Raw materials are sometimes charged to the furnace through feed chutes from
above the furnace. The surface of the furnace charge, which contains both molten material and
unconverted charge during operation, is typically maintained near the top of the furnace shell. The
lower ends of the electrodes are maintained at about 1 to 2 meters (3 to 7 feet) below the charge
surface. Three-phase electric current arcs from electrode to electrode, passing through the charge
material. The charge material melts and reacts to form the desired product as the electric energy is
converted into heat. The carbonaceous material in the furnace charge reacts with oxygen in the
metal oxides of the charge and reduces them to base metals. The reactions produce large quantities
of carbon monoxide (CO) which passes upward through the furnace charge. The molten metal and
slag are removed (tapped) through one or more tap holes extending through the furnace shell at the
hearth level. Feed materials may be charged continuously or intermittently. Power is applied
continuously. Tapping is intermittent based on production rate of the furnace.
Submerged electric arc furnaces are of two basic types, open and covered. Most of the
submerged electric arc furnaces in the U.S. are open furnaces. Open furnaces have a fume
collection hood at least one meter (3.3 feet) above the top of the furnace shell. Moveable panels or
screens are sometimes used to reduce the open area between the furnace and hood, and to improve
emissions capture efficiency. Carbon monoxide rising through the furnace charge burns in the area
between the charge surface and the capture hood. This substantially increases the volume of gas
the containment system must handle. Additionally, the vigorous open combustion process entrains
finer material in the charge. Fabric filters are typically used to control emissions from open
furnaces.
Covered furnaces have a water-cooled steel cover which fits closely to the furnace shell. The
objective of covered furnaces is to reduce air infiltration into the furnace gases, which reduces
combustion of that gas. This reduces the volume of gas requiring collection and treatment. The
7
Figure 2.2-2 Submerged three-phase electric arc furnace.
cover has holes for the charge and electrodes to pass through. Covered furnaces which partially
close these hood openings with charge material are referred to as "mix-sealed" or "semi-enclosed
furnaces." Although these covered furnaces significantly reduce air infiltration, some combustion
still occurs under the furnace cover. Covered furnaces that have mechanical seals around the
electrodes and sealing compounds around the outer edges are referred to as "sealed" or "totally
closed." These furnaces have little, if any, air infiltration and undercover combustion. Water leaks
from the cover into the furnace must be minimized as this leads to excessive gas production and
unstable furnace operation. Products prone to highly variable releases of process gases are
typically not made in covered furnaces for safety reasons. As the degree of enclosure increases, less
gas is produced for capture by the hood system and the concentration of carbon monoxide in the
furnace gas increases. Wet scrubbers are used to control emissions from covered furnaces. The
scrubbed, high carbon monoxide content gas may be used within the plant or flared.
The molten alloy and slag that accumulate on the furnace hearth are removed at one to five
hour intervals through the tap hole. Tapping typically lasts 10 to 15 minutes. In some cases,
tapping is done continuously. Tap holes are opened with pellet shot from a gun, by drilling or by
8
oxygen lancing. The molten metal and slag flow from the tap hole into a carbon-lined trough, then
into a carbon-lined runner which directs the metal and slag into a reaction ladle, ingot molds, or
chills (chills are low, flat, iron or steel pans that provide rapid cooling of the molten metal). After
tapping is completed the furnace is resealed by inserting a carbon paste plug into the tap hole.
Chemistry adjustments may be necessary after furnace smelting to achieve a specified
product. Ladle treatment reactions are batch processes and may include metal and alloy additions.
During tapping, and/or in the reaction ladle, slag is skimmed from the surface of the molten
metal. It can be disposed of in landfills, sold as road ballast, or used as a raw material in a furnace
or reaction ladle to produce a chemically related ferroalloy product.
After cooling and solidifying, the large ferroalloy castings may be broken with drop weights
or hammers. The broken ferroalloy pieces are then crushed, screened (sized) and stored in bins
until shipment. In some instances, the alloys are stored in lump form in inventories prior to sizing
for shipping.
Exothermic (Metallothermic) Process
The exothermic process is generally used to produce high grade alloys with low carbon
content. The intermediate molten alloy used in the process may come directly from a submerged
electric arc furnace or from another type of heating device. Silicon or aluminum combines with
oxygen in the molten alloy, resulting in a sharp temperature rise and strong agitation of the molten
bath. Low- and medium-carbon content ferrochromium and ferromanganese are produced by
silicon reduction. Aluminum reduction is used to produce chromium metal, ferrotitanium,
ferrovanadium, and ferrocolumbium. Mixed alumino/silico thermal processing is used for
producing ferromolybdenum and ferrotungsten. Although aluminum is more expensive than carbon
or silicon, the products are purer. Low carbon (LC) ferrochromium is typically produced by fusing
chromium ore and lime in a furnace. A specified amount is then placed in a ladle (ladle No. 1). A
known amount of an intermediate grade ferrochromesilicon is then added to the ladle. The reaction
is extremely exothermic and liberates chromium from its ore, producing LC ferrochromium and a
calcium silicate slag. This slag, which still contains recoverable chromium oxide, is reacted in a
second ladle (ladle No. 2) with molten high carbon (HC) ferrochromesilicon to produce the
intermediate grade ferrochromesilicon. Exothermic processes are generally carried out in open
9
vessels and may have emissions similar to the submerged arc process for short periods while the
reduction is occurring.
Electrolytic Processes
Electrolytic processes are used to produce high purity manganese and chromium. As of
1989, there were two ferroalloy facilities using electrolytic processes.
Manganese may be produced by the electrolysis of an electrolyte extracted from manganese
ore or manganese bearing ferroalloy slag. Manganese ores contain close to 50 percent manganese;
furnace slag normally contains about 10 percent manganese. The process has five steps: 1) roasting
the ore to convert it to manganese oxide (MnO), 2) leaching the roasted ore with sulfuric acid
(H2SO4) to solubilize manganese, 3) neutralization and filtration to remove iron and aluminum
hydroxides, 4) purifying the leach liquor by treatment with sulfide and filtration to remove a wide
variety of metal, and 5) electrolysis.
Electrolytic chromium is generally produced from high carbon ferrochromium. A large
volume of hydrogen gas is produced by dissolving the alloy in sulfuric acid. The leachate is treated
with ammonium sulfate and conditioned to remove ferrous ammonium sulfate and produce a
chrome-alum for feed to the electrolysis cells. The electrolysis cells are well-ventilated to reduce
ambient hydrogen and hexavalent chromium concentrations in the cell rooms.
2.3 EMISSIONS AND CONTROLS
Particulate is generated from several activities during ferroalloy production, including raw
material handling, smelting, tapping and product handling. Organic materials are generated almost
exclusively from the smelting operation. The furnaces are the largest potential sources of
particulate and organic emissions. The emission factors are given in Tables 2.3-1.
Particulate emissions from electric arc furnaces in the form of fumes (smoke-like particles)
account for an estimated 94 percent of the total particulate emissions in the ferroalloy industry.
Large amounts of carbon monoxide and organic materials also are emitted by submerged electric
arc furnaces. Carbon monoxide is formed as a byproduct of the chemical reaction between oxygen
in the metal oxides of the charge and carbon contained in the reducing agent (coke, coal, etc.).
Reduction gases containing organic compounds and carbon monoxide continuously rise from the
high temperature reaction zone, entraining fine particles and fume precursors. The mass weight of
10
carbon monoxide produced sometimes exceeds that of the metallic product. The heat-induced fume
consists of oxides of the products being produced and carbon from the reducing agent. The fume is
enriched by silicon dioxide, calcium oxide, and magnesium oxide, if present in the charge.
In an open electric arc furnace, virtually all carbon monoxide and much of the organic
matter burns with induced air at the furnace top. The remaining fume, captured by hooding about
one meter above the furnace, is directed to a gas cleaning device. Fabric filter are used to control
emissions from 85 percent of the open furnaces in the U.S. Scrubbers are used on 13 percent of the
furnaces, and electrostatic precipitators on 2 percent.
Two emission capture systems, not usually connected to the same gas cleaning device, are
necessary for covered furnaces. A primary capture system withdraws gases from beneath the
furnace cover. A secondary system captures fume released around the electrode seals and during
tapping. Scrubbers are used almost exclusively to control exhaust gases from sealed furnaces. The
scrubbers capture a substantial percentage of the organic emissions, which are much greater for
covered furnaces than open furnaces. The gas from sealed and mix-sealed furnaces is usually
flared at the exhaust of the scrubber. The carbon monoxide rich gas is sometimes used as a fuel in
kilns and sintering machines. The efficiency of flares for the control of carbon monoxide and the
reduction of VOCs has been estimated to be greater than 98 percent. A gas heating reduction of
organic and carbon monoxide emissions is 98 percent efficient.
Tapping operations also generate fumes. Tapping is intermittent and is usually conducted
during 10 to 20 percent of the furnace operating time. Some fumes originate from the carbon lip
liner, but most are a result of induced heat transfer from the molten metal or slag as it contacts the
runners, ladles, casting beds and ambient air. Some plants capture these emissions to varying
degrees with a main canopy hood. Other plants employ
11
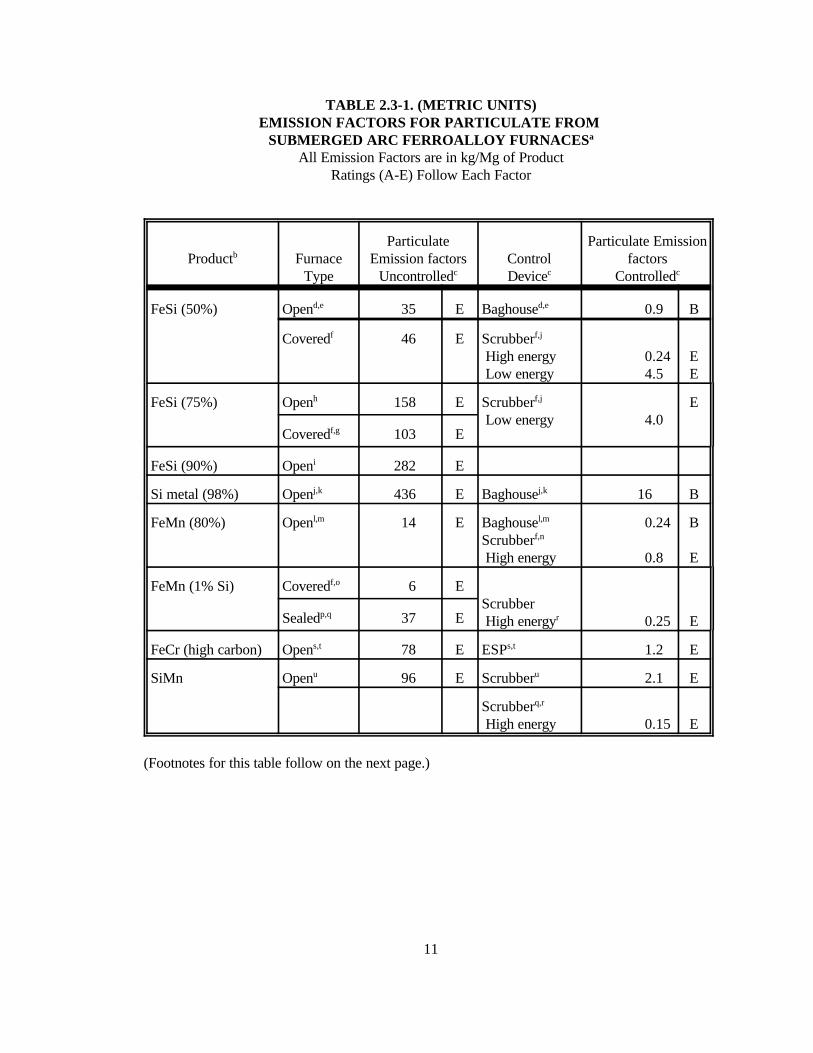
TABLE 2.3-1. (METRIC UNITS)EMISSION FACTORS FOR PARTICULATE FROM
SUBMERGED ARC FERROALLOY FURNACESa
All Emission Factors are in kg/Mg of ProductRatings (A-E) Follow Each Factor
Productb FurnaceType
ParticulateEmission factors
UncontrolledcControlDevicec
Particulate Emissionfactors
Controlledc
FeSi (50%) Opend,e 35 E Baghoused,e 0.9 B
Coveredf 46 E Scrubberf,j
High energy Low energy
0.244.5
EE
FeSi (75%) Openh 158 E Scrubberf,j
Low energy
4.0 E
Coveredf,g 103 E
FeSi (90%) Openi 282 E
Si metal (98%) Openj,k 436 E Baghousej,k 16 B
FeMn (80%) Openl,m 14 E Baghousel,m
Scrubberf,n
High energy
0.24
0.8
B
E
FeMn (1% Si) Coveredf,o 6 EScrubber High energyr 0.25 ESealedp,q 37 E
FeCr (high carbon) Opens,t 78 E ESPs,t 1.2 E
SiMn Openu 96 E Scrubberu 2.1 E
Scrubberq,r
High energy 0.15 E
(Footnotes for this table follow on the next page.)

12
Footnotes for Table 2.3-1 (Metric units)
a Factors are for main furnace dust collection system before and after control device. Where otheremissions, such as leaks or tapping, are included or quantified separately, such is noted.Particulate sources not included: raw material handling, storage, preparation; and productcrushing, screening, handling, packaging.
b Percentages are of the main alloying agent in product.c Low energy scrubbers are those with Î P < 20 in. H20; high energy with Î P > 20 in. H20.d Includes fumes captured by tapping hood (efficiency estimated at near 100%).e References 4, 10, 21.f References 4, 10.g Does not include emissions from tapping or mix seal leaks.h References 25-26.i Reference 23.j Estimated 60% of tapping emissions captured by control system (escaped fugitive emissions not
included in factor).k References 10, 13.l Estimated 50% of tapping emissions captured by control system (escaped fugitive emissions not
included in factor).m References 4, 10, 12.n Includes fume only from primary control system.o Includes tapping fumes and mix seal leak fugitive emissions. Fugitive emissions measured at
33% of total uncontrollable emissions.p Assumes tapping fumes not included in emission factor.q Reference 14.r Does not include tapping or fugitive emissions.s Tapping emissions included.t References 2, 15-17.u References 2, 18-19.

13
TABLE 2.3-1. (ENGLISH UNITS)EMISSION FACTORS FOR PARTICULATE FROM
SUBMERGED ARC FERROALLOY FURNACESa
All Emission Factors are in lb/ton of ProductRatings (A-E) Follow Each Factor
Productb FurnaceType
ParticulateEmission factors
UncontrolledcControlDevicec
Particulate Emissionfactors
Controlledc
FeSi (50%) Opend,e 70 E Baghoused,e 1.8 B
Coveredf 92 E Scrubberf,j
High energy Low energy
0.489.0
EE
FeSi (75%) Openh 316 E Scrubberf,j
Low energy
8.0 E
Coveredf,g 206 E
FeSi (90%) Openi 564 E
Si metal (98%) Openj,k 872 E Baghousej,k 32 B
FeMn (80%) Openl,m 28 E Baghousel,m
Scrubberf,n
High energy
0.48
1.6
B
E
FeMn (1% Si) Coveredf,o 12 EScrubber High energyr 0.5 ESealedp,q 74 E
FeCr (high carbon) Opens,t 157 E ESPs,t 2.4 E
SiMn Openu 192 E Scrubberu 4.2 E
Scrubberq,r
High energy 0.30 E
(See next page for footnotes.)

14
Footnotes for Table 2.3-1 (English units)
a Factors are for main furnace dust collection system before and after control device. Where otheremissions, such as leaks or tapping, are included or quantified separately, such is noted.Particulate sources not included: raw material handling, storage, preparation; and productcrushing, screening, handling, packaging.
b Percentages are of the main alloying agent in product.c Low energy scrubbers are those with Î P < 20 in. H20; high energy with Î P > 20 in. H20.dd Includes fumes captured by tapping hood (efficiency estimated at near 100%).ee References 4, 10, 21.f References 4, 10.g Does not include emissions from tapping or mix seal leaks.h References 25-26.i Reference 23.j Estimated 60% of tapping emissions captured by control system (escaped fugitive emissions not
included in factor).k References 10, 13.l Estimated 50% of tapping emissions captured by control system (escaped fugitive emissions not
included in factor).m References 4, 10, 12.n Includes fume only from primary control system.o Includes tapping fumes and mix seal leak fugitive emissions. Fugitive emissions measured at
33% of total uncontrollable emissions.p Assumes tapping fumes not included in emission factor.q Reference 14.r Does not include tapping or fugitive emissions.ss Tapping emissions included.t References 2, 15-17.u References 2, 18-19.
15
separate tapping hoods ducted to either the furnace emission control device or a separate control
device. No emission data for tapping operations are available, therefore, no emission factors are
presented.
After furnace tapping is completed, a reaction ladle may be used to adjust the metallurgy by
chlorination, oxidation, gas mixing and slag metal reactions. Ladle reactions are an intermittent
process, and emissions have not been quantified. Reaction ladle emissions are often captured by the
tapping emissions control system.
No available data are available to provide emission factors for raw material handling,
pretreatment and product handling. Dust particulate is emitted from raw material handling, storage
and preparation activities (see Figure 2.2-1). These activities include unloading raw materials from
delivery vehicles (ship, railway car or truck), storing raw materials in piles, loading raw materials
from storage piles into trucks or gondola cars and crushing and screening raw materials. Raw
materials may be dried before charging in rotary or other types of dryers, and these dryers can
generate significant particulate emissions. Dust may also be generated by heavy vehicles used for
loading, unloading and transferring material. Crushing, screening and storage of the ferroalloy
product emit particulate in the form of dust. The properties of particulate emitted as dust are
similar to the natural properties of the ores or alloys from which they originated, ranging in size
from 3 to 100 micrometers (µm).
Approximately half of all ferroalloy facilities have some type of control for dust emissions.
Dust generated from raw material storage may be controlled in several ways, including sheltering
storage piles from the wind with block walls, snow fences or plastic covers. Occasionally, piles are
sprayed with water to prevent airborne dust. Emissions generated by heavy vehicle traffic may be
reduced by using a wetting agent or paving the plant yard. Moisture in the raw materials, which
may be as high as twenty percent, helps to limit dust emissions from raw material unloading and
loading. Dust generated by crushing, sizing, drying or other pretreatment activities may be
controlled by dust collection equipment such as scrubbers, cyclones or fabric filter. Ferroalloy
product crushing and sizing usually require a fabric filter. The raw material emission collection
equipment may be connected to the furnace emission control system. For fugitive emissions from
open sources, see Section 11.2 of the AP-42 document.

16
2.4 REVIEW OF REFERENCES
Pacific Environmental Services (PES) contacted the following sources to obtain the most up-
to-date information on process descriptions and emissions for this industry:
1) Alabama Air Division, ADEM, Montgomery, AL.
2) Florida Department of Environmental Regulation, Tallahassee, FL.
3) Georgia Department of Natural Resources, Atlanta, GA.
4) Kansas Department of Health and Environment, Topeka, KS.
5) Michigan Department of Natural Resources, Lansing, MI.
6) Missouri Department of Natural Resources, Jefferson City, MO.
7) Pennsylvania Department of Environmental Resources, Harrisburg, PA.
No emission source tests were received from the parties contacted.
Process information was expanded using published EPA documents and Shreve's Chemical
Process Industries, fifth edition, McGraw Hill, 1984.
Emission factors shown in Table 2.3-1 are unchanged from the previous AP-42 section
(October 1986). However, PES has downgraded the ratings from "B" and "C" to an "E" rating,
with the one exception of SiMn (high energy scrubber). This change is discussed in detail in
Chapter 4.3.

17
2.5 REFERENCES FOR CHAPTER 2
1. F.J. Schottman, "Ferroalloys," 1980 Mineral Facts and Problems, Bureau of Mines, U.S.Department Of The Interior, Washington, DC, 1980.
2. J.O. Dealy, and A.M. Killin, Engineering and Cost Study of the Ferroalloy Industry, EPA-450/2-74-008, U.S. Environmental Protection Agency, Research Triangle Park, NC, May1974.
3. Background Information on Standards of Performance: Electric Submerged Arc Furnacesfor Production of Ferroalloys, Volume I: Proposed Standards, EPA-450/2-74-018a, U.S.Environmental Protection Agency, Research Triangle Park, NC, October 1974.
4. C.W. Westbrook, and D.P. Dougherty, Level I Environmental Assessment of ElectricSubmerged Arc Furnaces Producing Ferroalloys, EPA-600/2-81-038, U.S. EnvironmentalProtection Agency, Washington, DC, March 1981.
5. F.J. Schottman, "Ferroalloys," Minerals Yearbook, Volume I: Metals and Minerals, BureauOf Mines, Department Of The Interior, Washington, DC, 1980.
6. S. Beaton and H. Klemm, Inhalable Particulate Field Sampling Program for the FerroalloyIndustry, TR-80-115-G, GCA Corporation, Bedford, MA, November 1980.
7. G.W. Westbrook and D.P. Dougherty, Environmental Impact of Ferroalloy ProductionInterim Report: Assessment of Current Data, Research Triangle Institute, Research TrianglePark, NC, November 1978.
8. K. Wark and C.F. Warner, Air Pollution: Its Origin and Control, Harper and Row, NewYork, 1981.
9. M. Szabo and R. Gerstle, Operations and Maintenance of Particulate Control Devices onSelected Steel and Ferroalloy Processes, EPA-600/2-78-037, U.S. Environmental ProtectionAgency, Washington, DC, March 1978.
10. C.W. Westbrook, Multimedia Environmental Assessment of Electric Submerged ArcFurnaces Producing Ferroalloys, EPA-600/2-83-092, U.S. Environmental ProtectionAgency, Washington, DC, September 1983.
11. S. Gronberg, et al., Ferroalloy Industry Particulate Emissions: Source Category Report,EPA-600/7-86-039, U.S. Environmental Protection Agency, Cincinnati, OH, November1986.
12. T. Epstein, et al., Ferroalloy Furnace Emission Factor Development, Roane Limited,Rockwood, Tennessee, EPA-600/X-85-325, U.S. Environmental Protection Agency,Washington, DC, June 1981.
18
13. S. Beaton, et al., Ferroalloy Furnace Emission Factor Development, Interlake Inc., AlabamaMetallurgical Corp., Selma, Alabama, EPA-600/X-85-324, U.S. Environmental ProtectionAgency, Washington, DC, May 1981.
14. J.L. Rudolph, et al., Ferroalloy Process Emissions Measurement, EPA-600/2-79-045, U.S.Environmental Protection Agency, Washington, DC, February 1979.
15. Written communication from Joseph F. Eyrich, Macalloy Corporation, Charleston, SC toGCA Corporation, Bedford, MA, February 10, 1982, citing Airco Alloys and Carbide testR-07-7774-000-1, Gilbert Commonwealth, Reading, PA, 1978.
16. Source test, Airco Alloys and Carbide, Charleston, DC, EMB-71-PC-16(FEA), U.S.Environmental Protection Agency, Research Triangle Park, NC, 1971.
17. Telephone communication between Joseph F. Eyrich, Macalloy Corporation, Charleston, SCand Evelyn J. Limberakis, GCA Corporation, Bedford, MA, February 23, 1982.
18. Source test, Chromium Mining and Smelting Corporation, Memphis, TN, EMB-72-PC-05(FEA), U.S. Environmental Protection Agency, Research Triangle Park, NC, June 1972.
19. Source test, Union Carbide Corporation, Ferroalloys Division, Marietta, Ohio, EMB-71-PC-12 (FEA), U.S. Environmental Protection Agency, Research Triangle Park, NC, 1971.
20. R.A. Person, "Control of Emissions from Ferroalloy Furnace Processing," Journal OfMetals, 23(4):17-29, April 1971.
21. S. Gronberg, Ferroalloy Furnace Emission Factor Development Foote Minerals, Graham,W. Virginia, EPA-600/X-85-327, U.S. Environmental Protection Agency, Washington, DC,July 1981.
22. R.W. Gerstle, et al., Review of Standards of Performance for New Stationary Air Sources:Ferroalloy Production Facility, EPA-450/3-80-041, U.S. Environmental Protection Agency,Research Triangle Park, NC, December 1980.
23. Air Pollutant Emission Factors, Final Report, APTD-0923, U.S. Environmental ProtectionAgency, Research Triangle Park, NC, April 1970.
24. Telephone communication between Leslie B. Evans, Office Of Air Quality Planning andStandards, U.S. Environmental Protection Agency, Research Triangle Park, NC, andRichard Vacherot, GCA Corporation, Bedford, MA, October 18, 1984.
25. R. Ferrari, Experiences in Developing an Effective Pollution Control System for aSubmerged Arc Ferroalloy Furnace Operation, J. Metals, p. 95-104, April 1968.
26. Fredriksen and Nestas, Pollution Problems by Electric Furnace Ferroalloy Production,United Nations Economic Commission for Europe, September 1968.
19
27. A.E. Vandergrift, et al., Particulate Pollutant System Study—Mass Emissions, PB-203-128,PB-203-522 and P-203-521, National Technical Information Service, Springfield, VA, May1971.
28. Control Techniques for Lead Air Emissions, EPA-450/2-77-012, U.S. EnvironmentalProtection Agency, Research Triangle Park, NC, December 1977.
29. W.E. Davis, Emissions Study of Industrial Sources of Lead Air Pollutants, 1970, EPA-APTD-1543, W.E. Davis and Associates, Leawood, KS, April 1973.
30. Source Test, Foote Mineral Company, Vancoram Operations, Steubenville, OH, EMB-71-PC-08 (FEA), U.S. Environmental Protection Agency, Research Triangle Park, NC, August1971.
31. C.R. Neuharth, "Ferroalloys," Minerals Yearbook, Volume I: Metals and Minerals, Bureauof Mines, Department of The Interior, Washington, DC, 1989.
32. C.W. Westbrook and D.P. Daugherty, Environmental Impact of Ferroalloy ProductionInterim Report: Assessment of Current Data, Research Triangle Institute, Research TrianglePark, NC, November 1978.
33. N. Irving Sox and R.J. Lewis, Sr., Hawley's Condensed Chemical Dictionary, Van NostrandReinhold Company, Inc., Eleventh Edition, 1987.
34. Theodore Baumeister, Mark's Standard Handbook for Mechanical Engineers, McGraw-Hill,Eighth Edition, 1978.
20
3.0 GENERAL EMISSION DATA REVIEW AND ANALYSIS PROCEDURES
3.1 LITERATURE SEARCH AND SCREENING SOURCE TESTS
The first step in the investigative process involved a search of available literature relating to
criteria and noncriteria pollutant emissions associated with ferroalloy production. This search
included, but was not limited to the following references:
1) AP-42 background files maintained by the Emission Factor and Methodologies
Section. This is the source of the five air tests that are reviewed below.
2) Files maintained by the Emission Standards Division. No files are available at this
time.
3) "PM10 Emission Factor Listing Developed by Technology Transfer" (EPA-450/4-89-
022). Reviewed but not used due to uncertain quality of data.
4) Background Information Documents for NSPS and NESHAPS. No complete
emission source tests included in the documents reviewed.
5) Information in the Air Facility Subsystems (AFS) of the EPA Aerometric Information
Retrieval System (AIRS). Boxes of computer printouts were reviewed under other
AP-42 metallurgical sections. PES was unable to retrieve any useful information for
this application.
6) Handbook of Emission Factors, Parts I and II, Ministry of Health and Environmental
Protection, The Netherlands, 1980/1983. This information substantiated existing AP-
42 Section information. No actual emission test data available.
7) The EPA Clearinghouse for Inventories and Emission Factors (CHIEF). CHIEF
referenced emission source data as coming from AP-42. No new information.
8) The EPA databases, including Speciation Database Management System
(SPECIATE), the Crosswalk/Air Toxic Emission Factor Data Base Management
System (XATEF). Both of these database systems were reviewed without tangible
benefits.
9) A literature search was conducted in the Duke University library, including a
computer network search of the University of North Carolina and the North Carolina
State University. In addition, the USEPA Environmental Research Center library was
21
visited in an attempt to get primary emission source tests for ferroalloy production
facilities.
To reduce the amount of literature collected to a final group of references pertinent to this
report, the following general criteria were used:
1. Emissions data must be from a primary reference, i.e. the document must constitute
the original source of test data. For example, a technical paper was not included if the
original study was contained in the previous document.
2. The referenced study must contain test results based on more than one test run.
3. The report must contain sufficient data to evaluate the testing procedures and source
operating conditions (e.g., one-page reports were generally rejected).
If no primary data was found and the previous update utilized secondary data, this
secondary data was still used and the Emission Factor Rating lowered if needed. A final set of
reference materials was compiled after a thorough review of the pertinent reports, documents, and
information according to these criteria. The final set of reference materials is given in Chapter 4.0.
3.2 EMISSION DATA QUALITY RATING SYSTEM
As part of Pacific Environmental Services' analysis of the emission data, the quantity and
quality of the information contained in the final set of reference documents were evaluated. The
following data were always excluded from consideration.
1. Test series averages reported in units that cannot be converted to the selected
reporting units;
2. Test series representing incompatible test methods (i.e., comparison of the EPA
Method 5 front-half with the EPA Method 5 front- and back-half);
3. Test series of controlled emissions for which the control device is not specified;
4. Test series in which the source process is not clearly identified and described; and
5. Test series in which it is not clear whether the emissions were measured before or
after the control device.
22
Data sets that were not excluded were assigned equality rating. The rating system used was
that specified by the OAQPS for the preparation of AP-42 sections. The data were rated as
follows:
A
Multiple tests performed on the same source using sound methodology and reported in
enough detail for adequate validation. These tests do not necessarily conform to the
methodology specified in either the inhalable particulate (IP) protocol documents or the EPA
reference test methods, although these documents and methods were certainly used as a
guide for the methodology actually used.
B
Tests that were performed by a generally sound methodology but lack enough detail for
adequate validation.
C
Tests that were based on an untested or new methodology or that lacked a significant
amount of background data.
D
Tests that were based on a generally unacceptable method but may provide an order-of-
magnitude value for the source.
The following criteria were used to evaluate source test reports for sound methodology and
adequate detail:
1. Source operation. The manner in which the source was operated is well documented
In the report. The source was operating within typical parameters during the test.
2. Sampling procedures. The sampling procedures conformed to a generally acceptable
methodology. If actual procedures deviated from accepted methods, the deviations are
well documented. When this occurred, an evaluation was made of the extent such
alternative procedures could influence the test results.
3. Sampling and process data. Adequate sampling and process data are documented in
the report. Many variations can occur unnoticed and without warning during testing.
Such variations can induce wide deviations in sampling results. If a large spread
23
between test results cannot be explained by information contained in the test report,
the data are suspect and were given a lower rating.
4. Analysis and calculations. The test reports contain original raw data sheets. The
nomenclature and equations used were compared to those (if any) specified by the
EPA to establish equivalency. The depth of review of the calculations was dictated by
the reviewer's confidence in the ability and conscientiousness of the tester, which in
turn was based on factors such as consistency of results and completeness of other
areas of the test report.
3.3 EMISSION FACTOR QUALITY RATING SYSTEM
The quality of the emission factors developed from analysis of the test data was rated
utilizing the following general criteria:
A (Excellent)
Developed only from A-rated test data taken from many randomly chosen facilities in the
industry population. The source category is specific enough so that variability within the
source category population may be minimized.
B (Above average)
Developed only from A-rated test data from a reasonable number of facilities. Although no
specific bias is evident, it is not clear if the facilities tested represent a random sample of the
industries. As in the A-rating, the source category is specific enough so that variability
within the source category population may be minimized.
C (Average)
Developed only from A- and B-rated test data from a reasonable number of facilities.
Although no specific bias is evident, it is not clear if the facilities tested represent a random
sample of the industry. As in the A-rating, the source category is specific enough so that
variability within the source category population may be minimized.
D (Below average)
The emission factor was developed only from A- and B-rated test data from a small number
of facilities, and there is reason to suspect that these facilities do not represent a random
sample of the industry. There also may be evidence of variability within the source category
24
population. Limitations on the use of the emission factor are noted in the emission factor
table.
E (Poor)
The emission factor was developed from C- and D-rated test data, and there is reason to
suspect that the facilities tested do not represent a random sample of the industry. There also
may be evidence of variability within the source category population. Limitations on the use
of these factors are always noted.
The use of these criteria is somewhat subjective and depends to an extent on the individual
reviewer.
25
3.4 REFERENCES FOR CHAPTER 3
1. Technical Procedures for Developing AP-42 Emission Factors and Preparing AP-42Sections. U.S. Environmental Protection Agency, Emission Inventory Branch, Office of AirQuality Planning and Standards, Research Triangle Park, NC, 27711, April, 1992. [Note:this document is currently being revised at the time of this printing.]
2. AP-42, Supplement A, Appendix C.2, "Generalized Particle Size Distributions." U.S.Environmental Protection Agency, October, 1986.
26
4.0 POLLUTANT EMISSION FACTOR DEVELOPMENT
4.1 CRITERIA POLLUTANT EMISSIONS DATA
Volatile Organic Compounds.
No data on emissions of these pollutants were found for the ferroalloy process.
Lead.
No data on emissions of these pollutants were found for the ferroalloy process.
Sulfur dioxide.
No data on emissions of these pollutants were found for the ferroalloy process.
Nitrogen oxides.
No data on emissions of these pollutants were found for the ferroalloy process.
Carbon monoxide.
No data on emissions of these pollutants were found for the ferroalloy process.
Total Suspended Particulate & PM10.
PM10 is a subset of total suspended particulate (TSP) and consists of particles having a
diameter of less than ten microns (µm). There is no single method which is universally accepted for
the determination of particle size. A number of different techniques can be used which measure the
size of particles according to their basic physical properties. Since there is no "standard" method
for particle size analysis, a certain degree of subjective evaluation was used to determine if a test
series was performed using a sound methodology for particle sizing.
For pollution studies, the most common types of particle sizing instruments are cyclones,
rotoclones, and cascade impactors. Traditionally, cyclones and rotoclones have been used as a
preseparator ahead of a cascade impactor to remove the larger particles. These devices are of the
standard reverse-flow design whereby the flue gas enters the cyclone through a tangential inlet and
forms a vortex flow pattern. Particles move outward toward the cyclone wall with a velocity that is
determined by the geometry and flow rate in the cyclone and by their size. Large particles reach the
27
wall and are collected. A series of cyclones with progressively decreasing cut-points can be used to
obtain particle size distributions.
Cascade impactors used for the determination of particle size in process streams consist of a
series of plates or stages containing either small holes or slits with the size of the openings
decreasing from one plate to the next. In each stage of an impactor, the gas stream passes through
the orifice or slit to form a jet directed toward an impaction plate. For each stage, there is a
characteristic particle diameter that has a 50 percent probability of impaction. This characteristic
diameter is called the cut-point (D50) of the stage. Typically, commercial instruments have six to
eight impaction stages with a backup filter to collect those particles which are either too small to be
collected by the last stage or which are re-entrained off he various impaction surfaces by the
moving gas stream.
Table 4.1-1 was developed from five source tests and studies of past source test and
published in earlier editions of AP-42, Section 4.4 (October 1986). Pacific Environmental Services
reviewed the five source tests referenced by the table and found them to be technically unsound due
to a variety of problems that are discussed in detail in Chapter 4. The most basic problem is related
to the baghouse structure. There is no stack to consolidate and direct exhaust gases after the
exhaust gases have been filtered. As a result, measuring isokinetic flow in the baghouse plenum
chamber above the fabric filters proved impossible, resulting in a low confidence level regarding
test information data. PES is including the results of these source tests and studies with the
knowledge that even the order-of-magnitude of emissions may be in error.

28
TABLE 4.1-1 (METRIC UNITS)SIZE-SPECIFIC EMISSION FACTORS FOR
SUBMERGED ARC FERROALLOY FURNACESAll Emission Factors are in kg/Mg of Product
Ratings (A-E) Follow Each Factor
Product SCC'sControlDevice
ParticleSize (µm)
CumulativePercentage
Cumulative massemission factor
EmissionFactorrating
50% FeSiOpen furnace
30300601 Noneb,c 0.631.001.252.506.00
10.0015.0020.00
d
4550535761636669
100
161819202122232435
E
30300601 Baghouse 0.631.001.252.506.00
10.0015.0020.00
3139445463728085
100
0.280.350.400.490.570.650.720.770.90
E
80% FeMnOpen furnace
30300606 Nonee,f 0.631.001.252.506.00
10.0015.0020.00
d
3046526272869697
100
4789
1012131414
E
30300606 Baghousee 0.631.001.252.506.00
10.0015.0020.00
d
2030354967839297
100
0.0240.0350.0430.0600.0800.1000.1100.1180.120
E
29
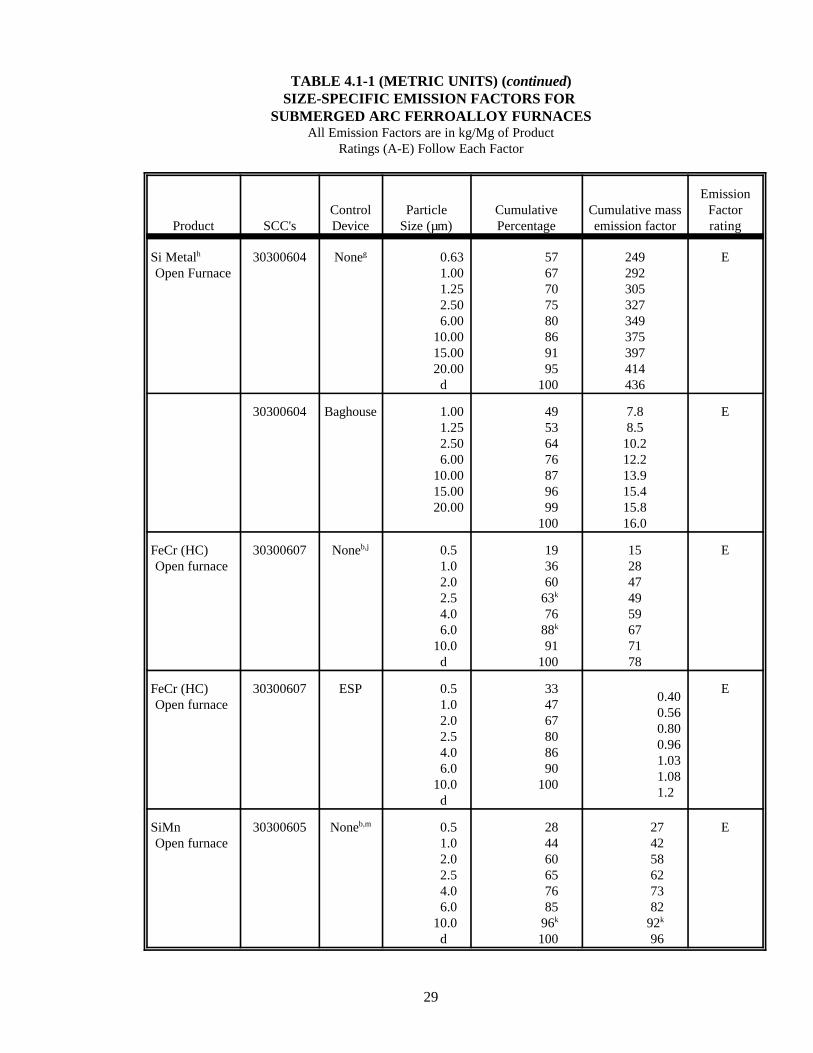
TABLE 4.1-1 (METRIC UNITS) (continued)SIZE-SPECIFIC EMISSION FACTORS FOR
SUBMERGED ARC FERROALLOY FURNACESAll Emission Factors are in kg/Mg of Product
Ratings (A-E) Follow Each Factor
Product SCC'sControlDevice
ParticleSize (µm)
CumulativePercentage
Cumulative massemission factor
EmissionFactorrating
Si Metalh
Open Furnace30300604 Noneg 0.63
1.001.252.506.00
10.0015.0020.00
d
5767707580869195
100
249292305327349375397414436
E
30300604 Baghouse 1.001.252.506.00
10.0015.0020.00
49536476879699
100
7.88.5
10.212.213.915.415.816.0
E
FeCr (HC)Open furnace
30300607 Noneb,j 0.51.02.02.54.06.0
10.0d
193660
63k
7688k
91100
1528474959677178
E
FeCr (HC)Open furnace
30300607 ESP 0.51.02.02.54.06.0
10.0d
334767808690
100
0.400.560.800.961.031.081.2
E
SiMnOpen furnace
30300605 Noneb,m 0.51.02.02.54.06.0
10.0d
284460657685
96k
100
274258627382
92k
96
E
30
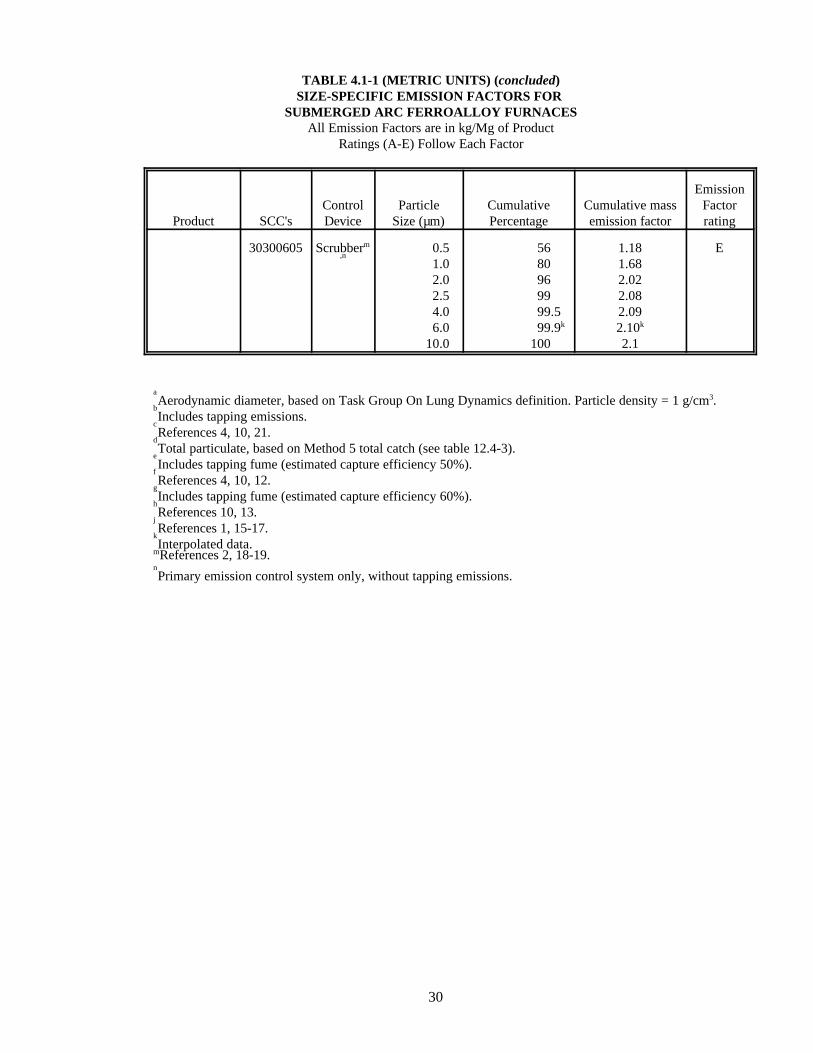
TABLE 4.1-1 (METRIC UNITS) (concluded)SIZE-SPECIFIC EMISSION FACTORS FOR
SUBMERGED ARC FERROALLOY FURNACESAll Emission Factors are in kg/Mg of Product
Ratings (A-E) Follow Each Factor
Product SCC'sControlDevice
ParticleSize (µm)
CumulativePercentage
Cumulative massemission factor
EmissionFactorrating
30300605 Scrubberm,n
0.51.02.02.54.06.0
10.0
5680969999.599.9k
100
1.181.682.022.082.092.10k
2.1
E
aAerodynamic diameter, based on Task Group On Lung Dynamics definition. Particle density = 1 g/cm3.
bIncludes tapping emissions.
cReferences 4, 10, 21.
dTotal particulate, based on Method 5 total catch (see table 12.4-3).
eIncludes tapping fume (estimated capture efficiency 50%).
f References 4, 10, 12.
gIncludes tapping fume (estimated capture efficiency 60%).
hReferences 10, 13.
j References 1, 15-17.
kInterpolated data.
mReferences 2, 18-19.nPrimary emission control system only, without tapping emissions.
31
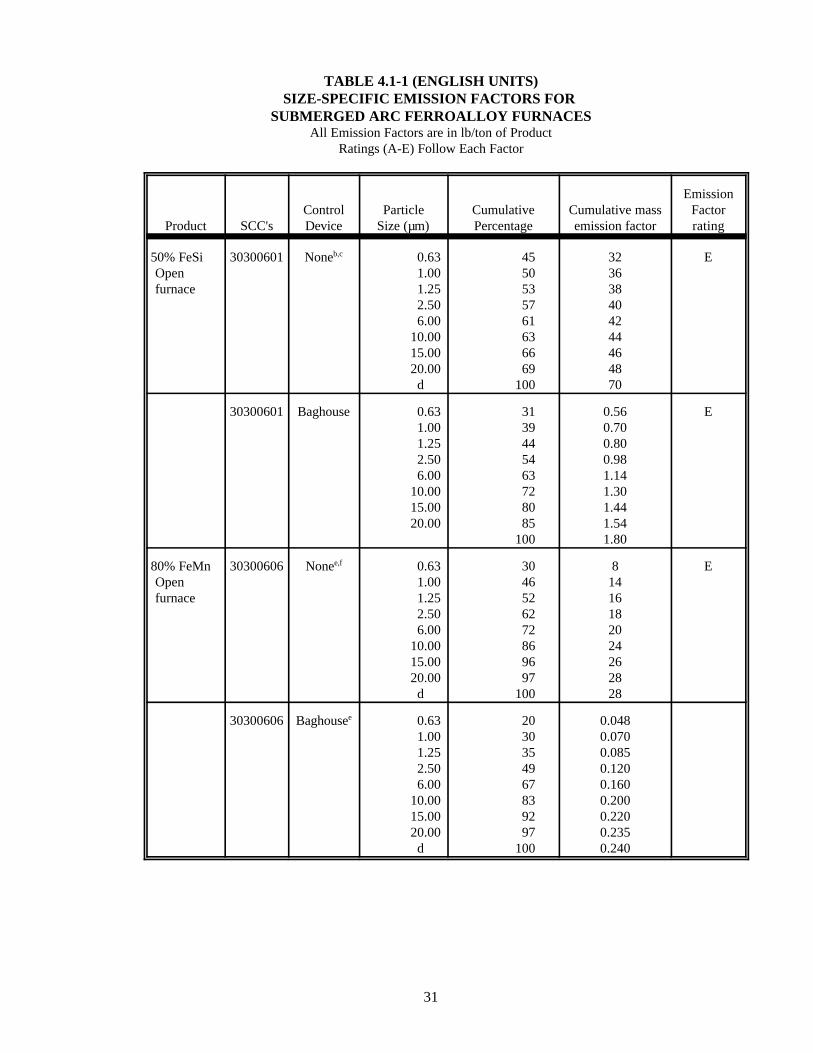
TABLE 4.1-1 (ENGLISH UNITS)SIZE-SPECIFIC EMISSION FACTORS FOR
SUBMERGED ARC FERROALLOY FURNACESAll Emission Factors are in lb/ton of Product
Ratings (A-E) Follow Each Factor
Product SCC'sControlDevice
ParticleSize (µm)
CumulativePercentage
Cumulative massemission factor
EmissionFactorrating
50% FeSiOpenfurnace
30300601 Noneb,c 0.631.001.252.506.00
10.0015.0020.00
d
4550535761636669
100
323638404244464870
E
30300601 Baghouse 0.631.001.252.506.00
10.0015.0020.00
3139445463728085
100
0.560.700.800.981.141.301.441.541.80
E
80% FeMnOpenfurnace
30300606 Nonee,f 0.631.001.252.506.00
10.0015.0020.00
d
3046526272869697
100
81416182024262828
E
30300606 Baghousee 0.631.001.252.506.00
10.0015.0020.00
d
2030354967839297
100
0.0480.0700.0850.1200.1600.2000.2200.2350.240

32
TABLE 4.1-1 (ENGLISH UNITS) (continued)SIZE-SPECIFIC EMISSION FACTORS FOR
SUBMERGED ARC FERROALLOY FURNACESAll Emission Factors are in lb/ton of Product
Ratings (A-E) Follow Each Factor
Product SCC'sControlDevice
ParticleSize (µm)
CumulativePercentage
Cumulativemass emission
factor
EmissionFactor rating
Si Metalh
OpenFurnace
30300604 Noneg 0.631.001.252.506.00
10.0015.0020.00
d
5767707580869195
100
498584610654698750794828872
E
30300604 Baghouse 1.001.252.506.00
10.0015.0020.00
49536476879699
100
15.617.020.424.427.830.831.632.0
E
FeCr (HC)Open furnace
30300607 Noneb,j 0.51.02.02.54.06.0
10.0d
193660
63k
7688k
91100
30569498118134142156
E
FeCr (HC)Open furnace
30300607 ESP 0.51.02.02.54.06.0
10.0d
334767808690
100
0.80 1.12 1.60 1.92 2.06 2.16 2.40
E
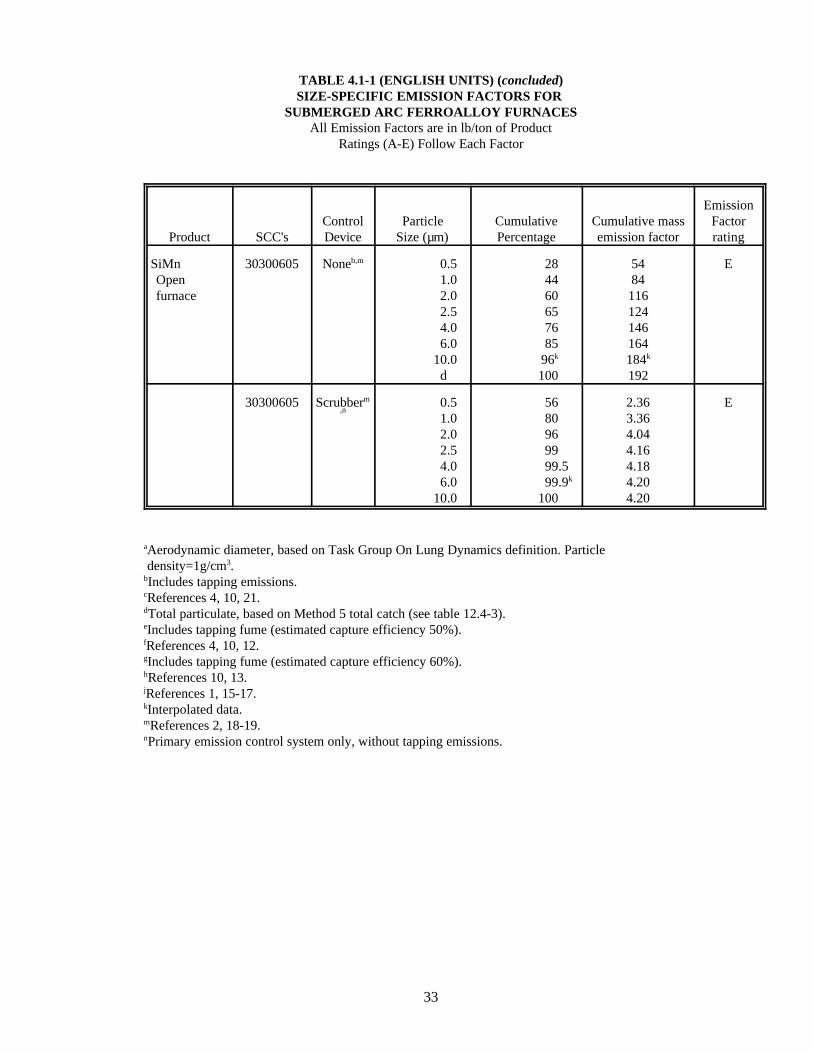
33
TABLE 4.1-1 (ENGLISH UNITS) (concluded)SIZE-SPECIFIC EMISSION FACTORS FOR
SUBMERGED ARC FERROALLOY FURNACESAll Emission Factors are in lb/ton of Product
Ratings (A-E) Follow Each Factor
Product SCC'sControlDevice
ParticleSize (µm)
CumulativePercentage
Cumulative massemission factor
EmissionFactorrating
SiMnOpenfurnace
30300605 Noneb,m 0.51.02.02.54.06.0
10.0d
284460657685
96k
100
5484116124146164184k
192
E
30300605 Scrubberm,n
0.51.02.02.54.06.0
10.0
5680969999.599.9k
100
2.363.364.044.164.184.204.20
E
aAerodynamic diameter, based on Task Group On Lung Dynamics definition. Particle density=1g/cm3.bIncludes tapping emissions.cReferences 4, 10, 21.dTotal particulate, based on Method 5 total catch (see table 12.4-3).eIncludes tapping fume (estimated capture efficiency 50%).fReferences 4, 10, 12.gIncludes tapping fume (estimated capture efficiency 60%).hReferences 10, 13.jReferences 1, 15-17.kInterpolated data.mReferences 2, 18-19.nPrimary emission control system only, without tapping emissions.
34
4.2 NONCRITERIA POLLUTION EMISSION DATA
Hazardous Air Pollutants.
Hazardous Air Pollutants (HAPs) are defined in the 1990 Clean Air Act Amendments. No
data on emissions of these pollutants were found for the ferroalloy process.
Global Warming Gases.
Pollutants such as methane, carbon dioxide, and N2O have been found to contribute to
overall global warming. No data on emissions of these pollutants were found for the ferroalloy
process.
Ozone Depletion Gases.
Chlorofluorocarbons have been found to contribute to ozone depletion. No data on emissions
of these pollutants were found for the ferroalloy process.
4.3 REVIEW OF SPECIFIC DATA SETS
Five source tests and past studies are listed in the table and used to develop the emission
factors published in the past edition of AP-42, Section 12.4, "Ferroalloy Production" (October
1986). These source tests have been reviewed by PES, using the guidelines discussed in Section 3.2
(Emission Data Quality Rating System). All five of the source tests are rated "D" due to technical
problems involving isokinetic flows, poor source collecting points due to control equipment design
and space limitations, utility outages during the test period, instruments becoming clogged during
testing, and a lack of production data in "real time" to enable accurate emission factors. The six
studies also used as references in Table 4.1-1 have not been reviewed. However, the five source
tests are discussed in detail below.
Reference 2: Ferroalloy Furnace Emission Factor Development, Roane Limited, Rockwood,
Tennessee
Two ferroalloy furnaces, sharing a common fabric filter (baghouse), were tested from
February 10 through February 12, 1981 by GCA Corporation for particulate controlled using a
fabric filter. Furnaces #3 and #4, open submerged electric arc furnaces, were producing
ferromanganese during testing. Pacific Environmental Services has completed a review of the
report. A problem is reported in the test results concerning an inability to gather flow rates leaving
the control device due to physical limitations at the test site. A disclaimer is made in the summary
of results and conclusions, stating that "an emission factor based on the average of all outlet tests
35
results should be considered one complete test run and since very little confidence can be applied to
the results of one test, the emission factor should only be considered an estimate."
Therefore, PES has reported the emission factors in this revision with a rating of "E." These
stack test results, although flawed, represent the best available information on particulate emission
from open submerged electric arc furnaces producing ferromanganese. The primary and most
damaging discrepancy in the testing procedures involves particulate collection after the control
device. The exit flow rates had to be calculated from measured entry velocities, and exit particulate
capture was made above several filters bags during each run. No velocity reading was made in the
plenum chamber where exit particulates were sampled. Without exit velocity readings, isokinetic
velocity was not available, disallowing confidence in exit samples collected. Additional unrelated
problems recorded during the stack tests includes pulling 20 ft3 of sample gases instead of 30 ft3
through a method 5 test filter train and the collection of air samples at the low end and below the
isokinetic velocity range of 90 to 110 percent. Actual isokinetic readings were taken at 87.9, 90.4,
92.8, 92.9, 93.6, and 92.5 percent.
Reference 3: Union Carbide Corporation, Ferroalloys Division, Marietta, Ohio
This series of stack tests was performed in 1971. Its purpose was to measure and size
particulate and to measure SO2 emissions from a silico-manganese ferroalloy operation. The
control device are two high energy venturi-type scrubbers leading to a single exhaust stack.
Problems during testing included electrical outages, poor sample port location dictated by the duct
design, filters clogging up within a few minutes and the isometric velocity could not be accurately
measured. The results of this series of tests have been reported in Section 12.4 Ferroalloy
Production. However, due to testing problems, the emission factor for this data has been reduced
from a "C" to an "E."
Reference 4: Ferroalloy Furnace Emission Factor Development, Interlake Inc., Alabama
Metallurgical Corp., Selma, Alabama
This series of stack tests were performed in March, 1981. Its purpose was to measure and
size particulate emissions from a 47 percent ferrosilicon operation, controlled by a baghouse
(fabric filter). The test lacked data to establish Methods 1-4. In addition, particulate readings for
the air stream entering the fabric filter are not reliable because "the impactor nozzle was in the
wake of the cyclone during the run." In addition, particulate measurements for the control device
exit are of suspect value as the "nozzles were turned perpendicular to the assumed direction of flow
all the time."
36
Particulate emission rates, controlled by the fabric filter, were sampled inside the baghouse
plenum chamber where no isokinetic readings were possible. Such information is of interest for
comparison with other similarly designed units, but does not provide an accurate emission rate.
Reference 5: Source Test, Foote Mineral Company, Vancoram Operations, Steubenville, OH
This series of stack tests were performed in September, 1971. Its purpose was to measure
and size particulate emissions from a high carbon ferrochrome ferroalloy operation that used an
open submerged electric arc furnace. The control device is a baghouse (fabric filter). Several
technical problems during the field work were identified. The most important discrepancy is the
lack of production rates during the testing periods. There was an unexplained seven percent
increase in flow rate exiting the baghouse than entered it on two of the test runs (#1 and #3). Duct
design and location made locating and gathering accurate data difficult, as there was little or no
straight flow of the gas stream prior to measurements. Also, based upon prior experience with
similar applications, plugging of the filters was anticipated. Precautions taken during the first run
were found not to be needed. No explanation was reported to account for this lack of filters
plugging up.
Reference 6: Source test, Airco Alloys and Carbide, Charleston, SC
Only the summary of results is available for this test. Three test runs were performed at the
inlet ducts and stack exhaust of a furnace equipped with electrostatic precipitator (ESP). The test
was performed to determine both particulate and sulfur dioxide (SO2) emissions. Some technical
problems were found during the test. Particulate emission rate at the exhaust outlet for Run 1 is
significantly high. The problem apparerntly relates to a furnace blow which reduced the effect of
the conditioning tower which in turn affected the efficiency of the ESP. It was also found that the
SO2 concentration for Run 2 was in error and not included in the average. Due to lack of test
information, the validity of the test methodology cannot be determined.
4.4 DATA GAP ANALYSIS
Information available on emissions from ferroalloy production is currently general in nature,
chronologically old, and suffers from a lack of demonstrated accuracy. No new emission factors
have been developed. Although ferroalloy production has had heavy foreign competition during the
past 14 years, resulting in a 44 percent reduction in U.S. production, more accurate and concise
emission factors need to be determined.
In order to maximize source testing resources, the following is a prioritized list of sources,
along with their emissions and normally used control equipment. For example, submerged electric
37
arc furnaces are believed to generate 94 percent of the total particulate emissions and almost all of
the organic emissions resulting from ferroalloy production. Closed electric arc furnaces generated
larger amounts of organic emissions than open electric arc furnaces. Therefore, closed electric arc
furnaces have the highest priority to be tested.
• Closed furnaces
• Open furnaces
• Tapping operations
• Exothermic reaction
• Fugitive emissions
Closed Furnace
Closed furnaces generate large amounts of organic compounds and carbon monoxide. The
fumes consists of oxides of the products being produced and carbon. Scrubbers are used almost
exclusively to control exhaust gases from sealed furnaces with a flare at the exhaust of the
scrubber.
Open furnace
The fumes are consistent with those generated by closed furnaces. Most if not all of the
carbon monoxide and organic compounds burns with induced air at the furnace top. Testing for the
products of that combustion may be important. Fabric filters, scrubbers, and electrostatic
precipitators are used to control emissions from open furnaces in the U.S.
Tapping operations
Tapping operations generate fumes. The emissions are captured and controlled by the
furnace control device or a separate control device.
Exothermic reaction
Fumes are a result of chlorination, oxidation, gas mixing and slag metal reactions.
Emissions are often captured by the tapping emissions control system or a dedicated control device.
Fugitive Emissions
Emission factors for raw material handling, pretreatment and product handling during
ferroalloy production are expected to be closely matched in both size distribution and volume to
similar operations used by other metallurgical industries.
38
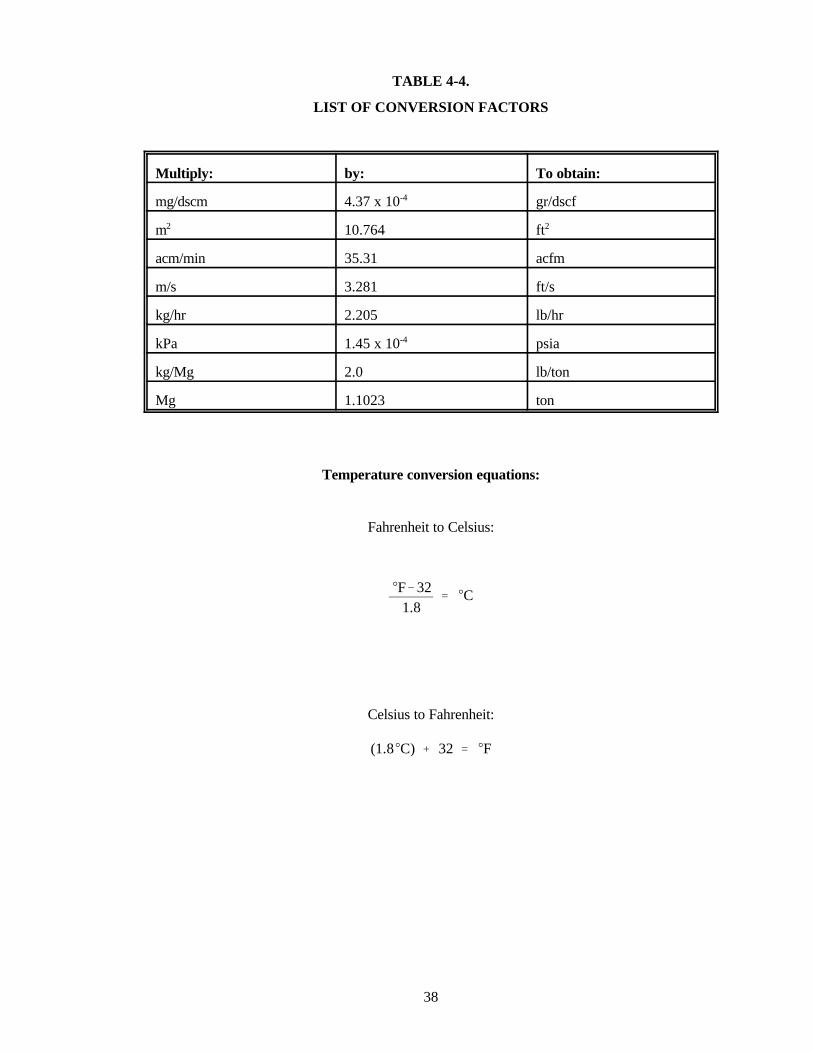
TABLE 4-4.
LIST OF CONVERSION FACTORS
Multiply: by: To obtain:
mg/dscm 4.37 x 10⁻⁴ gr/dscf
m2 10.764 ft2
acm/min 35.31 acfm
m/s 3.281 ft/s
kg/hr 2.205 lb/hr
kPa 1.45 x 10⁻⁴ psia
kg/Mg 2.0 lb/ton
Mg 1.1023 ton
Temperature conversion equations:
Fahrenheit to Celsius:
EF&321.8
' EC
Celsius to Fahrenheit:
(1.8EC) % 32 ' EF
39
4.5REFERENCES FOR CHAPTER 4
1.Technical Procedures for Developing AP-42 Emission Factors and Preparing AP-42 Sections.U.S. Environmental Protection Agency, Air Management Technology Branch, Office of Air
Quality Planning and Standards, Research Triangle Park, NC, 27711, April, 1992.
2.T. Epstein, et al., Ferroalloy Furnace Emission Factor Development, Roane Limited, Rockwood,Tennessee, EPA-600/X-85-325, U.S. Environmental Protection Agency, Washington, DC, June
1981.
3.Source test, Union Carbide Corporation, Ferroalloys Division, Marietta, Ohio, EMB-71-PC-12(FEA), U.S. Environmental Protection Agency, Research Triangle Park, NC, 1971.
4.S. Beaton, et al., Ferroalloy Furnace Emission Factor Development, Interlake Inc., AlabamaMetallurgical Corp., Selma, Alabama, EPA-600/X-85-324, U.S. Environmental Protection
Agency, Washington, DC, May 1981.
5.Source Test, Foote Mineral Company, Vancoram Operations, Steubenville, OH, EMB-71-PC-08(FEA), U.S. Environmental Protection Agency, Research Triangle Park, NC, August 1971.
6.Source test, Airco Alloys and Carbide, Charleston, SC, EMB-71-PC-16(FEA), U.S.Environmental Protection Agency, Research Triangle Park, NC, 1971.

40