“one day i will make it” › fulltext › ed484618.pdf · 2.1 demographic characteristics and...
TRANSCRIPT

“One Day I Will Make It”
A Study of Adult Student Persistence in Library Literacy Programs
Kristin E. Porter Sondra Cuban
John P. Comings
with Valerie Chase
January 2005

The Literacy in Libraries Across America (LILAA) initiative is supported by The Wallace Founda-tion and, with the support also of the U.S. Department of Education’s Office of Educational Re-search and Improvement, is being evaluated by MDRC and the National Center for the Study of Adult Learning and Literacy (NCSALL) at Harvard University.
The Wallace Foundation seeks to support and share effective ideas and practices that expand learning and enrichment opportunities for all people. Its three current objectives are:
• Strengthen education leadership to improve student achievement • Improve out-of-school learning opportunities • Expand participation in arts and culture
For more information and research on these and other related topics, please visit the Knowledge Center at www.wallacefoundation.org.
Dissemination of MDRC publications is also supported by the following foundations that help fi-nance MDRC’s public policy outreach and expanding efforts to communicate the results and impli-cations of our work to policymakers, practitioners, and others: The Atlantic Philanthropies; the Al-coa, Ambrose Monell, Bristol-Myers Squibb, Ford, Grable, and Starr Foundations; and the Open Society Institute.
The findings and conclusions in this document do not necessarily represent the official positions or policies of the funders.
For information about MDRC and copies of our publications, see our Web site: www.mdrc.org.
Copyright © 2005 by MDRC. All rights reserved.

-iii-
Overview
Although research indicates that adults with low literacy skills need 100 to 150 hours of instruction to advance one grade level, adults in literacy programs participate in instruction for an average of only 70 hours per year. The Wallace Foundation launched the Literacy in Libraries Across America (LILAA) initiative in 1996 to help library-based literacy programs nationwide increase the persis-tence of their adult learners, and it contracted with MDRC and the National Center for the Study of Adult Learning and Literacy (NCSALL) at Harvard University in 1999 to study the initiative. The participating libraries were granted resources to develop and implement persistence strategies that included improved instruction, more varied and more extensive social supports, and technology up-grades. This is the fourth and final report from the persistence study, which examined the implemen-tation and effects of these strategies in nine library literacy programs over four years and whether student participation changed over time.
Changes in Student Participation and Achievement • Throughout the study period, students’ average participation in program activities fell well
short of the level required to improve their literacy skills. For all demographic groups in the study, the duration and intensity of participation did not change substantially over time.
• Standardized tests showed modest increases in achievement. No relationship was found be-tween students’ number of hours of participation and their achievement gains.
Challenges in Implementation • The strategies closest to libraries’ core mission of improving literacy — such as expanded
computer-assisted instruction and improved tutor training — were implemented with rela-tively little difficulty. Rather than breaking with past practice, these changes were predomi-nantly incremental.
• Most of the programs were reluctant to develop a social service capacity. In the few excep-tions, social services were restricted to on-site child care or transportation vouchers, were implemented slowly, and did not fully address students’ needs.
• The emphasis on programmatic over social service strategies limited programs’ potential to improve persistence, because many students had barriers to participation, such as unstable work hours, child care or transportation needs, or health problems.
Pathways to Persistence • Different “pathways to persistence” emerged. Some students stopped participating after the
first few months. Others participated only intermittently because of barriers to participation. A minority of students were long-term participants.
• Although it is impossible to predict which pathway an individual student will follow, library literacy programs might increase their influence on persistence by acknowledging and ac-commodating multiple pathways, in these ways:
• Offer realistic social supports — especially for students not on the long-term pathway — such as on-site child care timed to coincide with evening instruction.
• Develop a system for referring students to social service and other education providers that are better equipped than libraries to help students cope with barriers to persistence.
• Adapt and add programmatic features, such as off-site instruction and drop-in classes, to make literacy services accessible to students on all pathways, and develop learning plans, to enable students to make progress even when they cannot attend program activities.


-v-
Contents
Overview iii List of Tables and Figures vii Preface ix Acknowledgments xi Executive Summary ES-1
1 Introduction 1
The LILAA Persistence Study 1 Key Questions and the Organization of This Report 2
2 Participants in Library Literacy Programs and the Factors That Influence Their Persistence 5
Characteristics of LILAA Program Participants 5 Patterns of Persistence Among LILAA Participants 10
3 The Challenge of Improving Student Persistence 27
Barriers to Persistence 27 Two Approaches for Improving Student Persistence 28 Summary and Recommendations 34
4 Pathways to Persistence 39
Five Persistence Pathways 39 A Look at the LILAA Experience from the Pathway Perspective 42 Implications of the Pathway Perspective for Program Design and Practice 43 Conclusion 47
Appendixes
A: The Five Libraries Participating in the LILAA Persistence Study 49 B: Samples Used in the LILAA Evaluation 55 C: The Achievement Study Component of the LILAA Persistence Study 57 D: Measuring Student Persistence: Definitions and Limitations 67
References and Bibliography 71 Publications on Literacy in Libraries Across America 77


-vii-
List of Tables and Figures
Table ES.1 The Five Libraries Participating in the LILAA Persistence Study ES-3 2.1 Demographic Characteristics and Primary Activities of Students
Entering a LILAA Program Between January 2000 and September 2002 6 2.2 Average Monthly Hours of Participation, When Active, for Students
Entering a LILAA Program Between January 2000 and September 2002 13 2.3 Demographic Characteristics and Primary Activities of Entrant Sample,
by Cohort 15 2.4 Average Monthly Hours of Participation, When Active, for Students
Entering a LILAA Program Between July 2000 and June 2002, by Cohort 18 2.5 Median Length of Participation, in Months, by Subgroup and Cohort 19 2.6 Average Monthly Hours of Participation, by Subgroup and Cohort 20 2.7 Average Monthly Hours of Participation and Median Length of Stay,
by Program and Cohort 22 2.8 Achievement Study Tests, Age/Grade Equivalents 24 B.1 Samples Used in the LILAA Persistence Study and Achievement Study 56 C.1 Performance Levels on the Basic English Skills Test (BEST)
for English Language Learners 60
Figure 2.1 Literacy Test Age/Grade Equivalents 8 2.2 Literacy Test Age/Grade Equivalents for English Speakers
and English Learners 9 2.3 Percentage of Students Who Exited the Program, by Month After Entry 11 2.4 Percentage of Students Who Exited the Program, by Month After Entry
and by Cohort 16


-ix-
Preface
An increasing number of jobs in the United States demand strong English literacy and communication skills. At the same time, millions of American adults can’t meet these demands because their prior education was inadequate, they have learning problems, or they are in the process of learning English. Many adult learners who want to improve their literacy and language skills enroll in programs that provide literacy instruction, but research has shown that adult stu-dents generally do not participate long enough or intensely enough to achieve significant gains.
Library-based programs are an important part of the network of organizations that serve adult literacy students. Libraries exist in most communities, are open to all, and provide a more inviting setting for adult learning than do other education institutions. In 1996, The Wallace Foundation launched the Literacy in Libraries Across America (LILAA) initiative to help 15 library literacy programs around the country develop and implement new ways to increase adult learners’ persistence and to test whether these new strategies lead to longer, more intense pro-gram participation and to improvements in literacy. This report presents the findings of a study of nine of these LILAA programs that was initiated in 1999 by The Wallace Foundation and was conducted by MDRC in collaboration with the National Center for the Study of Adult Learning and Literacy (NCSALL).
The report offers a sobering picture. The programs in the study all worked to boost the quality of their literacy instruction by improving the training of tutors, strengthening computer-assisted instruction, and tracking participation better. Unfortunately, student participation did not increase over time. The reasons behind this story — mostly related to the personal circum-stances of the adult learners — illustrate the difficulties of increasing participation in literacy programs but also provide a framework for understanding how to strengthen library literacy programs in the future. For instance, this study suggests that library literacy programs should be prepared to accommodate the reality of intermittent participation by adult students and should do more to connect these students to social services and other supports to help them overcome the barriers that prevent them from participating.
In recent years, concerns about low levels of persistence in adult education have height-ened as federal funding has been made increasingly contingent on programs’ abilities to demon-strate improvements in student achievement. The designers and managers of library literacy programs and the thousands of volunteers who work with individual adults can draw important lessons from this report — as can federal policymakers.
Gordon L. Berlin President


-xi-
Acknowledgments
The research in this report seeks to tell the story of the adults who come to library liter-acy programs to improve their skills and of the staff and volunteers who serve them. Thus, we are particularly grateful to the many library literacy students who shared their stories with us and to the program staff who reported on their experiences, helped collect high-quality partici-pation data, and reviewed an earlier draft of this report. We especially thank the following pro-gram directors: Steve Sumerford of Greensboro (North Carolina) Public Library, Ken English of New York Public Library, Norma Jones and Leslie Rodd of Oakland (California) Public Li-brary, Bruce Carmel of Queens Borough (New York) Public Library, and Kathy Endaya of Redwood City (California) Public Library. We thank as well Resonja Willoughby, at Oakland Public Library, for her assistance in administering a survey of students.
We also thank The Wallace Foundation and the U.S. Department of Education for their financial support of the Literacy in Libraries Across America (LILAA) persistence study. Spe-cial acknowledgment is due Edward Pauly, Sheila Murphy, and Lee Mitgang of The Wallace Foundation for their insights on the LILAA initiative and for their valuable comments on an early draft of this report.
Finally, we acknowledge the important contributions of our colleagues at MDRC and the National Center for the Study of Adult Learning and Literacy (NCSALL). At MDRC, Jean Eis-berg and Michele Beleu provided research assistance and report coordination; Joel Gordon helped with the collection of participation data; Robert Weber edited the report; and Stephanie Cowell prepared it for publication. At NCSALL, Lauren Wedam provided technical research assistance, with help from Rebecca Garland and Dominique Chlup; Rosalind Davidson trained the testers for the achievement study and offered guidance throughout the testing and reporting process; and John Strucker provided consultation and advice on the tests used in the achievement study. We also thank Lyn Verinsky for scoring the tests and the testers for administering them.
The Authors


ES-1
Executive Summary
Whether in the context of work, parenting, or civic responsibility, strong literacy and communication skills are more essential than ever to realizing one’s full potential in America. Many people who did not acquire these skills while growing up look to adult education pro-grams for instruction in literacy, English language fluency, or other types of basic skills. Re-search shows, however, that adult students often do not participate in such programs long enough to reap substantial learning gains.1 Many quickly drop out or attend education activities only sporadically, making little learning progress. Research suggests that students in adult liter-acy programs participate an average of 70 hours in a 12-month period;2 yet 100 to 150 hours of participation are required to improve literacy by one grade level.3 In recent years, concerns about low levels of persistence in adult education have become a major policy and program is-sue as federal funding has been made increasingly contingent on programs’ abilities to demon-strate improvements in their students’ achievement.
Public libraries have long been important providers of adult education. As familiar community institutions, libraries tend to offer welcoming and accessible environments for local residents seeking to improve their literacy skills. Through a range of services that include one-on-one tutoring, classes and small-group instruction, and computer-assisted learning, library literacy programs provide valuable learning opportunities for students who may have no other education options because of their low literacy skills. Like other adult education providers, li-brary literacy programs struggle to help students participate in learning activities long enough to improve their skills. And because students in library literacy programs have particularly low skill levels, they typically need many hours — often years — of instruction.
The Wallace Foundation launched the Literacy in Libraries Across America (LILAA) initiative in 1996 with the goal of helping public libraries around the country develop new ways to increase adult learners’ persistence. The Wallace Foundation also contracted with MDRC and the National Center for the Study of Adult Learning and Literacy (NCSALL) to document the libraries’ experiences and to examine whether the new strategies led to longer, more intense program participation and improvements in literacy and language skills. In the study, the plan-
1Young, Fleischman, Fitzgerald, and Morgan, 1994. 2This estimate comes from an official in the U.S. Department of Education’s Office of Vocational and
Adult Education. 3See T. Sticht, Evaluation of the Reading Potential Concept for Marginally Illiterate Adults (Alexandria,
VA: Human Resources Research Organization, 1982); G. Darkenwald, Adult Literacy Education: A Review of the Research and Priorities for Future Inquiry (New York: Literacy Assistance Center, 1986); and J. Comings, A. Sum, and J. Uvin, New Skills for a New Economy: Adult Education’s Key Role in Sustaining Economic Growth and Expanding Opportunity (Boston: Mass Inc., 2000).

ES-2
ning and implementation of strategies to improve student persistence were investigated in well-established library literacy programs in nine branches of five libraries (described in Table ES.1) over the course of four years, from 2000 through 2003.
Three previous reports defined the problem of adult student persistence and recorded early progress in enhancing library literacy program services.4 This final report from the LILAA persistence study offers lessons on the challenge of addressing factors that undermine persis-tence. Although a formal impact study was not conducted, this report’s findings illustrate the difficulties library literacy programs face in increasing student participation. The analyses pre-sented here break new ground in several respects. First, thorough documentation of students’ participation and achievement over the course of the LILAA initiative allowed for a detailed examination of persistence levels and patterns and of achievement trends. In general, participa-tion was not intense enough to make substantial differences in literacy (as confirmed by achievement tests), and the average duration of participation did not systematically improve over the years studied, though the average hours in months when students did attend increased slightly. The implementation research suggests why improving student persistence is so difficult and reveals the kinds of supports that adult learners need in order to persist. Overall, the report provides a framework for understanding the challenges of putting in place various persistence strategies, and it concludes with recommendations for what library literacy programs and other adult education providers may want to try next.
Key Findings
The Students in the LILAA Programs
• Adults who participated in the LILAA programs shared a desire to im-prove their low literacy skills, but otherwise they were a diverse group.
The clientele of the LILAA programs reflected the characteristics of their communities. The programs attracted more women than men (approximately 60 percent of the students were women), and students’ ages ranged broadly. Most participants were people of color (less than 5 percent were white), with each site drawing a third or more of its students from a single racial or ethnic group. Many students were recent immigrants who wanted to learn English, while others were native English speakers who wanted to improve their literacy and basic skills.
4See J. Comings and S. Cuban, So I Made Up My Mind: Introducing a Study of Adult Learner Persistence
in Library Literacy Programs (New York: MDRC, 2000); J. Comings, S. Cuban, J. Bos, and C. Taylor, “I Did It for Myself”: Studying Efforts to Increase Adult Learner Persistence in Library Literacy Programs (New York: MDRC, 2001); and J. Comings, S. Cuban, J. Bos, and K. Porter, “As Long As It Takes”: Responding to the Challenges of Adult Student Persistence in Library Literacy Programs (New York: MDRC, 2003).

The
LIL
AA
Per
sist
ence
Stu
dy
T
able
ES.
1
The
Fiv
e L
ibra
ries
Par
ticip
atin
g in
the
LIL
AA
Per
sist
ence
Stu
dy
Libr
ary
Num
ber o
f B
ranc
hes
Whe
re P
rogr
am Is
Hou
sed
Prog
ram
Fea
ture
s
Gre
ensb
oro
(NC
) Pub
lic
Libr
ary
9
Cha
vis a
nd G
lenw
ood
bran
ches
a C
havi
s off
ers a
ftern
oon
and
even
ing
GED
cla
sses
and
a
com
pute
r lab
. Gle
nwoo
d of
fers
smal
l-gro
up in
stru
ctio
n in
En
glis
h fo
r Spe
aker
s of O
ther
Lan
guag
es (E
SOL)
, one
-on
-one
tuto
ring,
and
a c
ompu
ter l
ab.
New
Yor
k Pu
blic
Lib
rary
85
Ford
ham
(Bro
nx),
Wak
efie
ld
(Bro
nx),
and
Sew
ard
Park
(M
anha
ttan)
bra
nche
s
Ford
ham
serv
es 1
50 st
uden
ts w
ith in
divi
dual
tuto
rials
an
d in
smal
l gro
ups a
nd o
ffer
s a c
ompu
ter l
ab fo
r in
depe
nden
t lite
racy
self-
inst
ruct
ion.
Wak
efie
ld se
rves
ab
out 1
00 st
uden
ts, m
ostly
of A
fro-
Car
ibbe
an o
rigin
, in
smal
l gro
ups a
nd c
ompu
ter s
elf-
stud
y; o
ffer
s job
s sea
rch
reso
urce
s. Se
war
d Pa
rk se
rves
a d
iver
se g
roup
of 8
0 st
uden
ts in
smal
l-gro
up tu
torin
g.
Oak
land
(CA
) Pub
lic
Libr
ary
19
D
ownt
own
offic
e bu
ildin
g ne
ar th
e lib
rary
Fo
unde
d in
198
4, th
e pr
ogra
m o
ffer
s cla
sses
and
one
-on-
one
tuto
ring
thro
ugh
a m
ix o
f 150
vol
unte
ers i
n ad
ditio
n to
pro
fess
iona
l sta
ff; w
ith 2
0 co
mpu
ters
, off
ers c
ompu
ter-
assi
sted
inst
ruct
ion.
Que
ens B
orou
gh (N
Y)
Publ
ic L
ibra
ry
62
C
entra
l (Ja
mai
ca),
Flus
hing
, and
R
ochd
ale
Vill
age
bran
ches
Fo
unde
d in
197
7, th
e pr
ogra
m e
nrol
ls o
ver 2
,500
adu
lts
per y
ear,
offe
ring
ESO
L an
d ba
sic
liter
acy
inst
ruct
ion.
Red
woo
d C
ity (C
A)
Publ
ic L
ibra
ry
3
R
edw
ood
City
Pub
lic L
ibra
ry, w
ith
serv
ices
in o
ther
com
mun
ity
orga
niza
tions
, inc
ludi
ng sc
hool
s, a
jail,
and
a h
alfw
ay h
ouse
Mor
e th
an 1
80 v
olun
teer
s tut
or a
ppro
xim
atel
y 20
0 ad
ults
on
e-on
-one
and
in sm
all g
roup
s; th
e pr
ogra
m in
clud
es a
le
arni
ng d
isab
ilitie
s com
pone
nt. T
hree
-qua
rters
of a
dult
stud
ents
are
His
pani
c.
N
OTE
: a Qua
ntita
tive
data
wer
e co
llect
ed o
nly
from
the
Gle
nwoo
d pr
ogra
m.

ES-4
• Overall, the literacy levels of students in the LILAA programs were low, and native English speakers showed lower average levels of achievement than did students who were learning English.
Toward the beginning of the study, 242 students at five of the programs took a battery of tests measuring various literacy competencies. Scores ranged from approximately the third-grade level on assessments of reading, phonetic decoding, and comprehension to the fifth-grade level on a test of vocabulary. Students who were learning English scored higher than native English speakers on two of the three literacy tests, perhaps in part because they had stronger literacy skills in their native language. The low overall levels of literacy at the outset of the study suggest that the students needed to participate in literacy learning activities for many hours in order to achieve their literacy goals.
Patterns of Persistence Among LILAA Participants
• Overall, the length and intensity of students’ participation in services fell short of the amount needed to make substantial improvements in liter-acy levels.
Almost two-thirds of entering LILAA students stopped participating within six months of enrolling in library literacy activities. In the months during which students did participate, they spent an average of 8.5 hours in literacy learning activities, or a little more than 2 hours per week. Overall, students spent an average of 58 hours in literacy activities at a LILAA program (before leaving for a period of at least three months) — far fewer than the 100 to 150 hours needed to increase literacy by a grade level.
• Over the life of the LILAA initiative, overall participation remained low. For all demographic groups, there were no substantial changes in the duration or intensity of program participation over the study period.
Based on a comparison of two cohorts of students who entered the LILAA programs — one early in the initiative and the other late, after most program improvements had been imple-mented — there was little change in students’ participation patterns over time. About 80 percent of both cohorts stopped participating in program activities within a year after entering, although those in the later cohort stopped participating somewhat sooner. This slight drop in the duration of participation may be attributable to administrative changes aimed at casting a wider net for students (leading to unintended increases in enrollment of students for whom the programs were not appropriate) or to new enrollment processes or expectations that may have deterred some students. The intensity of participation increased slightly between cohorts, from 8.3 hours per month for the earlier cohort to 9.0 hours per month for the later cohort. This slight increase in the intensity of participation is attributable to students’ spending more time in the computer lab,

ES-5
probably to take advantage of the expansion and upgrade of computer facilities at all the pro-grams during the LILAA initiative. At the same time, the average number of hours in tutoring declined from the earlier to the later cohort.
Older students tended to participate in the programs longer than younger students, but — across all subgroups defined by gender, race, and primary learning activity — there were no significant differences in persistence or in trends in persistence.
• Although the LILAA programs faced similar challenges in improving student persistence, the severity of the problems varied across pro-grams.
The levels of student persistence varied considerably across the nine LILAA programs. For example, exit rates one month after program entry ranged from 4 percent to 42 percent, and exit rates six months after program entry ranged from 44 percent to 84 percent. These wide ranges likely reflect differences in types of students, recruitment and intake procedures, or strategies for raising student engagement.
The intensity of students’ participation in the LILAA programs during the months in which they were active also varied substantially by program, ranging from 6.4 hours to 11.4 hours per month in active months. The differences in intensity could reflect different capacities to help students dedicate substantial amounts of time to literacy activities. Alternatively, the dif-ferences could reflect different priorities regarding what kinds of students to serve and the types and frequency of instruction to offer.
Trends in Achievement Among LILAA Participants
• There were modest improvements in student achievement as measured by standardized tests.
A sample of students took achievement tests at the beginning of the study, and about two-thirds took the same battery of tests approximately one year later. For these students, there were small but meaningful average gains (enough to exhibit improved skills) on the tests that measured overall reading comprehension but little or no improvement on other tests measuring phonemic decoding and vocabulary. No subgroups of students defined by gender, age, or race were more likely or less likely to experience improvement. Also, there was no relationship be-tween the number of hours of participation and achievement gains. Students who participated for more hours between the two waves of tests were no more likely to show higher achievement after one year than were students who participated fewer hours. This finding suggests that stu-dents with higher participation levels did not spend enough time in learning activities to im-prove the literacy skills captured by standardized tests.

ES-6
The Challenge of Improving Persistence
• The students in the LILAA programs faced a variety of difficulties that hampered their efforts to participate steadily and intensively in literacy learning.
Most of the students were from low-income households, and many worked long, unsta-ble hours. Many also had health problems or histories of substance abuse that prevented them from keeping steady employment. Program staff believed that many native-English-speaking students had undiagnosed learning disabilities that hampered them in their education and in other areas of their lives. Some students were in abusive relationships and lacked emotional support to improve their literacy skills. Finally, some of the students who were learning English were recent immigrants struggling to acclimate to their new environments. All these personal difficulties can be serious barriers to persistence in literacy services.
• Improving student persistence requires that personal barriers to persis-tence be addressed, but most of the LILAA programs were reluctant to develop a social service capacity. When social services were offered, im-plementation proved difficult.
Six of the LILAA programs did not attempt to implement such support services as child care and transportation assistance. Program staff felt that social service supports would distract them from their core mission of improving literacy. Others worried that such services would conflict with key pillars of the U.S. library system: the privacy and equal treatment of all pa-trons. Capacity constraints were also a key consideration. Of the three programs that attempted to provide an in-house social service — which in each case consisted of on-site child care or transportation vouchers — only one succeeded in meeting students’ needs. The services offered by the other two programs were mismatched with students’ needs or could not be sustained. Given that few approaches to addressing students’ personal barriers were implemented success-fully, it is not surprising that persistence did not improve over the course of the study.
• The LILAA programs were more successful in making programmatic improvements than in offering social services. The programmatic changes were of degree rather than kind, and they had less potential than social supports to improve student persistence.
The LILAA programs implemented a variety of strategies that strengthened their core services. Some strategies (such as off-site instruction, drop-in classes, and expanded self-paced computer-assisted instruction) made literacy services more accessible; some (such as improved tutor training and faster entry into instructional services) were designed to make students feel more welcome and more comfortable; and other strategies (such as diagnostic testing, interven-tions for students with learning disabilities, and goal-setting activities) focused on students’

ES-7
educational needs and goals. Programmatic strategies were easier to implement than social ser-vice strategies, because the former are more in line with libraries’ core mission of improving literacy. However, most of the strategies that the LILAA programs put in place represented small improvements on existing practices. Combined with the limited potential of these strate-gies to affect participation, this finding may also explain why there was no improvement in stu-dent persistence over the course of the LILAA study.
Adult Students Use Library Literacy Programs in Different Ways
• Participants in the LILAA programs followed different “pathways” through literacy education.
The LILAA study uncovered five main persistence pathways among adult literacy stu-dents at the LILAA programs. Students on the long-term pathway participated on a steady, pro-longed basis. They typically had few or no barriers to persistence and found program participa-tion enjoyable. However, many students on the long-term pathway lacked clear goals and may not have concentrated enough on their literacy education to make meaningful improvements in their literacy skills. Other students’ program participation was required as part of an agreement with a public assistance or law enforcement agency. Students on this mandatory pathway typi-cally faced several barriers to participation, but, with the support of their agency, they were of-ten able to persist.
Students on the three most common pathways tended to have clear literacy goals but had barriers to persistence that affected their participation in different ways. Those with the most or highest barriers often followed the tryout pathway, leaving the program soon after en-tering it. They often needed to address personal difficulties before making a commitment to lit-eracy learning. Students on the intermittent pathway also faced considerable barriers to partici-pation, but they dropped in and out of the program for months at a time. Their continuing con-tact with the program indicates a desire to participate, but the frequent interruptions in their at-tendance interfered with progress toward achievement goals. Students on the short-term path-way may or may not have had high barriers to persistence, but they had targeted, short-term goals that they were able to reach quickly before leaving the program.
• Libraries cannot determine in advance which pathway any individual literacy student will take, but they can do more to acknowledge, accom-modate, and improve the persistence of students on all pathways.
Given the large numbers of students, their diverse needs, and the complicated nature of barriers to persistence, addressing the individual needs of all students is beyond the capacity of most library literacy programs. The LILAA programs tended to respond to this reality by devel-oping strategies that could be applied to all students, but persistence levels remained low. The long-term pathway may seem to be the most promising route to literacy learning, but it is not

ES-8
feasible for all students. If students feel that this is the only pathway available, they may be less likely to persist or even to enroll in a literacy program. Although all the LILAA programs of-fered a warm, welcoming environment, some students seemed not to realize that other persis-tence pathways were also available, acceptable, and valuable.
What Library Literacy Programs Might Try Next • Offer realistic social support services.
Legitimate concerns about equity, privacy, and capacity may limit the extent to which public libraries can offer services beyond literacy instruction. Nonetheless, because boosting stu-dent persistence sometimes requires that personal and environmental difficulties be addressed, some library-based social services seem to warrant further exploration. One of the LILAA pro-grams showed that on-site child care, for example, can be part of a library-based literacy program. Although the LILAA programs’ attempts to provide transportation assistance were unsuccessful, further experimentation may reveal more successful approaches to implementation. And other types of services, such as some forms of counseling, may also show promise.
• Develop a system for referring students to other social service and educa-tion providers.
Providing referrals fits well with the library’s role as an information resource in the community. Library literacy programs could offer information about local social service and education providers more proactively by formalizing and institutionalizing their referral proc-esses. Rather than relying on staff to offer advice when a student reveals a difficulty or a need that they cannot address, for example, they could develop ways to make sure that students have access to referral information at any time. Library programs could also develop relationships with other community service providers in order to better understand locally available services and to make sure that their students actually receive the services they need after they are re-ferred. This information could then be regularly distributed among program staff, so that all staff have accurate, up-to-date information to share with students who seek assistance.
• Adapt and add programmatic improvements.
The programmatic improvements that were observed in the LILAA persistence study — though only minor enhancements of what the nine well-established programs were already doing — might serve as models for library literacy programs that have not yet implemented any strategies along these lines. Moreover, even programs that are already implementing the pro-grammatic strategies in some form might wish to alter them in light of the LILAA experiences. For example, off-site instruction and drop-in classes, which the LILAA programs implemented on a limited basis to make instruction more accessible to students who had transportation diffi-culties or scheduling conflicts, could be expanded according to student demand. Similarly, pro-

ES-9
grams might try adapting the drop-in approach, which the LILAA programs offered solely in the form of an English-language conversation class, to other types of instruction. Also, evaluat-ing and addressing learning disabilities — a key barrier to persistence for many adult literacy students — might also warrant introduction or expansion.
The study’s findings also point to two new strategies for library literacy programs to con-sider. First, staff could implement sponsorship programs in which students are matched with indi-viduals who can support their persistence and learning. The 2003 LILAA report notes that stu-dents who had a sponsor attributed their ability to persist to that person.5 Library literacy programs could foster sponsorship by helping students identify sponsors, by involving sponsors in program activities, and by educating sponsors about how to support students. Second, programs could use learning plans as a way to support persistence. By incorporating not only tutoring and classes but also homework and other activities — as well as any participation in social service or other educa-tion programs — learning plans could serve as a path toward literacy goals that guide students both in and out of the program and as a way to link different periods of participation.
• Modify existing services, and design new services to help students on all pathways.
The pathway perspective that emerges from the LILAA study provides a new way for libraries to think about the implementation and goals of their literacy programs. In applying the pathway perspective to the recommendations that come out of the LILAA experience, the study suggests that programs should put less emphasis on group learning activities — in which one can easily fall behind — in favor of offering more one-on-one, computer-based, and self-directed activities that allow students to dip in and out as their ability to participate fluctuates. This perspective also highlights the importance of providing referrals to social service and edu-cation providers in a timely, systematic fashion.
The pathway perspective might also guide the content of learning plans. For example, programs could incorporate self-study plans to accommodate the intermittent pathway, addi-tional education choices to accommodate the short-term pathway, and benchmarks met through a variety of activities to accommodate the long-term pathway.
Finally, library literacy programs could take steps to heighten awareness of the variabil-ity and unpredictability of students’ journeys on the persistence pathways. The goals would be to create a program atmosphere in which there is no stigma associated with participating irregu-larly or with returning to the program after a hiatus; to give students information up front about how to continue learning during periods when their participation is intermittent or nil; and to follow up systematically when participation becomes erratic.
5Comings, Cuban, Bos, and Porter, 2003.


-1-
Chapter 1
Introduction
In the United States today, not being able to read or write can prevent a person from find-ing and keeping employment that pays a wage above the poverty level. Low literacy can also un-dermine a person’s ability to be an educated consumer, an informed voter, and an involved parent or grandparent. Millions of adults in the United States lack the literacy and English language skills that would allow them to realize their full economic, social, and learning potential.1 Those who hope to raise their level of literacy often turn to public library-based programs for help because of libraries’ accessibility, lack of entrance requirements, and welcoming atmosphere.
Research indicates that adults need 100 to 150 hours of literacy instruction to raise their skills by one grade level.2 Yet adult literacy students participate in instruction for an average of only 70 hours per year,3 and many drop out after a brief period or attend only sporadically. In addition to family and work responsibilities, adult students often face personal or practical diffi-culties — such as learning disabilities or a lack of reliable transportation — that get in the way of program participation and literacy progress. Helping them learn enough to make a large and lasting difference in their skills is an uphill battle, and most literacy programs lack the resources needed to wage it. As leading providers of literacy services, public libraries thus struggle to in-crease the duration and intensity of program participation among their students, many of whom have no other basic education options because of very low skills. As federal funding for adult education becomes increasingly contingent on evidence of improvements in students’ literacy and communication skills, efforts to raise adult learners’ persistence grow in importance.
The LILAA Persistence Study The Wallace Foundation launched the Literacy in Libraries Across America (LILAA)
initiative in 1996 to improve the quality of programs and services for adult learners and their families at library literacy programs nationwide. In 1999, the foundation contracted with MDRC and the National Center for the Study of Adult Learning and Literacy (NCSALL) at Harvard University to conduct the LILAA persistence study. The objective of the study was to examine the planning, implementation, and effects on participation and achievement of strate-gies designed to boost persistence in nine high-quality adult literacy programs, each of which
1Comings, Reder, and Sum, 2001. 2Sticht, 1982; Darkenwald, 1986; Comings, Sum, and Uvin, 2000. 3This estimate comes from an official in the U.S. Department of Education’s Office of Vocational and
Adult Education.

-2-
was part of the LILAA initiative and served a sizable number of students. The nine programs were operated in five public libraries around the country: Greensboro Public Library, in North Carolina; New York Public Library and Queens Borough Public Library, in New York City; and Oakland Public Library and Redwood City Public Library, in California. MDRC managed the study and conducted the quantitative analysis, while NCSALL performed the qualitative analysis. For a description of each of the programs, see Appendix A.
The LILAA initiative provided library literacy programs with resources to develop and implement persistence strategies that included greater information exchange between staff and adult learners about program offerings and learners’ needs and goals, better tracking of stu-dents’ participation and engagement, more varied and more extensive support services (such as on-site child care and transportation vouchers), improved instruction, technology upgrades, and more intensive training of staff and tutors. The persistence study investigated these strategies in the nine programs over a four-year period, focusing on program design and services as well as on student participation and engagement. The data sources encompass program records of stu-dents’ demographic characteristics and attendance, achievement tests, interviews with students and program staff, and observations of the programs and the communities in which they oper-ated. By tracking changes in students’ participation over time, the quantitative research sheds light on the effects of the persistence strategies. The qualitative research characterizes the pro-grams’ contexts and experiences as they responded to the challenge of increasing persistence.
Key Questions and the Organization of This Report This fourth and final report on the LILAA persistence study covers the main findings
and draws lessons from the LILAA experience for library literacy program design and practice. It aims to address the following questions:
1. What are the key factors supporting and inhibiting participation in adult liter-acy programs? What are the implications of these factors for the design of strategies to improve learner persistence? (Chapter 3)
2. Over time, how did the programs in the persistence study change their opera-tions to support student persistence more effectively? What strategies were strengthened or put in place during the second and third years of the study? What operational lessons emerged as programs worked to support persistence? (Chapter 3)
3. As the strategies were applied, did persistence improve over time? Did stu-dents who entered the LILAA programs late in the study period persist longer

-3-
or participate more intensely than students who entered earlier? Were there dif-ferences among types of students or among programs? (Chapter 2)
4. Do some types of strategies appear to be especially promising as ways to im-prove student persistence? What efforts and resources were needed to put these innovations in place? What are the implications for future program design and operations? (Chapters 3 and 4)
5. What is the relationship between participation in library literacy services and improved literacy skills? What were the gains in literacy achievement test scores between the initial testing of students and a follow-up test? Did students who participated more in services show greater gains? Who showed few or no gains? What are the implications for program design? (Chapters 2 and 3)
Chapter 2 describes and analyzes students’ demographic characteristics, program par-ticipation, and literacy achievement. The demographic findings show that the programs in the LILAA persistence study attracted students of widely varying ages and ethnicities who had an average of a fifth-grade literacy level at the beginning of the study. Changes in students’ persis-tence over time were measured by comparing program attendance during the third year of the study period with baseline levels of participation in program services, which were presented in an earlier report that covered the study’s first two years.4 This analysis reveals that the duration and intensity of students’ participation in program services was about as low at the end of the study as it was at the beginning and that long periods of nonattendance were common. Also ob-served, however, were slight gains in the achievement test scores of a group of students tested at the beginning and the end of a one-year period.
To put the quantitative results in context, Chapter 3 delves into the LILAA programs’ persistence strategies, which turned out to be more difficult to develop and implement than ex-pected. Although myriad personal and environmental factors — including life course, self-efficacy, mental and physical health, sponsorship, goals, and material resources — influence students’ ability to persist in literacy learning, the programs invested primarily in improving programmatic operations and instruction rather than providing social supports. Some programs experimented with strategies aimed at personal and environmental factors (for instance, by of-fering bus vouchers or on-site child care), but these strategies were generally limited or were mismatched with students’ needs. Partly for this reason, implementation of social supports was slower and less complete than that of programmatic improvements, such as longer operating hours and better tutor training. Reflecting on these findings, the chapter concludes with recom-mendations for future program design and practice.
4Comings, Cuban, Bos, and Porter, 2003.

-4-
Chapter 4 presents a conceptual framework for understanding students’ patterns of partici-pation in the context of the barriers to persistence and implementation challenges faced by the LILAA programs. This framework can be used to refine, extend, and prioritize the program recom-mendations presented in Chapter 3 on the basis of the qualitative research. For example, it points to ways that library literacy programs might foster persistence even when students cannot participate in on-site activities and to ways that programs might reduce the adverse effects of personal and envi-ronmental barriers to persistence without taking on the role of social service providers.
* * *
The LILAA persistence study is groundbreaking in its documentation of the complex challenges that library literacy programs face as they attempt to raise persistence in diverse adult student populations and in its analysis of participation patterns among adult literacy students. Some of the persistence strategies used by the LILAA programs unfolded naturally, while oth-ers fell outside libraries’ traditional roles or conflicted with their mission. Overall, the programs’ efforts to increase persistence had little impact on students’ participation and achievement. These findings suggest both new strategies and modifications of current strategies that library literacy programs and other adult education providers might want to try next.

-5-
Chapter 2
Participants in Library Literacy Programs and the Factors That Influence Their Persistence
Prior to the Literacy in Libraries Across America (LILAA) initiative, little was known about the characteristics of adult learners in library literacy programs or about their patterns of persistence. This chapter describes a number of key characteristics of adult students entering the nine LILAA programs in the persistence study (described in Appendix A), and it discusses how some of these characteristics may shape persistence. The chapter also describes the resulting patterns of persistence among the LILAA participants and looks at the extent to which these patterns might have shifted during the course of the study, as the LILAA programs worked to address the challenges to student persistence. The chapter concludes with an analysis of gains in literacy achievement.
Characteristics of LILAA Program Participants As Table 2.1 shows, the LILAA programs attracted both men and women from a wide
age range (as young as 15 and as old as 100; not shown) and of many ethnicities, largely reflect-ing the communities in which the libraries are located. Whether they were recent immigrants with limited English fluency, native English speakers with learning disabilities, or adults who never completed high school, they all had a common desire to improve their literacy skills. Low literacy levels prevented many students at the libraries from participating in other adult educa-tion and job training opportunities, as well as from being qualified for many jobs. Many were not able to read to their children or to help them with homework. And for many of the LILAA students, limited literacy skills lessened their ability to be well-educated consumers, active citi-zens, and informed voters.
Near the beginning of this study, 242 students at five of the library programs took a bat-tery of tests measuring several different literacy competencies.1 (More findings from this part of
1Participating students were sampled from the Central and Flushing branches of Queens Borough Public
Library, the Fordham branch of New York Public Library, Oakland Public Library, and Redwood City Public Library. These programs were chosen because their instruction included adult basic education (ABE) and Eng-lish for Speakers of Other Languages (ESOL) and because they represented a variety of demographic charac-teristics, types of instructional formats, and student population sizes. Students participating in the testing had been engaged in literacy activities at the LILAA programs for varying amounts of time. Therefore, the literacy levels indicated by the scores measure the abilities of students while they were engaged in the program, rather than their abilities on entering the program. For more information about the achievement study component of the persistence study and about the battery of tests used, see Appendix C.

The LILAA Persistence Study
Table 2.1 Demographic Characteristics and Primary Activities of
Students Entering a LILAA Program Between January 2000 and September 2002
New York Queens BoroughAll Seward Rochdale Redwood
Programs Greensboro Fordham Park Wakefield Oakland Central Flushing Village City
Gender (%)Male 40.5 47.9 44.5 41.0 40.5 44.8 38.2 32.0 37.7 40.3Female 59.5 52.1 55.5 59.0 59.6 55.2 61.8 68.0 62.3 59.8
Age group (%)Under 21 9.0 11.1 10.3 9.6 9.2 10.1 10.1 3.7 10.1 8.821 - 35 40.1 55.8 38.6 40.4 35.8 29.7 41.3 35.2 34.2 40.636 - 50 34.9 26.1 37.9 31.5 31.0 43.5 34.3 38.3 35.0 39.651 - 65 12.8 5.4 11.5 15.4 18.7 13.4 12.2 15.8 17.1 9.7Over 65 3.2 1.6 1.6 3.1 5.4 3.3 2.2 7.0 3.5 1.4
Average age (years) 37.3 32.8 36.3 37.7 40.1 38.1 36.4 41.3 38.7 35.8
Ethnicity (%)Blacka 38.2 13.3 48.5 17.0 86.7 75.7 47.6 2.5 87.6 6.9Hispanic 26.6 36.8 40.2 17.6 7.0 7.5 25.1 18.0 3.1 79.0Asian/Pacific Islander 22.1 10.5 2.4 57.1 1.9 6.4 14.6 75.0 1.2 3.4White 3.7 3.6 2.8 4.9 2.2 6.8 3.2 3.6 1.6 6.9Other 9.5 35.7 6.1 3.3 2.2 3.6 9.5 0.9 6.6 3.9
Primary activity (%)Tutoringb 32.1 0.0 55.6 26.8 47.2 19.8 30.7 10.6 45.1 100.0Classesc 12.3 70.8 0.0 0.0 0.0 29.4 0.0 0.0 0.0 0.0Computer lab 54.4 26.7 44.4 73.3 52.9 37.9 69.3 89.5 55.0 0.0
Sample size 4,255 617 678 329 316 293 831 673 273 245SOURCE: MDRC calculations from site-reported participation data collected between January 2000 and December 2002. NOTES: The sample includes students who entered one of the nine LILAA programs between January 2000 and September 2002 and whose exit status is either confirmed or unknown. See Appendix B for a full description of the sample. Missing values were exluded from these calculations. aBlack includes immigrants from Africa and the Caribbean. bTutoring includes both individual and group tutoring. cOnly two programs offered classes. For descriptions of instructional offerings by program, see Appendix A.
-6-

-7-
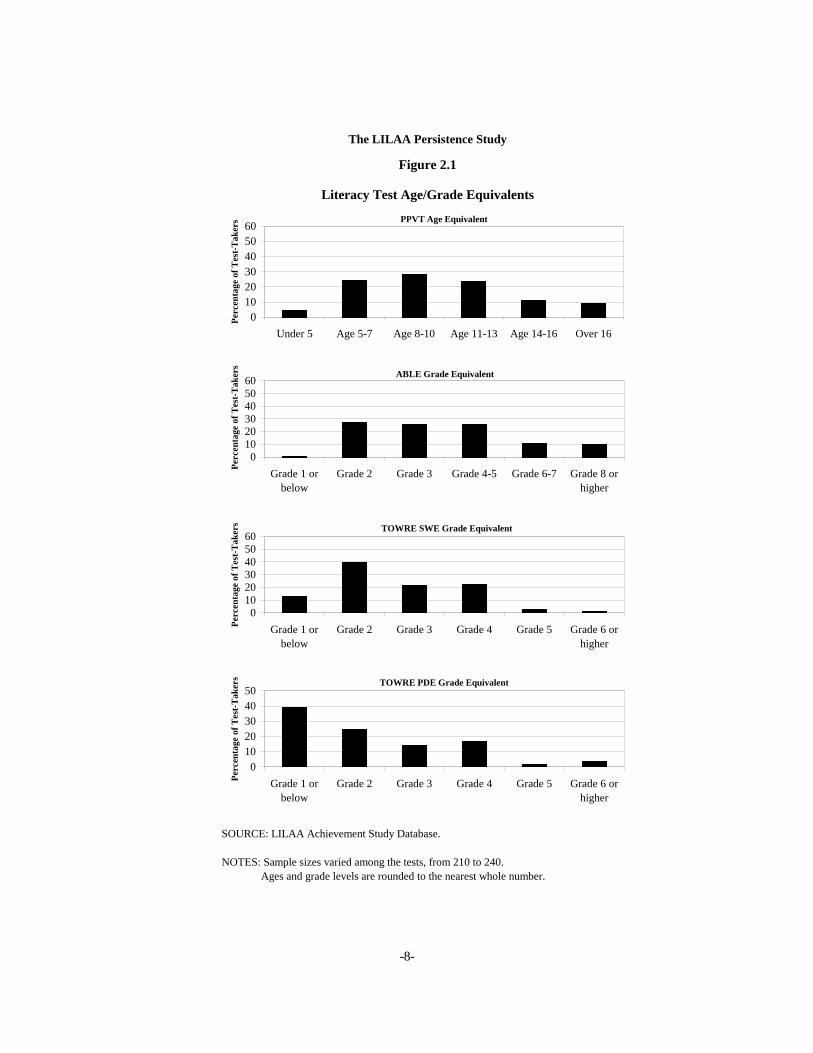
the study — in which the participants took the same battery of tests a year later — are presented later in this chapter.) While the sample is not random and includes students who had been par-ticipating in literacy services prior to testing, the students’ performance on the battery of tests, the first time they took it, illustrates the levels of literacy skills of the adult learners in the LILAA programs. Figure 2.1 presents the students’ scores, as either a grade or an age equiva-lent, on three of the tests administered in the first wave. It shows that most of the students scored at approximately the third- to fifth-grade level. This is also illustrated by the average scores presented below. Behind these summary measures, there was substantial variability among the test-takers’ performance levels on these tests (as indicated by relatively high standard errors for all the tests) and a small percentage of test-takers with much higher scores than the average student.
For the Peabody Picture Vocabulary Test (PPVT), which measures vocabulary skills, the average score among all the learners who successfully completed the test was the age-level equivalent of 10.4 years (approximately the fifth grade). For the two subtests of the Adult Basic Learning Examination (ABLE), the average score for the reading comprehension components, 4.1, translates to an equivalent of a fourth-grade reading level. And for the two subtests of the Test of Word Reading Efficiency (TOWRE) — a test of reading rate and word recognition — the majority of students scored at or below the third-grade level, with the average student scoring at a grade level of 2.8 for the Sight Word Efficiency (SWE) subtest and 2.6 for the Phonemic Decoding Efficiency (PDE) subtest. All three tests signify very low levels on a variety of literacy skills.
Students of English for Speakers of Other Languages (ESOL) also took a fourth test, the Basic English Skills Test (BEST). The mean score on the BEST was a Level VI on a scale of 10 levels defined for the BEST (not shown in Figure 2.1). A score of Level VI signifies the abil-ity to satisfy most basic survival needs, including routine work and social demands. It also typi-cally means that the test-taker can follow simple oral and written instructions in both familiar and unfamiliar settings and can communicate with native English speakers who are not used to dealing with limited English speakers.2 (Appendix Table C.1 explains the competencies associ-ated with Levels I through X of BEST scores.)
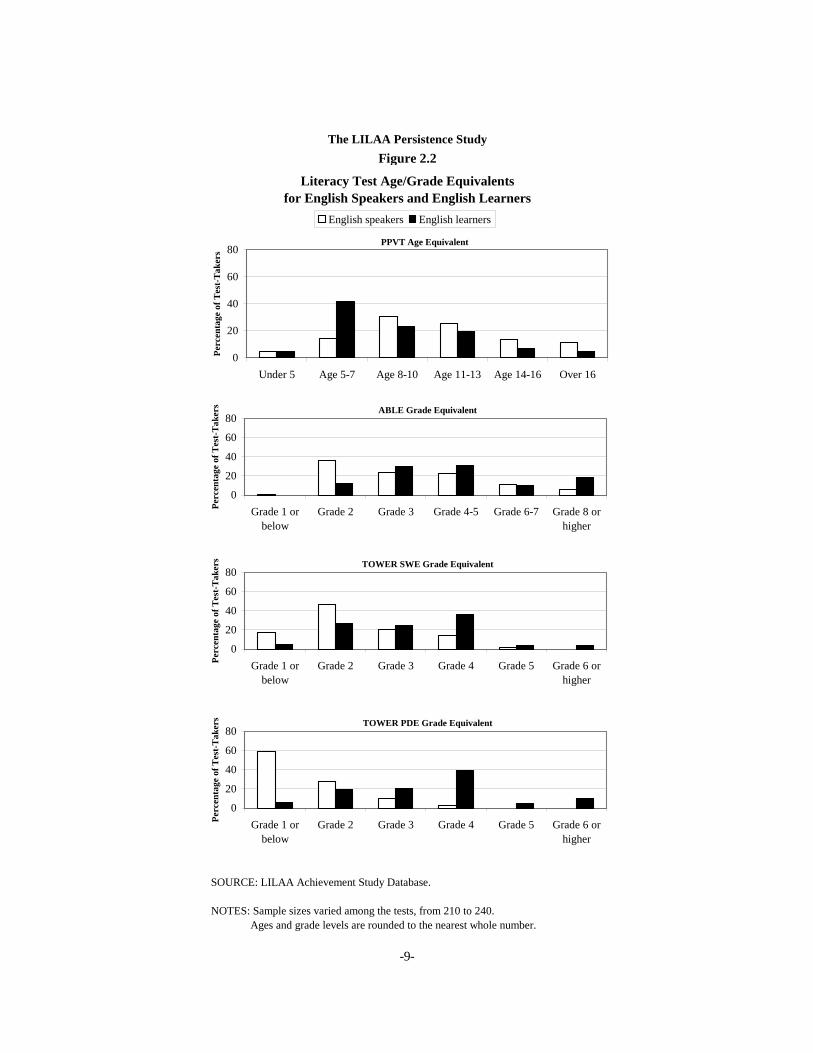
As Figure 2.2 shows, English language learners performed higher than English speakers on two of the three literacy tests that both groups took.3 Although this may seem surprising at first, there are several likely reasons for it. The initial levels of literacy among ESOL students may have been higher because many already had substantial literacy skills and formal education in their own language. They may, therefore, have been able to transfer their word recognition, decoding, and
2Center for Applied Linguistics, 1989. 3The only test on which ESOL students did not perform higher than non-ESOL students was the PPVT,
which measures English vocabulary.
-8-
The LILAA Persistence Study
Figure 2.1
Literacy Test Age/Grade Equivalents
0102030405060
Under 5 Age 5-7 Age 8-10 Age 11-13 Age 14-16 Over 16
PPVT Age Equivalent
Perc
enta
ge o
f Tes
t-T
aker
s
01020304050
Grade 1 orbelow
Grade 2 Grade 3 Grade 4 Grade 5 Grade 6 orhigher
TOWRE PDE Grade Equivalent
Perc
enta
ge o
f Tes
t-T
aker
s
SOURCE: LILAA Achievement Study Database.
NOTES: Sample sizes varied among the tests, from 210 to 240. Ages and grade levels are rounded to the nearest whole number.
0102030405060
Grade 1 orbelow
Grade 2 Grade 3 Grade 4-5 Grade 6-7 Grade 8 orhigher
ABLE Grade Equivalent
Perc
enta
ge o
f Tes
t-T
aker
s
0102030405060
Grade 1 orbelow
Grade 2 Grade 3 Grade 4 Grade 5 Grade 6 orhigher
TOWRE SWE Grade Equivalent
Perc
enta
ge o
f Tes
t-T
aker
s
-9-
The LILAA Persistence StudyFigure 2.2
Literacy Test Age/Grade Equivalentsfor English Speakers and English Learners
0
20
40
60
80
Under 5 Age 5-7 Age 8-10 Age 11-13 Age 14-16 Over 16
PPVT Age Equivalent
Perc
enta
ge o
f Tes
t-T
aker
sEnglish speakers English learners
0
20
40
60
80
Grade 1 orbelow
Grade 2 Grade 3 Grade 4-5 Grade 6-7 Grade 8 orhigher
ABLE Grade Equivalent
Perc
enta
ge o
f Tes
t-T
aker
s
0
20
40
60
80
Grade 1 orbelow
Grade 2 Grade 3 Grade 4 Grade 5 Grade 6 orhigher
TOWER SWE Grade Equivalent
Perc
enta
ge o
f Tes
t-T
aker
s
0
20
40
60
80
Grade 1 orbelow
Grade 2 Grade 3 Grade 4 Grade 5 Grade 6 orhigher
TOWER PDE Grade Equivalent
Perc
enta
ge o
f Tes
t-T
aker
s
SOURCE: LILAA Achievement Study Database.
NOTES: Sample sizes varied among the tests, from 210 to 240. Ages and grade levels are rounded to the nearest whole number.

-10-
reading comprehension skills to their English learning. On the other hand, English-speaking ABE learners may not have developed these basic skills. In addition, the schooling of ESOL students may have focused on reading and writing academic English, with less attention paid to their verbal abilities. Finally, because the test scores already capture some of the effects of students’ program participation, the higher scores recorded by English learners may suggest that their literacy skills increased more quickly as they participated in these programs.
Patterns of Persistence Among LILAA Participants
What Are the Overall Participation Patterns of the LILAA Population?
The 2003 report presents early findings on levels and patterns of student persistence in the first two years of the study.4 Drawing on attendance records from each of the library literacy programs, these analyses were groundbreaking for the adult literacy field, in that, for the first time, they provided a reliable baseline about student persistence. Now, at the conclusion of the study, with an additional year of attendance data, it is possible to explore changes in persistence patterns over time. Persistence is challenging to quantify, but measures of students’ participation in terms of how long (duration of participation) and how much (hours of activity) capture key aspects of their involvement in library literacy services.
Because of the numerous barriers to persistence faced by most adult students, it is not surprising that many library literacy participants do not end up staying very long. Almost two-thirds of entering LILAA students stopped participating by the end of six months after entering.5 (A stop in participation is defined here as three or more months of no activity.)6 Some of these students left their program very quickly. As Figure 2.3 shows, almost 20 percent of all entering students stopped after just one month, and another 24 percent stopped after two or three months.7 Overall, the median length of time that students remained engaged in a LILAA pro-gram before leaving was 4.7 months. In other words, half the entering students left before the
4See Comings, Cuban, Bos, and Porter, 2003. 5Entering students are defined as those who began participating in literacy learning activities at a LILAA
program after a period of three or more months without program activity. 6In the period before a stop in participation, there may have been interruptions of one or two months.
Some of these interruptions may have resulted from data problems (that is, a tutor who failed to report hours of participation). It is reasonable to assume that a gap of three months would not be a result of consecutive errors and is, therefore, interpreted as a departure from program activities. It is possible that some students returned later to start the program again.
7Because data collection ended in December 2002, it was not possible to determine when students who were active at that point exited; therefore the rates of exit presented here may slightly underestimate the actual percentage of students in the sample who stopped participating at various durations. For further explanations of the sample definitions and limitations, see Appendix D.

-11-
The LILAA Persistence Study
Figure 2.3
Percentage of Students Who Exited the Program, by Month After Entry
0
10
20
30
40
50
60
70
80
90
100
0 1 2 3 4 5 6 7 8 9 10 11 12
Month After Entry
Perc
enta
ge W
ho E
xite
d
SOURCE: MDRC calculations from site-reported participation data collected between January 2000 and December 2002.
NOTES: The sample includes 4,255 students who entered one of the nine LILAA programs between January 2000 and September 2002. For a full description of sample, see Appendix B. For students who entered the program in the later months, exits could not always be determined. Therefore, these percentages slightly underestimate the actual percentage of students who exited in Months 2 through 12.

-12-
end of five months, and half stayed longer. Some of the early departures likely include students who tried out a program but soon realized that another educational setting was more appropriate for their needs. But the early departures also likely include students who decided that they were not yet ready to undertake improving their literacy or who faced a high level of barriers that in-terfered with ongoing participation.
Some students participated consistently over their period of activity, while others may have had absences as long as one or two months. For example, among those students who par-ticipated for six months before exiting, 23 percent had an absence of at least one month. Exclud-ing gaps of inactivity from students’ total months of participation, for the full sample of entering students, the median length of participation was 4.3 months. Chapter 4 draws on case study re-search to discuss in more detail the various patterns of persistence, or pathways, and presents ideas about how library literacy programs might address students’ different needs.
Intensity of participation is also an important factor in achieving literacy improvements. In those months that students did attend a LILAA program, how much time did they spend in literacy learning activities? On average, students spent 8.5 hours a month in literacy activities at a LILAA program (Table 2.2). This translates to approximately a little over 2 hours a week. Overall, students spent an average of 58 hours in literacy activities at a LILAA program before exiting.8 However, this average is largely influenced by a small number of long-term students. Half of all students who exited spent a total of 28 hours or less in LILAA literacy offerings — far fewer than the 100 to 150 hours estimated to be needed for meaningful gains.9
Computer lab activities and tutoring, either in a small groups or one-on-one, were offered by all the LILAA programs. Only two programs offered formal classes led by trained instructors. (Appendix A describes the offerings at each program.) Students who participated in computer lab activities spent an average of 6.8 hours at a computer in active months; students who participated in tutoring spent an average of 7.1 hours with a tutor in active months; and students who partici-pated in classes spent an average of 5.3 hours attending classes in active months.
Table 2.2 shows that students who persisted longer also tended to participate more in-tensely. For example, students who participated for more than six months averaged 10.5 hours of participation per month. However, students who participated between four and six months averaged 9.1 hours, and students who participated for three months or less averaged 6.7 hours of participation per month.10 The positive relationship between persistence and hours of participa-tion shows that students who participated more were more likely to stick with the program.
8Because the researchers were unable to determine when some students exited a program, this figure
slightly underestimates total hours of participation. 9See Sticht, 1982; Darkenwald, 1986; Comings, Sum, and Uvin, 2000. 10These differences are statistically significant at the .05 level.

-13-
However, it is not possible to determine whether intensive participation increased persistence or whether intensive participators were simply different from other learners at the outset.
In sum, these findings illustrate the considerable challenge that literacy programs face in retaining adult students long enough and engaging them intensively enough to help them make real gains in their literacy abilities. Persistence among the LILAA students was low. A significant percentage stayed in their program for only one month. Some may have been “pro-gram shoppers,” trying out the program to see whether it fit their needs. However, the observa-tion that many more students stopped participating after just two or three months underscores the importance of establishing a connection with students and learning about their unique needs soon after they enroll. Also, although it may be difficult to find more than two hours a week to participate in a literacy program, such a limited time probably isn’t enough to make significant strides in learning to read and write.
Did Persistence Change Over Time?
Over the course of the LILAA initiative, the library literacy programs that were partici-pating in the persistence study heightened both their awareness of the personal and environ-mental factors affecting their adult students’ persistence and their awareness of the students’
The LILAA Persistence Study
Table 2.2
Average Monthly Hours of Participation, When Active, forStudents Entering a LILAA Program Between January 2000 and September 2002
Average Monthly Hours
Average monthly hours of participation, when active 8.5
Average monthly hours for students with 1 to 3 months of participation 6.7Average monthly hours for students with 4 to 6 months of participation 9.1Average monthly hours for students with more than 6 months of participation 10.5
SOURCE: MDRC calculations from site-reported participation data collected between January 2000 and December 2002.
NOTES: The full sample includes 4,255 students who entered one of the nine LILAA programs between January 2000 and September 2002. Average monthly hours are calculated across all active months, from entry to confirmed exit or end of data collection.

-14-
actual participation patterns. Some of the strategies that the LILAA programs designed and im-plemented to improve persistence reflect an improved understanding of these factors and trends. But, as is discussed in Chapters 3 and 4, successfully addressing the complex and diverse needs of their students proved to be more difficult than expected. The programs had more success im-plementing programmatic strategies — such as adjustments in operating hours and enhanced computer lab activities — which made participation more convenient and more valuable. Most of these strategies, however, were small enhancements to what the programs were already doing prior to the LILAA initiative. But given that the programs did make efforts to make it easier for students to participate, did they succeed in making any improvements in learners’ persistence? Did their attempts or their increased attention to their students’ varying needs have any effect?
In order to make comparisons of persistence measures over time, the analysis focuses on two cohorts of entering students: Cohort 1 entered between July 2000 and June 2001; and Cohort 2 entered between July 2001 and June 2002. Because the LILAA programs’ strategies for improving persistence were gradually designed and implemented between January 2000 and June 2002, these two cohorts bridged changes in both program practices and staff awareness of students’ barriers to persistence. 11 The two cohorts were similar in other ways as well, as seen in Table 2.3, which compares their demographic characteristics and primary program activities.
Figure 2.4 compares the two cohorts’ exit rates for the first year after program entry.12 It shows that students in the later cohort, who entered after most persistence strategies were in place, stopped participating at a slightly higher rate, or sooner, than their peers in the earlier co-hort. For example, 22 percent of Cohort 2 participated for only one month, compared with 13 percent of Cohort 1. And 48 percent of Cohort 2 stayed for three months or less, compared with 35 percent of Cohort 1. In subsequent months, however, the rates become more similar, with approximately the same percentage in each cohort having exited by Month 6. It is possible that for longer-term students — those already staying in the program beyond one year — there was improved ongoing persistence, but the available data do not allow such a comparison. (As is discussed later in the report, the qualitative research suggests that many program strategies benefited the longer-term students.) However, there was no overall improvement in retaining the majority of students (more than 80 percent), who participated for less than a year.
11This selection of cohorts provides the most accurate comparisons because it excludes data from the earli-
est months of the study, when many of the programs were still working out challenges in collecting and enter-ing data. This selection also excludes students entering in the last months of the study; often, program exit can-not be determined because the data collection ended in December 2002.
12Cohort 2 includes more students for whom an exit could not be determined. However, the resulting bias only affects exit rates after Month 4, and assuming that exit rates for this group are similar to the exit rates for the rest of the cohort, this bias is small in Months 5 through 12.

-15-
The LILAA Persistence Study
Table 2.3
Demographic Characteristics and Primary Activities of Entrant Sample, by Cohort
_freq_ 2.0 _freq_ 3.0
Number Percentage Number Percentage
GenderMale 596 40.4 695 41.5Female 880 59.6 980 58.5
Age groupUnder 21 131 9.1 152 9.221 - 35 578 39.9 682 41.136 - 50 500 34.6 563 34.051 - 65 196 13.6 205 12.4Over 65 42 2.9 56 3.4
EthnicityBlack 583 39.7 622 36.8Hispanic 398 27.1 489 29.0Asian/Pacific Islander 266 18.1 409 24.2White 46 3.1 59 3.5Other 177 12.0 110 6.5
Primary activityTutoring 548 36.9 464 27.1Classes 215 14.5 213 12.4Computer lab 716 48.2 1,012 59.1
Program SiteGreensboro 227 15.3 269 15.7Oakland 112 7.5 98 5.7Redwood City 94 6.3 90 5.3Central 211 14.2 372 21.7Flushing 155 10.4 309 18.1Rochdale 110 7.4 109 6.4Fordham 292 19.6 234 13.7Seward 150 10.1 94 5.5Wakefield 136 9.2 137 8.0
Sample size 1,487 1,712
Cohort 1 Cohort 2July 2000-June 2001 July 2001-June 2002
SOURCE: MDRC calculations from site-reported participation data collected between January 2000 and December 2002.
NOTES: Cohort 1 is defined by the 1,487 students who entered the program between July 2000 and June 2001. Cohort 2 is defined by the 1,712 students who entered the program between July 2001 and June 2002. See Appendix B for a full description of the sample. Percentage values may not sum to 100 percent, and number of students may not sum to respective sample sizes, due to missing values or, in the case of primary activity, to categorization as "other."

-16-
The LILAA Persistence Study
Figure 2.4
Percentage of Students Who Exited the Program, by Month After Entry and by Cohort
0
10
20
30
40
50
60
70
80
90
100
0 1 2 3 4 5 6 7 8 9 10 11 12
Month After Entry
Cohort 1, July 2000 - June 2001 (N=1,487)
Cohort2, July 2001 - June 2002 (N=1,712)
Cohort 1: Median length of stay = 5.4 months
Cohort 2: Median length of stay = 4.2 months
Perc
enta
ge W
ho E
xite
d
Month of ParticipationSOURCE: MDRC calculations from site-reported participation data collected between January 2000 and December 2002.
NOTES: The sample includes students who entered one of the nine LILAA programs between July 2000 and June 2002. Cohort 1 is defined by the 1,487 students who entered the program between July 2000 and June 2001. Cohort 2 is defined by the 1,712 students who entered the program between July 2001 and June 2002. For students who entered the program in the later months, exits could not always be determined because data collection ended in December 2002. Cohort 2 includes more students for whom an exit could not be determined. However, the resulting bias only affects exit rates after Month 4. Assuming that exit rates for this group are similar to the exit rates for the rest of the cohort, this bias is estimated to be less than 2 percent in Months 5 through 12. Exit rate differences between cohorts are statistically significant for each month after entry.

-17-
From these data, it appears that the only real change in length of participation over time
was that the students who stopped participating in program activities within a year stopped ear-lier in Cohort 2. The possible reasons are many, and they likely vary by program. For example, some programs with more early exits in Cohort 2 had large increases in the number of entering students; one program’s increase was as great as 99 percent in its already-large student popula-tion. The higher numbers of entering students may have made it more difficult to connect with students at the beginning of the program, or the increase may have brought in more students for whom the program was not well suited. It may also be the case that administrative changes at some programs affected students’ choices to remain in a program or influenced the types of stu-dents entering. Some students may have had more help in realizing that the program was not a good fit for their needs and were encouraged to seek other educational opportunities.
With respect to intensity of participation when active, students in Cohort 1 participated for an average of 8.3 hours per month, while their peers in Cohort 2 participated for an average of 9.0 hours per month. These comparisons, presented in Table 2.4, indicate an upward trend over time. The table also compares hours in each type of instructional activity. It shows a slight decline in average hours of participation in tutoring but a jump in average hours of participation in the com-puter lab. As the 2003 report describes in detail, all the LILAA programs upgraded and expanded their computer labs during the first couple of years of the initiative, by improving their hardware and software systems and by providing more assistance in using the computers.13 The investments appear to have paid off in increased usage of the computer labs by students; this finding likely explains much of the overall increase in hours of program participation when active.
In sum, there was not a significant change in LILAA students’ persistence over time, whether measured by length or intensity of participation. The LILAA programs’ efforts to im-prove the persistence of their adult literacy students may have had a positive impact on some of their learners, but, in the first year after planning and implementing a variety of strategies, there was no overall improvement. Chapter 3 discusses the programs’ experiences in implementing strategies aimed at improving persistence; it explains the unique challenges that library literacy programs face in altering their programs to help their students, and it offers some recommenda-tions on ways that programs can continue to work to address their students’ varying needs.
Did Persistence Vary by Subgroup?
As the above analysis concludes, overall, participation levels in the LILAA programs did not vary substantially by cohort — by the year in which students entered their program. But before this story can be completed, it is important to look for any exceptions among subgroups
13Comings, Cuban, Bos, and Porter, 2003.

-18-
of students. Do participation patterns look different for various subgroups? Are there any excep-tions to the cohort story when focusing on particular subgroups?
For the full sample and for each year’s cohort, Table 2.5 shows the entering students’ median length of monthly participation in a LILAA program, and Table 2.6 shows the average monthly hours of participation, when active, for subgroups defined by demographic characteris-tics and primary program activity. The tables show that some differences were found across subgroups by age — older students tended to participate more hours per month — and by eth-nicity (though the latter differences are intertwined with those related to the local programs, be-cause ethnic groups tended to be clustered by program). When comparing demographic sub-groups, these tables also show little difference from the overall cohort findings.
The LILAA Persistence Study
Table 2.4
Average Monthly Hours of Participation, When Active, forStudents Entering a LILAA Program Between July 2000 and June 2002,
by Cohort
Cohort 1 Cohort 2
Average monthly hours of participation, when active 8.3 9.0
Average monthly hours for students with 1 to 3 months of participation 6.9 7.0Average monthly hours for students with 4 to 6 months of participation 7.7 9.8Average monthly hours for students with more than 6 months of participation 10.2 11.6
Average monthly hours of participation in tutoring 3.3 2.8Average monthly hours of participation in classes or group activity 0.9 0.9Average monthly hours of participation in computer lab 4.1 5.3
Average Monthly Hours
SOURCE: MDRC calculations from site-reported participation data collected between January 2000 and December 2002.
NOTES: Cohort 1 is defined by the 1,487 students who entered the program between July 2000 and June 2001. Cohort 2 is defined by the 1,712 students who entered the program between July 2001 and June 2002. Average monthly hours of participation in the three activities are calculated from each of the full cohort samples and therefore include students who may not have participated in a given activity. Not all LILAA programs offered all activities. For example, only two programs offered classes. Average monthly hours are calculated across all active months, from entry to confirmed exit or end of data collection. Cohort 2 includes more students for whom an exit could not be determined. However, the resulting bias only affects exit rates after Month 4, and assuming that exit rates for this group are similar to the exit rates for the rest of the cohort, this bias is estimated to be less than 2 percent in Months 5 through 12.
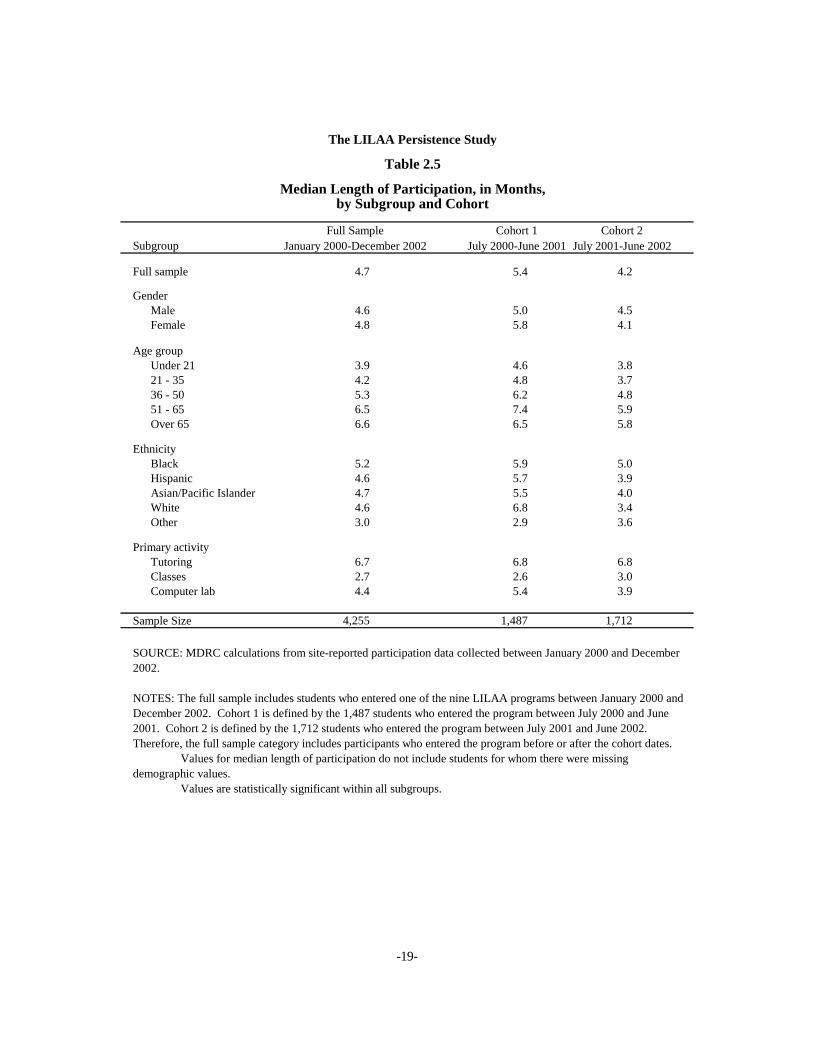
-19-
The LILAA Persistence Study
Table 2.5
Median Length of Participation, in Months,by Subgroup and Cohort
Full Sample Cohort 1 Cohort 2Subgroup January 2000-December 2002 July 2000-June 2001 July 2001-June 2002
Full sample 4.7 5.4 4.2
GenderMale 4.6 5.0 4.5Female 4.8 5.8 4.1
Age groupUnder 21 3.9 4.6 3.821 - 35 4.2 4.8 3.736 - 50 5.3 6.2 4.851 - 65 6.5 7.4 5.9Over 65 6.6 6.5 5.8
EthnicityBlack 5.2 5.9 5.0Hispanic 4.6 5.7 3.9Asian/Pacific Islander 4.7 5.5 4.0White 4.6 6.8 3.4Other 3.0 2.9 3.6
Primary activityTutoring 6.7 6.8 6.8Classes 2.7 2.6 3.0Computer lab 4.4 5.4 3.9
Sample Size 4,255 1,487 1,712
SOURCE: MDRC calculations from site-reported participation data collected between January 2000 and December 2002.
NOTES: The full sample includes students who entered one of the nine LILAA programs between January 2000 and December 2002. Cohort 1 is defined by the 1,487 students who entered the program between July 2000 and June 2001. Cohort 2 is defined by the 1,712 students who entered the program between July 2001 and June 2002. Therefore, the full sample category includes participants who entered the program before or after the cohort dates. Values for median length of participation do not include students for whom there were missing demographic values. Values are statistically significant within all subgroups.

-20-
The LILAA Persistence Study
Table 2.6
Average Monthly Hours of Participation, by Subgroup and Cohort
NSPHRS_Mean NSPHRS Mean NSPHRS Mean
Full Sample Cohort 1 Cohort 2Subgroup January 2000-December 2002 July 2000-June 2001 July 2001-June 2002
Full sample 8.5 8.3 9.0
GenderMale 8.8 8.7 9.3Female 8.4 8.1 9.0
Age groupUnder 21 8.7 8.8 9.721 - 35 8.1 8.0 8.636 - 50 8.6 8.2 9.151 - 65 9.4 9.3 10.2Over 65 9.9 10.3 10.4
EthnicityBlack 9.6 9.8 9.8Hispanic 7.9 7.6 8.5Asian/Pacific Islander 8.1 7.4 9.1White 7.6 7.9 7.7Other 7.4 6.7 8.4
Primary activitya
Tutoring 9.5 9.0 10.4Classes 6.7 6.5 7.1Computer lab 8.4 8.4 9.0
freq freq freqSample size 4,255 1,487 1,712
Average Monthly Hours
SOURCE: MDRC calculations from site-reported participation data collected between January 2000 and December 2002.
NOTES: The full sample includes 4,255 students who entered one of the nine LILAA programs between January 2000 and September 2002. Cohort 1 is defined by the 1,487 students who entered the program between July 2000 and June 2001. Cohort 2 is defined by the 1,712 students who entered the program between July 2001 and June 2002. Therefore, the full sample includes participants who entered the program before or after the cohort dates. Average monthly hours are calculated across all active months, from entry to confirmed exit or end of data collection. aAverage monthly hours by primary activity represent students' average total hours across all activities; values are organized into categories according to the activity in which a student spent the most time between entry and exit.

-21-
However, there are some interesting variations when comparing the participation of stu-dent subgroups defined by primary program activity. Tables 2.5 and 2.6 show that it was the stu-dents whose main activity was tutoring who had both the longest participation and the greatest intensity of participation. (It is important to keep in mind, however, that although the differences are statistically significant when controlling for site, they could result, in part, from program-specific characteristics, because the types of activities that the sites offered varied.) In addition, there was no change in participation over time for students whose main activity was tutoring. Also, for students whose main activity was classes, there was a small improvement in the length of participation over time. However, among students whose main activity was computer lab, 59 percent of the sample (as shown in Table 2.3) were more in line with the overall trend of a de-crease in the length of participation over time. But as Table 2.6 shows, it appears that students in all activities added hours in the computer lab, as hours increased slightly for all three subgroups.
Were There Differences in Persistence Across the LILAA Programs?
Table 2.7 shows that there were substantial differences in student persistence across the LILAA programs. First, it shows that the median length of participation — 4.8 months for all programs combined — ranged from 2.4 months to 7.3 months across the nine individual pro-grams. The variations observed for this measure are due to large variations in exit rates during the early months. For example, as noted earlier, 19 percent of students across all programs par-ticipated for just one month before exiting. However, across the nine LILAA programs, this proportion ranged from approximately 4 percent to 42 percent. Six months after program en-trance, exit rates ranged from 44 percent to 84 percent. These differences across programs re-main even after controlling for participants’ characteristics (age, ethnicity, and gender) and for the activity offerings for which data were reported; however, the differences may reflect other variations in the kinds of students served and the types and frequency of instruction offered. In addition, the varying rates may reflect different approaches in the programs’ recruitment and intake procedures. They may indicate that some programs attracted a lot of students who ended up deciding that the program was not the best option for their needs. They may also indicate that some programs had a culture or policies that increased the likelihood that students would stay past the first months; for example, some programs had a longer waiting period before assigning students to a tutor. Average hours of participation in active months (those months when the stu-dent was in attendance) also varied substantially by program, ranging from 6.4 hours to 11.4 hours per month. The differences in intensity of participation across programs could indicate different program capacities to help students persist, in terms of dedicating substantial amounts of time to literacy activities, but they could also indicate different foci of the programs, in terms of the kinds of students served and the types and frequency of instruction.
These findings demonstrate that the literacy programs in the LILAA study faced differ-ent challenges in improving the persistence of their adult students. Inasmuch as the programs

NSPHRS_MeanSPHRS MeanSPHRS Mean
Full Sample Cohort 1 Cohort 2 Full Sample Cohort 1 Cohort 2
Full sample 8.5 8.3 9.0 2 4.7 5.4 4.2
Program siteA 6.4 6.0 6.5 6 2.4 2.4 2.6B 7.6 8.9 7.0 7 3.2 3.8 2.5C 7.7 8.1 8.1 8 7.3 12.0 6.7D 7.2 7.9 7.1 3 3.1 4.3 2.9E 7.6 6.5 9.5 5 6.0 6.5 4.9F 8.9 9.1 8.1 9 6.5 6.7 4.6G 11.4 9.8 13.2 4 7.2 7.6 7.1H 9.8 8.1 12.4 10 4.7 6.1 3.9I 11.4 11.0 11.5 11 5.1 4.6 6.0
freq freq freq
Average Monthly Hours Median Length of Stay, Months
The LILAA Persistence Study
Table 2.7
Average Monthly Hours of Participation and Median Length of Stay,by Program and Cohort
SOURCE: MDRC calculations from site-reported participation data collected between January 2000 and December 2002.
NOTES: The full sample includes 4,255 students who entered one of the nine LILAA programs between January 2000 and September 2002. Cohort 1 is defined by the 1,487 students who entered the program between July 2000 and June 2001. Cohort 2 is defined by the 1,712 students who entered the program between July 2001 and June 2002. Therefore, the full sample category includes participants who entered the program before or after the cohort dates. Average monthly hours are calculated across all active months, from entry to confirmed exit or end of data collection.
-22-

-23-
are located in different communities and within different library systems and have different ca-pacities, their clientele and their approaches probably varied in many ways that are not captured by the data. However, despite the many differences among these programs, there was not as much variation as one might expect in their abilities to enhance student persistence over the course of the LILAA initiative. As Table 2.7 shows, a couple programs (A and I) bucked the trend by slightly increasing the median length of participation, and while the increase in average monthly hours occurred at most programs, it did not happen everywhere. Overall, however, the similarity of trends across the programs demonstrates the challenges that all the libraries faced and that they continue to face in improving the persistence of their adult literacy students.
In sum, the analyses presented in this section show that although there were some shifts in the patterns of student persistence in these library literacy programs, overall participation re-mained at low levels. Among both cohorts, almost two-thirds of entering students stopped par-ticipating before the end of six months after entering, and approximately four-fifths left before the end of one year after entering. Entering students in Cohort 2 tended to leave earlier than in Cohort 1, for a variety of reasons likely depending on the program, and there was a small in-crease from Cohort 1 to Cohort 2 in the students’ levels of activity, due mostly to spending more time in the computer labs. A couple programs were slightly more successful in improving their students’ participation, but overall persistence patterns remained the same.
Were There Improvements in Literacy Achievement?
Approximately 63 percent of the students who took achievement tests at the beginning of the study, and whose scores were discussed earlier in this chapter, took the same battery of tests (with equivalent versions of the same tests) approximately one year later.14 Using these two waves of testing, it is possible to examine gains in literacy skills over time and to explore the link between student persistence and achievement gains.
Table 2.8 shows the average scores for those who took the tests in both waves. (Stars note a statistically significant difference between the two waves.) Small but meaningful gains were found on the ABLE and the BEST, two tests that measure overall reading comprehension. On the ABLE, there was a statistically significant average gain close to one-half a grade level (0.4). And on the BEST, students of English for Speakers of Other Languages (ESOL) gained an average of 5.1 out of 82.0 possible points — typically enough to raise a student’s skill level by half a level on the 10 levels of language ability designated for the test. This gain, therefore, may indicate improved English ability in daily life. There was also a very small gain on the SWE (Sight Word Efficiency) component of the TOWRE, which tests the ability to identify
14For more information about the battery of tests used, see Appendix C.

-24-
and pronounce real words. No statistically significant gains were found on the other tests — the PDE (Phonemic Decoding Efficiency) component of the TOWRE, which measures the abil-ity to read and pronounce made-up words, and the PPVT, which measures vocabulary skills.
Some studies have shown that at least 100 hours of instruction are needed for an in-crease of one grade level in literacy skills.15 In the sample of students who took both waves of tests, some participants spent as few as 2 hours and others as many as 744 hours in tutoring, classes, or computer lab activities at a LILAA program. Did the students who spent more hours dedicated to literacy learning make greater strides as measured by these tests?16
15See Sticht, 1982; Darkenwald, 1986; Comings, Sum, and Uvin, 2000. 16Using multivariate analysis, the researchers examined the effect of hours as well as a number of meas-
ures that may have had some predictive effect on Wave 2 scores, including student’s scores on Wave 1, their program site, their primary learning activity, whether or not they were an ESOL student, and their gender, age, and ethnicity.
The LILAA Persistence Study
Table 2.8
Achievement Study Tests,Age/Grade Equivalents
Test Wave 1 Wave 2 Difference Sample SizeW1ABEQV_W2ABEQV_ABEQVD_Mean W2ABEQV_
ABLE (grade equivalent) 4.14 4.54 0.40 ** 131W1PPAGE_W2PPAGE_PPAGED_MeanW2PPAGE_N
PPVT (age equivalent) 10.79 10.50 -0.29 150W1PDEQV_W2PDEQV_PDEQVD_MeanW2PDEQV_N
TOWRE (grade equivalents) W1SWEQVW2SWEQVSWEQVD_MeanW2SWEQV_NPDE 2.74 2.71 -0.03 121SWE 2.83 2.93 0.11 * 129
W1BTOTL_W2BTOTL_BTOTLD_MeanW2BTOTL_NBEST (conversion score) 6 6 0
(Total score) 58.86 63.95 5.09 *** 44W1CMBSTDW2CMBSTDDCMBSTD_Mea W2CMBEQV
SOURCE: MDRC calculations from site-reported participation data collected between January 2000 and December 2002.
NOTES: Sample sizes represent students who took tests both in Wave 1 and in Wave 2. The BEST conversion score is a 1 to 10 scale defined by the BEST. See Appendix C for details. Statistical significance levels are indicated as: *** = 1 percent; ** = 5 percent; * = 10 percent.

-25-
Students’ scores in Wave 2 (or their gains in literacy) were not found to be a function of the amount of time that they spent in attendance at a library literacy program.17 The lack of a rela-tionship between hours and achievement may suggest that even students with higher levels of ac-tivity did not spend enough time to make a large difference in literacy learning. This finding may also suggest that the instruction that these library literacy students received was not the type needed to produce measurable improvements on these tests. For each of the tests — as well as for a combined score for all tests — the researchers found that of all these possible measurable predic-tors of scores in Wave 2, only a student’s Wave 1 score had any effect. The analysis also revealed that achievement gains did not vary by any of the demographic or programmatic subgroups.18
In sum, modest participation in literacy activities led to modest gains in achievement on standardized tests. Because the population served by library literacy programs tends to have very low literacy skills (and often learning disabilities, as well), even minor gains are more dif-ficult to achieve, and thus the findings of some small gains can be viewed as promising. How-ever, most of the students are not persisting in their learning — whether inside or outside the LILAA programs — enough to make meaningful gains on standardized tests. Students in sur-veys did identify positive outcomes of program participation. For example, students reported using types of print and electronic text that they had not used before. Students also expressed that they felt that they had made some progress in learning. This change in literacy practices and self-efficacy about learning might cause students to continue to improve their literacy skills even after they stop participating in instruction.
17To determine this relationship, the researchers tested hours between the tests both linearly and by levels
defined by quartiles in order to limit the effect of outliers. Both approaches revealed the same finding. 18This is not to say that those students who did achieve gains on literacy tests do not share common char-
acteristics. It may be that the students entering these library literacy programs tended to be alike in ways that predict their ability to improve their literacy achievement or that the ways in which they differed were not cap-tured by the demographic or program characteristics for which data were available.


-27-
Chapter 3
The Challenge of Improving Student Persistence
At the start of the Literacy in Libraries Across America (LILAA) persistence study, the nine library programs set out to develop specific strategies for improving the persistence of their adult literacy students. However, designing and implementing strategies above and beyond what the programs were already doing to support persistence proved to be more challenging than ex-pected. The LILAA programs were successful in making a few improvements to their existing services, but they encountered many challenges in developing new strategies that got to the heart of the persistence problem: students’ personal barriers to participation. Consequently, as shown in Chapter 2, it not surprising that persistence did not improve over the three years of the study.
This chapter illustrates the challenges of improving student persistence by describing the experiences of the nine LILAA programs. Most improved their core program services to better accommodate students’ needs. A few also developed a social service capacity to help stu-dents address their personal difficulties. Because the second approach tackled the primary fac-tors affecting persistence, it had the greater potential to realize the goals of the LILAA initiative. However, the greater challenges of implementing this second approach severely limited the number and scope of the social service strategies that were put in place by the LILAA pro-grams. Implementation of the first approach was more complete, but because the service changes represented only minor improvements over what the programs were already doing, these strategies had less potential to increase persistence.
This chapter has three main sections. The first section provides an overview of the bar-riers to persistence among the LILAA adult student population. Then the chapter describes the LILAA programs’ experiences with each of the two approaches to improving student persis-tence that are outlined above. The concluding section summarizes what other library literacy programs can learn from the LILAA programs’ experiences, and it recommends some next steps that might improve student persistence in these programs.
Barriers to Persistence A valuable contribution of the LILAA persistence study is that it provides a better un-
derstanding of the personal and environmental factors that inhibit adult literacy students’ persis-tence. The 2003 report describes these factors in detail and their prevalence among the LILAA clientele.1 The report highlights that many of the LILAA programs’ students face serious diffi-
1Comings, Cuban, Bos, and Porter, 2003.
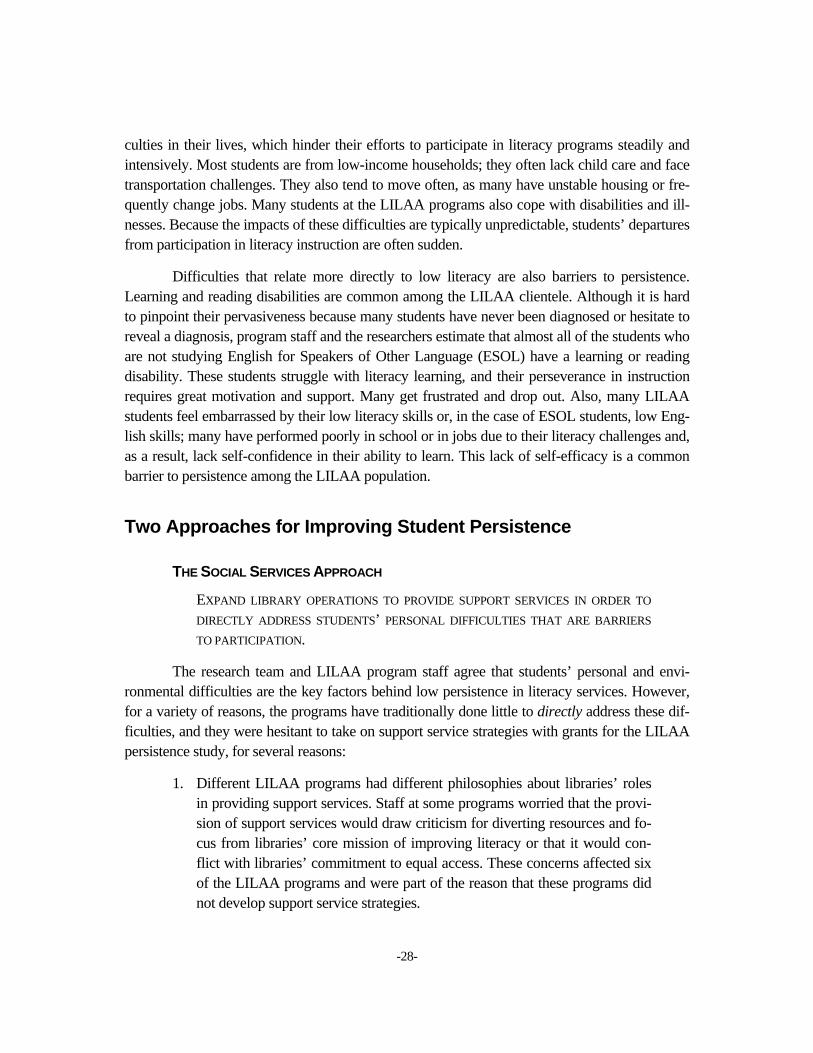
-28-
culties in their lives, which hinder their efforts to participate in literacy programs steadily and intensively. Most students are from low-income households; they often lack child care and face transportation challenges. They also tend to move often, as many have unstable housing or fre-quently change jobs. Many students at the LILAA programs also cope with disabilities and ill-nesses. Because the impacts of these difficulties are typically unpredictable, students’ departures from participation in literacy instruction are often sudden.
Difficulties that relate more directly to low literacy are also barriers to persistence. Learning and reading disabilities are common among the LILAA clientele. Although it is hard to pinpoint their pervasiveness because many students have never been diagnosed or hesitate to reveal a diagnosis, program staff and the researchers estimate that almost all of the students who are not studying English for Speakers of Other Language (ESOL) have a learning or reading disability. These students struggle with literacy learning, and their perseverance in instruction requires great motivation and support. Many get frustrated and drop out. Also, many LILAA students feel embarrassed by their low literacy skills or, in the case of ESOL students, low Eng-lish skills; many have performed poorly in school or in jobs due to their literacy challenges and, as a result, lack self-confidence in their ability to learn. This lack of self-efficacy is a common barrier to persistence among the LILAA population.
Two Approaches for Improving Student Persistence
THE SOCIAL SERVICES APPROACH
EXPAND LIBRARY OPERATIONS TO PROVIDE SUPPORT SERVICES IN ORDER TO
DIRECTLY ADDRESS STUDENTS’ PERSONAL DIFFICULTIES THAT ARE BARRIERS
TO PARTICIPATION.
The research team and LILAA program staff agree that students’ personal and envi-ronmental difficulties are the key factors behind low persistence in literacy services. However, for a variety of reasons, the programs have traditionally done little to directly address these dif-ficulties, and they were hesitant to take on support service strategies with grants for the LILAA persistence study, for several reasons:
1. Different LILAA programs had different philosophies about libraries’ roles in providing support services. Staff at some programs worried that the provi-sion of support services would draw criticism for diverting resources and fo-cus from libraries’ core mission of improving literacy or that it would con-flict with libraries’ commitment to equal access. These concerns affected six of the LILAA programs and were part of the reason that these programs did not develop support service strategies.

-29-
2. Safeguarding the privacy of library users has long been a core tenet of the U.S. library system, so it is little surprise that concerns about privacy issues were a second reason that support service strategies were restricted. LILAA program staff struggled with how to reconcile their desire to gather informa-tion about students’ needs with the mandate they felt to respect students’ pri-vacy. Moreover, because many students were hesitant to reveal their personal difficulties, it was difficult for the LILAA programs to assess students’ most pressing needs or to figure out which students would benefit from particular support services. Moreover, some staff worried that students might feel em-barrassed to take advantage of social services.
3. Capacity constraints were a third reason that the LILAA programs’ persis-tence strategies focused little on support services. Most social service strate-gies are costly because they often require hiring additional staff and expand-ing current staff members’ expertise. Moreover, despite having received funds to implement a social service strategy, the program directors worried that when the funds ran out, they would not be able continue a service that students relied on to support their persistence.
Three of the nine LILAA programs did, however, attempt some limited direct support service strategies. At these three programs, there was a vision for the libraries to play an ex-panded role in providing student support services in addition to literacy activities. The directors of these programs believed that students’ needs should be met holistically, either directly by library staff or through collaborations with local service providers. The strategies that the pro-grams tried during the study were limited to child care and transportation vouchers, however, and the programs often met hurdles that illustrate the challenges in applying the social services approach to boost student persistence.
Two programs implemented child care services during the persistence study. One pro-gram hired staff to provide child care on-site twice a week during a women’s literacy class. Al-though the service was welcomed by the students, it was dropped after approximately one year because of concerns about licensing requirements and because the library lacked sufficient space to accommodate it. The other program’s child care service was referred to as “preschool” because the children participated in learning activities. The program drew on current and former adult literacy students as well as students at a local community college to provide the child care during evening classes. This design was more sustainable. Although the other LILAA programs did not implement child care, many offered “family literacy” services, which created opportuni-ties for parents and children to learn together. Although family literacy activities did not give adults the time needed to concentrate on their own learning needs, they provided another way

-30-
for adult students to be engaged in the program. Overall, the child care strategies met a pressing need for some students, and one program showed that such services can be implemented.
Two LILAA programs attempted to address the financial hardships related to students’ transportation by establishing bus-voucher strategies. At one site, however, the voucher strategy never really got off the ground because there were not enough users. Many students did not know about the availability of vouchers; the number of vouchers they received was not suffi-cient to cover their transportation costs; and the local bus system was not convenient for most students. At the other LILAA site, transportation vouchers were in high demand and were given out liberally. However, soon there were not enough vouchers to meet demand, and staff learned that some students were taking more vouchers than needed for their commute to the library. The program responded by restricting vouchers to the students who met certain criteria. At both pro-grams, the voucher strategies did little to alleviate students’ transportation difficulties.
Although social service strategies were limited at the LILAA programs, it is important to point out that all the programs did offer a variety of informal and ad hoc social supports. These supports were a product of the caring environments inherent in the LILAA programs’ cultures, rather than a result of strategic planning related to the persistence study. For example, most of the programs offered informal counseling and referrals, which typically took the form of advice to individual students who sought help or confided in a tutor or staff member. Pro-grams often encouraged tutors to listen to students and to refer them to the program directors for help. Some programs designated staff as “learner advocates” or “persistence coordinators” who dedicated time to reaching out to students or to developing referral resources. Some programs recruited former or longtime literacy students to serve as mentors for other students. Individuals who took on these supportive roles served in some cases as “sponsors,” who were described in the 2003 report as providing emotional, informational, and educational support.2 Other ongoing supports at the LILAA programs included stress-reduction workshops, life-skills classes, and social outings and events.
THE PROGRAMMATIC APPROACH
IMPROVE THE LIBRARIES’ OPERATIONS AND INSTRUCTIONAL SERVICES TO BET-
TER ACCOMMODATE STUDENTS’ NEEDS.
The second approach for supporting the persistence of adult literacy students leverages libraries’ strengths as community learning institutions. Strategies that fit this approach aim to improve existing core services by making them more valuable and more convenient for stu-
2Comings, Cuban, Bos, and Porter, 2003.

-31-
dents. Although such “programmatic” strategies do not help students overcome their personal difficulties, they do help students participate despite their difficulties.
The LILAA programs applied the programmatic approach in three ways: (1) by making literacy services more accessible, (2) by making students feel welcome and comfortable, and (3) by identifying and focusing on students’ educational needs and goals. The LILAA programs were already employing a variety of programmatic strategies in these ways prior to the persistence study, and many programs made efforts to expand and improve these strategies over the course of the study. But because the changes were small and because the potential to affect students’ persis-tence without fundamentally addressing their personal barriers was limited, the strategies did not lead to changes in participation patterns. The following sections describe some of the LILAA pro-grams’ efforts to focus their operations and instructional strategies on persistence.
Making Literacy Services More Accessible
Making library literacy services more accessible supports adult students’ persistence by accommodating their varying schedules. Many adult learners work long hours, often at more than one job, while also balancing family responsibilities. Creating more options for participa-tion in the LILAA programs’ literacy services involved expanding not only the hours of opera-tion but also the flexibility of attendance requirements.
Off-Site Services
To accommodate transportation and child care challenges, a few LILAA programs moved some literacy services closer to their students. One program held small classes at local schools in the evenings. Children were welcome to accompany their parents — there were no other patrons or students to disturb, and the program often provided activities for the children while the adults studied. Other programs provided off-site tutoring; for example, tutors arranged to meet students at convenient locations, such as another library branch or a local bookstore or even the student’s home. One program also tried off-site computer instruction at local schools.
Drop-In Group Instruction
Two programs added group instruction with a drop-in schedule, so that each session was self-contained rather than dependent on attendance in the previous session. Therefore, a student who was unable to attend a scheduled session could join the next one without missing anything or getting lost. In both programs, however, the drop-in sessions were instructor-led conversation groups of interest only to ESOL students. Although the sessions were popular among students at all levels, sometimes instructors found it difficult to tailor the conversations to fit all levels and to readjust to a different mix of students at each session. The less-advanced students, therefore, often missed out. Some programs discouraged drop-in classes, because they

-32-
felt that a stable group of students created a comfortable setting and a sense of community for participants. But they sometimes offered drop-in extracurricular activities, such as homework groups or reading groups. Although such meetings did not offer instruction, they gave students an opportunity to participate in learning activities in a group setting on a flexible schedule.
Computer Labs
All nine of the LILAA programs expanded and upgraded their computer labs during the persistence study. Each site offered at least 5 and as many as 20 workstations exclusively for literacy program use, in addition to computers available in the library’s main facility. Moreover, the literacy programs purchased self-paced educational software and upgraded their Internet access. As a result, students had more opportunities to supplement their classes or tutoring with self-study or to substitute computer-assisted learning when they could not attend scheduled ses-sions. Having someone on staff to provide assistance in the computer lab was the greatest chal-lenge, but one program addressed this by finding volunteer graduate students to serve as “tech-nology mentors” who helped students figure out which software best met their skill levels and goals. Overall, the increased accessibility of computer labs perhaps produced the greatest in-crease in student participation. As Chapter 2 shows (Table 2.4), participation in computer lab activities increased from an average of 4.1 hours per month for the first cohort of students to an average of 5.3 hours per month for the second cohort of students.
Making Students Feel Welcome and Comfortable
The adult students who enter library literacy programs often have a lot of anxiety about their low literacy skills. Many LILAA students struggled in school or in other adult education programs and were weary of “school-like” settings. Also, as mentioned earlier, many were em-barrassed by their low skills and lacked confidence in their ability to learn. Consequently, it is essential that library literacy programs do all that they can to make adult students feel welcome and comfortable, in order to maximize the possibility that they will chose to keep coming. All the LILAA programs had long been aware of this and were attentive to ensuring an atmosphere of care and respect. During the persistence study, however, several programs found ways to do even more.
Improved Tutor Training and Tutor Support
Tutors often are an important factor in students’ persistence. Not only do tutors provide individualized instruction, but they also often become mentors for students. Therefore, during the persistence study, all LILAA programs improved their tutor training and tutor support, to increase tutors’ ability to help students with literacy and to be more sensitive to their persistence problems. One program increased the hours and duration of training required for tutors. Another
-33-
program developed standardized tutor-training manuals that included technical content on teaching literacy, tips on supporting conversation, and strategies for integrating cultural issues into instruction. Two programs inserted a cultural awareness component into tutor training. And several programs required a greater commitment from tutors, which had the added effect of screening out those who were less dedicated, thereby bolstering tutor persistence — a critical factor for student persistence.
Accelerated Start of Instruction
For many adults with very low literacy, it takes courage to enter an educational pro-gram. Therefore, the sooner programs can engage and assure students that they are welcome, the better the chances are that the students will persist. Unfortunately, all of the LILAA pro-grams had long waiting lists for literacy activities, especially in the case of tutors, and students had to wait anywhere from a couple of weeks to more than a year before beginning instruction with a tutor. During this wait, students might change their mind or become discouraged. But all the programs tried to engage new students in computer lab activities while they waited for a tu-tor. Two programs that also offered classes accelerated the start of instruction by designing open-entry classes; that is, students did not have to wait for the next term but instead could join a class a few weeks or months after it had started. This strategy was successful when the in-structors of the open-entry classes were experienced and could manage classes with students of varying skill levels.
Identifying and Focusing on Students’ Educational Needs and Goals
The adult students who enter library literacy programs want to improve their literacy skills, but many do not know how to go about it. Their goals often entail visions of “a better life” rather than concrete steps toward improving their skills. The literature on persistence sug-gests that literacy programs’ efforts to assist students in defining and achieving goals are essen-tial for supporting persistence. The 2003 report explains in depth the various goals that adult students bring to library literacy programs and the importance of addressing them.3 This section gives some concrete examples of how the LILAA programs became more attentive to students’ goals during the persistence study.
Placement and Follow-Up Testing
Most LILAA program staff felt that assessment was important so that they could gauge students’ skills at entry and students could track their own progress. The programs implemented placement and follow-up testing during the persistence study. Placement tests were used to fig-
3Comings, Cuban, Bos, and Porter, 2003.
-34-
ure out the kinds of instruction that students needed when they first entered a program, but these tests often pointed to general literacy levels rather than to such instructional needs as work on phonics, vocabulary, or comprehension. Partly this reflects the nature of tests, but it also points to the programs’ capacities to apply test information to instructional services. Follow-up tests were given primarily because staff felt that if students saw “evidence” of progress toward liter-acy gains, they would be more likely to continue participating. As with the placement tests, however, the results of follow-up tests were not used for designing instruction. And for both the students and the staff, the testing often turned out to be disappointing. Staff felt that the standard tests did not measure what students were actually learning, but alternative exams that might bet-ter capture their gains were too complicated and too expensive to administer.
Identifying and Addressing Learning Disabilities
Most program staff and the researchers agreed that there was a high prevalence of learn-ing disabilities among the LILAA students. However, most programs did not have the capacity to adequately identify and address learning disabilities. Nonetheless, two programs did either adopt or strengthen their learning disability features during the persistence study. At these pro-grams, staff typically targeted students who self-reported disabilities, who had educational his-tories indicating disabilities, or whom staff suspected of having disabilities. The programs im-plemented approaches to address these students’ needs to varying degrees. One program piloted a comprehensive, structured curriculum — the Barton System — which guided tutors in deliv-ering scripted instruction on various skills. But the other program relied on tutors to use a vari-ety of tools, including phonics-focused materials or computer-assisted instruction. Supporting the interventions that students needed to overcome learning disabilities proved challenging for the LILAA programs because of the demands they placed on volunteer tutors and on students.
Goal-Setting and Follow-Up
During the LILAA persistence study, all nine literacy programs implemented goal as-sessments for new students. One program developed a comprehensive “goal checklist” as an exercise for students to figure out and set goals and then to track their progress over time. Goal-setting exercises created opportunities for students to plan and articulate specific goals. One challenge for all the programs, however, was the difficulty of following up goals with students; although a few programs intended to do goal follow-up sessions, finding the time to hold them proved too difficult.
Summary and Recommendations The LILAA programs’ experiences during the persistence study provide lessons for
other library literacy programs and for other adult education providers that face the challenge of

-35-
increasing the persistence of their students. The following conclusions and recommendations emerge from the LILAA programs’ experiences in applying the approaches described above and from in-depth interviews with students and program staff.
PUBLIC LIBRARIES ARE LIMITED IN THEIR ABILITY TO PROVIDE IN-HOUSE SOCIAL
SUPPORT SERVICES, BUT SOME STRATEGIES ARE WORTH TRYING.
Other adult education programs may be hesitant to undertake in-house social support services for the same reasons that the LILAA programs were. They may view social support services as being in conflict with their focus on instruction. For programs that seek to expand services to include social support, however, the LILAA programs provide few examples. There was one successful and sustainable child care program that enhanced the persistence of students who had young children. But because the LILAA programs did not attempt to implement other in-house social support services, results from the persistence study cannot determine whether other models might also be feasible. This suggests an opportunity for future research. A study that dedicates resources entirely to a comprehensive set of support strategies designed to match the most pressing needs of adult literacy students and that also addresses concerns about privacy and capacity may reveal other ways that libraries can directly help students overcome personal and environmental barriers to persistence.
LIBRARY LITERACY PROGRAMS MAY BE ABLE TO DO MORE TO HELP STUDENTS FIND OFF-SITE SERVICES IN THE COMMUNITY TO ADDRESS THEIR PERSONAL AND ENVIRONMENTAL
BARRIERS TO PERSISTENCE.
All the LILAA programs were more comfortable in helping students address their per-sonal difficulties by referring them to other community service providers. Making referrals is a natural role for public libraries, as a key information resource in the community. However, li-brary literacy programs could perhaps reach more students and better help them by formalizing and institutionalizing their referral systems. For example, rather than relying on staff to offer advice when students reveal a difficulty, library literacy programs could develop ways to pro-vide all students with access to referral information at any time. Also, to ensure that the referrals are appropriate to the literacy students’ needs, the programs could designate a representative to develop relationships with other community service providers, in order to better understand lo-cal services and ensure that referred students are actually able to receive the services they need. The programs could also train more staff in making referrals so that, when students do seek ad-vice, all staff have up-to-date and accurate information to pass along.
LIBRARY LITERACY PROGRAMS MIGHT CONSIDER SPONSORSHIP AS A WAY TO LINK
STUDENTS WITH INDIVIDUALS WHO CAN SUPPORT THEIR PERSISTENCE.

-36-
Another area in which the LILAA programs could build on their strengths by formalizing and institutionalizing an activity is related to sponsorship. The 2003 LILAA report notes that stu-dents who had sponsors — whether at home, at a social service agency, or within the program — tended to have a better chance of persisting in their literacy learning.4 Therefore, one recommen-dation to come out of the LILAA persistence study is for library literacy programs to develop sponsorship programs, which can take many forms. For example, each new student might be linked with a long-term student or a successful former student, or new students might be asked to designate someone they know personally to serve as their sponsor. The library might then develop tasks for students and sponsors to do together on a regular basis, such as goal-setting, reflecting on progress, or celebrating achievements. Library literacy programs might also consider educating sponsors about their referral networks, because the sponsors’ more personal relationships with the students may put them in a good position to offer referral information.
LIBRARIES CAN MAKE THEIR LITERACY PROGRAMS MORE ACCESSIBLE TO STUDENTS
WHO CANNOT ATTEND REGULARLY.
The LILAA programs’ efforts to make themselves more accessible to students may provide ideas for other literacy education providers. First, programs might consider offering learning activities off-site, closer to where students live. This worked well for one LILAA pro-gram, which offered evening sessions at local schools, while the adult students’ children also participated in learning activities. Also, while the drop-in classes were developed only for ESOL students, this model might be replicated for other literacy students. Although the drop-in format may not be as effective as consecutive classes, it offers an alternative to students who cannot attend routinely and may make the difference between attending and not attending at all. Computer labs that have a variety of educational software and are staffed to help students navi-gate can also fit the drop-in format, and they can allow students to supplement other learning activities. As the LILAA programs learned, it is important to have staff or volunteers available to help students use the computers and to select the right software for their skill levels and goals.
A WELCOMING AND ACCEPTING ENVIRONMENT IS ESSENTIAL FOR SUPPORTING
STUDENT PERSISTENCE. SUCH AN ENVIRONMENT IS INNATE IN LIBRARY LITERACY
PROGRAMS, BUT THERE ARE ALSO STRATEGIES THAT CAN HELP TO MAXIMIZE THE
SUPPORTIVE CLIMATE.
Literacy programs experience a lot of turnover in tutors and students, and so it takes an ongoing effort to maintain a welcoming and accepting environment. Several LILAA programs improved tutor training in order to instill sensitivity toward students’ literacy needs, personal barriers and difficulties, and cultural backgrounds. On the other hand, students might not feel
4Comings, Cuban, Bos, and Porter, 2003.

-37-
very welcome if they cannot immediately begin participating in the program. As a result, sev-eral LILAA programs worked to decrease the time that students spent waiting for a tutor or class assignment, and they found ways for students to begin activities while they waited. At all the programs, students could, at the very least, begin taking advantage of the computer lab. Open-entry classes or group instruction with a drop-in format can also help students begin ac-tivities immediately — and thus become engaged.
ALTHOUGH IT IS COMPLICATED AND RESOURCE-INTENSIVE TO ADDRESS LEARNING
DISABILITIES, LIBRARY LITERACY PROGRAMS MIGHT BE ABLE TO DO MORE TO IDENTIFY
AND HELP STUDENTS WHO HAVE LEARNING PROBLEMS.
Rather than relying on self-reports of reading disabilities, on general literacy tests that are not designed to point out reading disabilities, or on staff judgment, library literacy programs could explore using research-based assessments or questionnaires to screen students entering their programs. Also, rather than relying on tutors or instructors to design instructional ap-proaches to address these students’ learning needs, programs could explore planned and scripted curricula such as the Barton System, which was designed for use by volunteer tutors in adult literacy programs.
ALTHOUGH DEFINING AND TRACKING STUDENTS’ NEEDS AND GOALS HELP PROVIDE THE
MOTIVATION TO PERSIST, IT IS OFTEN CHALLENGING FOR PROGRAMS TO IMPLEMENT
THESE STRUCTURES.
Strategies for figuring out students’ literacy needs or for helping students realize their goals were among the most challenging programmatic efforts made by the libraries in the per-sistence study. Testing and goal-setting sessions require a lot of staff time. While most of the programs did initial goal-setting, it was rare for them to design instruction according to goals or to reassess students’ needs and goals on a regular basis. Yet some programs did streamline and simplify these processes. For example, all programs developed electronic databases to store test scores and goal information. Some programs also developed goal-setting forms that standard-ized the information they gathered while also providing some guidance to students.
* * *
The LILAA programs used two different approaches for improving student persistence: the social services approach and the programmatic approach. The programs’ experiences pro-vide some valuable examples for libraries and other providers of literacy instruction to follow. However, the few strategies that were implemented during the persistence study were minor changes to the program services and did not lead to improvements in student persistence. Get-ting to the heart of the persistence problem — students’ personal barriers — is essential in order to make any real progress in adult literacy students’ participation and achievement. When in-

-38-
house services are minimal or not an option, formalizing and institutionalizing a comprehensive referral system may be the next-best option. Developing individualized support systems through formal sponsorship programs may provide another layer of assistance and encouragement for students. Also, when it comes to improving operations and instructional services, flexibility and variety are key. Providing more times, more places, and more ways to participate in literacy in-struction can boost persistence. However, to make all these recommendations work, libraries need to approach them with a comprehensive framework that focuses on the complex nature of persistence and the varying needs of literacy students. Chapter 4 presents such a framework.

-39-
Chapter 4
Pathways to Persistence
The experiences of the nine library literacy programs that took part in the Literacy in Libraries Across America (LILAA) persistence study provide lessons that can inform future efforts to increase the persistence of adult literacy students — and, thereby, their achievement. Whereas Chapter 3 examines student persistence at the program level, this chapter focuses on how the factors that influence persistence play out at the level of students. The purposes are to illuminate possible links between the barriers to persistence discussed in Chapter 3 and the low levels of participation documented in Chapter 2 as well as to explore the implications of these links for program design and practice. The resulting analysis points to a more complex defini-tion of persistence than might have been foreseen at the outset of the LILAA persistence study.
As reported in Chapter 2, almost 20 percent of students in the LILAA programs stopped attending after just one month, and another 24 percent stopped attending after two to three months. Within six months after entering, about two-thirds of students appeared to have dropped out. As discussed in Chapter 3, most of the programs tackled these low overall levels of participation by trying to make instruction more flexible and more accessible. Like the strate-gies for addressing personal and environmental barriers to persistence, however, these efforts tended to be few, informal, and concentrated in the period immediately after enrollment. In light of the findings presented in Chapter 2, it appears that more comprehensive, sustained imple-mentation of such efforts may help library literacy programs increase persistence among all stu-dents, including those who do not attend program activities on a regular, long-term basis. Thoughtful expansion of literacy programs’ social service offerings holds promise as well.
Five Persistence Pathways All-or-none measures of participation do not capture the diversity of the ways in which
students in the LILAA programs did or did not persist in their literacy learning. As demon-strated in this section, a more nuanced look at students’ patterns of participation suggests that, to have a greater impact on persistence and achievement, library literacy programs need to develop new ways to respond to low levels of long-term participation and to rethink what it takes for an adult student to persist in literacy learning.
The 2003 report from the LILAA persistence study proposes a four-way categorization of students according to their patterns of participation.1. As the study unfolded, it became clear that
1Comings, Cuban, Bos, and Porter, 2003.

-40-
identifying students as short-term, intermittent, long-term, or mandatory is inadequate, because the same student might participate in program services to different degrees during different peri-ods. The qualitative research undertaken for this report points to a useful new model for under-standing participation in library literacy programs that conceptualizes each student as following a persistence pathway. The notion of pathways reflects the fluid nature of each student’s actual par-ticipation and emphasizes that persistence is a function of more than personal characteristics.
Given the large number and the complexity of factors that affect persistence, the path-way or pathways followed by a given student cannot be predicted in advance. As the analysis makes clear, however, the pathway model has important potential implications for how library literacy programs design their messages, instruction, and services. The five main pathways identified during the LILAA persistence study are short-term, tryout, intermittent, long-term, and mandatory. With the exception of the tryout pathway, each corresponds to a student cate-gory in the 2003 report. As revealed by the following descriptions of the pathways, students’ reasons for following one pathway or another are diverse, but the personal and environmental barriers to and supports for persistence that are discussed in Chapter 3 play a crucial role.
• Short-Term Pathway. Students on the short-term pathway participated inten-sively for a short period to accomplish a specific goal, such as passing a job certification test or to prepare for a longer course of study, such as classes to at-tain a General Educational Development (GED) certificate. Most of these stu-dents had few or no personal and environmental barriers to persistence or man-aged to overcome their barriers long enough to meet their short-term learning goal or to transfer to a program that met their longer-term needs.
• Tryout Pathway. The tryout pathway was introduced to the analysis be-cause some students who participated in the LILAA programs on a short-term basis faced barriers to persistence that were at least temporarily insur-mountable, or the students lacked goals clear enough to sustain their motiva-tion to participate in literacy learning, despite having a high level of motiva-tion to learn. Like students on the short-term pathway, students on the tryout pathway generally participated in a LILAA program for only a brief period, but they often did so for lack of an attainable literacy goal.
• Intermittent Pathway. Whether their goals were diffuse or specific, stu-dents on the intermittent pathway required a long period of participation to improve their literacy. Because of personal and environmental factors that limited their persistence, however, they moved in and out of a LILAA pro-gram at least once over a period of months or years. Most working-age stu-dents found themselves on the intermittent pathway because of poverty (both

-41-
their own and that of the family and friends whom they could ask for help), employment, child care responsibilities, or some combination of the three. When not attending the program, some of these students participated in other literacy services, and some stayed in contact with the LILAA program. Al-though program staff sometimes described students on the intermittent path-way as dropouts, such students typically saw themselves as continuously connected to the program. Thus, some students who in Chapter 2 appear to have left the programs — because they did not attend activities for at least three months — may have been on the intermittent pathway.
• Long-Term Pathway. Students on the long-term pathway participated in li-brary literacy services regularly over an extended period. Many considered education an end in itself and did not cite the wish to attain specific goals as a reason for their enrollment. As their participation pattern suggests, students on this pathway had successfully surmounted their barriers to persistence or at least had circumvented them with the help of personal and community supports. Given that most of the barriers to adult learner persistence relate to employment, children, and relationship partners, it is not surprising that stu-dents on the long-term pathway tended to be over the age of 30. They usually saw their library literacy program as a comfortable, supportive community. and they viewed the staff as friends or family members. Because of their strong commitment, they were generally willing to tolerate service delays (for instance, a long wait for a tutor assignment) and slow learning progress.
• Mandatory Pathway. Like long-term students, students on the mandatory pathway participated in literacy services over a protracted period, but they did so because a public assistance or law enforcement agency required them to attend literacy instruction. In most cases, they fulfilled the requirement by enrolling in a library literacy program rather than another type of education provider because their literacy skills were too low to qualify for any other type of program, because they could not afford or arrange for transportation to any other type of program, or because their caseworker had a relationship with a library literacy program and steered them in its direction. Their par-ticipation was usually regular, and their goals often overlapped with those of the agency that mandated their attendance. After the requirement to partici-pate was lifted — or sometimes even before that — many students on the mandatory pathway left the LILAA program abruptly.
As already noted, a given student might follow different pathways at different times. Just as personal and environmental factors often determine a student’s initial pathway, they can

-42-
cause a student to switch pathways. For example, a student on the short-term pathway might move to the intermittent pathway after taking a new job with hours that conflict with the timing of program services or after a child or family member becomes ill. If the resulting conflict with or disruption of participation lasts long enough, the student might lose the assigned tutor and might disengage from the program.
Other factors can also shape persistence pathways. In the LILAA programs, a number of students followed the intermittent pathway not because they had barriers to persistence but because they participated in another type of instruction that was parallel to the library’s literacy services, filling gaps in participation in one program with spells of activity in the other. Other students on the intermittent pathway had been receiving long-term instruction elsewhere in Eng-lish for Speakers of Other Languages (ESOL) or Adult Basic Education (ABE), but they switched to a LILAA program because they were unable to attend those more traditional, class-room-based programs with the required regularity and intensity.
A Look at the LILAA Experience from the Pathway Perspective At first glance, the long-term pathway appears to be the most promising route to greater
persistence and higher achievement. Coupled with the large number of hours of instruction that adults need to substantially improve their literacy skills, the way in which most people acquire those skills (that is, by regularly attending school) underscores the potential rewards of long-term participation. Moreover, for some students, the expectation that they will follow the long-term pathway may be self-fulfilling. The learning disabilities program in one of the LILAA li-braries, for example, encouraged students to participate on a steady, long-term basis, and, with few exceptions, students did. Nevertheless, following the long-term pathway is not realistic for many students much of the time. A more flexible array of instruction and services has the poten-tial to increase persistence among students on all pathways.
If library literacy programs invest primarily in getting students on the long-term path-way, they risk decreasing persistence among students who are unable to follow this course. Stu-dents on the intermittent pathway, in particular, may think that their inability to attend program activities regularly precludes them from improving their literacy skills. In the LILAA programs, for example, some students mistakenly believed that there was a specific period of time during which they should or could visit the program and use its services. At least some students might not have dropped out had the programs conveyed more clearly their expectations of and provi-sions for people who could not participate on a regularly scheduled or long-term basis. Also, although the LILAA programs created a warm, inviting atmosphere, they did not directly counter feelings of failure or stigma among students on the intermittent pathway.

-43-
None of the LILAA programs designed its instruction or services with persistence pathways explicitly in mind, but some did respond to the needs of students who were not on the long-term pathway. For instance, one program introduced staggered computer hours to serve students who could not attend classes regularly because they did shift work in restaurants; the program also offered a drop-in conversation club for ESOL students. In addition, on their own initiative, some tutors and other staff followed up with students whose participation in on-site activities had flagged. When this occurred, follow-up typically entailed calling students to find out what was keeping them from participating and to encourage them to return to the program. In some cases, students spontaneously kept in touch with their program during a hiatus in par-ticipation. From the pathway perspective, flexible instruction and formal follow-up should be integral to what library literacy programs offer their students.
Although students on the intermittent pathway are particularly ill-served by a program that steers most students toward the long-term pathway, those on other pathways can also miss out on opportunities to increase their persistence. For example, some students on the short-term and tryout pathways in the LILAA programs did not receive referrals to other programs or to services that might have helped them reach their literacy goals. Even students on the long-term pathway can benefit from the multiple-pathway model: Despite the efforts of some programs to vary instruction, long-term students sometimes became bored or frustrated.
Though difficult to implement, needs and goals assessments show promise as a way for library literacy programs to identify students’ learning goals and to uncover barriers to persis-tence that might call for referrals to other programs and services. For example, when probed about literacy goals at program intake, one LILAA student said that the program’s classroom instruction would be a useful way to “get the hang of reading” again before enrolling in a GED class — an early sign that the student was on the short-term pathway. Nevertheless, it would be unrealistic to expect program operators to predict students’ pathways or to assign them to ser-vices and instruction based on such predictions, because the factors that shape persistence pat-terns are unpredictable and usually lie outside library literacy programs’ control. As a rule of thumb, then, programs need to assume that any given student could follow any of the five per-sistence pathways and could change pathways over time.
Implications of the Pathway Perspective for Program Design and Practice
The pathway perspective from the LILAA persistence study suggests ways in which li-brary literacy programs could improve the implementation of their current strategies for increas-ing student persistence and points to new strategies that they might consider adopting. This final section explores the implications of the pathway model for program design and practice.

-44-
In stressing the importance of helping students persist even when they cannot attend program activities on a regular, long-term basis, the pathway model suggests some refinements and extensions of the recommendations regarding the support services and programmatic ap-proaches to supporting persistence that are presented at the end of Chapter 3. A promising gen-eral approach is to put less emphasis on group learning activities, in which students can easily fall behind, and offer more one-on-one, computer-based, and self-directed activities that allow students to dip in and out as their ability to participate fluctuates and also to provide referrals in a timely, systematic fashion. Given the low overall levels of participation among adult literacy students (documented in Chapter 2), programs also need to work hard to keep the lines of com-munication open with students on all pathways and to help students tap into social services in the community. The pathway model might also help programs prioritize their investments in communication and social support activities.
The Support Services Approach
1. Provide counseling and referrals early and often. As revealed in Chapter 3, it is unrealistic to expect library literacy programs to provide direct ser-vices to address students’ personal and environmental barriers to persistence. For students who are not on the long-term pathway, however, targeted in-vestment in well-timed, relevant counseling and referrals could make the dif-ference between their persisting in some form of literacy learning and giving up. Ideally, counseling and referrals would be provided early on, so that stu-dents on the short-term and tryout pathways and students awaiting activity assignments can benefit from them. Current staff knowledge of social service and education resources could form the foundation of a more comprehensive referral system that is stored in a database and shared with other education and social service programs. If funds for additional staff can be procured, programs might also consider hiring a guidance counselor with a background in social services to help students on all pathways — particularly the inter-mittent pathway — to stay as engaged in learning as possible; like the data-base, the counselor could be shared with similar programs. Another promis-ing approach is to expand the preparation of long-term students who act as academic mentors for other students (a strategy that some of the LILAA pro-grams implemented) to include training in counseling and social service re-ferrals. On the basis of their own experience, fellow students are likely have a clear intuitive grasp of the pathway perspective and the importance of keep-ing students committed to the program and engaged in learning, even during spells of nonattendance.

-45-
2. Make social supports more flexible. To the extent that library literacy pro-grams can offer direct social supports to students, they should attempt to make the supports as flexible as possible. For instance, a program that offers on-site child care could schedule it to coincide with drop-in classes and with computer lab hours and could make it easier for a student who stops by un-expectedly to have access to a child care opening. One strategy for reengag-ing students who have stopped attending the program is to let them know about new or improved services that might bring them back to the program, such as expanded child care hours or a new type of drop-in instruction.
3. Improve communication. By stressing that many students will not adapt to a long-term pattern of participation, the pathway perspective implies that pro-grams need to develop strategies to use when students are inactive. One strat-egy is to create a formal procedure for staying in contact with students who are not participating, such as a monthly phone call from a staff member or student volunteer. Students can be informed about this procedure during ori-entation, which would encourage them to view their relationship with the program as ongoing even when they cannot attend activities regularly. Other ways to keep students engaged are to invite them to celebrations of fellow students’ attainment of learning milestones and to conduct exit interviews that give them a chance to reconnect with the program or to reveal goals and needs that might be addressed elsewhere. Regardless of their patterns of at-tendance, students should be encouraged to call or to stop by the program to read, borrow a book, use a computer, or ask for help even if they cannot at-tend classroom or tutor instruction. It is also important to keep students ap-prised of changes, such as new instructional services — especially those that might be a good fit for their needs.
The Programmatic Approach
1. Teach staff about persistence pathways. To reap the full benefits of the pathway perspective, programs need to teach tutors and other staff about the pathways to persistence, conveying the implications for implementation of program services while stressing the unpredictability of individual students’ pathways. Specifically, staff can be trained to acknowledge to students — especially during intake and orientation — that regular, long-term participa-tion will not be possible for everyone and that there is no stigma associated with participating irregularly or with returning to the program after a hiatus; to give students specific information up front about how to continue learning

-46-
during periods when their participation is intermittent or nil; and to follow up systematically with students who have stopped attending program activities.
2. Make learning plans. The pathway model also points to learning plans as a way to support persistence. To keep students on all pathways progressing toward higher literacy, the learning plan should incorporate not only tutor and classroom instruction but also activities that students can engage in on their own and, where appropriate, participation in other education programs. An essential component of the learning plan is a set of homework assign-ments for students to start working on if they find themselves unable to at-tend on-site activities. Learning plans might even facilitate assessment of students’ needs and goals, which, as discussed in Chapter 3, the LILAA pro-grams found time-consuming and difficult. In particular, by making the con-tent and course of literacy activities more concrete, the learning plan may ex-pose needs and goals that might not otherwise come to light. Ideally, both the construction of the learning plan and the needs and goals assessment would take place early in a student’s involvement with the program and periodically thereafter. Going through the process immediately after enrollment is espe-cially helpful to students on the short-term and tryout pathways, who might otherwise lose contact with the program. And in follow-up discussions, stu-dents on the long-term and intermittent pathways could let the program know whether the learning plan is working for them, while students on the manda-tory pathway could generate a personal learning plan that encourages them to persist in learning even after they fulfill their participation requirement.
3. Offer even more flexible instruction. From the pathway perspective, the overarching goal of a library literacy program should be to design instruction so that every student can benefit from at least one of the instruction types. This approach underscores the importance of the recommendations in Chap-ter 3 that programs improve the instruction provided in drop-in classes, ex-pand drop-in activities to include more than conversation clubs for ESOL students, offer off-site services such as tutoring in students’ communities or homes, provide students with explicit instruction in how to use computers to engage in self-study, and expand the hours during which computers are available for independent use. Programs that make instruction more flexible need to invest in more self-study materials — such as books on tape, interac-tive computer software, videos, and reading workbooks that students can check out of the library — and to devote staff time to showing students how to take advantage of these resources. Programs might also consider assigning some staff the role of roving tutors who are available to work with any stu-
-47-
dents who show up on a particular day. Experienced tutors who have the ability to identify and address a variety of needs quickly are the best candi-dates, although programs might also develop a curriculum to train less ex-perienced tutors to assume this role.
4. Recruit students with the persistence pathways in mind. As already ob-served, assigning students to activities or making referrals on the basis of the persistence pathways is unrealistic because the factors that shape a given stu-dent’s pathway are difficult, if not impossible, to predict. Therefore, library literacy programs should strive to attract and recruit the students who are most likely to take advantage of and benefit from their services. For example, a program can help education and social service organizations that serve po-tential students make more-informed referrals by keeping them apprised of what the program offers.
Conclusion There is no escaping the fact — cited often in this report — that adults must invest sub-
stantial time and effort in learning if they are to improve their literacy skills. At the same time, the results of the LILAA persistence study indicate that few adult literacy students can partici-pate in on-site activities regularly over a protracted period, even when they are enrolled in high-quality, well-funded programs. By suggesting that persistence can take multiple forms, the pathway framework may help library-based literacy programs reconcile the exigencies of adult literacy students’ goals with the realities of their lives. Persistence must be supported — as one student put it — “as long as it takes.”
This chapter takes a first step toward using the ideas of pathways to refine, expand, and prioritize the social service and programmatic approaches that Chapter 3 outlines for increasing student persistence. It is hoped that library literacy programs will take up this challenge where the LILAA study leaves off, by developing instruction and services that promote adult literacy whatever pathways their students follow.


Appendix A
The Five Libraries Participating in the LILAA Persistence Study

-50-
The five libraries in the Literacy in Libraries Across America (LILAA) persistence study illustrate a portion of the diversity of the library literacy programs in the United States, both in setting and in the students they serve. Each library has shown organizational stability and has leaders who are interested in making changes to enhance student persistence. These programs are not intended to be a representative sample of all library literacy programs, but they instead can illustrate what happens when experienced programs make persistence a focus, re-ceive special support to enhance services, and are part of a special effort to monitor progress and assess effects on students. The following brief descriptions provide background information about the study sites and the variety of settings, services, and students. Some of the five libraries have multiple literacy programs operating out of branch libraries, and these are included in this research, bringing the total to nine literacy programs.1
Greensboro Public Library The Greensboro (NC) Public Library’s literacy programs evolved from a community
effort to address the needs of adults with low literacy skills. This resulted in Literacy 2000, a collaborative plan supported by the library, Guilford Technical Community College, Reading Connections (a nonprofit agency supporting one-on-one tutoring), and other community agen-cies. The literacy programs that were started through Literacy 2000 are located at two of Greensboro Public Library’s nine branches, one of which (Glenwood) relies on AmeriCorps volunteers for many of its staff members.2
• Chavis. Also known as the Lifelong Learning Branch, the Chavis branch of-fers adult students afternoon and evening classes in preparation for the Gen-eral Educational Development (GED) exam, taught by teachers from the lo-cal community college. The program also has a computer lab and gives in-struction in word-processing and E-mail.
• Glenwood. The Glenwood branch is in a working-class neighborhood that has attracted many refugees and immigrants from all over the world. The li-brary is housed in a modern, sunny building that is a source of pride to the community. It offers small-group instruction in English for Speakers of Other Languages (ESOL), family literacy classes, a computer lab, and a collection of foreign language and multicultural reading materials.
1The five libraries use somewhat different terminology in naming their overall local LILAA effort
and the activities at specific branch libraries. For ease of exposition, this report uses the label “library” to identify the five LILAA grantees in the persistence study, and it uses the label “program” to identify spe-cific sites where literacy services are delivered.
2Quantitative data were collected only from the Glenwood program.

-51-
New York Public Library New York Public Library (NYPL) has a long history of providing adult literacy services.
Since the nineteenth century, NYPL branches have helped immigrants assimilate into the local community. Immigrants still come to the NYPL branches for English instruction, preparation to pass the citizenship test, and reading materials in their own language. NYPL provides literacy ser-vices through the Centers for Reading and Writing (CRWs) at 9 of its 85 branches. The CRWs — funded primarily by the New York City Adult Literacy Initiative (NYCALI) — target adults at the lowest levels of literacy. Although the CRWs still serve many new immigrants, the focus of NYCALI is currently on literacy for English-speaking adults. The wide array of ethnic groups and nationalities served by the CRWs is reflected in the diversity of program staff and in the learning materials. The LILAA persistence study is focused on three of the CRWs.
• Fordham. The Fordham branch is in a densely populated, thriving business district in the Bronx and houses the CRW in several rooms in the back of the library. The program serves approximately 150 students at any given time. The students participate in small-group instruction in the evenings and/or in tutoring sessions held throughout the day — most of which are led by volun-teers. Students also have access to a computer lab, where they can use the Internet, E-mail, and independently work on literacy activities and educa-tional software.
• Wakefield. Housing one of NYPL’s oldest CRWs, the Wakefield branch is located in a residential neighborhood also in the Bronx. The program serves approximately 100 students — mostly Afro-Caribbean adults — many of whom live within walking distance of the library. Students participate in small-group sessions and in computer study. The CRW is located in the basement of the library and has a computer lab, job search resources, and book collections.
• Seward Park. The Seward Park branch is located on Manhattan’s Lower East Side, near Chinatown, but because of ongoing renovations since 2002, the program has temporarily moved to the Tompkins Street branch. The CRW serves Chinese, Puerto-Rican, African-American, and Afro-Caribbean students. Approximately 80 students participate in small-group tutoring and study in the computer lab. The CRW also has an extensive collection of mul-ticultural materials.

-52-
Oakland Public Library Second Start — Oakland (CA) Public Library’s adult literacy program — started in 1984
and is a small, community-based alternative program with classroom instruction and one-on-one tutoring. Housed in a downtown office building, Second Start’s multiethnic staff offer an intensive and personalized curriculum in math, writing, and spelling as well as instruction in stress reduc-tion. The classes are taught by professional instructors; some classes have a fixed schedule, while others are open-entry, open-exit. Second Start also offers a computer-assisted literacy program, with more than 20 computers. The majority of Second Start’s funding comes from the City of Oakland, with some additional support from private sources. In the center’s informal meeting room, free food donated by neighborhood restaurants is often available. Nearly 150 volunteers serve as one-on-one tutors both in-house and off-site. Several students have been hired as staff, and the program makes efforts to share decision-making with its students.
Queens Borough Public Library Queens Borough Public Library is among the nation’s oldest and largest library systems
and serves one of the most diverse populations. The adult literacy program, founded in 1977, has its roots in earlier library-based programs that provided education to immigrants. Currently, 6 of the library’s 62 branches support Adult Learning Centers (ALCs), which are funded through the New York City Adult Literacy Initiative (NYCALI), other government programs, and foundations. The ALCs enroll more than 2,500 adults each year, offering ESOL, pre-GED, and basic literacy instruction as well as computer classes, self-study with video- and audiotapes, literacy collections, and a student-writing journal entitled The Open Door. Three of the six ALCs are included in the LILAA persistence study.
• Central. The Central branch’s ALC serves about 300 adult students in the Jamaica section of Queens. Volunteers lead small-group tutoring. Students also use a computer lab that has internet access and self-study materials.
• Flushing. The Flushing branch is the largest in the Queens system and en-rolls approximately 500 adult literacy students each year. Located in a com-mercial district of an area populated by immigrants from all over the world, the ALC provides ESOL and basic literacy study to students mainly of Asian descent. The program also serves many drop-in clients who are seeking so-cial service referrals and resources.
• Rochdale Village. The Rochdale Village branch houses a smaller program that serves about 100 students. It is located in a middle- and working-class neighborhood and serves mostly African-American and Afro-Caribbean students. The ALC is housed in one room at the back of the library and of-

-53-
fers small-group instruction, computer access, and a large collection of lit-eracy materials.
Redwood City Public Library Project READ, in Redwood City, California, serves approximately 200 adults who have
low literacy skills. More than 180 volunteer tutors work with these adult students either one-on one or in small groups. The program also has five computers and provides help in using them. Two-thirds of the students are Hispanic, and many do not have a high school diploma or GED. Project READ serves a variety of other populations, including children and teens in the com-munity, people with learning disabilities, and adults in a local prison. The program receives funding through the library’s general fund and receives additional funding and resources from individuals, businesses, and foundations.


Appendix B
Samples Used in the LILAA Evaluation

The LILAA Persistence Study
Appendix Table B.1
Samples Used in the LILAA Persistence Study and Achievement Study
Sample
Definition
Period During Which Sample Was Identified
Sample Size
How Sample Is Used
Program entrants (with at least 3 months of follow-up to check for exit)
New or returning participants (those who became active in a program after at least 3 months of inactivity) who have a confirmed or undetermined exit
January 2000 to September 2002 (Wakefield, where data collection started late, is slightly underrepresented in this sample.)
4,255 To describe the characteristics of adult learn-ers served by LILAA programs
Program entrants: Cohort 1
New or returning participants who entered a program between July 2000 and June 2001
July 2000 through June 2001 1,487 To describe patterns of persistence over time as LILAA programs redesigned and imple-mented strategies to improve persistence
Program entrants: Cohort 2
New or returning participants who entered a program between July 2001 and June 2002
July 2001 through June 2002
1,712
Achievement study participants: Wave 1
Students from five of the nine sites who volunteered to take a battery of literacy tests and complete a short survey
Tests completed between January 2001 and March 2002
242 To describe the literacy levels of students in the LILAA programs and to de-scribe their perspectives on literacy and learning
Achievement study participants: Waves 1 & 2
Students who participated in both waves of testing
Tests completed between May 2002 and March 2003 (Tests were adminis-tered 12-17 months apart, with a mean of 13.75 months between tests.)
152 To describe any changes between Wave 1 and Wave 2
-56-

Appendix C
The Achievement Study Component of the LILAA Persistence Study

-58-
The Design of the Achievement Study Within the larger context of the Literacy in Libraries Across America (LILAA) persistence
study, the achievement study component was designed to provide the opportunity to learn about:
• The literacy level of students in the LILAA programs
• How achievement improves as students spend more time in the programs
The design involves measuring student achievement at two points in time — approxi-mately 12 months apart — with a battery of literacy tests. The literacy levels reported in Chap-ter 2 of this report are based on findings from the first point in time. To the extent possible, all the students who participated in the first wave of the tests have been tracked and retested, re-gardless of whether they remained active in their LILAA program. The results of these tests were supplemented with in-depth qualitative interviews of a subsample of these students, to capture (1) the extent of participation in literacy activities inside and outside the library literacy programs and (2) students’ perceptions of changes in their literacy levels.
The Tests Used in the Achievement Study The battery of tests selected for the achievement study consists of instruments that are
all considered program-based and learner-centered, and they all focus on the learning process as program outcomes. Most important, these tests rely on different procedures for different stu-dents, making them more appropriate for each individual and thus more meaningful and valid. These tests are reputable, standardized tests that are used nationally, which allows for library literacy programs to be assessed among other adult education providers, giving them an equal base of comparison. This is the first time that a battery of standardized tests has been given spe-cifically to a cohort of library literacy programs within a systematic study of them. The tests are described below.
1. The Test of Word Reading Efficiency (TOWRE), published by Pro-Ed, meas-ures reading rate and word recognition. Reading rate and word recognition are important predictors of reading comprehension. (Someone who reads too slowly loses the meaning of long and complicated sentences.) The TOWRE consists of two subtests:
• The Sight Word Efficiency (SWE) subtest measures the number of printed words that can be correctly identified within 45 seconds.

-59-
• The Phonemic Decoding Efficiency (PDE) subtest measures the number of pronounceable words that the test-taker can decode in 45 seconds.1
2. The Peabody Picture Vocabulary Test (PPVT) measures vocabulary skills, as-sessing both verbal and auditory attainment of Standard English. It is a measure of listening and reading vocabulary. The test can be administered to persons of any age. Test-takers are asked to select pictures that best match the meaning of words that are read aloud by the person administering the test.2
3. The Adult Basic Learning Examination (ABLE) test measures several skills, including reading comprehension (only the reading comprehension part is used in this study). For the reading comprehension subtest, test-takers are presented with signs and short reading passages about the day-to-day lives of adults. The pas-sages are followed by questions that test comprehension of the text and the ability to make inferences. The test has three levels: Level 1 is for adults with one to four years of education (primary schooling); Level 2 is for adults with five to eight years of schooling (intermediate schooling); and Level 3 is for adults who have had at least eight years of schooling but who have not graduated from high school.3
4. The Basic English Skills Test (BEST) is a special test for students of English as a Second Language (ESL); it measures English speaking and listening skills. It is designed to measure competency-based listening comprehension, speaking, and elementary reading and writing skills. Test-takers are presented with a series of real-life listening and speaking tasks, such as telling time, paying for a store item, and giving and receiving directions.4 Only those sample members who are learn-ers of English (60 students) took the BEST. See Appendix Table C.1.
Though the achievement tests described above were selected to measure different liter-acy outcomes, some of the differences in achievement levels across the tests are notable. The most highly correlated tests are the ABLE and the TOWRE,5 as would be expected, because the rate of word recognition (as measured by the TOWRE) is an important predictor of reading comprehension (as measured by the ABLE). The absence of correlation between the PPVT and the other tests may suggest that the vocabulary skills measured by the PPVT are distinct and surprisingly unrelated to the other literacy skills as measured with this battery of tests.
1Torgesen, Wagner, and Rashotte, 1999. 2Dunn and Dunn, 1997. 3Karlsen and Gardner, 1986. 4Center for Applied Linguistics, 1984. 5There is a statistically significant correlation coefficient of .51 between the ABLE and the TOWRE
SWE subtest, and there is a statistically significant correlation coefficient of .45 between the ABLE and the TOWRE PDE subtest.

The
LIL
AA
Per
sist
ence
Stu
dy
App
endi
x T
able
C.1
Perf
orm
ance
Lev
els o
n th
e B
asic
Eng
lish
Skill
s Tes
t (B
EST
) for
Eng
lish
Lan
guag
e L
earn
ers
Gen
eral
Lan
guag
e A
bilit
y Li
sten
ing
Com
preh
ensi
on
Ora
l Com
mun
icat
ion
Rea
ding
W
ritin
g B
EST
Scor
e
0. N
o ab
ility
wha
tsoe
ver.
No
abili
ty w
hats
oeve
r. N
o ab
ility
wha
tsoe
ver.
No
abili
ty w
hats
oeve
r. N
o ab
ility
wha
tsoe
ver.
0-8
I. Fu
nctio
ns m
inim
ally
, if a
t all,
in
Engl
ish.
C
an h
andl
e on
ly v
ery
rout
ine
entry
-le
vel j
obs t
hat d
o no
t req
uire
ora
l co
mm
unic
atio
n an
d in
whi
ch a
ll ta
sks
can
be e
asily
dem
onst
rate
d.
A n
ativ
e En
glis
h sp
eake
r use
d to
de
alin
g w
ith li
mite
d En
glis
h sp
eake
rs
can
rare
ly c
omm
unic
ate
with
a p
erso
n at
this
leve
l exc
ept t
hrou
gh g
estu
res.
Und
erst
ands
onl
y a
few
is
olat
ed w
ords
and
ex
trem
ely
sim
ple
lear
ned
phra
ses,
such
as
Wha
t’s y
our n
ame?
Voc
abul
ary
limite
d to
a
few
isol
ated
wor
ds.
No
cont
rol o
f gra
mm
ar.
Rec
ogni
zes m
ost l
ette
rs
of th
e al
phab
et a
nd
sing
le-d
igit
num
bers
.
Cop
ies l
ette
rs o
f the
al
phab
et, n
umbe
rs, o
wn
nam
e an
d ad
dres
s;
need
s ass
ista
nce.
9-15
II. F
unct
ions
in a
ver
y lim
ited
way
in
situ
atio
ns re
late
d to
imm
edia
te n
eeds
. C
an h
andl
e on
ly ro
utin
e en
try-le
vel
jobs
that
do
not r
equi
re o
ral
com
mun
icat
ion
and
in w
hich
all
talk
s ca
n be
eas
ily d
emon
stra
ted.
A
nat
ive
Engl
ish
spea
ker u
sed
to
deal
ing
with
lim
ited
Engl
ish
spea
kers
w
ill h
ave
grea
t diff
icul
ty
com
mun
icat
ing
with
a p
erso
n at
this
le
vel.
Und
erst
ands
a li
mite
d nu
mbe
r of v
ery
sim
ple
lear
ned
phra
ses,
spok
en
slow
ly w
ith fr
eque
nt
repe
titio
ns.
Expr
esse
s a li
mite
d nu
mbe
r of i
mm
edia
te
surv
ival
nee
ds u
sing
ver
y si
mpl
e le
arne
d ph
rase
s. A
sk a
nd re
spon
ds to
ver
y si
mpl
e le
arne
d qu
estio
ns.
Som
e co
ntro
l of v
ery
basi
c gr
amm
ar.
Rec
ogni
zes l
ette
rs o
f th
e al
phab
et, n
umbe
rs
1-10
0, a
nd a
few
ver
y co
mm
on si
ght w
ords
(s
uch
as n
ame,
add
ress
, st
op).
Writ
es le
tters
of t
he
alph
abet
, num
bers
1-
100,
ver
y ba
sic
pers
onal
info
rmat
ion;
on
sim
plifi
ed fo
rms,
need
s ass
ista
nce.
16-2
8
(con
tinue
d)

A
ppen
dix
Tab
le C
.1 (c
ontin
ued)
Gen
eral
Lan
guag
e A
bilit
y Li
sten
ing
C
ompr
ehen
sion
O
ral C
omm
unic
atio
n R
eadi
ng
Writ
ing
BES
T Sc
ore
III.
Func
tions
with
som
e di
ffic
ulty
in
situ
atio
ns re
late
d to
imm
edia
te n
eeds
. C
an h
andl
e ro
utin
e en
try-le
vel j
obs
that
invo
lve
only
the
mos
t bas
ic o
ral
com
mun
icat
ion
and
in w
hich
all
task
s ca
n be
dem
onst
rate
d.
A n
ativ
e En
glis
h sp
eake
r use
d to
de
alin
g w
ith li
mite
d En
glis
h sp
eake
rs
will
hav
e gr
eat d
iffic
ulty
co
mm
unic
atin
g w
ith a
per
son
at th
is
leve
l.
Und
erst
ands
sim
ple
lear
ned
phra
ses,
spok
en
slow
ly w
ith fr
eque
nt
repe
titio
ns.
Expr
esse
s im
med
iate
su
rviv
al n
eeds
usi
ng
sim
ple
lear
ned
phra
ses.
Ask
s and
resp
onds
to
sim
ple
lear
ned
ques
tions
. So
me
cont
rol o
f ver
y ba
sic
gram
mar
.
Rea
ds a
nd u
nder
stan
ds
a lim
ited
num
ber o
f co
mm
on si
ght w
ords
an
d sh
ort,
sim
ple
lear
ned
phra
ses r
elat
ed
to im
med
iate
nee
ds.
Writ
es a
lim
ited
num
ber o
f ver
y co
mm
on w
ords
and
ba
sic
pers
onal
in
form
atio
n; o
n si
mpl
ified
form
s, ne
eds
assi
stan
ce.
29-4
1
IV. C
an sa
tisfy
bas
ic su
rviv
al n
eeds
an
d a
few
ver
y ro
utin
e so
cial
dem
ands
.
Can
han
dle
entry
-leve
l job
s tha
t inv
olve
so
me
sim
ple
oral
com
mun
icat
ion
but f
o rw
hich
task
s can
als
o be
dem
onst
rate
d.
A n
ativ
e En
glis
h sp
eake
r use
d to
de
alin
g w
ith li
mite
d En
glis
h sp
eake
rs
will
hav
e di
ffic
ulty
com
mun
icat
ing
with
a p
erso
n at
this
leve
l.
Und
erst
ands
sim
ple
lear
ned
phra
ses e
asily
an
d so
me
sim
ple
new
ph
rase
s con
tain
ing
fam
iliar
voc
abul
ary
spok
en sl
owly
with
fr
eque
nt re
petit
ions
.
Expr
esse
s bas
ic su
rviv
al
need
s, in
clud
ing
aski
ng
and
resp
ondi
ng to
rela
ted
ques
tions
usi
ng b
oth
lear
ned
and
a lim
ited
num
ber o
f new
phr
ases
. Pa
rtici
pate
s in
basi
c co
nver
satio
ns in
a fe
w
very
rout
ine
soci
al
situ
atio
ns (f
or e
xam
ple,
gr
eetin
g, in
vitin
g).
Spea
ks w
ith h
esita
tion
and
freq
uent
pau
ses.
Som
e co
ntro
l of b
asic
gr
amm
ar.
Rea
ds a
nd u
nder
stan
ds
sim
ple
lear
ned
sent
ence
s and
som
e ne
w se
nten
ces r
elat
ed
to im
med
iate
nee
ds;
freq
uent
m
isin
terp
reta
tions
.
Writ
es c
omm
on w
ords
an
d si
mpl
e ph
rase
s re
late
d to
imm
edia
te
need
s; m
akes
freq
uent
er
rors
and
nee
ds
assi
stan
ce.
42-5
0
(con
tinue
d)

App
endi
x T
able
C.1
(con
tinue
d)
Gen
eral
Lan
guag
e A
bilit
y Li
sten
ing
Com
preh
ensi
on
Ora
l Com
mun
icat
ion
Rea
ding
W
ritin
g B
EST
Scor
e
V. C
an sa
tisfy
bas
ic su
rviv
al n
eeds
an
d so
me
limite
d so
cial
dem
ands
. C
an h
andl
e jo
bs a
nd jo
b tra
inin
g th
at
invo
lve
follo
win
g si
mpl
e or
al a
nd v
ery
basi
c w
ritte
n in
stru
ctio
ns b
ut fo
r w
hich
mos
t tas
ks c
an a
lso
be
dem
onst
rate
d.
A n
ativ
e En
glis
h sp
eake
r use
d to
de
alin
g w
ith li
mite
d En
glis
h sp
eake
rs
will
hav
e so
me
diff
icul
ty
com
mun
icat
ing
with
a p
erso
n at
this
le
vel.
Und
erst
ands
lear
ned
phra
ses e
asily
and
shor
t ne
w p
hras
es c
onta
inin
g fa
mili
ar v
ocab
ular
y sp
oken
slow
ly w
ith
repe
titio
n.
Has
lim
ited
abili
ty to
un
ders
tand
on
the
tele
phon
e.
Func
tions
inde
pend
ently
in
mos
t fac
e-to
-fac
e ba
sic
surv
ival
situ
atio
ns b
ut n
eeds
so
me
help
. A
sks a
nd re
spon
ds to
dire
ct
ques
tions
on
fam
iliar
and
so
me
unfa
mili
ar su
bjec
ts.
Still
relie
s on
lear
ned
phra
ses
but a
lso
uses
new
phr
ases
(tha
is, s
peak
s with
som
e cr
eativ
ity) b
ut w
ith so
me
hesi
tatio
n an
d pa
uses
. C
omm
unic
ates
on
the
phon
e to
exp
ress
a li
mite
d nu
mbe
r of
surv
ival
nee
ds, b
ut w
ith so
me
diff
icul
ty.
Parti
cipa
tes i
n ba
sic
conv
ersa
tions
in a
lim
ited
num
ber o
f soc
ial s
ituat
ions
. C
an o
ccas
iona
lly c
larif
y ge
nera
l mea
ning
by
sim
ple
rew
ordi
ng.
Incr
easi
ng, b
ut in
cons
iste
nt,
cont
rol o
f bas
ic g
ram
mar
.
Rea
ds a
nd
unde
rsta
nds s
ome
shor
t sim
plifi
ed
mat
eria
ls re
late
d to
ba
sic
need
s with
so
me
mis
inte
rpre
tatio
ns.
Writ
es p
hras
es a
nd
som
e sh
ort,
sim
ple
sent
ence
s; c
ompl
etes
si
mpl
ified
form
s. M
akes
som
e er
rors
; ne
eds a
ssis
tanc
e.
51-5
7
(con
tinue
d)

A
ppen
dix
Tab
le C
.1 (c
ontin
ued)
Gen
eral
Lan
guag
e A
bilit
y Li
sten
ing
C
ompr
ehen
sion
O
ral C
omm
unic
atio
n R
eadi
ng
Writ
ing
BES
T Sc
ore
VI.
Can
satis
fy m
ost s
urvi
val n
eeds
an
d lim
ited
soci
al d
eman
ds.
C
an h
andl
e jo
bs a
nd jo
b tra
inin
g th
at
invo
lve
follo
win
g si
mpl
e or
al a
nd
writ
ten
inst
ruct
ions
and
dia
gram
s. A
nat
ive
Engl
ish
spea
ker n
ot u
sed
to
deal
ing
with
lim
ited
Engl
ish
spea
kers
w
ill b
e ab
le to
com
mun
icat
e w
ith a
pe
rson
at t
his l
evel
on
fam
iliar
topi
cs,
but w
ith d
iffic
ulty
and
som
e ef
fort.
Und
erst
ands
co
nver
satio
ns
cont
aini
ng so
me
unfa
mili
ar v
ocab
ular
y on
man
y ev
eryd
ay
subj
ects
, with
a n
eed
for r
epet
ition
, re
wor
ding
, or s
low
er
spee
ch.
Has
som
e ab
ility
to
unde
rsta
nd w
ithou
t fa
ce-to
-fac
e co
ntac
t (fo
r ex
ampl
e, o
n th
e te
leph
one
and
TV)
Func
tions
inde
pend
ently
in
mos
t sur
viva
l situ
atio
ns b
ut
need
s som
e he
lp.
Rel
ies l
ess o
n le
arne
d ph
rase
s; sp
eaks
with
cr
eativ
ity b
ut w
ith
hesi
tatio
n.
Com
mun
icat
es o
n th
e ph
one
abou
t fam
iliar
subj
ects
but
w
ith so
me
diff
icul
ty.
Parti
cipa
tes w
ith so
me
conf
iden
ce in
soci
al
situ
atio
ns w
hen
addr
esse
d di
rect
ly.
Can
som
etim
es c
larif
y ge
nera
l mea
ning
by
rew
ordi
ng.
Con
trol o
f bas
ic g
ram
mar
is
evid
ent b
ut in
cons
iste
nt;
may
atte
mpt
to u
se m
ore
diff
icul
t gra
mm
ar b
ut w
ith
alm
ost n
o co
ntro
l.
Rea
ds a
nd
unde
rsta
nds
sim
plifi
ed m
ater
ials
on
fam
iliar
subj
ects
. M
ay a
ttem
pt to
read
so
me
nons
impl
ified
m
ater
ials
(for
ex
ampl
e, a
not
ice
from
the
gas
com
pany
) but
nee
ds a
gr
eat d
eal o
f as
sist
ance
.
Perf
orm
s bas
ic w
ritin
g ta
sks i
n a
fam
iliar
co
ntex
t, in
clud
ing
shor
t pe
rson
al n
otes
and
le
tters
(for
exa
mpl
e, to
a
teac
her o
r lan
dlor
d).
Mak
es so
me
erro
rs;
may
nee
d as
sist
ance
58-6
4
(con
tinue
d)

A
ppen
dix
Tab
le C
.1 (c
ontin
ued)
Gen
eral
Lan
guag
e A
bilit
y Li
sten
ing
C
ompr
ehen
sion
O
ral C
omm
unic
atio
n R
eadi
ng
Writ
ing
BES
T Sc
ore
VII
. Can
satis
fy su
rviv
al n
eeds
and
ro
utin
e w
ork
and
soci
al d
eman
ds.
Can
han
dle
wor
k th
at in
volv
es
follo
win
g or
al a
nd si
mpl
e w
ritte
n in
stru
ctio
ns in
fam
iliar
and
som
e un
fam
iliar
situ
atio
ns.
A n
ativ
e En
glis
h sp
eake
r not
use
d to
de
alin
g w
ith li
mite
d En
glis
h sp
eake
rs
can
gene
rally
com
mun
icat
e w
ith a
pe
rson
at t
his l
evel
abo
ut fa
mili
ar
topi
cs.
Und
erst
ands
co
nver
satio
ns o
n m
ost
ever
yday
subj
ects
at
norm
al sp
eed
whe
n ad
dres
sed
dire
ctly
; may
ne
ed re
petit
ion,
re
wor
ding
, or s
low
er
spee
ch.
Und
erst
ands
rout
ine
wor
k-re
late
d co
nver
satio
ns.
Incr
easi
ng a
bilit
y to
un
ders
tand
with
out
face
-to-f
ace
cont
act
(tele
phon
e, T
V, r
adio
). H
as d
iffic
ulty
follo
win
g co
nver
satio
n be
twee
n na
tive
spea
kers
.
Func
tions
inde
pend
ently
in
surv
ival
and
man
y so
cial
an
d w
ork
situ
atio
ns b
ut m
ay
need
hel
p oc
casi
onal
ly.
Com
mun
icat
es o
n th
e ph
one
abou
t fam
iliar
subj
ects
. Ex
pand
s on
basi
c id
eas i
n co
nver
satio
n bu
t stil
l spe
aks
with
hes
itatio
n w
hile
se
arch
ing
for a
ppro
pria
te
voca
bula
ry a
nd g
ram
mar
. C
larif
ies g
ener
al m
eani
ng
easi
ly a
nd c
an so
met
imes
co
nvey
exa
ct m
eani
ng.
Con
trols
bas
ic g
ram
mar
but
no
t mor
e di
ffic
ult g
ram
mar
.
Rea
ds a
nd p
artly
un
ders
tand
s som
e no
nsim
plifi
ed
mat
eria
ls o
n ev
eryd
ay su
bjec
ts;
need
s ass
ista
nce.
Perf
orm
s rou
tine
writ
ing
talk
s with
in a
fa
mili
ar c
onte
xt.
Mak
es so
me
erro
rs;
may
nee
d as
sist
ance
.
65+ (c
ontin
ued)

A
ppen
dix
Tab
le C
.1 (c
ontin
ued)
G
ener
al L
angu
age
Abi
lity
List
enin
g
Com
preh
ensi
on
Ora
l Com
mun
icat
ion
Rea
ding
W
ritin
g B
EST
Scor
e
VII
I. C
an p
artic
ipat
e ef
fect
ivel
y in
so
cial
and
fam
iliar
wor
k si
tuat
ions
. A
nat
ive
Engl
ish
spea
ker n
ot u
sed
to
deal
ing
with
lim
ited
Engl
ish
spea
kers
ca
n co
mm
unic
ate
with
a p
erso
n at
this
le
vel a
bout
alm
ost a
ll to
pics
.
Und
erst
ands
gen
eral
co
nver
satio
n an
d co
nver
satio
n on
te
chni
cal s
ubje
cts i
n ow
n fie
ld.
Und
erst
ands
with
out
face
-to-f
ace
cont
act
(tele
phon
e, T
V, r
adio
); m
ay h
ave
diff
icul
ty
follo
win
g ra
pid
or
collo
quia
l spe
ech.
U
nder
stan
ds m
ost
conv
ersa
tion
betw
een
nativ
e sp
eake
rs; m
ay
mis
s det
ails
if sp
eech
is
very
rapi
d or
col
loqu
ial
or if
subj
ect i
s un
fam
iliar
.
Parti
cipa
tes e
ffec
tivel
y in
pr
actic
al a
nd so
cial
co
nver
satio
n an
d in
te
chni
cal d
iscu
ssio
ns in
ow
n fie
ld.
Spea
ks fl
uent
ly in
bot
h fa
mili
ar a
nd u
nfam
iliar
si
tuat
ions
; can
han
dle
prob
lem
situ
atio
ns.
Con
veys
and
exp
lain
s exa
ct
mea
ning
of c
ompl
ex id
eas.
Goo
d co
ntro
l of g
ram
mar
.
Rea
ds a
nd
unde
rsta
nds m
ost
nons
impl
ified
m
ater
ials
, inc
ludi
ng
mat
eria
ls in
ow
n fie
ld.
Perf
orm
s writ
ing
task
s w
ith re
ason
able
ac
cura
cy to
mee
t soc
ial
and
basi
c w
ork
need
s.
IX. C
an p
artic
ipat
e flu
ently
and
ac
cura
tely
in p
ract
ical
, soc
ial,
and
wor
k si
tuat
ions
. A
nat
ive
Engl
ish
spea
ker n
ot u
sed
to
deal
ing
with
lim
ited
Engl
ish
spea
kers
ca
n co
mm
unic
ate
easi
ly w
ith a
per
son
at th
is le
vel.
Und
erst
ands
alm
ost a
ll sp
eech
in a
ny c
onte
xt;
occa
sion
ally
is
conf
used
by
high
ly
collo
quia
l or r
egio
nal
spee
ch.
App
roxi
mat
es a
nat
ive
spea
ker’
s flu
ency
and
ab
ility
to c
onve
y ow
n id
eas
prec
isel
y, e
ven
in u
nfam
iliar
si
tuat
ions
. Sp
eaks
with
out e
ffor
t. H
as e
xcel
lent
con
trol o
f gr
amm
ar w
ith n
o ap
pare
nt
patte
rns o
f wea
knes
s.
Rea
ds n
onsi
mpl
ified
m
ater
ials
.
App
roxi
mat
es a
nat
ive
spea
ker’
s abi
lity
to
writ
e ac
cura
tely
.
(con
tinue
d)

A
ppen
dix
Tab
le C
.1 (c
ontin
ued)
Gen
eral
Lan
guag
e A
bilit
y Li
sten
ing
C
ompr
ehen
sion
O
ral C
omm
unic
atio
n R
eadi
ng
Writ
ing
BES
T Sc
ore
X. H
as a
bilit
y eq
ual t
o th
at o
f a n
ativ
e sp
eake
r of t
he sa
me
soci
oeco
nom
ic
leve
l.
Has
abi
lity
equa
l to
that
of
a n
ativ
e sp
eake
r of
the
sam
e so
cioe
cono
mic
leve
l.
Has
abi
lity
equa
l to
that
of a
na
tive
spea
ker o
f the
sam
e so
cioe
cono
mic
leve
l.
Has
abi
lity
equa
l to
that
of a
nat
ive
spea
ker o
f the
sam
e so
cioe
cono
mic
leve
l.
Has
abi
lity
equa
l to
that
of
a n
ativ
e sp
eake
r of
the
sam
e so
cioe
cono
mic
leve
l.
SO
UR
CE:
Cen
ter f
or A
pplie
d Li
ngui
stic
s, 19
84.
Appendix D
Measuring Student Persistence: Definitions and Limitations

-68-
The data used to analyze student persistence in Chapter 2 come from attendance records from each of the programs in the Literacy in Libraries Across America (LILAA) persistence study. These records provide the hours of participation in different types of learning activities, month by month, from January 2000 through December 2002. They also include basic informa-tion about the students, including their gender, date of birth, and ethnicity. However, the level of detail and the definitions for participation were not consistent across programs. Therefore, in order to talk about students’ experiences the same way across all the programs — using the data available — the researchers developed some basic definitions related to students’ status in a program. These definitions, listed below, may differ from the operational definitions used by the programs and, therefore, may result in the researchers’ finding different trends (or different par-ticipation numbers) than the programs themselves reported.
• “Active”: Some programs may have considered a student active if the stu-dent had attended activities in a given period. But others may have consid-ered a student active if the student had not communicated that he or she had dropped out or if the student had remained informally connected to the pro-gram despite not actually participating. In order to have “active” mean the same thing across all programs, the researchers developed a definition based on the information available to them: A student is defined as active in any given month if he or she had at least one hour of participation recorded in the database for that month.1 The time may have been spent in any of the activi-ties for which programs collected attendance. These activities varied by pro-gram, but all programs did at least collect attendance data for their primary instructional activities — some combination of tutoring, class or group ses-sions, and computer lab activities.
• “Program entry”: Some programs did not record a start date for all stu-dents. Or some programs may have recorded the date of a first contact, while other programs may have recorded the date of a first class or tutoring session. Therefore, the researchers needed to find an alternative, common definition that would include as many students as possible in the analyses. They solved this challenge by defining the month of entry as the first month in the data-base in which a student was “active” after a period of three or more months of not being active. With this definition, the researchers may not always be identifying a student’s first month ever in the program; some students may
1The researchers required at least one hour (rather than a fraction of an hour) for a student to be con-
sidered active because time that was less than one hour typically resulted from data processing of files in which time had to be split across two months. These fractions of hours would be rounded to one month’s time and would be set to missing in the other month’s time.

-69-
have been active in the program four months earlier or a year earlier. In any case, the student either was new to the LILAA program or was beginning the program again.
• “Program exit”: Similar to program entry, program exit is defined by a stu-dent’s participation pattern rather than a date entered in the database. The month of exit is the first month following program entry before at least three months of no activity. And — again similar to program entry — this defini-tion does not necessarily capture program exits without a return; instead, it captures the end of the current spell. In most cases, however the student did not return. The data show that only 12 percent of students who exited a pro-gram for a period of three or more months ever returned. It is important to note that, for some participants, an exit could not be confirmed because the data ended. Therefore, exit rates may slightly underestimate the actual per-centage of students who actually left a program.
The resulting sample for the participation analyses includes 4,255 new or returning par-ticipants (that is, those who became active in a program after at least three months of inactivity) who have a confirmed or undetermined exit. The sample was identified between January 2000 and September 2002. Wakefield — where data collection started late — is slightly underrepre-sented in this sample.
Because of the many challenges that the LILAA programs faced in collecting and man-aging data for the persistence study, it was inevitable that some student participation was not captured in the data provided for the evaluation. Despite such underreporting, however, the data still reveal valuable trends in participation patterns at each program. Because the data cover a long period of time (from January 2000 to December 2002), periodic lapses in entering data on students’ attendance do not invalidate the larger picture of their persistence. Also, although data are likely missing, it can usually be assumed that they will be missing at a relatively consistent level over time, because the programs tended to be faced with the same set of challenges. There-fore, trends over time reveal trends in participation.
It’s important to note that the data do not capture many other aspects of student persis-tence. There are a number of literacy activities that program staff could not quantify and include in the data. For example, students’ time spent doing homework, reading on their own at home, or engaging in conversation with their classmates is important to success in achieving literacy, but the data do not reflect such activities. However, it is assumed that students enrolled in the library literacy programs because they could benefit from the assistance and support that these programs offered. Therefore, analyzing persistence in participation at the library literacy pro-

-70-
grams alone is valuable. Moreover, many of the literacy activities that students pursued on their own time were often a result of their participation in a literacy program.
In addition to limitations in measuring individual literacy activities, this study’s quanti-tative analyses (and the programs’ databases) are not designed to capture many other aspects of students’ lives that are relevant to their literacy experiences. For example, the data typically come from a registration or intake session. The data do not track students’ employment histories after intake; they do not follow outcomes for their families and children; and they do not capture students’ educational progress after leaving the literacy programs (with the exception of the stu-dents included in the achievement study). The researchers also do not consistently know the educational attainment level of students. Most important, they do not have data on why students left the programs. Thus, the assessments of successes for both the programs and the students are necessarily limited.
In sum, the task of collecting and managing data on who students are and just how they are spending their time in literacy programs is a substantial challenge for libraries. It requires a lot of staff time to implement processes to track attendance; to follow up with instructors, tutors and students; to set up and learn new software; and to enter large amounts of data into the sys-tem. And with the added challenges of privacy concerns and the noncompliance of some tutors and students, there is always a large possibility that not all of students’ data are being recorded. However, despite missing information and other limitations, the data collected for this study allow for valuable and valid analyses of student persistence. Although these data may not suf-fice for giving accurate counts of the total number of students participating in each of the LILAA programs, examining the data in the aggregate and over a long period of time allows for analyses of program levels of and trends in participation.

-71-
References and Bibliography
American Library Association. 1964. Service to Adult Illiterates. Chicago: American Library Asso-ciation, Adult Services Division, Committee on Reading Improvement for Adults.
American Library Association. 1998. “Retooling Literacy for the 21st Century.” American Libraries 29 (11).
Appalachian Adult Education Center. 1973. The Interrelating of Library Basic Education Services to Disadvantaged Adults: A Demonstration of Four Alternative Working Models. Annual Re-port, vols. 1-12. Washington, DC: U.S. Department of Education.
Bandura, A. 1986. Social Foundations of Thought and Action: A Social Cognitive Theory. Engle-wood Cliffs, NJ: Prentice-Hall.
Beder, H. 1990. “Reasons for Nonparticipation in Adult Basic Education.” Adult Education Quar-terly 40: 207-218.
Beder, H. 1991. Adult Literacy: Issues for Policy and Practice. Malabar, FL: Krieger.
Beder, H. 1992. “Nonparticipation in Adult Education.” NCAL Connections (Winter). Philadelphia: National Center on Adult Literacy.
Belzer, A. 1998. “Stopping Out Not Dropping Out.” Focus on Basics 2 (8): 15-17.
Bickerton, R., J. Comings, K. Shields, and S. Waldron. 1995. A Research Agenda for Adult Basic Education: Report of a Delphi Study. Boston: World Education.
Birge, L. E. 1981. Serving Adult Learners. Chicago: American Library Association.
Bos, J. M., J. Snipes, S. Scrivener, and G. Hamilton. 2001. Improving Basic Skills: The Effects of Adult Education in Welfare-to-Work Programs. Washington, DC: U.S. Department of Educa-tion.
Brandt, D. 2001. Literacy in American Lives. Cambridge, UK: Cambridge University Press.
Brown, E. 1975. Library Services to the Disadvantaged. Metuchen, NJ: Scarecrow Press.
Bundy, M., and F. Stielow (eds.). 1987. Activism in American Librarianship, 1962-1973. See Major Owens, “The War on Poverty and Community Outreach,” chap. 6, pp. 73-82. New York: Greenwood.
Burtless, G. 1994. “Rising Wage Inequality and the Future of Work in America.” Pages 7-40 in J. Norwood (ed.), Widening Earnings Inequality: Why and Why Now. Washington, DC: Urban Institute Press.

-72-
Center for Applied Linguistics. 1984, 1989. Basic English Skills Test Manual. Washington, DC: Center for Applied Linguistics. [“Student Performance Level Document.” Basic English Skills Test: Test Manual. Washington, DC: Center for Applied Linguistics. Based on Office of Refu-gee Resettlement (U.S. Department of Health and Human Services). 1985. Competency-Based Mainstream English Language Training Project (MELT) Resource Package. Washington, DC: U.S. Department of Health and Human Services, Office of Refugee Resettlement.]
Center for Applied Linguistics. 1998. Research Agenda for Adult ESL. Washington, DC: Center for Applied Linguistics.
Coleman, J. E. 1983. “The Social Responsibilities of Librarians Toward Literacy Education.” In P. Schuman (ed.), Social Responsibilities of Librarians. New York: Bowker.
Comings, J. 1995. “Literacy Skill Retention in Adult Students in Developing Countries.” Interna-tional Journal of Educational Development 15 (1): 37-45.
Comings, J., and S. Cuban. 2000. So I Made Up My Mind: Introducing a Study of Adult Learner Persistence in Library Literacy Programs. New York: MDRC.
Comings, J., S. Cuban, J. Bos, and K. Porter with F. Doolittle. 2003. “As Long As It Takes”: Re-sponding to the Challenges of Adult Student Persistence in Library Literacy Programs. New York: MDRC.
Comings, J., S. Cuban, J. Bos, and C. Taylor. 2001. “I Did It for Myself”: Studying Efforts to In-crease Adult Student Persistence in Library Literacy Programs. New York: MDRC.
Comings, J., A. Parrella, and L. Soricone. 1999. Persistence Among Adult Basic Education Students in Pre-GED Classes. NCSALL Reports 12. Cambridge, MA: National Center for the Study of Adult Learning and Literacy.
Comings, J., S. Reder, and A. Sum. 2001. Building a Level Playing Field. Cambridge, MA: National Center for the Study of Adult Learning and Literary.
Comings, J., A. Sum, and J. Uvin. 2000. New Skills for a New Economy: Adult Education’s Key Role in Sustaining Economic Growth and Expanding Opportunity. Boston: Mass Inc.
Cross, K. 1981. Adults as Learners: Increasing Participation and Facilitating Learning. San Fran-cisco: Jossey-Bass.
Cuban, S. 1999. “Before Days: Women in a Library Literacy Program in Hilo, Hawaii Talk Story.” Ph.D. Dissertation. Madison: University of Wisconsin.
Darkenwald, G. 1986. Adult Literacy Education: A Review of the Research and Priorities for Future Inquiry. New York: Literacy Assistance Center.
Dunn, L., and L. M. Dunn. 1997. Examiner’s Manual for the PPVT-III. Circle Pines, MN: American Guidance Service.

-73-
Estabrook, L., and E. Lakner. 2000. Literacy Programs for Adults in Public Libraries: A Survey Re-port Prepared for the LWRD [Lila Wallace–Reader’s Digest Funds]. Champaign: University of Illinois, Library Research Center, Graduate School of Library and Information Science.
Eyster, G. 1976. Non-Formal Training Institutes: Final Report, 1973-1976. Morehead, KY: More-head State University, Appalachian Adult Education Center.
Geertz, G. 2001. “Using a Multisensory Approach to Help Struggling Adult Learners.” Focus on Basics 5 (A): 16-19.
Hayes, E. 1988. “A Typology of Low-Literate Adults Based on Perceptions of Deterrents to Partici-pation in Adult Basic Education.” Adult Education Quarterly 39: 1-10.
Hiatt. P. 1965. “Urban Public Library Services for Adults of Low Education.” Library Quarterly 12 (1, 2): 81-98.
Karlsen, B., and E. F. Gardner. 1986. Directions for Administering the Adult Basic Learning Exami-nation, Level 1 (2nd ed.), p. 6. New York: The Psychological Corporation, Harcourt, Brace, Jo-vanovich.
Kirsch, I., A. Jungeblut, L. Jenkins, and A. Kolstad. 1993. Adult Literacy in America: A First Look at the Results of the National Adult Literacy Survey. Washington, DC: U.S. Department of Education.
Knowles, M. 1970. The Modern Practice of Adult Education: Andragogy Versus Pedagogy. New York: Association Press.
Kolstad, A., I. Kirsch, K. Yamamoto, N. Norris, D. Rock, A. Jungeblut, P. O’Reilly, M. Berlin, L. Mohadjer, J. Waksberg, H. Goksel, J. Burke, S. Rieger, J. Green, M. Klein, A. Campbell, L. Jenkins, A. Kolstad, P. Mosenthal, and S. Baldi. 2001. Technical Report and Data File User’s Manual for the 1992 National Adult Literacy Survey. Washington, DC: U.S. Department of Education.
Lee, R. E. 1966. Continuing Education for Adults Through the American Public Library, 1833-1964. Chicago: American Library Association.
Levy, F., and R. J. Murnane. 1992. “U.S. Earnings Levels and Earnings Inequality: A Review of Recent Trends and Proposed Explanations.” Journal of Economic Literature 30 (3): 1333-1381.
Lewin, K. 1999. The Complete Social Scientist: A Kurt Lewin Reader, ed. Martin Gold. Washington, DC: American Psychological Association.
Lindzey, G., and E. Aronson. 1985. Handbook of Social Psychology, vol. I. New York: Random House.
Lipsman, C. K. 1972. The Disadvantaged and Library Effectiveness. Chicago: American Library Association.

-74-
Lyman, H. 1973. Library Materials in Service to the New Adult Reader. Chicago: American Library Association.
Lyman, H. 1977a. Literacy and the Nation’s Libraries. Chicago: American Library Association.
Lyman, H. 1977b. Reading and the Adult New Reader. Chicago: American Library Association.
McCook, K. P. 1992. “Where Would We Be Without Them? Libraries and Adult Education Activi-ties, 1966-1991.” Reference and User Services Quarterly [previously published as RQ by the American Library Association] 2: 245-253.
McDonald, B. 1966. Literacy Activities in Public Libraries: A Report of the Study of Services to Adults. Chicago: American Library Association.
Measures and Methods for the National Reporting System for Adult Education: Implementation Guidelines. 2001. Washington DC: Division of Adult Education and Literacy, Office of Voca-tional and Adult Education, U.S. Department of Education.
Mincer, J. 1974. Schooling, Experience, and Earnings. New York: Columbia University Press.
Monroe, M. 1986. “The Evolution of Literacy Programs in the Context of Library Adult Education.” Library Trends (Fall): 197-205.
Murnane, R., and F. Levy. 1996. Teaching the New Basic Skills. New York: Free Press.
National Center for Education Statistics (NCES). 1997. Digest of Education Statistics. NCES 98-015. Washington, DC: U.S. Department of Education, National Center for Education Statistics.
National Institute for Literacy (NIFL). 2000. Equipped for the Future Content Standards. Washing-ton, DC: National Institute for Literacy.
National Institute for Literacy (NIFL). 2001. A National Research and Development Agenda for Adult Learning and Literacy. Washington, DC: National Institute for Literacy.
Nauratil, M. 1985. Public Libraries and Non-Traditional Clienteles: The Politics of Special Ser-vices. Westport, CT: Greenwood Press.
Perin, D., and D. Greenberg. 1993. “Relationship Between Literacy Gains and Length of Stay in a Basic Education Program for Health Care Workers.” Adult Basic Education 3 (3): 171-186.
Polachek, S., and S. W. Siebert. 1993. The Economics of Earnings. Cambridge, UK: Cambridge University Press.
Quigley, B. A. 1997. Rethinking Literacy Education: The Critical Need for Practice-Based Change. San Francisco: Jossey-Bass.
Quigley, B. A. 1998. “The First Three Weeks: A Critical Time for Motivation,” Focus on Basics 2 (8): 6-11.
-75-
Rolstad, G. 1990. “Literacy Services in Public Libraries.” Pages 245-263 in K. Heim and D. Wal-lace (eds.), Adult Services: An Enduring Focus for Public Libraries. Chicago: American Li-brary Association.
Schmidt, S. 1978. “A History of ABE Services in Public Libraries.” In “The Public Library and Adult Basic Education,” ed. Melissa Forinash. Drexel Library Quarterly 14 (4).
Seager, A. 1993. Learning from Public Library Literacy Programs. Portsmouth, NH: RMC Corpo-ration.
Seidman, I. E. 1991. Interviewing as Qualitative Research: A Guide for Researchers in Education and Social Sciences. New York: Teachers College Press.
Shaywitz, S. E., and B. Shaywitz. 2001. “The Neurobiology of Reading and Dyslexia.” Focus on Basics 5 (A): 11-15.
Shirk, J. C. 1983. “Relevance Attributed to Urban Public Libraries by Adult Learners: A Case Study and Content Analysis of 81 Interviews.” Ph.D. Dissertation. College Station: Texas A&M Uni-versity.
Spangenberg, G. 1996. Even Anchors Need Lifelines: Public Libraries in Adult Literacy. New York: Spangenberg Learning Resources and the Center for the Book.
Spradley, J. P. 1979. The Ethnographic Interview. New York: Holt, Rinehart and Winston.
Spradley, J. P. 1980. Participant Observation. New York: Holt, Rinehart and Winston.
Sticht, T. 1982. Evaluation of the Reading Potential Concept for Marginally Illiterate Adults. Alex-andria, VA: Human Resources Research Organization.
Sticht, T., B. McDonald, and P. Erickson. 1998. Passports to Paradise: The Struggle to Teach and to Learn on the Margin of Adult Education. San Diego: Consortium for Workforce Education and Lifelong Learning (CWELL).
Strauss, A., and J. Corbin. 1990. Basics of Qualitative Research: Grounded Theory Procedures and Techniques. Newbury Park, CA: Sage Publications.
Strucker, J., and R. Davidson. 2000. “How the ARCS Was Done.” NCSALL Occasional Paper. Cambridge, MA: National Center for the Study of Adult Learning and Literacy. Web site: http://ncsall.gse.harvard.edu/research/op_arcs.pdf.
Sum, A., R. Taggart, and N. Fogg. 1995. Dreams to Dust: The Deteriorating Labor Market For-tunes of Young Adult Men and Women in the United States, 1967-1994. Boston: Northeastern University, Center for Labor Market Studies.
Torgesen, J. K., R. Wagner, and C. A. Rashotte. 1999. Test of Word Reading Efficiency (TOWRE) Examiner’s Manual. Austin, TX: Pro-Ed, pp. 8-9.
Tracy-Mumford, F. 1994. Student Retention: Creating Student Success. NAEPDC Monograph 2. Washington, DC: National Adult Education Professional Development Consortium, Inc.

-76-
Tyler, J., R. Murnane, and J. Willett. 2000. “Cognitive Skills Matter in the Labor Market, Even for School Dropouts.” NCSALL Reports 15. Cambridge, MA: National Center for the Study of Adult Learning and Literacy.
Vann, S. K. 1978. Melvil Dewey: His Enduring Presence in Librarianship. Littleton, CO: Libraries Unlimited, Inc.
Weibel, K. 1982. Outreach Programs in Libraries, 1960-1975. Madison: University of Wisconsin.
Weingand, D. E. (ed.). 1986. “Adult Education, Literacy and Libraries.” Champaign: University of Illinois, Graduate School of Library and Information Science. Library Trends 35 (2).
Wikelund, K., S. Reder, and S. Hart-Landsberg. 1992. Expanding Theories of Adult Literacy Par-ticipation: A Literature Review. NCAL Technical Report TR92-1. Philadelphia: National Cen-ter on Adult Literacy.
Young, M., N. Fitzgerald, and M. Morgan. 1994. National Evaluation of Adult Education Pro-grams: Learner Outcomes and Program Results. Arlington, VA: Development Associates.
Young, M., H. Fleischman, N. Fitzgerald, and M. Morgan. 1994. National Evaluation of Adult Edu-cation Programs: Patterns and Predictors of Client Attendance. Arlington, VA: Development Associates.
Zweizig, D., J. Robbins, and D. Johnson. 1988. Libraries and Literacy Education: Comprehensive Survey Report. Washington, DC: U.S. Department of Education.

-77-
Publications on Literacy in Libraries Across America
“As Long As It Takes” Responding to the Challenges of Adult Student Persistence in Library Literacy Programs 2003. John Comings, Sondra Cuban, Johannes M. Bos, Kristin E. Porter, with Fred C. Doolittle
“I Did It for Myself” Studying Efforts to Increase Adult Learner Persistence in Library Literacy Programs 2001. John P. Comings, Sondra Cuban, Johannes M. Bos, Catherine J. Taylor
“So I Made Up My Mind” Introducing a Study of Adult Learner Persistence in Library Literacy Programs 2000. John Comings, Sondra Cuban


About MDRC
MDRC is a nonprofit, nonpartisan social policy research organization. We are dedicated to learning what works to improve the well-being of low-income people. Through our research and the active communication of our findings, we seek to enhance the effectiveness of social policies and programs. MDRC was founded in 1974 and is located in New York City and Oakland, California.
MDRC’s current projects focus on welfare and economic security, education, and employment and community initiatives. Complementing our evaluations of a wide range of welfare reforms are new studies of supports for the working poor and emerging analyses of how programs affect children’s development and their families’ well-being. In the field of education, we are testing reforms aimed at improving the performance of public schools, especially in urban areas. Finally, our community projects are using innovative approaches to increase employment in low-income neighborhoods.
Our projects are a mix of demonstrations ― field tests of promising program models ― and evaluations of government and community initiatives, and we employ a wide range of methods to determine a program’s effects, including large-scale studies, surveys, case studies, and ethnographies of individuals and families. We share the findings and lessons from our work ― including best practices for program operators ― with a broad audience within the policy and practitioner community, as well as the general public and the media.
Over the past quarter century, MDRC has worked in almost every state, all of the nation’s largest cities, and Canada. We conduct our projects in partnership with state and local governments, the federal government, public school systems, community organizations, and numerous private philanthropies.