“determination of critical micelle concentrations using uv- visible spectroscopy” ·...
TRANSCRIPT

J. High School Res. 2011, vol. 2, issue 1
Template version 20090630 © 2009 FWF and KAS, UTA
“Determination of Critical Micelle Concentrations Using UV-Visible Spectroscopy” Nasiru, Tahirat;1 Avila, Luis;1 Levine, Mindy2 1Department of Chemistry, Columbia University, 3000 Broadway, New York, NY 10027 2Department of Chemistry, University of Rhode Island, 51 Lower College Road, Kingston, RI 02881 October 6th, 2010, March 10th, 2011, published September 27th, 2011 Abstract: There is an ongoing need for methods to measure the critical micelle concentration (CMC) of surfactants, which are commonly used in household products like soap and detergent. Reported herein is a straightforward method to determine CMCs, by measuring the absorbance of a water-insoluble dye that dissolves in solution in the presence of micelles. The effect of a variety of electrolytes on the CMC of sodium-n-dodecylbenzenesulfonate is quantified and analyzed using a portable and inexpensive MicroLab spectrophotometer. These results indicate that non-transition metal electrolytes lower the critical micelle concentration of the surfactant. D-block metals nickel, copper, and zinc, however, form complexes with the dye. These colored complexes obscure the accurate determination of the CMC.
Introduction: Surfactants (surface-active agents) are amphiphilic organic compounds structurally composed of a long hydrocarbon “tail” and a water-soluble polar “head” as represented schematically in Figure 1.
Figure 1: Schematic representation of a surfactant The structures of many common surfactants are shown in Figure 2. Surfactants are found in a wide variety of commercial products such as industrial and household detergents, emulsifiers, adhesives, and paints.
Figure 2: Chemical structures of common surfactants
Surfactants can assume several supramolecular arrangements in solution, including circular aggregates called micelles (Figure 3). Micelles are formed when the surfactant concentration reaches a certain value, termed the critical micelle concentration (CMC), and are arranged with the hydrophobic tails oriented inward and the hydrophilic heads oriented toward the aqueous solution.
Figure 3: Schematic representation of micelles
O S ONaO O
sodium dodecyl sulfate
SONa
O O
sodium n-dodecylbenzenesulfonate
N Brcetyl trimethyl ammonium bromide
N O
lauryldimethylamine oxide
J. High School Res. 2011, vol. 2, issue 1
Template version 20090630 © 2009 FWF and KAS, UTA
There are many methods that have been developed to determine the CMC of surfactants: (1) The fluorescence changes of acridine orange are used to determine the CMC of surfactants;1 (2) The dianion of fluorescein exhibits substantial fluorescence changes that can be used to determine the CMC of cationic surfactants;2 and (3) The surface tension of surfactant solutions was also used to determine the CMC.3 One of the simplest methods for CMC determination is to measure the absorbance of 1-(2-pyridylazo)-2-naphthol (PAN), a water-insoluble organic dye (Figure 4), at 470 nm.4 Below the CMC, the dye does not dissolve in the aqueous surfactant solution, and the absorbance of the solution remains low. At the CMC, a sudden rise in the solution’s absorbance is observed, as the dye is encapsulated in micelles and dissolves in solution.
Figure 4: Chemical structure of 1-(2-pyridylazo)-2-naphthol (PAN) The previous report using PAN to measure the CMC briefly mentions that electrolytes such as sodium carbonate lower the CMC of surfactants. Reported herein is a detailed investigation into the effect of a variety of salts, specifically sodium carbonate, sodium phosphate, sodium chloride, and potassium nitrate, on the CMC of sodium-n-dodecylbenzenesulfonate (SDBS). The effect of a variety of d-block metal cations on the CMC of SDBS, specifically Cu2+, Ni2+, and Zn2+, is also investigated. We find that the addition of non-
transition metal electrolytes lowers the CMC of SDBS, and the addition of transition metal salts leads to the direct complexation of the PAN dye. All of these results can be quantified using a MicroLab spectrophotometer, which is portable and inexpensive. Finally, the resulting color changes of the dye in solution are quite dramatic and exciting. Experimental Methods: Materials All chemicals were obtained from Sigma-Aldrich, St. Louis, MO, USA, and used as received. Instrumentation A MicroLab FS-522 Spectrophotometer was obtained from MicroLab, Inc., Bozeman, MT, USA. An Agilent 8453 UV-Visible Spectrophotometer (Santa Clara, CA, USA) was used to obtain full absorption spectra of the dye with transition metals. Procedure The following stock solutions were prepared: 1. 100 mL of a 1.6 x 10⁻³ M solution of
PAN in pentanes (0.040 g PAN) 2. 200 mL of a 8.0 x 10⁻³ M SDBS
aqueous solution (0.558 g SDBS) 3. 200 mL of a 3.0 x 10⁻² M Na2CO3
aqueous solution (0.636 g Na2CO3) 4. 200 mL each of an 0.10 M aqueous
solution were prepared for the following inorganic salts: NaCl, Na3PO4, Zn(NO3)2, Cu(NO3)2, KNO3, and NiSO4.6H2O.
Fifteen dilutions of SDBS were prepared as follows: 1 mL to 15 mL of the SDBS stock solution were measured into volumetric flasks and diluted to a final volume of 50 mL. The final

J. High School Res. 2011, vol. 2, issue 1
Template version 20090630 © 2009 FWF and KAS, UTA
Table 1: Dilutions and concentrations of SDBS Solution number
SDBS added (mL)
H2O added (mL)
Final total volume (mL)
Final SDBS concentration (M)
1 1 49 50 1.1 x 10⁻⁴ 2 2 48 50 2.1 x 10⁻⁴ 3 3 47 50 3.2 x 10⁻⁴ 4 4 46 50 4.2 x 10⁻⁴ 5 5 45 50 5.3 x 10⁻⁴ 6 6 44 50 6.4 x 10⁻⁴ 7 7 43 50 7.5 x 10⁻⁴ 8 8 42 50 8.5 x 10⁻⁴ 9 9 41 50 9.6 x 10⁻⁴
10 10 40 50 1.1 x 10⁻³ 11 11 39 50 1.2 x 10⁻³ 12 12 38 50 1.3 x 10⁻³ 13 13 37 50 1.4 x 10⁻³ 14 14 36 50 1.5 x 10⁻³ 15 15 35 50 1.6 x 10⁻³
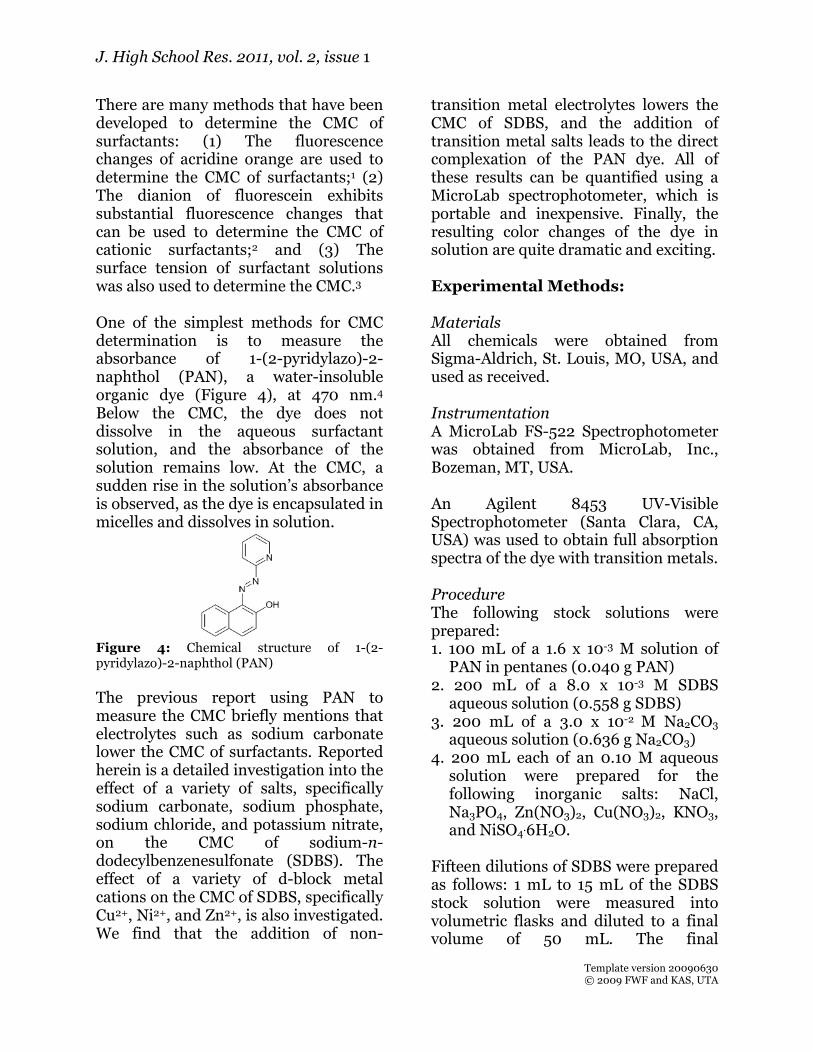
concentrations ranged from 1.1 x 10⁻⁴ M to 1.6 x 10⁻³ M as shown in Table 1. To each MicroLab vial was added 10 mL of an SDBS solution and 5 mL of a salt solution. Ten drops of the PAN solution in pentanes were added to each vial. The container was gently swirled and the pentane was allowed to evaporate for 20 minutes. The absorbance of each solution at 470 nm was measured using the MicroLab spectrophotometer. Results and Discussion Section: Changes in the CMC: Measuring the absorbance of the dye-surfactant solution as a function of surfactant concentration allows one to determine the CMC of each solution. Specifically, at concentrations below the CMC, the solution absorbance is extremely low. At the CMC, there is a sudden increase in absorbance. Above the CMC, the absorbance of the solution increases linearly with increasing concentration. The CMC occurs at the concentration where the two lines intersect, or where the flat absorption line starts to increase. The concentration that
corresponds to that intersection is the point at which micelles form. The literature-reported value for the CMC of SDBS in water is 1.6 x 10⁻³ M.4 The presence of electrolytes is known to decrease the CMC of surfactants. In this experiment, the addition of KNO3, NaCl and Na2CO3 resulted in a decrease in the CMC of SDBS from 1.6 x 10⁻³ M to 4.3 x 10⁻⁴ M. Figure 5 shows the effect of NaCl on the CMC of SDBS. There is a marked increase in the absorbance of PAN at a SDBS concentration of 4.3 x 10⁻⁴ M, representing the CMC of SDBS in that solution. KNO3 and Na2CO3 solutions behave similarly. The absorbance of SDBS/PAN solutions in the presence of Na3PO4 were measured as well. However, there was no sudden increase in the solution absorbance at any concentration of SDBS that would indicate that the CMC was reached. The absorbance of SDBS/PAN in the presence of Zn(NO3)2, a non-colored d-block metal, was measured (Figure 6). In this case, a significant increase in
J. High School Res. 2011, vol. 2, issue 1
Template version 20090630 © 2009 FWF and KAS, UTA
Figure 5: CMC determination of SDBS in the presence of sodium chloride
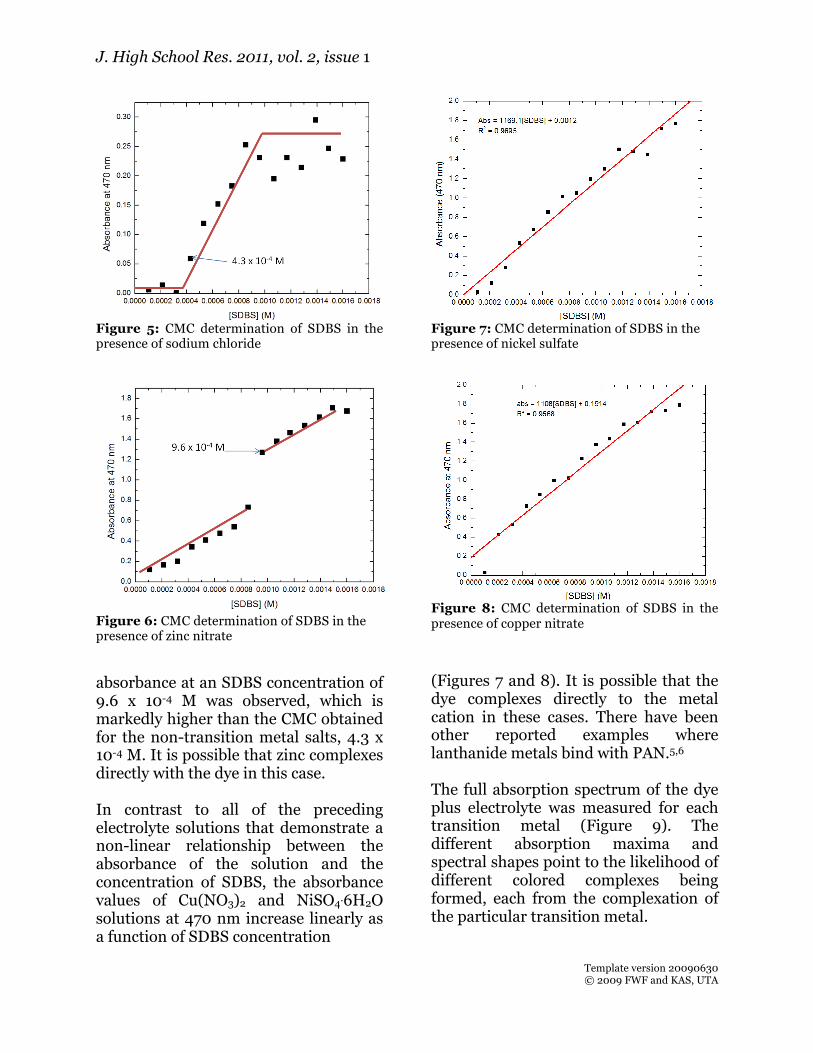
Figure 6: CMC determination of SDBS in the presence of zinc nitrate absorbance at an SDBS concentration of 9.6 x 10⁻⁴ M was observed, which is markedly higher than the CMC obtained for the non-transition metal salts, 4.3 x 10⁻⁴ M. It is possible that zinc complexes directly with the dye in this case. In contrast to all of the preceding electrolyte solutions that demonstrate a non-linear relationship between the absorbance of the solution and the concentration of SDBS, the absorbance values of Cu(NO3)2 and NiSO4.6H2O solutions at 470 nm increase linearly as a function of SDBS concentration
Figure 7: CMC determination of SDBS in the presence of nickel sulfate
Figure 8: CMC determination of SDBS in the presence of copper nitrate
(Figures 7 and 8). It is possible that the dye complexes directly to the metal cation in these cases. There have been other reported examples where lanthanide metals bind with PAN.5,6 The full absorption spectrum of the dye plus electrolyte was measured for each transition metal (Figure 9). The different absorption maxima and spectral shapes point to the likelihood of different colored complexes being formed, each from the complexation of the particular transition metal.

J. High School Res. 2011, vol. 2, issue 1
Template version 20090630 © 2009 FWF and KAS, UTA
Figure 9: Absorption spectrum of PAN with SDBS in the presence of: (a) copper nitrate; (b) nickel sulfate; and (c) zinc nitrate Color changes: For each electrolyte solution, as the concentration of SDBS increases, the color of the solution changes. For example, the most dilute NaCl solutions appear pink. Starting at 5.1 x 10⁻⁴ M SDBS concentration, the solutions appear yellow/orange in color. This color change, from pink to yellow/orange as the concentration of surfactant increases, is seen for the Na2CO3 and Na3PO4 solutions as well (Figure 10). We also investigated how the absorption of the free metal ions in solution related
Figure 10: Color changes in sodium carbonate solutions of PAN and SDBS (increasing concentrations of SDBS as you move from left to right)
to the absorption of their complexes with PAN. Figures 11 and 12 show the absorption spectra of copper (II) and nickel (II) in the presence and absence of PAN. These results indicate that copper has a broad near-infrared absorption band in both the free and complexed state, as well as visible absorption peaks corresponding to the Cu-PAN complex. Nickel has a sharp absorption band at approximately 395 nm in both the free and complexed state. Free nickel cation has two additional peaks at 655 and 722 nm, whereas the Ni-PAN complex has two
Figure 11: Absorption spectrum of copper (II) sulfate in water and in the presence of SDBS and PAN

J. High School Res. 2011, vol. 2, issue 1
Template version 20090630 © 2009 FWF and KAS, UTA
Figure 12: Absorption spectrum of nickel (II) in water and in the presence of SDBS and PAN addition peaks at 549 and 607 nm. These results indicate that some of the absorption bands in the metal-PAN complexes can be ascribed to the metal absorption, but that there are some bands that are uniquely related to the dye and the dye-metal complexes. Conclusion: The experiment was designed to test the quantitative effect of sodium salts on the CMC of SDBS, and the absorbance of transition metal cations in surfactant solutions. Based on the data, the following conclusions can be drawn: 1. The CMC of SDBS in the presence of various electrolytes was determined to be substantially lower than the CMC of SDBS in the absence of electrolytes. Additionally, the CMC of SDBS in the presence of several electrolytes was identical: KNO3, Na2CO3, and NaCl all lowered the CMC of SDBS to 4.3 x 10⁻⁴ M (in the absence of electrolytes the CMC is 1.6 x 10⁻³ M). 2. Both Cu(NO3)2 and NiSO4.6H2O likely complex with the PAN dye and prevent the formation of micelles. Thus, a linear
correlation between the absorbance of the metal-dye solution and its concentration is observed. 3. The MicroLab spectrophotometer was effective in most cases in quantitatively determining the CMC in the presence of various electrolytes. Excellent linear correlations were obtained between concentration and solution absorbance in the presence of copper nitrate and nickel sulfate using the MicroLab spectrophotometer. In summary, the CMC of a common surfactant has been measured under a variety of conditions. The micelles formed under these conditions can be utilized for several applications. Acknowledgements: I would like to take this opportunity to express my utmost gratitude to Professor Mindy Levine for her mentorship, guidance, and assistance throughout this experimental process. I would also like to extend this appreciation to Dr. Avila, who provided me his lab and the resources to conduct this experiment. I also want to thank the ACS Project SEED for their financial support. And finally, I would like to thank my parents for their relentless support and motivation. References: 1. Rujimethabhas, M.; Wilairat, P. J. Chem. Ed.
1978, 55, 342. 2. Roessler, N. J. Chem. Ed. 1979, 56, 675. 3. Worley, J.D. J. Chem. Ed. 1992, 69, 678. 4. Furton, K.G.; Norelus, A. J. Chem. Ed. 1993,
70, 254. 5. Drozdzewski, P. M. J. Mol. Struct. 1990, 220,
95. 6. Rao, I. M.; Satyanarayana, D. J. Ind. Chem.
Soc. 1980, 57, 1132.