“crossroads” · 2018-05-11 · dec-13 y-14 sep-14 jan-15 y-15 sep-15 jan-16 y-16 sep-16 jan-17...
TRANSCRIPT

“Crossroads”
MAY 2018 | ISSUE 65

This document is not valid without disclosure; refer the last page for the disclosure
Alpha Strategist | “Crossroads”
Contents
MAY 2018 | ISSUE 65 2
Executive Summary
Section I………………………………………………………………......................................................………...04-21
ection II…………………………………………………….......................................................………………....22-37
Section III…………………………………………………….........................................................……………….39-67
………………………………………………………………........................................…….......03
(Market through Graphs, Our advisory calls, Model Portfolio & performance, Outlook, Investment
Opportunities & Investment articles)
S
(Detailed views on Equities, Fixed Income, Alternative)
(Advisory approach, 4C Framework, Update on our recommended products)

MAY 2018 | ISSUE 65 3
From a market stand point we are at ”. Markets are witnessing headwinds arising from
concerns over the upcoming state elections, trade spats between major global economies and
spike in global yields. On the other hand, we are witnessing tail winds in the form of increasing
economic traction in the domestic economy resulting in expectation of strong earnings and this
has been complimented by robust domestic flows. Clearly the confluence of the above has
resulted in resurgence of volatility which has been absent for a while now. We see the overall
environment as positive for risky assets, but expect muted returns and higher volatility going
forward.
From a global stand point, optimism appears to be on the rise. A fiscal stimulus for the US economy via tax reform, a
tightening job market combined with substantial increase in Federal borrowing has resulted in a sharp up tick in US
treasury yields. With this development we believe that the tailwind from an accommodative global liquidity condition is
increasingly being challenged, as key central banks tighten monetary policy. This is likely to have a bearing on flows
towards emerging markets.
Growth prospects for the Indian economy continue to look bright. This is evident from various high frequency data
points. Increased economic activity will eventually get reflected in corporate profitability. The building blocks of a
domestic economic recovery seem to be falling in place. This appears to be led by both structural and cyclical factors.
Clearly the visibility of earnings recovery which had been elusive for a while now appears to be turning into reality.
There are early signs of normalization after earnings experienced a subdued trend over the past couple of years. Our
newly launched strategy “Renaissance India Next PMS” aims to capture growth through companies and sectors which
have been head winded in the past but will see good up tick in the coming years. We continue to advise a staggered
approach to investing in equities with a view to commit more during any sharp corrections. In order to capitalize on the
upcoming volatility we are happy to introduce you to “Avendus Enhanced Return Fund” which endeavors to generate
equity like returns while keeping volatility lower than traditional equity strategies. We believe that this proposition
would certainly add value to your portfolio.
Fixed income markets have been quite volatile in the last couple of months with ten year government bond yields
moving between 7.1-7.8%. The government and the RBI have announced a slew of measures to calm the bond markets.
We believe that the RBI will be in an extended state of pause on interest rates. Hence we recommend investors to look at
low maturity high accrual portfolios like short term funds, selected credit portfolios and ultra-short term funds.
At such “ ” it is important to revisit your stated goals as well as asset allocation and stick to it in a disciplined
manner. As usual this edition is rich with several articles to make your investment journey simpler.
Crossroads
Crossroads
“
Happy Investing!
Ashish Shanker
(Head, Investment Advisory – Private Wealth Management)
Executive Summary
Alpha Strategist | “Crossroads”

This document is not valid without disclosure; refer the last page for the disclosure
MAY 2018 | ISSUE 65 4
Section I
Market through Graphs........................................................................................05
Portfolios Commentary........................................................................................08
Model Portfolios .................................................................................................09
.......................................................10
Succession of a Female - Hindu.............................................................................12
Power of Asset Allocation....................................................................................13
Hind-sight investing ............................................................................................15
Decoding Investment Style..................................................................................16
Temperature Gauge.............................................................................................17
Fixed Income Manager Selection Framework
Investment Grid ..................................................................................................19
Our Recommendations .......................................................................................20
Alpha Strategist | “Crossroads”

1.2
1.4
1.6
1.8
2.0
2.2
2.4
2.6
2.8
3.0
3.2 10-year US Treasury Yield (%)
De
c-1
3
Ma
y-1
4
Se
p-1
4
Jan
-15
Ma
y-1
5
Se
p-1
5
Jan
-16
Ma
y-1
6
Se
p-1
6
Jan
-17
Ma
y-1
7
Se
p-1
7
Jan
-18
Ap
r-1
8
Macro Economy
• The yield on the 10-year Treasury note ended higher in
April, crossing the psychological mark of 3% during the
month
Some encouraging US economic data along with
expectation of more aggressive interest rate hikes
from the US Fed dented sentiment for treasuries
The rise in US treasury yields comes at a time when
there are concerns of widening trade deficit, fiscal
slippage, rising crude prices and the rupee
depreciation in India. This in turn could impact the
foreign flows into India
•
•
• The Indian Meteorological Department (IMD) released
its first forecast for the 2018 southwest monsoon
(June-September) rainfall with expectations of normal
monsoon
It expects monsoon rainfall at 97% of the long period
average (LPA) with very less probability of
experiencing a deficit monsoon
With rising tensions about farmers' distress, general
elections in 2019 and the fact that winter monsoon
(January-February) rainfall in 2018 was the worst in at
least 26 years, 2018 southwest monsoon holds special
significance
•
•
IMD expects normal monsoon in 2018
Source: Indian Meteorological Department (IMD)
MAY 2018 | ISSUE 65 5
Markets through Graphs
Alpha Strategist | “Crossroads”
Source: Bloomberg
US Treasury yield hits its highest level since 2014
• Oil prices rose over 5.2% in April to close at $74/bbl as
compared to $70.3/bbl at the end of the previous
month
Oil prices were hit by a stronger US dollar and a sharp
increase in US crude inventories. However, support
came from lingering uncertainty over the Iranian
nuclear deal
Rising oil prices could have an adverse impact on
India's current account deficit. However, there would
be limited impact on inflation, given its low weightage
in the inflation measure
•
•
Oil prices continue to surge
Source: Bloomberg
9899
98
9593
106
9697
102
92
106
8785
98
95
2011 2012 2013 2014 2015 2016 2017 2018
(% of LPA)IMD's April forecast Actual rainfall
??
20
35
50
65
80Oil (Brent) $/bbl
Ap
r-1
5
Jul-
15
Oct
-15
Jan
-16
Ap
r-1
6
Jul-
16
Oct
-16
Jan
-17
Ap
r-1
7
Jul-
17
Oct
-17
Jan
-18
Ap
r-1
8

• Equity markets witnessed a stellar month with Nifty 50
gaining 6.2% in April as compared to decline of 4.9%
and 3.6% in the month of and March,
respectively
Robust domestic flows and healthy start to Q4FY18
earnings season supported market rally amidst FII
selling, currency depreciation and rising crude prices
The current valuation levels are on the back of
depressed earnings growth over the last few years. We
expect earnings to recover supported by demand
recovery in consumption sectors, low base of
demonetization and commodity price inflation
February
•
•
Equities
MAY 2018 | ISSUE 65 6
Source: Bloomberg
Sensex PE (TTM) trades 31% above average
Alpha Strategist | “Crossroads”
• Both earnings yield to bond yield (EY-BY) and MOVI
which we use to gauge market attractiveness, trades in
the fair value zone
Both indicators suffered on the back of recent market
rally and rise in bond yields. However, even at these
levels investors have made positive returns at least
70% of times for 3-year holding period
Given the current valuations, we suggest investors to
stagger their investments over the next few months
and capitalize on any sharp decline by incremental
deployment
•
•
Valuation indicators trade in fair value zone
Source: MOWM
• The Q4FY18 earnings season has so far been broadly in
line with expectations in terms of revenue. However,
profits have missed estimates, largely dragged by
corporate-focused private banks
Sales, EBITDA and PAT for the 20 Nifty companies have
grown at 19.1%, 14.1% and 2.2%, as against
expectations of 16.0%, 13.6% and 11.9%, respectively
We expect the performance of corporate-focused
private banks and PSU Banks to drag the aggregates in
Q4FY18. However, consumer, cement, autos, private
banks, NBFCs and IT shall provide the necessary
cushion which reinstates our FY19 earnings recovery
story
•
•
Nifty (20 companies) sales growth of 19%
(estimate 16% YoY)
Source: MOSL
Ap
r-0
8
24.1
18.8
5.0
10.0
15.0
20.0
25.0
30.0 Sensex TTM PE 10-year average PE
Ap
r-0
9
Ap
r-1
0
Ap
r-1
1
Ap
r-1
2
Ap
r-1
3
Ap
r-1
4
Ap
r-1
5
Ap
r-1
6
Ap
r-1
7
Ap
r-1
8
10
1
9
12
17
12 12
14
19
Ma
r-1
6
Jun
-16
Se
p-1
6
De
c-1
6
Ma
r-1
7
Jun
-17
Se
p-1
7
De
c-1
7
Ma
r-1
8
Sales growth (%YoY)
0.50
0.55
0.60
0.65
0.70
0.75
0.80
0.85
80.0
90.0
100.0
110.0
120.0
130.0 MOVI (LHS) EY-BY (RHS)
Ap
r-1
5
Oct
-15
Ap
r-1
6
Oct
-16
Ap
r-1
7
Oct
-17
Ap
r-1
8

MAY 2018 | ISSUE 65 7
Summary
Fixed Income
Consumption, Domestic Cyclicals, Rural
High quality Corporate Bond funds,
Credit Opportunities funds, FMPBullish on accrual strategies
& tactical on dynamic bond funds
Sovereign Gold Bonds, Gold ETFsNeutral Neutral
AlternativesGold prices inches up
• Gold prices (-1.8%) saw a slight fall in April to close the
month at $1,315 per ounce as compared with $1,339
per ounce in the previous month
Gold prices started on a high note due to weakness in
the US dollar and fears of a global trade war, however,
gains were offset after the US Fed raised expectations
of a faster pace of rate hikes and as dollar strengthened
We continue to hold our neutral stance on gold, as we
believe there is merit in having allocation to this asset
class as it acts as a hedge against any major geopolitical
risk
•
•
Alpha Strategist | “Crossroads”
Source: Bloomberg
6.06.46.87.27.68.08.48.89.29.6
10.010.4
1 Yr 3 Yr 5 Yr
Yie
ld (
%)
Maturity
Gsec AAA AA AGsec (1 year bck) AAA (1 year bck) AA (1 year bck) A (1 year bck)
Source: Bloomberg
Increase in yields across credit curve
• In lieu of the ongoing concerns, yields across the credit
curve at the shorter end have shifted upwards hence
resulting in spreads of 40–170 bps w.r.t different credit
assets
Quantum of rise in yields of AAA segment has not been
accompanied with a similar rise in yield of lower rated
assets owing to spread compression
From a prudent risk reward perspective, short term
AAA assets offers a value proposition to lock in
investments at higher yields which were prevalent in
lower rated assets
•
•
6.2 6.2
6.7
7.3
7.67.8 7.8 7.9 7.8
8.07.9
7.8 7.88.0 8.0 8.0
5.8
6.0
6.26.4
6.6
6.8
7.07.2
7.4
7.67.8
8.0
8.2
3M 6M 1Y 2Y 3Y 4Y 5Y 6Y 7Y 8Y 9Y 10Y 11Y 12Y 13Y 17Y
Years
Current 1 mnth back 6 mnths back 1 yr back
Yields remain volatile on confluence of domestic &
global factors
• Indian bond market has kept the stakeholders on toes
due to wide swings in the yields.
While RBI’s dovish stance on inflation, reduced
government borrowing, OMO purchases and easing of
FPI norms supported bond market, hawkish stance
revealed in MPC minutes, rising crude oil prices and
global yields dented market sentiment
In such volatile times, it is prudent to stick to high
quality/credit oriented accrual strategies so as to get a
visibility of risk adjusted returns
•
•
Source: Bloomberg
1000
1050
1100
1150
1200
1250
1300
1350
1400
Ap
r-1
4
Au
g-1
4
De
c-1
4
Ap
r-1
5
Au
g-1
5
De
c-1
5
Ap
r-1
6
Au
g-1
6
De
c-1
6
Ap
r-1
7
Au
g-1
7
De
c-1
7
Ap
r-1
8
GOLD Spot ($/Oz)

MAY 2018 | ISSUE 65 8
Investment Committee
Alpha Strategist | “Crossroads”
Portfolios CommentaryTactical changes and strategies
� – Replaced Income Funds with Dynamic Bond Funds based on the note released -
– Reduced allocation to Gold by 25% and increased to Dynamic Bond Funds based on discussionin the Investment Committee meeting
– Reduced further allocation to Gold by 25% and increased to Dynamic Bond Funds based on discussionin the Investment Committee meeting
– Exited Gilt Fund’s and moved to Short-term Funds (40%), Income Funds (40%) and Dynamic BondFunds (20%) based on the note released -
– Exited Income Funds and other long duration investments and invested the redemption proceeds inUltra Short-term Funds based on the note released –
– Cash allocation brought back to its strategic weight and invested the balance allocation into giltfunds based on the note released –
– Switched 15% of equity allocation to Information Technology (IT) sector funds from large cap andmulti cap funds, based on the note released –
– Reduced 10% of equity allocation and switched to ultra short term funds based on the notereleased –
– Switched 50% of Short-term Funds allocation to Gilt Funds, to increase duration of theportfolio, based on the note released –
– Deployed Cash in Nifty ETFs, based on the note released –
– Switched all cash positions to gilt funds, to further increase duration of the portfolio
– Reduced allocation to Gilts and moved to Ultra Short term Funds to create liquidity in the portfolio
May 23, 2014 – Switched allocation from IT Sector Funds and Nifty ETFs to Infrastructure Funds and Small cap Fundsrespectively, based on the note released –
– Switched allocation from Cash to Gilt funds, to increase the duration of the portfolio based on thenote
– Switched allocation from Small & Midcap funds to Large Cap funds, on the back of relativelyhigher valuations of midcaps as compared to large cap.
– On the fundamental front, demand side continues to be supportive for gold. We have therebyrevised out short term outlook on gold from underweight to neutral stance.
– Reduced Gilt exposure and allocated the proceeds towards Gold, on the back of better risk rewardscenario for gold & bond yields coming below it long term average
December 15, 2012
February 14, 2013
April 1, 2013
May 17, 2013
July 29, 2013
September 20, 2013
September 27, 2013
September 30, 2013
November 20, 2013
November 25, 2013
December 3, 2013
May 5, 2014
September 6, 2014
September 28, 2015
September 24, 2015
February 29 , 2016
“Interest”ing TimesAhead”
“Yields came tumbling after…to plummet further”
“Ride the Tide”
“The Gilt Edge”
“Information Technology – In a position on strength”
“The Bear-nanke Hug – Underweight Equities”
“Time to Rebuild Duration – A Déjà vu”
“Equity Markets – An Update”
“Good Times Ahead!”
“Way Ahead for Duration”.
�
�
�
�
�
�
�
�
�
�
�
�
�
�
�
�
�
�
�
April 22, 2016 – Switched allocation from Duration strategies to Accrual strategies, based on the note released –
March 31, 2018 – In Fixed Income, we reiterate our stance on accrual strategy, however, given the current valuations,tactical allocation to dynamic bond funds can be considered by investors who can withstand interest rate volatility
March 31, 2018 – Increase allocation towards value oriented multi-cap strategies
“Time toShift Gears”
As on April 30, 2018
Committee Members
Mr.
Mr. Vijay Goel – Private Wealth Management
Mr. Ashish Shanker – Head, Investment Advisory
Mr. Kishore Narne – Head, Commodities & Currency
Mr. Nikhil Gupta, Economist, MOSL
Mr. Pradeep Ashok Kumar – Vice President,
Gautam Duggad – Head of Research, Institutional Equities, MOSL
Managing Director & CEO,
Investment Advisory
Products & Advisory Team, Private Wealth Management
Mr. A Balasubramanian, CEO, Aditya Birla Sun Life AMC Ltd.
External Invitee

MAY 2018 | ISSUE 65 9
Alpha Strategist | “Crossroads”
Model Portfolios
Note:
Portfolio inception date: October 01, 2012
All ratios calculated for 3 years period. Risk free rate at 6.0%
Performance as on: April 30, 2018
Key Ratios1-year rolling return Max
Drawdown
Draw Down
Period
Jensen's
AlphaInformation
Ratio
Aggressive+
Balanced
Conservative
21.5%
13.3%
9.0%
-12.2%
-4.7%
2.8%
63.2%
34.5%
17.6%
-17.5%
-8.3%
-4.0%
Aug-15 - Feb-16
Aug-15 - Feb-16
Jun-13 - Aug-13
4.1%
1.1%
-0.8%
0.8
1.0
1.4
0.6
0.5
0.4
0.5
0.3
-0.1
Min MaxBeta Sharpe
Average
Client Profile Performance Snapshot
Conservative
55.2%
5.0%
39.8%
Accrual
Gold Fund
Corporate Bond
Balanced
9.0%
12.0%
12.0%
7.0%
26.0%
10.0%
24.0%
Large Cap Funds
Mid Cap Funds
Multi Cap Funds
Balanced Funds
Accrual
Gold Fund
Corporate Bond
Aggressive+
30.0%
22.5%20.0%
27.5%
Equity PMS
Large Cap Funds
Mid Cap Funds
Multi Cap Funds
-0.40.0
0.91.4
5.7
7.3
8.2 8.5
1.4
2.1
5.9
7.58.1 8.0
1 Month 3 Months 6 Months 1 Year 3 Year 5 year Since
Inception
% R
etu
rn
Conservative Portfolio Conservative Index
2.5
-0.3
2.5
9.2 9.3
12.511.6
2.6
-0.2
3.2
10.0
8.3
9.79.2
1 Month 3 Months 6 Months 1 Year 3 Year 5 year Since
Inception
% R
etu
rn
Balanced Portfolio Balanced Index
1 Month 3 Months 6 Months 1 Year 3 Year 5 year Since
Inception
6.0
-0.1
4.2
14.1 13.5
19.717.8
6.2
-2.6
3.9
15.4
9.5
12.6 12.0
% R
etu
rn
Aggressive+ Portfolio Aggressive+ Index

MAY 2018 | ISSUE 65 10
Adding objectivity to fixed income investing
Fixed Income Manager Selection Framework
Alpha Strategist | “Crossroads”
In the above graph, we have taken the Average 1 yr rolling return for 5 years for various funds across categories. The result
was that there was a significant difference between the top performer and bottom performer in almost every category,
making a case for choosing fund managers over the funds. The ability to generate enhanced returns varies from manager
to manager within the same category, thus laying emphasis on the skills of a fund manager. But one must also realize that
past performance cannot be the only criteria to judge a fund. It is almost hazardous to do so. Different market cycles
present different opportunities.
So what strategy will help investors so that their investments are relevant for the ongoing market cycle? Even in fixed
income, there are risks associated with interest rates, credit and liquidity. With the numerous funds at one's disposal,
choosing the correct one can be quite a challenge. Before we venture into the framework of choosing a manager let us
take a sneak-peak into the two kinds of strategies adopted for “enhancing” returns – Credit and Duration.
The credit opportunities style looks for companies that have the ability to repay and mitigates risks such as default and
liquidity. This benefits investors via higher coupons, thus enhancing their overall return. However, the duration style
plays on interest rate cycles and requires an intricate macroeconomic understanding as the manager must get the
interest rate cycles right. Both these strategies play out at various points of time. At a time one anticipates interest rates
to peak, duration strategies would be a preferred option as any subsequent decline in interest rates would enhance the
portfolio returns. Likewise, in a rising interest rate scenario, duration strategies would not augur well, calling for
investment in credit strategies.
The battle of objective vs. subjective decision making often makes appearance in investing. To our mind, having an
objective oriented approach gives purpose to investment which helps in avoiding any impulsive calls. Traditionally, equity
has always been viewed as an asset class for capital appreciation while fixed income is seen as an avenue for capital
preservation. Amongst the fixed income instruments, the most commonly accepted investment avenue is fixed deposits.
There is a psychological comfort that investors draw on account of the fixed return provided by such instruments.
However investors must realize that an instrument like a fixed deposit is tax inefficient. As a result, it does not even meet
the core objective preserving the purchasing power. That raises the obvious question – what kind of fixed income options
should investors seek?
If the veil of ignorance is done away with and the fixed income market is probed into, one will realize that there are
various market linked investment avenues that investors can invest in. To our mind, fixed income mutual funds are one
example of an efficient investment option that investors can avail of as they have various benefits like diversification,
professional management and tax efficiency. However, the question of prudent selection still remains unanswered.
Liq
uid
UST
Sho
rt T
erm
Cre
dit
Op
ps.
Lon
g I
nco
me
Dyn
am
ic
Bo
nd Gilt
6.6 6.77.4
9.2
7.7
6.7 6.9
8.3 8.6 9.0
9.9
8.9 9.29.88.9
9.3
10.310.8 10.8
11.912.6
Avg. 1 Yr RR of worst performing fund Category Average Avg. 1 Yr RR of best performing fund

MAY 2018 | ISSUE 65 11
Alpha Strategist | “Crossroads”
Just like a fast bowler cannot bowl spin and vice versa, a manager cannot mimic both approaches simultaneously. A
manager must be clear on his stance and having experienced two to three market cycles will be of huge significance.
To our mind, good performance is an outcome of a robust process. Hence, one needs to be cognizant of the latter at the
time of evaluation. This thought process has given birth to our . By evaluating the
pilot rather than just the plane, each would enable us to unmask the different hues of investment process from the
performance which is the ultimate outcome.
This framework implies a paradigm shift from the industry norm of ranking funds only on the basis of past performance.
This qualitative and quantitative process would enable us to construct for our clients. In line with
our philosophy of providing better insights to you, we hope you find the same informative.
“4C framework of manager selection”
“C”
“winning portfolios”

MAY 2018 | ISSUE 65 12
Alpha Strategist | “Crossroads”
Succession of a Female - Hindu
Son
Married
Individual
Female
Daughter
Husband
Children of deceasedSon
Children of deceased
daughter
Intestate Succession in case of death of a Female Hindu
On the death of a female Hindu, in case she has a Will, her assets are distributed amongst the persons as specified in the
will. However, in case a Female Hindu dies without leaving a will (i.e. she dies intestate), the assets would be distributed
according to the Hindu Succession Act. The succession of Hindu, Jain, Buddhist and Sikh is governed by the Hindu
Succession Act.
After the amendment of the Act in 2005, females have been given equal rights of inheritance as that of a male. However
the distribution of her property is different from a male.
Any property whether movable or immovable earned or inherited by her will be considered, either before, during or
after the marriage, even before the commencement of the Act is her assets.
Below is the pictorial overview on the intestate succession in case of demise of a Female Hindu:
Conclusion:
By writing a Will, one can bypass the above succession law and bequeath the assets as per her Wish.
Mother
Unmarried
Father
In case of a widow do not have anychildren the assets shall devolve upon
upon the heirs of the husband i.e.(Mother in law etc.)�
�
�
�
If there are no heirs of the husbandthen upon her mother and father
If there are no mother and father,then upon the heirs of her father
If there are no heirs of her fatherthen upon the heirs of her mother

MAY 2018 | ISSUE 65 13
Alpha Strategist | “Crossroads”
Power of Asset Allocation
Historically equity has been viewed as a wealth creating asset class and debt and gold being inflation beating asset class.
That said, little do people know that both debt and gold have rarely beaten inflation. At the same time while equity offers
superior returns in the long run, it also exposes one to certain volatility inherent to the nature of the asset class. Asset
allocation enables you to maximize your return potential while reduce your risk. Industry research has shown that 92% of
the returns are attributable to the correct asset allocation.
We thought it to be prudent to substantiate it with some data. The table below highlights calendar year performance of
different asset classes such as equity, debt, gold and cash. As you would observe no asset class has been a consistent
winner.
Having said that, it is very clear that if one were to do a very simple asset allocation of equal investing in different asset
classes, there would have been only 1 instance in last 15 years where the strategy would have given negative returns. This
includes period of global financial crisis where most of the markets were battered. Thus there is a clear merit in
diversifying assets across different asset classes as it reduces dependency on single asset classes and protect from
market turbulence.
Performance as on: April 30, 2018
Equity is represented by Nifty 50
Debt is represented by CRISIL Short term bond Index,
Cash is represented by CRISIL
Liquid fund Index and Gold – Bloomberg, MOWM
Average: Equal allocation to each asset class in the calendar year
In our mind while return certainly matters, but so does risk. Based on your risk taking appetite, one should decide on how
much money needs to be allocated to different asset classes.There are multiple factors that define your risk tolerance
level such as investment horizon, liquidity needs, investment goals and so on. An investor with high risk tolerance may be
willing to accept greater volatility in pursuit to generate higher potential returns and may allocate higher percentage of
the portfolio towards higher risk assets. On the other hand, an investor with low risk tolerance may have to forego higher
potential returns for a steadier and less volatile portfolio.
11.3%
CAGREquity
16.1%
Gold
11.4%
Debt
6.8%
Cash
6.8%
CAGR of underlying asset classes
Multi-asset approach tends to deliver smoother returns than what is achieved by investing in just a single asset class
2003
Equity
71.9%
2004 2005 2006 2007 2008 2009 2010 2012 2013 20142011 2015 2016 2017
Average
Equity
10.7%
Gold
24.1%
Gold
31.9%
Equity
27.7%
Cash
9.0%
Equity
31.4%
Debt
8.7%
Gold
12.0%
Equity
28.6%
Equity
75.8%
Equity
36.3%
Equity
39.8%
Equity
54.8%
Gold
30.1%
Gold
13.5%
Cash
4.0%
Gold
22.3%
Gold
20.8%
Gold
16.7%
Debt
9.5%
Gold
19.7%
Equity
17.9%
Cash
8.2%
Gold
10.2%
Debt
8.3%
Debt
10.5%
Cash
8.2%
Debt
9.8%
Cash
6.6%
23.8%
Cash
4.6%
Debt
5.4%
Gold
5.9%
Debt
2.7%
Cash
4.6%
Cash
6.0%
Debt
8.0%
Cash
8.4%
Debt
6.6%
Cash
5.1%
Debt
7.9%
Debt
9.1%
Cash
7.5%
Equity
-4.1%
Cash
9.2%
Equity
6.8%
11.6%8.1%1.7%12.9%1.2%13.9%5.8%13.0%26.7%-0.9%21.7%18.0%17.0%4.5%
Debt
%5.4
Gold
0.5%
Debt
4.5%
Debt
5.5%
Cash
7.5%
Equity
-51.8%
Cash
4.9%
Debt
4.7%
Equity
-24.6%
Equity
3.0%
Gold
-6.2%
Gold
0.6%
Gold
-19.2%
Cash
8.5%
2.6%
2018*
Gold
5.4%
Debt
0.7%
Cash
2.4%
Equity
2.0%

MAY 2018 | ISSUE 65 14
Alpha Strategist | “Crossroads”
By selecting a portfolio with equity and fixed income, the potential gains that the equity component can give are much
higher and the associated risk can be well taken care of by the fixed investment portfolio. Thus a portfolio invested across
asset classes has the ability to generate superior risk adjusted return.
To prove our hypothesis, we carried out back-testing with just two asset classes, equity and fixed income. We created
three model portfolios with 75:25, 50:50 and 25:75 exposures to fixed income and equity respectively. Over 5-year
holding period, none of these portfolio generated negative returns. Also, it is worth highlighting that over 3-year holding
period, portfolio which has high exposure to equity (75%) gave positive returns 98.7% of time over the last 12 years.
• Multi-asset class strategies smoothen the ride
• Protects on the downside during extreme falls witnessed from a single asset class
• Makes returns more predictable
The above illustration has been carried out for indices which are passively managed. Our experience has been that
actively managed strategies have been able to generate significant alpha. Thereby, we believe the upside benefit is
higher in case of actively managed strategies. Consequently, the same can be depicted from the below table.
Fixed Income 75%; Equity: 25% Fixed Income 50%; Equity: 50% Fixed Income 25%; Equity: 75%
1 year 3 year 5 year 1 year 3 year 5 year 1 year 3 year 5 year
Period of analysis: March 2002 to April 2018
Equity is represented by Nifty 50 & Debt is represented by CRISIL Short term bond Index
10.4%
28.1%
-8.2%
180
9 (5.%)
41 (22.8%)
10.0%
21.7%
5.2%
158
0.0%
13 (8.2%)
9.8%
20.3%
5.6%
132
0.0%
3 (2.3%)
13.6%
48.9%
-22.7%
180
19 (10.6%)
43 (23.9%)
12.3%
35.2%
2.4%
158
0.0%
27 (17.1%)
11.6%
30.2%
3.6%
132
0.0%
14 (10.6%)
16.7%
70.6%
-37.4%
180
30 (16.7%)
45 (25.0%)
14.3%
46.4%
-0.6%
158
2 (1.3%)
32 (20.3%)
13.2%
37.8%
1.4%
132
0.0%
18 (13.6%)
For indices:
Fixed Income 75%; Equity: 25% Fixed Income 50%; Equity: 50% Fixed Income 25%; Equity: 75%
1 year 3 year 5 year 1 year 3 year 5 year 1 year 3 year 5 year
13.7%
38.3%
-6.2%
179
7 (3.9%)
26 (14.5%)
13.5%
33.9%
6.0%
157
0.0%
0 (0.0%)
13.0%
30.6%
6.9%
131
0.0%
0 (0.0%)
19.8%
70.2%
-21.1%
179
17 (9.5%)
34 (19.%)
18.2%
54.1%
2.7%
157
0.0%
9 (5.7%)
16.8%
44.3%
6.0%
131
0.0%
0 (0.0%)
25.9%
102.2%
-36.2%
179
25 (14.%)
40 (22.3%)
22.3%
70.0%
-1.0%
157
2 (1.3%)
14 (8.9%)
20.0%
54.1%
5.2%
131
0.0%
2 (1.5%)
For actively managed strategies:
For active managers, Franklin India Prima Plus, HDFC Equity Fund and Sundaram Select Midcap have been considered for Equity and Aditya Birla SL Short Term
and SBI Magnum InstaCash Cash has been considered for Debt
Portfolio
Holding Period
Average
Max
Min
Number of observation
Number of times below 0%
Number of times below 6%
Portfolio
Holding Period
Average
Max
Min
Number of observation
Number of times below 0%
Number of times below 6%

MAY 2018 | ISSUE 65 15
Hind-sight Investing
We are well aware of the disclaimer “past performance is no guarantee of future results”. Despite this the most common
method of investing in mutual funds remains by looking at the past performance. It’s quite intuitive to assume that
something that was a good investment in the recent past is still a good investment.
However, it’s not that simple. Our study shows that there is a limited probability of getting investment decisions right
which are solely based on historical data. Let us illustrate this with some examples of the recent past.
The below table comprises of last 17 years of data which to our mind is comprehensive. Funds were ranked based solely
on performance for pre-defined time buckets. As you can see, in the 1 year bucket 36% of the funds continued to be top
performers and 64% could not retain their position. Similarly, in the 3 year bucket 68% of the funds could not retain their
position.
If we translate the above numbers in terms of probability, your chance of selecting a top performing fund basis past
performance is lesser than winning a coin toss!
Just like we don't drive a car looking at the rear view mirror, investment decisions too should not be based on mere past
performance. In fact to our mind one needs to go beyond the norm of return based analysis to arrive at investment
decisions.
As the age old adage goes “bet on the jockey, not the horse”, the same holds true for investment wherein you lay your bet
on the manager and not the fund. So how does one go about it? In line with our philosophy of empowering you, we take
this opportunity to provide you an understanding of our “manager selection methodology”.
(Methodology notes: Date range period 2000-2017, calendar year returns, all open-ended equity schemes, AUM cut off
250cr as on 31st Dec 2017)
Review period: 2000 - 2017
Investments in top performing funds based on 1 – 3 yr track record
Top funds basis
1 yr performance
Rank after1 year
Q1 - 36%
Q2 - 24%
Q3 - 20%
Q4 – 20%
Rank after3 year
Q1 - 33% Q1 - 32%
Top funds basis
1 yr performance
Top funds basis
3 yr performance
Q2 - 34%
Q3 - 16%
Q4 – 17%
Q2 - 33%
Q3 - 18%
Q4 – 17%
Rank after3 year
The top 25% of the funds on basis of performance are assigned Q1, next 25% are assigned Q2 and so on.
Alpha Strategist | “Crossroads”
MAY 2018 | ISSUE 65 16
Decoding Investment Style
Past performance is just the tip of the iceberg - A consistent and a transparent portfolio management approach
contributes to the sustainable long term returns
As investors and advisors, we tend to get swayed by the recent past performance while making our investment
decisions and overlook the underlying philosophy and process which would contribute towards the future returns.
Moreover, history suggests that the process for selecting funds only on the basis of past performance may not be a full
proof procedure in the future. Thus, we believe that in generating sustainable long term performance, skill plays a
major role rather than luck and to assess the skills of a fund manager, it becomes pertinent to understand the
consistency in their fund management approach.
Like any sportsman who demonstrates their styles in different terrains, we are of the view that every manager has a
different style and approach for stock picking and portfolio construction. Through our detailed due diligence process,
we aim to understand the capabilities, consistency and experience of the Fund manager and substantiate their
investment style with their past and current investments.
Through our analysis and research, we have devised a which basically states that an investment style
oscillates between two extremes of investing i.e. and while the other blended
styles of investment like and lies in between the two extremes. When a manager sticks to
picking stocks which are out of favor or below their average valuations and expect these stocks to revert back, then
these managers are demonstrating a mean reversion investment style. For example, ICICI Fund Managers are known for
their value style of investing. On the other hand, if the manager foresees a sustainable growth in the earnings of a
company and is ready to pay a premium for the stock, then the fund manager belongs to growth style of investing. For
example, Motilal Oswal Fund Managers believe in ‘QGLP’ and exhibit earnings momentum investment style.
In an investment world where more choices may lead to more confusion, it is important to understand the style of the
Fund Manager rather than the standalone performance of the funds.
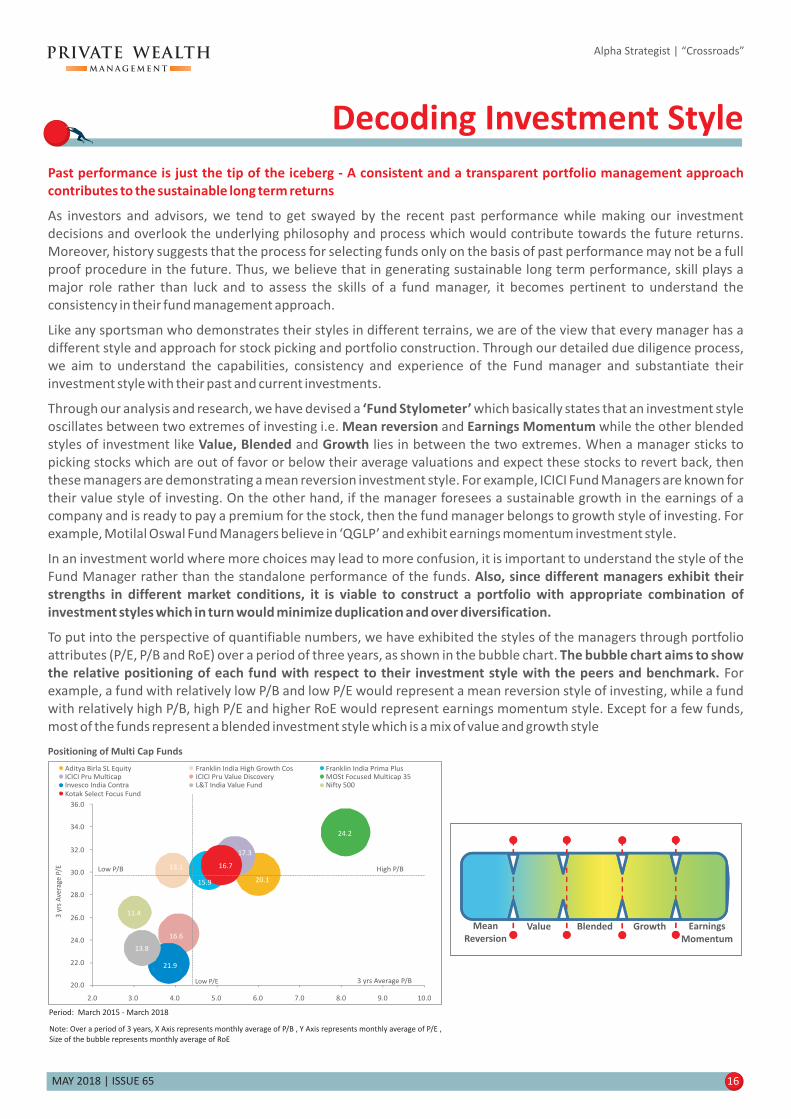
To put into the perspective of quantifiable numbers, we have exhibited the styles of the managers through portfolio
attributes (P/E, P/B and RoE) over a period of three years, as shown in the bubble chart.
For
example, a fund with relatively low P/B and low P/E would represent a mean reversion style of investing, while a fund
with relatively high P/B, high P/E and higher RoE would represent earnings momentum style. Except for a few funds,
most of the funds represent a blended investment style which is a mix of value and growth style
‘Fund Stylometer’
Mean reversion Earnings Momentum
Value, Blended Growth
Also, since different managers exhibit their
strengths in different market conditions, it is viable to construct a portfolio with appropriate combination of
investment styles which in turn would minimize duplication and over diversification.
The bubble chart aims to show
the relative positioning of each fund with respect to their investment style with the peers and benchmark.
Alpha Strategist | “Crossroads”
Mean
Reversion
Value Blended Growth Earnings
Momentum
Note: Over a period of 3 years, X Axis represents monthly average of P/B , Y Axis represents monthly average of P/E ,
Size of the bubble represents monthly average of RoE
Positioning of Multi Cap Funds
Period: March 2015 - March 2018
20.1
13.1
15.9
17.3
16.6
24.2
21.9
13.8
11.4
16.7
20.0
22.0
24.0
26.0
28.0
30.0
32.0
34.0
36.0
2.0 3.0 4.0 5.0 6.0 7.0 8.0 9.0 10.0
3 yrs Average P/B
Aditya Birla SL Equity Franklin India High Growth Cos Franklin India Prima PlusICICI Pru Multicap ICICI Pru Value Discovery MOSt Focused Multicap 35Invesco India Contra L&T India Value Fund Nifty 500
Kotak Select Focus Fund
High P/B
Low P/E
Low P/B
3 y
rs A
vera
ge P
/E

MAY 2018 | ISSUE 65 17
With markets making historical highs there is a lot of time and ink getting consumed giving views on valuations. One of
the views being that valuations are above long term average and the parameter used to arrive at this view is price
earning multiple. To our mind formulating views solely based on this parameter has certain pitfall. For instance
historically higher price earning phases have been backed by high growth momentum which in today’s scenario is
different. Earnings seem to be the missing ingredient over the past couple of years. Thus there is a need to use multiple
parameters rather than confining oneself to a single variable in order to make investment decisions more full proof. In
our view one needs to take into account risk reward in order to arrive at margin of safety which is critical and forms the
basis for any investment decision.
We are cognizant of the fact that investments are tuned to meet your objectives and thus calling for a suitable asset mix
basis your investment objective. In addition we believe that investors should have a disciplined investment approach
with respect to asset allocation and should not get swayed by market sentiments to avoid accidents. Deviation from the
strategic asset mix should be under circumstances having favorable risk reward. Ideally a prudent investment decision
revolves around the principle of increasing equity exposure when markets are cheap and allocate less when markets are
expensive. However the challenge always remains to accurately estimate when the market is cheap or expensive. In
order to arrive at the decision of preferring equity over debt or vice versa, we believe earning yield to bond yield is an
excellent parameter to consider. This ratio indicates the perceived risk differential between equity and bonds.
Historically whenever earnings yield and bond yield spreads are above 0.8, equities are considered to be undervalued.
For instance at the time of demonetization which coincided with U.S election, one witnessed a sharp fall in yields
making investment in equity compelling on the back of relative valuations. Likewise, any number below .6 suggests
merit in having the portfolio tinted towards debt.
The earning yield to bond yield parameter along with our in-house indicator of market valuations named as MOVI – The
Motilal Oswal Valuation Index enables us to arrive at a well-researched and thought through asset class outlook. So
what is MOVI and what are the variables considered? MOVI is basically an index which is calculated based on the Price to
Earnings (PE), Price to Book Value (PB) and Dividend Yield (DY) on the components of Nifty 50. By means of an algorithm
the weighted average PE, PB and DY of the components of Nifty 50, one arrives at index. A higher level on the MOVI
means markets are expensive and hence one should reduce equity exposure while a lower level on the MOVI means
markets are attractive and hence one should overweight equity exposure.
With the above mentioned input variables we have crafted a unique model coined as temperature gauge which help in
making investment choices across asset classes. The objective of the strategy is to reduce volatility and keep investors
shielded from the sharp falls that are sometimes seen after sustained rise in equity prices.
So how has this fared in the past?
Temperature Gauge
Alpha Strategist | “Crossroads”

MAY 2018 | ISSUE 65 18
Alpha Strategist | “Crossroads”
In the above graph the earning yield is plotted against the x axis and MOVI on the Y axis. The data considered is
represented from the bottom of the market in 2002 till date which basically encompasses two full market cycles of
boom and bust. It is quite evident from the above graph that as the market tends to move towards top right corner,
there are several instances of negative returns and a cautious approach is recommended. However, as the market
moves towards bottom left corner, there are more instances of 18%+ returns from a 3-year forward perspective and
recommend investors to invest aggressively.
This qualitative and quantitative process would enable us to construct “winning portfolios” for our clients. In line with
our philosophy of providing better insights to you, we hope you find the same informative.
3-yr forward NiftyActive
Manager
Average
Max
Min
% times >0%
10%
46%
-9%
97%
19%
54%
-8%
97%
<0%
0-10%
10-18%
18%+
Current
MOVI
40
60
80
100
120
140
160
0.81.01.21.41.61.8
1.53 1.2 0.62 0.54
68%
95%
Fair Value ZoneAttractive Zone
Expensive
Zone
52% of the
observation
lies in this area
0.6
Temperature Gauge – Our internal market thermometer
0.4
EY-BY 0.4-
0.6-
0.8-
1.0-
1.2-
1.4-
1.6-
-
-
-
-
-
-
140
120
100
80
60
40
EY-BY
0.54
MOVI
115.6
Period of analysis: Jan 2002 to April 2018

MOTILAL OSWAL PRIVATE WEALTH MANAGEMENT (MOPWM) - INVESTMENT GRID (May 2018)
Asset Class Holding Period Theme Strategy Managed Solutions
1 Year
< 3 Years
Equity
Fixed Income
Alternatives
Valuations (TTM) trading slightly above its long term average
Revival in rural economy & consumption, deep value,
cyclical recovery
Growth through diversification
Low duration, taxation benefit
Play on short term rates coming off, Capital Preservation
(low credit risk)
Large caps, Dynamic Equity Funds
Multi-cap
Diversified Strategy
Arbitrage/Ultra Short Term Funds/ Low
Duration Funds Long-short funds
High Quality Shot Term Funds,
Structured Products
> 3 Years Coupon + Capital Appreciation Credit Opportunties Funds
3 Years & above
Accommodative central bank policies and reduced likelihood of
US rate hikeSovereign Gold Bonds, Gold ETFs> 3 Years --
M0 NTDOP PMS, ASK Indian Entrepreneur Portfolio, ASK Select
Portfolio, Renaissance All Cap, Franklin India High Growth Cos, Franklin
India Prima Plus, MOSt Focused Multicap 35, M0 NTDOP PMS, Aditya
Birla Equity
MAY 2018 | ISSUE 65 19
Investment GridAlpha Strategist | “Crossroads”
MO Value PMS, Motilal Oswal F25, Aditya Birla SL Top 100, Aditya Birla
SL Focused Eq, ICICI Pru BlueChip Eq, SBI Bluechip , Motilal Oswal
Dynamic, Avendus Enhanced Return
IDFC Arbitrage, Kotak Equity Arbitrage , Invesco India Arbitrage, ICICI
Pru Equity Arbitrage, ABSL Savings, Franklin India Ultra Short, Franklin
Low Duration, ICICI Pru Savings, UTI Treasury Advantage
BNP Paribas Corporate Bond, IDFC Corprate Bond, Aditya Birla
Corporate Bond, IDFC SSIF-ST, ICICI Pru ST Plan, 1-3 yr Fixed Income
Structured Products, FMPs
IDFC Credit Opps, HDFC Credit Risk Bond, ICICI Pru Credit Risk,Reliance
Credit Risk, Franklin STIP, BOI Axa Credit Risk, ABSL Medium Term, LnT
Resurgent India Bond, Reliance Classic Bond, Franklin India Income Opp
Renaissance India Next, Ashmore India Opportunities Fund, Invesco
RISE & DAWN Portfolio, DHFL Pramerica Deep Value PMS, Invesco India
Contra Fund, L&T India Value Fund, ICICI Pru Value Discovery
10-12 YearsHigh equity upside based Alternative
Investment FundsIndia Business Excellence Fund III
Investment in mid-market enterprises that are typically market
leaders which are generally managed by first-generation
entrepreneurs specially from consumer, financial services,
pharma & niche manufacturing sectors
5 - 7 yearsInvesting in early stage mezzanine/
structured equity transactions with
reputed developers from top 6 citiesIndia Realty Excellence Fund IV
Affordable Housing space

MAY 2018 | ISSUE 65 20
Our Recommendations
Alpha Strategist | “Crossroads”
Portfolio Management Services (PMS)
* PMS performance are net of all expenses & fees
Absolute
1 Year 3 Years 5 Years
MOPWM
RatingScheme Name
CAGRStd Dev Beta Alpha
Info.
Ratio
Avg 1 yr
rolling
return
Mααα 12.6
14.8
18.8
14.0
10.5
28.9
3.5
Mααα
Mααα
9.4
19.6
15.4
15.4
10.8
—
19.0
PMS Strategies*
16.6
10.8
6.6
12.1
8.7
24.3
12.7
14.6
8.2
14.1
15.3
15.5
19.1
14.6
9.3
11.5
9.2
17.4
17.9
15.9
12.2
21.3
13.5
12.0
—
21.1
22.1
19.5
21.5
24.4
26.5
22.6
18.8
22.4
19.7
15.4
18.6
14.6
10.1
11.7
9.6
17.3
17.9
15.9
12.4
20.6
—
12.2
14.1
13.6
15.6
12.8
13.0
14.9
15.8
14.6
12.9
15.5
—
13.9
0.90
0.95
1.04
0.90
0.89
1.04
1.07
0.99
0.85
1.03
—
1.00
7.0
4.9
-2.3
0.1
-1.9
4.8
5.3
3.7
1.1
8.2
—
—
1.0
1.0
-0.4
-0.2
-0.6
1.3
1.0
0.8
0.0
1.4
—
—
Mααα
Mααα
Mαα
Mαα
Mαα
2.8
14.1
16.2
33.6
12.1
13.0
15.8
11.1
15.8
12.2
Mααα
Mαα
Mαα
Mααα
12.2
18.2
18.6
23.9
15.8
18.4
18.1
19.7
17.1
16.9
—
27.7
27.8
25.8
26.4
27.7
31.0
34.2
27.3
21.0
12.6
17.9
18.3
23.0
15.7
18.4
17.7
19.7
—
16.7
14.5
15.2
15.4
16.7
13.7
16.7
14.3
17.6
—
16.2
0.77
0.89
0.92
0.95
0.80
0.96
0.82
0.98
—
1.00
-1.7
2.4
2.5
6.8
1.1
2.1
3.0
3.2
—
—
-0.5
0.2
0.4
1.0
-0.2
0.3
0.2
0.4
—
—
Mααα
Absolute
1 Year 3 Years 5 Years
MOPWM
RatingScheme Name
CAGRStd Dev Beta Alpha
Avg 1 yr
rolling
return
AUM
(in Rs. Cr.)Info.
Ratio
Mααα 14.3
15.7
10.5
11.3
11.8
12.5
15.4
Mααα
Mαα
Mαα
Large Cap Funds
12.6
12.3
11.2
11.8
11.6
10.5
9.5
18.7
17.1
17.8
—
17.3
15.6
12.6
12.7
12.5
11.5
12.0
11.8
—
9.8
12.5
13.1
13.1
13.0
13.0
—
13.5
0.88
0.94
0.93
0.81
0.94
—
1.00
3.3
2.9
1.9
2.9
2.2
—
—
0.7
0.8
0.4
0.3
0.6
—
—
Mαα
—
—
—
10.1
11.0
9.6
12.0
10.9
12.4
Balanced Funds
Aditya Birla SL Equity Hybrid ’95 Fund
ICICI Pru Equity & Debt Fund
Franklin India Balanced Fund
HDFC Hybrid Fund
Mααα
Mααα
Mαα
Mαα
Category Average
CRISIL Balanced - Agg Index
11.7
12.6
9.5
12.5
10.1
11.2
17.2
18.2
16.2
19.5
15.7
13.5
11.7
12.4
9.5
12.3
—
11.1
10.2
10.3
8.9
10.4
—
9.0
1.10
1.09
0.96
1.14
—
1.00
0.1
0.9
-1.3
0.6
—
—
0.2
0.4
-0.7
0.5
—
—
14,662
28,806
2,087
21,779
—
—
—
—
Mααα
Mα
—
Mααα
Mααα
Mααα
18.0
31.0
27.0
27.4
—
—
22.4
9.9
19.4
15.3
15.3
11.2
—
19.3
13.5
17.8
13.4
13.4
13.7
—
18.1
0.89
0.94
0.75
0.77
0.92
—
0.92
0.5
3.4
4.7
5.8
-0.5
—
3.4
0.0
0.3
0.3
0.5
-0.2
—
0.2Mααα
AUM
(in Rs. Cr.)
Mααα
Mαα
Mααα
Mαα
Arbitrage Funds
Mααα
Mαα
—
—
Mααα
—
MOSt Value Strategy
MOST NTDOP Strategy
ASK IEP Strategy
ASK SELECT Strategy
DHFL DV
RISE Strategy
MOST IOP Strategy
Equity Mutual Funds
2,767
8,012
6,361
3,013
598
447
4,355
15,236
17,142
4,212
1,003
20,451
—
—
Category Average
NIFTY 50
SBI BlueChip Fund
ICICI Pru BlueChip Equity Fund
Aditya Birla SL Focused Equity Fund
Motilal Oswal Focused 25 Fund
Aditya Birla SL Frontline Equity Fund
12,213
17,853
7,602
11,848
16,652
1,450
8,073
9,251
2,856
2,606
—
—
Multi Cap Funds
Motilal Oswal Multicap 35 Fund
Kotak Select Focus Fund
Franklin India Focused Equity
Franklin India Prima Plus Fund
ICICI Pru Value Discovery Fund
Invesco India Contra Fund
L&T India Value Fund
Aditya Birla SL Equity Fund
ICICI Pru Multicap Fund
Sundaram Rural & Consumption Fund
Category Average
NIFTY 500
1,279
3,005
21,357
3,647
6,686
6,551
7,517
6,248
—
—
Small & Mid Cap Funds
Motilal Oswal Midcap 30 Fund
Kotak Emerging Opportunites Fund
HDFC Mid-Cap Opportunities Fund
HDFC Small Cap Fund
Franklin India Prima Fund
Sundaram Midcap Fund
Franklin India Smaller Cos Fund
DSPBR Small Cap Fund
Category Average
Nifty Free Float Midcap 100
IDFC Arbitrage Fund
ICICI Pru Equity-Arbitrage Fund
Kotak Equity Arbitrage Scheme
Invesco India Arbitrage Fund
Category Average
Crisil Liquid Fund Index
Mαα
Mααα
Mααα
-3.1
-2.7
-2.7
-2.5—
—
-0.9
-0.9
-0.8
-0.8—
—
2,288
8,686
11,257
347—
—
5.8
5.86.1
5.95.86.9
6.1
6.3
6.4
6.26.37.3
7.2
7.3
7.3
7.07.18.1
6.0
6.1
6.2
6.1—
—
0.4
0.4
0.4
0.5—
—
0.79
0.97
0.92
0.84—
—
MAY 2018 | ISSUE 65 21
Alpha Strategist | “Crossroads”
IDFC Coporate Bond Fund
BNP Paribas Corp Bond Fund
IDFC SSIF-ST Fund
Aditya Birla SL Corporate Bond
Franklin India IBA-A*
Crisil Composite Bond Fund Index
4.5
1.8
4.0
4.7
5.4
0.8
3.2
2.5
3.0
3.7
4.5
-1.2
5.8
5.5
5.3
6.0
6.8
3.7
—
7.6
7.1
8.0
7.9
7.6
—
7.9
7.8
8.6
8.6
7.9
1.7
3.1
1.6
1.6
2.0
—
8.1
8.3
8.1
8.2
9.1
—
96.3
90.4
96.4
79.2
14.4
—
—
7.7
—
16.4
80.4
—
—
—
—
—
0.8
—
3.7
1.9
3.6
4.5
4.4
—
11,456
91
4,344
17,330
885
—
Accrual Funds - High Quality
M
M
M
M
M
M
M
ααα
ααα
αα
ααα
ααα
αα
αα
M
M
M
ααα
ααα
αα
Category Average
Crisil Composite Bond Fund Index
6.3
4.8
7.0
4.5
6.2
4.2
2.3
4.6
5.5
2.8
4.7
0.8
5.0
3.9
6.8
3.2
5.3
3.4
1.4
3.6
4.1
2.0
3.9
-1.2
7.7
6.7
8.3
5.8
7.6
5.9
4.9
5.5
6.4
5.5
6.3
3.7
8.2
8.5
9.7
—
8.3
8.0
8.1
8.1
7.9
8.2
8.3
7.6
9.1
9.5
—
—
9.0
8.6
—
8.5
8.4
—
8.8
7.9
9,769
11,536
1,495
11,456
3,466
10,752
2,495
5,205
10,409
8,131
—
—
Credit Opportunities Fund
Category Average
Dynamic Bond Fund
Crisil Composite Bond Fund Index
7,477
1,435
1,970
3,160
—
—
M
M
M
M
ααα
ααα
αα
αα
0.1
4.9
0.9
-0.1
1.1
0.8
2.6
4.0
3.0
1.6
3.4
3.7
-3.5
-0.3
-1.7
-2.8
-1.0
-1.2
6.5
8.1
7.4
6.4
6.5
7.6
8.1
10.6
7.2
7.4
7.3
7.9
48.5
80.1
92.3
98.0
—
—
43.5
12.2
7.6
—
—
—
2.0
—
—
—
—
—
6.0
7.8
0.2
2.0
—
—
Franklin India ST Income Plan *
Aditya Birla SL Medium Term Fund
BOI AXA Credit Risk Fund
IDFC Corp Bond Fund
Franklin India Income Opportunities Fund
Reliance Credit Risk Fund
L&T Resurgent India Corp Bond Fund
HDFC Credit Risk Bond Fund
ICICI Pru Credit Risk Fund
Reliance Classic Bond Fund
Aditya Birla SL Dynamic Bond Fund
UTI Dynamic Bond Fund
SBI Dynamic Bond
IDFC Dynamic Bond Fund
—
—
—
—
Category Average
Ultra Short Term
Crisil Liquid Fund Index
21,053
19,753
5,421
12,880
9,845
—
—
M
M
M
M
M
ααα
ααα
ααα
αα
αα
6.6
6.9
7.5
7.9
6.4
6.4
7.3
6.7
6.9
7.8
7.9
6.6
6.5
6.9
5.7
6.0
6.3
7.1
6.0
5.6
6.9
8.0
8.2
9.0
9.0
7.9
7.5
7.3
8.6
8.7
9.3
9.4
8.9
8.1
8.1
80.4
66.5
24.6
27.1
81.6
—
—
17.5
31.2
68.6
70.2
15.7
—
—
—
—
5.0
—
—
—
—
2.1
2.3
1.9
2.7
2.7
—
—
ICICI Pru Saving Fund
Aditya Birla SL Savings Fund
Franklin India Low Duration Fund
Franklin India Ultra Short Bond Fund
UTI Treasury Advantage Fund
—
—
M
M
—
ααα
αα
M
M
M
αα
αα
αα
9.7
20.8
32.0
96.3
11.9
4.3
78.1
30.8
9.0
16.6
—
—
75.5
66.1
51.6
—
78.2
87.2
19.3
62.1
83.1
80.0
—
—
12.4
8.8
12.9
—
7.6
5.3
—
—
3.8
—
—
—
2.5
4.2
3.5
3.7
2.2
3.3
2.6
5.7
4.1
3.4
—
—
1.9
1.8
1.5
1.7
1.8
1.9
2.8
1.5
1.7
2.5
—
—
10.1
9.9
11.3
8.1
9.8
9.8
8.7
8.8
9.8
9.2
—
—
3.5
2.2
1.9
3.1
—
—
8.9
8.4
7.1
8.0
—
—
0.9
0.7
1.3
0.7
0.7
—
—
8.0
8.0
8.8
8.9
8.0
—
—
Fixed Income Mutual Funds
3 Month 6 Month 1 Year 3 Years 5 YearsMod Dur
Gross
YTM(%)
Sov,
Equivalent
AAA & AA+ &
BelowUnratedScheme Name
MOPWMRating
Simple Annualised CAGRCall & Cash
AUM
(in RS Cr.)
M
M
M
ααα
αα
αα
3.9
4.4
3.7
4.4
5.1
2.7
3.4
2.6
3.4
3.5
5.6
5.5
5.4
5.6
5.5
7.7
7.4
7.8
7.3
7.6
8.8
7.8
8.2
7.8
8.3
—
—
—
—
—
5.0
2.1
2.9
—
—
5,010
5,709
9,123
—
—
Short Term Income
Aditya Birla SL ST Opportunities Fund
Axis Short Term Fund
ICICI Pru Short Term Plan
Category Average
Crisil Short Term Bond Fund Index
60.7
89.6
91.1
—
—
34.3
8.3
6.0
—
—
—
—
1.8
1.5
1.7
—
—
8.6
8.1
8.1
—
—
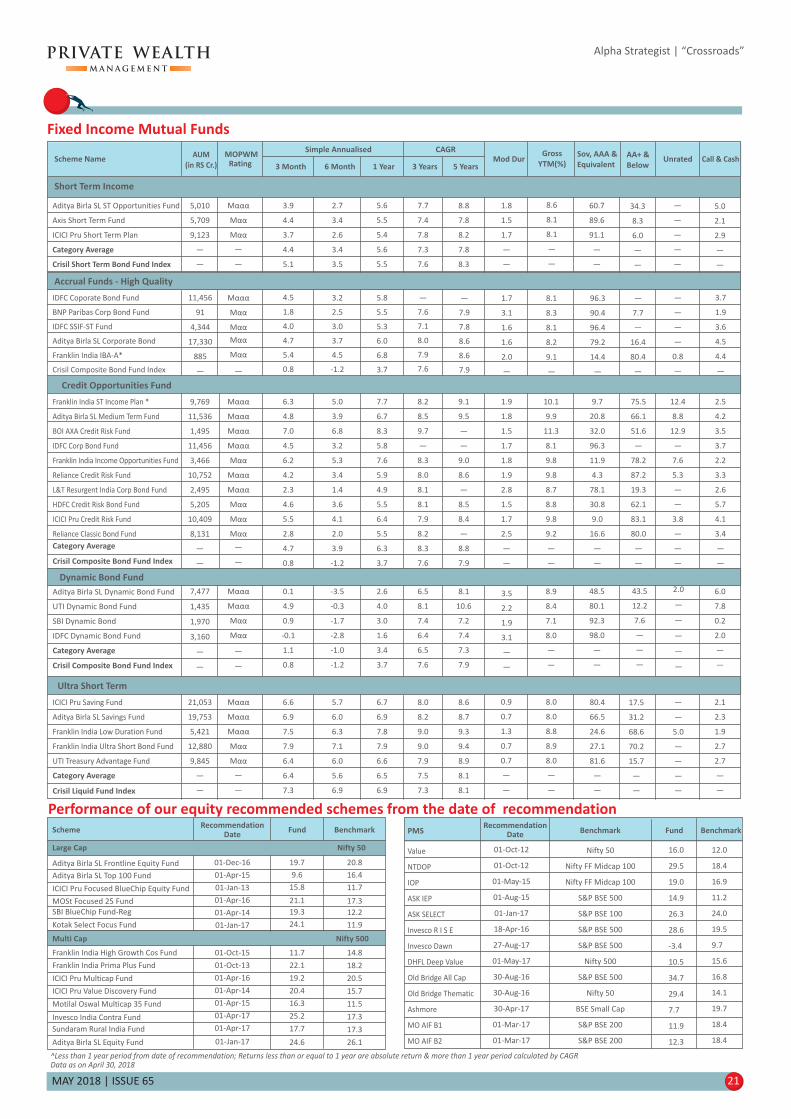
^Less than 1 year period from date of recommendation; Returns less than or equal to 1 year are absolute return & more than 1 year period calculated by CAGRData as on April 30, 2018
Performance of our equity recommended schemes from the date of recommendation
Benchmark
Value
NTDOP
IOP
ASK IEP
ASK SELECT
Invesco R I S E
Invesco Dawn
DHFL Deep Value
Old Bridge All Cap
Old Bridge Thematic
Ashmore
MO AIF B1
MO AIF B2
FundBenchmark
12.0
18.4
16.9
11.2
24.0
19.5
9.7
15.6
16.8
14.1
19.7
18.4
18.4
01-Oct-12
01-Oct-12
01-May-15
01-Aug-15
01-Jan-17
18-Apr-16
27-Aug-17
01-May-17
30-Aug-16
30-Aug-16
30-Apr-17
01-Mar-17
01-Mar-17
16.0
29.5
19.0
14.9
26.3
28.6
-3.4
10.5
34.7
29.4
7.7
11.9
12.3
Nifty 50
Nifty FF Midcap 100
Nifty FF Midcap 100
S&P BSE 500
S&P BSE 100
S&P BSE 500
S&P BSE 500
Nifty 500
S&P BSE 500
Nifty 50
BSE Small Cap
S&P BSE 200
S&P BSE 200
RecommendationDatePMS
Large Cap Nifty 50
Multi Cap Nifty 500
20.8
16.4
11.7
17.3
12.2
11.9
BenchmarkScheme FundRecommendation
Date
01-Dec-16
01-Apr-15
01-Jan-13
01-Apr-16
01-Apr-14
01-Jan-17
19.7
9.6
15.8
21.1
19.3
24.1
Aditya Birla SL Frontline Equity Fund
Aditya Birla SL Top 100 Fund
ICICI Pru Focused BlueChip Equity Fund
MOSt Focused 25 Fund
SBI BlueChip Fund-Reg
Kotak Select Focus Fund
14.8
18.2
20.5
15.7
11.5
17.3
17.3
26.1
01-Oct-15
01-Oct-13
01-Apr-16
01-Apr-14
01-Apr-15
01-Apr-17
01-Apr-17
01-Jan-17
11.7
22.1
19.2
20.4
16.3
25.2
17.7
24.6
Franklin India High Growth Cos Fund
Franklin India Prima Plus Fund
ICICI Pru Multicap Fund
ICICI Pru Value Discovery Fund
Motilal Oswal Multicap 35 Fund
Invesco India Contra Fund
Sundaram Rural India Fund
Aditya Birla SL Equity Fund

This document is not valid without disclosure; refer the last page for the disclosure
MAY 2018 | ISSUE 65 22
Section II
Macro Economy...................................................................................................23
Equities...............................................................................................................29
Fixed Income.......................................................................................................34
Alternatives.........................................................................................................37
Alpha Strategist | “Crossroads”

MAY 2018 | ISSUE 65 23
Macro Economy
Alpha Strategist | “Crossroads”
US Fed’s outlook remains
positive and rate hikes
remain on course
The US Fed left rates unchanged in their recent meet but going by their outlook, rate hikes
remain on course. The recent spike in inflation means that the next hike is expected in the
central bank’s June meeting. US GDP data was released recently and it was lower than the
previous quarter. The slowdown is likely caused by the reduced pace of consumer spending
and residential fixed investment. Yet, the economy is growing at a decent pace and looks on
track for continued expansion. Also, the US is expected to receive a substantial amount of
fiscal stimulus this year through tax reform and the passing of another federal bill.
Despite the China trade spat, the Fed remains optimistic on economic growth. A full blown
trade war scenario between the US and China still looks unlikely and negotiations should
prove to be a diffuser but as long as the issue remains unsettled, uncertainty will keep a cap
on global markets. Meanwhile US treasury yields went past the 3% mark and the dollar
rallied subsequently.
US expansion remains on track despite lower GDP
GDP YoY
Inflation rate
10yr Gsec
Policy rate
2.90%
2.40%
2.94%
1.75%
2.00%
1.10%
0.05%
-0.10%
6.80%
2.10%
3.68%
4.35%
2.90%
1.60%
0.56%
0.00%
2.10%
1,6%
0.78%
0.00%
1.20%
2.50%
1.43%
0.50%
2.50%
1.30%
-0.44%
0.00%
US Japan China Germany FranceUnited
KingdomEuro Area
Major Economies - Snapshot
Emerging Economies - Snapshot
GDP YoY
Inflation rate
10yr Gsec
Policy rate
7.20%
4.28%
7.76%
6.00%
5.10%
3.41%
6.96%
4.25%
2.10%
2.68%
9.87%
6.50%
1.20%
5.04%
7.54%
7.50%
2.80%
1.60%
2.75%
1.50%
3.40%
2.60%
2.20%
2.00%
0.90%
2.40%
7.27%
7.25%
India Indonesia Brazil Mexico South Korea RussiaHong Kong
US Trade deficit with China continues to balloon
Source: U.S. Bureau of Economic Analysis
0.6
2.2
2.8
1.8
1.2
3.1 3.22.9
2.3
Q1 Q2 Q3 Q4 Q1 Q2 Q3 Q4 Q1
2016 2016 2016 2016 2017 2017 2017 2017 2018
US GDP (annualized % growth)
After expanding for twenty straight quarters, the Euro zone recorded its slowest growth in a
year and a half, causing concern for investors. A stronger euro currency and slower
economic activity are making investors question if the central bank could stick to their plan.
The cause for the slowdown has not been pinpointed yet but the suspects are lower exports
and bad weather conditions.
Slower Eurozone growth stokes concerns

Alpha Strategist | “Crossroads”
MAY 2018 | ISSUE 65 24
ECB’s stance in
question in the
face of slowdown
Meanwhile concerns surrounding the impact of the US-China trade spat and Brexit have
bubbled up. The ECB, which was planning to end its bond buying program this year, is
viewing upcoming data with caution. The central bank was relying on growth to eventually
boost inflation. Yet Eurozone’s purchasing managers’ index, which tracks activity such as
order books and inventory, signaled that the slowdown is likely to be temporary and
expansion could return soon.
Despite continued growth, Japan faces testing year ahead
Japan’s recovery continues to remain robust and growth is likely to continue through the
year, albeit at a slower pace. The slowdown was caused by a hit to exports and lower
consumer spending due to increased prices of daily goods. Some important factors will test
the economy’s resilience this year. A potential increase in sales tax is likely to be levied
which could cause the nation’s growth to slow down. Japan will be cautious this time
around because the last time taxes were raised, the country was hit by a recession as a
result. Also, the Bank of Japan is likely to wind down stimulus if it hits its inflation target. It is
already halfway to the target and is showing signs of increased growth.
Meanwhile Japan and China are holding an economic dialogue after eight years on the
back of the US trade threats. This could set the stage for new trade dialogues between
Japan and China at an important time, as they both will be directly or indirectly affected by
the US trade spat.
With inflation increasing,
the BoJ is likely to
withdraw stimulus
China’s service sector shines in April
Amidst trade negotiations with the US, China’s service sector was boosted in April by faster
new business and employment growth. This is a testament to China’s reduced dependency
on their manufacturing sector and rise in their services sector. This will in turn boost the
domestic demand in the country at an important time. Rising wages are giving consumers
more spending power at home. Meanwhile, new business orders accelerated further due
to better market conditions. Both manufacturing and service sectors are showing
increased signs of firming growth.
Concern remains around the US trade talks. After a round of discussions, no substantial
outcome was achieved but discussions are likely to continue. While some undisclosed
trade issues were resolved, disagreement has been mentioned on other matters.
China’s economy shows
signs of firming growth
amidst US trade talks
China’s trade advantage over the US
Source: United States Census Bureau
0
100,000
200,000
300,000
400,000
500,000
600,000
20
00
20
01
20
02
20
03
20
04
20
05
20
06
20
07
20
08
20
09
20
10
20
11
20
12
20
13
20
14
20
15
20
16
20
17
in $ mn US Goods Exports to China US Goods Imports from China

Alpha Strategist | “Crossroads”
MAY 2018 | ISSUE 65 25
Indian Economy
IMD expects normal monsoon in 2018
The Indian Meteorological Department (IMD) released its first forecast for the 2018
southwest monsoon (June-September) rainfall with expectations of normal monsoon. It
expects monsoon rainfall at 97% of the long period average (LPA) with very less probability
of experiencing a deficit monsoon. Earlier, Skymet, a private weather forecasting agency,
also predicted southwest monsoon rainfall at 100% of LPA.
These, however, are early forecasts. Timely arrival of monsoons, followed by healthy
monthly and regional distribution, would be crucial. Meanwhile, storage levels in
reservoirs are showing faster depletion. As of mid-April, water storage at 91 major
reservoirs in the country stood at 84% of what is considered normal, compared with 90%
for the same period last year.
Importantly though, the IMD's April forecasts for rainfall are not very reliable. The actual
rainfall has deviated significantly from the forecasts in four out of the last five years and the
deviation has been a downward revision during the three years, 2014 to 2016. With rising
tensions about farmers' distress, general elections in 2019 and the fact that winter
monsoon (January-February) rainfall in 2018 was the worst (only ~38% of normal rainfall)
in at least 26 years, 2018 southwest monsoon holds special significance.
Low probability of
a deficient rainfall
Only 14% probability of deficient rainfall Deviation of actual rainfall from initial forecasts
Source: IMD Source: IMD
CRISIL: Credit quality of Indian firms improved in FY18
As per the latest report by CRISIL, debt rating upgrades outpaced downgrades in FY18.
There were 1402 upgrades against 839 downgrades in FY18, leading to a credit ratio of 1.67
times, better than 1.22 times reported in FY17. Also, debt weighted credit ratio for FY18
stands at 2.31 times much higher than 0.88 times recorded in the previous financial year.
The downgrade rate for FY18 stands at 5.9%, the lowest in the past five fiscals, indicating a
sustained recovery in credit quality. This has helped the credit ratio stay above 1 for the
fourth consecutive financial years.
We expect resolution of stressed assets to provide much-needed respite from FY19
onwards as gross NPAs are expected to peak. However, this may be offset by recognition of
new NPAs stemming from recent revisions to the resolution framework for stressed asset
by the RBI. Going forward, with both domestic and global demand expected to improve,
and transitory impact of demonetization and GST fading out, we expect credit quality
improvement to sustain in FY19.
Expect credit quality
to improve further
in FY19
Deficient (<90)
14%
Below Normal
(90-96)
30%Normal
(96-104)
42%
Above Normal
(104-110)
12%
Excess (>110)
2%
-0.1
-19.5
4.3 3.5
-6.7
7.8
-7.7 -7.9 -8.4
-1.3
2008 2009 2010 2011 2012 2013 2014 2015 2016 2017
Deviation of actual rainfall from IMD’s 1st forecasts

Alpha Strategist | “Crossroads”
MAY 2018 | ISSUE 65 26
Retail inflation eases to 5-month low
CPI-based retail inflation eased to a five-month low of 4.3% YoY in March 2018, from 4.4% in
the preceding month. After rising continuously for 6-months (July-Dec 2017) and touching
17-month high of 5.2% in Dec 2017, retail inflation has started to ease since January 2018
onwards.
The decline in headline inflation was largely on account of a sharp drop in vegetables
inflation (6.04% weight in CPI), which fell to 11.7% YoY in March 2018 from 17.6% and 27%
in the preceding two months. This alone contributed as much as 32 bps fall in MoM
headline number. Core inflation (all items excluding ‘food & beverages’ and ‘fuel & light’)
inched up to 5.2% in March 2018, touching its highest level in 43 months.
Lower-than-expected inflation over the past few months makes us believe that, although
inflation is set to rise in Q1FY19, it is unlikely to exceed 5.5%. Thereafter, a high base should
pull down CPI inflation closer to ~4% in H2FY19. Our full year FY19 average inflation
estimate is 4.4%, in line with the RBI’s estimate of 4.5%. Consequently, we believe that the
RBI is likely to look through such statistical effects and maintain status quo in 2018.
While retail inflation
eases, core inflation
inches up
Retail inflation eases to 4.3% in March 2018…
Source: CSO
…primarily driven by vegetables
Source: CSO
Wholesale inflation eases slightly
Wholesale inflation eases slightly, touching 8-month low of 2.47% in the month of March.
This was fourth consecutive month where wholesale inflation continued to ease, however,
the extent of easing moderated significantly.
On segment-wise basis, the overall primary goods category inflation eased further to 0.2%
in March from 0.8% in the previous month mainly due to dip in foods articles (-0.3%
compared to 0.9% in February). Manufactured products group inflation was almost the
same at 3.0% as compared to the previous month. However, the inflation in fuel, power and
light group surged to 4.7% in March as against 3.8% in the previous month.
Going ahead, spike in global crude oil prices as well as domestic vegetable prices, would
keep the WPI inflation firm. Also, unfavorable base effect is likely to push up inflation.
Overall, we expect WPI to move up to 3.9% for FY19 as compared to average of 2.9% in FY18
and 1.8% in FY17.
Wholesale inflation
eases slightly,
touches 8-month low
4.3
0.0
2.0
4.0
6.0
8.0
10.0
12.0
Jul-
13
No
v-1
3
Ma
r-1
4
Jul-
14
No
v-1
4
Ma
r-1
5
Jul-
15
No
v-1
5
Ma
r-1
6
Jul-
16
No
v-1
6
Ma
r-1
7
Jul-
17
No
v-1
7
Ma
r-1
8
CPI (% YoY)0.01
0.13
(0.02)
(0.32)
0.02
0.01
(0.07)
0.01
(0.00)
(0.01)
0.09
Cereals & products
Pulses & products
Sugar & products
Vegetables
Other food & beverages
Pan, tobacco & intoxicants
Fuel & light
Housing
Clothing & footwear
Fuel for vehicles
Other misc. items
Contribution to change in inflation - MoM basis (%)
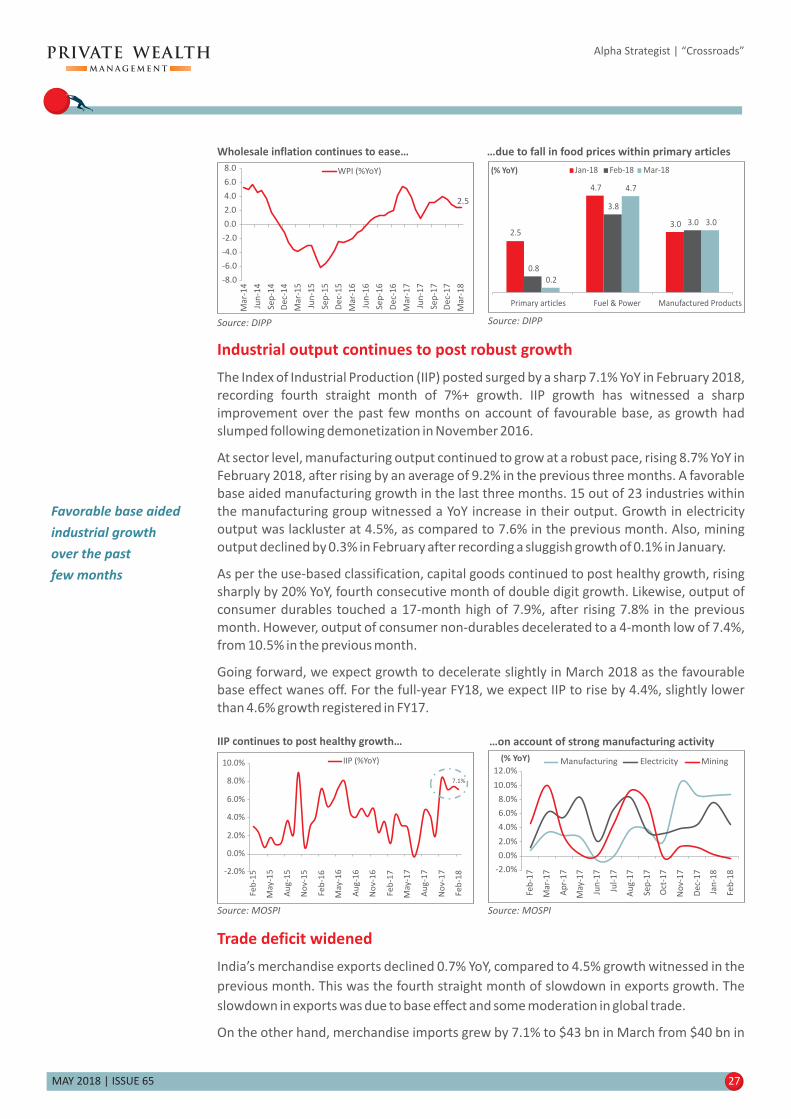
MAY 2018 | ISSUE 65 27
Alpha Strategist | “Crossroads”
Industrial output continues to post robust growth
The Index of Industrial Production (IIP) posted surged by a sharp 7.1% YoY in February 2018,
recording fourth straight month of 7%+ growth. IIP growth has witnessed a sharp
improvement over the past few months on account of favourable base, as growth had
slumped following demonetization in November 2016.
At sector level, manufacturing output continued to grow at a robust pace, rising 8.7% YoY in
February 2018, after rising by an average of 9.2% in the previous three months. A favorable
base aided manufacturing growth in the last three months. 15 out of 23 industries within
the manufacturing group witnessed a YoY increase in their output. Growth in electricity
output was lackluster at 4.5%, as compared to 7.6% in the previous month. Also, mining
output declined by 0.3% in February after recording a sluggish growth of 0.1% in January.
As per the use-based classification, capital goods continued to post healthy growth, rising
sharply by 20% YoY, fourth consecutive month of double digit growth. Likewise, output of
consumer durables touched a 17-month high of 7.9%, after rising 7.8% in the previous
month. However, output of consumer non-durables decelerated to a 4-month low of 7.4%,
from 10.5% in the previous month.
Going forward, we expect growth to decelerate slightly in March 2018 as the favourable
base effect wanes off. For the full-year FY18, we expect IIP to rise by 4.4%, slightly lower
than 4.6% growth registered in FY17.
Favorable base aided
industrial growth
over the past
few months
…due to fall in food prices within primary articles
Source: DIPP
Wholesale inflation continues to ease…
Source: DIPP
Trade deficit widened
India’s merchandise exports declined 0.7% YoY, compared to 4.5% growth witnessed in the
previous month. This was the fourth straight month of slowdown in exports growth. The
slowdown in exports was due to base effect and some moderation in global trade.
On the other hand, merchandise imports grew by 7.1% to $43 bn in March from $40 bn in
…on account of strong manufacturing activity
Source: MOSPI
IIP continues to post healthy growth…
Source: MOSPI
2.5
4.7
3.0
0.8
3.8
3.0
0.2
4.7
3.0
Primary articles Fuel & Power Manufactured Products
(% YoY) Jan-18 Feb-18 Mar-18
2.5
-8.0
-6.0
-4.0
-2.0
0.0
2.0
4.0
6.0
8.0
Ma
r-1
4
Jun
-14
Sep
-14
De
c-1
4
Ma
r-1
5
Jun
-15
Sep
-15
De
c-1
5
Ma
r-1
6
Jun
-16
Sep
-16
De
c-1
6
Ma
r-1
7
Jun
-17
Sep
-17
De
c-1
7
Ma
r-1
8
WPI (%YoY)
7.1%
-2.0%
0.0%
2.0%
4.0%
6.0%
8.0%
10.0%
Feb
-15
Ma
y-1
5
Au
g-1
5
No
v-1
5
Feb
-16
Ma
y-1
6
Au
g-1
6
No
v-1
6
Feb
-17
Ma
y-1
7
Au
g-1
7
No
v-1
7
Feb
-18
IIP (%YoY)
-2.0%
0.0%
2.0%
4.0%
6.0%
8.0%
10.0%
12.0%
Feb
-17
Ma
r-1
7
Ap
r-1
7
May
-17
Jun
-17
Jul-
17
Au
g-1
7
Sep
-17
Oct
-17
No
v-1
7
De
c-1
7
Jan
-18
Feb
-18
(% YoY) Manufacturing Electricity Mining

MAY 2018 | ISSUE 65 28
Alpha Strategist | “Crossroads”
Slowdown in both exports and imports growth
Source: Ministry of Commerce and Industry
the same month last year. However, the pace of imports growth has moderated over the last
two months. Oil imports valued at $11.1 bn grew 13.9% higher than the imports bills of
March 2017 on the back of recovery in crude prices. However, gold imports declined by
40.3% YoY to $2.5 bn in March.
Thereby, overall trade deficit, the gap between exports and imports, inched up to $13.7 bn,
which is $1.7 bn higher on-month and $3 bn higher on-year.
Going forward, we do not expect major acceleration in exports momentum owing to
moderating global trade. As for imports, the recent rise in oil prices could keep the import
bills high. Overall, we expect trade deficit at $165 bn for the entire FY19 higher than $156.8
bn registered in FY18.
Trade deficit widens ($ bn)
Source: Ministry of Commerce and Industry
-30
-20
-10
0
10
20
30
40
50
60
Mar
-16
May
-16
Jul-
16
Sep
-16
No
v-1
6
Jan
-17
Mar
-17
May
-17
Jul-
17
Sep
-17
No
v-1
7
Jan
-18
Mar
-18
Exports (YoY %) Imports (YoY %)
-25
0
25
50
Mar
-17
Apr
-17
May
-17
Jun-
17
Jul-
17
Aug
-17
Sep-
17
Oct
-17
Nov
-17
Dec
-17
Jan-
18
Feb-
18
Mar
-18
Exports Imports Trade Balance
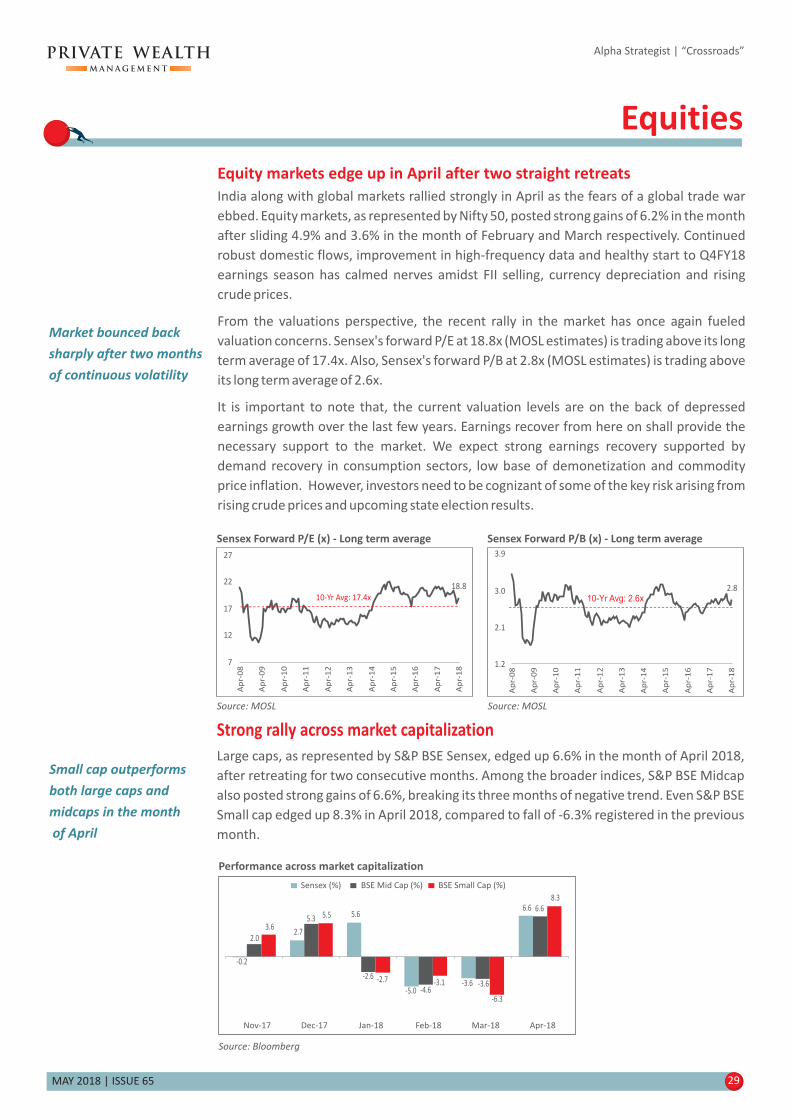
-0.2
2.7
5.6
-5.0-3.6
6.6
2.0
5.3
-2.6
-4.6-3.6
6.6
3.6
5.5
-2.7 -3.1
-6.3
8.3
Nov-17 Dec-17 Jan-18 Feb-18 Mar-18 Apr-18
Sensex (%) BSE Mid Cap (%) BSE Small Cap (%)
MAY 2018 | ISSUE 65 29
Equities
Alpha Strategist | “Crossroads”
Strong rally across market capitalization
Large caps, as represented by S&P BSE Sensex, edged up 6.6% in the month of April 2018,
after retreating for two consecutive months. Among the broader indices, S&P BSE Midcap
also posted strong gains of 6.6%, breaking its three months of negative trend. Even S&P BSE
Small cap edged up 8.3% in April 2018, compared to fall of -6.3% registered in the previous
month.
Small cap outperforms
both large caps and
midcaps in the month
of April
Equity markets edge up in April after two straight retreats
India along with global markets rallied strongly in April as the fears of a global trade war
ebbed. Equity markets, as represented by Nifty 50, posted strong gains of 6.2% in the month
after sliding 4.9% and 3.6% in the month of February and March respectively. Continued
robust domestic flows, improvement in high-frequency data and healthy start to Q4FY18
earnings season has calmed nerves amidst FII selling, currency depreciation and rising
crude prices.
From the valuations perspective, the recent rally in the market has once again fueled
valuation concerns. Sensex's forward P/E at 18.8x (MOSL estimates) is trading above its long
term average of 17.4x. Also, Sensex's forward P/B at 2.8x (MOSL estimates) is trading above
its long term average of 2.6x.
It is important to note that, the current valuation levels are on the back of depressed
earnings growth over the last few years. Earnings recover from here on shall provide the
necessary support to the market. We expect strong earnings recovery supported by
demand recovery in consumption sectors, low base of demonetization and commodity
price inflation. However, investors need to be cognizant of some of the key risk arising from
rising crude prices and upcoming state election results.
Market bounced back
sharply after two months
of continuous volatility
Sensex Forward P/E (x) - Long term average
Source: MOSLSource: MOSL
Sensex Forward P/B (x) - Long term average
Performance across market capitalization
Source: Bloomberg
18.8
7
12
17
22
27
Ap
r-0
8
Ap
r-0
9
Ap
r-1
0
Ap
r-1
1
Ap
r-1
2
Ap
r-1
3
Ap
r-1
4
Ap
r-1
5
Ap
r-1
6
Ap
r-1
7
Ap
r-1
8
10-Yr Avg: 17.4x2.8
1.2
2.1
3.0
3.9
10-Yr Avg: 2.6x
Ap
r-0
8
Ap
r-0
9
Ap
r-1
0
Ap
r-1
1
Ap
r-1
2
Ap
r-1
3
Ap
r-1
4
Ap
r-1
5
Ap
r-1
6
Ap
r-1
7
Ap
r-1
8

Data from Apr 13 to Apr 18
PE
Large cap
Midcap
April - 13
17.0
17.3
April - 18
24.1
49.2
27%
-6%
23%
59%
30%
115%
Large cap
Midcap
Earnings growth PE mean reversion PE re-rating/de-rating
Price
growth
168%
Price
growth
80%
MAY 2018 | ISSUE 65 30
Alpha Strategist | “Crossroads”
Risk-reward continues to favor multi cap strategies
Over the last 5-years, while the earnings (EPS) for the large caps have grown 27%, the EPS
for midcaps have de-grown by -6%. At the same time, large caps (Sensex) delivered 80%
absolute returns, while midcaps delivered a stellar 168% absolute returns. While, there has
been re-rating in both the segments, the extent of re-rating in midcap is relatively high,
implying broad based midcap valuations are relatively stretched compared to its large cap
peers.
Given the above context, from a valuation perspective, large caps offers valuation comfort
as compared to midcaps given the high visibility on earnings provided by large caps. Also,
we believe there are various opportunities in certain companies in the mid & small cap
space which can benefit from broad based recovery in the economy. Thereby, we continue
to favor multi cap and focused midcap strategies.
Prefer multi cap
and focused
midcap strategies
Significant PE re-rating in midcaps
Source: Bloomberg
Midcap to large cap premium continue to remain
elevated
Source: Bloomberg
Fundamental valuation indicators trade in fair value zone
To gauge the investment attractiveness of the markets, we track two indicators viz. Motilal
Oswal Value Index (MOVI) and Earnings yield to Bond yield (EY-BY). Both these indicators
help us understand if the markets are cheap or expensive.
MOVI comprises of price to earnings, price to book value and dividend yield. A low MOVI
level indicates that the market valuation appears to be cheap and vice versa. Based on our
analysis, for a three-year holding period, there has been no instance of negative return
when the entry point in the market based on 90-day average MOVI level is below 100. The
recent rally in the market has led to spike in valuations. Currently, the 90-day moving
average ratio stands at 116.0, indicating that equity markets are trading at fag end of fair
value zone. Investors have made positive returns 70% of times for 3-year holding period
even at these levels.
Also, earnings yield to bond yield is trading at fag end of fair value zone, due to recent rally in
the market and a sharp rise in bond yields. Based on historical data, equity as an asset class
becomes very attractive when EY/BY trades above 0.8. Currently, EY/BY trades at 0.54 below
its 10-year average of 0.72. At current levels, investors have made money 85% of times for a
3-year holding period.
Taking both valuation indicators into consideration, we suggest investors to stagger their
investments over the next few months and capitalize by aggressively deploying in any sharp
decline.
Follow staggered
investment approach
6500
7500
8500
9500
10500
11500
0.8
1.0
1.2
1.4
1.6
1.8
2.0
2.2
2.4
2.6
Ap
r-1
5
Oct-
15
Ap
r-1
6
Oct-
16
Ap
r-1
7
Oct-
17
Ap
r-1
8
Mid to Large Cap Premium Avg. Premium Nifty (RHS)
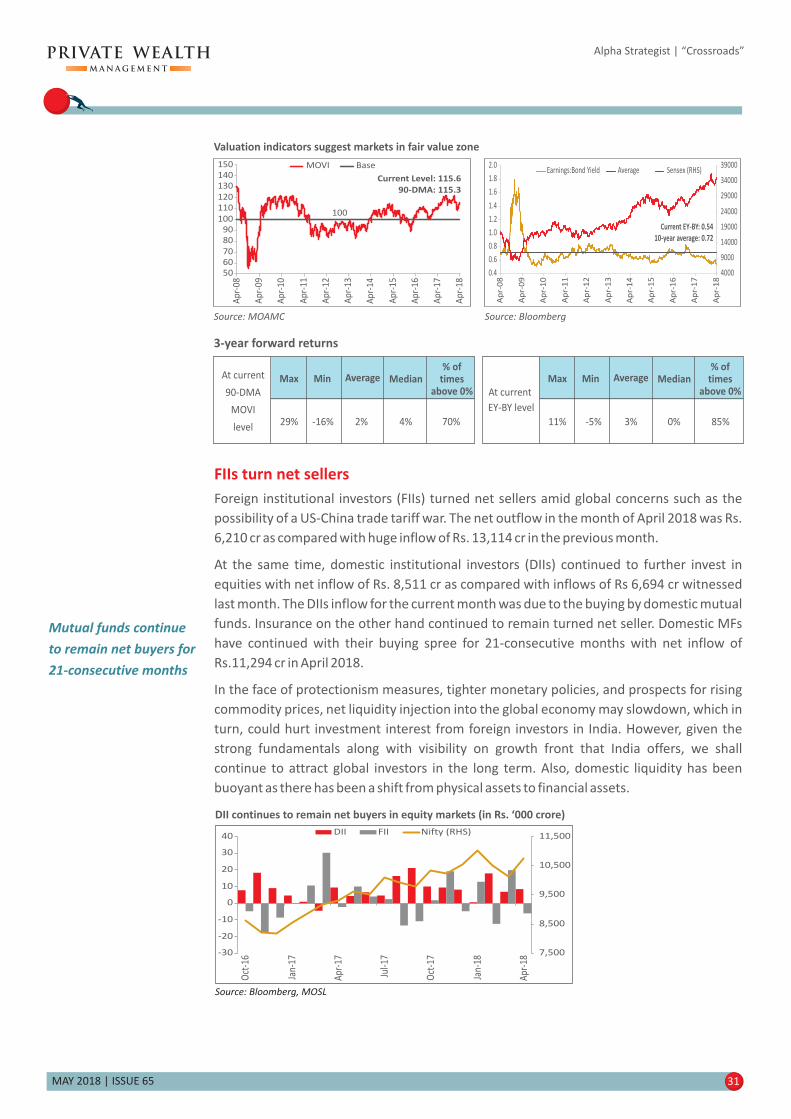
100
506070
8090
100
110120
130140150
Ap
r-0
8
Ap
r-0
9
Ap
r-1
0
Ap
r-1
1
Ap
r-1
2
Ap
r-1
3
Ap
r-1
4
Ap
r-1
5
Ap
r-1
6
Ap
r-1
7
Ap
r-1
8
MOVI Base
Current Level: 115.6
90-DMA: 115.3
MAY 2018 | ISSUE 65 31
Alpha Strategist | “Crossroads”
3-year forward returns
At current
90-DMA
MOVI
level29%
Max
-16%
Min
2%
Average
4%
Median
70%
% oftimes
above 0% At current
EY-BY level
11%
Max
-5%
Min
3%
Average
0%
Median
85%
% oftimes
above 0%
Valuation indicators suggest markets in fair value zone
Source: BloombergSource: MOAMC
Mutual funds continue
to remain net buyers for
21-consecutive months
FIIs turn net sellers
Foreign institutional investors (FIIs) turned net sellers amid global concerns such as the
possibility of a US-China trade tariff war. The net outflow in the month of April 2018 was Rs.
6,210 cr as compared with huge inflow of Rs. 13,114 cr in the previous month.
At the same time, domestic institutional investors (DIIs) continued to further invest in
equities with net inflow of Rs. 8,511 cr as compared with inflows of Rs 6,694 cr witnessed
last month. The DIIs inflow for the current month was due to the buying by domestic mutual
funds. Insurance on the other hand continued to remain turned net seller. Domestic MFs
have continued with their buying spree for 21-consecutive months with net inflow of
Rs.11,294 cr in April 2018.
In the face of protectionism measures, tighter monetary policies, and prospects for rising
commodity prices, net liquidity injection into the global economy may slowdown, which in
turn, could hurt investment interest from foreign investors in India. However, given the
strong fundamentals along with visibility on growth front that India offers, we shall
continue to attract global investors in the long term. Also, domestic liquidity has been
buoyant as there has been a shift from physical assets to financial assets.
Source: Bloomberg, MOSL
DII continues to remain net buyers in equity markets (in Rs. ‘000 crore)
4000
9000
14000
19000
24000
29000
34000
39000
0.4
0.6
0.8
1.0
1.2
1.4
1.6
1.8
2.0
Ap
r-0
8
Ap
r-0
9
Ap
r-1
0
Ap
r-1
1
Ap
r-1
2
Ap
r-1
3
Ap
r-1
4
Ap
r-1
5
Ap
r-1
6
Ap
r-1
7
Ap
r-1
8
Earnings:Bond Yield Average Sensex (RHS)
Current EY-BY: 0.54
10-year average: 0.72
7,500
8,500
9,500
10,500
11,500
-30
-20
-10
0
10
20
30
40
Oct
-16
Jan-
17
Apr
-17
Jul-1
7
Oct
-17
Jan-
18
Apr
-18
DII FII Nifty (RHS)

MAY 2018 | ISSUE 65 32
Alpha Strategist | “Crossroads”
Sectoral performance for the month of April 2018
Source: Bloomberg
Domestic Institutional
Investors (DIIs)
Flows in Rs. cr. April 2018 March 2018
Mutual Fund
Insurance
Total
9,256
6,694
13,114
-2,562
Foreign Institutional Investors (FIIs)*
As on April 30, 2018, *As on April 27, 2018
11,294
8,511
-2,782
-6,210
Except for Telecom & Oil & Gas , all sectoral indices ended in positive in the month of
April 2018. IT was the best performing sector on account of impressive quarterly results and
benefit of rupee depreciation. The sector has been the best performing sector even on
CYTD basis. On the other hand, telecom sector was the worst performing sector as the
department of telecom (DoT) asked major telecom players to clear dues before approving
their mega merger.
sector
IT sector among the
best performing sector
in the month of April
Sectoral Performance
12.1%9.9% 9.0%
7.6% 7.4% 7.2% 5.8% 5.3% 5.3%
0.5%
0.0% -1.3% -1.8%
IT
FM
CG
Re
alt
y
He
alt
hca
re
Au
to
Me
tal
Ca
pit
al
Go
od
s
Ba
nk
Po
we
r
Co
nsu
me
rD
ura
ble
s
PS
U
Oil
& G
as
Tele
co
m

MAY 2018 | ISSUE 65 33
Alpha Strategist | “Crossroads”
Source: Bloomberg Note: Performance in absolute terms
4.0%
2.9%
3.1%
8.1%
4.4%
-0.4%
2.3%
-7.2%
-3.7%
6.9%
5.4%
4.0%
5.0%
-1.2%
0.1%
5.1%
1.0%
-0.7%
7.5%
2.0%
5.3%
-2.6%
-4.6%
-3.6%
6.6%
-4.5%
6.6%
4.5%
1.1%
5.9%
4.3%
2.8%
1.0%
6.3%
-9.2%
-2.3%
7.4%
5.8%
5.4%
6.5%
-1.9%
2.2%
4.4%
-0.6%
0.8%
9.2%
3.6%
5.5%
-2.7%
-3.1%
-6.3%
8.3%
-4.3%
8.3%
0.1%
4.5%
5.1%
3.2%
1.1%
-4.1%
0.6%
-5.2%
0.7%
5.4%
2.7%
5.3%
1.5%
7.4%
3.2%
-3.2%
0.8%
-3.9%
5.0%
0.6%
3.6%
0.2%
-1.9%
-2.1%
9.9%
5.7%
9.9%
3.9%
5.2%
2.1%
5.6%
4.5%
-2.7%
1.5%
-4.7%
-2.7%
7.5%
5.2%
4.0%
3.7%
4.8%
-1.0%
8.0%
-3.3%
-1.5%
4.7%
1.2%
0.8%
7.4%
-8.6%
-3.9%
5.3%
-0.7%
5.3%
3.6%
-3.0%
0.3%
1.9%
-7.6%
-4.1%
0.3%
1.2%
-6.1%
11.0%
3.9%
-4.0%
3.0%
0.1%
2.1%
10.6%
-0.6%
-4.9%
19.5%
-4.0%
7.0%
-11.8%
-2.9%
-7.9%
-1.8%
-22.5%
-1.8%
2.9%
-2.2%
1.6%
5.2%
-0.8%
0.1%
1.8%
-4.5%
-6.4%
0.5%
4.0%
-0.5%
-1.9%
-9.7%
4.6%
0.0%
-7.4%
2.6%
5.9%
-2.0%
5.8%
-1.6%
-3.1%
-6.8%
7.6%
-4.4%
7.6%
-0.5%
2.2%
-3.2%
-3.5%
-3.5%
-2.0%
-1.9%
-1.8%
3.3%
-5.8%
8.2%
-0.1%
-7.2%
6.3%
-3.9%
6.1%
-3.6%
-1.2%
4.2%
3.6%
5.1%
11.3%
-0.4%
-3.2%
12.1%
20.3%
12.1%
2.1%
-0.4%
4.3%
9.0%
4.5%
2.8%
8.3%
-2.9%
1.6%
5.6%
5.4%
0.2%
6.6%
-1.4%
-7.3%
7.5%
7.0%
-2.2%
11.5%
-3.8%
2.2%
0.5%
-5.3%
-5.7%
-1.3%
-11.4%
-1.3%
2.6%
4.8%
2.0%
6.8%
4.3%
1.0%
-0.2%
-9.2%
0.6%
7.7%
-1.5%
2.5%
3.5%
6.1%
-3.1%
4.5%
-3.2%
2.1%
5.1%
-0.8%
6.1%
-3.0%
-4.3%
-3.1%
7.4%
-3.4%
7.4%
2.7%
9.6%
2.8%
4.1%
-1.7%
-4.1%
2.3%
-5.9%
-2.7%
8.2%
3.7%
7.3%
8.6%
-1.5%
-3.0%
5.3%
-3.6%
-0.9%
7.3%
0.2%
3.7%
6.4%
-6.3%
-3.1%
5.8%
2.1%
5.8%
2.6%
-0.2%
7.3%
7.0%
4.4%
-0.6%
6.3%
-0.7%
-2.4%
8.4%
1.5%
1.6%
4.9%
-3.8%
-6.5%
7.1%
-0.5%
-3.7%
13.0%
-2.3%
-0.1%
-0.6%
-8.6%
-5.7%
0.0%
-14.3%
0.0%
10.4%
4.7%
7.9%
4.8%
-4.0%
-1.9%
2.9%
-17.6%
-1.4%
8.4%
9.1%
7.0%
20.2%
0.4%
5.8%
7.0%
-2.2%
-3.4%
11.4%
6.3%
6.6%
0.0%
-5.4%
-9.7%
9.0%
-6.8%
9.0%
2.7%
-0.2%
1.8%
3.6%
0.6%
0.5%
3.0%
-12.8%
-0.4%
12.4%
9.1%
10.7%
1.4%
-0.5%
4.0%
2.8%
7.5%
-0.8%
5.2%
16.2%
5.7%
-0.9%
-5.7%
5.1%
0.5%
-1.4%
0.5%
5.5%
-0.1%
7.2%
10.4%
5.7%
-1.8%
5.7%
3.4%
-5.2%
15.5%
1.9%
-0.7%
-4.2%
-0.5%
1.1%
9.2%
6.9%
2.1%
8.6%
-5.6%
7.5%
3.3%
-1.6%
-12.2%
7.2%
-4.4%
7.2%
4.0%
1.4%
6.6%
4.0%
1.1%
-5.2%
0.8%
1.1%
-2.0%
9.1%
1.3%
3.6%
2.4%
-4.7%
0.2%
4.4%
-2.7%
-2.4%
6.5%
-1.2%
2.6%
-2.6%
-4.2%
-4.4%
5.3%
-6.0%
5.3%
Apr-16
May-16
Jun-16
Jul-16
Aug-16
Sep-16
Oct-16
Nov-16
Dec-16
Jan-17
Feb-17
Mar-17
Apr-17
May-17
Jun-17
Jul-17
Aug-17
Sep-17
Oct-17
Nov-17
Dec-17
Jan-18
Feb-18
Mar-18
Apr-18
CYTD
FYTD
1.0%
4.1%
1.2%
3.9%
1.4%
-2.1%
0.2%
-4.6%
-0.1%
3.9%
3.9%
3.1%
1.0%
4.1%
-0.7%
5.2%
-2.4%
-1.4%
6.2%
-0.2%
2.7%
5.6%
-5.0%
-3.6%
6.6%
3.2%
6.6%
Date SensexBSE Mid
Cap
BSE Small
CapFMCG Bank Telecome
Health
CareIT Oil & Gas Auto
Capital
GoodsPSU Realty
Consumer
DurablesMetal Power
Outlook
The key trigger that was missing for last few years in an otherwise solid and strong India macro story was earnings
growth. Going forward, we expect earnings recovery to gather pace. The optimism surrounding the upcoming
earnings season is increasing with various lead indicators turning favorable. Also, we expect earnings recover to be
supported by demand recovery in consumption sectors, low base of demonetization and commodity price inflation.
The evidence around recovery in rural Consumption is getting stronger with every passing quarter and early results of
Q4FY18 bolster this view.
However, the recent market rally has once again fueled valuation concerns. Going forward, revival in earnings growth
shall provide the necessary support for markets to rally. Also, investors need to be cognizant of some of the key risk
arising from the rising crude oil prices and upcoming state election results.
Thereby, we continue to suggest investors to stagger their investments over the next few months and capitalize on any
sharp decline by incremental deployment. Also, we continue to favor multi cap and focused midcap strategies.

6.2 6.2
6.7
7.3
7.67.8 7.8 7.9 7.8
8.07.9
7.8 7.88.0 8.0 8.0
5.86.06.26.46.66.87.07.27.47.67.88.08.2
3M 6M 1Y 2Y 3Y 4Y 5Y 6Y 7Y 8Y 9Y 10Y 11Y 12Y 13Y 17Y
Years
Current 1 mnth back 6 mnths back 1 yr back
MAY 2018 | ISSUE 65 34
Fixed Income
Alpha Strategist | “Crossroads”
Indian bond yields rise in April after a rally in March
The month of April was a volatile month for Indian bond market wherein the 10 year GSec
bond yield traded in the range of 7.13% - 7.8%. Such a volatile movement was characterized
by a positive rally in the first week on back of RBI’s dovish stance on inflation projections and
surprise shift in market borrowing policy by the Government, however in the second half of
the month the market participants became nervous and the yields rose due to the hawkish
stance revealed by the minutes of Monetary Policy Committee (MPC), surge in crude oil
prices, muted demand and US yields crossing the psychological mark of 3%.
Thus, going forward, volatility would be prevalent at least for the near term and hence
would be dependent on many factors like any hike in rates by RBI (though the same has
been discounted by the market), stickiness in crude prices, rise in global yields, monsoon,
inflation trajectory etc.
Value opportunities
exists in front
end of the curve
Source: RBI, Bloomberg
A volatile year for the Indian bond market
RBI resorts to OMO to ease liquidity
From Rs 4 trillion in April 2017, the core liquidity in the banking system has fallen to about Rs
400 billion in April 2018, thus keeping the system liquidity close to neutral. Having said,
against the backdrop of rising bond yields, foreign outflows and higher currency in
circulation, RBI announced purchase of Rs 10,000 Crs of bonds through open market
operations so as to ease liquidity in the system and maintain a durable liquidity
management. However, the announcement of recent OMO purchase seems to be a
preemptive step to contain liquidity which would be adversely affected by seasonal factors
towards the end of the current quarter.
We are of the view that RBI would continue to remain on the path of maintaining neutral
liquidity and would resort to such measures as and when required.
RBI expects liquidity to be in moderate surplus mode in first half of 2018 - 19
Source: Bloomberg
(270,000)
(170,000)
(70,000)
30,000
130,000
230,000
330,000
430,000
530,000
Dec-
15
Jan-
16
Mar
-16
May
-16
Jul-1
6
Sep-
16
Oct-1
6
Dec-
16
Feb-
17
Apr-1
7
Jun-
17
Jul-1
7
Sep-
17
Nov-
17
Jan-
18
Mar
-18
Apr-1
8
Rs. C
rs
System Cash Liquidity
RBI to continue
on the path of
neutral liquidity
management

0.5%
-1.1%
1.6%
-1.0% -0.8% -1.1%-1.7%
3.5% 3.6%
7.2%
2.5%
1.2%
-0.4%
4.9%
US
Jap
an
Ch
ina
Ge
rma
ny
Fra
nce
UK
Eu
ro A
rea
Ind
ia
Ind
on
esia
Bra
zil
Me
xic
o
S K
ore
a
Ho
ng
Ko
ng
Ru
ssia
Real Rate of Returns (10 yr G-Sec - Inflation)
MAY 2018 | ISSUE 65 35
Alpha Strategist | “Crossroads”
Year 2017 witnessed highest foreign inflows of Rs.1.48 lakh crs in Indian bond markets since
2014 on back of improving marcos, firm political mandate, stable currency and Central
Bank’s continued efforts to rein in inflation. However, sentiments became jittery and initial
months of 2018 saw a cumulative net outflow of Rs.10,800 Crs (Jan – April 2018). Some of
the worries that resulted in lower appetite from foreign investors include stickiness in crude
oil prices, concerns regarding widening of fiscal and current account deficit, depreciating
currency and gradual increase in US bond yields.
Being cognizant of the ongoing concerns, the latest measure of increasing FPI limits and
allowing FPIs to invest in short duration securities by RBI may aid in renewing the buying
interest. With respect to government securities and state development loans, the residual
maturity limits have been withdrawn and with respect to corporate bonds, FPI can invest
with residual maturity up to 1 year, relaxed from 3 years earlier. In both the categories, the
relaxation is subject to investments in residual maturity below one year to not exceed 20
percent of the total investment. Although such measures may prove to be beneficial in the
short term in terms of easing pressure on short term yields and rupee, albeit volatility in the
flows, one needs to be aware whether such measures would be beneficial in the long run or
not.
Having said that, the real rate of return of India when compared to most of the developed
economies is quite lucrative barring emerging economies like Brazil & Russia. Hence, the
hunt for the higher yield may drive foreign flows towards India. However, stability of
domestic macros and development on the global factors may decide the quantum and
durability of future foreign flows.
Amidst rising bond yields and macro concerns, RBI eases investment rules
for foreign investors
Foreign investors turn net bond sellers in 2018
Source: Bloomberg Source: Bloomberg
Real rates remain attractive for emerging markets
(20,000)
(15,000)
(10,000)
(5,000)
-
5,000
10,000
15,000
20,000
25,000
30,000
Jan
-16
Fe
b-1
6M
ar-
16
Ap
r-1
6M
ay
-16
Jun
-16
Jul-
16
Au
g-1
6S
ep
-16
Oct-
16
No
v-1
6D
ec-1
6Ja
n-1
7Fe
b-1
7M
ar-
17
Ap
r-1
7M
ay
-17
Jun
-17
Jul-
17
Au
g-1
7S
ep
-17
Oct-
17
No
v-1
7D
ec-1
7Ja
n-1
8Fe
b-1
8M
ar-
18
Ap
r-1
8
FPI/FII Debt Flows (Rs. Crs)
In lieu of the domestic & global uncertainties, yields across the curve, especially on the front
end, have shifted upwards pushing the credit spreads at higher levels. The spreads are
hovering in the range of 40 – 170 bps w.r.t different credit assets across short to medium
end of the yield curve.
To give a perspective, in last one year, AAA yield curve is currently trading at levels above the
levels of AA yield curve prevailing at that time. A case in point is that over the last one year
the quantum of rise in yields of AAA segment has not been accompanied with a similar rise
in yield of lower rated assets, thus leading to spread compression between AAA and high
yielding assets. Such compression has been largely owing to transmission of interest rate
Foreign demand
to be a function of
macro – economic
parameters and
exchange rate
movement
Short to medium term bond funds offer good value in the current
market scenario
Risk reward continues
to remain favorable
towards accrual
strategies

MAY 2018 | ISSUE 65 36
Alpha Strategist | “Crossroads”
The past one year has been quite volatile for the fixed income investors resulting in almost a 100 bps increase in yields
at different parts of the curve. Going forward, we expect some volatility to continue on back of the ongoing concerns,
both on domestic and global front.
Given this backdrop, we continue to believe that investors should capitalize on the absolute value which is most visible
on the front end of the curve with bond maturities upto 5 years. We reiterate that for capital preservation and
reasonable income accrual, one should consider investing in ultra-short term, short term, high quality corporate bond
and credit oriented funds with duration in the range of 1- 3 years.
Outlook
rise to AAA segment due to its liquid and better price discovery attribute and not owing to
any credit prospects of lower rated bonds.
Thus, from a prudent risk reward perspective, investing in high quality front end strategies
with bond maturities up to 5 years makes imminent sense. Investors who are comfortable
taking credit risk, can allocate funds towards well researched credit oriented short term
strategies so as to benefit from higher carry along with lesser interest rate risk.
Source: Bloomberg Source: Bloomberg
Source: RBI, Bloomberg
Upward shift in yield curve across credit in last 1 year
6.06.46.87.27.68.08.48.89.29.6
10.010.4
1 Yr 3 Yr 5 Yr
Yie
ld (
%)
Maturity
Gsec AAA AA AGsec (1 year bck) AAA (1 year bck) AA (1 year bck) A (1 year bck)
113
37
171
6640
174
58 42
168
020406080
100120140160180200
AAA - Gsec AA - AAA A - AA
Sp
re
ad
in
bp
s
Current Credit spreads
1 Yr Maturity 3 Yr Maturity 5 Yr Maturity
54 48
181
8048
176
7854
175
020406080
100120140160180200
AAA - Gsec (1 yr back) AA - AAA (1 yr back) A - AA (1 yr back)
Sp
re
ad
in
bp
s
Credit spreads (1 Yr back)
1 Yr Maturity 3 Yr Maturity 5 Yr Maturity
Credit spreads (1 Yr back) in different maturity bucketsCurrent credit spreads in different maturity buckets

MAY 2018 | ISSUE 65 37
Alternatives
Volatility was the theme for most asset classes and precious metals was no different, as gold moved by 4%, but closed the
month almost flat at $1,322 Last month, heightened geopolitical tensions, rising US10 year yield apart from sharp rise in
global crude oil prices guided market movement. Global equities, broadly, closed in the green as rising crude oil prices
raised expectation that inflation could start to pick up in the coming months as well as after trade war tensions started to
recede between the US and China. Since the start of the month, gold prices started to gain primarily on back of
heightened geopolitical tensions in Syria, but tensions started to cool-off between US and Russia after US President
Donald Trump said that the attack was intended to as proportional strike aimed specifically at Syria's chemical weapons
facilities rather than a broader set of targets and was a one-time assault to punish Damascus for a suspected gas attack.
Gains were capped after FOMC minutes showed that policymakers at the Federal Reserve expect the growth of the
economy to remain firm and that inflation would rise in the coming months. Policymakers at the central bank expect US
economic outlook has strengthened in the recent past, but at the same time expect that retaliatory trade actions by other
countries as downside risk for the economy. The next FOMC policy meeting is scheduled at the start of the month and
expectation is that the Federal Reserve could keep rates unchanged. This time though no projections for the US economy
will be released and that could keep the event a low key affair. No major impact on the dollar would be seen as most of it is
discounted in the market.
The Dollar on the other hand started to rebound against its major crosses after remaining under pressure for the past few
months. The greenback started to regain after recent economic data released from the US came showed the economy
was coming out of the woods. Except for the non-farm payrolls number which was bit disappointing, most economic
numbers released last month were either in line with estimates or beat estimates.
Apart from central bank meeting that remained in focus and heightened geopolitical tensions increased investment
demand in gold. Last month, gold ETF witnessed buying interest with investment in SPDR saw holdings rise by 25 tonnes
.i.e a rise of over 3% in investment demand in gold, while investments in silver ETF remained subdued.
Gold
Alpha Strategist | “Crossroads”
Outlook
For the month, we expect that volatility for precious metals could continue to remain high as US 10-year yield would
remain in focus. As it hovers around the psychological mark of 3% market participants will be keeping an eye on how it
starts to move from here on. Rise in inflation has bolstered expectation that the Fed will continue to push rates higher,
thereby adding to gains for the yield. Ahead of the important June meeting, OPEC countries are scheduled to meet this
month and will be important to gauge the committee's stance going forward. Geopolitical tensions could be one of the
important triggers that would restrict any major losses for gold. For the month, we expect gold, on the COMEX, to
quote in the range $1,280 and $1,365 and on the domestic bourses it is expected to quote in the range of Rs.30,400 and
Rs.31,600.
28,000
29,000
30,000
31,000
32,000
33,000 Crisil Gold Index
Apr
-17
May
-17
Jun-
17
Jul-
17
Aug
-17
Sep-
17
Oct
-17
Nov
-17
Dec
-17
Jan-
18
Mar
-18
Apr
-18
Gold (INR) - Neutral stance
Source: CRISILSource: CRISILSource: Bloomberg
Gold prices ended almost flat in the month
1000
1050
1100
1150
1200
1250
1300
1350
1400
Apr
-14
Aug
-14
Dec
-14
Apr
-15
Aug
-15
Dec
-15
Apr
-16
Aug
-16
Dec
-16
Apr
-17
Aug
-17
Dec
-17
Apr
-18
GOLD Spot ($/Oz)

This document is not valid without disclosure; refer the last page for the disclosure
MAY 2018 | ISSUE 65 38
Section III
Advisory Approach..............................................................................................39
Model Portfolios Performance.............................................................................40
4C Framework.....................................................................................................41
Fund llocator.....................................................................................................42
Equity Recommendations....................................................................................43
Managed Strategies.............................................................................................44
Debt Offering ......................................................................................................51
Fund Insight.........................................................................................................53
α
Real Estate Offering.............................................................................................50
Alternative Offering ............................................................................................52
Alpha Strategist | “Crossroads”

MAY 2018 | ISSUE 65 39
Advisory Process
Advisory Approach
True portfolio of clients and asset allocation is best determined through Financial Planning strategy. If not, the clients
can follow a model portfolio approach. Following steps are followed for Model Portfolio construction:
1) Investors are classified according to their risk profile viz. Aggressive, Moderately Aggressive, Balanced, Moderately
Conservative and Conservative.
2) Asset Allocation is done at two levels:
(a) Static – Based on the risk profile, asset allocation is defined at a broad level:
(b) Dynamic – Asset Allocation based on the market conditions
Our Methodology
Since different clients have different risk return preferences, based on our comprehensive risk profiling process we
have categorized the clients broadly into categories viz.6 Aggressive+, Aggressive, Moderately Aggressive, Balanced,
Moderately Conservative and Conservative
We follow a robust Advisory Process to generate “Alpha” in the client’s portfolio. The entire approach is governed by a
stringent risk management framework.
Conservative
Moderately Conservative
Balanced
Moderately Aggressive
Aggressive
Aggressive+
0.0%
20.0%
40.0%
65.0%
85.0%
100%
85.0%
65.0%
40.0%
20.0%
0.0%
-
10.0%
10.0%
10.0%
5.0%
5.0%
-
5.0%
5.0%
10.0%
10.0%
10.0%
-
Equity Bond Cash Gold
View on asset
classes
Asset Allocation
Alpha
Investment
Committee
Product Selection
across asset classes
Manager Alpha
Product & Advisory
CommitteePortfolio
Construction
Financial Strategy
Alpha Strategist | “Crossroads”

MAY 2018 | ISSUE 65 40
Model Portfolios Performance
Alpha Strategist | “Crossroads”
Note:
Portfolio inception date: October 01, 2012
Performance as on :
Static Blended Benchmark (SBB): is an Index that tracks the performance of the strategic asset allocation of the client. It is a blended benchmark for a portfolio
based on benchmarks of each asset class in the portfolio. This index is re-balanced to its original weights after every calendar quarter. No tactical changes or active
asset allocation calls are applied to this index.
April 30, 2018
BalancedModerately Aggressive
Aggressive +
ConservativeModerately Conservative
Aggressive
90
110
130
150
170
190
210
230
Oct
-12
Ap
r-1
3
No
v-1
3
May
-14
De
c-1
4
Jul-
15
Jan
-16
Au
g-1
6
Feb
-17
Sep
-17
Ap
r-1
8
NA
V i
n I
NR
Mod Aggressive Portfolio SBB
90
100
110
120
130
140
150
160
170
180
190
200
Oct
-12
Ap
r-1
3
No
v-1
3
May
-14
De
c-1
4
Jul-
15
Jan
-16
Au
g-1
6
Feb
-17
Sep
-17
Ap
r-1
8
NA
V i
n I
NR
Balanced Portfolio SBB
90
100
110
120
130
140
150
160
170
Oct
-12
Ap
r-1
3
No
v-1
3
May
-14
De
c-1
4
Jul-
15
Jan
-16
Au
g-1
6
Feb
-17
Sep
-17
Ap
r-1
8
NA
V i
n I
NR
Conservative Portfolio SBB
80
110
140
170
200
230
260
290
Oct
-12
Ap
r-1
3
No
v-1
3
May
-14
De
c-1
4
Jul-
15
Jan
-16
Au
g-1
6
Feb
-17
Sep
-17
Ap
r-1
8
NA
V i
n I
NR
Aggressive + Portfolio SBB
80
110
140
170
200
230
260
Oct
-12
Ap
r-1
3
No
v-1
3
May
-14
De
c-1
4
Jul-
15
Jan
-16
Au
g-1
6
Feb
-17
Sep
-17
Ap
r-1
8
NA
V i
n I
NR
Aggressive Portfolio SBB
90
100
110
120
130
140
150
160
170
180
190
Oct
-12
Ap
r-1
3
No
v-1
3
May
-14
De
c-1
4
Jul-
15
Jan
-16
Au
g-1
6
Feb
-17
Sep
-17
Ap
r-1
8
NA
V i
n I
NR
Mod Conservative Portfolio SBB

MAY 2018 | ISSUE 65 41
4C Framework
The 4C Fund Manager Selection Process
Evaluating Manager Expertise
Alpha Strategist | “Crossroads”
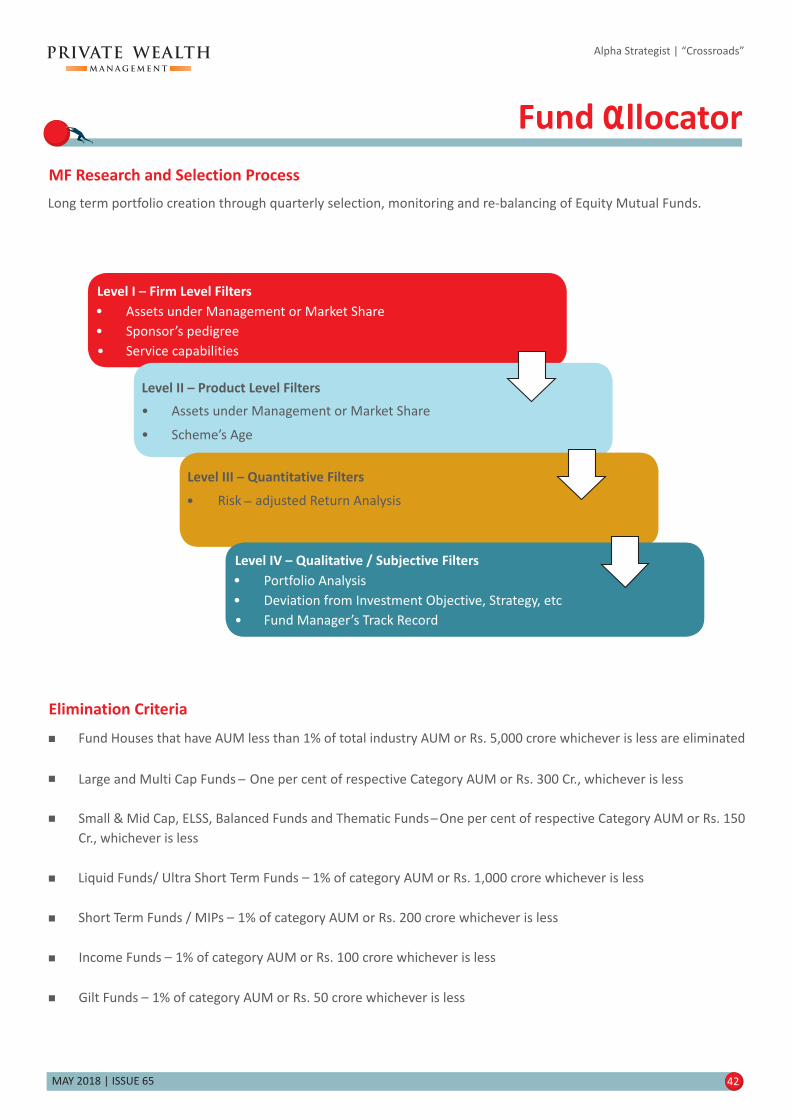
MAY 2018 | ISSUE 65 42
MF Research and Selection Process
Long term portfolio creation through quarterly selection, monitoring and re-balancing of Equity Mutual Funds.
Elimination Criteria
Level I _ Firm Level Filters
Assets under Management or Market Share
Sponsor’s pedigree
Service capabilities
Level II _ Product Level Filters
Assets under Management or Market Share
Scheme’s Age
Level III _ Quantitative Filters
Risk _ adjusted Return Analysis
Level IV _ Qualitative / Subjective Filters
Portfolio Analysis
Deviation from Investment Objective, Strategy, etc
Fund Manager’s Track Record
Fund Houses that have AUM less than 1% of total industry AUM or Rs. 5,000 crore whichever is less are eliminated
Large and Multi Cap Funds _ One per cent of respective Category AUM or Rs. 300 Cr., whichever is less
Small & Mid Cap, ELSS, Balanced Funds and Thematic Funds_ One per cent of respective Category AUM or Rs. 150
Cr., whichever is less
Liquid Funds/ Ultra Short Term Funds _ 1% of category AUM or Rs. 1,000 crore whichever is less
Short Term Funds / MIPs _ 1% of category AUM or Rs. 200 crore whichever is less
Income Funds _ 1% of category AUM or Rs. 100 crore whichever is less
Gilt Funds _ 1% of category AUM or Rs. 50 crore whichever is less
Alpha Strategist | “Crossroads”

We follow an institutional approach for recommending stocks in client’s portfolios. Below mentioned are our top picks currently:
Direct Equity
Equity RecommendationsAlpha Strategist | “Crossroads”
MAY 2018 | ISSUE 65 43
RationaleCompany SectorCurrent Mkt
Price (INR)
Target Price
(INR)
Net Profit 3
Yr CAGR (%)
Dividend
Yield (%)P/E
Market Cap
(INR Crs)
With a variety of regulatory changes happening across the nation, the domestic 3W market has been on an upswing for the last 2-3 months. Averagemonthly volumes were 24.7k in FY18YTD v/s 21.1k in FY17. Bajaj Auto sees incremental opportunity of ~142k passenger 3Ws in the next 2-3 years (v/sFY17 volumes of 240k passenger 3Ws) in key states like Maharashtra, Karnataka and New Delhi
Bajaj AutoAuto &
Auto ancillaries
Leading Consumer Electrical compnay. Rrecently acquired Lloyds which will help gain stronger foothold in fast growing durable segment. Thecompnay aims to double its revenue in next 3 years through new product launches, expansion of existing product portfolio and increasedchannel pentration.GST rates being cut to 18% from 28% would accelerate the shift from unorganized to organized space
MahindraCIE(MACA)is a multi-technology automotive components supplier,with annual revenue of INR 53 b in CY16. MACA is all primed for growthphase, after three years of consolidation. It has all ingredients in place for sustained growth over the next 2-3 years. i.e.(a)India business high dependence on fast growing segments and players with favourable product lifecycle,(b)Scope to add products/customers inMFE and Metal castello,(c) limited capex,(d)supportive parent,and (e)focused M&Astrategy to access technologies,customers or markets.
The Ramco Cements (TRCL) is one of the top three cement producers in South India with total nameplate capacity of 12.5mtpa (0.95mtpa in WestBengal and the balance in the South). It also has operational wind farm capacity of 159MW and 157MW of CPP capacity Ramco Cement is among thelowest-cost cement producers in south, along with the most premium brands. Strong brand and higher trade segment mix aid superior pricing in coremarkets With more than 10% market share in the south, strong brand/dealer network, superior pricing and industry-leading RoE (18-20% in Fy18),peak parameters are already in place
Strong performance across parameters in a period marred by significant economic challenges. Liability franchise has strengthened significantly, withsustained improvement in CASA ratio to 36.3 % (up 820bp), improving deposit concentration ratios, and more favorable ALM profile. This has alsobenefitted NIM and increased fee income streams. The company also has benefitted from targeting cash rich region. YES Bank remains a good option inthe mid size banking segment on the back of its healthy capitalization, strong capital allocation, and market leading growth rates
Ad growth is expected to remain healthy, despite the expected moderation in FMCG as viewership share gains in regional portfolio and newchannels could aid in cushioning the impact. Telecom ad spend too is expected to pick up in 2H.
HDFC Bank is well positioned with ~40% CASA, growth outlook ~1.3x industry and least qualiity risk.With strong capacity, CET1 ratiof of~13%, strongemphasis on digitization, the bank is well positioned to capitalize on the expected pick up in economic growth cycleHDFC Bank
Banking &
Finance
Mahindra CIE
The Ramco
Cement
Yes Bank
Cement &
Construction
Banking &
Finance
Zee
Entertainmen
Media &
Entertainment
Granules India Pharma
Granules India (GRAN) is a vertically integrated manufacturer of pharmaceutical products. It is among the largest manufacturers of Paracetamol andIboprofen in the world. It derives 63% of its business from Europe and the US. GRAN also has a formulations plant, with a capacity to produce 18btablets per annum. It has its own Abbreviated New Drug Applications (ANDAs) and dossiers. GRAN services more than 300 customers across 60 nations(exports are ~87% ofrevenues) GRAN reported 39% earnings CAGR on improved profitability, higher operating leverage and superior business mix. Itexpanded its finished dosages business at aCAGR of 36% over FY11-16, leading to higher profitability and improved utilization of the existing capacityof 18b tablets. Profitability of the PFI business has also improvedsubstantially, with the implementation of 6MT order capacity. As a result, GRAN hasexpanded its EBITDA margins from 11.8% in FY11 to ~21% in FY17
Market leader with ~32% market share in moulded furniture segment. The plastics generator is largest revenue for the company at ~89% (FY2017). Thecompany has been able to grow this business consistently (8.3% CAGR over FY12-17) on the back of new products, designs and innovation (ex. Hybridchairs combining metal and plastics). Market size of Furniture Industry is ~INR750bn. Of this 85% is unorganized, GST implementation would also aidshift from unorganized to organized, where Nilkamal is a market leader and is best suited to benefit from this shift.
Havells India Capital Goods
KEI Industries Ltd is ranked amongst the top3 power cable companies in India and is also engaged in the EPC business. The institutional segment is thelargest revenue generator for the copany followed by retail segment and exports segment Well positioned to be a key beneficary fri the recentintiatives taken by government in the infrastructure and real estate segment.HW,EHV, EPC segment are expected to drive revenue Has high historicalROE & ROCE Even with high capex the company is expected to maintain the net debt to equity below 1.0x
Nilkamal Ltd Plastics
KEI Inds. Cables
2,948
109
1,945
250
823
362
587
547
1,702
435
4,031
175
2,350
274
847
410
705
640
2,215
537
6
30
20
66
80
28
36
3
38
104
1.87
0.72
0.67
0.00
0.37
0.75
0.43
0.64
0.65
0.14
22
17
27
26
29
20
38
60
21
35
85,305
2,758
505,008
9,458
19,395
83,437
56,365
34,183
2,540
3,405
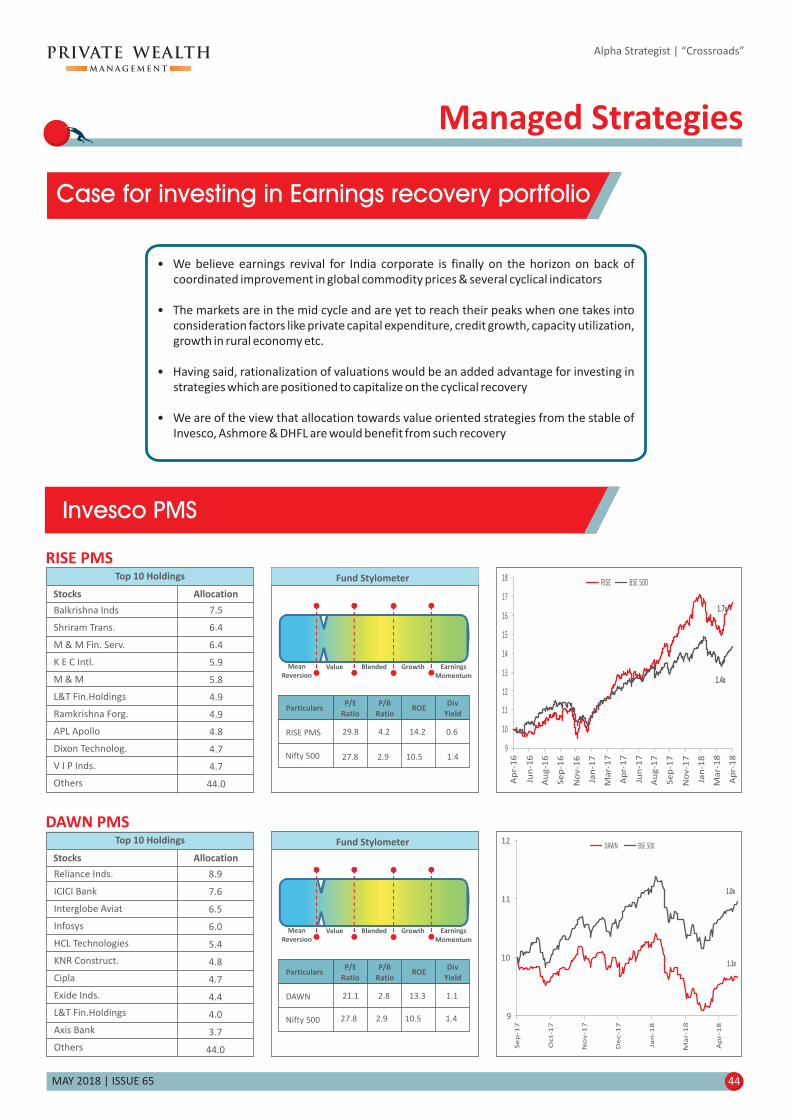
Reliance Inds.
ICICI Bank
Interglobe Aviat
Infosys
HCL Technologies
KNR Construct.
Cipla
Exide Inds.
L&T Fin.Holdings
Axis Bank
Others
8.9
7.6
6.5
6.0
5.4
4.8
4.7
4.4
4.0
3.7
44.0
Top 10 Holdings
Stocks Allocation
Fund Stylometer
Mean
Reversion
Value Blended Growth Earnings
Momentum
ParticularsP/E
Ratio
P/B
RatioROE
Div
Yield
DAWN
Nifty 500
21.1 2.8 13.3 1.1
27.8 2.9 10.5 1.4
Fund Stylometer
Mean
Reversion
Value Blended Growth Earnings
Momentum
ParticularsP/E
Ratio
P/B
RatioROE
Div
Yield
RISE PMS 29.8 4.2 14.2 0.6
Nifty 500 27.8 2.9 10.5 1.4
Balkrishna Inds
Shriram Trans.
M & M Fin. Serv.
K E C Intl.
M & M
L&T Fin.Holdings
Ramkrishna Forg.
APL Apollo
Dixon Technolog.
V I P Inds.
Others
7.5
6.4
6.4
5.9
5.8
4.9
4.9
4.8
4.7
4.7
44.0
Top 10 Holdings
Stocks Allocation
Managed Strategies
• We believe earnings revival for India corporate is finally on the horizon on back of
coordinated improvement in global commodity prices & several cyclical indicators
The markets are in the mid cycle and are yet to reach their peaks when one takes into
consideration factors like private capital expenditure, credit growth, capacity utilization,
growth in rural economy etc.
Having said, rationalization of valuations would be an added advantage for investing in
strategies which are positioned to capitalize on the cyclical recovery
We are of the view that allocation towards value oriented strategies from the stable of
Invesco, Ashmore & DHFL are would benefit from such recovery
•
•
•
MAY 2018 | ISSUE 65 44
Alpha Strategist | “Crossroads”
Case for investing in Earnings recovery portfolio
Invesco PMS
RISE PMS
DAWN PMS
1.7x
1.4x
9
10
11
12
13
14
15
16
17
18
Ap
r-1
6
Jun
-16
Au
g-1
6
Se
p-1
6
No
v-1
6
Jan
-17
Ma
r-1
7
Ap
r-1
7
Jun
-17
Au
g-1
7
Se
p-1
7
No
v-1
7
Jan
-18
Ma
r-1
8
Ap
r-1
8
RISE BSE 500
1.1x
1.0x
9
10
11
12
Se
p-1
7
Oct-
17
No
v-1
7
De
c-1
7
Jan
-18
Ma
r-1
8
Ap
r-1
8
DAWN BSE 500

MAY 2018 | ISSUE 65 45
Alpha Strategist | “Crossroads”
St Bk of India
Container Corpn.
ITC
Castrol India
Oracle Fin.Serv.
Cummins India
Indraprastha Gas
Multi Comm. Exc.
O N G C
Sanofi India
Others
6.5
5.0
4.8
4.3
4.3
4.0
4.0
4.0
4.0
4.0
55.3
Top 10 Holdings
Stocks Allocation
Fund Stylometer
Mean
Reversion
Value Blended Growth Earnings
Momentum
ParticularsP/E
Ratio
P/B
RatioROE
Div
Yield
Deep Value
Nifty 500
22.1 3.1 13.8 1.6
27.8 2.9 10.5 1.4
Sudarshan Chem.
Dishman Carbogen
Ahluwalia Contr.
South Ind.Bank
Persistent Sys
J Kumar Infra
Intrasoft Tech.
Essel Propack
Ganesh Housing
Sanghi Inds.
Others
5.4
5.4
5.3
5.2
4.9
4.8
4.8
4.7
4.6
4.5
50.5
Top 10 Holdings
Stocks Allocation
39.1 1.8 4.7 0.9
Fund Stylometer
Mean
Reversion
Value Blended Growth Earnings
Momentum
ParticularsP/E
Ratio
P/B
RatioROE
Div
Yield
Ashmore PMS 20.9 2.1 10.3 0.9
8.9%
-4.4%
-0.3%
7.7%
8.3%
-1.7%
4.6%
19.7%
1M 3M 6M Since inception
Ashmore BSE Small Cap
DHFL Pramerica PMS
Deep Value PMS
Ashmore
Ashmore India Opportunities Fund
2.9x
2.1x
5
10
15
20
25
30
35
Ju
l-1
3
De
c-1
3
Ma
y-1
4
Oct-1
4
Ap
r-1
5
Se
p-1
5
Fe
b-1
6
Ju
l-1
6
De
c-1
6
Ju
n-1
7
No
v-1
7
Ap
r-1
8
DHFL Pramerica DV Nifty 500
Nifty Free FloatMid Cap 100

MAY 2018 | ISSUE 65 46
Alpha Strategist | “Crossroads”
Mean
Reversi on
Value Blended Growth Earnings
Momentum
ParticularsP/E
Ratio
P/B
RatioROE
Div
Yield
Opportunities
Nifty 500
22.0 3.2 14.4 0.7
27.8 2.9 10.5 1.4
ParticularsP/E
Ratio
P/B
RatioROE
Div
Yield
Midcap 22.8 2.6 11.2 0.7
Nifty Free FloatMid Cap 100
39.1 1.8 4.7 0.9
Investment
Philosophy
• Focus on sustainable and quality growth
• Understanding economic value of a business by employing a fair value approach
• Focus on fundamentals rather than on price momentum
• Risk management is central to Investment management
Managed By
Pankaj Murarka
• Over 2 decades of experience in Equities fund Management
• Ability to leverage his Private Equity experience at RARE Enterprises
• Known for identifying business leaders early and buy them at reasonable valuations
• Emphasis on Risk management and Bottom up stock selection
• Fund Management skill honed through prior stints at UTI AMC, Axis AMC, DSP Merill
Lynch
Renaissance Investment Managers
• Dominant Market players & companies in Industries that have gone through consolidation
Companies with a healthy balance sheet to ensure margin of safety
Beneficiary of earning recovery due to underutilized capacity and operating leverage
Min Investment – Rs. 1 cr
Multi cap fund with bottom up stock selection
Fund will have 4 closing with the last closing on 15th May 2018
Tenure: 3 years+ 1 year extension at Fund Manager’s discretion (15th May 2021+ 1 year)
•
•
•
•
•
•
Renaissance Opportunities Portfolio
Syngene Intl.
Federal Bank
DCB Bank
Info Edg.(India)
Just Dial
Bank of Baroda
S Chand & Compan
Sanghvi Movers
Sun TV Network
Mahindra Holiday
Others
9.0
8.0
8.0
7.0
7.0
5.0
5.0
5.0
5.0
5.0
36.0
Top 10 Holdings
Stocks Allocation
Renaissance Midcap Portfolio
St Bk of India
HDFC Bank
Kotak Mah. Bank
Federal Bank
Sun Pharma.Inds.
Axis Bank
Info Edg.(India)
Larsen & Toubro
Tata Motors
Sanghvi Movers
Others
7.0
6.0
6.0
6.0
6.0
5.0
5.0
5.0
5.0
5.0
44.0
Top 10 Holdings
Stocks Allocation
Renaissance Opportunities Portfolio

MAY 2018 | ISSUE 65 47
Motilal Oswal
Alpha Strategist | “Crossroads”
Fund Stylometer
Mean
Reversion
Value Blended Growth Earnings
Momentum
ParticularsP/E
Ratio
P/B
RatioROE
Div
Yield
IOP PMS 27.2 3.7 13.7 0.7
Nifty Free FloatMid Cap 100
39.1 1.8 4.7 0.9
DCB Bank
Aegis Logistics
AU Small Finance
Birla Corpn.
Quess Corp
Gabriel India
Dishman Carbogen
Can Fin Homes
TTK Prestige
Blue Star
Others
10.3
8.0
7.9
7.3
5.9
5.7
5.3
4.9
4.8
4.7
35.4
Top 10 Holdings
Stocks Allocation
Fund Stylometer
Mean
Reversion
Value Blended Growth Earnings
Momentum
ParticularsP/E
Ratio
P/B
RatioROE
Div
Yield
NTDOP PMS 35.2 5.6 15.9 0.6
Nifty Free FloatMid Cap 100
39.1 1.8 4.7 0.9
Kotak Mah. Bank
Voltas
Bajaj Fin.
Page Industries
Eicher Motors
City Union Bank
Max Financial
Bosch
Bharat Forge
Godrej Inds.
Others
12.3
9.7
8.7
8.6
6.6
4.5
4.3
4.1
4.1
4.0
33.0
Top 10 Holdings
Stocks Allocation
Fund Stylometer
Mean
Reversion
Value Blended Growth Earnings
Momentum
ParticularsP/E
Ratio
P/B
RatioROE
Div
Yield
Value PMS 24.9 4.7 18.8 0.9
Nifty 50 23.3 3.1 13.4 1.6 0
50
100
150
200
250
300
26.5x
10.6x
Ma
r-0
3
Ju
n-0
4
Se
p-0
5
De
c-0
6
Ma
r-0
8
Ju
l-0
9
Oct-1
0
Ja
n-1
2
Ap
r-1
3
Ju
l-1
4
Oct-1
5
Ja
n-1
7
Ap
r-1
8
Value Nifty 50
HDFC Bank
Kotak Mah. Bank
AU Small Finance
Bharat Forge
Eicher Motors
B P C L
Larsen & Toubro
Bajaj Finserv
H D F C
Sun Pharma.Inds.
Others
10.3
8.8
7.1
6.7
6.6
6.4
5.7
5.7
5.6
5.1
37.1
Top 10 Holdings
Stocks Allocation
Value PMS
NTDOP PMS
IOP PMS
5.9x
2.4x
0
10
20
30
40
50
60
70D
ec-0
7
De
c-0
8
De
c-0
9
Ja
n-1
1
Ja
n-1
2
Fe
b-1
3
Fe
b-1
4
Ma
r-1
5
Ma
r-1
6
Ma
r-1
7
Ap
r-1
8
NTDOP Nifty Midcap 100
3.5x
2.8x
0
5
10
15
20
25
30
35
40
45
Fe
b-1
0
Se
p-1
0
Ma
r-1
1
Oct-1
1
Ap
r-1
2
No
v-1
2
Ma
y-1
3
De
c-1
3
Ju
n-1
4
Ja
n-1
5
Ju
l-1
5
Fe
b-1
6
Au
g-1
6
Ma
r-1
7
Oct-1
7
Ap
r-1
8
IOP Nifty Midcap 100

MAY 2018 | ISSUE 65 48
Alpha Strategist | “Crossroads”
Fund Stylometer
Mean
Reversion
Value Blended Growth Earnings
Momentum
ParticularsP/E
Ratio
P/B
RatioROE
Div
Yield
IEP PMS
Nifty 500 27.8 2.9 10.5 1.4
41.7 6.9 16.6 0.3
Cholaman.Inv.&Fn
Bajaj Fin.
IndusInd Bank
Bajaj Finserv
Britannia Inds.
Page Industries
MRF
Havells India
Motherson Sumi
Astral Poly
Others
7.5
6.9
6.9
6.6
6.3
5.8
5.4
5.4
5.3
5.1
38.9
Top 10 Holdings
Stocks Allocation
ASK PMS
IEP PMS
Motilal Oswal Focused Multicap Opportunities Fund (AIF)*
Fund Stylometer
Mean
Reversion
Value Blended Growth Earnings
Momentum
ParticularsP/E
Ratio
P/B
RatioROE
Div
Yield
MO AIF 37.1 4.3 11.7 0.5
Nifty 500 27.8 2.9 10.5 1.4
Quess Corp
Voltas
Kotak Mah. Bank
DCB Bank
Asian Paints
Godrej Inds.
Federal Bank
Birla Corpn.
Colgate-Palm.
AU Small Finance
Others
12.0
10.4
9.7
8.8
7.5
6.6
6.3
6.1
6.0
5.3
21.3
Top 10 Holdings
Stocks Allocation
Fund Stylometer
Mean
Reversion
Value Blended Growth Earnings
Momentum
ParticularsP/E
Ratio
P/B
RatioROE
Div
Yield
IOP 2 PMS 36.4 5.4 14.9 0.4
Nifty Free FloatMid Cap 100
39.1 1.8 4.7 0.9
Cholaman.Inv.&Fn
Godrej Agrovet
GRUH Finance
Coffee Day Enter
Bajaj Electrical
Avanti Feeds
HEG
Ipca Labs.
Century Ply.
JK Lakshmi Cem.
Others
8.3
7.3
7.3
6.8
6.5
6.4
6.2
5.8
5.5
5.3
34.6
Top 10 Holdings
Stocks Allocation
IOP 2 PMS
4.9x
2.3x
0
10
20
30
40
50
60
Ja
n-1
0
De
c-1
0
No
v-1
1
Oct-1
2
Se
p-1
3
Ju
l-1
4
Ju
n-1
5
Ma
y-1
6
Ap
r-1
7
Ma
r-1
8ASK IEP BSE 500
Performance (since March 1, 2017)
11.9% 12.3%
18.4%
MO AIF B1 MO AIF B2 BSE 200
12.7%
2.9%
IOP V2 Nifty Midcap FF100
Performance (since Feb 05, 2018)
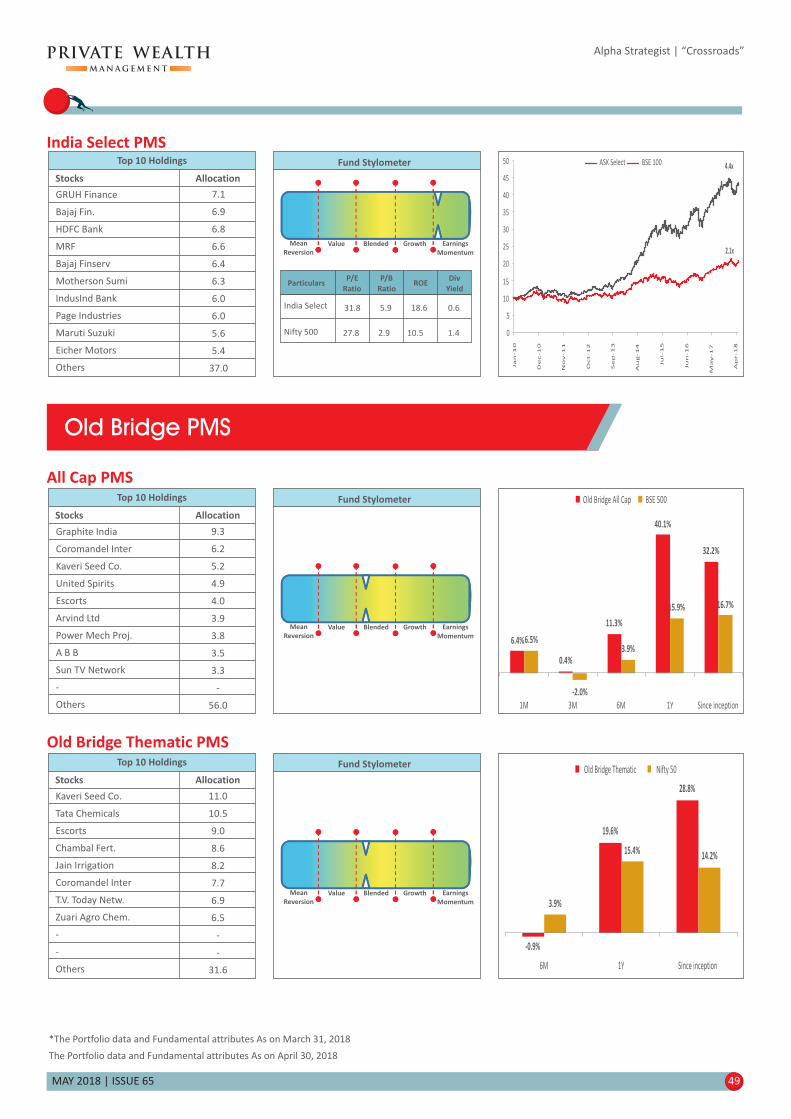
MAY 2018 | ISSUE 65 49
Alpha Strategist | “Crossroads”
*The Portfolio data and Fundamental attributes As on March 31, 2018
The Portfolio data and Fundamental attributes As on April 30, 2018
Fund Stylometer
Mean
Reversion
Value Blended Growth Earnings
Momentum
Kaveri Seed Co.
Tata Chemicals
Escorts
Chambal Fert.
Jain Irrigation
Coromandel Inter
T.V. Today Netw.
Zuari Agro Chem.
-
-
Others
11.0
10.5
9.0
8.6
8.2
7.7
6.9
6.5
-
-
31.6
Top 10 Holdings
Stocks Allocation
Fund Stylometer
Mean
Reversion
Value Blended Growth Earnings
Momentum
Graphite India
Coromandel Inter
Kaveri Seed Co.
United Spirits
Escorts
Arvind Ltd
Power Mech Proj.
A B B
Sun TV Network
-
Others
9.3
6.2
5.2
4.9
4.0
3.9
3.8
3.5
3.3
-
56.0
Top 10 Holdings
Stocks Allocation
Old Bridge PMS
Old Bridge Thematic PMS
All Cap PMS
Fund Stylometer
Mean
Reversion
Value Blended Growth Earnings
Momentum
ParticularsP/E
Ratio
P/B
RatioROE
Div
Yield
India Select 31.8 5.9 18.6 0.6
Nifty 500 27.8 2.9 10.5 1.4
GRUH Finance
Bajaj Fin.
HDFC Bank
MRF
Bajaj Finserv
Motherson Sumi
IndusInd Bank
Page Industries
Maruti Suzuki
Eicher Motors
Others
7.1
6.9
6.8
6.6
6.4
6.3
6.0
6.0
5.6
5.4
37.0
Top 10 Holdings
Stocks Allocation
India Select PMS
4.4x
2.1x
0
5
10
15
20
25
30
35
40
45
50
Ja
n-1
0
De
c-1
0
No
v-1
1
Oct-1
2
Se
p-1
3
Au
g-1
4
Ju
l-1
5
Ju
n-1
6
Ma
y-1
7
Ap
r-1
8
ASK Select BSE 100
6.4%
0.4%
11.3%
40.1%
32.2%
6.5%
-2.0%
3.9%
15.9% 16.7%
1M 3M 6M 1Y Since inception
Old Bridge All Cap BSE 500
-0.9%
19.6%
28.8%
3.9%
15.4% 14.2%
6M 1Y Since inception
Old Bridge Thematic Nifty 50

Real Estate Offering
MAY 2018 | ISSUE 65 50
Alpha Strategist | “Crossroads”
India Realty Excellence Fund IV
2010 2011 2012 2013 2014 2015 2016 2017 2018 2019 2020 2021 2022 2023 2024 2025
Supply had
overtaken demand
Inventory levels peaked
and average price
growth slowed down
Demand expected to
outpace supply leading to
fall in inventory level
Inventory expected to
bottom-out and prices
expected to rise
Higher demand &
rising prices will lead
to more supply
Fund’s Investment
Period
Fund’s Exit
Timeline
Investment Strategy
City Strategy• City focus: MMR, Delhi NCR,
Bengaluru, Pune, Chennai &
Hyderabad
• City concentration (except MMR &
Bengaluru): <30% of fund
size
Project Strategy• Residential segment with focus on
affordable segment
• Commercial projects (selectively)
• Single project concentration: <20% of
fund size
Developer Strategy• Established & dominant players in
each micro-market having good
execution capability
• Investment with a developer group not
to exceed 20% of Fund Size
Investment Structure Strategy• Mezzanine Investments (~50%):
Downside protection with regular
coupon along with equity kicker
• Structured equity (up to 50%):
Enhanced returns by undertaking
equity investments with reputed
developers
iref IV
Target Fund Size Rs. 1500 cr (incl. green-shoe option of Rs. 500 cr)
Hurdle Rate 10% IRR (pre-tax)
Target Return 22-24%
Minimum Commitment Rs. 1 cr
Sponsor & team Commitment 10% of aggregate Capital Commitments received by the Fund, subject to a minimum Capital
Commitment of Rs. 50 cr and maximum of Rs. 100 cr
Tenure 5 Y from the date of the final closing subject to two additional 1 year extensions
Commitment Period 2 Y from final closing (extendable by 1Y)
Management Fees• Rs. 1 cr to 10 cr: 2.0% p.a.
• > Rs. 10 cr to 25 cr: 1.75% p.a.
• > Rs. 25 cr: 1.50% p.a.
Carried interest (with catch up) • Rs. 1 cr to 10 cr: 15.0% p.a.
• > Rs. 10 cr to 25 cr: 12.50% p.a.
• > Rs. 25 cr: 10.0% p.a.
Key Terms
Capturing the real estate recovery cycle

MAY 2018 | ISSUE 65 51
Debt Offering
Alpha Strategist | “Crossroads”
BOI AXA Corporate Credit Spectrum
A niche opportunity for seasoned investors to participate in open ended high yield debt fund which aims to provide
superior risk adjusted returns by investing in structured corporate credit & vanilla issuances across the credit spectrum.
Expertise of global
investment firm
Niche
Opportunity
Skin in the
game
Quality &
Security
• Returns linked to at time of
maturity
• as compared to plain vanilla credit oriented and real estate
debt funds
pre determined coupons plus equity premium
Attractively positioned
• for identification, evaluation, diligence and
structuring of opportunities
• The firm has expertise in managing assets across multiple asset classes
• In India, the firm has
Tie up with global investment firm
5 yr track record in structured credit & private lending
• The global investment firm in the deals through NBFC /AIF
platform which is USD 2.5 Bn
• BOI AXA fund gets to participate in the deal through water fall mechanism.
• of Rs. 75 Crs in BOI AXA fund
invests its own capital
AXA has a seed capital
• The global investment firm provides to companies
whose underlying business is strong & thus
• like real estate/infrastructure
• to the company , thus would have ‘ ’
holistic financial solutions
the firm has the confidence of owning
the equity
Focus on promoter quality & avoid stressed sectors
Major lender pari passu to the pledged assets
AUM Rs. 1495
Average Maturity 2.4 yrs
Modified Duration 1.5 yrs
YTM 11.3%
Portfolio as on 30th April 2018AAA/A1+
32%
AA/AA-
22%
A & Below
29%
Unrated
13%
Cash
4%
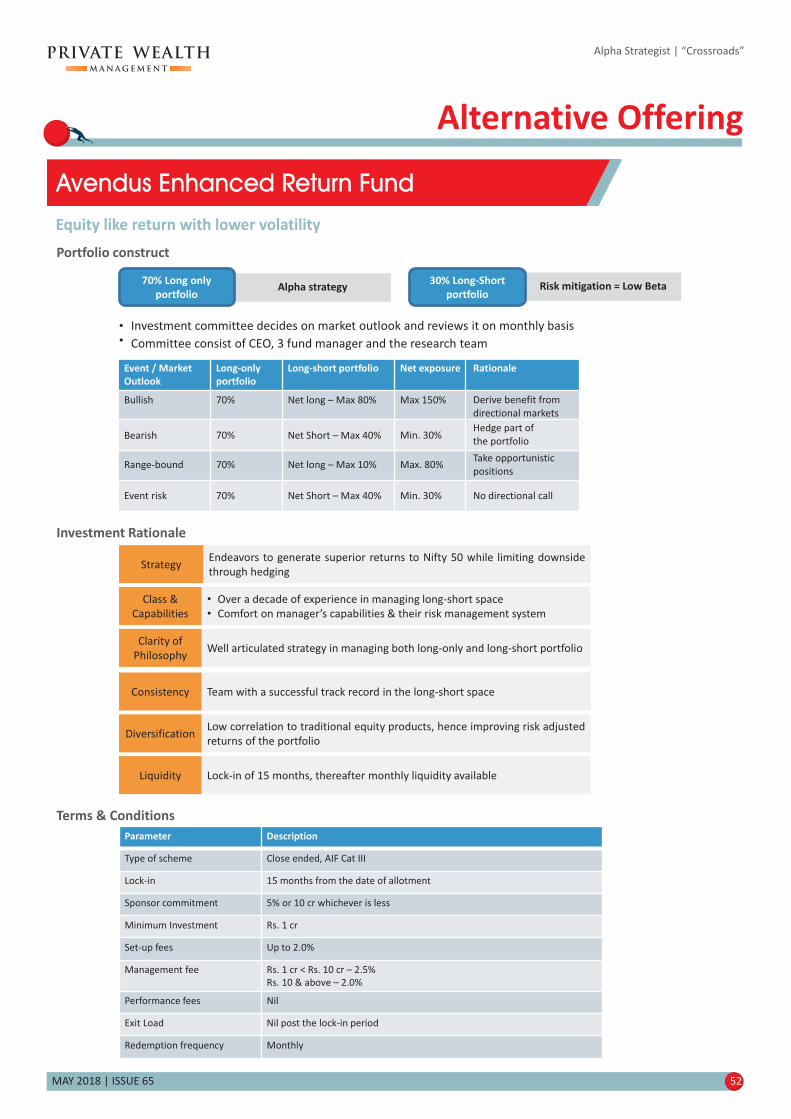
Alternative Offering
MAY 2018 | ISSUE 65 52
Alpha Strategist | “Crossroads”
Equity like return with lower volatility
Portfolio construct
Alpha strategy70% Long only
portfolioRisk mitigation = Low Beta
30% Long-Short
portfolio
• Investment committee decides on market outlook and reviews it on monthly basis• Committee consist of CEO, 3 fund manager and the research team
Endeavors to generate superior returns to Nifty 50 while limiting downside
through hedgingStrategy
Team with a successful track record in the long-short spaceConsistency
Lock-in of 15 months, thereafter monthly liquidity availableLiquidity
Low correlation to traditional equity products, hence improving risk adjusted
returns of the portfolioDiversification
Well articulated strategy in managing both long-only and long-short portfolioClarity of
Philosophy
• Over a decade of experience in managing long-short space
• Comfort on manager’s capabilities & their risk management system
Class &
Capabilities
Investment Rationale
Terms & Conditions
Parameter Description
Type of scheme Close ended, AIF Cat III
Lock-in 15 months from the date of allotment
Sponsor commitment 5% or 10 cr whichever is less
Minimum Investment Rs. 1 cr
Set-up fees Up to 2.0%
Management fee Rs. 1 cr < Rs. 10 cr – 2.5%
Rs. 10 & above – 2.0%
Performance fees Nil
Exit Load Nil post the lock-in period
Redemption frequency Monthly
Avendus Enhanced Return Fund
Event / Market
Outlook
Long-only
portfolio
Long-short portfolio Net exposure Rationale
Bullish 70% Net long – Max 80% Max 150%
Bearish 70% Net Short – Max 40% Min. 30%
Range-bound 70% Net long – Max 10% Max. 80%
Event risk 70% Net Short – Max 40% Min. 30% No directional call
Hedge part of
the portfolio
Derive benefit from
directional markets
Take opportunistic
positions

MAY 2018 | ISSUE 65 53
Fund InsightLarge Cap Funds
Alpha Strategist | “Crossroads”
Positioning of Large Cap Funds
Period : Apr 2015 - Mar 2018
Top 5 Sector
Top 5 Sector
23.3 3.1 13.4 1.6
Fund Stylometer
Mean
Reversion
Value Blended Growth Earnings
Momentum
ParticularsP/E
Ratio
P/B
RatioROE
Div
Yield
Fund
Nifty 50
23.3 3.1 13.4 1.6
Fund Stylometer
Mean
Reversion
Value Blended Growth Earnings
Momentum
ParticularsP/E
Ratio
P/B
RatioROE
Div
Yield
Fund
Nifty 50
HDFC Bk
ICICI Bk
Infosys
ITC
L & T
Maruti
Yes Bk
HCL
M & M
HDFC Ltd
Others
7.4
5.0
4.7
4.6
2.8
2.8
2.5
2.2
2.2
2.2
63.6
Top 10 Holdings
Stocks Allocation
HDFC Bk
ICICI Bk
Infosys
ITC
L & T
Maruti
Yes Bk
HCL
M & M
HDFC Ltd
Others
7.4
5.0
4.7
4.6
2.8
2.8
2.5
2.2
2.2
2.2
63.6
Top 10 Holdings
Stocks Allocation
Aditya Birla SL Focused Equity Fund - Mahesh Patil)
Aditya Birla SL Frontline Eq Fund (Fund Manager - Mahesh Patil)
21.4 3.0 13.8 1.3
20.4 3.1 15.4 1.4
34.7
12.4
10.4
9.1
8.2
Financial Cons GoodsIT Energy Auto
34.7
12.4
10.4
9.1
8.2
Financial Cons GoodsIT EnergyAuto
19.9
18.8
17.6
22.8
17.7
14.3
18.0
20.0
22.0
24.0
26.0
28.0
30.0
32.0
34.0
36.0
38.0
2.0 3.0 4.0 5.0 6.0 7.0 8.0 9.0
3 yrs Average P/B
Aditya Birla SL Frontline Equity Aditya Birla SL Top 100 ICICI Pru Focused Bluechip Equity
MOST Focused 25 SBI BlueChip Nifty 50
3 y
rs A
vera
ge
P/E
Bubble size
3 yrs Average RoE
High P/B
Low P/E
Low P/B

28.4
14.7
11.9
9.0
7.8
Financial EnergyAuto IT Cons Goods
MAY 2018 | ISSUE 65 54
Alpha Strategist | “Crossroads”
Top 5 Sector
ICICI Pru Focused BlueChip Eq Fund (Fund Manager – Sankaran Naren)
Most Focused 25 Fund* (Fund Manager – Siddharth Bothra)
SBI BlueChip Fund (Fund Manager – Sohini Andani)
ICICI Bk
HDFC Bk
Infosys
SBI
Motherson
ITC
L & T
Maruti
Power Grid
NTPC
Others
6.8
6.1
4.4
3.9
3.8
3.7
3.6
3.3
3.3
3.1
58.0
Top 10 Holdings
Stocks Allocation
HDFC Bk
L & T
M & M
ITC
Nestle
Chola Invest & Fin
IndusInd Bk
Kotak Bk
Ultratech Cement
HDFC Ltd
Others
8.0
5.6
4.1
3.8
3.4
2.7
2.6
2.6
2.5
2.5
62.3
Top 10 Holdings
Stocks Allocation
Top 5 Sector
Fund Stylometer
Mean
Reversion
Value Blended Growth Earnings
Momentum
ParticularsP/E
Ratio
P/B
RatioROE
Div
Yield
Fund
Nifty 50
Mean
Reversion
Value Blended Growth Earnings
Momentum
Fund Stylometer
ParticularsP/E
Ratio
P/B
RatioROE
Div
Yield
Fund
Nifty 50
23.3 3.1 13.4 1.6
23.3 3.1 13.4 1.6
22.2 2.9 13.2 1.3
24.8 3.8 15.3 1.0
32.0
11.4
9.1
7.5
6.9
Financial Auto Cons GoodsConstruction Pharma
Top 5 Sector
HDFC Bk
Maruti
HDFC Ltd
HDFC Life Insur
ICICI Lombard
ABB
Britannia
Container Corp
Kotak Bk
Eicher
Others
9.3
9.0
7.3
6.6
6.1
5.4
5.4
5.2
4.8
4.2
36.8
Top 10 Holdings
Stocks Allocation
Mean
Reversion
Value Blended Growth Earnings
Momentum
Fund Stylometer
ParticularsP/E
Ratio
P/B
RatioROE
Div
Yield
Fund
Nifty 50 23.3 3.1 13.4 1.6
29.7 5.4 18.0 0.9
41.6
15.9
12.8
5.45.4
Financial AutoCons Goods Cap Goods IT

MAY 2018 | ISSUE 65 55
Alpha Strategist | “Crossroads”
Multi Cap Funds
Top 5 Sector
Top 5 Sector
Aditya Birla SL Equity Fund (Fund Manager - Anil Shah)
Franklin India Prima Plus Fund (Fund Manager - Anand Radhakrishnan)
HDFC Bk
ICICI Bk
ITC
Maruti
Tata Chemicals
Infosys
Tata Steel
Bharat Forge
Dabur
Hindalco
Others
6.1
4.8
3.9
3.6
3.4
3.2
3.2
2.7
2.4
2.4
64.2
Top 10 Holdings
Stocks Allocation
HDFC Bk
Infosys
Bharti
Yes Bk
L & T
ICICI Bk
M & M
Kotak Bk
Axis Bk
HCL
Others
8.7
5.2
4.6
4.3
3.9
3.8
3.7
3.3
3.1
2.8
56.6
Top 10 Holdings
Stocks Allocation
Mean
Reversion
Value Blended Growth Earnings
Momentum
Fund Stylometer
ParticularsP/E
Ratio
P/B
RatioROE
Div
Yield
Fund
Nifty 500 27.8 2.9 10.5 1.4
Mean
Reversion
Value Blended Growth Earnings
Momentum
Fund Stylometer
ParticularsP/E
Ratio
P/B
RatioROE
Div
Yield
Fund
Nifty 500 27.8 2.9 10.5 1.4
20.8 2.8 13.7 1.0
22.2 3.4 15.2 1.0
20.1
13.1
15.9
17.3
16.6
24.2
21.9
13.8
11.4
16.7
20.0
22.0
24.0
26.0
28.0
30.0
32.0
34.0
36.0
2.0 3.0 4.0 5.0 6.0 7.0 8.0 9.0 10.0
3 yrs Average P/B
Aditya Birla SL Equity Franklin India High Growth Cos Franklin India Prima PlusICICI Pru Multicap ICICI Pru Value Discovery MOSt Focused Multicap 35Invesco India Contra L&T India Value Fund Nifty 500
Kotak Select Focus Fund
High P/B
Low P/E
Low P/B
3 y
rs A
vera
ge P
/E
Positioning of Multi Cap Funds
Period : Apr 2015 - Mar 2018
26.9
10.5
10.0
10.0
7.9
Financial IT AutoPharma Cons Goods
15.4
12.910.4
9.9
6.5
Cap Goods TextilesChemicals Others Metal

MAY 2018 | ISSUE 65 56
Alpha Strategist | “Crossroads”
Top 5 Sector
Top 5 Sector
Top 5 Sector
Franklin India Focus Equity Fund (Fund Manager - Roshi Jain)
ICICI Pru Value Discovery Fund (Fund Manager - Mrinal Singh)
ICICI Prudential Multicap Fund (George Heber Joseph, Atul Patel)
SBI
HDFC Bk
Axis Bk
ICICI Bk
Bharti
IOC
Whirlpool
NTPC
BPCL
Sanofi
Others
9.0
8.9
8.2
7.5
6.2
4.1
3.4
3.4
3.2
2.9
43.4
Top 10 Holdings
Stocks Allocation
Sun Pharma
Wipro
Infosys
NTPC
M & M
Power Grid
HDFC Bk
ITC
SBI
IOC
Others
10.4
5.8
5.6
5.2
5.0
4.7
4.6
4.0
3.0
3.0
48.6
Top 10 Holdings
Stocks Allocation
Infosys
HDFC Ltd
Sun Pharma
ICICI Bk
SBI
GAIL
ITC
Dabur
Cummins
Motherson
Others
5.2
5.1
5.1
4.9
4.9
4.2
4.1
3.9
3.7
3.6
55.3
Top 10 Holdings
Stocks Allocation
Mean
Reversion
Value Blended Growth Earnings
Momentum
Fund Stylometer
ParticularsP/E
Ratio
P/B
RatioROE
Div
Yield
Fund
Nifty 500 27.8 2.9 10.5 1.4
27.8 2.9 10.5 1.4
Mean
Reversion
Value Blended Growth Earnings
Momentum
Fund Stylometer
ParticularsP/E
Ratio
P/B
RatioROE
Div
Yield
Fund
Nifty 500
Fund Stylometer
ParticularsP/E
Ratio
P/B
RatioROE
Div
Yield
Fund
Nifty 500
Earnings
Momentum
Mean
ReversionValue GrowthBlended
27.8 2.9 10.5 1.4
21.5 2.7 12.5 1.3
18.9 3.0 15.7 1.4
22.7 3.9 17.0 1.4
19.8
13.911.2
9.9
8.8
Financial Auto Cons Goods
Cap Goods Others
17.1
14.914.7
8.9
8.7
Financial Cap GoodsCons Goods Others Auto
15.4
12.910.4
9.9
6.5
Cap Goods TextilesChemicals Others Metal
Top 5 Sector
Invesco India Contra Fund (Fund Manager - Taher Badshah, Amit Ganatra)
HDFC Bk
RIL
HDFC Ltd
ITC
ICICI Bk
M & M
Infosys
Cipla
Cyient
HCL
Others
7.0
5.2
5.0
4.5
4.2
3.8
3.8
3.7
3.3
3.3
56.1
Top 10 Holdings
Stocks Allocation
23.1 3.3 14.3 1.0
Fund Stylometer
Mean
Reversion
Value Blended Growth Earnings
Momentum
ParticularsP/E
Ratio
P/B
RatioROE
Div
Yield
Fund
Nifty 500 27.8 2.9 10.5 1.4
13.9
12.9
12.6
12.6
6.8
Financial ConstructionCap Goods Others Cons Goods

Alpha Strategist | “Crossroads”
MAY 2018 | ISSUE 65 57
Top 5 Sector
L&T India Value Fund (Fund Manager - Venugopal M)
RIL
HDFC Ltd
L & T
DiviS Lab
ITC
HCL
Ramco Cements
Future Retail
Federal Bk
Jindal Steel & Power
3.8
3.5
3.3
2.8
2.7
2.2
2.1
2.1
2.1
2.0
73.5
Top 10 Holdings
Stocks Allocation
22.3 2.9 13.0 1.2
Fund Stylometer
Mean
Reversion
Value Blended Growth Earnings
Momentum
ParticularsP/E
Ratio
P/B
RatioROE
Div
Yield
Fund
Nifty 500 27.8 2.9 10.5 1.4
Top 5 Sector
MOSt Focused Multicap 35 Fund* (Fund Manager - Gautam Sinha Roy)
HDFC Ltd
Maruti
HDFC Bk
IndusInd Bk
Interglobe Aviation
HPCL
BPCL
Eicher
Bajaj Finance
United Spirits
Others
9.2
7.7
7.7
5.1
4.7
4.7
4.5
4.3
4.0
4.0
44.0
Top 10 Holdings
Stocks Allocation
Fund Stylometer
Mean
Reversion
Value Blended Growth Earnings
Momentum
ParticularsP/E
Ratio
P/B
RatioROE
Div
Yield
Fund
Nifty 500 27.8 2.9 10.5 1.4
23.4 4.9 20.7 1.1
23.2
21.0
13.4
9.2
9.2
Financial Others Construction
Cap Goods Cons Goods
Top 5 Sector
Kotak Select Focus Fund* (Fund Manager - Harsha Upadhyaya)
HDFC Ltd
HDFC Bk
L & T
RIL
ICICI Bk
IndusInd Bk
Infosys
Hero Moto
Maruti
SBI
Others
9.6
7.4
5.5
4.9
3.9
3.3
3.3
3.3
3.0
2.9
52.9
Top 10 Holdings
Stocks Allocation
Fund Stylometer
Mean
Reversion
Value Blended Growth Earnings
Momentum
ParticularsP/E
Ratio
P/B
RatioROE
Div
Yield
Fund
Nifty 500 27.8 2.9 10.5 1.4
24.9 3.8 15.4 0.9
20.0
18.0
12.0
8.7
5.6
Financial Cap GoodsCons Goods Others Chemicals
14.1
12.7
8.1
7.0
5.6
Cap Goods OthersIT Services Auto
Top 5 Sector
Sundaram Rural & Consumption Fund* (Fund Manager: S. Krishnakumar; S. Bharath)
M & M
HUL
ITC
UPL
NCC
Heritage Foods
SBI
Britannia
Ujjivan Fina
Maruti
Others
4.7
4.6
3.5
3.5
2.5
2.4
2.2
2.2
2.1
2.1
70.1
Top 10 Holdings
Stocks Allocation
Fund Stylometer
Mean
Reversion
Value Blended Growth Earnings
Momentum
ParticularsP/E
Ratio
P/B
RatioROE
Div
Yield
Fund
Nifty 500 27.8 2.9 10.5 1.4
28.1 4.0 14.3 0.9
15.4
12.910.4
9.9
6.5
Cap Goods TextilesChemicals Others Metal

Midcap Fund
Positioning of Midcap Funds
Period : Apr 2015 - Mar 2018
16.6
16.5
14.5
18.9
20.3
7.3
22.0
24.0
26.0
28.0
30.0
32.0
34.0
36.0
38.0
40.0
42.0
44.0
46.0
1.5 2.5 3.5 4.5 5.5 6.5 7.5 8.5 9.53 yrs Average P/B
HDFC Mid-Cap Opportunities Fund Franklin India Prima Fund Sundaram Select Midcap
Kotak Emerging Equity Scheme Motilal Oswal Midcap 30 Fund Nifty Free Float Midcap 100
High P/B
Low P/B
High P/E
Low P/E
Bubble size : 3 yrs Average RoE
3 yr
s Av
erag
e P/
E
MAY 2018 | ISSUE 65 58
Alpha Strategist | “Crossroads”
Top 5 Sector
Top 5 Sector
39.1 1.8 4.7 0.9
Fund Stylometer
Mean
Reversion
Value Blended Growth Earnings
Momentum
ParticularsP/E
Ratio
P/B
RatioROE
Div
Yield
Fund
Nifty Free Float
Mid Cap 100
39.1 1.8 4.7 0.9
Fund Stylometer
Mean
Reversion
Value Blended Growth Earnings
Momentum
ParticularsP/E
Ratio
P/B
RatioROE
Div
Yield
Fund
HDFC Bk
Infosys
Bharti
Yes Bk
L & T
ICICI Bk
M & M
Kotak Bk
Axis Bk
HCL
Others
8.7
5.2
4.6
4.3
3.9
3.8
3.7
3.3
3.1
2.8
56.6
Top 10 Holdings
Stocks Allocation
Sundram Fasteners
Chola Invest & Fin
Balkrishna
Voltas
Hexaware Tech
City Union Bk
TI Financial
Aarti
RBL Bk
Exide
Others
.1
4.1
3.6
3.4
2.8
2.6
2.5
2.5
2.2
2.1
70.1
Top 10 Holdings
Stocks Allocation
Franklin India Prima Fund* (Fund Manager: R. Janakiraman; Hari Shyamsunder)
HDFC Mid-Cap Opportunities Fund* (Fund Manager: Chirag Setalvad; Rakesh Vyas)
16.8 2.5 14.9 0.7
25.7 3.6 14.0 0.8
26.9
10.5
10.0
10.0
7.9
Financial IT AutoPharma Cons Goods
19.8
13.911.2
9.9
8.8
Financial AutoCons Goods Cap Goods
Others Nifty Free Float
Mid Cap 100

Top 5 Sector
Top 5 Sector
Fund Stylometer
Mean
Reversion
Value Blended Growth Earnings
Momentum
ParticularsP/E
Ratio
P/B
RatioROE
Div
Yield
Fund
Fund Stylometer
Mean
Reversion
Value Blended Growth Earnings
Momentum
ParticularsP/E
Ratio
P/B
RatioROE
Div
Yield
Fund
HDFC Bk
Infosys
Bharti
Yes Bk
L & T
ICICI Bk
M & M
Kotak Bk
Axis Bk
HCL
Others
8.7
5.2
4.6
4.3
3.9
3.8
3.7
3.3
3.1
2.8
56.6
Top 10 Holdings
Stocks Allocation
4RBL Bk
Voltas
AU Small Bk
Astral Poly
IndusInd Bk
Nerolac Paints
Bajaj Finance
Indraprastha Gas
Kajaria Ceramics
Quess Corp
Others
6.0
5.3
5.3
5.3
5.3
5.2
5.2
4.8
4.7
4.4
48.5
Top 10 Holdings
Stocks Allocation
Kotak Emerging Equity Fund* (Fund Manager: Pankaj Tibrewal)
Motilal Oswal Midcap 30 Fund* (Fund Manager: Chirag Setalvad; Rakesh Vyas)
43.5 6.9 15.8 0.4
31.4 4.7 15.0 0.6
20.0
18.0
12.0
8.7
5.6
Financial Cap GoodsCons Goods Others Chemicals
23.2
21.0
13.4
9.2
9.2
Financial Others ConstructionCap Goods Cons Goods
MAY 2018 | ISSUE 65 59
Alpha Strategist | “Crossroads”
Top 5 Sector Fund Stylometer
Mean
Reversion
Value Blended Growth Earnings
Momentum
ParticularsP/E
Ratio
P/B
RatioROE
Div
Yield
Fund
Ramco Cements
Sundaram-Clayton
Trent
Quess Corp
Schaeffler
Honeywell Auto
Arvind
Wabco
SRF
Chola Invest & Fin
Others
3.9
3.5
3.0
2.6
2.5
2.5
2.3
2.2
2.2
2.1
73.2
Top 10 Holdings
Stocks Allocation
Sundaram Midcap Fund* (Fund Manager: S. Krishnakumar)
28.6 3.7 12.9 0.7
17.1
14.914.7
8.9
8.7
Financial Cap GoodsCons Goods Others Auto
Nifty Free Float
Mid Cap 10039.1 1.8 4.7 0.9
Nifty Free Float
Mid Cap 10039.1 1.8 4.7 0.9
Nifty Free FloatMid Cap 100
39.1 1.8 4.7 0.9

Small Cap Fund
Positioning of Small cap Funds
Period : Apr 2015 - Mar 2018
MAY 2018 | ISSUE 65 60
Alpha Strategist | “Crossroads”
Top 5 Sector
Top 5 Sector
Fund Stylometer
Mean
Reversion
Value Blended Growth Earnings
Momentum
ParticularsP/E
Ratio
P/B
RatioROE
Div
Yield
Fund
Fund Stylometer
Mean
Reversion
Value Blended Growth Earnings
Momentum
ParticularsP/E
Ratio
P/B
RatioROE
Div
Yield
Fund
Finolex
Aarti
SRF
APL Apollo Tubes
Atul
Eveready
Ipca
Siyaram Silk Mills
Sharda Cropchem
KPR Mill
Others
5.5
4.1
3.5
3.3
3.2
3.0
2.8
2.6
2.5
2.5
67.0
Top 10 Holdings
Stocks Allocation
Finolex
Repco Home Fin
HDFC Bk
Voltas
eClerx Services
Music Broadcast
Nesco
Cyient
Shankara Building
Deepak Nitrite
Others
5.1
2.7
2.4
2.2
2.2
2.2
2.2
2.2
2.0
2.0
74.8
Top 10 Holdings
Stocks Allocation
DSPBR Small Cap Fund* (Fund Manager: Vinit Sambre; Jay Kothari)
Franklin India Smaller Cos Fund* (Fund Manager: R. Janakiraman; Hari Shyamsunder)
22.9 3.3 14.6 0.8
21.9 3.5 16.0 0.7
15.4
12.910.4
9.9
6.5
Cap Goods Textiles
Chemicals Others Metal
13.9
12.9
12.6
12.6
6.8
Financial ConstructionCap Goods Others Cons Goods
15.0 18.3
17.7
7.3
20.0
22.0
24.0
26.0
28.0
30.0
32.0
34.0
36.0
1.5 2.5 3.5 4.5 5.5 6.5
3 yr
s A
vera
ge P
/E
3 yrs Average P/B
Bubble size : 3 yrs Average RoE
High P/B
High P/E
Low P/E
Low P/B
Franklin India Smaller Cos Fund DSPBR Small Cap Fund
HDFC Small Cap Fund Nifty Free Float Midcap 100
Nifty Free FloatMid Cap 100
39.1 1.8 4.7 0.9
Nifty Free FloatMid Cap 100
39.1 1.8 4.7 0.9
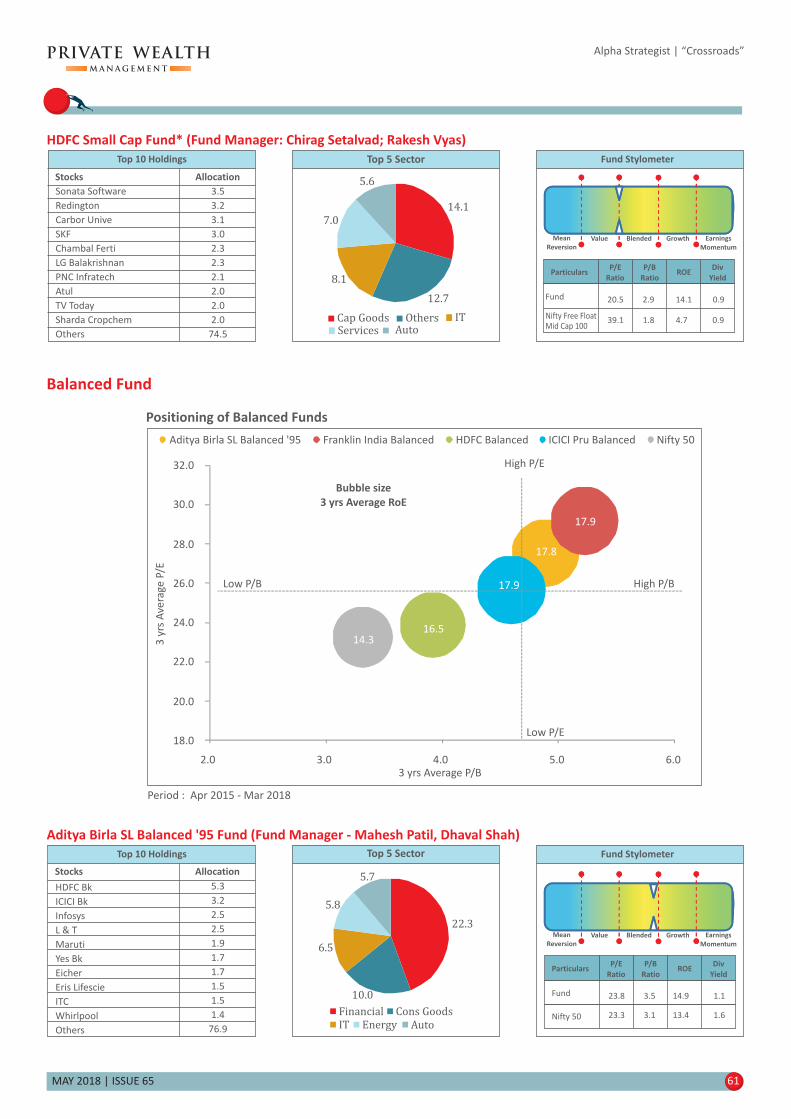
MAY 2018 | ISSUE 65 61
Alpha Strategist | “Crossroads”
Top 5 Sector Fund Stylometer
Mean
Reversion
Value Blended Growth Earnings
Momentum
ParticularsP/E
Ratio
P/B
RatioROE
Div
Yield
Fund
Sonata Software
Redington
Carbor Unive
SKF
Chambal Ferti
LG Balakrishnan
PNC Infratech
Atul
TV Today
Sharda Cropchem
Others
3.5
3.2
3.1
3.0
2.3
2.3
2.1
2.0
2.0
2.0
74.5
Top 10 Holdings
Stocks Allocation
HDFC Small Cap Fund* (Fund Manager: Chirag Setalvad; Rakesh Vyas)
20.5 2.9 14.1 0.9
14.1
12.7
8.1
7.0
5.6
Cap Goods Others ITServices Auto
Nifty Free FloatMid Cap 100
39.1 1.8 4.7 0.9
Balanced Fund
17.8
17.9
16.5
17.9
14.3
18.0
20.0
22.0
24.0
26.0
28.0
30.0
32.0
2.0 3.0 4.0 5.0 6.03 yrs Average P/B
Aditya Birla SL Balanced '95 Franklin India Balanced HDFC Balanced ICICI Pru Balanced Nifty 50
3 y
rs A
vera
ge
P/E
Bubble size
3 yrs Average RoE
High P/B
High P/E
Low P/E
Low P/B
Positioning of Balanced Funds
Period : Apr 2015 - Mar 2018
Top 5 Sector
HDFC Bk
ICICI Bk
Infosys
L & T
Maruti
Yes Bk
Eicher
Eris Lifescie
ITC
Whirlpool
Others
5.3
3.2
2.5
2.5
1.9
1.7
1.7
1.5
1.5
1.4
76.9
Top 10 Holdings
Stocks Allocation
Mean
Reversion
Value Blended Growth Earnings
Momentum
Fund Stylometer
ParticularsP/E
Ratio
P/B
RatioROE
Div
Yield
Fund
Nifty 50
Aditya Birla SL Balanced '95 Fund (Fund Manager - Mahesh Patil, Dhaval Shah)
23.3 3.1 13.4 1.6
23.8 3.5 14.9 1.1
22.3
10.0
6.5
5.8
5.7
Financial Cons Goods
IT Energy Auto
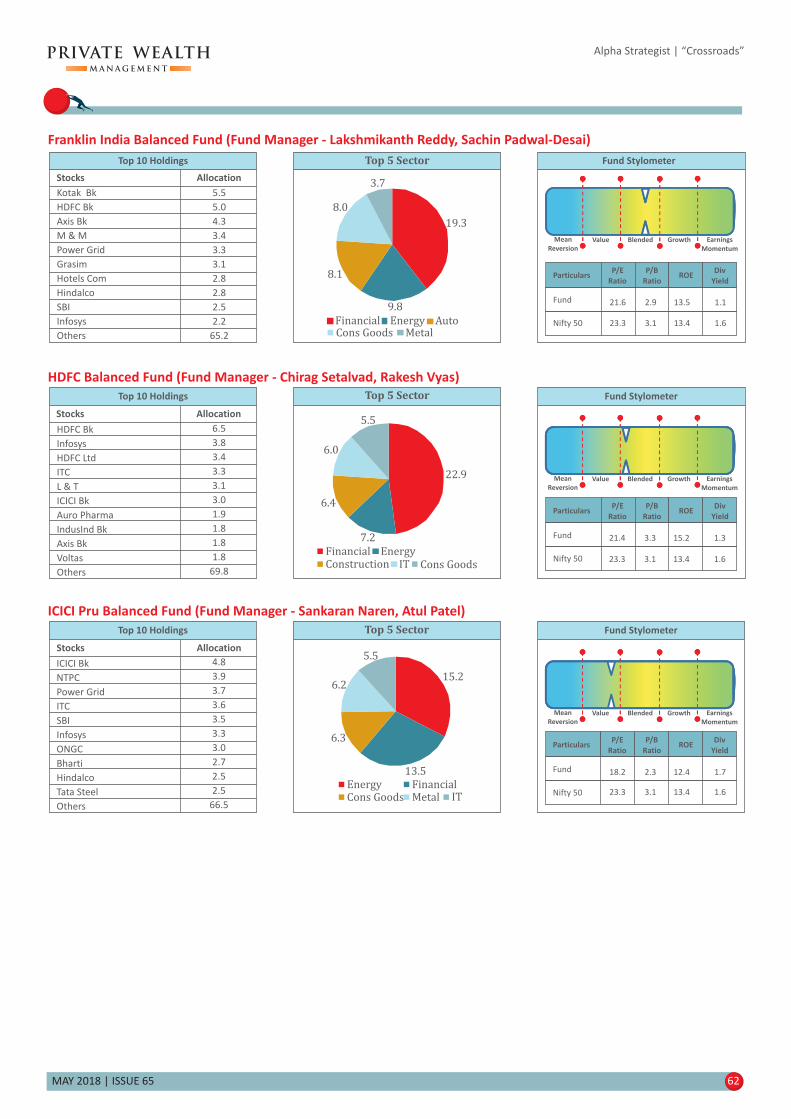
MAY 2018 | ISSUE 65 62
Alpha Strategist | “Crossroads”
Top 5 Sector
Kotak Bk
HDFC Bk
Axis Bk
M & M
Power Grid
Grasim
Hotels Com
Hindalco
SBI
Infosys
Others
5.5
5.0
4.3
3.4
3.3
3.1
2.8
2.8
2.5
2.2
65.2
Top 10 Holdings
Stocks Allocation
Franklin India Balanced Fund (Fund Manager - Lakshmikanth Reddy, Sachin Padwal-Desai)
Mean
Reversion
Value Blended Growth Earnings
Momentum
Fund Stylometer
ParticularsP/E
Ratio
P/B
RatioROE
Div
Yield
Fund
Nifty 50 23.3 3.1 13.4 1.6
21.6 2.9 13.5 1.1
19.3
9.8
8.1
8.0
3.7
Financial Energy AutoCons Goods Metal
Top 5 Sector
Top 5 Sector
HDFC Bk
Infosys
HDFC Ltd
ITC
L & T
ICICI Bk
Auro Pharma
IndusInd Bk
Axis Bk
Voltas
Others
6.5
3.8
3.4
3.3
3.1
3.0
1.9
1.8
1.8
1.8
69.8
Top 10 Holdings
Stocks Allocation
ICICI Bk
NTPC
Power Grid
ITC
SBI
Infosys
ONGC
Bharti
Hindalco
Tata Steel
Others
4.8
3.9
3.7
3.6
3.5
3.3
3.0
2.7
2.5
2.5
66.5
Top 10 Holdings
Stocks Allocation
HDFC Balanced Fund (Fund Manager - Chirag Setalvad, Rakesh Vyas)
ICICI Pru Balanced Fund (Fund Manager - Sankaran Naren, Atul Patel)
Fund Stylometer
ParticularsP/E
Ratio
P/B
RatioROE
Div
Yield
Fund
Nifty 50
Mean
Reversion
Value Blended Growth Earnings
Momentum
23.3 3.1 13.4 1.6
Fund Stylometer
Mean
Reversion
Value Blended Growth Earnings
Momentum
ParticularsP/E
Ratio
P/B
RatioROE
Div
Yield
Fund
Nifty 50 23.3 3.1 13.4 1.6
18.2 2.3 12.4 1.7
21.4 3.3 15.2 1.3
22.9
7.2
6.4
6.0
5.5
Financial EnergyConstruction IT Cons Goods
15.2
13.5
6.3
6.2
5.5
Energy FinancialCons Goods Metal IT

MAY 2018 | ISSUE 65 63
The Portfolio data and Fundamental attributes As on April 30, 2018
*The Portfolio data and Fundamental attributes As on March 31, 2018
Alpha Strategist | “Crossroads”
Portfolio Details
77.0
88.4
86.5
83.0
80.1
76.5
79.5
62.6
71.5
70.7
66.9
38.0
60.1
72.0
41.8
18.6
12.6
2.0
1.8
17.7
2.3
9.2
—
51.0
57.6
53.1
46.1
Scheme Name Large Cap
Equity
Midcap Small cap Sov & AAA AA &equivalent Cash Others
Fixed Income Cash & Others
SBI BlueChip Fund
ICICI Pru BlueChip Equity Fund
Aditya Birla SL Focused Equity Fund
Motilal Oswal Focused 25 Fund
Aditya Birla SL Frontline Equity Fund
Motilal Oswal Multicap 35 Fund
Kotak Select Focus Fund
Franklin India Focused Equity
Franklin India Prima Plus Fund
ICICI Pru Value Discovery Fund
Invesco India Contra Fund
L&T India Value Fund
Aditya Birla SL Equity Fund
ICICI Pru Multicap Fund
Sundaram Rural & Consumption Fund
Motilal Oswal Midcap 30 Fund
Kotak Emerging Opportunites Fund
HDFC Mid-Cap Opportunities Fund
HDFC Small Cap Fund
Franklin India Prima Fund
Sundaram Midcap Fund
Franklin India Smaller Cos Fund
DSPBR Small Cap Fund
Aditya Birla SL Equity Hybrid ’95 Fund
ICICI Pru Equity & Debt Fund
Franklin India Balanced Fund
HDFC Hybrid Fund
15.2
2.6
6.3
15.9
16.4
22.3
15.1
19.6
25.5
13.3
25.0
49.9
30.1
21.3
41.7
80.8
75.7
90.0
42.3
75.2
91.6
53.3
51.4
21.4
7.3
12.5
19.3
—
—
—
—
0.1
—
0.1
5.8
—
0.9
4.6
3.0
0.9
—
12.2
—
8.5
3.3
40.0
3.2
28.1
45.8
2.1
0.5
1.1
1.4
—
5.4
2.4
9.0
1.1
4.8
1.2
2.3
6.9
3.1
0.5
3.5
8.0
8.5
6.7
1.1
0.6
2.2
2.5
15.8
5.9
0.7
8.0
2.3
3.5
5.6
1.8
4.1
1.7
4.7
0.0
—
0.0
—
2.7
—
—
5.0
-
—
—
—
—
—
0.5
1.8
—
—
—
—
—
11.8
14.8
11.8
24.0
—
—
—
—
—
—
—
—
—
—
—
—
—
—
—
—
0.0
0.5
—
—
—
—
—
9.2
11.5
19.7
3.9
in % terms
5.4
2.4
9.0
1.1
4.8
1.2
2.3
6.9
3.1
0.5
3.5
8.0
8.5
6.7
1.1
0.6
2.2
2.5
15.8
5.9
0.7
8.0
2.3
3.5
5.6
1.8
4.1

MAY 2018 | ISSUE 65 64
Notes
Alpha Strategist | “Crossroads”

MAY 2018 | ISSUE 65 65
Notes
Alpha Strategist | “Crossroads”

MAY 2018 | ISSUE 65 66
Notes
Alpha Strategist | “Crossroads”

MAY 2018 | ISSUE 65 67
Motilal Oswal Wealth Management Limited
CIN: U67110MH2002PLC135075
Registered Office Address: Motilal Oswal Tower, Rahimtullah Sayani Road,
Opposite Parel ST Depot, Prabhadevi, Mumbai 400 025
Tel No.: 022 3980 4263; Website: www.motilaloswal.com
Registration details: SEBI PMS Regn No: INP000004409; AMFI Regn No: ARN87554
Please read disclosure document as issued by company from time to time.
Ashish Shanker
Head – Investment Advisory
91 22 3982 5549+
Pradeep Ashok Kumar
Vice President - Financial Strategy
91 22 3010 2353+
Kumarpal Jain
Manager
91 22 3010 2327+
The information, data or analysis does not constitute investment advice or as an offer or solicitation of an offer to purchase or subscribe for any investment or a recommendation and is meantfor your personal information only and suggests a proposition which does not guarantee any returns. Motilal Oswal Wealth Management Ltd (hereinafter referred as MOWML) or any of itsaffiliates is not soliciting any action based upon it. This information, including the data, or analysis provided herein is neither intended to aid in decision making for legal, financial or otherconsulting questions, nor should it be the basis of any investment or other decisions. The historical performance presented in this document is not indicative of and should not be construed asbeing indicative of or otherwise used as a proxy for future or specific investments. The relevant product offering documents should be read for further details. MOWML does not takeresponsibility for authentication of any data or information which has been furnished by you, the entity offering the product, or any other third party which furnishes the data or information.The above mentioned assets are not necessarily maintained or kept in custody of MOWML. The information contained in this statement are updated as and when received as a result of whichthere may be differences between the details contained herein and those reflected in the records of the respective entities or that of yours. In the event where information sent through anyelectronic Media (including but not limited to Net Banking or e-mail) or print do not tally, for whatever reason, with the records available with the entity offering the product or the third partymaintaining such information in each of the foregoing cases, the information with the entity offering the product or third party maintaining such information shall be considered as final. Thebenchmarking shown in document above is a result of the choice of benchmark MOWML uses for the various products. It is possible that some investments offered by the third parties haveother benchmarks and their actual relative under- or out-performance is different from that provided in the statement. The recipient should seek appropriate professional advice includingtax advice before dealing with any realized or unrealized gain / loss reflecting in this statement. The above data, information or analysis is shared at the request of the recipient and is meant forinformation purpose only and is not an official confirmation of any transactions mentioned in the document above. Service related complaints may be acceptable for rectification ofinaccurate data. You should notify us immediately and in any case within 15 days of receipt of this document date if you notice any error or discrepancy in the information furnished above,failing which it would be deemed to have been accepted by you. MOWML reserves the right to rectify discrepancies in this document, at any point of time. The sharing of information inrelation to one’s assets may not be secure and you are required to completely understand the risk associated with sharing such information. The information being shared with MOWML canpose risk of information being stolen and or used by unauthorized persons who do not have the rights to access such information. MOWML or any of its group companies, its employees, andagents cannot be held liable for unauthorized use of such information. Our sales professionals or other employees may provide oral or written views to you that reflect their personal opinionswhich may be contrary to the opinions expressed herein. You should carefully consider whether any information shared herein and investment products mentioned herein are appropriate inview of your investment experience, objectives, financial resources, relevant circumstances & risk appetite. All recipients of this Information should conduct their own investigation andanalysis and should check the accuracy, reliability and completeness of the Information .This Information is distributed upon the express understanding that no part of the information hereincontained has been independently verified. Further, no representation or warranty expressed or implied is made nor is any responsibility of any kind accepted with respect to thecompleteness or accuracy of any information as may be contained herein. Also no representation or warranty expressed or implied is made that such information remains unchanged in anyrespect as of any date or dates after those stated herein with respect to any matter concerning any statement made herein above. In no event will MOWML and their officers, directors,personnel, employees or its affiliates and group company be liable for any damages, losses or liabilities including without limitation, direct or indirect, special, incidental, consequentialdamages, losses or liabilities, in connection with your use of the information mentioned in this document or your reliance on or use or inability to use the information contained in thisdocument, even if you advise us of the possibility of such damages, losses or expenses. The contents of this document do not have any contractual value. The information contained in thisdocument is confidential in nature and you are receiving all such information on the express condition of confidentiality. If you are not the intended recipient, you must not disclose or use theinformation in this document in any way whatsoever. If you received it in error, please inform us immediately by return e-mail and delete the document with no intention of its being retrievedby you. We do not guarantee the integrity of any e-mails or attached files and are not responsible for any changes made to them. This report and information therein is not directed orintended for distribution to, or use by, any person or entity who is a citizen or resident of or located in any locality, state, country or other jurisdiction, where such distribution, publication,availability or use would be contrary to law, regulation or which would subject MOWML and affiliates to any registration or licensing requirement within such jurisdiction. The informationcontained herein is strictly confidential and meant solely for the selected recipient and may not be altered in any way, transmitted to, copied or distributed, in part or in whole, to any otherperson or to the media or reproduced in any form, without prior written consent of MOWML.MOWML in the course of conduct of its business activity may have financial, business or otherinterest in other entities including the subject mentioned herein, however MOWML encourages independence in preparing this information and strives to minimize conflict in preparation ofthe above information. MOWML does not have material conflict of interest at the time of publication of this information. While every effort has been made to ensure that the informationprovided herein is accurate, timely, secure and error-free, MOWML, their directors, promoters, employees, agents and assigns shall not in any way be responsible for any loss or damagesarising in any contract, tort or otherwise from the use or inability to use this information and its contents. Any material downloaded or otherwise obtained through the use of the website oremail is at your own discretion and risk and you will be solely responsible for any damage that may occur to your computer systems and data as a result of download of such material. Anyinformation sent from MOWML to an e-mail account or other electronic receiving communication systems/ servers, is at your risk and if the same is lost, incorrectly received, or sent to theincorrect e-mail or are accessible to third parties, MOWML is not and cannot be responsible or made liable for such transmission.
“©
“
use. CRISIL has taken due care and caution in computation of the Indices, based on the data obtained from sources, which it considers reliable. However, CRISIL does
not guarantee the accuracy, adequacy or completeness of the Indices and is not responsible for any errors or for the results obtained from the use of the Indices.
CRISIL especially states that it has no financial liability whatsoever to the Licensee / users of CRISIL Indices.”
2013 CRISIL Limited. All Rights Reserved.
CRISIL Indices are the sole property of CRISIL Limited (CRISIL). CRISIL Indices shall not be copied, retransmitted or redistributed in any manner for any commercial
Safe Harbor
Alpha Strategist | “Crossroads”

Motilal Oswal Tower, 6th Floor, Junction of Gokhale & Sayani Road, Prabhadevi, Mumbai - 400 025.
Ahmedabad | Bangalore | Chennai | Hyderabad | Kolkata | Mumbai | New Delhi | Pune
Email: [email protected]