“aleksa santic” jsc, aleksa santic - priv.rs · geografical location of joint-stock...
TRANSCRIPT

“Aleksa Santic” JSC,Aleksa Santic
Capital structure (in%)
Shareholders’ fund 0.13Privatization Agency 70.00Others 29.87
General Information
Full legal name Joint-stock agricultural company “Aleksa Santic”
Address No. 3 Solunskih Dobrovoljaca Street
Identification Number 08166978
Core activity Cultivation of wheat, other crops and plants
Foundation Year 1958
Number of Employees 221

Distance form the Company to:
General Information
Belgrade 180 km
Regional Center 25 km
Main road 0 km
Port 40 km
Railway 0 km

Location
Geografical location of Joint-stock agricultural company “Aleksa Santic” is of strategic importance in the market area of soughteaste Europe and provides oportunity for intensive busines coperation. Majdanpek is a town and municipality in Bor District of Serbia.
Pan-European Transport CorridorsALEkSA SANtIC

tradition
On surfaces district of village Aleksa Santic in 1946 formed two farms and one on what was then the territory of atara Čonoplja So in Aleksa Santic formed State farm “North” and the State farm “exemption” in the area Čonopljanski State farm “9 May”.
In 1953, merged the PD North and PD liberation into a single enterprise Agricultural well Unity which was not long-lived because in 1954, separated.
Year 1958 is a milestone for the PD Aleksa Santic. that year, there is a connection, the North, Liberation and “9 May” in a single farm: agricultural-industrial complex “Aleksa Santic” - the largest farm in this part of Vojvodina, with 6,792 ha of land. PIk “Aleksa Santic” and in 1962 merged with the agricultural cooperative of Aleksa Santic, and a unified whole social sector of agriculture.

Production/Services
FIELD
POMOLOGY
ANIMAL HUSBANDRY
COOPERAtION
REtAILERS
VEtERINARY StAtION
SERVICES

Certificates
Quality assurance certificate ISO 9001Company does not own quality assurance certificate ISO 9001.
EcologyAccording to applicable regulations, the requirements for environment protection are not fulfilled.

Production
Product / services Unit Quantity Value in EUR
2011 2012 2012 2011 2012 2013
Wheat kg 5,052 4,343 5,345 907.762 1.083.658 992.853
Winter barley kg 2,169 1,636 2,577 429.829 378.762 532.860
Sunflower kg 1,277 1,360 1,802 390.526 716.078 451.047
Soy kg 1,229 218 305 422.712 143.185 131.182
Sugar beet kg 30,393 17,914 19,050 1.336.896 765.236 855.631
Commercial corn kg 6,383 1,703 2,421 1.037.061 312.039 386.359
Commercial corn - trench silo kg 0 0 2,416 0 0 265.269
Seed corn kg 242 62 211 202.215 58.008 255.091
Sour cherry kg 200 95 220 106.813 100.114 125.878
Plum kg 116 35 195 14.469 7.425 19.486
Fattening pigs kg 510 662 698 657.659 1.103.460 1.159.996
Cull sows kg 37 35 36 38.990 47.582 48.050
Pigs (cages) kg 0 0 8 0 0 17.441
Fattening pigs-light kg 0 0 20 0 0 28.631

Land / Buildings / Livestock
Agricultural land-type of right:ownership/type of ownership:private: 732 ha
Agricultural land- type of right:lease/ type of ownership:state: 2,881 ha
Buildings: Total surface-78.955 m2
Livestock: Balance state on March 12th 2014; Pigs 7,307 Pcs

Production and Capacity
Machine (Production line) Unit Installed capacity Real capacity % of utilization
2011 2012 2013
New silo t 18000 15000 70.00 50.00 50.00Ground storages t 7500 7500 20.00 20.00 20.00Trench silo t 4500 5000 70.00Drying unit IVSK 2x12 t 2x12 t/č 2x10 t/č 40.00 30.00 40.00Fodder mixer t 10 t/č 7 t/č 30.00 30.00 30.00Hammer mill I t 4 t/č 4 t/č 30.00 30.00 30.00Hammer mill II t 4 t/č 4 t/č 30.00 30.00 30.00Hammer mill PSA 160t t 45 t/č 35 t/č Tractor JD 8320-I pcs 185,9 kw 185,9 kw 90.00 90.00 90.00Tractor JD 8320-II pcs 185,9 kw 185,9 kw 75.00 80.00 80.00Combine JD CTS9780i pcs 243.4 kw 243.4 kw 85.00 85.00 85.00Combine JD CTS9780hm pcs 243.4 kw 243.4 kw 75.00 75.00 75.00Combine JD CTS9780hm pcs 243.4 kw 243.4 kw 65.00 65.00 65.00Tractor MTZ 1025 pcs 4 77.2 kw 77.2 kw 80.00 80.00 80.00Tractor MTZ 820 pcs 2 60 kw 60 kw 70.00 70.00 70.00Tractor MTZ 82 pcs 5 60 kw 60 kw 60.00 60.00 60.00Tractor IMT 539 pcs 10 28.5 kw 28.5 kw 40.00 40.00 40.00Loader ULT 160 C pcs 177.6 ks 177.6 ks 60.00 60.00 60.00Truck Iveco 190.36 tts with trailer pcs 265 kw 265 kw 50.00 55.00 55.00Tractor JD 6630 pcs 2 80.00 85.00Tractor JD 5110 pcs 80.00 85.00Tractor MTZ 1221 80.00 85.00
Capacity utilization

Realization
Movement in sale volume
Product/service Quantity sold Value in EUR
Unit 2011 2012 2013 2011 2012 2013 Wheat kg 6,762 4,992 5,667 1.344.694 1.245.526 1.052.982Winter barley kg 2,128 1,525 2,152 420.170 353.007 445.170Sunflower kg 1,277 1,450 1,799 423.056 763.764 450.254Soy kg 1,226 215 304 401.057 135.530 130.972Sugar beet kg 29,595 17,914 19,050 1.266.512 716.230 855.631Commercial corn kg 1,566 2,749 2,654 244.111 503.570 423.506Mercantile corn- trench silo kg 0 0 0 0 0 0Seed corn kg 594 61 211 439.064 58.008 255.091Sour cherry kg 205 95 220 110.062 100.114 125.878Plum kg 117 32 195 14.430 7.425 19.486Fattening pigs kg 510 662 697 657.659 1.103.460 1.159.996Cull sows kg 37 35 36 38.990 47.582 48.050Pigs (cages) kg 0 0 8 0 0 17.441Fattening pigs - light kg 0 0 20 0 0 28.631
TOTAL : 5.359.805 5.034.216 5.013.088
Sales structure in % 2011 2012 2013
Domestic market 100.00 100.00 100.00
Foreign market 0.00 0.00 0.00
TOTAL : 100.00 100.00 100.00
Sales structure Distribution channels Distribution channels % of share
Direct sale 90.00
Wholesale 0.00
Retail 0.00
Intermediaries 10.00
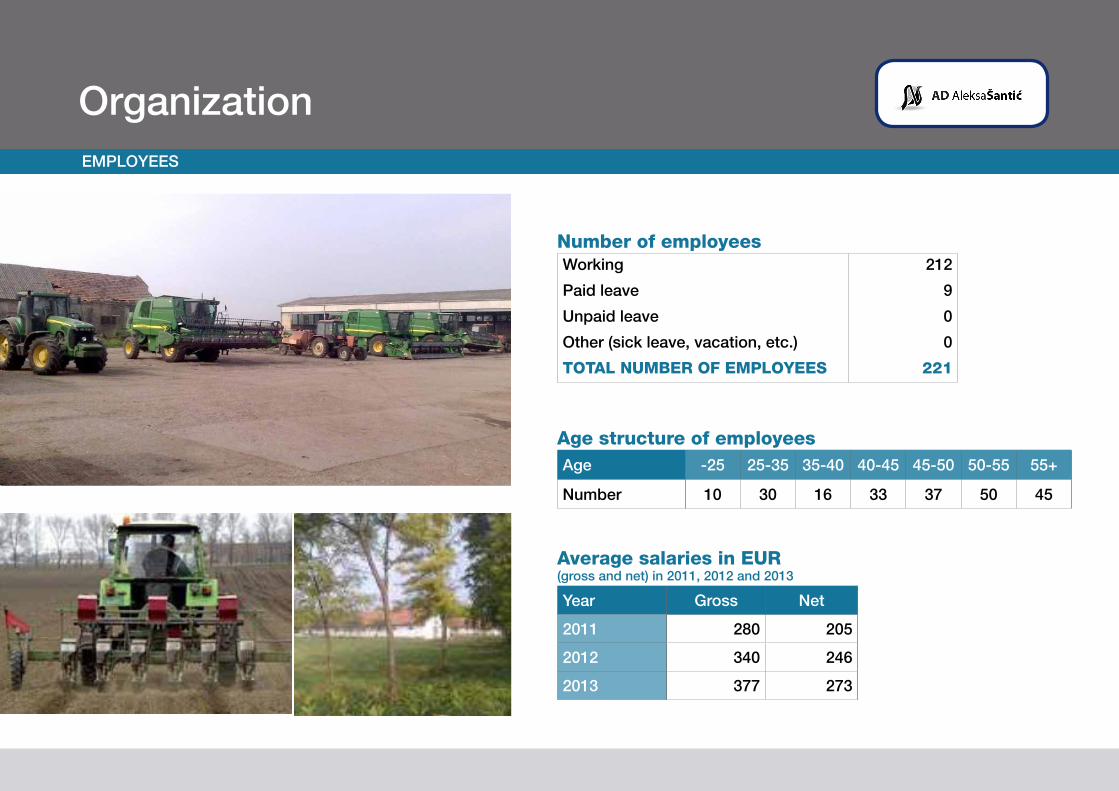
OrganizationEMPLOYEES
Number of employeesWorking 212
Paid leave 9
Unpaid leave 0
Other (sick leave, vacation, etc.) 0
TOTal NuMbEr Of EMplOyEES 221
age structure of employeesAge -25 25-35 35-40 40-45 45-50 50-55 55+
Number 10 30 16 33 37 50 45
average salaries in Eur(gross and net) in 2011, 2012 and 2013
Year Gross Net
2011 280 205
2012 340 246
2013 377 273
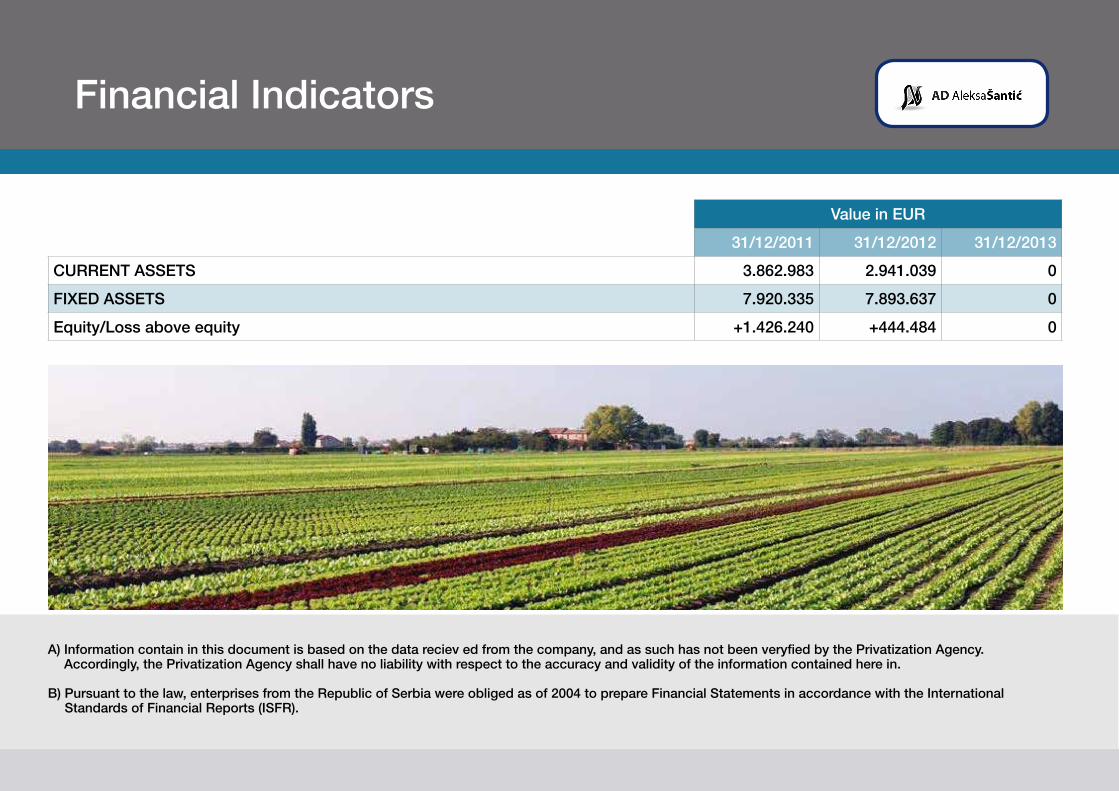
Financial Indicators
Value in EUR
31/12/2011 31/12/2012 31/12/2013
CURRENt ASSEtS 3.862.983 2.941.039 0
FIxED ASSEtS 7.920.335 7.893.637 0
Equity/Loss above equity +1.426.240 +444.484 0
A) Information contain in this document is based on the data reciev ed from the company, and as such has not been veryfied by the Privatization Agency. Accordingly, the Privatization Agency shall have no liability with respect to the accuracy and validity of the information contained here in.
B) Pursuant to the law, enterprises from the Republic of Serbia were obliged as of 2004 to prepare Financial Statements in accordance with the International Standards of Financial Reports (ISFR).

SWOt Analysys
STrENgThS: The favorable geographical location, direct
access to raw materials and customers, solid yields in crop production, high quality
agricultural products, a long tradition, know-how, broad customer network and
developed long-term relationships with them, diversified structure of suppliers,
developed distribution network, significant storage capacity ...
OppOrTuNITIES:Export potential, the potential for the introduction of new products in crop
and livestock production, the write-off of debt to state creditors, the possibility of renting state-owned agricultural land.
WEakNESS:No ISO and HACCP standards, underutilized capacity, low level of finalization of the process of production, difficult access to loans, outdated and insufficient machinery, slow turnover in primary production, the relatively small area of own agricultural land, lack of state subsidies in agriculture for legal entities
ThrEaTS: Unfavorable climate conditions (drought, hail), fluctuations of prices of agricultural products, price volatility of raw materials, loss of state agricultural land
s
o
w
t

Advantages of Investing in Serbia
Favorable geographic position, owing to which any shipment can reach any location in Europe within 24 hours
Highly educated and cheap labor force
Restructured and stable financial system
Simple procedures for a company start–up and registration
Simple procedures for foreign trade transactions and foreign investments
Several free trade agreements have been signed, ensuring supply of goods to nearly 800 million consumers:
• In March 2012 Serbia was granted the candidates status by the EC
• CEFtA
• Agreement with the EFtA members
• Autonomous trade preferences granted by the EU in December 2000, and implementation of the Interim trade Agreement with the EU started in February 2010
• Agreement with the Russian Federation, Belarus and kazakhstan
• Agreement with turkey

Contact
Privatization Agency Republic of SerbiaAdress: 23 Terazije, 11000 Belgrade, SerbiaPhone: +381 11 / 3020-800Fax: +381 11 / 3020-828Email: [email protected]
www.priv.rs
Ministry of Economy Republic of SerbiaAddress: 20, Kneza Milosa Street, 11000 Belgrade, Serbia
www.privreda.gov.rs