antimicrobal medicines consumption (amc data: 2011 … · this report sets out and analyses data on...
TRANSCRIPT

AMC data 2011–2014
WHO Regional Office for Europe
Antimicrobial Medicines
Consumption (AMC) Network


WHO Regional Office for Europe
Antimicrobial Medicines
Consumption (AMC) Network
AMC data 2011–2014

Abstract
This report sets out and analyses data on antimicrobial medicines consumption (AMC) collected from non-European Union countries in the WHO European Region and Kosovo (in accordance with Security Council resolution 1244 (1999)). Its aims are to support countries that are building or strengthening their national surveillance systems on AMC and to stimulate the sharing of data both within and between countries. The WHO Regional Office for Europe and its partners remain committed to supporting countries in these endeavours through the activities of the WHO AMC Network.
Keywords
ANTIMICROBIAL MEDICINES CONSUMPTIONNATIONAL SURVEILLANCE NETWORKSANTI-INFECTIVE AGENTS – THERAPEUTIC USEDRUG RESISTANCE, MICROBIALEPIDEMIOLOGICAL MONITORINGDATA COLLECTIONEUROPE
ISBN: 9789289052382
© World Health Organization 2017All rights reserved. The Regional Office for Europe of the World Health Organization welcomes requests for permission to reproduce or translate its publications, in part or in full.
The designations employed and the presentation of the material in this publication do not imply the expression of any opinion whatsoever on the part of the World Health Organization concerning the legal status of any country, territory, city or area or of its authorities, or concerning the delimitation of its frontiers or boundaries. Dotted lines on maps represent approximate border lines for which there may not yet be full agreement.
The mention of specific companies or of certain manufacturers’ products does not imply that they are endorsed or recommended by the World Health Organization in preference to others of a similar nature that are not mentioned. Errors and omissions excepted, the names of proprietary products are distinguished by initial capital letters.
All reasonable precautions have been taken by the World Health Organization to verify the information contained in this publication. However, the published material is being distributed without warranty of any kind, either express or implied. The responsibility for the interpretation and use of the material lies with the reader. In no event shall the World Health Organization be liable for damages arising from its use. The views expressed by authors, editors, or expert groups do not necessarily represent the decisions or the stated policy of the World Health Organization.
Address requests about publications of the WHO Regional Office for Europe to: Publications WHO Regional Office for Europe UN City, Marmorvej 51 DK-2100 Copenhagen Ø, DenmarkAlternatively, complete an online request form for documentation, health information, or for permission to quote or translate, on the Regional Office website (http://www.euro.who.int/pubrequest).

iii
CONTENTS
Acknowledgements . . . . . . . . . . . . . . . . . . . . . . . . . . . . . . . . . . . . . . . . . . . . . . . . . . . . . . . . . . . . . . . . . vi
Foreword . . . . . . . . . . . . . . . . . . . . . . . . . . . . . . . . . . . . . . . . . . . . . . . . . . . . . . . . . . . . . . . . . . . . . . . . . . ix
Abbreviations . . . . . . . . . . . . . . . . . . . . . . . . . . . . . . . . . . . . . . . . . . . . . . . . . . . . . . . . . . . . . . . . . . . . . x
Summary . . . . . . . . . . . . . . . . . . . . . . . . . . . . . . . . . . . . . . . . . . . . . . . . . . . . . . . . . . . . . . . . . . . . . . . . . xi
1. Introduction . . . . . . . . . . . . . . . . . . . . . . . . . . . . . . . . . . . . . . . . . . . . . . . . . . . . . . . . . . 1
2. The WHO Antimicrobial Medicines Consumption (AMC) Network . . . . . . . . . . . . . . 2
2.1 Background. . . . . . . . . . . . . . . . . . . . . . . . . . . . . . . . . . . . . . . . . . . . . . . . . . . . . . . . . . . . . . . . . . 2
2.2 Objectives of the WHO AMC Network. . . . . . . . . . . . . . . . . . . . . . . . . . . . . . . . . . . . . . . . . . . . 3
2.3 Participating countries and areas . . . . . . . . . . . . . . . . . . . . . . . . . . . . . . . . . . . . . . . . . . . . . . 4
3. Data collection and analysis . . . . . . . . . . . . . . . . . . . . . . . . . . . . . . . . . . . . . . . . . . . . . 5
3.1 Methodology . . . . . . . . . . . . . . . . . . . . . . . . . . . . . . . . . . . . . . . . . . . . . . . . . . . . . . . . . . . . . . . . . 5
3.2 Data collection . . . . . . . . . . . . . . . . . . . . . . . . . . . . . . . . . . . . . . . . . . . . . . . . . . . . . . . . . . . . . . . 6
3.3 Data analysis . . . . . . . . . . . . . . . . . . . . . . . . . . . . . . . . . . . . . . . . . . . . . . . . . . . . . . . . . . . . . . . . 7
3.4 Data interpretation . . . . . . . . . . . . . . . . . . . . . . . . . . . . . . . . . . . . . . . . . . . . . . . . . . . . . . . . . . 10
4. Albania . . . . . . . . . . . . . . . . . . . . . . . . . . . . . . . . . . . . . . . . . . . . . . . . . . . . . . . . . . . . . 12
4.1 Data sources and years of data collection . . . . . . . . . . . . . . . . . . . . . . . . . . . . . . . . . . . . . . 12
4.2 Estimates of volumes of consumption of J01 anti-infective agents . . . . . . . . . . . . . . . . 12
4.3 Relative consumption of J01 anti-infective agents by subgroup . . . . . . . . . . . . . . . . . . . 14
4.4 Relative consumption by choice of agent . . . . . . . . . . . . . . . . . . . . . . . . . . . . . . . . . . . . . . . 16
4.5 The 10 most consumed agents . . . . . . . . . . . . . . . . . . . . . . . . . . . . . . . . . . . . . . . . . . . . . . . 20
4.6 Comments . . . . . . . . . . . . . . . . . . . . . . . . . . . . . . . . . . . . . . . . . . . . . . . . . . . . . . . . . . . . . . . . . . 21
5. Armenia . . . . . . . . . . . . . . . . . . . . . . . . . . . . . . . . . . . . . . . . . . . . . . . . . . . . . . . . . . . . 22
5.1 Data sources and years of data collection . . . . . . . . . . . . . . . . . . . . . . . . . . . . . . . . . . . . . . 22
5.2 Estimates of volumes of consumption of J01 anti-infective agents . . . . . . . . . . . . . . . . 22
5.3 Relative consumption of J01 anti-infective agents by subgroup . . . . . . . . . . . . . . . . . . . 24
5.4 Relative consumption by choice of agent . . . . . . . . . . . . . . . . . . . . . . . . . . . . . . . . . . . . . . . 27
5.5 The 10 most consumed agents . . . . . . . . . . . . . . . . . . . . . . . . . . . . . . . . . . . . . . . . . . . . . . . 30
5.6 Comments . . . . . . . . . . . . . . . . . . . . . . . . . . . . . . . . . . . . . . . . . . . . . . . . . . . . . . . . . . . . . . . . . . 31
6. Azerbaijan . . . . . . . . . . . . . . . . . . . . . . . . . . . . . . . . . . . . . . . . . . . . . . . . . . . . . . . . . . 32
6.1 Data sources and years of data collection . . . . . . . . . . . . . . . . . . . . . . . . . . . . . . . . . . . . . . 32
6.2 Estimates of volumes of consumption of J01 anti-infective agents . . . . . . . . . . . . . . . . 32
6.3 Relative consumption of J01 anti-infective agents by subgroup . . . . . . . . . . . . . . . . . . . 34
6.4 Relative consumption by choice of agent . . . . . . . . . . . . . . . . . . . . . . . . . . . . . . . . . . . . . . . 36

iv
6.5 The 10 most consumed agents . . . . . . . . . . . . . . . . . . . . . . . . . . . . . . . . . . . . . . . . . . . . . . . 39
6.6 Comments . . . . . . . . . . . . . . . . . . . . . . . . . . . . . . . . . . . . . . . . . . . . . . . . . . . . . . . . . . . . . . . . . . 41
7. Belarus . . . . . . . . . . . . . . . . . . . . . . . . . . . . . . . . . . . . . . . . . . . . . . . . . . . . . . . . . . . . . 42
7.1 Data sources and years of data collection . . . . . . . . . . . . . . . . . . . . . . . . . . . . . . . . . . . . . . 42
7.2 Estimates of volumes of consumption of J01 anti-infective agents . . . . . . . . . . . . . . . . 42
7.3 Relative consumption of J01 anti-infective agents by subgroup . . . . . . . . . . . . . . . . . . . 44
7.4 Relative consumption by choice of agent . . . . . . . . . . . . . . . . . . . . . . . . . . . . . . . . . . . . . . . 46
7.5 The 10 most consumed agents . . . . . . . . . . . . . . . . . . . . . . . . . . . . . . . . . . . . . . . . . . . . . . . 50
7.6 Comments . . . . . . . . . . . . . . . . . . . . . . . . . . . . . . . . . . . . . . . . . . . . . . . . . . . . . . . . . . . . . . . . . . 51
8. Kyrgyzstan. . . . . . . . . . . . . . . . . . . . . . . . . . . . . . . . . . . . . . . . . . . . . . . . . . . . . . . . . . . 52
8.1 Data sources and years of data collection . . . . . . . . . . . . . . . . . . . . . . . . . . . . . . . . . . . . . . 52
8.2 Estimates of volumes of consumption of J01 anti-infective agents . . . . . . . . . . . . . . . . 52
8.3 Relative consumption of J01 anti-infective agents by subgroup . . . . . . . . . . . . . . . . . . . 55
8.4 Relative consumption by choice of agent . . . . . . . . . . . . . . . . . . . . . . . . . . . . . . . . . . . . . . . 57
8.5 The 10 most consumed agents . . . . . . . . . . . . . . . . . . . . . . . . . . . . . . . . . . . . . . . . . . . . . . . 60
8.6 Comments . . . . . . . . . . . . . . . . . . . . . . . . . . . . . . . . . . . . . . . . . . . . . . . . . . . . . . . . . . . . . . . . . . 61
9. Montenegro . . . . . . . . . . . . . . . . . . . . . . . . . . . . . . . . . . . . . . . . . . . . . . . . . . . . . . . . . 62
9.1 Data sources and years of data collection . . . . . . . . . . . . . . . . . . . . . . . . . . . . . . . . . . . . . . 62
9.2 Estimates of volumes of consumption of J01 anti-infective agents . . . . . . . . . . . . . . . . 62
9.3 Relative consumption of J01 anti-infective agents by subgroup . . . . . . . . . . . . . . . . . . . 64
9.4 Relative consumption by choice of agent . . . . . . . . . . . . . . . . . . . . . . . . . . . . . . . . . . . . . . . 66
9.5 The 10 most consumed agents . . . . . . . . . . . . . . . . . . . . . . . . . . . . . . . . . . . . . . . . . . . . . . . 69
9.6 Comments . . . . . . . . . . . . . . . . . . . . . . . . . . . . . . . . . . . . . . . . . . . . . . . . . . . . . . . . . . . . . . . . . . 71
10. Republic of Moldova . . . . . . . . . . . . . . . . . . . . . . . . . . . . . . . . . . . . . . . . . . . . . . . . . 72
10.1 Data sources and years of data collection . . . . . . . . . . . . . . . . . . . . . . . . . . . . . . . . . . . . . 72
10.2 Estimates of volumes of consumption of J01 anti-infective agents . . . . . . . . . . . . . . . 72
10.3 Relative consumption of J01 anti-infective agents by subgroup . . . . . . . . . . . . . . . . . 75
10.4 Relative consumption by choice of agent . . . . . . . . . . . . . . . . . . . . . . . . . . . . . . . . . . . . . . 77
10.5 The 10 most consumed agents . . . . . . . . . . . . . . . . . . . . . . . . . . . . . . . . . . . . . . . . . . . . . . 80
10.6 Comments . . . . . . . . . . . . . . . . . . . . . . . . . . . . . . . . . . . . . . . . . . . . . . . . . . . . . . . . . . . . . . . . 81
11. Serbia . . . . . . . . . . . . . . . . . . . . . . . . . . . . . . . . . . . . . . . . . . . . . . . . . . . . . . . . . . . . . 82
11.1 Data sources and years of data collection . . . . . . . . . . . . . . . . . . . . . . . . . . . . . . . . . . . . . 82
11.2 Estimates of volumes of consumption of J01 anti-infective agents . . . . . . . . . . . . . . . 82
11.3 Relative consumption of J01 anti-infective agents by subgroup . . . . . . . . . . . . . . . . . 84
11.4 Relative consumption by choice of agent . . . . . . . . . . . . . . . . . . . . . . . . . . . . . . . . . . . . . . 87
11.5 The 10 most consumed agents . . . . . . . . . . . . . . . . . . . . . . . . . . . . . . . . . . . . . . . . . . . . . . 90
11.6 Comments . . . . . . . . . . . . . . . . . . . . . . . . . . . . . . . . . . . . . . . . . . . . . . . . . . . . . . . . . . . . . . . . 91
12. Tajikistan . . . . . . . . . . . . . . . . . . . . . . . . . . . . . . . . . . . . . . . . . . . . . . . . . . . . . . . . . . . 92
12.1 Data sources and years of data collection . . . . . . . . . . . . . . . . . . . . . . . . . . . . . . . . . . . . . 92

v
12.2 Estimates of volumes of consumption of J01 anti-infective agents . . . . . . . . . . . . . . . 92
12.3 Relative consumption of J01 anti-infective agents by subgroup . . . . . . . . . . . . . . . . . 94
12.4 Relative consumption by choice of agent . . . . . . . . . . . . . . . . . . . . . . . . . . . . . . . . . . . . . . 96
12.5 The 10 most consumed agents . . . . . . . . . . . . . . . . . . . . . . . . . . . . . . . . . . . . . . . . . . . . . . 99
12.6 Comments . . . . . . . . . . . . . . . . . . . . . . . . . . . . . . . . . . . . . . . . . . . . . . . . . . . . . . . . . . . . . . . 101
13.Turkey . . . . . . . . . . . . . . . . . . . . . . . . . . . . . . . . . . . . . . . . . . . . . . . . . . . . . . . . . . . . 102
13.1 Data sources and years of data collection . . . . . . . . . . . . . . . . . . . . . . . . . . . . . . . . . . . . 102
13.2 Estimates of volumes of consumption of J01 anti-infective agents . . . . . . . . . . . . . . 102
13.3 Relative consumption of J01 anti-infective agents by subgroup . . . . . . . . . . . . . . . . 105
13.4 Relative consumption by choice of agent . . . . . . . . . . . . . . . . . . . . . . . . . . . . . . . . . . . . . 107
13.5 The 10 most consumed agents . . . . . . . . . . . . . . . . . . . . . . . . . . . . . . . . . . . . . . . . . . . . . 111
13.6 Comments . . . . . . . . . . . . . . . . . . . . . . . . . . . . . . . . . . . . . . . . . . . . . . . . . . . . . . . . . . . . . . . 112
14. Uzbekistan . . . . . . . . . . . . . . . . . . . . . . . . . . . . . . . . . . . . . . . . . . . . . . . . . . . . . . . . 113
14.1 Data sources and years of data collection . . . . . . . . . . . . . . . . . . . . . . . . . . . . . . . . . . . . 113
14.2 Estimates of volumes of consumption of J01 anti-infective agents . . . . . . . . . . . . . . 113
14.3 Relative consumption of J01 anti-infective agents by subgroup . . . . . . . . . . . . . . . . 115
14.4 Relative consumption by choice of agent . . . . . . . . . . . . . . . . . . . . . . . . . . . . . . . . . . . . . 117
14.5 The 10 most consumed agents . . . . . . . . . . . . . . . . . . . . . . . . . . . . . . . . . . . . . . . . . . . . . 120
14.6 Comments . . . . . . . . . . . . . . . . . . . . . . . . . . . . . . . . . . . . . . . . . . . . . . . . . . . . . . . . . . . . . . . 121
15. Kosovo (in accordance with Security Council resolution 1244 (1999)) . . . . . . . . 122
15.1 Data sources and years of data collection . . . . . . . . . . . . . . . . . . . . . . . . . . . . . . . . . . . . 122
15.2 Estimates of volumes of consumption of J01 anti-infective agents . . . . . . . . . . . . . . 122
15.3 Relative consumption of J01 anti-infective agents by subgroup . . . . . . . . . . . . . . . . 124
15.4 Relative consumption by choice of agent . . . . . . . . . . . . . . . . . . . . . . . . . . . . . . . . . . . . . 126
15.5 The 10 most consumed agents . . . . . . . . . . . . . . . . . . . . . . . . . . . . . . . . . . . . . . . . . . . . . 130
15.6 Comments . . . . . . . . . . . . . . . . . . . . . . . . . . . . . . . . . . . . . . . . . . . . . . . . . . . . . . . . . . . . . . . 131
16. Cross-national comparisons . . . . . . . . . . . . . . . . . . . . . . . . . . . . . . . . . . . . . . . . . . 132
16.1 Background . . . . . . . . . . . . . . . . . . . . . . . . . . . . . . . . . . . . . . . . . . . . . . . . . . . . . . . . . . . . . . 132
16.2 Estimates of volumes of consumption of J01 anti-infective agents . . . . . . . . . . . . . . 132
16.3 Relative consumption of J01 anti-infective agents . . . . . . . . . . . . . . . . . . . . . . . . . . . . 134
16.4 Relative consumption by choice of agent . . . . . . . . . . . . . . . . . . . . . . . . . . . . . . . . . . . . . 137
16.5 Comparisons with ESAC-Net antimicrobial quality indicators . . . . . . . . . . . . . . . . . . . 139
17. Discussion . . . . . . . . . . . . . . . . . . . . . . . . . . . . . . . . . . . . . . . . . . . . . . . . . . . . . . . . . 141
References . . . . . . . . . . . . . . . . . . . . . . . . . . . . . . . . . . . . . . . . . . . . . . . . . . . . . . . . . . . 142
Annex 1. Methodology . . . . . . . . . . . . . . . . . . . . . . . . . . . . . . . . . . . . . . . . . . . . . . . . . . . . . . . . . . . . . 143
Annex 2. Data collection . . . . . . . . . . . . . . . . . . . . . . . . . . . . . . . . . . . . . . . . . . . . . . . . . . . . . . . . . . . 145
Annex 3. Measurement metrics and quality indicators for antimicrobial consumption . . . . 148

vi
ACKNOWLEDGEMENTS
The WHO Regional Office for Europe would like to thank the WHO Antimicrobial Medicines Consumption (AMC) Network members for providing antimicrobial consumption data and for their valuable contributions to this report.
The Regional Office would particularly like to acknowledge the contribution of Nina Sautenkova to building and supporting the WHO AMC Network during its formative years, and would also like to thank the pool of experts and WHO country offices for their support in setting up and strengthening national AMC surveillance.
Contributors to data collection (2011–2014) and nominated AMC national focal points
Country or area Contributors
AlbaniaIris HoxhaLecturerFaculty of Pharmacy, Tirana University of Medicine
ArmeniaLilith GhazaryanDeputy DirectorScientific Centre of Drug and Medical Technology Expertise, Ministry of Health
Azerbaijan
Vafa AbilovaSpecialistDepartment of Import Medicines and Medical Devices, Analytical Expertise Centre, Ministry of Health
Nazifa MursalovaGuiding AdviserSector of Sanitary Epidemiological Surveillance, Ministry of Health
BelarusHalina PyshnikConsultantDepartment of Organization of Medicines Provision, Ministry of Health
Bosnia and Herzegovina
Tijana SpasojevicHeadSector for Providing Information on Drugs and Medical Products, Agency for Medicinal Products and Medical Devices
Georgia
Irma KorinteliPhysician, Paediatrician
Marina DarakhvelidzeHeadHealth Care Department, Ministry of Labour, Health and Social Affairs
Kazakhstan
Larissa MakalkinaHeadDrug Centre of Republican Centre for Health Development, Ministry of Health and Social Protection
Kyrgyzstan
Gulbara KulushovaPhD, AssistantDepartment of Basic and Clinical Pharmacology, Faculty of Medicine, Kyrgyz-Russian Slavic University named after B.N. Yeltsin
Montenegro
Lidija CizmovicHeadDepartment for Establishing Maximum Prices and Monitoring Consumption of Medicines, Agency for Medicines and Medical Devices

vii
Country or area Contributors
Republic of Moldova
Angela CarpProcurement SpecialistP.I. Coordination, Implementation and Monitoring Unit of Health System Projects
Nicolae FurtunaDeputy DirectorNational Public Health Centre
Russian Federation
Svetlana RachinaHeadPharmacoepidemiology and Pharmacoeconomics Department, Interregional Association for Clinical Microbiology and Antimicrobial Chemotherapy
SerbiaVesela RadonjicNational Centre for Information on Medicines and Medical DevicesMedicines and Medical Devices Agency of Serbia
Tajikistan
Salomuddin YusufiHeadDepartment for Science and Medical/Pharmaceutical Education Ministry of Health and Social Protection of Population of the Republic of Tajikistan
Nargis MaqsudovaLecturerPharmacoeconomic DepartmentAvicenna Tajik State Medical University
The former Yugoslav Republic of Macedonia
Kristina HristovaDirectorPharmacy Department, Health Insurance Fund
Turkey
Bahar MelikPharmacistDepartment of Rational Drug Use, Turkish Medicines and Medical Devices Agency
Mesil AksoyPharmacist and HeadDepartment of Rational Drug Use, Turkish Medicines and Medical Devices Agency
Emre Umut GürpınarPharmacistDepartment of Rational Drug Use, Turkish Medicines and Medical Devices Agency
UkraineLarysa IakovlievaHead and Doctor of PharmacyPharmacoeconomic Department, National University of Pharmacy
Uzbekistan
Muhabbat IbragimovaHeadCentre for Policy on Medicines and Medical Devices, Central Directorate for Quality Control of Medicines and Medical Equipment, Ministry of Health
Kosovo (in accordance with Security Council resolution 1244 (1999))
Arianit JakupiPharmacist; former CEO A2 - Pharmaceutical Consulting; Kosovo Medicines Agency/Ministry of Health
The WHO Regional Office for Europe would also like to acknowledge the following for their contributions to the WHO AMC Network:
• Arno Muller, Consultant, WHO Geneva;• Klaus Weist, Senior Expert Antimicrobial Consumption, European Centre for Disease Prevention and
Control (ECDC), Solna, Sweden;• Irene Litleskare, Senior Adviser, WHO Collaborating Centre for Drug Statistics Methodology,
Norwegian Institute of Public Health, Oslo, Norway;• Hege Blix Salvesen, Senior Researcher, Department of Pharmacoepidemiology, Norwegian Institute
of Public Health; Professor, School of Pharmacy, University of Oslo, Norway;• Brian Godman, Professor, Strathclyde Institute of Pharmacy and Biomedical Sciences,
University of Strathclyde, Glasgow, United Kingdom; Senior Researcher, Division of Clinical Pharmacology, Karolinska Institutet, Stockholm, Sweden.

viii
• Danilo Lo Fo Wong, Programme Manager, Control of Antimicrobial Resistance, WHO Regional Office for Europe
The database for data analysis was developed in conjunction with Public Health Expertise, Paris, France.
The report was written by the following members of the Health Technologies and Pharmaceuticals Programme, WHO Regional Office for Europe:
• Jane Robertson, Technical Officer• Kotoji Iwamoto, Technical Officer• Guillaume Dedet, Technical Officer• Hanne Bak Pedersen, Programme Manager.
WHO AMC Network activities are coordinated by the WHO Regional Office for Europe. The financial support of the Dutch Ministry of Health, Welfare and Sports is gratefully acknowledged.

ix
FOREWORD
In September 2011, all 53 countries in the WHO European Region adopted the European strategic action plan on antibiotic resistance. Strategic priorities included strengthening of the surveillance of antibiotic resistance and antimicrobial consumption and promoting the rational use of antimicrobial medicines. The WHO Global Action Plan on antimicrobial resistance was agreed by Members States at the Sixty-eighth World Health Assembly in 2015. It recognizes the importance of collecting and analysing data on antibiotic use as a means of identifying potential overuse, underuse and inappropriate use of antimicrobial medicines, and as a basis for developing interventions to address inappropriate practices.
Such actions are key to the WHO Regional Office for Europe’s agenda on strengthening health systems in order to accelerate health gains and reduce health inequalities. This health systems strengthening agenda was endorsed by all Member States via the 2008 Tallinn Charter (Health Systems for Health and Wealth) and is a priority area under Health 2020, the European policy for health and well-being. Improving health information and health information systems – collating, interpreting and analysing data, and using the results to inform decision-making – is central to this work.
Surveillance of AMC has been undertaken by all countries of the European Union (EU), as well as Iceland and Norway, via the European Surveillance on Antimicrobial Consumption Network (ESAC-Net) since 1997. This work is now coordinated by ECDC, but surveillance of antimicrobial consumption in the non-EU Member States in the WHO European Region has not been systematic.
To address this, the WHO Regional Office for Europe established the WHO AMC Network in 2011 to assist countries in setting up or strengthening national AMC surveillance and to contribute to Region-wide AMC surveillance. A national approach to monitoring and evaluation ultimately serves to provide centralized data to ensure that policies and strategies to address AMC and antimicrobial resistance are effective. These efforts are closely coordinated with ECDC to ensure that data are comparable and compatible, which will provide a pan-European overview of trends and sources of AMC.
This report describes the data collected from a number of non-EU countries in the WHO European Region gathered through the WHO AMC Network. Its aim is to illustrate the value of national AMC surveillance and to stimulate the sharing of data both within and between countries. Sharing of these data show that national governments are taking antimicrobial resistance seriously as a key public health issue.
The WHO Regional Office for Europe remains committed to supporting countries in these endeavours through the activities of the WHO AMC Network.
Hans Kluge, MDDirector, Division of Health Systems and Public Health

x
ABBREVIATIONS
AMC antimicrobial medicines consumption
ATC Anatomical Therapeutic Chemical (classification system)
CAESAR Central Asian and Eastern European Surveillance of Antimicrobial Resistance (Network)
DDD defined daily dose
DID defined daily doses per 1000 inhabitants per day
ECDC European Centre for Disease Prevention and Control
ESAC-Net European Surveillance of Antimicrobial Consumption Network
EU European Union
Abbreviations of country and area names used in some tables and figures
ALB Albania
ARM Armenia
AZE Azerbaijan
BLR Belarus
KGZ Kyrgyzstan
MDA Republic of Moldova
MNE Montenegro
SRB Serbia
TJK Tajikistan
TUR Turkey
UZB Uzbekistan
KOS Kosovo (in accordance with Security Council resolution 1244 (1999))

xi
SUMMARY
1 All references to Kosovo in this summary should be understood as references to Kosovo in accordance with United Nations Security Council resolution 1244 (1999).
The WHO AMC Network is an initiative of the WHO Regional Office for Europe. It aims to support all countries in the WHO European Region that are not part of the European Surveillance of Antimicrobial Consumption Network (ESAC-Net) coordinated by the European Centre for Disease Prevention and Control (ECDC).
Albania, Armenia, Azerbaijan, Belarus, Bosnia and Herzegovina, Georgia, Kazakhstan, Kyrgyzstan, Montenegro, the Republic of Moldova, the Russian Federation, Serbia, Tajikistan, the former Yugoslav Republic of Macedonia, Turkey, Ukraine and Uzbekistan, as well as Kosovo,1 are currently engaged at various stages of participation in the WHO AMC Network. Between 2011 and 2014, all of these contributed one or more years of antimicrobial consumption data to the Network.
This is the first WHO AMC Network report; it sets out and analyses the antimicrobial consumption data for 11 of the participating countries and Kosovo.1
Key findings
Data on total consumption of antibacterials for systemic use (Anatomical Therapeutic Chemical (ATC) classification group J01) was available for 11 countries and Kosovo.1 Consumption in 2014 ranged from 8.5 defined daily doses per 1000 inhabitants per day (DID) in Azerbaijan to 40.4 DID in Turkey– a more than fourfold difference in consumption estimates. The population-weighted mean consumption across the 12 datasets was 24.4 DID.
Even greater variability was reported in the relative use of parenteral (injectable) formulations – from 4% of total J01 consumption in Turkey to 69% in Azerbaijan.
The most commonly consumed subgroup of antibacterials was beta-lactams (ATC group J01C), with a range of 35.4% (Belarus) to 65.6% (Azerbaijan) of total J01 consumption. Cephalosporins (J01D) represented between 6.1% (Azerbaijan) and 30.3% (Turkey) of total consumption; quinolones (J01M) made up less than 0.1% of total consumption in Uzbekistan and 17% in the Republic of Moldova.
Cephalosporins and quinolones are broad-spectrum antibiotics and are considered second-line antibiotics in many prescribing guidelines. In the data reported here, the two groups combined represented between 10% (Azerbaijan) and 38% (Republic of Moldova) of total J01 consumption.
Choice of cephalosporins varied widely. Overall, consumption of fourth-generation agents was limited (mostly <0.1 DID). Consumption of first-generation agents varied from 8% (Turkey) to 80% (Serbia) of total cephalosporin consumption, and second-generation agents from very low consumption (<0.1 DID) in a number of settings to 54% of cephalosporin consumption (6.5 DID)
xii
in Turkey. Third-generation agent consumption ranged from 16% (Serbia) to 83% (Tajikistan) of total cephalosporin consumption and represented more than 50% of total cephalosporin consumption in six of the 12 datasets.
Similarly, the relative consumption of amoxicillin and the broader-spectrum amoxicillin and clavulanic acid varied widely. Amoxicillin was the more consumed agent in most datasets – the exception was Turkey, where only 11% of consumption of these two agents was amoxicillin.
Estimates were derived for seven of the ESAC-Net quality indicators for antibiotic consumption. Variability in estimates of these indicators was considerable in both the WHO AMC Network and 2014 ESAC-Net analyses.
Conclusions
The results presented in this report document trends of AMC across parts of non-EU Europe. The notable feature of the cross-national comparisons is the wide variability of estimates. This is unlikely to be explained by different patterns or burden of disease alone. The reasons for such variability require further investigation and offer opportunities to develop interventions to promote more responsible use of antimicrobials.
The data sources used to provide consumption estimates have a number of limitations, and the results need to be interpreted in this light. Despite this, the levels of AMC reported, and in some cases the choices of antimicrobial agents used, confirm the need for action. A commitment to ongoing collection, analysis and use of consumption data is essential: it is a central element laid out in the Global Action Plan on antimicrobial resistance adopted during the Sixty-eighth World Health Assembly in May 2015.

1
1. INTRODUCTION
In September 2011 all 53 countries in the WHO European Region adopted the European strategic action plan on antibiotic resistance. This was developed in recognition of the following factors:
• in many countries in the Region antibiotic resistance had been neglected;• no systematic surveillance of antibiotic use and resistance was in place;• control efforts needed to be coordinated between the health and other relevant sectors;• antibiotic resistance can spread internationally through travel and trade;• international standards and mechanisms for sharing data and information were needed.
At the Sixty-eighth World Health Assembly held in May 2015, Member States adopted the Global Action Plan (WHO, 2015) on antimicrobial resistance and the resolution urged Member States to implement it, recognizing that this might need to be adapted to specific contexts and national priorities.
The Global Action Plan has five objectives:
• to improve awareness and understanding of antimicrobial resistance;• to strengthen surveillance and research;• to reduce the incidence of infection;• to optimize the use of antimicrobial medicines; and• to ensure sustainable investment in countering antimicrobial resistance.
Specifically related to objective 4, Member States were asked to provide “stewardship programmes that monitor and promote optimization of antimicrobial use at national and local levels in accordance with international standards in order to ensure the correct choice of medicine at the right dose on the basis of evidence”. Thus, an important element of the Plan is monitoring the consumption of antimicrobial medicines. All countries have some data related to the import, procurement, distribution or clinical use of antimicrobials in their communities that can be used as the basis of stewardship and monitoring programmes.
Data on the consumption of antimicrobial medicines have a number of uses, including:
• relating exposure to antimicrobials to the development of antimicrobial resistance;• identifying and providing an early warning of problems relating to changes in exposure and utilization
and developing interventions to address problems identified;• monitoring the outcomes of interventions aimed at changing exposure;• assessing the quality of prescribing against practice guidelines;• raising awareness in health professionals, consumers and policy-makers about the issues of
antimicrobial resistance and the potential contribution of inappropriate use of antimicrobials in humans.
A considerable amount of work has already been undertaken in Europe to measure consumption of antimicrobials through two programmes undertaken by the European Surveillance of Antimicrobial Consumption Network (ESAC-Net) and the WHO Regional Office for Europe.

2
2. THE WHO ANTIMICROBIAL MEDICINES CONSUMPTION (AMC) NETWORK
2 The EEA unites the EU Member States and three of the four EFTA countries (Iceland, Liechtenstein and Norway) into an internal market governed by the same basic rules.
2.1 Background
The WHO AMC Network is an initiative of the WHO Regional Office for Europe and aims to support all countries and areas in the Region that are not part of ESAC-Net, coordinated by the European Centre for Disease Prevention and Control (ECDC) in the European Union (EU).
2.1.1 ESAC-Net
ESAC-Net is a Europe-wide network of national surveillance systems, providing European reference data on antimicrobial consumption. ESAC-Net collects and analyses data on antimicrobial consumption from EU, European Economic Area (EEA)2 and European Free Trade Association (EFTA) countries, in both the community (primary care) and the hospital sectors.
The data collected by ESAC-Net are used to provide timely information and feedback to EU and EEA/EFTA countries on indicators of antimicrobial consumption. These indicators provide a basis for monitoring countries’ progress towards prudent use of antimicrobials.
ESAC-Net publishes annual reports of antimicrobial consumption data, conveyed to ECDC using a standard reporting framework from the community and hospital sectors. In addition to the report, a selection of tables showing trends in consumption of antibacterials for systemic use in both sectors are available as separate downloadable files. ECDC also provides access to an interactive database on its website (ECDC, 2017a). This allows the display of selected data on antimicrobial consumption in different formats such as tables, maps and figures. It includes data on antimicrobial consumption in EU Member States and two EEA non-EU countries (Iceland and Norway) from 1997. This resource provides a powerful tool for examining changes in consumption over time and data at different levels of aggregation.
2.1.2 The WHO AMC Network
A pilot data collection project was undertaken in 2011, involving the Laboratory of Medical Microbiology of the University of Antwerp in Belgium, ECDC and the WHO Collaborating Centre for Drug Statistics Methodology, to monitor AMC at the national level in non-EU European Member

3
States. The project used the Anatomical Therapeutic Chemical (ATC) classification system and defined daily dose (DDD) methodology and the ESAC-Net data collection methods.
The Health Technologies and Pharmaceuticals Programme of the WHO Regional Office for Europe subsequently established a protocol for collection of AMC data that follows on from the pilot project work and the WHO AMC Network. This programme complements the work undertaken by ESAC-Net on AMC and by the WHO Regional Office for Europe with the Central Asian and Eastern European Surveillance of Antimicrobial Resistance (CAESAR) Network.
2.2 Objectives of the WHO AMC Network
The aim of the WHO AMC Network is to establish national surveillance systems for consumption of antimicrobial medicines. To complement the data obtained for the EU through ESAC-Net and enable comparison of data throughout the WHO European Region, the methodology for data collection used by the WHO AMC Network is closely aligned with that used by ECDC, to facilitate comparisons between EU and non-EU Member States in the Region. The data collected at the country and area level are shared with stakeholders and can be used to inform programmes and proposals for national policy actions to improve the responsible use of antimicrobials, as well as for cross-national comparisons. Fig.2.1 illustrates the scope of data collection by the WHO AMC Network in the Region.
Participating countries with the data included in the report
Participating countries with the data not included in the report
Non-participating countries in AMC network in Europe
Fig. 2.1 Status of data reporting to the WHO AMC Network
2. THE WHO ANTIMICROBIAL MEDICINES CONSUMPTION (AMC) NETWORK

4
2.3 Participating countries and areas
3 All references to Kosovo in this chapter should be understood as references to Kosovo in accordance with United Nations Security Council resolution 1244 (1999).
Albania, Armenia, Azerbaijan, Belarus, Bosnia and Herzegovina, Georgia, Kazakhstan, Kyrgyzstan, Montenegro, the Republic of Moldova, the Russian Federation, Serbia, Tajikistan, the former Yugoslav Republic of Macedonia, Turkey, Ukraine and Uzbekistan, as well as Kosovo,3 are currently engaged in the WHO AMC Network. Between 2011 and 2014, all 18 contributed three or four years of antimicrobial consumption data to the Network. Of these, 11 countries and Kosovo3 gave permission by the cut-off date of 30 November 2016 for the data to be published. Analyses for other Network members are shared with countries directly and may be included in future publications. Fig. 2.1 illustrates the scope of data collection by the WHO AMC Network in the Region.
2. THE WHO ANTIMICROBIAL MEDICINES CONSUMPTION (AMC) NETWORK

5
3. DATA COLLECTION AND ANALYSIS
3.1 Methodology
3.1.1 Definitions
For the purposes of this report, a distinction is made between consumption data and antimicrobial use data. This is done to recognize differences in the data sources and in the type of information that may be obtained from each approach.
• Consumption data are used to refer to estimates derived from aggregated data sources such as import or wholesaler data or aggregated health insurance data, where no information is available on the patients receiving the medicines or why the antimicrobials are used. These data sources provide a proxy estimate of use of antimicrobials. Consumption data may be presented as total consumption for a country or may be disaggregated by setting (community or hospital; public or private sectors).
• Antimicrobial use data are used to refer to estimates derived from patient-level data. These may allow disaggregation based on patient characteristics (such as gender or age) or indications for which the medicine is being used.
3.1.2 Measurements used
The WHO AMC Network uses the ATC classification system, and the most commonly used measurement metric is the number of DDDs. Details of both are provided in Annex 1.
The ATC classification system allows flexibility in reporting by medicine or groups of medicines. Medicines are classified in groups at five different levels. The majority of antimicrobial agents are classified in ATC main group J: anti-infectives for systemic use.
The DDD is the assumed average maintenance dose per day for a medicine used for its main indication in adults. The DDD is a technical unit of use and does not necessarily reflect the recommended or average prescribed daily dose. It is a useful metric that allows comparisons within and between countries.
3.1.3 Antimicrobials included in monitoring
The WHO AMC Network programme focuses only on antimicrobials for systemic use – it excludes topical antimicrobials. The core set of agents that all countries include in their monitoring is as follows:

6
• antibacterials (J01);• antibiotics for alimentary tract and metabolism (A07AA);• nitroimidazole derivatives against amoebiasis and other protozoal diseases (P01AB).
In addition, the WHO surveillance programme (WHO 2016) includes an optional list of antimicrobials that countries may include in their surveillance programmes according to local needs and resources:
• antimycotics for systemic use (J02);• antifungals for systemic use (D01BA);• antivirals for systemic use (J05);• drugs for treatment of tuberculosis (J04A);• antimalarials (P01B).
This report builds on the early experience of data collection at the country and area level. It provides an analysis of data collected between 2011 and 2014 and illustrates some cross-national comparisons for selected measures of AMC in 2014. The results it presents relate to analyses of antimicrobial agents in ATC group J01. Data relating to consumption of other antimicrobials – including antibiotics for alimentary tract and metabolism (A07AA), nitroimidazole derivatives against amoebiasis and other protozoal diseases (P01AB), antimycotics for systemic use (J02), antifungals for systemic use (D01BA), antivirals for systemic use (J05), drugs for treatment of tuberculosis (J04A) and antimalarials (P01B) – are also collected in some of the WHO AMC Network countries and areas but are not presented in this report. These additional analyses can be conducted at the country level and the results used to monitor antimicrobial consumption in these disease-specific areas.
3.1.4 Health care sectors monitored
In the majority of the countries and areas participating in the WHO AMC Network it is not possible to disaggregate data by sector (community or hospital; public or private), so total consumption data are reported in most cases.
3.2 Data collection
3.2.1 Sources of antimicrobial consumption data and progress with data collection 2011–2014
Most countries and areas participating in the WHO AMC Network use import data (from customs records and declaration forms) as the source of information on antimicrobial consumption. These are supplemented with sales records from market authorization holders or local manufacturing estimates where there is local pharmaceutical manufacturing. In some cases, data from wholesalers are used. Table 3.1 summarizes the years of data, health care sector coverage and data sources used in each of the settings included in this report.
3. DATA COLLECTION AND ANALYSIS

7
Table 3.1 Sources of data used for consumption estimates (2011–2014)
Country or area Years of data Health care sector coverage Data sources for consumption estimates
Albania 2011–2014 Total care - Import records
Armenia 2011–2014 Total care - Import records - Sales records from local manufacturers
Azerbaijan 2011–2014 Total care - Import records
Belarus 2011–2014 Total care - Import records - Sales records from local manufacturers
Kyrgyzstan 2011–2014 Total care - Import records - Sales records from local manufacturers
Montenegro 2011–2014 Total care - Import records
Republic of Moldova 2011–2014 Total care - Import records - Sales records from local manufacturers
Serbia 2011–2014 Total care - Sales records from marketing authorization holders
Tajikistan 2011–2014 Total care - Import records - Certification records
Turkey 2011–20122013–2014
OutpatientTotal care
- IMS Health - Wholesaler records from
pharmaceutical track and trace system
Uzbekistan 2011–2014 Total care - Import records
Kosovo (in accordance with Security Council resolution 1244 (1999))
2011–2014 Total care - Import records
3.2.2 Data collection procedures
Data collection for the WHO AMC Network follows a standardized protocol and uses a common Excel template. Each year, the WHO regional team in Copenhagen launches a call for AMC data. The focal points fill in the template with AMC data (numbers of packages of each product imported or sold), the relevant product information and population data. Further details on data collection are provided in Annex 2.
All data in this report have been approved for publication by the ministry of health or relevant national authority.
3.3 Data analysis
3.3.1 Consumption estimates
Once the datasets are agreed, the WHO regional team analyses the data. The number of packages of each product is multiplied by the number of DDDs per package to calculate the total number of DDDs for each product. These are aggregated to give the total number of DDDs at the desired ATC code level.
Population-adjusted estimates of consumption are automatically calculated with embedded macros for calculation of consumption estimates in DDD per 1000 inhabitants per day (DID). Further details of population estimates are provided in Annex 2.
3. DATA COLLECTION AND ANALYSIS

8
3.3.2 Metrics reported
The use of the ATC classification permits analyses at five different levels – from main class (level 1) to individual medicine (level 5) (see Annex 1). The AMC data for ATC category J01 are analysed to give both country- or area-specific trends in antimicrobial consumption and trends and differences in cross-national comparisons.
This report focuses on four types of key measure used to examine trends over time within countries and areas and in cross-national comparisons (Table 3.2):
• volume of consumption measures, reported as numbers of DID;• relative consumption measures, expressed as a percentage of total consumption of a group
of antimicrobials;• the agents consumed, reflecting the choice of specific antimicrobial agents within a class and
allowing more focused assessment of whether the choices align with recommended best practices and clinical practice guidelines;
• utilization of the 10 most consumed agents.
Table 3.2 Metrics used in analyses over time and in cross-national comparisons
Category Unit
Estimates of volumes of consumption of antibacterials for systemic use (J01)
Total consumption of J01 antibacterials by route of administration DIDa
Total consumption of J01 antibacterials by pharmacological subgroup: - tetracyclines (J01A) - amphenicols (J01B) - beta-lactams (J01C) - cephalosporins (J01D) - sulfonamides and trimethoprim (J01E) - macrolides, lincosamides and streptogramins (J01F) - quinolone antibacterials (J01M) - other J01 antibacterials (J01G, J01R, J01X)
DID
Relative consumption of J01 antibacterials by subgroup
Relative consumption of J01 antibacterials by pharmacological subgroup %
Consumption of cephalosporins and quinolones as a proportion of total consumption of J01 antibacterials %
Relative consumption by choice of agent
Relative consumption of agents of cephalosporins by generation %
Relative consumption of cephalosporins by generation: - choice of first-generation cephalosporins (J01DB) - choice of second-generation cephalosporins (J01DC) - choice of third-generation cephalosporins (J01DD) - choice of fourth-generation cephalosporins (J01DE)
%
Relative consumption of agents within fluoroquinolones (J01MA) %
Relative consumption of amoxicillin and amoxicillin and clavulanic acid %
The 10 most consumed agents
The 10 most consumed agents – oral formulation DID
The 10 most consumed agents – parenteral formulation DID
a DID: DDD/1000 inhabitants per day.
3. DATA COLLECTION AND ANALYSIS

9
3.3.2.1 Route of administrationOral administration is generally regarded as the most acceptable and economical method of administration of antimicrobials. Hospitalized patients initially on intravenous antibiotics can often be safely switched to an oral equivalent once they are clinically stable. Oral medication is associated with fewer complications, lower health care costs and earlier hospital discharge. Nevertheless, it must be recognized that there may also be cultural and medical practice traditions that favour use of parenteral formulations in some settings.
This report includes analyses of use of oral and parenteral formulations for J01 medicines. Where use of parenteral formulations is comparatively high, there may be opportunities to increase use of oral formulations without loss of clinical efficacy.
3.3.2.2 Total consumption in DDD per 1000 inhabitants per dayThe DDD per 1000 inhabitants per day (abbreviated to DID) is the most commonly reported metric of antimicrobial consumption and the most frequently used measure in cross-national comparisons (see Chapter 16).
It should be noted that only medicines assigned an ATC code and DDD are included in the analyses reported here. In several countries in the WHO AMC Network, a number of medicines without such codes are consumed by the population. Exclusion of these medicines means that data are missing in the numerator for the calculation, and the resulting DID estimates will underestimate total antimicrobial consumption in the country.
3.3.2.3 Quinolones and cephalosporinsQuinolones and cephalosporins are broad-spectrum antibiotics and are considered second-line antibiotics in most prescribing guidelines (Adriaenssens et al., 2011a). Thus, their use should be restricted to ensure availability as second-line therapy, should first-line antibiotics fail.
Guidance from authorities such as Public Health England (2016) suggests that simple generic antibiotics should be used if possible when antibiotics are necessary. Broad-spectrum antibiotics (for example, amoxicillin and clavulanic acid, quinolones and cephalosporins) need to be reserved to treat resistant disease. They should generally be used only when narrow-spectrum antibiotics are ineffective because they increase the risk of methicillin-resistant Staphylococcus aureus, Clostridium difficile and resistant urinary tract infections.
Public Health England also notes that although identifying the cephalosporin and quinolone classes as high risk may have been an important control measure in reducing the risk of Clostridium difficile infection, an unintended consequence may have been a recent increase in clinically inappropriate prescribing of co-amoxiclav and other broad-spectrum antibiotics, such as piperacillin-tazobactam. These alternative antibiotics have a very limited set of recommended clinical indications.
WHO (2012) identifies fluoroquinolones, third- and fourth-generation cephalosporins, macrolides and glycopeptides as being of highest priority for risk management to ensure that critically important antimicrobials are used prudently both in human and veterinary medicine. While there is no optimal level of prescribing of quinolones and cephalosporins, their volume as a proportion of all antibiotic prescribing has been validated as a marker of quality in the primary care setting (Adriaenssens et al., 2011b) – see Annex 2.
3. DATA COLLECTION AND ANALYSIS

10
3.3.2.4 FluoroquinolonesFluoroquinolones (J01MA) are the most widely used agents within the quinolone antibacterials (J01M) group. Public Health England identifies the prescribing of fluoroquinolones such as ciprofloxacin and ofloxacin in general practice as a cause for concern. Resistance to quinolones has increased at a considerable rate (for example, quinolone-resistant Neisseria gonorrhoeae) and is usually high level, affecting all the quinolones. Public Health England guidance on managing common infections recommends that quinolones are used as first-line treatment only for acute pyelonephritis, acute prostatitis, epididymitis and pelvic inflammatory disease. The guidance suggests that fluoroquinolones should be used in lower respiratory tract infections only when there is proven resistance to other antibiotics.
3.3.2.5 CephalosporinsThird- and fourth-generation cephalosporins have a broader spectrum of activity than first- and second-generation agents, with enhanced coverage of both Gram-positive and Gram-negative organisms.
3.3.2.6 Amoxicillin, amoxicillin and clavulanic acidThe addition of clavulanic acid to amoxicillin extends the spectrum of activity of amoxicillin against beta-lactamase-producing bacteria. Amoxicillin and clavulanic acid is recommended as second-line treatment in many treatment guidelines.
Further details of measurement metrics and quality indicators for antimicrobial consumption are provided in Annex 3.
3.4 Data interpretation
The goal of the AMC surveillance data collected and presented in this report is to provide a description of consumption of the antimicrobials in class J01. For a correct assessment of the magnitude and trends of antimicrobial consumption in the country or area and to allow cross-national comparison of results, the data are required to be both valid and reliable.
The validity and reliability of data may be compromised at different points, however. These include:
• incomplete registration of antimicrobial products in circulation in the country• incomplete capture and reporting of data• double counting of medicines from different data sources• errors in data entry that were not identified during data validation• data excluded from calculations where no ATC or DDD is assigned for the medicine.
Together these errors will affect the absolute values for antimicrobial consumption (measured in DID).
Incomplete data capture may occur when not all wholesalers provide data on products sold. Sales data from local manufacturers need to distinguish between medicines for local consumption and medicines exported.
In a number of countries and areas participating in the WHO AMC Network, no ATC or DDD is assigned to a considerable number of products. Consumption of these medicines is excluded from
3. DATA COLLECTION AND ANALYSIS

11
the analyses reported here, meaning that total consumption estimates presented underestimate actual consumption of antibacterials.
The WHO Regional Office for Europe is working with participants in the WHO AMC Network and the WHO Collaborating Centre for Drug Statistics Methodology to identify products without codes and to resolve these for future analyses.
3.4.1 Import data
A particular issue with data derived from importation records is that the estimates will be affected by the cycles of procurement and delivery. For example, if tenders apply for a two-year period, it is unlikely that deliveries will occur in similar quantities and at regular intervals during that time. Receipt of two or more deliveries in one year may be followed by importation of smaller quantities in the next. This may give rise to fluctuations in estimates of consumption that do not relate to use of antibacterials by patients and health care facilities.
Import cycles are also likely to mean that different products are received at different times. Thus, relative use estimates may also be affected. Notwithstanding these limitations, it is reasonable to assume that over a longer period the relative use estimates will stabilize and more closely reflect the relative consumption of different antibacterial agents. Consequently, trends over time need to be interpreted carefully. In general, import data should not be used to make comparisons on monthly or quarterly consumption.
The analyses in this report provide annual consumption estimates. The fluctuations in total consumption estimates from a number of countries, however, suggest that import cycles may contribute in part to the patterns of consumption shown.
3.4.2 Information value
The data presented may not yet be optimal, or systemic issues may lead to biased estimates, but recognizing these limitations may encourage WHO AMC Network countries and areas to consider using different data sources, such as wholesaler rather than import data. Later, as information systems develop, it may be possible to derive consumption estimates from reimbursement records from health insurance agencies and e-prescribing platforms.
Even with the data limitations, the variability of consumption patterns within and between countries provides a basis for further investigation to better understand how antibacterials are used in practice. The consumption data need to be interpreted with an understanding of the local context, taking account of changes in regulations (including enforcement of prescription-only status), data sources, resistance patterns and the potential impact of interventions to change practices.
3. DATA COLLECTION AND ANALYSIS

12
4. ALBANIA
4.1 Data sources and years of data collection
Albania provided data for each of the four years of data collection (2011–2014). The main sources were import records provided by the drug agency (Table 4.1).
Table 4.1 Sources of data used for consumption estimates (2011–2014)
Year Health care sector coverage Data type Data source
(consumption) Population Data source (population)
2011 Total care Import records Drug agency 2 904 780 World Bank
2012 Total care Import records Drug agency 2 900 489 World Bank
2013 Total care Import records Drug agency 2 897 366 World Bank
2014 Total care Import records Drug agency 2 893 654 World Bank
4.2 Estimates of volumes of consumption of antibacterials for systemic use (J01)
Total consumption of antibacterials for systemic use (ATC class J01) is examined by route of administration (oral and parenteral formulations) and by pharmacological subgroup.
4.2.1 Total consumption of J01 antibacterials by route of administration
The consumption of oral and parenteral (injectable) formulations of J01 antibacterials is shown in Fig. 4.1 and summarized in Table 4.2 as DDD/1000 inhabitants per day (DID).
The import data show some fluctuations in total consumption over time (25.1 DID in 2011 to 22.7 DID in 2014); however, this might be explained in part by import cycles for these medicines.

13
The relative consumption of parenteral antibacterials remained reasonably stable at around 7-8% of total J01 consumption (Table 4.2).
Table 4.2 Total consumption of J01 antibacterials by route of administration
Route of administrationDDD/1000 inhabitants per daya (% of totalb)
2011 2012 2013 2014
Oral J01 23.8 (95) 19.6 (93) 16.3 (93) 21 (92)
Parenteral J01 1.4 (5) 1.5 (7) 1.3 (7) 1.8 (8)
Total 25.1 21.1 17.5 22.7
a DDD: daily defined dose. b Total amounts and percentages may vary slightly owing to rounding.
4.2.2 Total consumption of J01 antibacterials by pharmacological subgroup
The consumption of J01 antibacterials by pharmacological subgroup is shown in Fig. 4.2 and summarized in Table 4.3.
Numerically, the largest changes in consumption of pharmacological subgroups occurred in the tetracyclines subgroup (J01A), which decreased from 7.8 DID in 2011 to 3.6 DID in 2014. The highest levels of consumption were in beta-lactams (J01C), at 8.6 DID in 2011 and 9.9 DID in 2014. There were trends towards increasing use of beta-lactams (J01C), cephalosporins (J01D) and macrolides, lincosamides and streptogramins (J01F) between 2011 and 2014.
4. ALBANIA
0
5
10
15
20
25
30
DD
D/1
000
inha
bita
nts
per
day
Parenteral antibacterials
Oral antibacterials
ALB2013
ALB2012
ALB2011
ALB2014
Fig. 4.1 Total consumption of J01 antibacterials by route of administration
DDD: defined daily dose.

14
Table 4.3 Total consumption of J01 antibacterials by pharmacological subgroup
Class of antibacterial agentsDDD/1000 inhabitants per daya
2011 2012 2013 2014
Tetracyclines (J01A) 7.8 0.9 2.3 3.6
Amphenicols (J01B) 0.2 0.1 0.1 0.1
Beta-lactams (J01C) 8.6 9.6 7.8 9.9
Cephalosporins (J01D) 2.7 3.3 2.4 3.6
Sulfonamides and trimethoprim (J01E) 0.9 0.8 0.5 0.2
Macrolides, lincosamides and streptogramins (J01F) 1.3 1.5 2.1 2.0
Quinolone antibacterials (J01M) 2.7 3.6 1.9 2.4
Other J01 antibacterials (J01G, J01R, J01X) 1.0 1.2 0.5 0.8
Totalb 25.1 21.1 17.5 22.7
a DDD: daily defined dose. b Total amounts may vary slightly owing to rounding.
4.3 Relative consumption of J01 antibacterials by subgroup
4.3.1 Relative consumption of J01 antibacterials by pharmacological subgroup
The relative consumption of pharmacological subgroups measured as a proportion of total J01 antibacterials is shown in Fig. 4.3 and summarized in Table 4.4.
There has been a decline in consumption of tetracylines (J01A) over time. While it is a quantitatively a smaller decline, consumption of sulfonamides and trimethoprim (J01E) also decreased over time (from 3.5% of total J01 consumption in 2011 to 0.7% in 2014) (Table 4.4).
0
5
10
15
20
25
30
DD
D/1
000
inha
bita
nts
per
day
ALB2013
ALB2012
ALB2011
ALB2014
Quinolone antibacterials (J01M)
Macrolides, lincosamides and streptogramins (J01F)
Sulfonamides and trimethoprim (J01E)
Cephalosporins (J01D)
Beta-lactams (J01C)
Amphenicols (J01B)
Other J01 antibacterials
Tetracyclines (J01A)
Fig. 4.2 Total consumption of J01 antibacterials by pharmacological subgroup
DDD: defined daily dose.
4. ALBANIA

15
Table 4.4 Relative consumption of J01 antibacterials by pharmacological subgroup
Class of antibacterial agentsConsumption as proportion of total J01 consumption (%)a
2011 2012 2013 2014
Tetracyclines (J01A) 31.2 4.5 13.2 16.0
Amphenicols (J01B) 0.7 0.3 0.6 0.4
Beta-lactams (J01C) 34.2 45.7 44.2 43.7
Cephalosporins (J01D) 10.6 15.5 13.5 15.9
Sulfonamides and trimethoprim (J01E) 3.5 3.9 2.7 0.7
Macrolides, lincosamides and streptogramins (J01F) 5.4 7.1 11.8 9.0
Quinolone antibacterials (J01M) 10.7 17.3 11.0 10.7
Other J01 antibacterials (J01G, J01R, J01X) 3.9 5.7 2.9 3.6
a Total percentages may vary slightly owing to rounding.
Beta-lactams (J01C) was the most consumed pharmacological subgroup in 2011–2014, at 43.7% of total J01 consumption in 2014, followed by the tetracyclines (J01A), at 16%, cephalosporins (J01D), at 15.9%, and quinolone antibacterials (J01M), at 10.7%.
4.3.2 Consumption of cephalosporins and quinolones as a proportion of total consumption of J01 antibacterials
Cephalosporins and quinolones are broad-spectrum antibiotics and are considered second-line antibiotics in most prescribing guidelines. Generally, it is recommended that their use should be restricted to ensure availability as second-line therapy, should first-line antibiotics fail.
0%
20%
40%
60%
80%
100%
Pro
port
ion
of to
tal
J01
anti
bact
eria
l con
sum
ptio
n
ALB2013
ALB2012
ALB2011
ALB2014
Quinolone antibacterials (J01M)
Macrolides, lincosamides and streptogramins (J01F)
Sulfonamides and trimethoprim (J01E)
Cephalosporins (J01D)
Beta-lactams (J01C)
Amphenicols (J01B)
Other J01 antibacterials
Tetracyclines (J01A)
Fig. 4.3 Relative consumption of J01 antibacterials by pharmacological subgroup
4. ALBANIA

16
The relative consumption of cephalosporins and quinolones measured as a proportion of total J01 antibacterials is shown in Fig. 4.4 and summarized in Table 4.5.
Consumption of quinolone antibacterials was reasonably stable in 2011–2014 (at around 11% of total J01 consumption), while the data suggest an increase in consumption of cephalosporins during the period. Together, the two groups constituted 27% of J01 antibacterial consumption in 2014 (Table 4.5).
Table 4.5 Consumption of cephalosporins and quinolones as a proportion of total consumption of J01 antibacterials
Class of antibacterial agentsDDD/1000 inhabitants per daya (% of totalb)
2011 2012 2013 2014
Quinolone antibacterials (J01M) 2.7 (11) 3.6 (17) 1.9 (11) 2.4 (11)
Cephalosporins (J01D) 2.7 (11) 3.3 (16) 2.4 (13) 3.6 (16)
Other J01 antibacterials 19.8 (79) 14.1 (67) 13.2 (75) 16.7 (73)
Total 25.1 21.1 17.5 22.7
a DDD: daily defined dose. b Total amounts and percentages may vary slightly owing to rounding.
4.4 Relative consumption by choice of agent
4.4.1 Relative consumption of cephalosporins by generation
Third- and fourth-generation cephalosporins have a broader spectrum of activity than first- and second-generation agents, with enhanced coverage of both Gram-positive and Gram-negative
0%
20%
40%
60%
80%
100%
Pro
port
ion
of to
tal
J01
anti
bact
eria
l con
sum
ptio
n
ALB2013
ALB2012
ALB2011
ALB2014
Other J01 antibacterials
Cephalosporins (J01D)
Quinolone antibacterials (J01M)
Fig. 4.4 Consumption of cephalosporins and quinolones as a proportion of total consumption of J01 antibacterials
4. ALBANIA

17
organisms. WHO (2012) has identified third- and fourth-generation cephalosporins as some of the agents of highest priority for risk management to ensure that critically important antimicrobials are used prudently both in human and veterinary medicine.
The relative consumption of first-, second-, third- and fourth-generation cephalosporins in 2011–2014 is shown in Fig. 4.5 and summarized in Table 4.6.
Consumption of fourth-generation cephalosporins was very limited (<0.1 DID) during 2011–2014, but consumption of third-generation agents increased (from 19% in 2011 to 30% in 2014) and consumption of first- and second-generation agents decreased from 81% to 70% of total cephalosporin use across the period (Table 4.6).
Table 4.6 Relative consumption of cephalosporins by generation
GenerationDDD/1000 inhabitants per daya (% of totalb)
2011 2012 2013 2014
First-generation (J01DB) 0.7 (28) 1.1 (34) 0.5 (21) 0.9 (24)
Second-generation (J01DC) 1.4 (53) 1.5 (45) 1.3 (54) 1.7 (46)
Third-generation (J01DD) 0.5 (19) 0.7 (21) 0.6 (24) 1.1 (30)
Fourth-generation (J01DE) <0.1 <0.1 <0.1 <0.1
Total 2.7 3.3 2.4 3.6
a DDD: daily defined dose. b Total amounts and percentages may vary slightly owing to rounding.
0%
20%
40%
60%
80%
100%
Pro
port
ion
of t
otal
ce
phal
ospo
rin
cons
umpt
ion
ALB2013
ALB2012
ALB2011
ALB2014
Fourth-generation (J01DE)
Third-generation (J01DD)
Second-generation (J01DC)
First-generation (J01DB)
Fig. 4.5 Relative consumption of cephalosporins by generation
4. ALBANIA

18
4.4.1.1 Choice of first-generation cephalosporins (J01DB)Table 4.7 summarizes the pattern of consumption of first-generation cephalosporins in 2011–2014. Cefalexin and cefazolin were those most consumed agents.
Table 4.7 Relative consumption of agents within first-generation cephalosporins (J01DB)
AgentDDD/1000 inhabitants per daya (% of totalb)
2011 2012 2013 2014
Cefalexin 0.5 (74) 0.8 (75) 0.4 (71) 0.4 (47)
Cefazolin 0.2 (26) 0.3 (25) 0.1 (28) 0.4 (53)
Cefradine – – <0.1 <0.1
Total 0.7 1.1 0.5 0.9
a DDD: daily defined dose. b Total amounts and percentages may vary slightly owing to rounding.
4.4.1.2 Choice of second-generation cephalosporins (J01DC)Table 4.8 summarizes the pattern of consumption of second-generation cephalosporins in 2011–2014. Cefuroxime and cefaclor were those most consumed.
Table 4.8 Relative consumption of agents within second-generation cephalosporins (J01DC)
AgentDDD/1000 inhabitants per daya (% of totalb)
2011 2012 2013 2014
Cefuroxime 0.6 (46) 0.6 (40) 0.8 (64) 1.1 (64)
Cefaclor 0.7 (52) 0.8 (58) 0.4 (33) 0.5 (33)
Cefonicide <0.1 <0.1 <0.1 –
Cefprozil <0.1 <0.1 <0.1 <0.1
Total 1.4 1.5 1.3 1.7
a DDD: daily defined dose. b Total amounts and percentages may vary slightly owing to rounding.
4.4.1.3 Choice of third-generation cephalosporins (J01DD)Table 4.9 summarizes the pattern of consumption of third-generation cephalosporins in 2011–2014. Ceftriaxone and cefixime were those most consumed.
Table 4.9 Relative consumption of agents within third-generation cephalosporins (J01DD)
AgentDDD/1000 inhabitants per daya (% of totalb)
2011 2012 2013 2014
Cefotaxime <0.1 <0.1 <0.1 <0.1
Ceftazidime <0.1 <0.1 <0.1 <0.1
Ceftriaxone 0.3 (55) 0.3 (44) 0.3 (48) 0.6 (52)
Cefixime 0.2 (40) 0.3 (50) 0.2 (42) 0.4 (38)
Cefpodoxime – – – <0.1
Cefdinir – – <0.1 <0.1
Total 0.5 0.7 0.6 1.1
a DDD: daily defined dose. b Total amounts and percentages may vary slightly owing to rounding.
4. ALBANIA

19
4.4.1.4 Choice of fourth-generation cephalosporins (J01DE)Consumption of fourth-generation cephalosporins was low during 2011–2014, with cefpirome consumed in small amounts.
4.4.2 Relative consumption of agents within fluoroquinolones (J01MA)
Quinolone antibacterials comprised around 11% of consumption of J01 antibacterials during 2011–2014 (see Table 4.4). Around 90% of quinolone consumption was from the fluoroquinolone category (J01MA). The most consumed agents were ciprofloxacin and levofloxacin (Table 4.10).
Table 4.10 Relative consumption of agents within fluoroquinolones (J01MA)
AgentDDD/1000 inhabitants per daya (% of totalb)
2011 2012 2013 2014
Ciprofloxacin 1.3 (52) 1.9 (53) 1.6 (86) 1.8 (79)
Norfloxacin 0.2 (7) 0.3 (9) <0.1 0.1 (5)
Rufloxacin <0.1 <0.1 <0.1 –
Levofloxacin 0.1 (6) 0.1 (4) 0.1 (8) 0.3 (15)
Moxifloxacin 0.9 (36) 1.2 (34) <0.1 <0.1
Total 2.4 3.5 1.8 2.3
a DDD: daily defined dose. b Total amounts and percentages may vary slightly owing to rounding.
4.4.3 Relative consumption of amoxicillin, amoxicillin and clavulanic acid
The addition of clavulanic acid to amoxicillin extends the spectrum of activity of amoxicillin against beta-lactamase-producing bacteria. Amoxicillin and clavulanic acid is recommended as second-line treatment in many treatment guidelines.
Table 4.11 summarizes the relative consumption of amoxicillin and broader-spectrum amoxicillin and clavulanic acid. Amoxicillin was the more consumed agent in all years reported.
Table 4.11 Relative consumption of amoxicillin and amoxicillin and clavulanic acid
AgentDDD/1000 inhabitants per daya (% of totalb)
2011 2012 2013 2014
Amoxicillin (J01CA04) 5.4 (70) 5.9 (64) 3.7 (53) 5.8 (63)
Amoxicillin and clavulanic acid (J01CR02) 2.4 (30) 3.3 (36) 3.3 (47) 3.4 (37)
Total 7.8 9.1 7.0 9.1
a DDD: daily defined dose. b Total amounts and percentages may vary slightly owing to rounding.
4. ALBANIA

20
4.5 The 10 most consumed agents
While the number of J01 antibacterial agents available is large, there is considerable evidence from ESAC-Net and other analyses that consumption tends to be concentrated in a relatively small number.
4.5.1 The 10 most consumed agents – oral formulation
Table 4.12 summarizes consumption of the oral agents that comprise the 10 most consumed in 2014. Seven agents (amoxicillin, amoxicillin and enzyme inhibitor, tetracycline, ciprofloxacin, doxycycline, azithromycin and cefuroxime) account for just over 76% of consumption.
4.5.2 The 10 most consumed agents – parenteral formulation
Table 4.13 summarizes consumption of the 10 most consumed parenteral agents in 2014. Four of these (ceftriaxone, cefazolin, gentamicin and ciprofloxacin) account for just over 77% of consumption.
Table 4.12 The 10 most consumed agents – oral formulation (2014)
AgentDDD/1000 inhabitants per daya
Top 10 Top 9 Top 8 Top 7 Top 6 Top 5 Top 4 Top 3 Top 2 Top 1
Amoxicillin 5.78 5.78 5.78 5.78 5.78 5.78 5.78 5.78 5.78 5.78
Amoxicillin and enzyme inhibitor 3.36 3.36 3.36 3.36 3.36 3.36 3.36 3.36 3.36
Tetracycline 2.08 2.08 2.08 2.08 2.08 2.08 2.08 2.08
Ciprofloxacin 1.72 1.72 1.72 1.72 1.72 1.72 1.72
Doxycycline 1.09 1.09 1.09 1.09 1.09 1.09
Azithromycin 1.00 1.00 1.00 1.00 1.00
Cefuroxime 0.98 0.98 0.98 0.98
Clarithromycin 0.78 0.78 0.78
Ampicillin 0.60 0.60
Cefaclor 0.54
Total consumption for this group of agents
17.93 17.39 16.79 16.01 15.04 14.03 12.94 11.22 9.14 5.78
Total consumption for all oral J01 antibacterials
20.96 20.96 20.96 20.96 20.96 20.96 20.96 20.96 20.96 20.96
Proportion (%) of total consumption for oral J01 antibacterials
85.6% 83.0% 80.1% 76.4% 71.7% 67.0% 61.8% 53.5% 43.6% 27.6%
a DDD: daily defined dose.
4. ALBANIA

21
4.6 Comments
The analyses presented in this chapter are based on import records, and the results suggest that import cycles may have an impact on the estimates and explain (in part) the fluctuations between years.
Consideration could be given to exploring the use of additional data sources, such as wholesaler data, to create more robust consumption estimates, including disaggregation to community and hospital sectors. A more detailed understanding of the patterns of antimicrobial consumption would identify areas for further investigation and allow development of targeted interventions to address potential problems identified in the consumption of antibacterials.
Table 4.13 The 10 most consumed agents – parenteral formulation (2014)
AgentDDD/1000 inhabitants per daya
Top 10 Top 9 Top 8 Top 7 Top 6 Top 5 Top 4 Top 3 Top 2 Top 1
Ceftriaxone 0.55 0.55 0.55 0.55 0.55 0.55 0.55 0.55 0.55 0.55
Cefazolin 0.45 0.45 0.45 0.45 0.45 0.45 0.45 0.45 0.45
Gentamicin 0.27 0.27 0.27 0.27 0.27 0.27 0.27 0.27
Ciprofloxacin 0.12 0.12 0.12 0.12 0.12 0.12 0.12
Ampicillin 0.09 0.09 0.09 0.09 0.09 0.09
Cefuroxime 0.08 0.08 0.08 0.08 0.08
Metronidazole 0.07 0.07 0.07 0.07
Amikacin 0.04 0.04 0.04
Cefotaxime 0.04 0.04
Cefepime 0.02
Total consumption for this group of agents
1.73 1.71 1.67 1.63 1.56 1.48 1.39 1.27 1.00 0.55
Total consumption for all parental J01 antibacterials
1.79 1.79 1.79 1.79 1.79 1.79 1.79 1.79 1.79 1.79
Proportion (%) of total consumption for parental J01 antibacterials
97.0% 95.8% 93.5% 91.1% 87.4% 82.8% 77.7% 71.2% 56.0% 30.8%
a DDD: daily defined dose.
4. ALBANIA

22
5. ARMENIA
5.1 Data sources and years of data collection
Armenia provided data for each of the four years of data collection (2011–2014). The main sources were import records provided by the drug agency and information provided by local pharmaceutical manufacturers (Table 5.1). Further information on the estimates provided by local manufacturers was not available.
Table 5.1 Sources of data used for consumption estimates (2011–2014)
Year Health care sector coverage Data type Data source
(consumption) Population Data source (population)
2011 Total care Import recordsSales records
Drug agencyLocal manufacturers 2 964 120 World Bank
2012 Total care Import recordsSales records
Drug agencyLocal manufacturers 2 969 081 World Bank
2013 Total care Import recordsSales records
Drug agencyLocal manufacturers 2 976 566 World Bank
2014 Total care Import recordsSales records
Drug agencyLocal manufacturers 3 006 154 World Bank
5.2 Estimates of volumes of consumption of antibacterials for systemic use (J01)
Total consumption of antibacterials for systemic use (ATC class J01) is examined by route of administration (oral and parenteral formulations) and by pharmacological subgroup.
5.2.1 Total consumption of J01 antibacterials by route of administration
The consumption of oral and parenteral (injectable) formulations of J01 antibacterials is shown in Fig. 5.1 and summarized in Table 5.2 as DDD/1000 inhabitants per day (DID).
The data show some fluctuations in total consumption of J01 antibacterials over time, with the highest levels in 2011 (15.9 DID), a fall in 2012, then increasing consumption estimates between

23
2012 and 2014. It is unclear whether the results relate to a true reduction in consumption in 2012, changes in data sources or the influence of medicine import cycles. Further investigation is required to explain these observations.
The relative consumption of parenteral antibacterials remained reasonably stable at around 10–12% of total J01 consumption (Table 5.2).
Table 5.2 Total consumption of J01 antibacterials by route of administration
Route of administrationDDD/1000 inhabitants per daya (% of totalb)
2011 2012 2013 2014
Oral J01 14.2 (89) 10 (88) 12.2 (88) 12.9 (90)
Parenteral J01 1.7 (11) 1.4 (12) 1.7 (12) 1.5 (10)
Total 15.9 11.4 13.9 14.4
a DDD: daily defined dose. b Total amounts and percentages may vary slightly owing to rounding.
5.2.2 Total consumption of J01 antibacterials by pharmacological subgroup
The consumption of J01 antibacterials by pharmacological subgroup is shown in Fig. 5.2 and summarized in Table 5.3.
5. ARMENIA
0
5
10
15
20
DD
D/1
000
inha
bita
nts
per
day
Parenteral antibacterials
Oral antibacterials
ARM2013
ARM2012
ARM2011
ARM2014
Fig. 5.1 Total consumption of J01 antibacterials by route of administration
DDD: defined daily dose.

24
The highest levels of consumption were in beta-lactams (J01C), at 6.3 DID in 2011 and 5.6 DID in 2014, and tetracyclines (J01A), at 2.1 DID in 2011 and 2 DID in 2014 (Table 5.3).
Table 5.3 Total consumption of J01 antibacterials by pharmacological subgroup
Class of antibacterial agentsDDD/1000 inhabitants per daya
2011 2012 2013 2014
Tetracyclines (J01A) 2.1 2.2 1.5 2.0
Amphenicols (J01B) 0.4 0.4 0.5 0.4
Beta-lactams (J01C) 6.3 3.5 5.5 5.6
Cephalosporins (J01D) 1.2 1.2 1.2 1.4
Sulfonamides and trimethoprim (J01E) 1.5 1.3 1.2 1.4
Macrolides, lincosamides and streptogramins (J01F) 1.3 0.9 1.4 1.4
Quinolone antibacterials (J01M) 2.0 1.1 1.5 1.5
Other J01 antibacterials (J01G, J01R, J01X) 1.1 0.8 1.1 0.7
Totalb 15.9 11.4 13.9 14.4
a DDD: daily defined dose. b Total amounts may vary slightly owing to rounding.
5.3 Relative consumption of J01 antibacterials by subgroup
5.3.1 Relative consumption of J01 antibacterials by pharmacological subgroup
The relative consumption of pharmacological subgroups measured as a proportion of total J01 antibacterials is shown in Fig. 5.3 and summarized in Table 5.4.
0
5
10
15
20
DD
D/1
000
inha
bita
nts
per
day
ARM2013
ARM2012
ARM2011
ARM2014
Quinolone antibacterials (J01M)
Macrolides, lincosamides and streptogramins (J01F)
Sulfonamides and trimethoprim (J01E)
Cephalosporins (J01D)
Beta-lactams (J01C)
Amphenicols (J01B)
Other J01 antibacterials
Tetracyclines (J01A)
Fig. 5.2 Total consumption of J01 antibacterials by pharmacological subgroup
DDD: defined daily dose.
5. ARMENIA
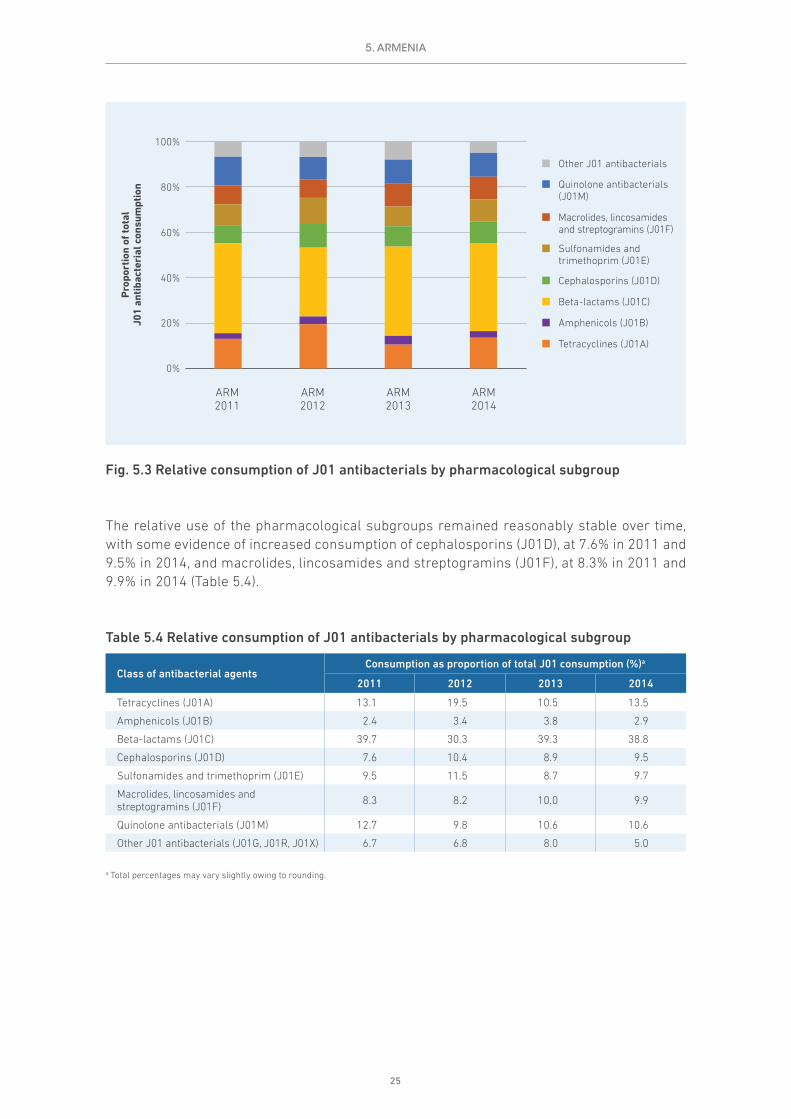
25
The relative use of the pharmacological subgroups remained reasonably stable over time, with some evidence of increased consumption of cephalosporins (J01D), at 7.6% in 2011 and 9.5% in 2014, and macrolides, lincosamides and streptogramins (J01F), at 8.3% in 2011 and 9.9% in 2014 (Table 5.4).
Table 5.4 Relative consumption of J01 antibacterials by pharmacological subgroup
Class of antibacterial agentsConsumption as proportion of total J01 consumption (%)a
2011 2012 2013 2014
Tetracyclines (J01A) 13.1 19.5 10.5 13.5
Amphenicols (J01B) 2.4 3.4 3.8 2.9
Beta-lactams (J01C) 39.7 30.3 39.3 38.8
Cephalosporins (J01D) 7.6 10.4 8.9 9.5
Sulfonamides and trimethoprim (J01E) 9.5 11.5 8.7 9.7
Macrolides, lincosamides and streptogramins (J01F) 8.3 8.2 10.0 9.9
Quinolone antibacterials (J01M) 12.7 9.8 10.6 10.6
Other J01 antibacterials (J01G, J01R, J01X) 6.7 6.8 8.0 5.0
a Total percentages may vary slightly owing to rounding.
0%
20%
40%
60%
80%
100%
Pro
port
ion
of to
tal
J01
anti
bact
eria
l con
sum
ptio
n
ARM2013
ARM2012
ARM2011
ARM2014
Quinolone antibacterials (J01M)
Macrolides, lincosamides and streptogramins (J01F)
Sulfonamides and trimethoprim (J01E)
Cephalosporins (J01D)
Beta-lactams (J01C)
Amphenicols (J01B)
Other J01 antibacterials
Tetracyclines (J01A)
Fig. 5.3 Relative consumption of J01 antibacterials by pharmacological subgroup
5. ARMENIA

26
5.3.2 Consumption of cephalosporins and quinolones as a proportion of total consumption of J01 antibacterials
Cephalosporins and quinolones are broad-spectrum antibiotics and are considered second-line antibiotics in most prescribing guidelines. Generally, it is recommended that their use should be restricted to ensure availability as second-line therapy, should first-line antibiotics fail.
The relative consumption of cephalosporins and quinolones measured as a proportion of total J01 antibacterials is shown in Fig. 5.4 and summarized in Table 5.5.
There were small relative increases in consumption of cephalosporins, while consumption of quinolone antibacterials was stable. Together these two categories constituted 21% of J01 antibacterial consumption in 2014 (Table 5.5).
Table 5.5 Consumption of cephalosporins and quinolones as a proportion of total consumption of J01 antibacterials
Class of antibacterial agentsDDD/1000 inhabitants per daya (% of totalb)
2011 2012 2013 2014
Quinolone antibacterials (J01M) 2 (13) 1.1 (10) 1.5 (11) 1.5 (11)
Cephalosporins (J01D) 1.2 (8) 1.2 (10) 1.2 (9) 1.4 (10)
Other J01 antibacterials 12.7 (80) 9.1 (80) 11.2 (80) 11.5 (80)
Total 15.9 11.4 13.9 14.4
a DDD: daily defined dose. b Total amounts and percentages may vary slightly owing to rounding.
0%
20%
40%
60%
80%
100%
Pro
port
ion
of to
tal
J01
anti
bact
eria
l con
sum
ptio
n
ARM2013
ARM2012
ARM2011
ARM2014
Other J01 antibacterials
Cephalosporins (J01D)
Quinolone antibacterials (J01M)
Fig. 5.4 Consumption of cephalosporins and quinolones as a proportion of total consumption of J01 antibacterials
5. ARMENIA

27
5.4 Relative consumption by choice of agent
5.4.1 Relative consumption of cephalosporins by generation
Third- and fourth-generation cephalosporins have a broader spectrum of activity than first- and second-generation agents, with enhanced coverage of both Gram-positive and Gram-negative organisms. WHO (2012) has identified third- and fourth-generation cephalosporins as some of the agents of highest priority for risk management to ensure that critically important antimicrobials are used prudently both in human and veterinary medicine.
The relative consumption of first-, second-, third- and fourth-generation cephalosporins in 2011–2014 is shown in Fig. 5.5 and summarized in Table 5.6.
Consumption of both second- and fourth-generation cephalosporins over time was very limited. Most consumption was of third-generation agents (increasing from 60% in 2011 to 73% in 2014), matched by reductions in consumption of first- and second-generation cephalosporins combined (39% in 2011 to 27% in 2014; Table 5.6).
Table 5.6 Relative consumption of cephalosporins by generation
GenerationDDD/1000 inhabitants per daya (% of totalb)
2011 2012 2013 2014
First- and second-generation (J01DB, J01DC) 0.5 (39) 0.4 (30) 0.5 (41) 0.4 (27)
Third-generation (J01DD) 0.7 (60) 0.8 (70) 0.7 (59) 1 (73)
Fourth-generation (J01DE) <0.1 <0.1 <0.1 <0.1
Total 1.2 1.2 1.2 1.4
a DDD: daily defined dose. b Total amounts and percentages may vary slightly owing to rounding.
0%
20%
40%
60%
80%
100%
Pro
port
ion
of t
otal
ce
phal
ospo
rin
cons
umpt
ion
ARM2013
ARM2012
ARM2011
ARM2014
Fourth-generation (J01DE)
Third-generation (J01DD)
Second-generation (J01DC)
First-generation (J01DB)
Fig. 5.5 Relative consumption of cephalosporins by generation
5. ARMENIA

28
5.4.1.1 Choice of first-generation cephalosporins (J01DB)Table 5.7 summarizes the pattern of consumption of first-generation cephalosporins in 2011–2014. Cefalexin and cefazolin were the agents most consumed.
Table 5.7 Relative consumption of agents within first-generation cephalosporins (J01DB)
AgentDDD/1000 inhabitants per daya (% of totalb)
2011 2012 2013 2014
Cefalexin 0.1 (28) <0.1 0.1 (24) 0.1 (47)
Cefalotin <0.1 <0.1 <0.1 <0.1
Cefazolin 0.3 (72) 0.1 (62) 0.3 (76) 0.1 (53)
Cefadroxil <0.1 <0.1 <0.1 <0.1
Cefradine <0.1 <0.1 <0.1 <0.1
Total 0.4 0.2 0.4 0.2
a DDD: daily defined dose. b Total amounts and percentages may vary slightly owing to rounding.
5.4.1.2 Choice of second-generation cephalosporins (J01DC)Cefuroxime was the most consumed of the second-generation agents, with very low levels of consumption across the category.
5.4.1.3 Choice of third-generation cephalosporins (J01DD)Table 5.8 summarizes the pattern of consumption of third-generation cephalosporins in 2011–2014. Consumption was dominated by ceftriaxone.
Table 5.8 Relative consumption of agents within third-generation cephalosporins (J01DD)
AgentDDD/1000 inhabitants per daya (% of totalb)
2011 2012 2013 2014
Cefotaxime <0.1 <0.1 <0.1 <0.1
Ceftazidime <0.1 <0.1 <0.1 <0.1
Ceftriaxone 0.7 (91) 0.7 (90) 0.6 (87) 0.9 (91)
Cefixime <0.1 <0.1 <0.1 <0.1
Cefodizime <0.1 <0.1 <0.1 <0.1
Cefoperazone <0.1 <0.1 <0.1 <0.1
Cefpodoxime <0.1 <0.1 <0.1 <0.1
Ceftibuten <0.1 <0.1 <0.1 <0.1
Cefdinir <0.1 <0.1 <0.1 <0.1
Cefoperazone, combinations – – <0.1 <0.1
Total 0.7 0.8 0.7 1.0
a DDD: daily defined dose. b Total amounts and percentages may vary slightly owing to rounding.
5.4.1.4 Choice of fourth-generation cephalosporins (J01DE)Consumption of any of the fourth-generation cephalosporins was very limited.
5. ARMENIA

29
5.4.2 Relative consumption of agents within fluoroquinolones (J01MA)
Quinolone antibacterials comprised around 11% of consumption of J01 antibacterials during 2011–2014 (see Table 5.4). Almost all quinolone consumption was from the fluoroquinolone category (J01MA). The most consumed agent was ciprofloxacin, with lower consumption of ofloxacin and moxifloxacin (Table 5.9).
Table 5.9 Relative consumption of agents within fluoroquinolones (J01MA)
AgentDDD/1000 inhabitants per daya (% of totalb)
2011 2012 2013 2014
Ofloxacin 0.1 (6) 0.2 (20) 0.1 (8) 0.2 (11)
Ciprofloxacin 1.1 (58) 0.5 (52) 1 (72) 1 (71)
Pefloxacin <0.1 <0.1 <0.1 <0.1
Norfloxacin 0.1 (6) 0.1 (10) 0.1 (8) <0.1
Lomefloxacin <0.1 <0.1 <0.1 <0.1
Fleroxacin <0.1 <0.1 <0.1 <0.1
Rufloxacin <0.1 <0.1 <0.1 <0.1
Levofloxacin 0.5 (25) <0.1 <0.1 <0.1
Moxifloxacin <0.1 0.1 (10) <0.1 0.1 (10)
Gemifloxacin <0.1 <0.1 <0.1 <0.1
Gatifloxacin <0.1 <0.1 <0.1 <0.1
Total 1.9 1.0 1.4 1.4
a DDD: daily defined dose. b Total amounts and percentages may vary slightly owing to rounding.
5.4.3 Relative consumption of amoxicillin, amoxicillin and clavulanic acid
The addition of clavulanic acid to amoxicillin extends the spectrum of activity of amoxicillin against beta-lactamase-producing bacteria. Amoxicillin and clavulanic acid is recommended as second-line treatment in many treatment guidelines.
Table 5.10 summarizes the relative consumption of amoxicillin and broader-spectrum amoxicillin and clavulanic acid. Amoxicillin was the more consumed agent in all years reported, although there is evidence of increasing consumption of amoxicillin and clavulanic acid (20% in 2011, 33% in 2014).
Table 5.10 Relative consumption of amoxicillin and amoxicillin and clavulanic acid
AgentDDD/1000 inhabitants per daya (% of totalb)
2011 2012 2013 2014
Amoxicillin (J01CA04) 4.3 (80) 1.9 (64) 3.8 (76) 3.5 (67)
Amoxicillin and clavulanic acid (J01CR02) 1 (20) 1.1 (36) 1.2 (24) 1.7 (33)
Total 5.3 3.1 5.0 5.2
a DDD: daily defined dose. b Total amounts and percentages may vary slightly owing to rounding.
5. ARMENIA

30
5.5 The 10 most consumed agents
While the number of J01 antibacterial agents available is large, there is considerable evidence from ESAC-Net and other analyses that consumption tends to be concentrated in a relatively small number.
5.5.1 The 10 most consumed agents – oral formulation
Table 5.11 summarizes consumption of the oral agents that comprise the 10 most consumed in 2014. Six agents (amoxicillin, amoxicillin and enzyme inhibitor, doxycycline, sulfamethoxazole and trimethoprim, ciprofloxacin and azithromycin) account for almost 77% of consumption.
5.5.2 The 10 most consumed agents – parenteral formulation
Table 5.12 summarizes consumption of the 10 most consumed parenteral agents in 2014. Three of these (ceftriaxone, cefazolin and benzylpenicillin) account for 75% of consumption.
Table 5.11 The 10 most consumed agents – oral formulation (2014)
AgentDDD/1000 inhabitants per daya
Top 10 Top 9 Top 8 Top 7 Top 6 Top 5 Top 4 Top 3 Top 2 Top 1
Amoxicillin 3.52 3.52 3.52 3.52 3.52 3.52 3.52 3.52 3.52 3.52
Amoxicillin and enzyme inhibitor 1.69 1.69 1.69 1.69 1.69 1.69 1.69 1.69 1.69
Doxycycline 1.64 1.64 1.64 1.64 1.64 1.64 1.64 1.64
Sulfamethoxazole and trimethoprim 1.36 1.36 1.36 1.36 1.36 1.36 1.36
Ciprofloxacin 0.95 0.95 0.95 0.95 0.95 0.95
Azithromycin 0.74 0.74 0.74 0.74 0.74
Clarithromycin 0.49 0.49 0.49 0.49
Nitrofurantoin 0.49 0.49 0.49
Chloramphenicol 0.42 0.42
Tetracycline 0.32
Total consumption for this group of agents
11.62 11.30 10.89 10.40 9.90 9.16 8.20 6.84 5.21 3.52
Total consumption for all oral J01 antibacterials
12.93 12.93 12.93 12.93 12.93 12.93 12.93 12.93 12.93 12.93
Proportion (%) of total consumption for oral J01 antibacterials
89.8% 87.4% 84.2% 80.4% 76.5% 70.8% 63.4% 52.9% 40.2% 27.2%
a DDD: daily defined dose.
5. ARMENIA

31
5.6 Comments
Interpretation of the data presented in this chapter relies on an understanding of the national context. The analyses are based on import records and local manufacturer information, and the results suggest that import cycles may have an impact on the estimates and explain (in part) the fluctuations between years.
Consideration could be given to exploring the use of additional data sources, such as wholesaler data, to create more robust consumption estimates, including disaggregation to community and hospital sectors. A more detailed understanding of the patterns of antimicrobial consumption would identify areas for further investigation and allow development of targeted interventions to address potential problems identified in the consumption of antibacterials.
Table 5.12 The 10 most consumed agents – parenteral formulation (2014)
AgentDDD/1000 inhabitants per daya
Top 10 Top 9 Top 8 Top 7 Top 6 Top 5 Top 4 Top 3 Top 2 Top 1
Ceftriaxone 0.92 0.92 0.92 0.92 0.92 0.92 0.92 0.92 0.92 0.92
Cefazolin 0.13 0.13 0.13 0.13 0.13 0.13 0.13 0.13 0.13
Benzylpenicillin 0.08 0.08 0.08 0.08 0.08 0.08 0.08 0.08
Streptomycin 0.08 0.08 0.08 0.08 0.08 0.08 0.08
Ampicillin 0.04 0.04 0.04 0.04 0.04 0.04
Ciprofloxacin 0.04 0.04 0.04 0.04 0.04
Metronidazole 0.03 0.03 0.03 0.03
Moxifloxacin 0.03 0.03 0.03
Cefotaxime 0.03 0.03
Cefuroxime 0.03
Total consumption for this group of agents
1.42 1.39 1.36 1.33 1.29 1.26 1.22 1.14 1.05 0.92
Total consumption for all parental J01 antibacterials
1.51 1.51 1.51 1.51 1.51 1.51 1.51 1.51 1.51 1.51
Proportion (%) of total consumption for parental J01 antibacterials
93.8% 92.0% 90.2% 87.9% 85.6% 83.1% 80.4% 75.1% 69.6% 60.8%
a DDD: daily defined dose.
5. ARMENIA

32
6. AZERBAIJAN
6.1 Data sources and years of data collection
Azerbaijan provided data for each of the four years of data collection (2011–2014). The main sources were import records provided by the drug agency (Table 6.1).
Table 6.1 Sources of data used for consumption estimates (2011–2014)
Year Health care sector coverage Data type Data source
(consumption) Population Data source (population)
2011 Total care Import records Drug agency 9 173 082 World Bank
2012 Total care Import records Drug agency 9 295 784 World Bank
2013 Total care Import records Drug agency 9 416 801 World Bank
2014 Total care Import records Drug agency 9 535 079 World Bank
6.2 Estimates of volumes of consumption of antibacterials for systemic use (J01)
Total consumption of antibacterials for systemic use (ATC class J01) is examined by route of administration (oral and parenteral formulations) and by pharmacological subgroup.
6.2.1 Total consumption of J01 antibacterials by route of administration
The consumption of oral and parenteral (injectable) formulations of J01 antibacterials is shown in Fig. 6.1 and summarized in Table 6.2 as DDD/1000 inhabitants per day (DID).
The data indicate some considerable fluctuations in total consumption of J01 antibacterials over time (17.1 DID in 2011 to 8.5 DID in 2014), with the highest estimate in 2012. Further investigation of the data sources used and completeness of data collection are needed to better understand

33
the results of the analyses shown here. Most notable is the high relative use of parenteral antibacterials – reported as 69% of total J01 consumption in 2014 (Table 6.2).
Table 6.2 Total consumption of J01 antibacterials by route of administration
Route of administrationDDD/1000 inhabitants per daya (% of totalb)
2011 2012 2013 2014
Oral J01 9.1 (53) 9.6 (47) 5.7 (48) 2.6 (31)
Parenteral J01 8 (47) 10.9 (53) 6.1 (52) 5.8 (69)
Total 17.1 20.5 11.7 8.5
a DDD: daily defined dose. b Total amounts and percentages may vary slightly owing to rounding.
6.2.2 Total consumption of J01 antibacterials by pharmacological subgroup
The consumption of J01 antibacterials by pharmacological subgroup is shown in Fig. 6.2 and summarized in Table 6.3.
6. AZERBAIJAN
0
5
10
15
20
25
DD
D/1
000
inha
bita
nts
per
day
Parenteral antibacterials
Oral antibacterials
AZE2013
AZE2012
AZE2011
AZE2014
Fig. 6.1 Total consumption of J01 antibacterials by route of administration
DDD: defined daily dose.

34
Table 6.3 Total consumption of J01 antibacterials by pharmacological subgroup
Class of antibacterial agentsDDD/1000 inhabitants per daya
2011 2012 2013 2014
Tetracyclines (J01A) 1.4 2.2 0.8 0.6
Amphenicols (J01B) 0.5 0.6 0.3 0.1
Beta-lactams (J01C) 11.3 13.8 6.6 5.6
Cephalosporins (J01D) 0.8 0.7 0.5 0.5
Sulfonamides and trimethoprim (J01E) 0.8 0.3 0.9 0.5
Macrolides, lincosamides and streptogramins (J01F) 1.0 1.3 0.9 0.6
Quinolone antibacterials (J01M) 0.8 1.0 0.7 0.4
Other J01 antibacterials (J01G, J01R, J01X) 0.6 0.6 1.0 0.3
Totalb 17.1 20.5 11.7 8.5
a DDD: daily defined dose. b Total amounts may vary slightly owing to rounding.
Given the uncertainty surrounding the reliability of the data for 2013 and 2014, it is difficult to comment on any patterns of change in absolute volumes of consumption for pharmacological subgroups.
6.3 Relative consumption of J01 antibacterials by subgroup
6.3.1 Relative consumption of J01 antibacterials by pharmacological subgroup
The relative consumption of pharmacological subgroups measured as a proportion of total J01 antibacterials is shown in Fig. 6.3 and summarized in Table 6.4.
0
5
10
15
20
25
DD
D/1
000
inha
bita
nts
per
day
AZE2013
AZE2012
AZE2011
AZE2014
Quinolone antibacterials (J01M)
Macrolides, lincosamides and streptogramins (J01F)
Sulfonamides and trimethoprim (J01E)
Cephalosporins (J01D)
Beta-lactams (J01C)
Amphenicols (J01B)
Other J01 antibacterials
Tetracyclines (J01A)
Fig. 6.2 Total consumption of J01 antibacterials by pharmacological subgroup
DDD: defined daily dose.
6. AZERBAIJAN

35
The data illustrate the decline in relative consumption of tetracylines (J01A) and amphenicols (J01B) over time. Consumption of sulfonamides and trimethoprim (J01E) and macrolides, lincosamides and streptogramins (J01F) increased over time. Beta-lactams (J01C) was the most consumed pharmacological subgroup (65.6% of total J01 consumption in 2014) (Table 6.4).
Table 6.4 Relative consumption of J01 antibacterials by pharmacological subgroup
Class of antibacterial agentsConsumption as proportion of total J01 consumption (%)a
2011 2012 2013 2014
Tetracyclines (J01A) 8.2 10.7 6.9 6.7
Amphenicols (J01B) 2.9 3.1 2.9 0.9
Beta-lactams (J01C) 66.3 67.0 55.8 65.6
Cephalosporins (J01D) 4.4 3.5 4.4 6.1
Sulfonamides and trimethoprim (J01E) 4.6 1.3 7.4 5.6
Macrolides, lincosamides and streptogramins (J01F) 5.6 6.5 7.9 6.5
Quinolone antibacterials (J01M) 4.4 4.8 6.2 4.5
Other J01 antibacterials (J01G, J01R, J01X) 3.5 3.1 8.5 4.1
a Total percentages may vary slightly owing to rounding.
6.3.2 Consumption of cephalosporins and quinolones as a proportion of total consumption of J01 antibacterials
Cephalosporins and quinolones are broad-spectrum antibiotics and are considered second-line antibiotics in most prescribing guidelines. Generally, it is recommended that their use should be restricted to ensure availability as second-line therapy, should first-line antibiotics fail.
0%
20%
40%
60%
80%
100%
Pro
port
ion
of to
tal
J01
anti
bact
eria
l con
sum
ptio
n
AZE2013
AZE2012
AZE2011
AZE2014
Quinolone antibacterials (J01M)
Macrolides, lincosamides and streptogramins (J01F)
Sulfonamides and trimethoprim (J01E)
Cephalosporins (J01D)
Beta-lactams (J01C)
Amphenicols (J01B)
Other J01 antibacterials
Tetracyclines (J01A)
Fig. 6.3 Relative consumption of J01 antibacterials by pharmacological subgroup
6. AZERBAIJAN

36
The relative consumption of cephalosporins and quinolones measured as a proportion of total J01 antibacterials is shown in Fig. 6.4 and summarized in Table 6.5.
The consumption of cephalosporins and quinolone antibacterials was relatively stable over time. Together these two categories constitute around 10% of J01 antibacterial consumption in 2014 (Table 6.5).
Table 6.5 Consumption of cephalosporins and quinolones as a proportion of total consumption of J01 antibacterials
Class of antibacterial agentsDDD/1000 inhabitants per daya (% of totalb)
2011 2012 2013 2014
Quinolone antibacterials (J01M) 0.8 (4) 1 (5) 0.7 (6) 0.4 (4)
Cephalosporins (J01D) 0.8 (4) 0.7 (4) 0.5 (4) 0.5 (6)
Other J01 antibacterials 15.6 (91) 18.8 (92) 10.5 (89) 7.6 (89)
Total 17.1 20.5 11.7 8.5
a DDD: daily defined dose. b Total amounts and percentages may vary slightly owing to rounding.
6.4 Relative consumption by choice of agent
6.4.1 Relative consumption of cephalosporins by generation
Third- and fourth-generation cephalosporins have a broader spectrum of activity than first- and second-generation agents, with enhanced coverage of both Gram-positive and Gram-negative
0%
20%
40%
60%
80%
100%
Pro
port
ion
of to
tal
J01
anti
bact
eria
l con
sum
ptio
n
AZE2013
AZE2012
AZE2011
AZE2014
Other J01 antibacterials
Cephalosporins (J01D)
Quinolone antibacterials (J01M)
Fig. 6.4 Consumption of cephalosporins and quinolones as a proportion of total consumption of J01 antibacterials
6. AZERBAIJAN

37
organisms. WHO (2012) has identified third- and fourth-generation cephalosporins as some of the agents of highest priority for risk management to ensure that critically important antimicrobials are used prudently both in human and veterinary medicine.
The relative consumption of first-, second-, third- and fourth-generation cephalosporins in 2011–2014 is shown in Fig. 6.5 and summarized in Table 6.6.
There was very low consumption of fourth-generation cephalosporins reported, with consumption of first- and second-generation agents combined around 24% of total cephalosporin consumption. Third-generation cephalosporins were most consumed (Table 6.6).
Table 6.6 Relative consumption of cephalosporins by generation
GenerationDDD/1000 inhabitants per daya (% of totalb)
2011 2012 2013 2014
First- and second-generation (J01DB-C) 0.1 (20) 0.1 (15) 0.1 (21) 0.1 (24)
Third-generation (J01DD) 0.6 (80) 0.6 (85) 0.4 (78) 0.4 (76)
Fourth-generation (J01DE) <0.1 <0.1 <0.1 <0.1
Total 0.8 0.7 0.5 0.5
a DDD: daily defined dose. b Total amounts and percentages may vary slightly owing to rounding.
6.4.1.1 Choice of first-generation cephalosporins (J01DB)Together, first- and second-generation agents contributed 0.1 DID to total J01 consumption in 2011–2014. Levels of consumption of first-generation cephalosporins (cefalexin, cefazolin and cefadroxil) were low.
0%
20%
40%
60%
80%
100%
Pro
port
ion
of t
otal
ce
phal
ospo
rin
cons
umpt
ion
AZE2013
AZE2012
AZE2011
AZE2014
Fourth-generation (J01DE)
Third-generation (J01DD)
Second-generation (J01DC)
First-generation (J01DB)
Fig. 6.5 Relative consumption of cephalosporins by generation
6. AZERBAIJAN

38
6.4.1.2 Choice of second-generation cephalosporins (J01DC)Levels of consumption of second-generation cephalosporins (cefuroxime, cefaclor) were low in 2011–2014.
6.4.1.3 Choice of third-generation cephalosporins (J01DD)Table 6.7 summarizes the pattern of consumption of third-generation cephalosporins in 2011–2014. Ceftriaxone was the most consumed agent.
Table 6.7 Relative consumption of agents within third-generation cephalosporins (J01DD)
AgentDDD/1000 inhabitants per daya (% of totalb)
2011 2012 2013 2014
Cefotaxime <0.1 0.1 (19) <0.1 <0.1
Ceftazidime <0.1 <0.1 <0.1 <0.1
Ceftriaxone 0.5 (81) 0.5 (77) 0.3 (83) 0.3 (83)
Cefixime <0.1 <0.1 <0.1 <0.1
Cefoperazone <0.1 <0.1 <0.1 –
Total 0.6 0.6 0.4 0.4
a DDD: daily defined dose. b Total amounts and percentages may vary slightly owing to rounding.
6.4.1.4 Choice of fourth-generation cephalosporins (J01DE)Levels of consumption of the fourth-generation cephalosporins (cefepime and cefpirome) were low in 2011–2014.
6.4.2 Relative consumption of agents within fluoroquinolones (J01MA)
Quinolone antibacterials comprised around 4–6% of consumption of J01 antibacterials during 2011–2014 (see Table 6.4). Almost all consumption was from the fluoroquinolone category (J01MA). The most consumed agents were levofloxacin and ofloxacin (Table 6.8).
Table 6.8 Relative consumption of agents within fluoroquinolones (J01MA)
AgentDDD/1000 inhabitants per daya (% of totalb)
2011 2012 2013 2014
Ofloxacin 0.2 (25) 0.3 (27) 0.2 (29) 0.1 (35)
Ciprofloxacin 0.2 (31) 0.2 (23) 0.2 (23) <0.1
Norfloxacin <0.1 <0.1 <0.1 <0.1
Levofloxacin 0.3 (42) 0.4 (39) 0.2 (33) 0.1 (38)
Moxifloxacin <0.1 0.1 (10) 0.1 (14) <0.1
Gemifloxacin – – – <0.1
Total 0.8 1.0 0.7 0.4
a DDD: daily defined dose. b Total amounts and percentages may vary slightly owing to rounding.
6. AZERBAIJAN

39
6.4.3 Relative consumption of amoxicillin, amoxicillin and clavulanic acid
The addition of clavulanic acid to amoxicillin extends the spectrum of activity of amoxicillin against beta-lactamase-producing bacteria. Amoxicillin and clavulanic acid is recommended as second-line treatment in many treatment guidelines.
Table 6.9 summarizes the relative consumption of amoxicillin and broader-spectrum amoxicillin and clavulanic acid. Amoxicillin was the more consumed agent in all years reported.
Table 6.9 Relative consumption of amoxicillin, amoxicillin and clavulanic acid
AgentDDD/1000 inhabitants per daya (% of totalb)
2011 2012 2013 2014
Amoxicillin (J01CA04) 4 (93) 3.3 (94) 1.3 (84) 0.3 (57)
Amoxicillin and clavulanic acid (J01CR02) 0.3 (7) 0.2 (6) 0.2 (16) 0.2 (43)
Total 4.4 3.5 1.5 0.5
a DDD: daily defined dose. b Total amounts and percentages may vary slightly owing to rounding.
Further investigation is required to understand the large relative increases in consumption of amoxicillin and clavulanic acid compared to amoxicillin over time (7% in 2011, 43% in 2014).
6.5 The 10 most consumed agents
While the number of J01 antibacterial agents available is large, there is considerable evidence from ESAC-Net and other analyses that consumption tends to be concentrated in a relatively small number.
6.5.1 The 10 most consumed agents – oral formulation
Table 6.10 summarizes consumption of the oral agents that comprise the 10 most consumed in 2014. Eight agents (doxycycline, azithromycin, sulfadimethoxine, amoxicillin, amoxicillin and enzyme inhibitor, sulfamethoxazole and trimethoprim, clarithromycin and tetracycline) account for almost 77% of consumption.
6.5.2 The 10 most consumed agents – parenteral formulation
Table 6.11 summarizes consumption of the 10 most consumed parenteral agents in 2014. One of these (ampicillin) accounts for almost 74% of consumption; two penicillins (ampicillin and benyzylpenicillin) account for almost 82% of consumption.
6. AZERBAIJAN

40
Table 6.10 The 10 most consumed agents – oral formulation (2014)
AgentDDD/1000 inhabitants per daya
Top 10 Top 9 Top 8 Top 7 Top 6 Top 5 Top 4 Top 3 Top 2 Top 1
Doxycycline 0.42 0.42 0.42 0.42 0.42 0.42 0.42 0.42 0.42 0.42
Azithromycin 0.33 0.33 0.33 0.33 0.33 0.33 0.33 0.33 0.33
Sulfadimethoxine 0.29 0.29 0.29 0.29 0.29 0.29 0.29 0.29
Amoxicillin 0.27 0.27 0.27 0.27 0.27 0.27 0.27
Amoxicillin and enzyme inhibitor 0.20 0.20 0.20 0.20 0.20 0.20
Sulfamethoxazole and trimethoprim 0.18 0.18 0.18 0.18 0.18
Clarithromycin 0.17 0.17 0.17 0.17
Tetracycline 0.15 0.15 0.15
Levofloxacin 0.13 0.13
Ofloxacin 0.12
Total consumption for this group of agents
2.26 2.14 2.02 1.86 1.70 1.51 1.31 1.04 0.75 0.42
Total consumption for all oral J01 antibacterials
2.63 2.63 2.63 2.63 2.63 2.63 2.63 2.63 2.63 2.63
Proportion (%) of total consumption for oral J01 antibacterials
85.9% 81.3% 76.5% 70.7% 64.4% 57.5% 49.8% 39.3% 28.3% 15.9%
a DDD: daily defined dose.
6. AZERBAIJAN
Table 6.11 The 10 most consumed agents – parenteral formulation (2014)
AgentDDD/1000 inhabitants per daya
Top 10 Top 9 Top 8 Top 7 Top 6 Top 5 Top 4 Top 3 Top 2 Top 1
Ampicillin 4.30 4.30 4.30 4.30 4.30 4.30 4.30 4.30 4.30 4.30
Benzylpenicillin 0.46 0.46 0.46 0.46 0.46 0.46 0.46 0.46 0.46
Ceftriaxone 0.33 0.33 0.33 0.33 0.33 0.33 0.33 0.33
Ampicillin and enzyme inhibitor 0.17 0.17 0.17 0.17 0.17 0.17 0.17
Amikacin 0.11 0.11 0.11 0.11 0.11 0.11
Combinations of penicillins 0.09 0.09 0.09 0.09 0.09
Metronidazole 0.08 0.08 0.08 0.08
Streptomycin 0.06 0.06 0.06
Kanamycin 0.06 0.06
Cefazolin 0.05
Total consumption for this group of agents
5.69 5.65 5.59 5.53 5.45 5.36 5.25 5.08 4.76 4.30
Total consumption for all parental J01 antibacterials
5.84 5.84 5.84 5.84 5.84 5.84 5.84 5.84 5.84 5.84
Proportion (%) of total consumption for parental J01 antibacterials
97.5% 96.7% 95.7% 94.7% 93.4% 91.8% 90.0% 87.1% 81.5% 73.6%
a DDD: daily defined dose.

41
6.6 Comments
The analyses presented in this chapter provide annual consumption estimates. The data indicate some considerable fluctuations in total consumption of J01 antibacterials over time, and further investigation of the sources used and completeness of data collection are needed to better understand the results.
6. AZERBAIJAN

42
7. BELARUS
7.1 Data sources and years of data collection
Belarus data were available for each of the four years of data collection (2011–2014). The main sources were import records provided by the drug agency and information provided by local pharmaceutical manufacturers (Table 7.1). Further information on the estimates provided by local manufacturers was not available.
Table 7.1 Sources of data used for consumption estimates (2011–2014)
Year Health care sector coverage Data type Data source
(consumption) Population Data source (population)
2011 Total care Import recordsSales records
Drug agencyLocal manufacturers 9 473 000 World Bank
2012 Total care Import recordsSales records
Drug agencyLocal manufacturers 9 464 000 World Bank
2013 Total care Import recordsSales records
Drug agencyLocal manufacturers 9 466 000 World Bank
2014 Total care Import recordsSales records
Drug agencyLocal manufacturers 9 483 000 World Bank
7.2 Estimates of volumes of consumption of antibacterials for systemic use (J01)
Total consumption of antibacterials for systemic use (ATC class J01) is examined by route of administration (oral and parenteral formulations) and by pharmacological subgroup.
7.2.1 Total consumption of J01 antibacterials by route of administration
The consumption of oral and parenteral (injectable) formulations of J01 antibacterials is shown in Fig. 7.1 and summarized in Table 7.2 as DDD/1000 inhabitants per day (DID).
The data indicate some fluctuations in total consumption of J01 antibacterials over time (17.9 DID in 2011 to 20.0 DID in 2014), with the highest estimate in 2013; however, this might be explained in part by the import cycles for these medicines.

43
The relative consumption of parenteral antibacterials remained reasonably stable at around 16% of total J01 consumption (Table 7.2).
Table 7.2 Total consumption of J01 antibacterials by route of administration
Route of administrationDDD/1000 inhabitants per daya (% of totalb)
2011 2012 2013 2014
Oral J01 15.3 (85) 16.3 (88) 19.3 (84) 16.7 (84)
Parenteral J01 2.6 (15) 2.2 (12) 3.7 (16) 3.3 (16)
Total 17.9 18.6 23.1 20.0
a DDD: daily defined dose. b Total amounts and percentages may vary slightly owing to rounding.
7.2.2 Total consumption of J01 antibacterials by pharmacological subgroup
The consumption of J01 antibacterials by pharmacological subgroup is shown in Fig. 7.2 and summarized in Table 7.3.
Numerically, the largest changes in consumption of pharmacological subgroups occurred in macrolides, lincosamides and streptogramins (J01F), which increased from 1.6 DID in 2011 to 2.8 DID in 2014, with a peak of 3.1 DID in 2013. The highest levels of consumption were beta-lactams (J01C), at 6.7 DID in 2011 and 7.1 DID in 2014, and cephalosporins (J01D), at 2.3 DID in 2011 and 3.1 DID in 2014.
7. BELARUS
0
5
10
15
20
25
DD
D/1
000
inha
bita
nts
per
day
Parenteral antibacterials
Oral antibacterials
BLR2013
BLR2012
BLR2011
BLR2014
Fig. 7.1 Total consumption of J01 antibacterials by route of administration
DDD: defined daily dose.

44
Table 7.3 Total consumption of J01 antibacterials by pharmacological subgroup
Class of antibacterial agentsDDD/1000 inhabitants per daya
2011 2012 2013 2014
Tetracyclines (J01A) 3.0 3.3 2.9 2.7
Amphenicols (J01B) 0.4 0.2 0.3 0.2
Beta-lactams (J01C) 6.7 5.9 8.2 7.1
Cephalosporins (J01D) 2.3 2.1 3.5 3.1
Sulfonamides and trimethoprim (J01E) 0.1 0.3 0.3 <0.1
Macrolides, lincosamides and streptogramins (J01F) 1.6 2.7 3.1 2.8
Quinolone antibacterials (J01M) 1.5 1.9 2.3 2.5
Other J01 antibacterials (J01G, J01X) 2.3 2.2 2.4 1.6
Totalb 17.9 18.6 23.1 20.0
a DDD: daily defined dose. b Total amounts may vary slightly owing to rounding.
7.3 Relative consumption of J01 antibacterials by subgroup
7.3.1 Relative consumption of J01 antibacterials by pharmacological subgroup
The relative consumption of pharmacological subgroups measured as a proportion of total J01 antibacterials is shown in Fig. 7.3 and summarized in Table 7.4.
The data illustrate the decline in relative consumption of tetracylines (J01A) and amphenicols (J01B) over time. While it is a quantitatively a smaller decline, consumption of sulfonamides and trimethoprim (J01E) also decreased over time.
0
5
10
15
20
25
DD
D/1
000
inha
bita
nts
per
day
BLR2013
BLR2012
BLR2011
BLR2014
Quinolone antibacterials (J01M)
Macrolides, lincosamides and streptogramins (J01F)
Sulfonamides and trimethoprim (J01E)
Cephalosporins (J01D)
Beta-lactams (J01C)
Amphenicols (J01B)
Other J01 antibacterials
Tetracyclines (J01A)
Fig. 7.2 Total consumption of J01 antibacterials by pharmacological subgroup
DDD: defined daily dose.
7. BELARUS

45
Beta-lactams (J01C) was the most consumed pharmacological subgroup, at 35.4% of total J01 consumption in 2014, followed by cephalosporins (J01D), at 15.4%, macrolides, lincosamides and streptogramins (J01F), at 14.1%, and tetracyclines (J01A), at 13.7% (Table 7.4).
Table 7.4 Relative consumption of J01 antibacterials by pharmacological subgroup
Class of antibacterial agentsConsumption as proportion of total J01 consumption (%)a
2011 2012 2013 2014
Tetracyclines (J01A) 16.9 17.7 12.8 13.7
Amphenicols (J01B) 2.3 1.2 1.5 1.2
Beta-lactams (J01C) 37.2 31.6 35.5 35.4
Cephalosporins (J01D) 13.0 11.4 15.0 15.4
Sulfonamides and trimethoprim (J01E) 0.4 1.6 1.5 <0.1
Macrolides, lincosamides and streptogramins (J01F) 9.2 14.3 13.3 14.1
Quinolone antibacterials (J01M) 8.3 10.4 10.0 12.3
Other J01 antibacterials (J01G, J01R, J01X) 12.6 11.8 10.3 7.9
a Total percentages may vary slightly owing to rounding.
7.3.2 Consumption of cephalosporins and quinolones as a proportion of total consumption of J01 antibacterials
Cephalosporins and quinolones are broad-spectrum antibiotics and are considered second-line antibiotics in most prescribing guidelines. Generally, it is recommended that their use should be restricted to ensure availability as second-line therapy, should first-line antibiotics fail.
0%
20%
40%
60%
80%
100%
Pro
port
ion
of to
tal
J01
anti
bact
eria
l con
sum
ptio
n
BLR2013
BLR2012
BLR2011
BLR2014
Quinolone antibacterials (J01M)
Macrolides, lincosamides and streptogramins (J01F)
Sulfonamides and trimethoprim (J01E)
Cephalosporins (J01D)
Beta-lactams (J01C)
Amphenicols (J01B)
Other J01 antibacterials
Tetracyclines (J01A)
Fig. 7.3 Relative consumption of J01 antibacterials by pharmacological subgroup
7. BELARUS

46
The relative consumption of cephalosporins and quinolones measured as a proportion of total J01 antibacterials is shown in Fig. 7.4 and summarized in Table 7.5.
There were small relative increases in consumption of both cephalosporins and quinolone antibacterials over time. Together these two categories constitute 27% of J01 antibacterial consumption in 2014 (Table 7.5).
Table 7.5 Consumption of cephalosporins and quinolones as a proportion of total consumption of J01 antibacterials
Class of antibacterial agentsDDD/1000 inhabitants per daya (% of totalb)
2011 2012 2013 2014
Quinolone antibacterials (J01M) 1.5 (8) 1.9 (10) 2.3 (10) 2.5 (12)
Cephalosporins (J01D) 2.3 (13) 2.1 (11) 3.5 (15) 3.1 (15)
Other J01 antibacterials 14.1 (79) 14.5 (78) 17.3 (75) 14.4 (72)
Total 17.9 18.6 23.1 20.0
a DDD: daily defined dose. b Total amounts and percentages may vary slightly owing to rounding.
7.4 Relative consumption by choice of agent
7.4.1 Relative consumption of cephalosporins by generation
Third- and fourth-generation cephalosporins have a broader spectrum of activity than first- and second-generation agents, with enhanced coverage of both Gram-positive and Gram-negative
0%
20%
40%
60%
80%
100%
Pro
port
ion
of to
tal
J01
anti
bact
eria
l con
sum
ptio
n
BLR2013
BLR2012
BLR2011
BLR2014
Other J01 antibacterials
Cephalosporins (J01D)
Quinolone antibacterials (J01M)
Fig. 7.4 Consumption of cephalosporins and quinolones as a proportion of total consumption of J01 antibacterials
7. BELARUS

47
organisms. WHO (2012) has identified third- and fourth-generation cephalosporins as some of the agents of highest priority for risk management to ensure that critically important antimicrobials are used prudently both in human and veterinary medicine.
The relative consumption of first-, second-, third- and fourth-generation cephalosporins in 2011–2014 is shown in Fig. 7.5 and summarized in Table 7.6.
Increasing consumption of fourth-generation cephalosporins was reported over time (13% of reported cephalosporin consumption in 2014), with some suggestion of relative reductions in consumption of third-generation agents (decreasing from 80% in 2011 to 66% in 2014). Consumption of first- and second-generation agents was reasonably stable (Table 7.6).
Table 7.6 Relative consumption of cephalosporins by generation
GenerationDDD/1000 inhabitants per daya (% of totalb)
2011 2012 2013 2014
First-generation (J01DB) 0.3 (12) 0.4 (19) 0.4 (11) 0.4 (13)
Second-generation (J01DC) 0.1 (5) 0.1 (7) 0.2 (6) 0.3 (9)
Third-generation (J01DD) 1.8 (80) 1.4 (70) 2.7 (79) 2 (66)
Fourth-generation (J01DE) <0.1 <0.1 0.1 (4) 0.4 (13)
Total 2.3 2.1 3.4 3.0
a DDD: daily defined dose. b Total amounts and percentages may vary slightly owing to rounding.
0%
20%
40%
60%
80%
100%
Pro
port
ion
of t
otal
ce
phal
ospo
rin
cons
umpt
ion
BLR2013
BLR2012
BLR2011
BLR2014
Fourth-generation (J01DE)
Third-generation (J01DD)
Second-generation (J01DC)
First-generation (J01DB)
Fig. 7.5 Relative consumption of cephalosporins by generation
7. BELARUS

48
7.4.1.1 Choice of first-generation cephalosporins (J01DB)Table 7.7 illustrates the pattern of consumption of first-generation cephalosporins in 2011–2014. Cefalexin and cefazolin were those most consumed.
Table 7.7 Relative consumption of agents within first-generation cephalosporins (J01DB)
AgentDDD/1000 inhabitants per daya (% of totalb)
2011 2012 2013 2014
Cefalexin 0.2 (62) 0.3 (82) 0.3 (85) 0.3 (64)
Cefazolin 0.1 (38) <0.1 <0.1 0.1 (36)
Total 0.3 0.4 0.4 0.4
a DDD: daily defined dose. b Total amounts and percentages may vary slightly owing to rounding.
7.4.1.2 Choice of second-generation cephalosporins (J01DC)Table 7.8 summarizes the pattern of consumption of second-generation cephalosporins in 2011–2014. Cefuroxime was the most consumed agent.
Table 7.8 Relative consumption of agents within second-generation cephalosporins (J01DC)
AgentDDD/1000 inhabitants per daya (% of totalb)
2011 2012 2013 2014
Cefuroxime <0.1 0.1 (79) 0.2 (98) 0.2 (96)
Cefaclor <0.1 <0.1 <0.1 <0.1
Cefprozil <0.1 <0.1 <0.1 <0.1
Total 0.1 0.1 0.2 0.3
a DDD: daily defined dose. b Total amounts and percentages may vary slightly owing to rounding.
7.4.1.3 Choice of third-generation cephalosporins (J01DD)Table 7.9 summarizes the pattern of consumption of third-generation cephalosporins in 2011–2014. Ceftriaxone and cefotaxime were those most consumed.
Table 7.9 Relative consumption of agents within third-generation cephalosporins (J01DD)
AgentDDD/1000 inhabitants per daya (% of totalb)
2011 2012 2013 2014
Cefotaxime 0.7 (35) 0.6 (40) 0.6 (22) 0.4 (22)
Ceftazidime <0.1 <0.1 <0.1 <0.1
Ceftriaxone 1.2 (64) 0.8 (56) 2 (75) 1.5 (77)
Cefixime <0.1 <0.1 <0.1 <0.1
Cefoperazone <0.1 <0.1 <0.1 <0.1
Cefpodoxime <0.1 <0.1 <0.1 <0.1
Ceftibuten <0.1 <0.1 <0.1 <0.1
Cefdinir <0.1 <0.1 <0.1 <0.1
Total 1.8 1.4 2.7 2.0
a DDD: daily defined dose. b Total amounts and percentages may vary slightly owing to rounding.
7. BELARUS
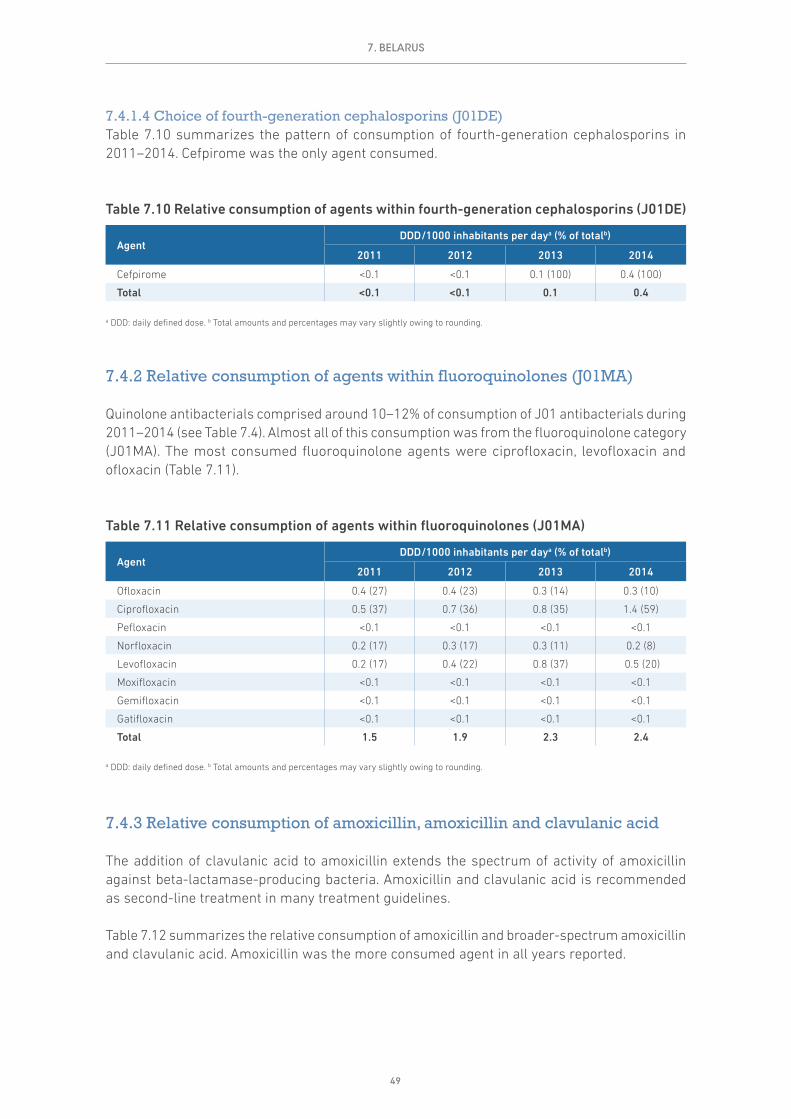
49
7.4.1.4 Choice of fourth-generation cephalosporins (J01DE)Table 7.10 summarizes the pattern of consumption of fourth-generation cephalosporins in 2011–2014. Cefpirome was the only agent consumed.
Table 7.10 Relative consumption of agents within fourth-generation cephalosporins (J01DE)
AgentDDD/1000 inhabitants per daya (% of totalb)
2011 2012 2013 2014
Cefpirome <0.1 <0.1 0.1 (100) 0.4 (100)
Total <0.1 <0.1 0.1 0.4
a DDD: daily defined dose. b Total amounts and percentages may vary slightly owing to rounding.
7.4.2 Relative consumption of agents within fluoroquinolones (J01MA)
Quinolone antibacterials comprised around 10–12% of consumption of J01 antibacterials during 2011–2014 (see Table 7.4). Almost all of this consumption was from the fluoroquinolone category (J01MA). The most consumed fluoroquinolone agents were ciprofloxacin, levofloxacin and ofloxacin (Table 7.11).
Table 7.11 Relative consumption of agents within fluoroquinolones (J01MA)
AgentDDD/1000 inhabitants per daya (% of totalb)
2011 2012 2013 2014
Ofloxacin 0.4 (27) 0.4 (23) 0.3 (14) 0.3 (10)
Ciprofloxacin 0.5 (37) 0.7 (36) 0.8 (35) 1.4 (59)
Pefloxacin <0.1 <0.1 <0.1 <0.1
Norfloxacin 0.2 (17) 0.3 (17) 0.3 (11) 0.2 (8)
Levofloxacin 0.2 (17) 0.4 (22) 0.8 (37) 0.5 (20)
Moxifloxacin <0.1 <0.1 <0.1 <0.1
Gemifloxacin <0.1 <0.1 <0.1 <0.1
Gatifloxacin <0.1 <0.1 <0.1 <0.1
Total 1.5 1.9 2.3 2.4
a DDD: daily defined dose. b Total amounts and percentages may vary slightly owing to rounding.
7.4.3 Relative consumption of amoxicillin, amoxicillin and clavulanic acid
The addition of clavulanic acid to amoxicillin extends the spectrum of activity of amoxicillin against beta-lactamase-producing bacteria. Amoxicillin and clavulanic acid is recommended as second-line treatment in many treatment guidelines.
Table 7.12 summarizes the relative consumption of amoxicillin and broader-spectrum amoxicillin and clavulanic acid. Amoxicillin was the more consumed agent in all years reported.
7. BELARUS

50
Table 7.12 Relative consumption of amoxicillin, amoxicillin and clavulanic acid
AgentDDD/1000 inhabitants per daya (% of totalb)
2011 2012 2013 2014
Amoxicillin (J01CA04) 2.4 (53) 4.2 (79) 5.4 (71) 4.2 (64)
Amoxicillin and clavulanic acid (J01CR02) 2.1 (47) 1.1 (21) 2.2 (29) 2.4 (36)
Total 4.5 5.3 7.6 6.6
a DDD: daily defined dose. b Total amounts and percentages may vary slightly owing to rounding.
7.5 The 10 most consumed agents
While the number of J01 antibacterial agents available is large, there is considerable evidence from ESAC-Net and other analyses that consumption tends to be concentrated in a relatively small number.
7.5.1 The 10 most consumed agents – oral formulation
Table 7.13 summarizes consumption of the oral agents that comprise the 10 most consumed in 2014. Six agents (amoxicillin, doxycycline, amoxicillin and enzyme inhibitor, azithromycin, ciprofloxacin and nitrofurantoin) account for just over 77% of consumption.
Table 7.13 The 10 most consumed agents – oral formulation (2014)
AgentDDD/1000 inhabitants per daya
Top 10 Top 9 Top 8 Top 7 Top 6 Top 5 Top 4 Top 3 Top 2 Top 1
Amoxicillin 4.25 4.25 4.25 4.25 4.25 4.25 4.25 4.25 4.25 4.25
Doxycycline 2.50 2.50 2.50 2.50 2.50 2.50 2.50 2.50 2.50
Amoxicillin and enzyme inhibitor 2.36 2.36 2.36 2.36 2.36 2.36 2.36 2.36
Azithromycin 1.54 1.54 1.54 1.54 1.54 1.54 1.54
Ciprofloxacin 1.33 1.33 1.33 1.33 1.33 1.33
Nitrofurantoin 1.01 1.01 1.01 1.01 1.01
Clarithromycin 0.89 0.89 0.89 0.89
Levofloxacin 0.38 0.38 0.38
Ampicillin 0.37 0.37
Cefalexin 0.25
Total consumption for this group of agents
14.90 14.64 14.27 13.89 12.99 11.98 10.65 9.11 6.75 4.25
Total consumption for all oral J01 antibacterials
16.71 16.71 16.71 16.71 16.71 16.71 16.71 16.71 16.71 16.71
Proportion (%) of total consumption for oral J01 antibacterials
89.2% 87.6% 85.4% 83.1% 77.8% 71.7% 63.7% 54.5% 40.4% 25.4%
a DDD: daily defined dose.
7. BELARUS

51
7.5.2 The 10 most consumed agents – parenteral formulation
Table 7.14 summarizes consumption of the 10 most consumed parenteral agents in 2014. Four of these (ceftriaxone, cefotaxime, cefepime and cefazolin) account for almost 75% of consumption.
7.6 Comments
The analyses presented in this chapter are based on sales records of wholesalers and local manufacturers, and the results suggest that import and medicine supply cycles may have a substantial impact on the estimates and explain (in part) the fluctuations between years.
Table 7.14 The 10 most consumed agents – parenteral formulation (2014)
AgentDDD/1000 inhabitants per daya
Top 10 Top 9 Top 8 Top 7 Top 6 Top 5 Top 4 Top 3 Top 2 Top 1
Ceftriaxone 1.51 1.51 1.51 1.51 1.51 1.51 1.51 1.51 1.51 1.51
Cefotaxime 0.42 0.42 0.42 0.42 0.42 0.42 0.42 0.42 0.42
Cefepime 0.38 0.38 0.38 0.38 0.38 0.38 0.38 0.38
Cefazolin 0.14 0.14 0.14 0.14 0.14 0.14 0.14
Levofloxacin 0.12 0.12 0.12 0.12 0.12 0.12
Metronidazole 0.11 0.11 0.11 0.11 0.11
Ciprofloxacin 0.11 0.11 0.11 0.11
Amikacin 0.08 0.08 0.08
Gentamicin 0.08 0.08
Meropenem 0.06
Total consumption for this group of agents
3.00 2.94 2.87 2.79 2.68 2.57 2.45 2.31 1.93 1.51
Total consumption for all parental J01 antibacterials
3.28 3.28 3.28 3.28 3.28 3.28 3.28 3.28 3.28 3.28
Proportion (%) of total consumption for parental J01 antibacterials
91.5% 89.7% 87.4% 85.0% 81.6% 78.2% 74.6% 70.3% 58.9% 46.0%
a DDD: daily defined dose.
7. BELARUS

52
8. KYRGYZSTAN
8.1 Data sources and years of data collection
Kyrgyzstan provided data for each of the four years of data collection (2011–2014). The main sources were import records provided by the drug agency and information provided by wholesalers (Table 8.1).
Table 8.1 Sources of data used for consumption estimates (2011–2014)
Year Health care sector coverage Data type Data source
(consumption) Population Data source (population)
2011 Total care Import recordsSales records
Drug agencyWholesalers 5 514 600 World Bank
2012 Total care Import recordsSales records
Drug agencyWholesalers 5 607 200 World Bank
2013 Total care Import recordsSales records
Drug agencyWholesalers 5 719 600 World Bank
2014 Total care Import recordsSales records
Drug agencyWholesalers 5 835 500 World Bank
8.2 Estimates of volumes of consumption of antibacterials for systemic use (J01)
Total consumption of antibacterials for systemic use (ATC class J01) is examined by route of administration (oral and parenteral formulations) and by pharmacological subgroup.
8.2.1 Total consumption of J01 antibacterials by route of administration
The consumption of oral and parenteral (injectable) formulations of J01 antibacterials is shown in Fig. 8.1 and summarized in Table 8.2 as DDD/1000 inhabitants per day (DID).
The substantial increase in total J01 consumption from 2011 to 2014 (24.0 to 36.8 DID) in part reflects the larger number of antibacterial preparations registered in Kyrgyzstan during the period.

53
Table 8.2 Total consumption of J01 antibacterials by route of administration
Route of administrationDDD/1000 inhabitants per daya (% of totalb)
2011 2012 2013 2014
Oral J01 6.7 (28) 7.3 (34) 10.7 (49) 28.7 (78)
Parenteral J01 17.3 (72) 14 (66) 11 (51) 8.1 (22)
Total 24.0 21.3 21.7 36.8
a DDD: daily defined dose. b Total amounts and percentages may vary slightly owing to rounding.
The substantial reduction in proportion of consumption of parenteral antibacterials (72% to 22%) is the result of sustained activities undertaken by the Ministry of Health and the Mandatory Health Insurance Fund. During this time, clinical protocols for primary care were developed and implemented. These recommended the use of oral rather than parenteral forms of antibacterials. Compliance with these protocols was frequently checked. These regulatory measures were supported by the Association of Family Physicians and the Association of Hospitals, which conducted active training of doctors on rational prescribing of medicines. In addition, the Mandatory Health Insurance Fund undertook active interventions to reduce unnecessary hospitalizations of patients. Together, these interventions contributed to the changes in practice reflected in the consumption data.
8. KYRGYZSTAN
0
5
10
15
20
25
30
35
40
DD
D/1
000
inha
bita
nts
per
day
Parenteral antibacterials
Oral antibacterials
KGZ2013
KGZ2012
KGZ2011
KGZ2014
Fig. 8.1 Total consumption of J01 antibacterials by route of administration
DDD: defined daily dose.

54
8.2.2 Total consumption of J01 antibacterials by pharmacological subgroup
The consumption of J01 antibacterials by pharmacological subgroup is shown in Fig. 8.2 and summarized in Table 8.3.
The volumes of consumption of most of the pharmacological subgroups increased over time: tetracyclines (J01A), beta-lactams (J01C), cephalosporins (J01D), macrolides, lincosamides and streptogramins (J01F) and quinolones (J01M).
Table 8.3 Total consumption of J01 antibacterials by pharmacological subgroup
Class of antibacterial agentsDDD/1000 inhabitants per daya
2011 2012 2013 2014
Tetracyclines (J01A) 0.6 0.6 0.7 2.1
Amphenicols (J01B) 0.5 0.5 0.4 0.3
Beta-lactams (J01C) 8.5 8.6 10.1 16.7
Cephalosporins (J01D) 1.8 4.4 4.0 4.7
Sulfonamides and trimethoprim (J01E) 1.0 0.8 1.7 1.5
Macrolides, lincosamides and streptogramins (J01F) 0.8 1.1 1.5 4.1
Quinolone antibacterials (J01M) 0.5 0.4 0.4 5.0
Other J01 antibacterials (J01G, J01R, J01X) 10.4 4.8 3.0 2.4
Totalb 24.0 21.3 21.7 36.8
a DDD: daily defined dose. b Total amounts may vary slightly owing to rounding.
0
5
10
15
20
25
30
35
40
DD
D/1
000
inha
bita
nts
per
day
KGZ2013
KGZ2012
KGZ2011
KGZ2014
Quinolone antibacterials (J01M)
Macrolides, lincosamides and streptogramins (J01F)
Sulfonamides and trimethoprim (J01E)
Cephalosporins (J01D)
Beta-lactams (J01C)
Amphenicols (J01B)
Other J01 antibacterials
Tetracyclines (J01A)
Fig. 8.2 Total consumption of J01 antibacterials by pharmacological subgroup
DDD: defined daily dose.
8. KYRGYZSTAN

55
8.3 Relative consumption of J01 antibacterials by subgroup
8.3.1 Relative consumption of J01 antibacterials by pharmacological subgroup
The relative consumption of pharmacological subgroups measured as a proportion of total J01 antibacterials is shown in Fig. 8.3 and summarized in Table 8.4.
There were substantial increases in the relative consumption of beta-lactams (J01C), which rose from 35.3% to 45.4%, cephalosporins (J01D), from 7.4% to 12.8%, macrolides, lincosamides and streptogramins (J01F), from 3.3% to 11.2%, and quinolones (J01M), from 2.1% to 13.7%. The most substantial reduction was in the “other J01 antibacterials” category, from 43.4% to 6.4% (Table 8.4).
Table 8.4 Relative consumption of J01 antibacterials by pharmacological subgroup
Class of antibacterial agentsConsumption as proportion of total J01 consumption (%)a
2011 2012 2013 2014
Tetracyclines (J01A) 2.0 3.0 3.3 5.7
Amphenicols (J01B) 2.0 2.5 1.9 0.8
Beta-lactams (J01C) 35.3 40.2 46.4 45.4
Cephalosporins (J01D) 7.4 20.8 18.5 12.8
Sulfonamides and trimethoprim (J01E) 4.1 3.9 7.6 4.0
Macrolides, lincosamides and streptogramins (J01F) 3.3 5.0 6.7 11.2
Quinolone antibacterials (J01M) 2.1 2.1 1.9 13.7
Other J01 antibacterials (J01G, J01R, J01X) 43.4 22.5 13.8 6.4
a Total percentages may vary slightly owing to rounding.
0%
20%
40%
60%
80%
100%
Pro
port
ion
of to
tal
J01
anti
bact
eria
l con
sum
ptio
n
KGZ2013
KGZ2012
KGZ2011
KGZ2014
Quinolone antibacterials (J01M)
Macrolides, lincosamides and streptogramins (J01F)
Sulfonamides and trimethoprim (J01E)
Cephalosporins (J01D)
Beta-lactams (J01C)
Amphenicols (J01B)
Other J01 antibacterials
Tetracyclines (J01A)
Fig. 8.3 Relative consumption of J01 antibacterials by pharmacological subgroup
8. KYRGYZSTAN

56
8.3.2 Consumption of cephalosporins and quinolones as a proportion of total consumption of J01 antibacterials
Cephalosporins and quinolones are broad-spectrum antibiotics and are considered second-line antibiotics in most prescribing guidelines. Generally, it is recommended that their use should be restricted to ensure availability as second-line therapy, should first-line antibiotics fail.
The relative consumption of cephalosporins and quinolones measured as a proportion of total J01 antibacterials is shown in Fig. 8.4 and summarized in Table 8.5.
The relative increases in consumption of both cephalosporins and quinolones over 2011–2014 were substantial. Together these two categories constituted 27% of J01 antibacterial consumption in 2014 (Table 8.5).
Table 8.5 Consumption of cephalosporins and quinolones as a proportion of total consumption of J01 antibacterials
Class of antibacterial agentsDDD/1000 inhabitants per daya (% of totalb)
2011 2012 2013 2014
Quinolone antibacterials (J01M) 0.5 (2) 0.4 (2) 0.4 (2) 5 (14)
Cephalosporins (J01D) 1.8 (7) 4.4 (21) 4 (18) 4.7 (13)
Other J01 antibacterials 21.7 (91) 16.4 (77) 17.3 (80) 27.1 (73)
Total 24.0 21.3 21.7 36.8
a DDD: daily defined dose. b Total amounts and percentages may vary slightly owing to rounding.
0%
20%
40%
60%
80%
100%
Pro
port
ion
of to
tal
J01
anti
bact
eria
l con
sum
ptio
n
KGZ2013
KGZ2012
KGZ2011
KGZ2014
Other J01 antibacterials
Cephalosporins (J01D)
Quinolone antibacterials (J01M)
Fig. 8.4 Consumption of cephalosporins and quinolones as a proportion of total consumption of J01 antibacterials
8. KYRGYZSTAN

57
8.4 Relative consumption by choice of agent
8.4.1 Relative consumption of cephalosporins by generation
Third- and fourth-generation cephalosporins have a broader spectrum of activity than first- and second-generation agents, with enhanced coverage of both Gram-positive and Gram-negative organisms. WHO (2012) has identified third- and fourth-generation cephalosporins as some of the agents of highest priority for risk management to ensure that critically important antimicrobials are used prudently both in human and veterinary medicine.
The relative consumption of first-, second-, third- and fourth-generation cephalosporins in 2011–2014 is shown in Fig. 8.5 and summarized in Table 8.6.
Consumption of both second- and fourth-generation cephalosporins over time was very limited. Most consumption was of third-generation agents (increasing from 59% in 2011 to 80% in 2014), matched by reductions in consumption of first-generation cephalosporins (39% in 2011 to 17% in 2014; Table 8.6).
0%
20%
40%
60%
80%
100%
Pro
port
ion
of t
otal
ce
phal
ospo
rin
cons
umpt
ion
KGZ2013
KGZ2012
KGZ2011
KGZ2014
Fourth-generation (J01DE)
Third-generation (J01DD)
Second-generation (J01DC)
First-generation (J01DB)
Fig. 8.5 Relative consumption of cephalosporins by generation
8. KYRGYZSTAN

58
Table 8.6 Relative consumption of cephalosporins by generation
GenerationDDD/1000 inhabitants per daya (% of totalb)
2011 2012 2013 2014
First-generation (J01DB) 0.7 (39) 0.9 (19) 1.8 (45) 0.8 (17)
Second-generation (J01DC) <0.1 <0.1 <0.1 0.1 (2)
Third-generation (J01DD) 1 (59) 3.5 (79) 2.1 (53) 3.8 (80)
Fourth-generation (J01DE) <0.1 <0.1 <0.1 <0.1
Total 1.8 4.4 4.0 4.7
a DDD: daily defined dose. b Total amounts and percentages may vary slightly owing to rounding.
8.4.1.1 Choice of first-generation cephalosporins (J01DB)Table 8.7 summarizes the pattern of consumption of first-generation cephalosporins in 2011–2014. Cefazolin was the most consumed agent.
Table 8.7 Relative consumption of agents within first-generation cephalosporins (J01DB)
AgentDDD/1000 inhabitants per daya (% of totalb)
2011 2012 2013 2014
Cefalexin <0.1 <0.1 <0.1 <0.1
Cefazolin 0.7 (100) 0.9 (100) 1.8 (100) 0.8 (100)
Total 0.7 0.9 1.8 0.8
a DDD: daily defined dose. b Total amounts and percentages may vary slightly owing to rounding.
8.4.1.2 Choice of second-generation cephalosporins (J01DC)Levels of consumption of second-generation cephalosporins were low in 2011–2014.
8.4.1.3 Choice of third-generation cephalosporins (J01DD)Table 8.8 summarizes the pattern of consumption of third-generation cephalosporins in 2011–2014. Ceftriaxone was the most consumed agent.
Table 8.8 Relative consumption of agents within third-generation cephalosporins (J01DD)
AgentDDD/1000 inhabitants per daya (% of totalb)
2011 2012 2013 2014
Cefotaxime <0.1 <0.1 <0.1 <0.1
Ceftazidime <0.1 <0.1 <0.1 <0.1
Ceftriaxone 1 (92) 3.4 (98) 2 (93) 3.4 (90)
Cefixime <0.1 <0.1 <0.1 0.3 (9)
Cefoperazone <0.1 <0.1 <0.1 <0.1
Cefpodoxime <0.1 <0.1 <0.1 <0.1
Cefoperazone, combinations <0.1 <0.1 <0.1 <0.1
Total 1.0 3.5 2.1 3.8
a DDD: daily defined dose. b Total amounts and percentages may vary slightly owing to rounding.
8. KYRGYZSTAN

59
8.4.1.4 Choice of fourth-generation cephalosporins (J01DE)Consumption of any of the fourth-generation cephalosporins was very limited.
8.4.2 Relative consumption of agents within fluoroquinolones (J01MA)
Quinolone antibacterials comprised around 14% of consumption of J01 antibacterials in 2014 (see Table 8.4). Almost all quinolone consumption was from the fluoroquinolone category (J01MA). The most consumed agents were ciprofloxacin and levofloxacin (Table 8.9).
Table 8.9 Relative consumption of agents within fluoroquinolones (J01MA)
AgentDDD/1000 inhabitants per daya (% of totalb)
2011 2012 2013 2014
Ofloxacin <0.1 <0.1 <0.1 <0.1
Ciprofloxacin 0.3 (65) 0.1 (30) 0.1 (28) 2.3 (46)
Norfloxacin 0.1 (21) 0.2 (38) 0.1 (35) 0.2 (3)
Levofloxacin <0.1 0.1 (24) 0.1 (26) 2.4 (48)
Moxifloxacin <0.1 <0.1 <0.1 <0.1
Total 0.5 0.4 0.4 5.0
a DDD: daily defined dose. b Total amounts and percentages may vary slightly owing to rounding.
8.4.3 Relative consumption of amoxicillin, amoxicillin and clavulanic acid
The addition of clavulanic acid to amoxicillin extends the spectrum of activity of amoxicillin against beta-lactamase-producing bacteria. Amoxicillin and clavulanic acid is recommended as second-line treatment in many treatment guidelines.
Table 8.10 summarizes the relative consumption of amoxicillin and broader-spectrum amoxicillin and clavulanic acid. Reported consumption was almost exclusively amoxicillin between 2011 and 2013. In 2014, almost half of the consumption was amoxicillin and clavulanic acid.
Table 8.10 Relative consumption of amoxicillin, amoxicillin and clavulanic acid
AgentDDD/1000 inhabitants per daya (% of totalb)
2011 2012 2013 2014
Amoxicillin (J01CA04) 3.1 (100) 3.3 (100) 5.5 (100) 7.4 (51)
Amoxicillin and clavulanic acid (J01CR02) <0.1 <0.1 <0.1 7.3 (49)
Total 3.1 3.3 5.5 14.7
a DDD: daily defined dose. b Total amounts and percentages may vary slightly owing to rounding.
8. KYRGYZSTAN

60
8.5 The 10 most consumed agents
While the number of J01 antibacterial agents available is large, there is considerable evidence from ESAC-Net and other analyses that consumption tends to be concentrated in a relatively small number.
8.5.1 The 10 most consumed agents – oral formulation
Table 8.11 summarizes consumption of the oral agents that comprise the 10 most consumed in 2014. Five agents (amoxicillin, amoxicillin and enzyme inhibitor, erythromycin, levofloxacin and ciprofloxacin) account for 77% of consumption.
8.5.2 The 10 most consumed agents – parenteral formulation
Table 8.12 summarizes consumption of the 10 most consumed parenteral agents in 2014. Four of these (ceftriaxone, benzylpenicillin, kanamycin and ampicillin) account for just over 78% of consumption.
Table 8.11 The 10 most consumed agents – oral formulation (2014)
AgentDDD/1000 inhabitants per daya
Top 10 Top 9 Top 8 Top 7 Top 6 Top 5 Top 4 Top 3 Top 2 Top 1
Amoxicillin 7.44 7.44 7.44 7.44 7.44 7.44 7.44 7.44 7.44 7.44
Amoxicillin and enzyme inhibitor 7.25 7.25 7.25 7.25 7.25 7.25 7.25 7.25 7.25
Erythromycin 2.67 2.67 2.67 2.67 2.67 2.67 2.67 2.67
Levofloxacin 2.42 2.42 2.42 2.42 2.42 2.42 2.42
Ciprofloxacin 2.28 2.28 2.28 2.28 2.28 2.28
Sulfamethoxazole and trimethoprim 1.48 1.48 1.48 1.48 1.48
Doxycycline 1.27 1.27 1.27 1.27
Azithromycin 1.06 1.06 1.06
Tetracycline 0.83 0.83
Nitrofurantoin 0.68
Total consumption for this group of agents
27.39 26.71 25.88 24.82 23.55 22.07 19.79 17.37 14.69 7.44
Total consumption for all oral J01 antibacterials
28.72 28.72 28.72 28.72 28.72 28.72 28.72 28.72 28.72 28.72
Proportion (%) of total consumption for oral J01 antibacterials
95.4% 93.0% 90.1% 86.4% 82.0% 76.8% 68.9% 60.5% 51.2% 25.9%
a DDD: daily defined dose.
8. KYRGYZSTAN

61
8.6 Comments
The analyses presented in this chapter are based on import records and sales records of wholesalers and local manufacturers, and the results suggest that import and medicine supply cycles may have a substantial impact on the estimates and explain (in part) the fluctuations between years. Further years of data are needed to determine whether levels of antibacterial consumption will continue to rise, as occurred in 2014.
Table 8.12 The 10 most consumed agents – parenteral formulation (2014)
AgentDDD/1000 inhabitants per daya
Top 10 Top 9 Top 8 Top 7 Top 6 Top 5 Top 4 Top 3 Top 2 Top 1
Ceftriaxone 3.41 3.41 3.41 3.41 3.41 3.41 3.41 3.41 3.41 3.41
Benzylpenicillin 1.10 1.10 1.10 1.10 1.10 1.10 1.10 1.10 1.10
Kanamycin 1.01 1.01 1.01 1.01 1.01 1.01 1.01 1.01
Ampicillin 0.85 0.85 0.85 0.85 0.85 0.85 0.85
Cefazolin 0.81 0.81 0.81 0.81 0.81 0.81
Metronidazole 0.28 0.28 0.28 0.28 0.28
Streptomycin 0.17 0.17 0.17 0.17
Chloramphenicol 0.11 0.11 0.11
Gentamicin 0.10 0.10
Cefuroxime 0.06
Total consumption for this group of agents
7.90 7.84 7.74 7.63 7.46 7.18 6.37 5.52 4.51 3.41
Total consumption for all parental J01 antibacterials
8.10 8.10 8.10 8.10 8.10 8.10 8.10 8.10 8.10 8.10
Proportion (%) of total consumption for parental J01 antibacterials
97.4% 96.7% 95.5% 94.1% 92.1% 88.6% 78.6% 68.1% 55.7% 42.1%
a DDD: daily defined dose.
8. KYRGYZSTAN

62
9. MONTENEGRO
9.1 Data sources and years of data collection
Montenegro provided data for each of the four years of data collection (2011–2014). The main sources were sales records of wholesalers provided by the drug agency (Table 9.1).
Table 9.1 Sources of data used for consumption estimates (2011–2014)
Year Health care sector coverage Data type Data source
(consumption) Population Data source (population)
2011 Total care Sales records of wholesalers Drug agency 620 079 World Bank
2012 Total care Sales records of wholesalers Drug agency 620 601 World Bank
2013 Total care Sales records of wholesalers Drug agency 621 207 World Bank
2014 Total care Sales records of wholesalers Drug agency 621 810 World Bank
9.2 Estimates of volumes of consumption of antibacterials for systemic use (J01)
Total consumption of antibacterials for systemic use (ATC class J01) is examined by route of administration (oral and parenteral formulations) and by pharmacological subgroup.
9.2.1 Total consumption of J01 antibacterials by route of administration
The consumption of oral and parenteral (injectable) formulations of J01 antibacterials is shown in Fig. 9.1 and summarized in Table 9.2 as DDD/1000 inhabitants per day (DID).
The data show some fluctuations in total consumption of J01 antibacterials over time (38.3 DID in 2011 and 32.7 DID in 2014), but this might be explained in part by the cycles of supply from wholesalers for these medicines. It should also be noted that in 2012 Montenegro enforced controls on the supply of antibacterials as prescription-only medicines. The consumption estimates need to be interpreted in the light of this change.

63
The relative consumption of parenteral antibacterials was low in all years, comprising around 5% of total J01 consumption during 2011–2014 (Table 9.2).
Table 9.2 Total consumption of J01 antibacterials by route of administration
Route of administrationDDD/1000 inhabitants per daya (% of totalb)
2011 2012 2013 2014
Oral J01 35.8 (94) 30.1 (95) 32.8 (95) 31 (95)
Parenteral J01 2.5 (6) 1.7 (5) 1.7 (5) 1.7 (5)
Total 38.3 31.8 34.6 32.7
a DDD: daily defined dose. b Total amounts and percentages may vary slightly owing to rounding.
9.2.2 Total consumption of J01 antibacterials by pharmacological subgroup
The consumption of J01 antibacterials by pharmacological subgroup is shown in Fig. 9.2 and summarized in Table 9.3.
The pattern of consumption among the pharmacological subgroups was similar during 2011–2014. The highest level of consumption was beta-lactams (J01C), at 15.4 DID in 2014 (Table 9.3).
9. MONTENEGRO
0
5
10
15
20
25
30
35
40
45
DD
D/1
000
inha
bita
nts
per
day
Parenteral antibacterials
Oral antibacterials
MNE2013
MNE2012
MNE2011
MNE2014
Fig. 9.1 Total consumption of J01 antibacterials by route of administration
DDD: defined daily dose.

64
Table 9.3 Total consumption of J01 antibacterials by pharmacological subgroup
Class of antibacterial agentsDDD/1000 inhabitants per daya
2011 2012 2013 2014
Tetracyclines (J01A) 1.7 1.2 1.0 1.1
Amphenicols (J01B) <0.1 <0.1 <0.1 –
Beta-lactams (J01C) 16.4 14.4 14.7 15.4
Cephalosporins (J01D) 6.7 5.0 5.4 4.9
Sulfonamides and trimethoprim (J01E) 1.7 1.1 1.1 1.1
Macrolides, lincosamides and streptogramins (J01F) 6.2 5.2 7.2 5.3
Quinolone antibacterials (J01M) 4.5 3.9 3.9 3.7
Other J01 antibacterials (J01G, J01R, J01X) 1.1 1.2 1.2 1.2
Totalb 38.3 31.8 34.6 32.7
a DDD: daily defined dose. b Total amounts may vary slightly owing to rounding.
9.3 Relative consumption of J01 antibacterials by subgroup
9.3.1 Relative consumption of J01 antibacterials by pharmacological subgroup
The relative consumption of pharmacological subgroups measured as a proportion of total J01 antibacterials is shown in Fig. 9.3 and summarized in Table 9.4.
Consumption of the subgroups was reasonably stable during 2011–2014, perhaps with some suggestion of increased consumption of beta-lactams (J01C), at 42.9% in 2011 and 47% in 2014, and decreased consumption of cephalosporins (J01D), at 17.4% in 2011 and 15% in 2014 (Table 9.4). These possible trends need to be confirmed with other data sources.
0
5
10
15
20
25
30
35
40
45
DD
D/1
000
inha
bita
nts
per
day
MNE2013
MNE2012
MNE2011
MNE2014
Quinolone antibacterials (J01M)
Macrolides, lincosamides and streptogramins (J01F)
Sulfonamides and trimethoprim (J01E)
Cephalosporins (J01D)
Beta-lactams (J01C)
Amphenicols (J01B)
Other J01 antibacterials
Tetracyclines (J01A)
Fig. 9.2 Total consumption of J01 antibacterials by pharmacological subgroup
DDD: defined daily dose.
9. MONTENEGRO

65
Table 9.4 Relative consumption of J01 antibacterials by pharmacological subgroup
Class of antibacterial agentsConsumption as proportion of total J01 consumption (%)a
2011 2012 2013 2014
Tetracyclines (J01A) 4.5 3.6 3.0 3.4
Amphenicols (J01B) <0.1 <0.1 <0.1 –
Beta-lactams (J01C) 42.9 45.2 42.7 47.0
Cephalosporins (J01D) 17.4 15.7 15.6 15.0
Sulfonamides and trimethoprim (J01E) 4.4 3.4 3.2 3.3
Macrolides, lincosamides and streptogramins (J01F) 16.2 16.2 20.9 16.2
Quinolone antibacterials (J01M) 11.7 12.2 11.2 11.4
Other J01 antibacterials (J01G, J01R, J01X) 3.0 3.7 3.4 3.7
a Total percentages may vary slightly owing to rounding.
9.3.2 Consumption of cephalosporins and quinolones as a proportion of total consumption of J01 antibacterials
Cephalosporins and quinolones are broad-spectrum antibiotics and are considered second-line antibiotics in most prescribing guidelines. Generally, it is recommended that their use should be restricted to ensure availability as second-line therapy, should first-line antibiotics fail.
The relative consumption of cephalosporins and quinolones measured as a proportion of total J01 antibacterials is shown in Fig. 9.4 and summarized in Table 9.5.
0%
20%
40%
60%
80%
100%
Pro
port
ion
of to
tal
J01
anti
bact
eria
l con
sum
ptio
n
MNE2013
MNE2012
MNE2011
MNE2014
Quinolone antibacterials (J01M)
Macrolides, lincosamides and streptogramins (J01F)
Sulfonamides and trimethoprim (J01E)
Cephalosporins (J01D)
Beta-lactams (J01C)
Amphenicols (J01B)
Other J01 antibacterials
Tetracyclines (J01A)
Fig. 9.3 Relative consumption of J01 antibacterials by pharmacological subgroup
9. MONTENEGRO

66
Consumption of quinolone antibacterials (J01M) was reasonably stable in 2011–2014 (11–12% of total consumption), while consumption of cephalosporins (J01D) decreased slightly over the period. Together these two subgroups comprised 26% of total J01 consumption in 2014 (Table 9.5).
Table 9.5 Consumption of cephalosporins and quinolones as a proportion of total consumption of J01 antibacterials
Class of antibacterial agentsDDD/1000 inhabitants per daya (% of totalb)
2011 2012 2013 2014
Quinolone antibacterials (J01M) 4.5 (12) 3.9 (12) 3.9 (11) 3.7 (11)
Cephalosporins (J01D) 6.7 (17) 5 (16) 5.4 (16) 4.9 (15)
Other J01 antibacterials 27.2 (71) 22.9 (72) 25.3 (73) 24.1 (74)
Total 38.3 31.8 34.6 32.7
a DDD: daily defined dose. b Total amounts and percentages may vary slightly owing to rounding.
9.4 Relative consumption by choice of agent
9.4.1 Relative consumption of cephalosporins by generation
Third- and fourth-generation cephalosporins have a broader spectrum of activity than first- and second-generation agents, with enhanced coverage of both Gram-positive and Gram-negative organisms. WHO (2012) has identified third- and fourth-generation cephalosporins as some of the agents of highest priority for risk management to ensure that critically important antimicrobials are used prudently both in human and veterinary medicine.
0%
20%
40%
60%
80%
100%
Pro
port
ion
of to
tal
J01
anti
bact
eria
l con
sum
ptio
n
MNE2013
MNE2012
MNE2011
MNE2014
Other J01 antibacterials
Cephalosporins (J01D)
Quinolone antibacterials (J01M)
Fig. 9.4 Consumption of cephalosporins and quinolones as a proportion of total consumption of J01 antibacterials
9. MONTENEGRO

67
The relative consumption of first-, second-, third- and fourth-generation cephalosporins in 2011–2014 is shown in Fig. 9.5 and summarized in Table 9.6.
Consumption of fourth-generation cephalosporins during 2011–2014 was very limited (< 0.1 DID). Consumption of first-generation cephalosporins increased from 45% to 59% and a relative decrease from 50% to 39% in consumption of third-generation cephalosporins was reported.
Table 9.6 Relative consumption of cephalosporins by generation
GenerationDDD/1000 inhabitants per daya (% of totalb)
2011 2012 2013 2014
First-generation (J01DB) 3 (45) 2.8 (56) 3 (56) 2.9 (59)
Second-generation (J01DC) 0.3 (5) 0.2 (4) <0.1 <0.1
Third-generation (J01DD) 3.3 (50) 1.9 (40) 2.3 (43) 1.9 (39)
Fourth-generation (J01DE) <0.1 <0.1 <0.1 <0.1
Total 6.6 4.9 5.3 4.9
a DDD: daily defined dose. b Total amounts and percentages may vary slightly owing to rounding.
9.4.1.1 Choice of first-generation cephalosporins (J01DB)Table 9.7 illustrates the pattern of consumption of first-generation cephalosporins in 2011–2014. Cefalexin was the most consumed agent.
0%
20%
40%
60%
80%
100%
Pro
port
ion
of t
otal
ce
phal
ospo
rin
cons
umpt
ion
MNE2013
MNE2012
MNE2011
MNE2014
Fourth-generation (J01DE)
Third-generation (J01DD)
Second-generation (J01DC)
First-generation (J01DB)
Fig. 9.5 Relative consumption of cephalosporins by generation
9. MONTENEGRO

68
Table 9.7 Relative consumption of agents within first-generation cephalosporins (J01DB)
AgentDDD/1000 inhabitants per daya (% of totalb)
2011 2012 2013 2014
Cefalexin 3 (99) 2.8 (99) 2.9 (99) 2.8 (98)
Cefazolin <0.1 <0.1 <0.1 <0.1
Cefadroxil <0.1 <0.1 <0.1 –
Total 3.0 2.8 3.0 2.9
a DDD: daily defined dose. b Total amounts and percentages may vary slightly owing to rounding.
9.4.1.2 Choice of second-generation cephalosporins (J01DC)Levels of consumption of the second-generation cephalosporins (cefuroxime, cefaclor) were low in 2011–2014.
9.4.1.3 Choice of third-generation cephalosporins (J01DD)Table 9.8 summarizes the pattern of consumption of third-generation cephalosporins in 2011–2014. Cefixime was the most consumed agent.
Table 9.8 Relative consumption of agents within third-generation cephalosporins (J01DD)
AgentDDD/1000 inhabitants per daya (% of totalb)
2011 2012 2013 2014
Ceftazidime <0.1 <0.1 <0.1 <0.1
Ceftriaxone 1.1 (33) 0.2 (11) 0.3 (13) 0.1 (6)
Cefixime 2.2 (66) 1.7 (87) 1.9 (85) 1.7 (90)
Cefpodoxime – <0.1 <0.1 <0.1
Ceftibuten <0.1 <0.1 <0.1 <0.1
Total 3.3 1.9 2.3 1.9
a DDD: daily defined dose. b Total amounts and percentages may vary slightly owing to rounding.
9.4.1.4 Choice of fourth-generation cephalosporins (J01DE)Consumption of the fourth-generation cephalosporins was low in 2011–2014, with only cefpirome consumed in small amounts.
9.4.2 Relative consumption of agents within fluoroquinolones (J01MA)
Quinolone antibacterials comprised 11–12% of J01 antibacterials during 2011–2014 (see Table 9.4). Around 63% of quinolone consumption was from the fluoroquinolone category (J01MA). The most consumed agent was ciprofloxacin (Table 9.9).
Pipemidic acid was the agent from the “other quinolones” category (J01MB) that accounted for the remaining consumption (1.38 DID in 2014). Pipemidic acid is structurally similar to nalidixic acid and can be used in the treatment of urinary tract infections.
9. MONTENEGRO

69
Table 9.9 Relative consumption of agents within fluoroquinolones (J01MA)
AgentDDD/1000 inhabitants per daya (% of totalb)
2011 2012 2013 2014
Ofloxacin <0.1 <0.1 <0.1 <0.1
Ciprofloxacin 2.8 (95) 2.5 (96) 2.4 (95) 2.2 (95)
Norfloxacin <0.1 <0.1 <0.1 <0.1
Levofloxacin <0.1 <0.1 <0.1 <0.1
Moxifloxacin <0.1 <0.1 <0.1 <0.1
Total 3.0 2.6 2.5 2.3
a DDD: daily defined dose. b Total amounts and percentages may vary slightly owing to rounding.
9.4.3 Relative consumption of amoxicillin, amoxicillin and clavulanic acid
The addition of clavulanic acid to amoxicillin extends the spectrum of activity of amoxicillin against beta-lactamase-producing bacteria. Amoxicillin and clavulanic acid is recommended as second-line treatment in many treatment guidelines.
Table 9.10 summarizes the relative consumption of amoxicillin and broader-spectrum amoxicillin and clavulanic acid. Amoxicillin was the more consumed agent in all years reported.
Table 9.10 Relative consumption of amoxicillin, amoxicillin and clavulanic acid
AgentDDD/1000 inhabitants per daya (% of totalb)
2011 2012 2013 2014
Amoxicillin (J01CA04) 9.3 (65) 8.9 (67) 9.6 (69) 9.8 (70)
Amoxicillin and clavulanic acid (J01CR02) 5 (35) 4.4 (33) 4.2 (31) 4.3 (30)
Total 14.2 13.2 13.8 14.1
a DDD: daily defined dose. b Total amounts and percentages may vary slightly owing to rounding.
9.5 The 10 most consumed agents
While the number of J01 antibacterial agents available is large, there is considerable evidence from ESAC-Net and other analyses that consumption tends to be concentrated in a relatively small number.
9.5.1 The 10 most consumed agents – oral formulation
Table 9.11 summarizes consumption of the oral agents that comprise the 10 most consumed in 2014. Six agents (amoxicillin, amoxicillin and enzyme inhibitor, azithromycin, cefalexin, ciprofloxacin and cefixime) account for just over 76% of consumption.
9.5.2 The 10 most consumed agents – parenteral formulation
Table 9.12 summarizes consumption of the 10 most consumed parenteral agents in 2014. Four of these (gentamicin, combinations of antibacterials, amikacin and ceftriaxone) account for just over 75% of consumption. Gentamicin alone accounted for 49% of consumption.
9. MONTENEGRO

70
Table 9.11 The 10 most consumed agents – oral formulation (2014)
AgentDDD/1000 inhabitants per daya
Top 10 Top 9 Top 8 Top 7 Top 6 Top 5 Top 4 Top 3 Top 2 Top 1
Amoxicillin 9.77 9.77 9.77 9.77 9.77 9.77 9.77 9.77 9.77 9.77
Amoxicillin and enzyme inhibitor 4.29 4.29 4.29 4.29 4.29 4.29 4.29 4.29 4.29
Azithromycin 2.99 2.99 2.99 2.99 2.99 2.99 2.99 2.99
Cefalexin 2.83 2.83 2.83 2.83 2.83 2.83 2.83
Ciprofloxacin 2.15 2.15 2.15 2.15 2.15 2.15
Cefixime 1.71 1.71 1.71 1.71 1.71
Erythromycin 1.62 1.62 1.62 1.62
Pipemidic acid 1.37 1.37 1.37
Sulfamethoxazole and trimethoprim 1.08 1.08
Doxycycline 1.01
Total consumption for this group of agents
28.81 27.80 26.72 25.35 23.73 22.02 19.87 17.04 14.05 9.77
Total consumption for all oral J01 antibacterials
31.00 31.00 31.00 31.00 31.00 31.00 31.00 31.00 31.00 31.00
Proportion (%) of total consumption for oral J01 antibacterials
92.9% 89.7% 86.2% 81.8% 76.5% 71.0% 64.1% 55.0% 45.3% 31.5%
a DDD: daily defined dose.
9. MONTENEGRO
Table 9.12 The 10 most consumed agents – parenteral formulation (2014)
AgentDDD/1000 inhabitants per daya
Top 10 Top 9 Top 8 Top 7 Top 6 Top 5 Top 4 Top 3 Top 2 Top 1
Gentamicin 0.83 0.83 0.83 0.83 0.83 0.83 0.83 0.83 0.83 0.83
Combinationsb 0.19 0.19 0.19 0.19 0.19 0.19 0.19 0.19 0.19
Amikacin 0.16 0.16 0.16 0.16 0.16 0.16 0.16 0.16
Ceftriaxone 0.11 0.11 0.11 0.11 0.11 0.11 0.11
Metronidazole 0.08 0.08 0.08 0.08 0.08 0.08
Ciprofloxacin 0.06 0.06 0.06 0.06 0.06
Cefazolin 0.05 0.05 0.05 0.05
Meropenem 0.05 0.05 0.05
Ceftazidime 0.04 0.04
Vancomycin 0.03
Total consumption for this group of agents
1.61 1.58 1.54 1.49 1.44 1.37 1.29 1.18 1.03 0.83
Total consumption for all parental J01 antibacterials
1.72 1.72 1.72 1.72 1.72 1.72 1.72 1.72 1.72 1.72
Proportion (%) of total consumption for parental J01 antibacterials
93.7% 92.0% 89.4% 86.7% 83.8% 80.1% 75.2% 68.9% 59.7% 48.6%
a DDD: daily defined dose. b Combinations of antibacterials are: J01CA20, J01CE30, J01EB20, J01EC20 or J01ED20.

71
9.6 Comments
Interpretation of the data presented in this chapter relies on an understanding of the national context. The analyses are based on wholesaler records, and the results suggest that supply cycles may have an impact on the estimates and explain (in part) the fluctuations between years.
A more detailed understanding of the patterns of antimicrobial consumption would identify areas for further investigation and allow development of targeted interventions to address potential problems identified in the consumption of antibacterials.
9. MONTENEGRO

72
10. REPUBLIC OF MOLDOVA
10.1 Data sources and years of data collection
The Republic of Moldova provided data for each of the four years of data collection (2011–2014). The main sources were import records provided by the drug agency and information provided by local pharmaceutical manufacturers (Table 10.1). Further information on the estimates provided by local manufacturers was not available.
Table 10.1 Sources of data used for consumption estimates (2011–2014)
Year Health care sector coverage Data type Data source
(consumption) Population Data source (population)
2011 Total care Import recordsManufacturing records
Drug agencyLocal manufacturers 3 559 986 World Bank
2012 Total care Import recordsManufacturing records
Drug agencyLocal manufacturers 3 559 519 World Bank
2013 Total care Import recordsManufacturing records
Drug agencyLocal manufacturers 3 558 566 World Bank
2014 Total care Import recordsManufacturing records
Drug agencyLocal manufacturers 3 556 397 World Bank
10.2 Estimates of volumes of consumption of antibacterials for systemic use (J01)
Total consumption of antibacterials for systemic use (ATC class J01) is examined by route of administration (oral and parenteral formulations) and by pharmacological subgroup.
10.2.1 Total consumption of J01 antibacterials by route of administration
The consumption of oral and parenteral (injectable) formulations of J01 antibacterials is shown in Fig. 10.1 and summarized in Table 10.2 as DDD/1000 inhabitants per day (DID).
The import data, supplemented with local manufacturer data, show considerable fluctuations in total consumption of J01 antibacterials over time, from 21.3 DID in 2011 to 17.7 DID in 2014,

73
with highest reported consumption of 22.8 DID in 2013. This pattern suggests there is some impact of the data sources used and might be explained in part by import and medicine supply cycles for these medicines.
The relative consumption of parenteral antibacterials remained reasonably stable at around 19% of total J01 consumption (Table 10.2).
Table 10.2 Total consumption of J01 antibacterials by route of administration
Route of administrationDDD/1000 inhabitants per daya (% of totalb)
2011 2012 2013 2014
Oral J01 17.2 (81) 11 (81) 18.6 (82) 14 (79)
Parenteral J01 4.1 (19) 2.6 (19) 4.1 (18) 3.7 (21)
Total 21.3 13.6 22.8 17.7
a DDD: daily defined dose. b Total amounts and percentages may vary slightly owing to rounding.
10.2.2 Total consumption of J01 antibacterials by pharmacological subgroup
The consumption of J01 antibacterials by pharmacological subgroup is shown in Fig. 10.2 and summarized in Table 10.3.
10. REPUBLIC OF MOLDOVA
0
5
10
15
20
25
DD
D/1
000
inha
bita
nts
per
day
Parenteral antibacterials
Oral antibacterials
MDA2013
MDA2012
MDA2011
MDA2014
Fig. 10.1 Total consumption of J01 antibacterials by route of administration
DDD: defined daily dose.

74
Given the fluctuations across the years it is difficult to draw substantial conclusions on changes in consumption for particular subgroups. Nevertheless, the data suggest some reductions in consumption of tetracyclines (J01A), which fell from 1.2 DID in 2011 to 0.6 DID in 2014, and sulfonamides and trimethoprim (J01E), which fell from 1.7 DID in 2011 to 1 DID in 2014. In 2014 the highest levels of consumption were beta-lactams (J01C), at 6.6 DID, and cephalosporins (J01D), at 3.7 DID (Table 10.3).
Table 10.3 Total consumption of J01 antibacterials by pharmacological subgroup
Class of antibacterial agentsDDD/1000 inhabitants per daya
2011 2012 2013 2014
Tetracyclines (J01A) 1.2 0.7 1.9 0.6
Amphenicols (J01B) 0.2 <0.1 0.2 0.2
Beta-lactams (J01C) 7.5 4.0 9.5 6.6
Cephalosporins (J01D) 3.2 2.1 3.1 3.7
Sulfonamides and trimethoprim (J01E) 1.7 0.9 1.1 1.0
Macrolides, lincosamides and streptogramins (J01F) 2.2 1.6 2.1 1.9
Quinolone antibacterials (J01M) 2.7 1.9 2.7 3.0
Other J01 antibacterials (J01G, J01R, J01X) 2.5 2.4 2.2 0.7
Totalb 21.3 13.6 22.8 17.7
a DDD: daily defined dose. b Total amounts may vary slightly owing to rounding.
0
5
10
15
20
25
DD
D/1
000
inha
bita
nts
per
day
MDA2013
MDA2012
MDA2011
MDA2014
Quinolone antibacterials (J01M)
Macrolides, lincosamides and streptogramins (J01F)
Sulfonamides and trimethoprim (J01E)
Cephalosporins (J01D)
Beta-lactams (J01C)
Amphenicols (J01B)
Other J01 antibacterials
Tetracyclines (J01A)
Fig. 10.2 Total consumption of J01 antibacterials by pharmacological subgroup
DDD: defined daily dose.
10. REPUBLIC OF MOLDOVA

75
10.3 Relative consumption of J01 antibacterials by subgroup
10.3.1 Relative consumption of J01 antibacterials by pharmacological subgroup
The relative consumption of pharmacological subgroups measured as a proportion of total J01 antibacterials is shown in Fig. 10.3 and summarized in Table 10.4.
The data illustrate the fluctuating patterns of consumption of the various subgroups over time. Most notable and consistent are the increasing relative consumption of cephalosporins (14.8% of J01 antibacterials consumption in 2011 and 20.7% in 2014) and quinolone antibacterials (12.7% in 2011 and 17% in 2014).
Table 10.4 Relative consumption of J01 antibacterials by pharmacological subgroup
Class of antibacterial agentsConsumption as proportion of total J01 consumption (%)a
2011 2012 2013 2014
Tetracyclines (J01A) 5.8 4.8 8.4 3.4
Amphenicols (J01B) 1.1 0.4 0.7 1.0
Beta-lactams (J01C) 35.3 29.2 41.7 37.3
Cephalosporins (J01D) 14.8 15.7 13.7 20.7
Sulfonamides and trimethoprim (J01E) 7.9 6.7 4.7 5.6
Macrolides, lincosamides and streptogramins (J01F) 10.4 11.9 9.2 10.9
Quinolone antibacterials (J01M) 12.7 13.9 12.1 17.0
Other J01 antibacterials (J01G, J01R, J01X) 11.8 17.4 9.6 4.0
a Total percentages may vary slightly owing to rounding.
10. REPUBLIC OF MOLDOVA
0%
20%
40%
60%
80%
100%
Pro
port
ion
of to
tal
J01
anti
bact
eria
l con
sum
ptio
n
MDA2013
MDA2012
MDA2011
MDA2014
Quinolone antibacterials (J01M)
Macrolides, lincosamides and streptogramins (J01F)
Sulfonamides and trimethoprim (J01E)
Cephalosporins (J01D)
Beta-lactams (J01C)
Amphenicols (J01B)
Other J01 antibacterials
Tetracyclines (J01A)
Fig. 10.3 Relative consumption of J01 antibacterials by pharmacological subgroup

76
10.3.2 Consumption of cephalosporins and quinolones as a proportion of total consumption of J01 antibacterials
Cephalosporins and quinolones are broad-spectrum antibiotics and are considered second-line antibiotics in most prescribing guidelines. Generally, it is recommended that their use should be restricted to ensure availability as second-line therapy, should first-line antibiotics fail.
The relative consumption of cephalosporins and quinolones measured as a proportion of total J01 antibacterials is shown in Fig. 10.4 and summarized in Table 10.5.
These data suggest increasing relative consumption of cephalosporins and quinolone antibacterials over time, with the two groups comprising 38% of total J01 consumption in 2014 (Table 10.5). Given the fluctuations in annual J01 consumption estimates, these observations require confirmation using other data sources.
Table 10.5 Consumption of cephalosporins and quinolones as a proportion of total consumption of J01 antibacterials
Class of antibacterial agentsDDD/1000 inhabitants per daya (% of totalb)
2011 2012 2013 2014
Quinolone antibacterials (J01M) 2.7 (13) 1.9 (14) 2.7 (12) 3 (17)
Cephalosporins (J01D) 3.2 (15) 2.1 (16) 3.1 (14) 3.7 (21)
Other J01 antibacterials 15.4 (72) 9.6 (70) 16.9 (74) 11 (62)
Total 21.3 13.6 22.8 17.7
a DDD: daily defined dose. b Total amounts and percentages may vary slightly owing to rounding.
0%
20%
40%
60%
80%
100%
Pro
port
ion
of to
tal
J01
anti
bact
eria
l con
sum
ptio
n
MDA2013
MDA2012
MDA2011
MDA2014
Other J01 antibacterials
Cephalosporins (J01D)
Quinolone antibacterials (J01M)
Fig. 10.4 Consumption of cephalosporins and quinolones as a proportion of total consumption of J01 antibacterials
10. REPUBLIC OF MOLDOVA

77
10.4 Relative consumption by choice of agent
10.4.1 Relative consumption of cephalosporins by generation
Third- and fourth-generation cephalosporins have a broader spectrum of activity than first- and second-generation agents, with enhanced coverage of both Gram-positive and Gram-negative organisms. WHO (2012) has identified third- and fourth-generation cephalosporins as some of the agents of highest priority for risk management to ensure that critically important antimicrobials are used prudently both in human and veterinary medicine.
The relative consumption of first-, second-, third- and fourth-generation cephalosporins in 2011–2014 is shown in Fig. 10.5 and summarized in Table 10.6.
Consumption of fourth-generation cephalosporins was very limited (<0.1 DID) during 2011–2014, with reasonably stable consumption of third-generation agents (45% of total cephalosporin consumption in 2014; Table 10.6).
Table 10.6 Relative consumption of cephalosporins by generation
GenerationDDD/1000 inhabitants per daya (% of totalb)
2011 2012 2013 2014
First-generation (J01DB) 1.3 (41) 0.6 (27) 0.5 (16) 1 (28)
Second-generation (J01DC) 0.5 (15) 0.6 (26) 0.7 (24) 1 (26)
Third-generation (J01DD) 1.4 (43) 1 (47) 1.9 (61) 1.7 (45)
Fourth-generation (J01DE) <0.1 <0.1 <0.1 <0.1
Total 3.2 2.1 3.1 3.7
a DDD: daily defined dose. b Total amounts and percentages may vary slightly owing to rounding.
10. REPUBLIC OF MOLDOVA
0%
20%
40%
60%
80%
100%
Pro
port
ion
of t
otal
ce
phal
ospo
rin
cons
umpt
ion
MDA2013
MDA2012
MDA2011
MDA2014
Fourth-generation (J01DE)
Third-generation (J01DD)
Second-generation (J01DC)
First-generation (J01DB)
Fig. 10.5 Relative consumption of cephalosporins by generation

78
10.4.1.1 Choice of first-generation cephalosporins (J01DB)Table 10.7 illustrates the pattern of consumption of first-generation cephalosporins in 2011–2014. Cefalexin and cefazolin were those most consumed.
Table 10.7 Relative consumption of agents within first-generation cephalosporins (J01DB)
AgentDDD/1000 inhabitants per daya (% of totalb)
2011 2012 2013 2014
Cefalexin 0.5 (36) 0.2 (28) 0.2 (38) 0.3 (34)
Cefazolin 0.8 (64) 0.4 (72) 0.3 (62) 0.7 (66)
Total 1.3 0.6 0.5 1.0
a DDD: daily defined dose. b Total amounts and percentages may vary slightly owing to rounding.
10.4.1.2 Choice of second-generation cephalosporins (J01DC)Table 10.8 summarizes the pattern of consumption of second-generation cephalosporins in 2011–2014. Cefuroxime was the most consumed agent.
Table 10.8 Relative consumption of agents within second-generation cephalosporins (J01DC)
AgentDDD/1000 inhabitants per daya (% of totalb)
2011 2012 2013 2014
Cefuroxime 0.5 (96) 0.5 (86) 0.7 (99) 0.9 (90)
Cefaclor <0.1 <0.1 <0.1 <0.1
Cefprozil <0.1 <0.1 <0.1 <0.1
Total 0.5 0.6 0.7 1.0
a DDD: daily defined dose. b Total amounts and percentages may vary slightly owing to rounding.
10.4.1.3 Choice of third-generation cephalosporins (J01DD)Table 10.9 summarizes the pattern of consumption of third-generation cephalosporins in 2011–2014. Ceftriaxone was the most frequently consumed agent, with lower consumption of cefotaxime and cefixime.
Table 10.9 Relative consumption of agents within third-generation cephalosporins (J01DD)
AgentDDD/1000 inhabitants per daya (% of totalb)
2011 2012 2013 2014
Cefotaxime 0.2 (12) <0.1 0.2 (13) 0.2 (11)
Ceftazidime 0.1 (8) <0.1 <0.1 <0.1
Ceftriaxone 0.9 (66) 0.7 (69) 1.3 (75) 1.1 (66)
Cefixime 0.2 (12) 0.2 (19) 0.1 (6) 0.2 (10)
Cefoperazone <0.1 <0.1 <0.1 <0.1
Cefpodoxime – – – <0.1
Ceftibuten <0.1 <0.1 <0.1 <0.1
Cefdinir – – – <0.1
Total 1.3 1.0 1.8 1.6
a DDD: daily defined dose. b Total amounts and percentages may vary slightly owing to rounding.
10. REPUBLIC OF MOLDOVA

79
10.4.1.4 Choice of fourth-generation cephalosporins (J01DE)Consumption of fourth-generation cephalosporins was low during 2011–2014, with cefepime and cefpirome consumed in small amounts.
10.4.2 Relative consumption of agents within fluoroquinolones (J01MA)
Quinolone antibacterials comprised between 12% and 17% of consumption of J01 antibacterials during 2011–2014 (see Table 10.4). Almost all of this quinolone consumption was from the fluoroquinolone category (J01MA). The most consumed agents were ciprofloxacin and levofloxacin, with smaller amounts of ofloxacin and norfloxacin consumed (Table 10.10). Reported consumption of newer fluoroquinolones moxifloxacin, gemifloxacin and gatifloxacin was low.
Table 10.10 Relative consumption of agents within fluoroquinolones (J01MA)
AgentDDD/1000 inhabitants per daya (% of totalb)
2011 2012 2013 2014
Ofloxacin 0.1 (5) 0.2 (14) 0.3 (12) 0.3 (10)
Ciprofloxacin 1.3 (50) 0.7 (42) 1 (39) 1.1 (39)
Pefloxacin <0.1 <0.1 <0.1 <0.1
Norfloxacin 0.4 (15) <0.1 0.3 (13) 0.3 (9)
Levofloxacin 0.7 (27) 0.6 (37) 0.8 (32) 1 (38)
Moxifloxacin <0.1 <0.1 <0.1 0.1 (5)
Gemifloxacin – – – <0.1
Gatifloxacin <0.1 <0.1 <0.1 <0.1
Total 2.5 1.7 2.5 2.8
a DDD: daily defined dose. b Total amounts and percentages may vary slightly owing to rounding.
10.4.3 Relative consumption of amoxicillin, amoxicillin and clavulanic acid
The addition of clavulanic acid to amoxicillin extends the spectrum of activity of amoxicillin against beta-lactamase-producing bacteria. Amoxicillin and clavulanic acid is recommended as second-line treatment in many treatment guidelines.
Table 10.11 summarizes the relative consumption of amoxicillin and broader-spectrum amoxicillin and clavulanic acid. Amoxicillin was the more consumed agent in all years reported.
Table 10.11 Relative consumption of amoxicillin and amoxicillin and clavulanic acid
AgentDDD/1000 inhabitants per daya (% of totalb)
2011 2012 2013 2014
Amoxicillin (J01CA04) 4.4 (81) 1.9 (65) 5 (71) 3.8 (70)
Amoxicillin and clavulanic acid (J01CR02) 1 (19) 1 (35) 2.1 (29) 1.6 (30)
Total 5.4 2.9 7.1 5.5
a DDD: daily defined dose. b Total amounts and percentages may vary slightly owing to rounding.
10. REPUBLIC OF MOLDOVA

80
10.5 The 10 most consumed agents
While the number of J01 antibacterial agents available is large, there is considerable evidence from ESAC-Net and other analyses that consumption tends to be concentrated in a relatively small number.
10.5.1 The 10 most consumed agents – oral formulation
Table 10.12 summarizes consumption of the oral agents that comprise the 10 most consumed in 2014. Eight agents (amoxicillin, amoxicillin and enzyme inhibitor, levofloxacin, ciprofloxacin, sulfamethoxazole and trimethoprim, azithromycin, cefuroxime and clarithromycin) account for just under 75% of consumption. The first four of these (amoxicillin, amoxicillin and enzyme inhibitor, levofloxacin and ciprofloxacin) represent around half (51%) of all oral J01 agent consumption.
10.5.2 The 10 most consumed agents – parenteral formulation
Table 10.13 summarizes consumption of the 10 most consumed parenteral agents in 2014. Six of these (ceftriaxone, cefazolin, ampicillin, amoxicillin, cefotaxime and metronidazole) account for just over 78% of consumption. The third-generation cephalosporin ceftriaxone alone accounted for almost 30% of consumption.
Table 10.12 The 10 most consumed agents – oral formulation (2014)
AgentDDD/1000 inhabitants per daya
Top 10 Top 9 Top 8 Top 7 Top 6 Top 5 Top 4 Top 3 Top 2 Top 1
Amoxicillin 3.52 3.52 3.52 3.52 3.52 3.52 3.52 3.52 3.52 3.52
Amoxicillin and enzyme inhibitor 1.59 1.59 1.59 1.59 1.59 1.59 1.59 1.59 1.59
Levofloxacin 1.03 1.03 1.03 1.03 1.03 1.03 1.03 1.03
Ciprofloxacin 0.99 0.99 0.99 0.99 0.99 0.99 0.99
Sulfamethoxazole and trimethoprim 0.98 0.98 0.98 0.98 0.98 0.98
Azithromycin 0.94 0.94 0.94 0.94 0.94
Cefuroxime 0.73 0.73 0.73 0.73
Clarithromycin 0.62 0.62 0.62
Doxycycline 0.58 0.58
Ampicillin 0.54
Total consumption for this group of agents
11.52 10.98 10.40 9.78 9.06 8.12 7.14 6.14 5.11 3.52
Total consumption for all oral J01 antibacterials
13.99 13.99 13.99 13.99 13.99 13.99 13.99 13.99 13.99 13.99
Proportion (%) of total consumption for oral J01 antibacterials
82.3% 78.5% 74.3% 69.9% 64.7% 58.0% 51.0% 43.9% 36.5% 25.2%
a DDD: daily defined dose.
10. REPUBLIC OF MOLDOVA

81
10.6 Comments
Interpretation of the data presented in this chapter relies on an understanding of the national context. The analyses are based on import and local manufacturer records, and the results suggest that import and medicine supply cycles may have a substantial impact on the estimates and explain (in part) the fluctuations between years.
Consideration could be given to exploring the use of additional data sources, such as wholesaler data, to create more robust consumption estimates. A more detailed understanding of the patterns of antimicrobial consumption would identify areas for further investigation and allow development of targeted interventions to address potential problems identified in the consumption of antibacterials.
10. REPUBLIC OF MOLDOVA
Table 10.13 The 10 most consumed agents – parenteral formulation (2014)
AgentDDD/1000 inhabitants per daya
Top 10 Top 9 Top 8 Top 7 Top 6 Top 5 Top 4 Top 3 Top 2 Top 1
Ceftriaxone 1.09 1.09 1.09 1.09 1.09 1.09 1.09 1.09 1.09 1.09
Cefazolin 0.69 0.69 0.69 0.69 0.69 0.69 0.69 0.69 0.69
Ampicillin 0.47 0.47 0.47 0.47 0.47 0.47 0.47 0.47
Amoxicillin 0.32 0.32 0.32 0.32 0.32 0.32 0.32
Cefotaxime 0.17 0.17 0.17 0.17 0.17 0.17
Metronidazole 0.17 0.17 0.17 0.17 0.17
Cefuroxime 0.14 0.14 0.14 0.14
Gentamicin 0.13 0.13 0.13
Streptomycin 0.08 0.08
Ciprofloxacin 0.07
Total consumption for this group of agents
3.34 3.27 3.19 3.06 2.92 2.75 2.57 2.25 1.78 1.09
Total consumption for all parental J01 antibacterials
3.71 3.71 3.71 3.71 3.71 3.71 3.71 3.71 3.71 3.71
Proportion (%) of total consumption for parental J01 antibacterials
90.1% 88.2% 86.0% 82.5% 78.7% 74.0% 69.3% 60.6% 47.9% 29.4%
a DDD: daily defined dose.

82
11. SERBIA
11.1 Data sources and years of data collection
Serbia provided data for each of the four years of data collection (2011–2014). The main sources were sales records of marketing authorization holders provided by the drug agency (Table 11.1).
Table 11.1 Sources of data used for consumption estimates (2011–2014)
Year Health care sector coverage Data type Data source
(consumption) Population Data source (population)
2011 Total careSales records of
marketing authorization holders
Drug agency 7 234 099 World Bank
2012 Total careSales records of
marketing authorization holders
Drug agency 7 199 077 World Bank
2013 Total careSales records of
marketing authorization holders
Drug agency 7 164 132 World Bank
2014 Total careSales records of
marketing authorization holders
Drug agency 7 130 576 World Bank
11.2 Estimates of volumes of consumption of antibacterials for systemic use (J01)
Total consumption of antibacterials for systemic use (ATC class J01) is examined by route of administration (oral and parenteral formulations) and by pharmacological subgroup.
11.2.1 Total consumption of J01 antibacterials by route of administration
The consumption of oral and parenteral (injectable) formulations of J01 antibacterials is shown in Fig. 11.1 and summarized in Table 11.2 as DDD/1000 inhabitants per day (DID).
There is evidence of an increase in total consumption of J01 antibacterials over time (26.4 DID in 2011 to 29.5 DID in 2014). Data are based on sales of registered medicines and include the supply of inpatient and outpatient institutions.

83
The relative consumption of parenteral antibacterials remained reasonably stable at around 6% of total J01 consumption during the period (Table 11.2).
Table 11.2 Total consumption of J01 antibacterials by route of administration
Route of administrationDDD/1000 inhabitants per daya (% of totalb)
2011 2012 2013 2014
Oral J01 24.9 (94) 25.7 (93) 25.9 (94) 27.8 (94)
Parenteral J01 1.5 (6) 1.9 (7) 1.6 (6) 1.7 (6)
Total 26.4 27.6 27.5 29.5
a DDD: daily defined dose. b Total amounts and percentages may vary slightly owing to rounding.
11.2.2 Total consumption of J01 antibacterials by pharmacological subgroup
The consumption of J01 antibacterials by pharmacological subgroup is shown in Fig. 11.2 and summarized in Table 11.3.
Numerically, the largest changes in consumption of pharmacological subgroups occurred in beta-lactams (J01C), which increased from 11.2 DID in 2011 to 13.7 DID in 2014. In addition, there is evidence of increasing consumption of cephalosporins (J01D), which increased from 3.7 DID to 4.4 DID, the sulfonamides and trimethoprim group (J01E), from 0.7 DID to 1.1 DID, and quinolones (J01M), from 2.6 DID to 3.3 DID. These were offset to some extent by reduced consumption of macrolides, lincosamides and streptogramins (J01F), which fell from 5.0 DID to 3.9 DID. Beta-lactams (J01C) showed the highest levels of consumption in 2011–2014.
11. SERBIA
0
5
10
15
20
25
30
35
DD
D/1
000
inha
bita
nts
per
day
Parenteral antibacterials
Oral antibacterials
SRB2013
SRB2012
SRB2011
SRB2014
Fig. 11.1 Total consumption of J01 antibacterials by route of administration
DDD: defined daily dose.

84
Table 11.3 Total consumption of J01 antibacterials by pharmacological subgroup
Class of antibacterial agentsDDD/1000 inhabitants per daya
2011 2012 2013 2014
Tetracyclines (J01A) 2.3 2.1 2.9 2.1
Amphenicols (J01B) <0.1 <0.1 <0.1 <0.1
Beta-lactams (J01C) 11.2 11.3 11.6 13.7
Cephalosporins (J01D) 3.7 4.7 4.1 4.4
Sulfonamides and trimethoprim (J01E) 0.7 0.5 0.9 1.1
Macrolides, lincosamides and streptogramins (J01F) 5.0 4.1 4.1 3.9
Quinolone antibacterials (J01M) 2.6 3.8 3.1 3.3
Other J01 antibacterials (J01G, J01R, J01X) 0.8 1.1 0.9 1.0
Totalb 26.4 27.6 27.5 29.5
a DDD: daily defined dose. b Total amounts may vary slightly owing to rounding.
11.3 Relative consumption of J01 antibacterials by subgroup
11.3.1 Relative consumption of J01 antibacterials by pharmacological subgroup
The relative consumption of pharmacological subgroups measured as a proportion of total J01 antibacterials is shown in Fig. 11.3 and summarized in Table 11.4.
0
5
10
15
20
25
30
35
DD
D/1
000
inha
bita
nts
per
day
SRB2013
SRB2012
SRB2011
SRB2014
Quinolone antibacterials (J01M)
Macrolides, lincosamides and streptogramins (J01F)
Sulfonamides and trimethoprim (J01E)
Cephalosporins (J01D)
Beta-lactams (J01C)
Amphenicols (J01B)
Other J01 antibacterials
Tetracyclines (J01A)
Fig. 11.2 Total consumption of J01 antibacterials by pharmacological subgroup
DDD: defined daily dose.
11. SERBIA

85
Beta-lactams (J01C) was the most consumed pharmacological subgroup, at 46.2% of total consumption in 2014, followed by cephalosporins (J01D), at 14.9%, and macrolides, lincosamides and streptogramins (J01F), at 13.3%.
Consumption of the pharmacological subgroups was reasonably stable during 2011–2014, with a suggestion of increased relative consumption of beta-lactams (J01C), from 42.4% in 2011 to 46.2% in 2014, and reduced relative consumption of macrolides, lincosamides and streptogramins (J01F), from 19.1% in 2011 to 13.3% in 2014.
Table 11.4 Relative consumption of J01 antibacterials by pharmacological subgroup
Class of antibacterial agentsConsumption as proportion of total J01 consumption (%)a
2011 2012 2013 2014
Tetracyclines (J01A) 8.8 7.5 10.7 7.0
Amphenicols (J01B) <0.1 <0.1 <0.1 <0.1
Beta-lactams (J01C) 42.4 41.1 42.0 46.2
Cephalosporins (J01D) 14.0 17.2 14.8 14.9
Sulfonamides and trimethoprim (J01E) 2.7 1.8 3.1 3.6
Macrolides, lincosamides and streptogramins (J01F) 19.1 14.7 14.7 13.3
Quinolone antibacterials (J01M) 9.9 13.7 11.2 11.3
Other J01 antibacterials (J01G, J01R, J01X) 3.2 4.0 3.3 3.5
a Total percentages may vary slightly owing to rounding.
0%
20%
40%
60%
80%
100%
Pro
port
ion
of to
tal
J01
anti
bact
eria
l con
sum
ptio
n
SRB2013
SRB2012
SRB2011
SRB2014
Quinolone antibacterials (J01M)
Macrolides, lincosamides and streptogramins (J01F)
Sulfonamides and trimethoprim (J01E)
Cephalosporins (J01D)
Beta-lactams (J01C)
Amphenicols (J01B)
Other J01 antibacterials
Tetracyclines (J01A)
Fig. 11.3 Relative consumption of J01 antibacterials by pharmacological subgroup
11. SERBIA

86
11.3.2 Consumption of cephalosporins and quinolones as a proportion of total consumption of J01 antibacterials
Cephalosporins and quinolones are broad-spectrum antibiotics and are considered second-line antibiotics in most prescribing guidelines. Generally, it is recommended that their use should be restricted to ensure availability as second-line therapy, should first-line antibiotics fail.
The relative consumption of cephalosporins and quinolones measured as a proportion of total J01 antibacterials is shown in Fig. 11.4 and summarized in Table 11.5.
Consumption of quinolones and cephalosporins was reasonably stable, at around 11% and 15% respectively, in 2011–2014. Together, these two subgroups comprise around 26% of total J01 consumption in 2014 (Table 11.5).
Table 11.5 Consumption of cephalosporins and quinolones as a proportion of total consumption of J01 antibacterials
Class of antibacterial agentsDDD/1000 inhabitants per daya (% of totalb)
2011 2012 2013 2014
Quinolone antibacterials (J01M) 2.6 (10) 3.8 (14) 3.1 (11) 3.3 (11)
Cephalosporins (J01D) 3.7 (14) 4.7 (17) 4.1 (15) 4.4 (15)
Other J01 antibacterials 20.1 (76) 19.1 (69) 20.4 (74) 21.8 (74)
Total 26.4 27.6 27.5 29.5
a DDD: daily defined dose. b Total amounts and percentages may vary slightly owing to rounding.
0%
20%
40%
60%
80%
100%
Pro
port
ion
of to
tal
J01
anti
bact
eria
l con
sum
ptio
n
SRB2013
SRB2012
SRB2011
SRB2014
Other J01 antibacterials
Cephalosporins (J01D)
Quinolone antibacterials (J01M)
Fig. 11.4 Consumption of cephalosporins and quinolones as a proportion of total consumption of J01 antibacterials
11. SERBIA

87
11.4 Relative consumption by choice of agent
11.4.1 Relative consumption of cephalosporins by generation
Third- and fourth-generation cephalosporins have a broader spectrum of activity than first- and second-generation agents, with enhanced coverage of both Gram-positive and Gram-negative organisms. WHO (2012) has identified third- and fourth-generation cephalosporins as some of the agents of highest priority for risk management to ensure that critically important antimicrobials are used prudently both in human and veterinary medicine.
The relative consumption of first-, second-, third- and fourth-generation cephalosporins in 2011–2014 is shown in Fig. 11.5 and summarized in Table 11.6.
Most consumption was of first-generation agents (increasing from 64% in 2011 to 80% in 2014), matched by reductions in consumption of second- and third-generation cephalosporins in 2011–2014 (Table 11.6). Consumption of fourth-generation agents was very limited.
Table 11.6 Relative consumption of cephalosporins by generation
GenerationDDD/1000 inhabitants per daya (% of totalb)
2011 2012 2013 2014
First-generation (J01DB) 2.3 (64) 3.5 (75) 3 (74) 3.5 (80)
Second-generation (J01DC) 0.4 (11) 0.3 (7) 0.2 (5) 0.2 (4)
Third-generation (J01DD) 0.9 (25) 0.8 (18) 0.8 (21) 0.7 (16)
Fourth-generation (J01DE) <0.1 <0.1 <0.1 <0.1
Total 3.6 4.7 4.0 4.4
a DDD: daily defined dose. b Total amounts and percentages may vary slightly owing to rounding.
0%
20%
40%
60%
80%
100%
Pro
port
ion
of t
otal
ce
phal
ospo
rin
cons
umpt
ion
SRB2013
SRB2012
SRB2011
SRB2014
Fourth-generation (J01DE)
Third-generation (J01DD)
Second-generation (J01DC)
First-generation (J01DB)
Fig. 11.5 Relative consumption of cephalosporins by generation
11. SERBIA

88
11.4.1.1 Choice of first-generation cephalosporins (J01DB)Table 11.7 illustrates the pattern of consumption of first-generation cephalosporins in 2011–2014. Cefalexin was the first-generation cephalosporin most consumed.
Table 11.7 Relative consumption of agents within first-generation cephalosporins (J01DB)
AgentDDD/1000 inhabitants per daya (% of totalb)
2011 2012 2013 2014
Cefalexin 2.3 (98) 3.5 (99) 2.9 (97) 3.4 (99)
Cefazolin <0.1 <0.1 <0.1 <0.1
Cefadroxil <0.1 <0.1 <0.1 <0.1
Total 2.3 3.5 3.0 3.5
a DDD: daily defined dose. b Total amounts and percentages may vary slightly owing to rounding.
11.4.1.2 Choice of second-generation cephalosporins (J01DC)Table 11.8 summarizes the pattern of consumption of second-generation cephalosporins in 2011–2014. Cefuroxime, cefaclor and cefprozil were those most consumed, although in reasonably small volumes.
Table 11.8 Relative consumption of agents within second-generation cephalosporins (J01DC)
AgentDDD/1000 inhabitants per daya (% of totalb)
2011 2012 2013 2014
Cefuroxime 0.3 (82) 0.2 (56) 0.1 (51) <0.1
Cefaclor <0.1 0.1 (31) <0.1 <0.1
Cefprozil <0.1 <0.1 <0.1 <0.1
Total 0.4 0.3 0.2 0.2
a DDD: daily defined dose. b Total amounts and percentages may vary slightly owing to rounding.
11.4.1.3 Choice of third-generation cephalosporins (J01DD)Table 11.9 summarizes the pattern of consumption of third-generation cephalosporins in 2011–2014. Ceftriaxone and cefixime were those most consumed.
Table 11.9 Relative consumption of agents within third-generation cephalosporins (J01DD)
AgentDDD/1000 inhabitants per daya (% of totalb)
2011 2012 2013 2014
Cefotaxime <0.1 <0.1 <0.1 <0.1
Ceftazidime <0.1 <0.1 <0.1 <0.1
Ceftriaxone 0.3 (34) 0.3 (38) 0.3 (38) 0.4 (61)
Cefixime 0.5 (59) 0.5 (54) 0.4 (49) 0.2 (22)
Cefoperazone <0.1 <0.1 <0.1 <0.1
Cefpodoxime <0.1 <0.1 <0.1 <0.1
Ceftibuten <0.1 <0.1 <0.1 <0.1
Total 0.9 0.8 0.8 0.7
a DDD: daily defined dose. b Total amounts and percentages may vary slightly owing to rounding.
11. SERBIA

89
11.4.1.4 Choice of fourth-generation cephalosporins (J01DE)Consumption of any of the fourth-generation cephalosporins was very limited.
11.4.2 Relative consumption of agents within fluoroquinolones (J01MA)
Quinolone antibacterials comprised around 11% of consumption of J01 antibacterials during 2013–2014 (see Table 11.4). Around 74% of quinolone consumption was from fluoroquinolone category (J01MA). The most consumed agents were ciprofloxacin, levofloxacin and norfloxacin (Table 11.10).
There was some consumption of agents within the “other quinolones” category (J01MB) – namely pipemidic acid, an analogue of nalidixic acid that can be used to treat urinary tract infections (0.9 DID in 2014).
Table 11.10 Relative consumption of agents within fluoroquinolones (J01MA)
AgentDDD/1000 inhabitants per daya (% of totalb)
2011 2012 2013 2014
Ofloxacin <0.1 <0.1 <0.1 <0.1
Ciprofloxacin 1.3 (76) 1.6 (59) 1.3 (59) 1.4 (59)
Norfloxacin 0.3 (17) 0.3 (13) 0.4 (17) 0.3 (13)
Levofloxacin <0.1 0.8 (29) 0.5 (24) 0.6 (25)
Moxifloxacin <0.1 <0.1 <0.1 <0.1
Total 1.7 2.7 2.2 2.4
a DDD: daily defined dose. b Total amounts and percentages may vary slightly owing to rounding.
11.4.3 Relative consumption of amoxicillin, amoxicillin and clavulanic acid
The addition of clavulanic acid to amoxicillin extends the spectrum of activity of amoxicillin against beta-lactamase-producing bacteria. Amoxicillin and clavulanic acid is recommended as second-line treatment in many treatment guidelines.
Table 11.11 summarizes the relative consumption of amoxicillin and broader-spectrum amoxicillin and clavulanic acid. Consumption was dominated by amoxicillin (78% in 2014).
Table 11.11 Relative consumption of amoxicillin, amoxicillin and clavulanic acid
AgentDDD/1000 inhabitants per daya (% of totalb)
2011 2012 2013 2014
Amoxicillin (J01CA04) 6.7 (64) 7.3 (74) 8.1 (75) 9.8 (78)
Amoxicillin and clavulanic acid (J01CR02) 3.8 (36) 2.6 (26) 2.7 (25) 2.7 (22)
Total 10.5 10.0 10.8 12.5
a DDD: daily defined dose. b Total amounts and percentages may vary slightly owing to rounding.
11. SERBIA

90
11.5 The 10 most consumed agents
While the number of J01 antibacterial agents available is large, there is considerable evidence from ESAC-Net and other analyses that consumption tends to be concentrated in a relatively small number.
11.5.1 The 10 most consumed agents – oral formulation
Table 11.12 summarizes consumption of the oral agents that comprise the 10 most consumed in 2014. Six agents (amoxicillin, cefalexin, amoxicillin and enzyme inhibitor, doxycycline, azithromycin and ciprofloxacin) account for just over 76% of consumption.
11.5.2 The 10 most consumed agents – parenteral formulation
Table 11.13 summarizes consumption of the 10 most consumed parenteral agents (by DID) in 2014. Five of these (gentamicin, ceftriaxone, combinations of antibacterials, metronidazole and cefuroxime) account for just over 75% of consumption.
Table 11.12 The 10 most consumed agents – oral formulation (2014)
AgentDDD/1000 inhabitants per daya
Top 10 Top 9 Top 8 Top 7 Top 6 Top 5 Top 4 Top 3 Top 2 Top 1
Amoxicillin 9.80 9.80 9.80 9.80 9.80 9.80 9.80 9.80 9.80 9.80
Cefalexin 3.43 3.43 3.43 3.43 3.43 3.43 3.43 3.43 3.43
Amoxicillin and enzyme inhibitor 2.73 2.73 2.73 2.73 2.73 2.73 2.73 2.73
Doxycycline 2.05 2.05 2.05 2.05 2.05 2.05 2.05
Azithromycin 1.79 1.79 1.79 1.79 1.79 1.79
Ciprofloxacin 1.39 1.39 1.39 1.39 1.39
Sulfamethoxazole and trimethoprim 1.07 1.07 1.07 1.07
Pipemidic acid 0.91 0.91 0.91
Ampicillin 0.83 0.83
Clarithromycin 0.81
Total consumption for this group of agents
24.82 24.01 23.18 22.26 21.19 19.80 18.01 15.96 13.23 9.80
Total consumption for all oral J01 antibacterials
27.82 27.82 27.82 27.82 27.82 27.82 27.82 27.82 27.82 27.82
Proportion (%) of total consumption for oral J01 antibacterials
89.2% 86.3% 83.3% 80.0% 76.2% 71.2% 64.7% 57.4% 47.5% 35.2%
a DDD: daily defined dose.
11. SERBIA

91
11.6 Comments
The analyses presented in this chapter are based on sales records of marketing authorization holders. Further years of data are needed to determine whether levels of antibacterial consumption will continue to rise, as occurred in 2014.
Use of complementary data sources and additional focused studies would allow more detailed understanding of the patterns of antimicrobial consumption. This would also facilitate the development of targeted interventions to address potential problems identified.
Table 11.13 The 10 most consumed agents – parenteral formulation (2014)
AgentDDD/1000 inhabitants per daya
Top 10 Top 9 Top 8 Top 7 Top 6 Top 5 Top 4 Top 3 Top 2 Top 1
Gentamicin 0.55 0.55 0.55 0.55 0.55 0.55 0.55 0.55 0.55 0.55
Ceftriaxone 0.42 0.42 0.42 0.42 0.42 0.42 0.42 0.42 0.42
Combinationsb 0.12 0.12 0.12 0.12 0.12 0.12 0.12 0.12
Metronidazole 0.11 0.11 0.11 0.11 0.11 0.11 0.11
Cefuroxime 0.09 0.09 0.09 0.09 0.09 0.09
Amikacin 0.05 0.05 0.05 0.05 0.05
Cefazolin 0.05 0.05 0.05 0.05
Ciprofloxacin 0.05 0.05 0.05
Ampicillin 0.04 0.04
Vancomycin 0.03
Total consumption for this group of agents
1.50 1.48 1.44 1.39 1.34 1.29 1.20 1.09 0.97 0.55
Total consumption for all parental J01 antibacterials
1.71 1.71 1.71 1.71 1.71 1.71 1.71 1.71 1.71 1.71
Proportion (%) of total consumption for parental J01 antibacterials
88.2% 86.5% 84.5% 81.6% 78.7% 75.7% 70.6% 63.9% 56.7% 32.3%
a DDD: daily defined dose. b Combinations of antibacterials are: J01CA20, J01CE30, J01EB20, J01EC20 or J01ED20.
11. SERBIA

92
12. TAJIKISTAN
12.1 Data sources and years of data collection
Tajikistan provided data for each of the four years of data collection (2011–2014). The main sources were import records and certification records provided by the State Surveillance Service for Pharmaceutical Activities. The data cover imported, locally produced and donated medicines (Table 12.1).
Table 12.1 Sources of data used for consumption estimates (2011–2014)
Year Health care sector coverage Data type Data source
(consumption) Population Data source (population)
2011 Total careImport records
Certification records
State Surveillance Service for
Pharmaceutical Activities
7 708 500a
The Agency for Statistics under the
President of the Republic of Tajikistan
2012 Total careImport records
Certification records
State Surveillance Service for
Pharmaceutical Activities
7 900 000a
The Agency for Statistics under the
President of the Republic of Tajikistan
2013 Total careImport records
Certification records
State Surveillance Service for
Pharmaceutical Activities
7 987 413a
The Agency for Statistics under the
President of the Republic of Tajikistan
2014 Total careImport records
Certification records
State Surveillance Service for
Pharmaceutical Activities
8 161 000a
The Agency for Statistics under the
President of the Republic of Tajikistan
a Population estimates include the autonomous province of Gorno-Badakhshan: 207,300 (2011, 2012), 211,200 (2013) and 206,000(2014). There are small differences in estimates of DID for 2011 in this report compared to the Lancet 2014 publication as the estimates presented here are based on total population including Gorno-Badakhshan.
12.2 Estimates of volumes of consumption of antibacterials for systemic use (J01)
Total consumption of antibacterials for systemic use (ATC class J01) is examined by route of administration (oral and parenteral formulations) and by pharmacological subgroup.
12.2.1 Total consumption of J01 antibacterials by route of administration
The consumption of oral and parenteral (injectable) formulations of J01 antibacterials is shown in Fig. 12.1 and summarized in Table 12.2 as DDD/1000 inhabitants per day (DID).

93
The data indicate some fluctuations in total consumption of J01 antibacterials over time (36.6 DID in 2011 to 38.7 DID in 2014), with the highest estimate in 2012 (41.6 DID) and lowest in 2013 (28.2 DID); however, this might be explained in part by the import cycles for these medicines. The volumes of consumption of parenteral antibacterials appear to have decreased over time (14 DID in 2011 to 11 DID in 2014). Parenteral formulations constituted 28% of total J01 consumption in 2014 (Table 12.2).
Table 12.2 Total consumption of J01 antibacterials by route of administration
Route of administrationDDD/1000 inhabitants per daya (% of totalb)
2011 2012 2013 2014
Oral J01 22.7 (62) 25.5 (61) 15.9 (56) 27.7 (72)
Parenteral J01 14 (38) 16.1 (39) 12.3 (44) 11 (28)
Total 36.6 41.6 28.2 38.7
a DDD: daily defined dose. b Total amounts and percentages may vary slightly owing to rounding.
12.2.2 Total consumption of J01 antibacterials by pharmacological subgroup
The consumption of J01 antibacterials by pharmacological subgroup is shown in Fig. 12.2 and summarized in Table 12.3.
Given the fluctuations in total consumption estimates it is difficult to identify clear trends in either increases or decreases of consumption of pharmacological subgroups. There appear to be increases in consumption of cephalosporins (J01D), at 5.7 DID in 2011 and 7 DID in 2014, and quinolones (J01M), at 3.5 DID in 2011 and 4 DID in 2014 (Table 12.3). The highest levels of consumption were beta-lactams (J01C), at 20.7 DID in 2014, and cephalosporins (J01D), at 7 DID in 2014.
12. TAJIKISTAN
0
5
10
15
20
25
30
35
40
45
DD
D/1
000
inha
bita
nts
per
day
Parenteral antibacterials
Oral antibacterials
TJK2013
TJK2012
TJK2011
TJK2014
Fig. 12.1 Total consumption of J01 antibacterials by route of administration
DDD: defined daily dose.

94
Table 12.3 Total consumption of J01 antibacterials by pharmacological subgroup
Class of antibacterial agentsDDD/1000 inhabitants per daya
2011 2012 2013 2014
Tetracyclines (J01A) 1.1 1.2 0.9 1.4
Amphenicols (J01B) 0.6 0.6 0.3 0.5
Beta-lactams (J01C) 20.5 23.8 15.3 20.7
Cephalosporins (J01D) 5.7 6.7 6.1 7.0
Sulfonamides and trimethoprim (J01E) 1.9 2.2 1.1 1.7
Macrolides, lincosamides and streptogramins (J01F) 0.7 0.8 0.8 0.9
Quinolone antibacterials (J01M) 3.5 4.0 2.2 4.0
Other J01 antibacterials (J01G, J01R, J01X) 2.7 2.3 1.6 2.6
Totalb 36.6 41.6 28.2 38.7
a DDD: daily defined dose. b Total amounts may vary slightly owing to rounding.
12.3 Relative consumption of J01 antibacterials by subgroup
12.3.1 Relative consumption of J01 antibacterials by pharmacological subgroup
The relative consumption of pharmacological subgroups measured as a proportion of total J01 antibacterials is shown in Fig. 12.3 and summarized in Table 12.4.
The data suggest small increases in relative consumption of tetracyclines (J01A), at 2.9% in 2011 and 3.7% in 2014, cephalosporins (J01D), at 15.7% in 2011 and 18.1% in 2014, and quinolones (J01M), at 9.4% in 2011 and 10.3% in 2014 (Table 12.4). Beta-lactams (J01C) was the most consumed pharmacological subgroup, at 53.5% of total J01 consumption in 2014.
0
5
10
15
20
25
30
35
40
45
DD
D/1
000
inha
bita
nts
per
day
TJK2013
TJK2012
TJK2011
TJK2014
Quinolone antibacterials (J01M)
Macrolides, lincosamides and streptogramins (J01F)
Sulfonamides and trimethoprim (J01E)
Cephalosporins (J01D)
Beta-lactams (J01C)
Amphenicols (J01B)
Other J01 antibacterials
Tetracyclines (J01A)
Fig. 12.2 Total consumption of J01 antibacterials by pharmacological subgroup
DDD: defined daily dose.
12. TAJIKISTAN

95
Table 12.4 Relative consumption of J01 antibacterials by pharmacological subgroup
Class of antibacterial agentsConsumption as proportion of total J01 consumption (%)a
2011 2012 2013 2014
Tetracyclines (J01A) 2.9 2.8 3.2 3.7
Amphenicols (J01B) 1.5 1.5 0.9 1.2
Beta-lactams (J01C) 56.0 57.3 54.3 53.5
Cephalosporins (J01D) 15.7 16.1 21.6 18.1
Sulfonamides and trimethoprim (J01E) 5.2 5.3 3.9 4.3
Macrolides, lincosamides and streptogramins (J01F) 2.0 2.0 2.8 2.3
Quinolone antibacterials (J01M) 9.4 9.6 7.7 10.3
Other J01 antibacterials (J01G, J01R, J01X) 7.3 5.4 5.6 6.6
a Total percentages may vary slightly owing to rounding.
12.3.2 Consumption of cephalosporins and quinolones as a proportion of total consumption of J01 antibacterials
Cephalosporins and quinolones are broad-spectrum antibiotics and are considered second-line antibiotics in most prescribing guidelines. Generally, it is recommended that their use should be restricted to ensure availability as second-line therapy, should first-line antibiotics fail.
The relative consumption of cephalosporins and quinolones measured as a proportion of total J01 antibacterials is shown in Fig. 12.4 and summarized in Table 12.5. Together these two categories constitute 28% of J01 antibacterial consumption in 2014.
0%
20%
40%
60%
80%
100%
Pro
port
ion
of to
tal
J01
anti
bact
eria
l con
sum
ptio
n
TJK2013
TJK2012
TJK2011
TJK2014
Quinolone antibacterials (J01M)
Macrolides, lincosamides and streptogramins (J01F)
Sulfonamides and trimethoprim (J01E)
Cephalosporins (J01D)
Beta-lactams (J01C)
Amphenicols (J01B)
Other J01 antibacterials
Tetracyclines (J01A)
Fig. 12.3 Relative consumption of J01 antibacterials by pharmacological subgroup
12. TAJIKISTAN

96
Table 12.5 Consumption of cephalosporins and quinolones as a proportion of total consumption of J01 antibacterials
Class of antibacterial agentsDDD/1000 inhabitants per daya (% of totalb)
2011 2012 2013 2014
Quinolone antibacterials (J01M) 3.5 (9) 4 (10) 2.2 (8) 4 (10)
Cephalosporins (J01D) 5.7 (16) 6.7 (16) 6.1 (22) 7 (18)
Other J01 antibacterials 27.4 (75) 30.9 (74) 19.9 (71) 27.7 (72)
Total 36.6 41.6 28.2 38.7
a DDD: daily defined dose. b Total amounts and percentages may vary slightly owing to rounding.
12.4 Relative consumption by choice of agent
12.4.1 Relative consumption of cephalosporins by generation
Third- and fourth-generation cephalosporins have a broader spectrum of activity than first- and second-generation agents, with enhanced coverage of both Gram-positive and Gram-negative organisms. WHO (2012) has identified third- and fourth-generation cephalosporins as some of the agents of highest priority for risk management to ensure that critically important antimicrobials are used prudently both in human and veterinary medicine.
The relative consumption of first-, second-, third- and fourth-generation cephalosporins in 2011–2014 is shown in Fig. 12.5 and summarized in Table 12.6.
Limited use of second- and fourth-generation cephalosporins was reported over time. Cephalosporin consumption was dominated by third-generation agents (83% of cephalosporin consumption in 2014; Table 12.6).
0%
20%
40%
60%
80%
100%
Pro
port
ion
of to
tal
J01
anti
bact
eria
l con
sum
ptio
n
TJK2013
TJK2012
TJK2011
TJK2014
Other J01 antibacterials
Cephalosporins (J01D)
Quinolone antibacterials (J01M)
Fig. 12.4 Consumption of cephalosporins and quinolones as a proportion of total consumption of J01 antibacterials
12. TAJIKISTAN

97
Table 12.6 Relative consumption of cephalosporins by generation
GenerationDDD/1000 inhabitants per daya (% of totalb)
2011 2012 2013 2014
First-generation (J01DB) 1 (17) 1.2 (17) 1.7 (27) 1.2 (17)
Second-generation (J01DC) <0.1 <0.1 <0.1 <0.1
Third-generation (J01DD) 4.7 (82) 5.5 (82) 4.4 (72) 5.8 (83)
Fourth-generation (J01DE) <0.1 <0.1 <0.1 <0.1
Total 5.7 6.7 6.1 7.0
a DDD: daily defined dose. b Total amounts and percentages may vary slightly owing to rounding.
12.4.1.1 Choice of first-generation cephalosporins (J01DB)Table 12.7 illustrates the pattern of consumption of first-generation cephalosporins in 2011–2014. Consumption was dominated by cefazolin.
Table 12.7 Relative consumption of agents within first-generation cephalosporins (J01DB)
AgentDDD/1000 inhabitants per daya (% of totalb)
2011 2012 2013 2014
Cefalexin <0.1 <0.1 <0.1 <0.1
Cefazolin 0.9 (95) 1.1 (96) 1.6 (100) 1.1 (94)
Cefadroxil <0.1 <0.1 <0.1 <0.1
Cefradine <0.1 <0.1 <0.1 <0.1
Total 1.0 1.2 1.7 1.2
a DDD: daily defined dose. b Total amounts and percentages may vary slightly owing to rounding.
0%
20%
40%
60%
80%
100%
Pro
port
ion
of t
otal
ce
phal
ospo
rin
cons
umpt
ion
TJK2013
TJK2012
TJK2011
TJK2014
Fourth-generation (J01DE)
Third-generation (J01DD)
Second-generation (J01DC)
First-generation (J01DB)
Fig. 12.5 Relative consumption of cephalosporins by generation
12. TAJIKISTAN

98
12.4.1.2 Choice of second-generation cephalosporins (J01DC)Reported consumption of second-generation cephalosporins was very limited.
12.4.1.3 Choice of third-generation cephalosporins (J01DD)Table 12.8 summarizes the pattern of consumption of third-generation cephalosporins in 2011–2014. Consumption was dominated by ceftriaxone.
Table 12.8 Relative consumption of agents within third-generation cephalosporins (J01DD)
AgentDDD/1000 inhabitants per daya (% of totalb)
2011 2012 2013 2014
Cefotaxime <0.1 <0.1 <0.1 <0.1
Ceftazidime <0.1 <0.1 <0.1 <0.1
Ceftriaxone 4.6 (97) 5.4 (97) 4.1 (95) 5.5 (95)
Cefixime <0.1 <0.1 0.2 (3) 0.2 (3)
Cefoperazone <0.1 <0.1 <0.1 <0.1
Cefpodoxime <0.1 <0.1 <0.1 <0.1
Cefoperazone, combinations – – <0.1 <0.1
Total 4.7 5.5 4.4 5.8
a DDD: daily defined dose. b Total amounts and percentages may vary slightly owing to rounding.
12.4.1.4 Choice of fourth-generation cephalosporins (J01DE)Reported consumption of fourth-generation cephalosporins was very limited.
12.4.2 Relative consumption of agents within fluoroquinolones (J01MA)
Quinolone antibacterials comprised around 7–10% of consumption of J01 antibacterials during 2011–2014 (see Table 12.4). Almost all quinolone consumption was from the fluoroquinolone category (J01MA). The most consumed agents were ciprofloxacin, levofloxacin and ofloxacin (Table 12.9).
Table 12.9 Relative consumption of agents within fluoroquinolones (J01MA)
AgentDDD/1000 inhabitants per daya (% of totalb)
2011 2012 2013 2014
Ofloxacin 0.8 (25) 1 (25) 0.2 (10) 0.1 (4)
Ciprofloxacin 1.9 (57) 2.3 (58) 1.6 (77) 3.1 (81)
Pefloxacin <0.1 <0.1 <0.1 <0.1
Norfloxacin <0.1 <0.1 <0.1 <0.1
Lomefloxacin – – – <0.1
Levofloxacin 0.6 (16) 0.6 (15) 0.2 (12) 0.5 (14)
Moxifloxacin <0.1 <0.1 <0.1 <0.1
Gatifloxacin <0.1 <0.1 <0.1 –
Total 3.4 3.9 2.0 3.9
a DDD: daily defined dose. b Total amounts and percentages may vary slightly owing to rounding.
12. TAJIKISTAN

99
12.4.3 Relative consumption of amoxicillin, amoxicillin and clavulanic acid
The addition of clavulanic acid to amoxicillin extends the spectrum of activity of amoxicillin against beta-lactamase-producing bacteria. Amoxicillin and clavulanic acid is recommended as second-line treatment in many treatment guidelines.
Table 12.10 summarizes the relative consumption of amoxicillin and broader-spectrum amoxicillin and clavulanic acid. Almost all consumption was amoxicillin.
Table 12.10 Relative consumption of amoxicillin, amoxicillin and clavulanic acid
AgentDDD/1000 inhabitants per daya (% of totalb)
2011 2012 2013 2014
Amoxicillin (J01CA04) 10.2 (98) 11.9 (99) 7.9 (97) 14.5 (98)
Amoxicillin and clavulanic Acid (J01CR02) 0.2 (2) 0.2 (1) 0.2 (3) 0.2 (2)
Total 10.3 12.1 8.1 14.7
a DDD: daily defined dose. b Total amounts and percentages may vary slightly owing to rounding.
12.5 The 10 most consumed agents
While the number of J01 antibacterial agents available is large, there is considerable evidence from ESAC-Net and other analyses that consumption tends to be concentrated in a relatively small number.
12.5.1 The 10 most consumed agents – oral formulation
Table 12.11 summarizes consumption of the oral agents that comprise the 10 most consumed in 2014. Four agents (amoxicillin, ciprofloxacin, ampicillin, sulfamethoxazole and trimethoprim) account for almost 75% of consumption.
12.5.2 The 10 most consumed agents – parenteral formulation
Table 12.12 summarizes consumption of the 10 most consumed parenteral agents in 2014. Ceftriaxone alone accounts for almost 50% of consumption.
12. TAJIKISTAN

100
Table 12.11 The 10 most consumed agents – oral formulation (2014)
AgentDDD/1000 inhabitants per daya
Top 10 Top 9 Top 8 Top 7 Top 6 Top 5 Top 4 Top 3 Top 2 Top 1
Amoxicillin 14.48 14.48 14.48 14.48 14.48 14.48 14.48 14.48 14.48 14.48
Ciprofloxacin 3.13 3.13 3.13 3.13 3.13 3.13 3.13 3.13 3.13
Ampicillin 1.68 1.68 1.68 1.68 1.68 1.68 1.68 1.68
Sulfamethoxazole and trimethoprim 1.42 1.42 1.42 1.42 1.42 1.42 1.42
Phenoxymethylpenicillin 1.25 1.25 1.25 1.25 1.25 1.25
Nitrofurantoin 1.09 1.09 1.09 1.09 1.09
Tetracycline 0.79 0.79 0.79 0.79
Doxycycline 0.62 0.62 0.62
Levofloxacin 0.49 0.49
Chloramphenicol 0.46
Total consumption for this group of agents
25.41 24.95 24.46 23.84 23.05 21.96 20.72 19.29 17.61 14.48
Total consumption for all oral J01 antibacterials
27.69 27.69 27.69 27.69 27.69 27.69 27.69 27.69 27.69 27.69
Proportion (%) of total consumption for oral J01 antibacterials
91.8% 90.1% 88.3% 86.1% 83.2% 79.3% 74.8% 69.7% 63.6% 52.3%
a DDD: daily defined dose.
12. TAJIKISTAN
Table 12.12 The 10 most consumed agents – parenteral formulation (2014)
AgentDDD/1000 inhabitants per daya
Top 10 Top 9 Top 8 Top 7 Top 6 Top 5 Top 4 Top 3 Top 2 Top 1
Ceftriaxone 5.48 5.48 5.48 5.48 5.48 5.48 5.48 5.48 5.48 5.48
Ampicillin 1.32 1.32 1.32 1.32 1.32 1.32 1.32 1.32 1.32
Cefazolin 1.11 1.11 1.11 1.11 1.11 1.11 1.11 1.11
Combinations 0.53 0.53 0.53 0.53 0.53 0.53 0.53
Metronidazole 0.49 0.49 0.49 0.49 0.49 0.49
Benzathine benzylpenicillin 0.46 0.46 0.46 0.46 0.46
Combinations of penicillins 0.39 0.39 0.39 0.39
Gentamicin 0.25 0.25 0.25
Benzylpenicillin 0.22 0.22
Amikacin 0.22
Total consumption for this group of agents
10.49 10.26 10.04 9.79 9.40 8.93 8.44 7.91 6.80 5.48
Total consumption for all parental J01 antibacterials
10.97 10.97 10.97 10.97 10.97 10.97 10.97 10.97 10.97 10.97
Proportion (%) of total consumption for parental J01 antibacterials
95.6% 93.6% 91.6% 89.3% 85.7% 81.5% 77.0% 72.1% 62.0% 49.9%
a DDD: daily defined dose.

101
12.6 Comments
Interpretation of the data presented in this chapter relies on an understanding of the national context. The analyses are based on import records, and the results suggest that import cycles may have an impact on the estimates and explain (in part) the fluctuations between years.
Consideration could be given to exploring the use of additional data sources, such as wholesaler data, to create more robust consumption estimates, including disaggregation to community and hospital sectors. A more detailed understanding of the patterns of antimicrobial consumption would identify areas for further investigation and allow development of targeted interventions to address potential problems identified in the consumption of antibacterials.
12. TAJIKISTAN

102
13. TURKEY
13.1 Data sources and years of data collection
Turkey provided data for each of the four years of data collection (2011–2014). The main sources were IMS Health for 2011–2012 and sales records of wholesalers derived from the pharmaceutical track and trace system for 2013–2014. The data cover imported medicines and locally manufactured medicines (Table 13.1).
Wholesaler data are provided as part of the comprehensive pharmaceutical track and trace system and cover all products in the supply and distribution chain. It is therefore expected to be a complete estimate of supplies of J01 antibacterials to pharmacies (community and hospital).
Table 13.1 Sources of data used for consumption estimates (2011–2014)
Year Health care sector coverage Data type Data source
(consumption) Population Data source (population)
2011 Community (outpatient) care NDa IMS Health 74 724 269 Turkish
Statistical Institute
2012 Community (outpatient) care NDa IMS Health 75 627 384 Turkish
Statistical Institute
2013 Total care Sales records of wholesalers
Track and trace system 77 667 864 Turkish
Statistical Institute
2014 Total care Sales records of wholesalers
Track and trace system 79 295 904 Turkish
Statistical Institute
a ND: not determined.
13.2 Estimates of volumes of consumption of antibacterials for systemic use (J01)
Total consumption of antibacterials for systemic use (ATC class J01) is examined by route of administration (oral and parenteral formulations) and by pharmacological subgroup.
13.2.1 Total consumption of J01 antibacterials by route of administration
Consumption of oral and parenteral (injectable) formulations of J01 antibacterials for 2011–2012 (outpatient care) is shown in Fig. 13.1 and for 2013–2014 (total care) in Fig. 13.2; these are summarized in Tables 13.2 and 13.3 as DDD/1000 inhabitants per day (DID).

103
The data on volume of consumption (42.3 DID) and relative consumption of parenteral formulations (2%) for outpatient care was the same for 2011 and 2012. Parenteral antibacterials comprised only 4% of total J01 consumption in 2014.
There is some indication of a reduction in total consumption of J01 antibacterials between 2013 and 2014, falling from 42.4 DID in 2013 to 40.4 in 2014. This is likely to be the result of efforts being undertaken in Turkey to reduce previously documented high levels of consumption of antibacterials.
13. TURKEY
Table 13.2 Outpatient consumption of J01 antibacterials by route of administration (2011–2012)
Route of administration
DDD/1000 inhabitants per daya (% of totalb)
2011 2012
Oral J01 41.4(98) 41.4 (98)
Parenteral J01 0.9 (2) 0.9 (2)
Total 42.3 42.3
a DDD: daily defined dose. b Total amounts and percentages may vary slightly owing to rounding.
Table 13.3 Total consumption of J01 antibacterials by route of administration (2013–2014)
Route of administration
DDD/1000 inhabitants per daya (% of totalb)
2013 2014
Oral J01 40.7(96) 38.7 (96)
Parenteral J01 1.8 (4) 1.7 (4)
Total 42.4 40.4
a DDD: daily defined dose. b Total amounts and percentages may vary slightly owing to rounding.
0
5
10
15
20
25
30
35
40
45
DD
D/1
000
inha
bita
nts
per
day
Parenteral antibacterials
Oral antibacterials
TUR2012
TUR2011
Fig. 13.1 Outpatient consumption of J01 antibacterials by route of administration (2011–2012)
DDD: defined daily dose.
Fig. 13.2 Total consumption of J01 antibacterials by route of administration (2013–2014)
DDD: defined daily dose.
0
5
10
15
20
25
30
35
40
45
DD
D/1
000
inha
bita
nts
per
day
Parenteral antibacterials
Oral antibacterials
TUR2014
TUR2013

104
It should be noted that population estimates of Turkish Statistical Institute are used for the calculations presented here. These estimates take account of the refugee population accommodated in Turkey (estimated at around 1 million displaced people in 2013 and 2 million in 2014). The government provides health services (including pharmaceuticals) for these displaced people.
13.2.2 Total consumption of J01 antibacterials by pharmacological subgroup
The consumption of J01 antibacterials by pharmacological subgroup in the periods 2011–2012 and 2013–2014 is shown in Figs. 13.3 and 13.4 and summarized in Tables 13.4 and 13.5.
While the volume of outpatient J01 antibacterial consumption was the same in 2011 and 2012, there were some differences among the classes of agent, with increased consumption of beta-lactams (J01C) and reduced consumption of cephalosporins (J01D) and quinolones (J01M).
The volumes of beta-lactams and cephalosporins decreased between 2013 and 2014. These form part of an overall reduction in total consumption (42.4 DID in 2013 to 40.4 DID in 2014).
13. TURKEY
0
5
10
15
20
25
30
35
40
45
TUR2012
TUR2011
DD
D/1
000
inha
bita
nts
per
day
Quinolone antibacterials (J01M)
Macrolides, lincosamides and streptogramins (J01F)
Sulfonamides and trimethoprim (J01E)
Cephalosporins (J01D)
Beta-lactams (J01C)
Amphenicols (J01B)
Other J01 antibacterials
Tetracyclines (J01A)
Fig. 13.3 Outpatient consumption of J01 antibacterials by pharmacological subgroup (2011–2012)
DDD: defined daily dose.
Fig. 13.4 Total consumption of J01 antibacterials by pharmacological subgroup (2013–2014)
DDD: defined daily dose.
0
5
10
15
20
25
30
35
40
45
TUR2014
TUR2013
DD
D/1
000
inha
bita
nts
per
day
Quinolone antibacterials (J01M)
Macrolides, lincosamides and streptogramins (J01F)
Sulfonamides and trimethoprim (J01E)
Cephalosporins (J01D)
Beta-lactams (J01C)
Amphenicols (J01B)
Other J01 antibacterials
Tetracyclines (J01A)

105
13.3 Relative consumption of J01 antibacterials by subgroup
13.3.1 Relative consumption of J01 antibacterials by pharmacological subgroup
The relative consumption of pharmacological subgroups measured as a proportion of total J01 antibacterials for outpatients in 2011–2012 and for total care in 2013–2014 are shown in Figs. 13.5 and 13.6 and summarized in Tables 13.6 and 13.7.
The relative consumption of the subgroups in outpatient care mirrors the changes in volumes, with increases in consumption of beta-lactams (J01C) and reductions in consumption of cephalosporins (J01D).
For total care (inpatient and outpatient), the relative consumption of beta-lactams was reasonably stable in 2013 and 2014 (at 44% and 44.5% respectively), with reductions in consumption of cephalosporins (32% and 30.3%) and small increases in consumption of macrolides, lincosamides and streptogramins (9.6% and 10.1%).
13.3.2 Consumption of cephalosporins and quinolones as a proportion of total consumption of J01 antibacterials
Cephalosporins and quinolones are broad-spectrum antibiotics and are considered second-line antibiotics in most prescribing guidelines. Generally, it is recommended that their use should be restricted to ensure availability as second-line therapy, should first-line antibiotics fail.
13. TURKEY
Table 13.4 Outpatient consumption of J01 antibacterials by pharmacological subgroup (2011–2012)
Class of antibacterial agents
DDD/1000 inhabitants per daya
2011 2012
Tetracyclines (J01A) 1.4 1.4
Amphenicols (J01B) <0.1 <0.1
Beta-lactams (J01C) 17.3 18.3
Cephalosporins (J01D) 14.1 13.6
Sulfonamides and trimethoprim (J01E) 0.5 0.4
Macrolides, lincosamides and streptogramins (J01F)
3.9 3.9
Quinolone antibacterials (J01M) 3.6 3.2
Other J01 antibacterials (J01G, J01R, J01X) 1.5 1.5
Totalb 42.3 42.3
a DDD: daily defined dose. b Total amounts may vary slightly owing to rounding.
Table 13.5 Total consumption of J01 antibacterials by pharmacological subgroup (2013–2014)
Class of antibacterial agents
DDD/1000 inhabitants per daya
2013 2014
Tetracyclines (J01A) 1.3 1.3
Amphenicols (J01B) <0.1 <0.1
Beta-lactams (J01C) 18.6 18.0
Cephalosporins (J01D) 13.6 12.2
Sulfonamides and trimethoprim (J01E) 0.4 0.4
Macrolides, lincosamides and streptogramins (J01F)
4.1 4.1
Quinolone antibacterials (J01M) 3.1 3.0
Other J01 antibacterials (J01G, J01R, J01X) 1.4 1.5
Totalb 42.4 40.4
a DDD: daily defined dose. b Total amounts may vary slightly owing to rounding.

106
13. TURKEY
Table 13.6 Relative consumption of J01 antibacterials by pharmacological subgroup (2011–2012) (outpatient care)
Class of antibacterial agents
Consumption as proportion of total
J01 consumption (%)a
2011 2012
Tetracyclines (J01A) 3.2 3.3
Amphenicols (J01B) <0.1 <0.1
Beta-lactams (J01C) 41.0 43.3
Cephalosporins (J01D) 33.4 32.2
Sulfonamides and trimethoprim (J01E) 1.1 0.9
Macrolides, lincosamides and streptogramins (J01F)
9.2 9.2
Quinolone antibacterials (J01M) 8.5 7.6
Other J01 antibacterials (J01G, J01R, J01X) 3.6 3.5
a Total percentages may vary slightly owing to rounding.
Table 13.7 Relative consumption of J01 antibacterials by pharmacological subgroup (2013–2014) (total care)
Class of antibacterial agents
Consumption as proportion of total
J01 consumption (%)a
2013 2014
Tetracyclines (J01A) 3.0 3.1
Amphenicols (J01B) <0.1 <0.1
Beta-lactams (J01C) 43.9 44.5
Cephalosporins (J01D) 32.0 30.3
Sulfonamides and trimethoprim (J01E) 0.9 0.9
Macrolides, lincosamides and streptogramins (J01F)
9.6 10.1
Quinolone antibacterials (J01M) 7.4 7.4
Other J01 antibacterials (J01G, J01R, J01X) 3.3 3.7
a Total percentages may vary slightly owing to rounding.
0%
20%
40%
60%
80%
100%
TUR2012
TUR2011
Quinolone antibacterials (J01M)
Macrolides, lincosamides and streptogramins (J01F)
Sulfonamides and trimethoprim (J01E)
Cephalosporins (J01D)
Beta-lactams (J01C)
Amphenicols (J01B)
Other J01 antibacterials
Tetracyclines (J01A)
Pro
port
ion
of to
tal
J01
anti
bact
eria
l con
sum
ptio
n
Fig. 13.5 Relative consumption of J01 antibacterials by pharmacological subgroup (2011–2012) (outpatient care)
Fig. 13.6 Relative consumption of J01 antibacterials by pharmacological subgroup (2013–2014) (total care)
0%
20%
40%
60%
80%
100%
TUR2012
TUR2011
Quinolone antibacterials (J01M)
Macrolides, lincosamides and streptogramins (J01F)
Sulfonamides and trimethoprim (J01E)
Cephalosporins (J01D)
Beta-lactams (J01C)
Amphenicols (J01B)
Other J01 antibacterials
Tetracyclines (J01A)
Pro
port
ion
of to
tal
J01
anti
bact
eria
l con
sum
ptio
n
The relative consumption of cephalosporins and quinolones measured as a proportion of total J01 antibacterials for outpatients in 2011–2012 and for total care in 2013–2014 are shown in Figs. 13.7 and 13.8 and summarized in Tables 13.8 and 13.9.

107
13.4 Relative consumption by choice of agent
13.4.1 Relative consumption of cephalosporins by generation
Third- and fourth-generation cephalosporins have a broader spectrum of activity than first- and second-generation agents, with enhanced coverage of both Gram-positive and Gram-negative
13. TURKEY
Table 13.8 Outpatient consumption of cephalosporins and quinolones as a proportion of total consumption of J01 antibacterials (2011–2012)
Class of antibacterial agents
DDD/1000 inhabitants per daya (% of totalb)
2011 2012
Quinolone antibacterials (J01M) 3.6 (9) 3.2 (8)
Cephalosporins (J01D) 14.1 (33) 13.6 (32)
Other J01 antibacterials 24.6 (58) 25.5 (60)
Total 42.3 42.3
a DDD: daily defined dose. b Total amounts and percentages may vary slightly owing to rounding.
Table 13.9 Total consumption of cephalosporins and quinolones as a proportion of total consumption of J01 antibacterials (2013–2014)
Class of antibacterial agents
DDD/1000 inhabitants per daya (% of totalb)
2013 2014
Quinolone antibacterials (J01M) 3.1 (7) 3 (7)
Cephalosporins (J01D) 13.6 (32) 12.2 (30)
Other J01 antibacterials 25.7 (61) 25.2 (62)
Total 42.4 40.4
a DDD: daily defined dose. b Total amounts and percentages may vary slightly owing to rounding.
0%
20%
40%
60%
80%
100%
TUR2012
TUR2011
Other J01 antibacterials
Cephalosporins (J01D)
Quinolone antibacterials (J01M)
Pro
port
ion
of to
tal
J01
anti
bact
eria
l con
sum
ptio
n
Fig. 13.7 Outpatient consumption of cephalosporins and quinolones as a proportion of total consumption of J01 antibacterials (2011–2012)
Fig. 13.8 Total consumption of cephalosporins and quinolones as a proportion of total consumption of J01 antibacterials (2013–2014)
0%
20%
40%
60%
80%
100%
TUR2014
TUR2013
Other J01 antibacterials
Cephalosporins (J01D)
Quinolone antibacterials (J01M)
Pro
port
ion
of to
tal
J01
anti
bact
eria
l con
sum
ptio
n
The relative consumption of the cephalosporin and quinolone subgroups in outpatient care was reasonably stable in 2011–2012. For total care, the relative consumption of quinolones was stable in 2013–2014, with some reduction in consumption of cephalosporins (32% to 30%).

108
organisms. WHO (2012) has identified third- and fourth-generation cephalosporins as some of the agents of highest priority for risk management to ensure that critically important antimicrobials are used prudently both in human and veterinary medicine.
The relative consumption of first-, second-, third- and fourth-generation cephalosporins in 2011–2012 and 2013–2014 are summarized in Tables 13.10 and 13.11.
Consumption of fourth-generation cephalosporins was very limited (<0.1 DID) during both periods. Relative consumption patterns of first-, second- and third-generation cephalosporins were generally stable in 2013–2014.
13.4.1.1 Choice of first-generation cephalosporins (J01DB)Tables 13.12 and 13.13 summarize the patterns of consumption of first-generation cephalosporins in 2011–2012 and 2013–2014. Cefalexin and cefazolin were those most consumed.
13. TURKEY
Table 13.10 Relative consumption of cephalosporins by generation (2011–2012) (outpatient care)
GenerationDDD/1000 inhabitants per daya (% of totalb)
2011 2012
First-generation (J01DB) 0.8 (6) 0.9 (7)
Second-generation (J01DC) 9 (64) 7.5 (55)
Third-generation (J01DD) 4.2 (30) 5.2 (38)
Fourth-generation (J01DE) <0.1 <0.1
Total 14.1 13.6
a DDD: daily defined dose. b Total amounts and percentages may vary slightly owing to rounding.
Table 13.11 Relative consumption of cephalosporins by generation (2013–2014) (total care)
GenerationDDD/1000 inhabitants per daya (% of totalb)
2013 2014
First-generation (J01DB) 1.1 (8) 1 (8)
Second-generation (J01DC) 7.3 (54) 6.5 (54)
Third-generation (J01DD) 5.2 (38) 4.6 (38)
Fourth-generation (J01DE) <0.1 <0.1
Total 13.6 12.2
a DDD: daily defined dose. b Total amounts and percentages may vary slightly owing to rounding.
Table 13.12 Relative consumption of agents within first-generation cephalosporins (J01DB) (2011–2012) (outpatient care)
AgentDDD/1000 inhabitants per daya (% of totalb)
2011 2012
Cefalexin 0.6 (73) 0.7 (76)
Cefazolin 0.2 (27) 0.2 (24)
Cefadroxil <0.1 <0.1
Total 0.8 0.9
a DDD: daily defined dose. b Total amounts and percentages may vary slightly owing to rounding.
Table 13.13 Relative consumption of agents within first-generation cephalosporins (J01DB) (2013–2014) (total care)
AgentDDD/1000 inhabitants per daya (% of totalb)
2013 2014
Cefalexin 0.7 (68) 0.7 (69)
Cefazolin 0.3 (32) 0.3 (31)
Cefadroxil <0.1 -
Total 1.1 1.0
a DDD: daily defined dose. b Total amounts and percentages may vary slightly owing to rounding.

109
13.4.1.2 Choice of second-generation cephalosporins (J01DC)Tables 13.14 and 13.15 summarize the patterns of consumption of second-generation cephalosporins in 2011–2012 and 2013–2014. Cefuroxime, cefaclor and cefprozil were those most consumed.
13.4.1.3 Choice of third-generation cephalosporins (J01DD)Tables 13.16 and 13.17 summarize the patterns of consumption of third-generation cephalosporins in 2011–2012 and 2013–2014. Levels of consumption of ceftriaxone were reasonably low across 2011–2014. Cefdinir and cefixime were the most consumed agents.
13. TURKEY
Table 13.16 Relative consumption of agents within third-generation cephalosporins (J01DD) (2011–2012) (outpatient care)
AgentDDD/1000 inhabitants per daya (% of totalb)
2011 2012
Cefotaxime <0.1 <0.1
Ceftazidime <0.1 <0.1
Ceftriaxone 0.2 (5) 0.2 (4)
Ceftizoxime <0.1 <0.1
Cefixime 1.1 (27) 1.1 (21)
Cefoperazone <0.1 <0.1
Cefpodoxime 1.1 (25) 1.2 (22)
Ceftibuten 0.3 (6) 0.2 (3)
Cefdinir 0.9 (21) 2 (39)
Cefditoren 0.7 (16) 0.5 (10)
Total 4.2 5.2
a DDD: daily defined dose. b Total amounts and percentages may vary slightly owing to rounding.
Table 13.17 Relative consumption of agents within third-generation cephalosporins (J01DD) (2013–2014) (total care)
AgentDDD/1000 inhabitants per daya (% of totalb)
2013 2014
Cefotaxime <0.1 <0.1
Ceftazidime <0.1 <0.1
Ceftriaxone 0.4 (8) 0.4 (9)
Ceftizoxime <0.1 <0.1
Cefixime 1.0 (20) 1.1 (24)
Cefoperazone <0.1 <0.1
Cefpodoxime 0.9 (17) 0.5 (11)
Ceftibuten 0.2 (5) 0.2 (5)
Cefdinir 2.2 (42) 2.1 (45)
Cefditoren 0.5 (9) 0.3 (6)
Total 5.2 4.6
a DDD: daily defined dose. b Total amounts and percentages may vary slightly owing to rounding.
Table 13.14 Relative consumption of agents within second-generation cephalosporins (J01DC) (2011–2012) (outpatient care)
AgentDDD/1000 inhabitants per daya (% of totalb)
2011 2012
Cefuroxime 6.5 (72) 5.4 (71)
Cefaclor 1.4 (15) 1 (13)
Loracarbef <0.1 <0.1
Cefprozil 1.1 (12) 1.2 (16)
Total 9.0 7.5
a DDD: daily defined dose. b Total amounts and percentages may vary slightly owing to rounding.
Table 13.15 Relative consumption of agents within second-generation cephalosporins (J01DC) (2013–2014) (total care)
AgentDDD/1000 inhabitants per daya (% of totalb)
2013 2014
Cefuroxime 5.2 (72) 4.6 (71)
Cefaclor 1 (13) 1.2 (18)
Loracarbef <0.1 -
Cefprozil 1.1 (15) 0.7 (10)
Total 7.3 6.5
a DDD: daily defined dose. b Total amounts and percentages may vary slightly owing to rounding.

110
13.4.1.4 Choice of fourth-generation cephalosporins (J01DE)Consumption of fourth-generation cephalosporins was low in 2011–2014, with cefepime and cefpirome the agents consumed in small amounts.
13.4.2 Relative consumption of agents within fluoroquinolones (J01MA)
Quinolone antibacterials comprised around 7% of consumption of J01 antibacterials during 2013–2014 (see Table13.7). Almost all quinolone consumption was from the fluoroquinolone category (J01MA). The most consumed agent was ciprofloxacin, with lower consumption of levofloxacin and moxifloxacin (Tables 13.18 and 13.19).
13.4.3 Relative consumption of amoxicillin, amoxicillin and clavulanic acid
The addition of clavulanic acid to amoxicillin extends the spectrum of activity of amoxicillin against beta-lactamase-producing bacteria. Amoxicillin and clavulanic acid is recommended as second-line treatment in many treatment guidelines.
Tables 13.20 and 13.21 summarize the relative consumption of amoxicillin and broader-spectrum amoxicillin and clavulanic acid in the periods 2011–2012 and 2013–2014. Consumption was dominated by amoxicillin and clavulanic acid (almost 90% of use in 2014).
13. TURKEY
Table 13.18 Relative consumption of agents within fluoroquinolones (J01MA) (2011–2012) (outpatient care)
AgentDDD/1000 inhabitants per daya (% of totalb)
2011 2012
Ofloxacin <0.1 <0.1
Ciprofloxacin 2.4 (66) 2.5 (77)
Pefloxacin <0.1 <0.1
Enoxacin <0.1 <0.1
Norfloxacin <0.1 <0.1
Levofloxacin 0.6 (17) 0.3 (9)
Moxifloxacin 0.4 (12) 0.3 (9)
Gemifloxacin 0.1 (3) <0.1
Total 3.6 3.2
a DDD: daily defined dose. b Total amounts and percentages may vary slightly owing to rounding.
Table 13.19 Relative consumption of agents within fluoroquinolones (J01MA) (2013–2014) (total care)
AgentDDD/1000 inhabitants per daya (% of totalb)
2013 2014
Ofloxacin <0.1 <0.1
Ciprofloxacin 2.3 (73) 2.2 (75)
Pefloxacin <0.1 -
Enoxacin <0.1 -
Norfloxacin <0.1 -
Levofloxacin 0.4(12) 0.3 (11)
Moxifloxacin 0.3 (11) 0.4 (12)
Gemifloxacin <0.1 <0.1
Total 3.1 3.0
a DDD: daily defined dose. b Total amounts and percentages may vary slightly owing to rounding.

111
13.5 The 10 most consumed agents
While the number of J01 antibacterial agents available is large, there is considerable evidence from ESAC-Net and other analyses that consumption tends to be concentrated in a relatively small number.
13.5.1 The 10 most consumed agents – oral formulation
Table 13.22 summarizes consumption of the oral agents that comprise the 10 most consumed in 2014. Six agents (amoxicillin and enzyme inhibitor, cefuroxime, clarithromycin, ciprofloxacin, cefdinir and amoxicillin) account for almost 75% of consumption.
13. TURKEY
Table 13.22 The 10 most consumed agents – oral formulation (2014)
AgentDDD/1000 inhabitants per daya
Top 10 Top 9 Top 8 Top 7 Top 6 Top 5 Top 4 Top 3 Top 2 Top 1
Amoxicillin and enzyme inhibitor 14.96 14.96 14.96 14.96 14.96 14.96 14.96 14.96 14.96 14.96
Cefuroxime 4.53 4.53 4.53 4.53 4.53 4.53 4.53 4.53 4.53
Clarithromycin 3.03 3.03 3.03 3.03 3.03 3.03 3.03 3.03
Ciprofloxacin 2.21 2.21 2.21 2.21 2.21 2.21 2.21
Cefdinir 2.07 2.07 2.07 2.07 2.07 2.07
Amoxicillin 1.85 1.85 1.85 1.85 1.85
Cefaclor 1.19 1.19 1.19 1.19
Doxycycline 1.15 1.15 1.15
Cefixime 1.11 1.11
Cefalexin 0.70
Total consumption for this group of agents 32.82 32.12 31.01 29.85 28.66 26.81 24.73 22.53 19.50 14.96
Total consumption for all oral J01 antibacterials
38.73 38.73 38.73 38.73 38.73 38.73 38.73 38.73 38.73 38.73
Proportion (%) of total consumption for oral J01 antibacterials
84.7% 82.9% 80.1% 77.1% 74.0% 69.2% 63.9% 58.2% 50.3% 38.6%
a DDD: daily defined dose.
Table 13.20 Relative consumption of amoxicillin, amoxicillin and clavulanic acid (2011–2012) (outpatient care)
AgentDDD/1000 inhabitants per daya (% of totalb)
2011 2012
Amoxicillin (J01CA04) 2.6 (17) 2.6 (15)
Amoxicillin and clavulanic acid (J01CR02)
13(83) 14.3 (85)
Total 15.6 16.9
a DDD: daily defined dose. b Total amounts and percentages may vary slightly owing to rounding.
Table 13.21 Relative consumption of amoxicillin, amoxicillin and clavulanic acid (2013–2014) (total care)
AgentDDD/1000 inhabitants per daya (% of totalb)
2013 2014
Amoxicillin (J01CA04) 2.2 (13) 1.9 (11)
Amoxicillin and clavulanic acid (J01CR02)
14.9(87) 15 (89)
Total 17.1 16.8
a DDD: daily defined dose. b Total amounts and percentages may vary slightly owing to rounding.

112
Table 13.23 The 10 most consumed agents – parenteral formulation (2014)
AgentDDD/1000 inhabitants per daya
Top 10 Top 9 Top 8 Top 7 Top 6 Top 5 Top 4 Top 3 Top 2 Top 1
Ceftriaxone 0.42 0.42 0.42 0.42 0.42 0.42 0.42 0.42 0.42 0.42
Cefazolin 0.32 0.32 0.32 0.32 0.32 0.32 0.32 0.32 0.32
Ampicillin and enzyme inhibitor 0.28 0.28 0.28 0.28 0.28 0.28 0.28 0.28
Cefuroxime 0.11 0.11 0.11 0.11 0.11 0.11 0.11
Gentamicin 0.07 0.07 0.07 0.07 0.07 0.07
Meropenem 0.06 0.06 0.06 0.06 0.06
Clindamycin 0.04 0.04 0.04 0.04
Lincomycin 0.04 0.04 0.04
Levofloxacin 0.03 0.03
Teicoplanin 0.03
Total consumption for this group of agents 1.40 1.37 1.34 1.30 1.26 1.20 1.13 1.02 0.74 0.42
Total consumption for all parental J01 antibacterials
1.71 1.71 1.71 1.71 1.71 1.71 1.71 1.71 1.71 1.71
Proportion (%) of total consumption for parental J01 antibacterials
81.9% 80.3% 78.4% 76.4% 73.8% 70.5% 66.2% 59.6% 43.4% 24.5%
a DDD: daily defined dose.
13.5.2 The 10 most consumed agents – parenteral formulation
Table 13.23 summarizes consumption of the 10 most consumed parenteral agents in 2014. Seven of these (ceftriaxone, cefazolin, ampicillin and enzyme inhibitor, cefuroxime, gentamicin, meropenem and clindamycin) account for just over 76% of consumption.
13.6 Comments
After antibiotic consumption data were calculated in 2011 (these were subsequently published in Lancet Infectious Diseases (Versporten et al., 2014)), Turkey undertook a range of interrelated activities to address the high levels of consumption reported. These efforts are reflected in the data for 2013 and 2014, with reductions in total J01 antibacterial consumption.
Further years of data will confirm the apparent trends towards a reduction in overall consumption. Given the large and diverse population in Turkey, examination of regional differences in patterns of consumption would provide additional opportunities for targeted interventions to support more responsible use of antimicrobial agents.
13. TURKEY

113
14.UZBEKISTAN
14.1 Data sources and years of data collection
Uzbekistan provided data for each of the four years of data collection (2011–2014). The main sources were import records provided by the drug agency (Table 14.1).
Table 14.1 Sources of data used for consumption estimates (2011–2014)
Year Health care sector coverage Data type Data source
(consumption) Population Data source (population)
2011 Total care Import records Drug agency 29 339 400 World Bank
2012 Total care Import records Drug agency 29 774 500 World Bank
2013 Total care Import records Drug agency 30 243 200 World Bank
2014 Total care Import records Drug agency 30 757 700 World Bank
14.2 Estimates of volumes of consumption of antibacterials for systemic use (J01)
Total consumption of antibacterials for systemic use (ATC class J01) is examined by route of administration (oral and parenteral formulations) and by pharmacological subgroup.
14.2.1 Total consumption of J01 antibacterials by route of administration
The consumption of oral and parenteral (injectable) formulations of J01 antibacterials is shown in Fig. 14.1 and summarized in Table 14.2 as DDD/1000 inhabitants per day (DID).
Most notable is the substantial increase in consumption of J01 antibacterials over time, albeit from a low baseline of 6.4 DID in 2011. Reported reasons for this increase include an increase in the number of manufacturers producing antimicrobial agents.
The reduction in consumption of parenteral antibacterials in 2014 may relate in part to efforts by the government to promote more rational and appropriate use of medicines, including antimicrobials.

114
Table 14.2 Total consumption of J01 antibacterials by route of administration
Route of administrationDDD/1000 inhabitants per daya (% of totalb)
2011 2012 2013 2014
Oral J01 3.7 (58) 1.8 (23) 2.3 (23) 6 (57)
Parenteral J01 2.7 (42) 6 (77) 8 (77) 4.5 (43)
Total 6.4 7.9 10.3 10.4
a DDD: daily defined dose. b Total amounts and percentages may vary slightly owing to rounding.
14.2.2 Total consumption of J01 antibacterials by pharmacological subgroup
The consumption of J01 antibacterials by pharmacological subgroup is shown in Fig. 14.2 and summarized in Table 14.3.
It is difficult to discern trends in the consumption of the various pharmacological subgroups, given the low overall consumption of J01 antibacterials reported in 2011 and the increases in consumption in 2014. The highest levels of consumption in 2014 were beta-lactams (J01C), at 3.9 DID, and cephalosporins (J01D), at 3.1 DID. The low levels of consumption of quinolones are consistent with the low number of registered products in the J01M subgroup. Likewise, the medicines register does not include medicines in the sulfonamides and trimethoprim (J01E) class.
14. UZBEKISTAN
0
2
4
6
8
10
12
DD
D/1
000
inha
bita
nts
per
day
Parenteral antibacterials
Oral antibacterials
UZB2013
UZB2012
UZB2011
UZB2014
Fig. 14.1 Total consumption of J01 antibacterials by route of administration
DDD: defined daily dose.

115
Table 14.3 Total consumption of J01 antibacterials by pharmacological subgroup
Class of antibacterial agentsDDD/1000 inhabitants per daya
2011 2012 2013 2014
Tetracyclines (J01A) 0.0 0.3 0.2 0.5
Amphenicols (J01B) 0.0 0.2 0.2 0.7
Beta-lactams (J01C) 2.8 4.3 5.6 3.9
Cephalosporins (J01D) 2.1 2.4 3.7 3.1
Sulfonamides and trimethoprim (J01E) – – – –
Macrolides, lincosamides and streptogramins (J01F) 1.2 0.3 0.2 1.6
Quinolone antibacterials (J01M) 0.1 0.1 0.2 <0.1
Other J01 antibacterials (J01G, J01R, J01X) 0.2 0.3 0.3 0.6
Totalb 6.4 7.9 10.3 10.4
a DDD: daily defined dose. b Total amounts may vary slightly owing to rounding.
14.3 Relative consumption of J01 antibacterials by subgroup
14.3.1 Relative consumption of J01 antibacterials by pharmacological subgroup
The relative consumption of pharmacological subgroups measured as a proportion of total J01 antibacterials is shown in Fig. 14.3 and summarized in Table 14.4.
While the highest levels of consumption in 2014 were beta-lactams (J01C) and cephalosporins (J01D), the relative consumption of these two groups of all J01 antibacterials decreased between 2011 and 2014. The data suggest some increases in relative consumption of tetracyclines (J01A),
0
2
4
6
8
10
12
DD
D/1
000
inha
bita
nts
per
day
UZB2013
UZB2012
UZB2011
UZB2014
Quinolone antibacterials (J01M)
Macrolides, lincosamides and streptogramins (J01F)
Sulfonamides and trimethoprim (J01E)
Cephalosporins (J01D)
Beta-lactams (J01C)
Amphenicols (J01B)
Other J01 antibacterials
Tetracyclines (J01A)
Fig. 14.2 Total consumption of J01 antibacterials by pharmacological subgroup
DDD: defined daily dose.
14. UZBEKISTAN

116
from 0.3% in 2011 to 5% in 2014, and amphenicols (J01B), from 0.1% in 2011 to 6.6% in 2014, with very low levels of consumption of quinolones in 2014 (J01M), at <0.1% (Table 14.4).
Table 14.4 Relative consumption of J01 antibacterials by pharmacological subgroup
Class of antibacterial agentsConsumption as proportion of total J01 consumption (%)a
2011 2012 2013 2014
Tetracyclines (J01A) 0.3 3.5 2.2 5.0
Amphenicols (J01B) 0.1 2.5 1.9 6.6
Beta-lactams (J01C) 43.9 54.3 54.0 37.5
Cephalosporins (J01D) 32.7 30.1 35.5 29.8
Sulfonamides and trimethoprim (J01E) – – – –
Macrolides, lincosamides and streptogramins (J01F) 18.3 3.9 2.3 15.3
Quinolone antibacterials (J01M) 1.3 1.8 1.6 <0.1
Other J01 antibacterials (J01G, J01R, J01X) 3.4 3.9 2.5 5.8
a Total percentages may vary slightly owing to rounding.
14.3.2 Consumption of cephalosporins and quinolones as a proportion of total consumption of J01 antibacterials
Cephalosporins and quinolones are broad-spectrum antibiotics and are considered second-line antibiotics in most prescribing guidelines. Generally, it is recommended that their use should be restricted to ensure availability as second-line therapy, should first-line antibiotics fail.
14. UZBEKISTAN
0%
20%
40%
60%
80%
100%
Pro
port
ion
of to
tal
J01
anti
bact
eria
l con
sum
ptio
n
UZB2013
UZB2012
UZB2011
UZB2014
Quinolone antibacterials (J01M)
Macrolides, lincosamides and streptogramins (J01F)
Sulfonamides and trimethoprim (J01E)
Cephalosporins (J01D)
Beta-lactams (J01C)
Amphenicols (J01B)
Other J01 antibacterials
Tetracyclines (J01A)
Fig. 14.3 Relative consumption of J01 antibacterials by pharmacological subgroup

117
The relative consumption of cephalosporins and quinolones measured as a proportion of total J01 antibacterials is shown in Fig. 14.4 and summarized in Table 14.5.
Relative consumption of cephalosporins was reasonably high, at 30% of total J01 consumption in 2014 (Table 14.5). By contrast, quinolone consumption was very low and was mainly consumption of ciprofloxacin and levofloxacin.
Table 14.5 Consumption of cephalosporins and quinolones as a proportion of total consumption of J01 antibacterials
Class of antibacterial agentsDDD/1000 inhabitants per daya (% of totalb)
2011 2012 2013 2014
Quinolone antibacterials (J01M) <0.1 0.1 (2) 0.2 (2) <0.1
Cephalosporins (J01D) 2.1 (33) 2.4 (30) 3.7 (35) 3.1 (30)
Other J01 antibacterials 4.3 (66) 5.4 (68) 6.5 (63) 7.3 (70)
Total 6.4 7.9 10.3 10.4
a DDD: daily defined dose. b Total amounts and percentages may vary slightly owing to rounding.
14.4 Relative consumption by choice of agent
14.4.1 Relative consumption of cephalosporins by generation
Third- and fourth-generation cephalosporins have a broader spectrum of activity than first- and second-generation agents, with enhanced coverage of both Gram-positive and Gram-negative organisms. WHO (2012) has identified third- and fourth-generation cephalosporins as some of the
0%
20%
40%
60%
80%
100%
Pro
port
ion
of to
tal
J01
anti
bact
eria
l con
sum
ptio
n
UZB2013
UZB2012
UZB2011
UZB2014
Other J01 antibacterials
Cephalosporins (J01D)
Quinolone antibacterials (J01M)
Fig. 14.4 Consumption of cephalosporins and quinolones as a proportion of total consumption of J01 antibacterials
14. UZBEKISTAN

118
agents of highest priority for risk management to ensure that critically important antimicrobials are used prudently both in human and veterinary medicine.
The relative consumption of first-, second-, third- and fourth-generation cephalosporins in 2011–2014 is shown in Fig. 14.5 and summarized in Table 14.6.
Use of second and fourth-generation cephalosporins over time was limited. Much cephalosporin consumption was of third-generation agents (63% of cephalosporin consumption in 2014; Table 14.6).
Table 14.6 Relative consumption of cephalosporins by generation
GenerationDDD/1000 inhabitants per daya (% of totalb)
2011 2012 2013 2014
First-generation (J01DB) 0.3 (15) 1.4 (61) 1.9 (52) 1 (33)
Second-generation (J01DC) 0.2 (11) <0.1 <0.1 0.1 (4)
Third-generation (J01DD) 1.5 (72) 0.9 (36) 1.7 (45) 1.9 (63)
Fourth-generation (J01DE) <0.1 <0.1 <0.1 <0.1
Total 2.1 2.4 3.7 3.1
a DDD: daily defined dose. b Total amounts and percentages may vary slightly owing to rounding.
14.4.1.1 Choice of first-generation cephalosporins (J01DB)Table 14.7 summarizes the pattern of consumption of first-generation cephalosporins in 2011–2014. Cefazolin was the agent consumed in almost all cases.
0%
20%
40%
60%
80%
100%
Pro
port
ion
of t
otal
ce
phal
ospo
rin
cons
umpt
ion
UZB2013
UZB2012
UZB2011
UZB2014
Fourth-generation (J01DE)
Third-generation (J01DD)
Second-generation (J01DC)
First-generation (J01DB)
Fig. 14.5 Relative consumption of cephalosporins by generation
14. UZBEKISTAN

119
Table 14.7 Relative consumption of agents within first-generation cephalosporins (J01DB)
AgentDDD/1000 inhabitants per daya (% of totalb)
2011 2012 2013 2014
Cefalexin 0.2 (58) <0.1 <0.1 <0.1
Cefazolin <0.1 1.4 (100) 1.9 (100) 1 (99)
Cefradine <0.1 - - <0.1
Total 0.3 1.4 1.9 1.0
a DDD: daily defined dose. b Total amounts and percentages may vary slightly owing to rounding.
14.4.1.2 Choice of second-generation cephalosporins (J01DC)Consumption of second-generation cephalosporins was low; cefuroxime was the most consumed agent.
14.4.1.3 Choice of third-generation cephalosporins (J01DD)Table 14.8 summarizes the pattern of consumption of third-generation cephalosporins in 2011–2014. Ceftriaxone was the most consumed agent.
Table 14.8 Relative consumption of agents within third-generation cephalosporins (J01DD)
AgentDDD/1000 inhabitants per daya (% of totalb)
2011 2012 2013 2014
Cefotaxime 0.5 (34) <0.1 0.2 (15) 0.1 (6)
Ceftazidime <0.1 <0.1 <0.1 <0.1
Ceftriaxone 0.5 (35) 0.7 (85) 1.3 (82) 1.6 (83)
Cefixime <0.1 <0.1 <0.1 <0.1
Cefoperazone <0.1 <0.1 <0.1 <0.1
Cefpodoxime 0.3 (24) <0.1 <0.1 0.1 (7)
Ceftibuten <0.1 <0.1 <0.1 <0.1
Cefoperazone, combinations <0.1 – – –
Total 1.4 0.8 1.6 1.9
a DDD: daily defined dose. b Total amounts and percentages may vary slightly owing to rounding.
14.4.1.4 Choice of fourth-generation cephalosporins (J01DE)Levels of consumption of fourth-generation cephalosporins (cefepime and cefpirome) were low in 2011–2014.
14.4.2 Relative consumption of amoxicillin, amoxicillin and clavulanic acid
The addition of clavulanic acid to amoxicillin extends the spectrum of activity of amoxicillin against beta-lactamase-producing bacteria. Amoxicillin and clavulanic acid is recommended as second-line treatment in many treatment guidelines.
Table 14.9 summarizes the relative consumption of amoxicillin and broader-spectrum amoxicillin and clavulanic acid. The switch in patterns of use is notable – amoxicillin and clavulanic acid dominates in 2011 (86% of consumption), but the reverse is true in 2014, with 88% of consumption
14. UZBEKISTAN

120
amoxicillin. The reasons for the apparent switch are not clear and require further investigation and confirmation at the country level.
Table 14.9 Relative consumption of amoxicillin, amoxicillin and clavulanic acid
AgentDDD/1000 inhabitants per daya (% of totalb)
2011 2012 2013 2014
Amoxicillin (J01CA04) 0.2 (14) 0.5 (92) 0.8 (94) 1.9 (88)
Amoxicillin and clavulanic acid (J01CR02) 1.2 (86) <0.1 <0.1 0.3 (12)
Total 1.4 0.5 0.9 2.2
a DDD: daily defined dose. b Total amounts and percentages may vary slightly owing to rounding.
14.5 The 10 most consumed agents
While the number of J01 antibacterial agents available is large, there is considerable evidence from ESAC-Net and other analyses that consumption tends to be concentrated in a relatively small number.
14.5.1 The 10 most consumed agents – oral formulation
Table 14.10 summarizes consumption of the oral agents that comprise the 10 most consumed in 2014. Five agents (amoxicillin, azithromycin, ampicillin, chloramphenicol and erythromycin) account for just over 76% of consumption.
14. UZBEKISTAN
Table 14.10 The 10 most consumed agents – oral formulation (2014)
AgentDDD/1000 inhabitants per daya
Top 10 Top 9 Top 8 Top 7 Top 6 Top 5 Top 4 Top 3 Top 2 Top 1
Amoxicillin 1.92 1.92 1.92 1.92 1.92 1.92 1.92 1.92 1.92 1.92
Azithromycin 0.86 0.86 0.86 0.86 0.86 0.86 0.86 0.86 0.86
Ampicillin 0.71 0.71 0.71 0.71 0.71 0.71 0.71 0.71
Chloramphenicol 0.68 0.68 0.68 0.68 0.68 0.68 0.68
Erythromycin 0.40 0.40 0.40 0.40 0.40 0.40
Doxycycline 0.31 0.31 0.31 0.31 0.31
Amoxicillin and enzyme inhibitor 0.26 0.26 0.26 0.26
Tetracycline 0.21 0.21 0.21
Clarithromycin 0.19 0.19
Cefpodoxime 0.14
Total consumption for this group of agents
5.67 5.53 5.34 5.13 4.86 4.56 4.16 3.48 2.78 1.92
Total consumption for all oral J01 antibacterials
5.96 5.96 5.96 5.96 5.96 5.96 5.96 5.96 5.96 5.96
Proportion (%) of total consumption for oral J01 antibacterials
95.1% 92.7% 89.5% 86.0% 81.6% 76.4% 69.8% 58.4% 46.6% 32.2%
a DDD: daily defined dose.

121
Table 14.11 The 10 most consumed agents – parenteral formulation (2014)
AgentDDD/1000 inhabitants per daya
Top 10 Top 9 Top 8 Top 7 Top 6 Top 5 Top 4 Top 3 Top 2 Top 1
Ceftriaxone 1.61 1.61 1.61 1.61 1.61 1.61 1.61 1.61 1.61 1.61
Cefazolin 1.01 1.01 1.01 1.01 1.01 1.01 1.01 1.01 1.01
Ampicillin 0.47 0.47 0.47 0.47 0.47 0.47 0.47 0.47
Benzylpenicillin 0.22 0.22 0.22 0.22 0.22 0.22 0.22
Combinations of penicillins 0.21 0.21 0.21 0.21 0.21 0.21
Streptomycin 0.21 0.21 0.21 0.21 0.21
Gentamicin 0.16 0.16 0.16 0.16
Kanamycin 0.13 0.13 0.13
Cefotaxime 0.12 0.12
Amikacin 0.10
Total consumption for this group of agents
4.24 4.13 4.01 3.88 3.72 3.52 3.30 3.09 2.62 1.61
Total consumption for all parental J01 antibacterials
4.45 4.45 4.45 4.45 4.45 4.45 4.45 4.45 4.45 4.45
Proportion (%) of total consumption for parental J01 antibacterials
95.1% 92.7% 90.1% 87.1% 83.6% 78.9% 74.1% 69.3% 58.8% 36.2%
a DDD: daily defined dose.
14.5.2 The 10 most consumed agents – parenteral formulation
Table 14.11 summarizes consumption of the 10 most consumed parenteral agents in 2014. Four of these (ceftriaxone, cefazolin, ampicillin and benzylpenicillin) account for just almost 75% of consumption.
14.6 Comments
The analyses presented in this chapter provide annual consumption estimates. The data indicate some considerable fluctuations in total consumption of J01 antibacterials over time, and further investigation of the sources used and completeness of data collection are needed to better understand the results.
Use of complementary data sources and additional focused studies would allow more detailed understanding of the patterns of antimicrobial consumption. This would also facilitate the development of targeted interventions to address potential problems identified.
14. UZBEKISTAN

122
15. KOSOVO (in accordance with Security Council resolution 1244 (1999))
15.1 Data sources and years of data collection
Kosovo (in accordance with Security Council resolution 1244 (1999)) provided data for each of the four years of data collection (2011–2014). The main sources were import records provided by the drug agency (Table 15.1).
Table 15.1 Sources of data used for consumption estimates (2011–2014)
Year Health care sector coverage Data type Data source
(consumption) Population Data source (population)
2011 Total care Import records Drug agency 1 790 957 World Bank
2012 Total care Import records Drug agency 1 805 200 World Bank
2013 Total care Import records Drug agency 1 818 117 World Bank
2014 Total care Import records Drug agency 1 812 771 World Bank
15.2 Estimates of volumes of consumption of antibacterials for systemic use (J01)
Total consumption of antibacterials for systemic use (ATC class J01) is examined by route of administration (oral and parenteral formulations) and by pharmacological subgroup.
15.2.1 Total consumption of J01 antibacterials by route of administration
The consumption of oral and parenteral (injectable) formulations of J01 antibacterials is shown in Fig. 15.1 and summarized in Table 15.2 as DDD/1000 inhabitants per day (DID).
The data suggest a trend towards decreasing consumption of J01 antibacterials over time, although consumption estimates were higher in 2014 than in 2013. The apparent increase of consumption might be due to changes in legislation, which simplified medicines registration and import procedures, as well also allowing emergency imports, leading to more reliable data. Estimates for 2011 and 2012 may be affected by less accurate estimates of imports. Further datasets are needed to confirm trends observed in 2013–2014.

123
Parenteral agents constituted 9% of total consumption of J01 antibacterials in 2013 and 2014 (Table 15.2).
Table 15.2 Total consumption of J01 antibacterials by route of administration
Route of administrationDDD/1000 inhabitants per daya (% of totalb)
2011 2012 2013 2014
Oral J01 25.1 (95) 21.7 (84) 17.3 (91) 18.8 (91)
Parenteral J01 1.3 (5) 4.2 (16) 1.7 (9) 2 (9)
Total 26.4 26.0 19.0 20.8
a DDD: daily defined dose. b Total amounts and percentages may vary slightly owing to rounding.
15.2.2 Total consumption of J01 antibacterials by pharmacological subgroup
The consumption of J01 antibacterials by pharmacological subgroup is shown in Fig. 15.2 and summarized in Table 15.3.
Given the fluctuations in data, it is difficult to comment on the absolute consumption of the various pharmacological subgroups. The changes in antibacterial consumption in 2013 and 2014 may relate to the data issues noted earlier, as well as national efforts to address antimicrobial resistance, through which an intersectoral working group was created, a national strategy on antimicrobial resistance developed and an action plan adopted. Awareness campaigns were conducted for consumers and focus increased on antimicrobial resistance issues in meetings of health care professionals. These activities are likely to have contributed to the overall reductions in antibacterial consumption seen in 2013.
15. KOSOVO
0
5
10
15
20
25
30
DD
D/1
000
inha
bita
nts
per
day
Parenteral antibacterials
Oral antibacterials
KOS2013
KOS2012
KOS2011
KOS2014
Fig. 15.1 Total consumption of J01 antibacterials by route of administration
DDD: defined daily dose.

124
Table 15.3 Total consumption of J01 antibacterials by pharmacological subgroup
Class of antibacterial agentsDDD/1000 inhabitants per daya
2011 2012 2013 2014
Tetracyclines (J01A) 0.7 0.1 0.5 0.9
Amphenicols (J01B) – – – <0.1
Beta-lactams (J01C) 12.8 13.1 10.1 10.6
Cephalosporins (J01D) 4.9 6.9 4.3 3.9
Sulfonamides and trimethoprim (J01E) 1.8 0.8 0.7 0.8
Macrolides, lincosamides and streptogramins (J01F) 2.6 1.7 1.3 1.9
Quinolone antibacterials (J01M) 3.0 2.5 1.9 1.9
Other J01 antibacterials (J01G, J01R, J01X) 0.5 0.9 0.3 0.7
Totalb 26.4 26.0 19.0 20.8
a DDD: daily defined dose. b Total amounts may vary slightly owing to rounding.
15.3 Relative consumption of J01 antibacterials by subgroup
15.3.1 Relative consumption of J01 antibacterials by pharmacological subgroup
The relative consumption of pharmacological subgroups measured as a proportion of total J01 antibacterials is shown in Fig. 15.3 and summarized in Table 15.4.
0
5
10
15
20
25
30
DD
D/1
000
inha
bita
nts
per
day
KOS2013
KOS2012
KOS2011
KOS2014
Quinolone antibacterials (J01M)
Macrolides, lincosamides and streptogramins (J01F)
Sulfonamides and trimethoprim (J01E)
Cephalosporins (J01D)
Beta-lactams (J01C)
Amphenicols (J01B)
Other J01 antibacterials
Tetracyclines (J01A)
Fig. 15.2 Total consumption of J01 antibacterials by pharmacological subgroup
DDD: defined daily dose.
15. KOSOVO

125
The relative estimates of consumption suggest reasonably stable consumption of beta-lactams (51.2% in 2014), cephalosporins (19%) and quinolone antimicrobials (9.2%)(Table 15.4).
Table 15.4 Relative consumption of J01 antibacterials by pharmacological subgroup
Class of antibacterial agentsConsumption as proportion of total J01 consumption (%)a
2011 2012 2013 2014
Tetracyclines (J01A) 2.6 0.6 2.4 4.1
Amphenicols (J01B) – – – <0.1
Beta-lactams (J01C) 48.7 50.5 53.2 51.2
Cephalosporins (J01D) 18.7 26.6 22.5 19.0
Sulfonamides and trimethoprim (J01E) 6.7 3.0 3.5 3.9
Macrolides, lincosamides and streptogramins (J01F) 10.0 6.5 7.0 9.2
Quinolone antibacterials (J01M) 11.3 9.5 10.1 9.2
Other J01 antibacterials (J01G, J01R, J01X) 2.0 3.4 1.3 3.4
a Total percentages may vary slightly owing to rounding.
15.3.2 Consumption of cephalosporins and quinolones as a proportion of total consumption of J01 antibacterials
Cephalosporins and quinolones are broad-spectrum antibiotics and are considered second-line antibiotics in most prescribing guidelines. Generally, it is recommended that their use should be restricted to ensure availability as second-line therapy, should first-line antibiotics fail.
0%
20%
40%
60%
80%
100%
Pro
port
ion
of to
tal
J01
anti
bact
eria
l con
sum
ptio
n
KOS2013
KOS2012
KOS2011
KOS2014
Quinolone antibacterials (J01M)
Macrolides, lincosamides and streptogramins (J01F)
Sulfonamides and trimethoprim (J01E)
Cephalosporins (J01D)
Beta-lactams (J01C)
Amphenicols (J01B)
Other J01 antibacterials
Tetracyclines (J01A)
Fig. 15.3 Relative consumption of J01 antibacterials by pharmacological subgroup
15. KOSOVO

126
The relative consumption of cephalosporins and quinolones measured as a proportion of total J01 antibacterials is shown in Fig. 15.4 and summarized in Table 15.5.
Relative consumption of quinolones and cephalosporins was reasonably stable over time, with the two groups combined representing around 30% of total consumption of J01 antibacterials in 2011–2014 (Table 15.5).
Table 15.5 Consumption of cephalosporins and quinolones as a proportion of total consumption of J01 antibacterials
Class of antibacterial agentsDDD/1000 inhabitants per daya (% of totalb)
2011 2012 2013 2014
Quinolone antibacterials (J01M) 3 (11) 2.5 (9) 1.9 (10) 1.9 (9)
Cephalosporins (J01D) 4.9 (19) 6.9 (27) 4.3 (23) 3.9 (19)
Other J01 antibacterials 18.5 (70) 16.6 (64) 12.8 (67) 14.9 (72)
Total 26.4 26.0 19.0 20.8
a DDD: daily defined dose. b Total amounts and percentages may vary slightly owing to rounding.
15.4 Relative consumption by choice of agent
15.4.1 Relative consumption of cephalosporins by generation
Third- and fourth-generation cephalosporins have a broader spectrum of activity than first- and second-generation agents, with enhanced coverage of both Gram-positive and Gram-negative
0%
20%
40%
60%
80%
100%
Pro
port
ion
of to
tal
J01
anti
bact
eria
l con
sum
ptio
n
KOS2013
KOS2012
KOS2011
KOS2014
Other J01 antibacterials
Cephalosporins (J01D)
Quinolone antibacterials (J01M)
Fig. 15.4 Consumption of cephalosporins and quinolones as a proportion of total consumption of J01 antibacterials
15. KOSOVO

127
organisms. WHO (2012) has identified third- and fourth-generation cephalosporins as some of the agents of highest priority for risk management to ensure that critically important antimicrobials are used prudently both in human and veterinary medicine.
The relative consumption of first-, second-, third- and fourth-generation cephalosporins in 2011–2014 is shown in Fig. 15.5 and summarized in Table 15.6.
Very little consumption of fourth-generation agents was reported in 2011–2014. Consumption of second-generation agents fluctuated across the period and there was a trend towards increased consumption of third-generation cephalosporins (27% in 2011 and 41% in 2014; Table 15.6). Most consumption remained of first- and second-generation agents (59% in 2014).
Table 15.6 Relative consumption of cephalosporins by generation
GenerationDDD/1000 inhabitants per daya (% of totalb)
2011 2012 2013 2014
First-generation (J01DB) 2.1 (42) 3.2 (46) 1 (24) 1 (25)
Second-generation (J01DC) 1.5 (31) 1.6 (24) 1.9 (45) 1.3 (34)
Third-generation (J01DD) 1.3 (27) 2.1 (30) 1.3 (31) 1.6 (41)
Fourth-generation (J01DE) <0.1 <0.1 <0.1 -
Total 4.9 6.9 4.3 3.9
a DDD: daily defined dose. b Total amounts and percentages may vary slightly owing to rounding.
0%
20%
40%
60%
80%
100%
Pro
port
ion
of t
otal
ce
phal
ospo
rin
cons
umpt
ion
KOS2013
KOS2012
KOS2011
KOS2014
Fourth-generation (J01DE)
Third-generation (J01DD)
Second-generation (J01DC)
First-generation (J01DB)
Fig. 15.5 Relative consumption of cephalosporins by generation
15. KOSOVO

128
15.4.1.1 Choice of first-generation cephalosporins (J01DB)Table 15.7 summarizes the pattern of consumption of first-generation cephalosporins in 2011–2014. Cefalexin and cefazolin were those most consumed.
Table 15.7 Relative consumption of agents within first-generation cephalosporins (J01DB)
AgentDDD/1000 inhabitants per daya (% of totalb)
2011 2012 2013 2014
Cefalexin 2 (94) 1.3 (41) 1 (96) 0.8 (84)
Cefazolin <0.1 1.9 (59) <0.1 0.1 (13)
Cefadroxil <0.1 – – –
Cefatrizine – – <0.1 <0.1
Total 2.1 3.2 1.0 1.0
a DDD: daily defined dose. b Total amounts and percentages may vary slightly owing to rounding.
15.4.1.2 Choice of second-generation cephalosporins (J01DC)Table 15.8 summarizes the pattern of consumption of third-generation cephalosporins in 2011–2014. Cefuroxime and cefaclor were those most consumed.
Table 15.8 Relative consumption of agents within second-generation cephalosporins (J01DC)
AgentDDD/1000 inhabitants per daya (% of totalb)
2011 2012 2013 2014
Cefuroxime 0.1 (9) 0.6 (34) 0.6 (33) 0.5 (34)
Cefaclor 1.4 (91) 1.1 (66) 1.3 (67) 0.9 (66)
Cefprozil – – – <0.1
Total 1.5 1.6 1.9 1.3
a DDD: daily defined dose. b Total amounts and percentages may vary slightly owing to rounding.
15.4.1.3 Choice of third-generation cephalosporins (J01DD)Table 15.8 summarizes the pattern of consumption of third-generation cephalosporins in 2011–2014. Ceftriaxone and cefixime were the most consumed agents.
Table 15.9 Relative consumption of agents within third-generation cephalosporins (J01DD)
AgentDDD/1000 inhabitants per daya (% of totalb)
2011 2012 2013 2014
Cefotaxime <0.1 <0.1 0 <0.1
Ceftazidime <0.1 <0.1 <0.1 <0.1
Ceftriaxone 0.7 (51) 1.5 (72) 1.1 (81) 1.2 (73)
Cefixime 0.6 (49) 0.6 (28) 0.3 (19) 0.4 (25)
Cefpodoxime - - <0.1 <0.1
Total 1.3 2.1 1.3 1.6
a DDD: daily defined dose. b Total amounts and percentages may vary slightly owing to rounding.
15. KOSOVO

129
15.4.1.4 Choice of fourth-generation cephalosporins (J01DE)Consumption of fourth-generation cephalosporins was low during 2011–2014, with cefpirome the only agent consumed in small amounts.
15.4.2 Relative consumption of agents within fluoroquinolones (J01MA)
Quinolone antibacterials comprised around 10% of consumption of J01 antibacterials during 2011–2014 (see Table 15.4). Almost all quinolone consumption was from the fluoroquinolone category (J01MA). The most consumed agents were ciprofloxacin and levofloxacin (Table 15.10).
Table 15.10 Relative consumption of agents within fluoroquinolones (J01MA)
AgentDDD/1000 inhabitants per daya (% of totalb)
2011 2012 2013 2014
Ofloxacin <0.1 <0.1 <0.1 <0.1
Ciprofloxacin 2.6 (97) 2.1 (91) 1.3 (77) 1.3 (74)
Norfloxacin <0.1 <0.1 <0.1 <0.1
Levofloxacin <0.1 0.1 (6) 0.4 (22) 0.4 (23)
Moxifloxacin <0.1 <0.1 - <0.1
Total 2.6 2.3 1.7 1.7
a DDD: daily defined dose. b Total amounts and percentages may vary slightly owing to rounding.
15.4.3 Relative consumption of amoxicillin, amoxicillin and clavulanic acid
The addition of clavulanic acid to amoxicillin extends the spectrum of activity of amoxicillin against beta-lactamase-producing bacteria. Amoxicillin and clavulanic acid is recommended as second-line treatment in many treatment guidelines.
Table 15.11 summarizes the relative consumption of amoxicillin and broader-spectrum amoxicillin and clavulanic acid. The increasing consumption of amoxicillin and clavulanic acid is notable (30% relative use in 2011 increasing to 53% in 2014).
Table 15.11 Relative consumption of amoxicillin, amoxicillin and clavulanic acid
AgentDDD/1000 inhabitants per daya (% of totalb)
2011 2012 2013 2014
Amoxicillin (J01CA04) 6.7 (70) 7.5 (70) 5.2 (60) 4.5 (47)
Amoxicillin and clavulanic acid (J01CR02) 2.8 (30) 3.2 (30) 3.4 (40) 5 (53)
Total 9.5 10.7 8.6 9.5
a DDD: daily defined dose. b Total amounts and percentages may vary slightly owing to rounding.
15. KOSOVO

130
15.5 The 10 most consumed agents
While the number of J01 antibacterial agents available is large, there is considerable evidence from ESAC-Net and other analyses that consumption tends to be concentrated in a relatively small number.
15.5.1 The 10 most consumed agents – oral formulation
Table 15.12 summarizes consumption of the oral agents that comprise the 10 most consumed in 2014. Seven agents (amoxicillin and enzyme inhibitor, amoxicillin, ciprofloxacin, clarithromycin, cefaclor, sulfamethoxazole and trimethoprim and cefalexin) account for just over 76% of consumption, of which two agents (amoxicillin, amoxicillin and enzyme inhibitor) account for 50% of consumption.
15.5.2 The 10 most consumed agents – parenteral formulation
Table 15.13 summarizes consumption of the 10 most consumed parenteral agents in 2014. Just two of these (ceftriaxone and gentamicin) account for just over 81% of consumption.
Table 15.12 The 10 most consumed agents – oral formulation (2014)
AgentDDD/1000 inhabitants per daya
Top 10 Top 9 Top 8 Top 7 Top 6 Top 5 Top 4 Top 3 Top 2 Top 1
Amoxicillin and enzyme inhibitor 5.00 5.00 5.00 5.00 5.00 5.00 5.00 5.00 5.00 5.00
Amoxicillin 4.48 4.48 4.48 4.48 4.48 4.48 4.48 4.48 4.48
Ciprofloxacin 1.27 1.27 1.27 1.27 1.27 1.27 1.27 1.27
Clarithromycin 1.15 1.15 1.15 1.15 1.15 1.15 1.15
Cefaclor 0.89 0.89 0.89 0.89 0.89 0.89
Sulfamethoxazole and trimethoprim 0.81 0.81 0.81 0.81 0.81
Cefalexin 0.81 0.81 0.81 0.81
Doxycycline 0.79 0.79 0.79
Phenoxymethylpenicillin 0.65 0.65
Azithromycin 0.64
Total consumption for this group of agents
16.48 15.84 15.19 14.40 13.60 12.79 11.90 10.75 9.48 5.00
Total consumption for all oral J01 antibacterials
18.81 18.81 18.81 18.81 18.81 18.81 18.81 18.81 18.81 18.81
Proportion (%) of total consumption for oral J01 antibacterials
87.6% 84.2% 80.8% 76.6% 72.3% 68.0% 63.3% 57.2% 50.4% 26.6%
a DDD: daily defined dose.
15. KOSOVO
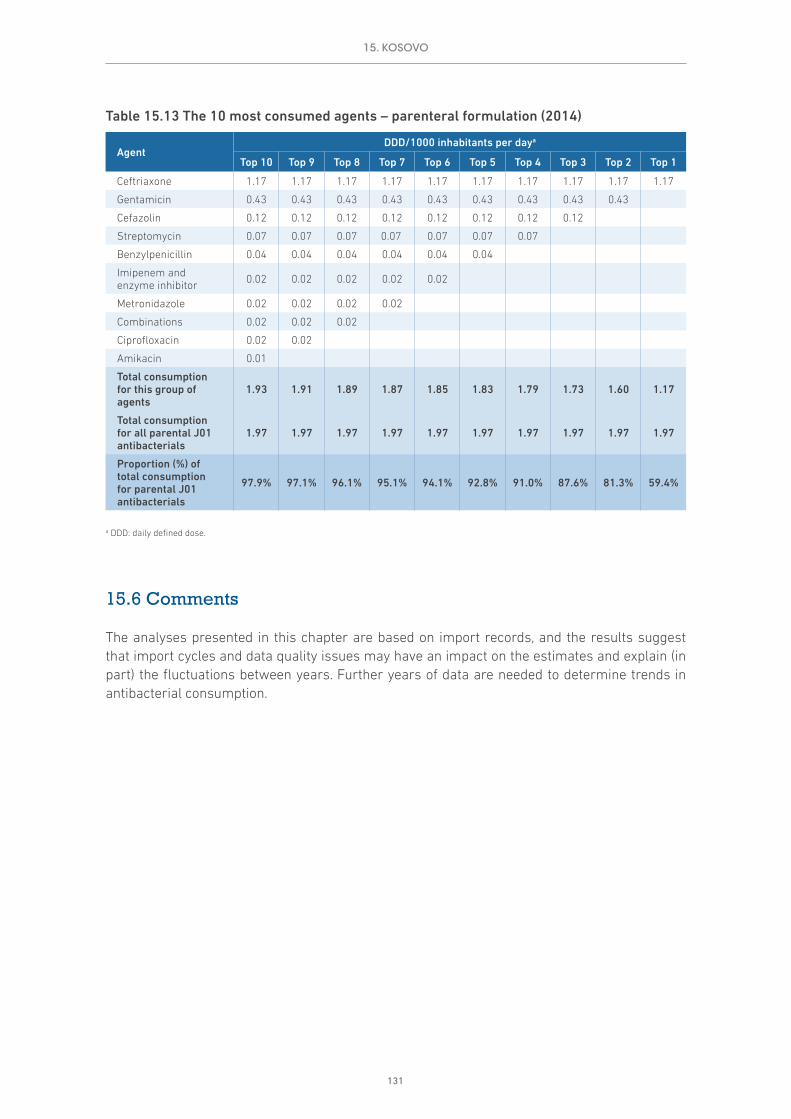
131
15.6 Comments
The analyses presented in this chapter are based on import records, and the results suggest that import cycles and data quality issues may have an impact on the estimates and explain (in part) the fluctuations between years. Further years of data are needed to determine trends in antibacterial consumption.
Table 15.13 The 10 most consumed agents – parenteral formulation (2014)
AgentDDD/1000 inhabitants per daya
Top 10 Top 9 Top 8 Top 7 Top 6 Top 5 Top 4 Top 3 Top 2 Top 1
Ceftriaxone 1.17 1.17 1.17 1.17 1.17 1.17 1.17 1.17 1.17 1.17
Gentamicin 0.43 0.43 0.43 0.43 0.43 0.43 0.43 0.43 0.43
Cefazolin 0.12 0.12 0.12 0.12 0.12 0.12 0.12 0.12
Streptomycin 0.07 0.07 0.07 0.07 0.07 0.07 0.07
Benzylpenicillin 0.04 0.04 0.04 0.04 0.04 0.04
Imipenem and enzyme inhibitor 0.02 0.02 0.02 0.02 0.02
Metronidazole 0.02 0.02 0.02 0.02
Combinations 0.02 0.02 0.02
Ciprofloxacin 0.02 0.02
Amikacin 0.01
Total consumption for this group of agents
1.93 1.91 1.89 1.87 1.85 1.83 1.79 1.73 1.60 1.17
Total consumption for all parental J01 antibacterials
1.97 1.97 1.97 1.97 1.97 1.97 1.97 1.97 1.97 1.97
Proportion (%) of total consumption for parental J01 antibacterials
97.9% 97.1% 96.1% 95.1% 94.1% 92.8% 91.0% 87.6% 81.3% 59.4%
a DDD: daily defined dose.
15. KOSOVO

132
16. CROSS-NATIONAL COMPARISONS
16.1 Background
As the methods of data collection for ESAC-Net and WHO AMC Network are broadly similar, it is possible to combine the datasets for an extended comparison of EU and non-EU countries and areas in Europe. Cross-national comparisons using 2014 data were conducted for the key metrics used in this report.
16.2 Estimates of volumes of consumption of antibacterials for systemic use (J01)
Total consumption of antibacterials for systemic use (ATC class J01) is examined by route of administration (oral and parenteral formulations) and by pharmacological subgroup.
16.2.1 Total consumption of J01 antibacterials by route of administration
The consumption of oral and parenteral (injectable) formulations of J01 antibacterials is shown in Fig. 16.1 and summarized in Table 16.1 as DDD/1000 inhabitants per day (DID).
The results illustrate the variability between countries and areas in total consumption of J01 antibacterials in 2014. DDD/1000 inhabitants per day ranged from 40.4 DID (Turkey) to 8.5 DID (Azerbaijan). The average total consumption across the 12 datasets was 24.4 DID.
This variability was also reflected in the relative consumption of parenteral forms of J01 antibacterials – ranging from 69% (Azerbaijan) to 4% (Turkey)(Table 16.1).

133
Table 16.1 Total consumption of J01 antibacterials by route of administration (2014)
Route of administration
DDD/1000 inhabitants per daya (% of totalb)
ALB ARM AZE BLR KGZ KOS MDA MNE SRB TJK TUR UZB
Oral J01 21 (92)
12.9 (90)
2.6 (31)
16.7 (84)
28.7 (78)
18.8 (91)
14 (79)
31 (95)
27.8 (94)
27.7 (72)
38.7 (96)
6 (57)
Parenteral J01 1.8 (8)
1.5 (10)
5.8 (69)
3.3 (16)
8.1 (22)
2 (9)
3.7 (21)
1.7 (5)
1.7 (6)
11 (28)
1.7 (4)
4.5 (43)
Total 22.7 14.4 8.5 20.0 36.8 20.8 17.7 32.7 29.5 38.7 40.4 10.4
a DDD: daily defined dose. b Total amounts and percentages may vary slightly owing to rounding.
16.2.2 Total consumption of J01 antibacterials by pharmacological subgroup
The consumption of J01 antibacterials by pharmacological subgroup is shown in Fig. 16.2 and summarized in Table 16.2.
Consistent with the variability in total consumption of J01 antibacterials, the absolute volumes of use of the pharmacological subgroups differed by setting. In each case, beta-lactams (J01C) was the most consumed of the subgroups, generally followed by cephalosporins (J01D) (Table 16.2).
4 Abbreviations of country and area names used in some tables and figures in this chapter are as follows: ALB: Albania; ARM: Armenia; AZE: Azerbaijan; BLR: Belarus; KGZ: Kyrgyzstan; KOS: Kosovo (in accordance with Security Council resolution 1244 (1999)); MDA: Republic of Moldova; MNE: Montenegro; SRB: Serbia; TJK: Tajikistan; TUR: Turkey; UZB: Uzbekistan.
0
5
10
15
20
25
30
35
40
45
DD
D/1
000
inha
bita
nts
per
day
Parenteral antibacterials Oral antibacterials
UZB2014
ARM2014
MDA2014
BLR2014
KOS2014
ALB2014
SRB2014
MNE2014
KGZ2014
TJK2014
TUR2014
AZE2014
Fig. 16.1 Total consumption of J01 antibacterials by route of administration (2014)4
DDD: defined daily dose.
16. CROSS-NATIONAL COMPARISONS

134
Table 16.2 Total consumption of J01 antibacterials by pharmacological subgroup (2014)
Class of antibacterial agents
DDD/1000 inhabitants per daya
ALB ARM AZE BLR KGZ KOS MDA MNE SRB TJK TUR UZB
Tetracyclines (J01A) 3.6 2.0 0.6 2.7 2.1 0.9 0.6 1.1 2.1 1.4 1.3 0.5
Amphenicols (J01B) 0.1 0.4 0.1 0.2 0.3 <0.1 0.2 - <0.1 0.5 <0.1 0.7
Beta-lactams (J01C) 9.9 5.6 5.6 7.1 16.7 10.6 6.6 15.4 13.7 20.7 18.0 3.9
Cephalosporins (J01D) 3.6 1.4 0.5 3.1 4.7 3.9 3.7 4.9 4.4 7.0 12.2 3.1
Sulfonamides and trimethoprim (J01E) 0.2 1.4 0.5 – 1.5 0.8 1.0 1.1 1.1 1.7 0.4 –
Macrolides, lincosamides and streptogramins (J01F)
2.0 1.4 0.6 2.8 4.1 1.9 1.9 5.3 3.9 0.9 4.1 1.6
Quinolone antibacterials (J01M) 2.4 1.5 0.4 2.5 5.0 1.9 3.0 3.7 3.3 4.0 3.0 <0.1
Other J01 antibacterials 0.8 0.7 0.3 1.6 2.4 0.7 0.7 1.2 1.0 2.6 1.5 0.6
Totalb 22.7 14.4 8.5 20.0 36.8 20.8 17.7 32.7 29.5 38.7 40.4 10.4
a DDD: daily defined dose. b Total amounts and percentages may vary slightly owing to rounding.
16.3 Relative consumption of J01 antibacterials
16.3.1 Relative consumption of J01 antibacterials by pharmacological subgroup
The relative consumption of pharmacological subgroups measured as a proportion of total J01 antibacterials is shown in Fig. 16.3 and summarized in Table 16.3.
0
5
10
15
20
25
30
35
40
45
DD
D/1
000
inha
bita
nts
per
day
UZB2014
ARM2014
MDA2014
BLR2014
KOS2014
ALB2014
SRB2014
MNE2014
KGZ2014
TJK2014
TUR2014
AZE2014
Quinolone antibacterials (J01M)
Macrolides, lincosamides and streptogramins (J01F)
Sulfonamides and trimethoprim (J01E)
Cephalosporins (J01D)
Beta-lactams (J01C)
Amphenicols (J01B)Other J01 antibacterials
Tetracyclines (J01A)
Fig. 16.2 Total consumption of J01 antibacterials by pharmacological subgroup (2014)
DDD: defined daily dose.
16. CROSS-NATIONAL COMPARISONS

135
The estimates of relative use of the J01 pharmacological subgroups illustrate the consumption patterns. Beta-lactams (J01C) constituted between 35.4% (Belarus) and 65.6% (Azerbaijan) of total consumption. Cephalosporins represented from 6.1% (Azerbaijan) to 30.3% (Turkey) of total consumption, while quinolones made up 17% of total J01 consumption in the Republic of Moldova and less than 0.1% in Uzbekistan (Table 16.3).
Table 16.3 Relative consumption of J01 antibacterials by pharmacological subgroup (2014)
Class of antibacterial agents
Consumption as proportion of total J01 consumption (%)a
ALB ARM AZE BLR KGZ KOS MDA MNE SRB TJK TUR UZB
Tetracyclines (J01A) 16.0 13.5 6.7 13.7 5.7 4.1 3.4 3.4 7.0 3.7 3.1 5.0
Amphenicols (J01B) 0.4 2.9 0.9 1.2 0.8 <0.1 1.1 - <0.1 1.2 <0.1 6.6
Beta-lactams (J01C) 43.7 38.8 65.6 35.4 45.4 51.2 37.3 47.0 46.2 53.5 44.5 37.5
Cephalosporins (J01D) 15.9 9.5 6.1 15.4 12.8 19.0 20.7 15.0 14.9 18.1 30.3 29.8
Sulfonamides and trimethoprim (J01E) 0.7 9.7 5.6 <0.1 4.0 3.9 5.6 3.3 3.6 4.3 0.9 –
Macrolides, lincosamides and streptogramins (J01F)
9.0 9.9 6.5 14.1 11.2 9.2 10.9 16.2 13.3 2.3 10.1 15.3
Quinolone antibacterials (J01M) 10.7 10.6 4.5 12.3 13.7 9.2 17.0 11.4 11.3 10.3 7.4 <0.1
Other J01 antibacterials 3.6 5.0 4.1 7.9 6.4 3.4 4.0 3.7 3.5 6.6 3.7 5.8
a Total percentages may vary slightly owing to rounding.
0%
20%
40%
60%
80%
100%
TUR2014
TJK2014
SRB2014
MNE2014
MDA2014
KOS2014
KGZ2014
BLR2014
AZE2014
ARM2014
ALB2014
UZB2014
Pro
port
ion
of to
tal
J01
anti
bact
eria
l con
sum
ptio
n
Quinolone antibacterials (J01M)
Macrolides, lincosamides and streptogramins (J01F)
Sulfonamides and trimethoprim (J01E)
Cephalosporins (J01D)
Beta-lactams (J01C)
Amphenicols (J01B)Other J01 antibacterials
Tetracyclines (J01A)
Fig. 16.3 Relative consumption of J01 antibacterials by pharmacological subgroup (2014)
16. CROSS-NATIONAL COMPARISONS

136
16.3.2 Consumption of cephalosporins and quinolones as a proportion of total consumption of J01 antibacterials
The relative consumption of cephalosporins and quinolones measured as a percentage of total J01 antibacterials in 2014 is shown in Fig. 16.4 and summarized in Table 16.4.
As noted in relation to Table 16.3, there was considerable variation in the use of the two pharmacological subgroups. Together, the two groups represented between 10% (Azerbaijan) and 38% (Republic of Moldova) of total J01 consumption (Table 16.4).
Table 16.4 Consumption of cephalosporins and quinolones as a proportion of total consumption of J01 antibacterials (2014)
Class of antibacterial agents
DDD/1000 inhabitants per daya (% of totalb)
ALB ARM AZE BLR KGZ KOS MDA MNE SRB TJK TUR UZB
Quinolone antibacterials (J01M)
2.4 (11)
1.5 (11)
0.4 (4)
2.5 (12)
5 (14)
1.9 (9)
3 (17)
3.7 (11)
3.3 (11)
4 (10)
3 (7) <0.1
Cephalosporins (J01D) 3.6 (16)
1.4 (10)
0.5 (6)
3.1 (15)
4.7 (13)
3.9 (19)
3.7 (21)
4.9 (15)
4.4 (15)
7 (18)
12.2 (30)
3.1 (30)
Other J01 antibacterials
16.7 (73)
11.5 (80)
7.6 (89)
14.4 (72)
27.1 (73)
14.9 (72)
11 (62)
24.1 (74)
21.8 (74)
27.7 (72)
25.2 (62)
7.3 (70)
Total 22.7 14.4 8.5 20.0 36.8 20.8 17.7 32.7 29.5 38.7 40.4 10.4
a DDD: daily defined dose. b Total amounts and percentages may vary slightly owing to rounding.
0%
20%
40%
60%
80%
100%
TUR2014
TJK2014
SRB2014
MNE2014
MDA2014
KOS2014
KGZ2014
BLR2014
AZE2014
ARM2014
ALB2014
UZB2014
Other J01 antibacterials Cephalosporins (J01D) Quinolone antibacterials (J01M)
Pro
port
ion
of to
tal
J01
anti
bact
eria
l con
sum
ptio
n
Fig. 16.4 Consumption of cephalosporins and quinolones as a percentage of the total consumption of J01 antibacterials (2014)
16. CROSS-NATIONAL COMPARISONS
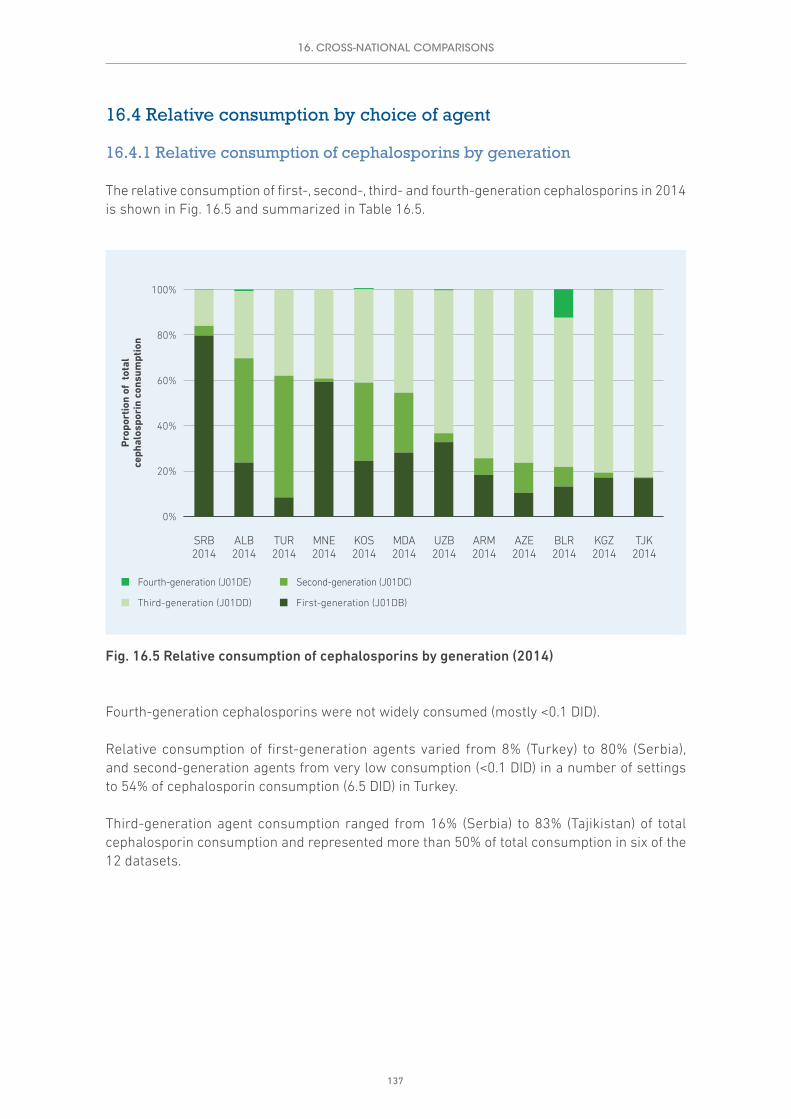
137
16.4 Relative consumption by choice of agent
16.4.1 Relative consumption of cephalosporins by generation
The relative consumption of first-, second-, third- and fourth-generation cephalosporins in 2014 is shown in Fig. 16.5 and summarized in Table 16.5.
Fourth-generation cephalosporins were not widely consumed (mostly <0.1 DID).
Relative consumption of first-generation agents varied from 8% (Turkey) to 80% (Serbia), and second-generation agents from very low consumption (<0.1 DID) in a number of settings to 54% of cephalosporin consumption (6.5 DID) in Turkey.
Third-generation agent consumption ranged from 16% (Serbia) to 83% (Tajikistan) of total cephalosporin consumption and represented more than 50% of total consumption in six of the 12 datasets.
0%
20%
40%
60%
80%
100%
KGZ2014
BLR2014
AZE2014
ARM2014
UZB2014
MDA2014
KOS2014
MNE2014
TUR2014
ALB2014
SRB2014
TJK2014
Fourth-generation (J01DE)
Third-generation (J01DD)
Second-generation (J01DC)
First-generation (J01DB)
Pro
port
ion
of t
otal
ce
phal
ospo
rin
cons
umpt
ion
Fig. 16.5 Relative consumption of cephalosporins by generation (2014)
16. CROSS-NATIONAL COMPARISONS

138
Table 16.5 Relative consumption of cephalosporins by generation (2014)
GenerationDDD/1000 inhabitants per daya (% of totalb)
ALB ARM AZE BLR KGZ KOS MDA MNE SRB TJK TUR UZB
First-generation (J01DB)
0.9 (24)
0.2 (18) <0.1 0.4
(13)0.8 (17)
1 (25)
1 (28)
2.9 (59)
3.5 (80)
1.2 (17)
1 (8)
1 (33)
Second-generation (J01DC)
1.7 (46) <0.1 <0.1 0.3
(9)0.1 (2)
1.3 (34)
1 (26) <0.1 0.2
(4) <0.1 6.5 (54)
0.1 (4)
Third-generation (J01DD)
1.1 (30)
1 (74)
0.4 (76)
2 (66)
3.8 (80)
1.6 (41)
1.7 (45)
1.9 (39)
0.7 (16)
5.8 (83)
4.6 (38)
1.9 (63)
Fourth-generation (J01DE) <0.1 <0.1 <0.1 0.4
(13) <0.1 – <0.1 <0.1 <0.1 <0.1 <0.1 <0.1
Total 3.6 1.4 0.5 3.0 4.7 3.9 3.7 4.9 4.4 7.0 12.2 3.1
a DDD: daily defined dose. b Total amounts and percentages may vary slightly owing to rounding.
16.4.2 Relative consumption of amoxicillin, amoxicillin and clavulanic acid
The relative consumption of amoxicillin and the broader-spectrum amoxicillin and clavulanic acid is shown in Fig. 16.6 and summarized in Table 16.6.
Amoxicillin was the more consumed agent in most datasets – the exception was Turkey, where only 11% of consumption was amoxicillin (Table 16.6).
0%
20%
40%
60%
80%
100%
Amoxicillin and Clavulanic Acid (J01CR02) Amoxicillin (J01CA04)
Pro
port
ion
of t
otal
con
sum
ptio
n
TUR2014
TJK2014
SRB2014
MNE2014
MDA2014
KOS2014
KGZ2014
BLR2014
AZE2014
ARM2014
ALB2014
UZB2014
Fig. 16.6 Relative consumption of amoxicillin, amoxicillin and clavulanic acid (2014)
16. CROSS-NATIONAL COMPARISONS

139
Table 16.6 Relative consumption of cephalosporins by generation (2014)
GenerationDDD/1000 inhabitants per daya (% of totalb)
ALB ARM AZE BLR KGZ KOS MDA MNE SRB TJK TUR UZB
Amoxicillin (J01CA04) 5.8 (63)
3.5 (67)
0.3 (57)
4.2 (64)
7.4 (51)
4.5 (47)
3.8 (70)
9.8 (70)
9.8 (78)
14.5 (98)
1.9 (11)
1.9 (88)
Amoxicillin and clavulanic acid (J01CR02)
3.4 (37)
1.7 (33)
0.2 (43)
2.4 (36)
7.3 (49)
5 (53)
1.6 (30)
4.3 (30)
2.7 (22)
0.2 (2)
15 (89)
0.3 (12)
Total 9.1 5.2 0.5 6.6 14.7 9.5 5.5 14.1 12.5 14.7 16.8 2.2
a DDD: daily defined dose. b Total amounts and percentages may vary slightly owing to rounding.
16.5 Comparisons with ESAC-Net antimicrobial quality indicators
ESAC-Net analyses use a number of metrics referred to as quality indicators (ECDC, 2017b). The measures in common in the ESAC-Net analysis and this report are shown in Annex 3.
Results for each measure are shown by separately country or area, along with the range of values for the WHO AMC Network and ESAC-Net 2014 analyses (Table 16.7).
Table 16.7 Quality indicators for antibiotic consumption for total care (2014)
Country or areaDDD/1000 inhabitants per daya Relative
consumption (%)
J01 J01C J01D J01F J01M J01DD+DE J01MA
Albania 22.7 9.9 3.6 2.0 2.4 5 10
Armenia 14.4 5.6 1.4 1.4 1.5 7 10
Azerbaijan 8.5 5.6 0.5 0.6 0.4 5 4
Belarus 20.0 7.1 3.1 2.8 2.5 12 12
Kyrgyzstan 36.8 16.7 4.7 4.1 5.0 10 14
Montenegro 32.7 15.4 4.9 5.3 3.7 6 7
Republic of Moldova 17.7 6.6 3.7 1.9 3.0 9 16
Serbia 29.5 13.7 4.4 3.9 3.3 2 8
Tajikistan 38.7 20.7 7.0 0.9 4.0 15 10
Turkey 40.4 18.0 12.2 4.1 3.0 11 7
Uzbekistan 10.4 3.9 3.1 1.6 <0.1 19 <0.1
Kosovo (in accordance with United Nations Security Council resolution 1244 (1999))
20.8 10.6 3.9 1.9 1.9 8 8
WHO AMC Network results 2014
Range of values 8.5–40.4 3.9–20.7 0.5–12.2 0.6–5.3 <0.1–5.0 2–19 <0.1–16
ESAC-Net results 2014
Range of values 10.6–35.1 4.2–18.0 0.03–7.3 0.61–7.9 0.50–3.7 <0.1–7.0 2.3–14.9
Abbreviations: J01: antibacterials for systemic use; J01C: beta-lactams, penicillins; J01D: other beta-lactam antibacterials; J01F: macrolides, lincosamides and streptogramins; J01M: quinolone antibacterials; J01DD+DE: third- and fourth-generation cephalosporins; J01MA: fluoroquinolonesa DDD: daily defined dose.
16. CROSS-NATIONAL COMPARISONS

140
Both datasets show considerable variability in these antibiotic quality indicators. One important difference between the data sets is that ESAC-Net data relate to the community sector, while WHO AMC Network data reflect total care. Nevertheless, in both cases the variability in overall consumption and for specific subgroups of antibacterials provides a basis for further national-level investigation into how these agents are consumed in practice.
16. CROSS-NATIONAL COMPARISONS

141
17. DISCUSSION
This report aims to present the data collected through the WHO AMC Network, to provide guidance to countries and areas on building or strengthening their national AMC surveillance and to stimulate the sharing of data both nationally and internationally. A national approach to monitoring and evaluation provides centralized data to ensure that policies and strategies to address antimicrobial resistance are effective.
Data limitations must be acknowledged. The results presented are mostly based on import records and local manufacturer sales records. Some of the limitations of these sources are described in section 3.4. The completeness, validity and reliability of the data should be considered when interpreting the results of the analyses. A fuller interpretation of the consumption data requires an understanding of the local context, taking account of changes in regulations (including enforcement of prescription-only status), data sources, resistance patterns and the potential impact of interventions to change practices. This report includes a number of examples of interventions that have led to changes in practice.
The antimicrobial consumption data should be disseminated not only at the national level but also regionally and locally. All relevant stakeholders should be informed in order to help guide, inform and evaluate interventions for behaviour change, with the ultimate aims of improving appropriate use of antimicrobials and reducing antimicrobial resistance. Public reporting can be a positive way to inform patients and the community transparently about the importance of antimicrobial resistance and the role the community plays in appropriate use of antimicrobials. Sharing of information increases confidence that these are being taken seriously as key public health issues.
Problem practices need to be addressed and interventions to improve practice developed. This may require regulatory interventions, such as enforcing prescription-only status for antimicrobials. Regulatory agencies also have an important role in ensuring that only high-quality medicines are in circulation. Problems with substandard and falsified products require attention. The pharmaceutical industry also has a role to play. It is important to assess the impact of industry in promoting use of antimicrobials. In addition, the existence of local manufacturers of specific products may be an influence on observed patterns of consumption.
The quantitative data on antimicrobials in the report are a starting-point for further studies to understand better the use of these medicines in clinical practice – this will require further quantitative and qualitative studies in primary care and hospital sectors.
The data presented summarize the early experience of the WHO AMC Network. Despite some data limitations, the levels of AMC reported and in some cases the choices of antimicrobial agents used confirm the need for action. The variability between countries suggests that the differences in patterns of consumption are not solely related to differences in disease burden. A commitment to ongoing collection, analysis and use of consumption data is essential and is a central element laid out in the Global Action Plan adopted during the World Health Assembly in May 2015.

142
REFERENCES
Adriaenssens N, Coenen S, Versporten A, Muller A, Minalu G, Faes C et al. (2011a). European Surveillance of Antimicrobial Consumption (ESAC): outpatient quinolone use in Europe (1997–2009). J Antimicrob Chemother. 66(suppl 6):vi47–vi56. doi: 10.1093/jac/dkr457.
Adriaenssens N, Coenen S, Versporten A, Muller A, Vankerckhoven V, Goossens H et al. (2011b). European Surveillance of Antimicrobial Consumption (ESAC): quality appraisal of antibiotic use in Europe. J Antimicrob Chemother. 66(suppl 6):vi71–vi77. doi: 10.1093/jac/dkr459.
ECDC (2017a). Antimicrobial consumption interactive database (ESAC-Net) [website]. Solna: European Centre for Disease Prevention and Control (http://ecdc.europa.eu/en/healthtopics/antimicrobial-resistance-and-consumption/antimicrobial-consumption/esac-net-database/Pages/database.aspx, accessed 4 January 2017).
ECDC (2017b). Quality indicators for antibiotic consumption in the community (primary care sector) in Europe 2015 [website]. Solna: European Centre for Disease Prevention and Control (http://ecdc.europa.eu/en/healthtopics/antimicrobial-resistance-and-consumption/antimicrobial-consumption/esac-net-database/Pages/quality-indicators-primary-care.aspx, accessed 5 January 2017).
Public Health England (2016). Management of infection guidance for primary care for consultation and local adaptation. London: Public Health England (https://www.gov.uk/government/publications/managing-common-infections-guidance-for-primary-care, accessed 30 December 2016).
Versporten A, Bolokhovets G, Ghazaryan L, Abilova V, Pyshnik G, Spasojevic T et al. (2014). Antibiotic use in eastern Europe: a cross-national database study in coordination with the WHO Regional Office for Europe. Lancet Infect Dis. 14(5):381–387. doi: 10.1016/S1473-3099(14)70071-4.
WHO (2012). Critically important antimicrobials for human medicine – 3rd revision. Geneva: World Health Organization (http://www.who.int/foodsafety/publications/antimicrobials-third/en/, accessed 30 December 2016).
WHO (2015). Global Action Plan on antimicrobial resistance. Geneva: World Health Organization (A68/20; http://www.who.int/antimicrobial-resistance/global-action-plan/en/, accessed 30 December 2016).
WHO (2016). WHO methodology for a global programme on surveillance of antimicrobial consumption – version 1.0. Geneva: World Health Organization (http://www.who.int/medicines/areas/rational_use/AMU_Surveillance/en/, accessed 30 December 2016).
WHO Collaborating Centre for Drug Statistics Methodology (2016). ATC/DDD methodology [website]. Oslo: Norwegian Institute of Public Health (http://www.whocc.no/atc_ddd_methodology/purpose_of_the_atc_ddd_system/, accessed 30 December 2016).

143
ANNEX 1. METHODOLOGY
The WHO Antimicrobial Medicines Consumption (AMC) Network uses the Anatomical Therapeutic Chemical (ATC) classification system. The most commonly used measurement metric is the number of defined daily doses (DDD).
ATC classification system
The ATC classification system allows flexibility in reporting by medicine or group of medicines. Medicines are classified in groups at five different levels. The majority of antimicrobial agents are classified in ATC main group J: anti-infectives for systemic use.
Level 1 (main group)
Main group J anti-infectives for systemic use
Level 2 (pharmacological/therapeutic subgroups)
ATC code Name
J01 antibacterials for systemic use
J02 antimycotics for systemic use
J04 antimycobacterials
J05 antivirals for systemic use
J06 immune sera and immunoglobulins
J07 vaccines
Level 3 (chemical/pharmacological/therapeutic subgroups)For example, within J01 these are:
ATC code Name
J01A tetracyclines
J01B amphenicols
J01C beta-lactam antibacterials, penicillins
J01D other beta-lactam antibacterials
J01E sulfonamides and trimethoprim
J01F macrolides, lincosamides and streptogramins
J01G aminoglycoside antibacterials
J01M quinolone antibacterials
J01R combinations of antibacterials
J01X other antibacterials

144
Level 4 (chemical/pharmacological/therapeutic subgroups)For example, within J01C these are:
ATC code Name
J01CA Penicillins with extended spectrum
J01CE Beta-lactamase sensitive penicillins
J01CF Beta-lactamase resistant penicillins
J01CG Beta-lactamase inhibitors
J01CR Combinations of penicillins, including beta-lactamase inhibitors
Level 5 (chemical substance)For example, within J01CA, these are:
ATC code Name
J01CA01 ampicillin
J01CA02 pivampicillin
J01CA03 carbenicillin
J01CA04 amoxicillin
J01CA05 carindacillin
J01CA06 bacampicillin
J01CA07 epicillin
J01CA08 pivmecillinam
J01CA09 azlocillin
J01CA10 mezlocillin
J01CA11 mecillinam
ATC code Name
J01CA12 piperacillin
J01CA13 ticarcillin
J01CA14 metampicillin
J01CA15 talampicillin
J01CA16 sulbenicillin
J01CA17 temocillin
J01CA18 hetacillin
J01CA19 aspoxicillin
J01CA20 combinations
J01CA51 ampicillin, combinations
Unit of measurement: DDD
The DDD is the assumed average maintenance dose per day for a medicine used for its main indication in adults. A DDD is only assigned for medicines that already have an ATC code. The DDD, however, is only a technical unit of use and does not necessarily reflect the recommended or average prescribed daily dose. The DDDs for anti-infectives are as a rule based on use in infections of moderate severity, but some anti-infectives are only used in severe infections and their DDDs are assigned accordingly. There are no separate DDDs for children, which makes the DDD estimates for paediatric formulations more difficult to interpret.
The number of DDDs is calculated as follows:
The number of DDDs provides a measure of extent of use, but for comparative purposes these data are usually adjusted for population size or population group, depending on the medicines of interest and the level of data disaggregation that is possible.
For most antimicrobials, DDD per 1000 inhabitants per day (DID) are calculated for the total population, including all age and gender groups. It may also be possible to stratify national estimates.
Number of DDDs = Total grams used
DDD value in grams
Where the total grams of medicine used is determined by summing the amounts of active ingredient across the various formulations (different strengths of tablets or capsules, syrup formulations, injections etc.) and pack sizes.

145
ANNEX 2. DATA COLLECTION
Data sources of antimicrobial consumption data
Most countries and areas participating in the WHO Antimicrobial Medicines Consumption (AMC) Network use import data (data from customs records and declaration forms) as one of the sources of information on antimicrobial consumption. These are supplemented with sales records from market authorization holders or local manufacturing estimates where there is local pharmaceutical manufacturing.
It is very important to identify correctly the data sources used in the country. If more than one source is used, it is important to be aware of overlaps in the information provided. If they are treated as separate estimates and combined to provide “total consumption”, this may overestimate actual antimicrobial consumption. Conversely, incomplete capture of import, wholesaler or manufacturing data may underestimate antimicrobial consumption by sector (community or hospital; public or private).
Table A2.1 summarizes some of the strengths and limitations of some of the different data sources.
Antimicrobial consumption data
Product-level dataThe first step requires identification of all the products for the antimicrobial agents registered (i.e. those with marketing authorization) in the country – a valid national exhaustive register of products. The register file is updated each year as new products receive marketing authorization.
Package-level dataConsumption may be expressed as the total number of packages for each product in the register of antimicrobial products consumed during the defined period. These will mostly be annual data.
Analyses based on packages of medicines will provide a crude estimate of the number of courses of treatment with antimicrobials used per year, based on the assumption that one package = one course of treatment. This measure needs to be interpreted carefully. In some settings, a package of oral medicine will represent a course of treatment. In other settings, patients may buy small numbers of tablets or capsules, or dispensing may be from large containers of the medicine, in which case a package will have very little meaning. A package is not likely to be a good guide to a course of treatment with a parenteral (injectable) antimicrobial.
Substance-level dataConsumption at the substance level can be summarized as aggregated defined daily doses (DDDs). The DDD value is assigned by the WHO Collaborating Centre for Drug Statistics Methodology.

146
Population estimates
For this report, population estimates were mostly obtained from the World Bank database (World Bank, 2016). These data are regularly updated and the population numbers can change. It is therefore important to note the source and date of the data used. For calculations of 2011–2013 consumption data, World Bank population estimates updated on 7 January 2015 were used. For calculations of 2014 consumption data, World Bank population estimates updated on 14 October 2016 were used.
National population estimates may differ from World Bank estimates and the use of national population data may give slightly different estimates of population-adjusted consumption expressed as DDD per 1000 inhabitants per day (DID). These differences in population estimates do not affect the calculations of relative consumption of pharmacological subgroups or groups of agents.
Table A2.1 Strengths and limitations of data sources for antimicrobial consumption
Data source Strengths Limitations
Import data - Import permits are issued by government. - Records are centralized. - Reporting for customs declaration forms
is standardized, including product type (generic, branded), volume, port of origin, country of manufacture, batch number and expiry date.
- Data include over-the-counter medicines.
- Documentation may be incomplete. - Data may include parallel trade stock
movements. - Data do not account for smuggled goods or
illegal entry of products. - Volumes match import cycles not
consumption patterns. - Records are administrative – not formatted
for research and analysis.
Local manufacturers
- Local licensed producers should be easily identified.
- Product volumes for local use and for export can be separated.
- Data in a format suitable for analysis can be requested.
- Private companies may be unwilling to provide data.
- Volumes reflect production not consumption patterns.
Wholesalers - Only legal entities are able to import medicines for distribution.
- Purchase and supply data can be provided. - Supply data may be disaggregated (by
community/hospital, region, facility type). - Data collection is easier where numbers of
wholesalers are limited. - Distribution/supply data are likely to
be closer to actual consumption than purchase data.
- In some countries medical, dental and veterinary practitioners and pharmacists can also import medicines.
- It may be difficult to get data from the private sector.
- Numbers of wholesalers are high in some settings.
- Some may supply other smaller wholesalers rather than end-users.
- Wholesalers may provide agriculture and veterinary sectors as well as medicines for human use.
Commercial data sources (such as IMS Health)
- Data collection is standardized. - There is capacity to combine data from
multiple sources including manufacturer records, hospital and pharmacy data.
- Data must be purchased. - Data collection may be limited in some
countries. - It may not be possible to examine data at
regional, local, facility or prescriber level. - Data may use classification other than
Anatomical Therapeutic Chemical (ATC) codes, so information at the pharmacological or chemical subgroup level may be limited.

147
Template for data collection
Data collection for the WHO AMC Network follows a standardized protocol and uses a common Excel data collection template.
A list of all antimicrobial medicines registered in the country (i.e. those with marketing authorization) is created. The route of administration (oral, parenteral, rectal, inhalation powder, inhalation solution) is entered to facilitate separate analyses such as for oral and parenteral formulations.
Each product is identified by the relevant ATC code and level. The DDD assigned by the WHO Collaborating Centre for Drugs Statistics Methodology (2016) with its unit of measurement (gram, milligram, millions of units) is entered alongside the product. The Centre also provides a list of combination products that have an approved DDD or “unit dose” measurement.
Data are entered for the number of packages for each registered product.
Population data are entered – this is the population for which the given consumption data apply. The total population may be based on WHO national population estimates for the relevant year or local estimates if there are reasons to believe that WHO estimates are inaccurate.
Contextual information related to antimicrobial consumption is entered into a separate worksheet, indicating whether the data represent the total, community or hospital consumption of antimicrobials.
Data verification
Validation of AMC data consists of two steps. The macro embedded in the template detects missing compulsory data and incorrect data units. The regional team reviews the submitted spreadsheets to identify other possible errors that cannot be detected by the macro. These include inconsistencies between data entered and product label information, unrealistic or improbable strengths of antimicrobials and miscalculated strengths of combination products when converted to standardized units. Errors are corrected by the regional team whenever possible, and the modified data sheets are returned to the AMC focal points for their confirmation and acceptance of any proposed changes. Potential errors that require more detailed product information or data requiring clarification are discussed with and corrected by the AMC focal points, and the modified data sent to the regional team again.
References
WHO Collaborating Centre for Drug Statistics Methodology (2016). ATC/DDD Index 2016 [website]. Oslo: Norwegian Institute of Public Health (https://www.whocc.no/atc_ddd_index/, accessed 31 December 2016).
World Bank (2016). Population, total [website]. Washington, DC: World Bank (http://data.worldbank.org/indicator/SP.POP.TOTL, accessed 5 January 2017).

148
ANNEX 3. MEASUREMENT METRICS AND QUALITY INDICATORS FOR ANTIMICROBIAL CONSUMPTION
As noted in section 3.3, this report focuses on a small number of measures of antibacterial consumption that are used to examine trends over time within countries and areas and in cross-national comparisons. The main types of key measure are:
• volume of consumption measures, reported as numbers of defined daily doses per 1000 inhabitants per day (DID);
• relative consumption measures, expressed as a percentage of total use of a group of antimicrobials;• the agents consumed, reflecting the choice of specific antimicrobial agents within a class and
allowing some more focused assessment of whether the choices align with recommended best practices and clinical practice guidelines.
Table A3.1 summarizes the measures reported and the relevant Anatomical Therapeutic Chemical (ATC) codes used in their calculation.
In addition, the report includes summaries of the utilization of the 10 most consumed agents (oral and parenteral formulations separately), along with the cumulative utilization these represent. This allows assessment of metrics such as which agents contribute to 75% of total drug utilization (DU75%). Often six or fewer agents make up the DU75%, and this potentially allows targeting of interventions to improve prescribing practices to these high-consumption medicines.
The 2012 European Surveillance on Antimicrobial Consumption Network (ESAC-Net) report (ECDC, 2014) noted that more than 50% of consumption of antibacterials for systemic use (ATC group J01) in the community was made up of 12 different antibacterial agents. In 22 (73%) of the 30 EU/European Economic Area countries included, three or fewer different agents were responsible for more than 50% of consumption of J01 antibacterials.
The ESAC-Net report makes no distinction in the use of oral and parenteral (injectable) formulations, and results relate to community use of antibacterials. In this WHO Antimicrobial Medicines Consumption (AMC) Network report, most data apply to total care; therefore, analyses are presented separately for oral and parenteral formulations.

149
Quality indicators for antimicrobial consumption
Quality indicators are defined as “measurable items of antibiotic use giving a possible indication of the level of quality, focusing on different aspects of quality (effectiveness, safety, appropriateness and costs, compliance, and persistence) and relevant to clinical practice” (Coenen et al., 2007).
Drug-specific quality indicators for outpatient use in Europe
The European Surveillance of Antimicrobial Consumption (ESAC) project developed 12 indicators of antibiotic use in 2007 (Coenen, 2007). These were identified from 22 initial indicators through a series of workshops with 27 experts from 15 European countries. The indicators are process indicators; they are comparative indicators with no link to thresholds that indicate appropriate levels of prescribing. They can be calculated with routinely gathered macro-level data.
Table A3.1 Metrics used in country-level analyses over time and cross-national comparisons
Category Unit
Estimates of volumes of consumption of antibacterials for systemic use (J01)
Total consumption of J01 antibacterials by route of administration Oral J01Parenteral J01
DIDa
Total consumption of J01 antibacterials by pharmacological subgroup: - tetracyclines (J01A) - amphenicols (J01B) - beta-lactams (J01C) - cephalosporins (J01D) - sulfonamides and trimethoprim (J01E) - macrolides, lincosamides and streptogramins (J01F) - quinolone antibacterials (J01M) - other J01 antibacterials (J01G, J01R, J01X)
J01A, J01B, J01C, J01D, J01E, J01F, J01M, J01G, J01R, J01X
DID
Relative consumption of J01 antibacterials by subgroup
Relative consumption of J01 antibacterials by pharmacological subgroup J01A, J01B, J01C, J01D, J01E, J01F, J01M, (J01G + J01R + J01X) as % of J01
%
Consumption of cephalosporins and quinolones as a proportion of total consumption of J01 antibacterials
(J01DB +J01DC + J01DD + J01DE)/J01, J01M/J01
%
Relative consumption by choice of agent
Relative consumption of agents of cephalosporins by generation J01DB, J01DC, J01DD, J01DE as % of total cephalosporins
%
Relative consumption of cephalosporins by generation: - choice of first-generation cephalosporins (J01DB) - choice of second-generation cephalosporins (J01DC) - choice of third-generation cephalosporins (J01DD) - choice of fourth-generation cephalosporins (J01DE)
J01DB, J01DC, J01DD, J01DE as % of J01
%
Relative consumption of agents within fluoroquinolones (J01MA) J01MA/J01 %
Relative consumption of amoxicillin and amoxicillin and clavulanic acid J01CR02, J01CA04 as % of (J01CA04 + J01CR02)
%
The 10 most consumed agents
The 10 most consumed agents – oral formulation J01 DID
The 10 most consumed agents – parenteral formulation J01 DID
a DID: DDD/1000 inhabitants per day.

150
Table A3.2 ESAC consensus-based antimicrobial quality indicators
Consumption Included in this report
J01 J01_DID Consumption of J01 antibacterials expressed in DIDa Yes
J01C J01C_DID Consumption of penicillins (J01C) expressed in DID Yes
J01D J01D_DID Consumption of cephalosporins (J01D) expressed in DID Yes
J01F J01F_DID Consumption of macrolides, lincosamides and streptogramins (J01F) expressed in DID
Yes
J01M J01M_DID Consumption of quinolones (J01M) expressed in DID Yes
Relative consumption
J01CE J01CE_% Consumption of beta-lactamase sensitive penicillins expressed as percentage
No
J01CR J01CR_% Consumption of combination of penicillins, including beta-lactamase inhibitor expressed as percentage
No
J01DD+DE J01DD+DE_% Consumption of third- and fourth-generation cephalosporins (J01DD+DE) expressed as percentage
Yes
J01MA J01MA_% Consumption of fluoroquinolones (J01MA) expressed as percentage
Yes
J01 J01_B/N Ratio of the consumption of broad (J01(CR+DC+DD+(F-FA01))) to the consumption of narrow-spectrum penicillins, cephalosporins and macrolides (J01(CE+DB+FA+01))
No
J01 J01_SV Seasonal variation of the total antibiotic consumption No
J01M J01M_SV Seasonal variation of quinolone consumption multiplied by their use in DID
No
a DID: DDD/1000 inhabitants per day.
Table A3.2 shows the 12 ESAC antimicrobial quality indicators and indicates which of them are included in this report. A summary of antimicrobial quality indicators is also presented in Chapter 16.
Measures of seasonal variation in antimicrobial consumption are not included in the analyses as most consumption estimates are based on import and manufacturer records. It may be possible to examine seasonal variation in demand for antimicrobials in settings where consumption estimates are derived from data on wholesaler supplies to health facilities, or where health facility or prescribing data are available.
Disease-specific quality indicators for outpatient antibiotic prescribing
Following on from the consensus-based antimicrobial quality indicators developed for outpatient antibiotic use, ESAC has now developed a series of disease-specific indicators (Adriaenssens et al., 2011). This was in response to clinicians’ need to have disease-specific, rather than drug-specific, information on antibiotic use. Using a similar process to that used for the previous indicators, the group developed seven broad indicators, each with two or three subindicators (Table A3.3).
These are also all process indicators, but unlike the previous ESAC indicators, the disease-specific indicators have recommended targets for use. Calculation of each of these indicators requires data linkage to the indications for use, and thus requires micro-level data collection.
While none of these indicators is included in this report, information on these measures is added below to illustrate future directions for analyses of antibacterial medicines, as data sources linking medicine with indication for treatment become available.

151
Table A3.3 Disease-specific quality indicators
Indicator number Title ATC code Acceptable
range (%)
1a Percentage of patients aged between 18 and 75 years with acute bronchitis/bronchiolitis prescribed antibacterials for systemic use J01 0–30
1b =1aa receiving the recommended antibacterials J01CA or J01AA 80–100
1c =1a receiving quinolones J01M 0–5
2a Percentage of patients older than 1 year with acute upper respiratory infection prescribed antibacterials for systemic use J01 0–20
2b =2a receiving the recommended antibacterials J01CE 80–100
2c =2a receiving quinolones J01M 0–5
3aPercentage of female patients older than 18 years with cystitis/other urinary infection prescribed antibacterials for systemic use
J01 80–100
3b =3a receiving the recommended antibacterials J01XE or J01EA or J01XX 80–100
3c =3a receiving quinolones J01M 0–5
4a Percentage of patients older than 1 year with acute tonsillitis prescribed antibacterials for systemic use J01 0–20
4b =4a receiving the recommended antibacterials J01CE 80–100
4c =4a receiving quinolones J01M 0–5
5a Percentage of patients older than 18 years with acute/chronic sinusitis prescribed antibacterials for systemic use J01 0–20
5b =5a receiving the recommended antibacterials J01CA or J01CE 80–100
5c =5a receiving quinolones J01M 0–5
6a Percentage of patients older than 2 years with acute otitis media/myringitis prescribed antibacterials for systemic use J01 0–20
6b =6a receiving the recommended antibacterials J01CA or J01CE 80–100
6c =6a receiving quinolones J01M 0–5
7a Percentage of patients aged between 18 and 65 years with pneumonia prescribed antibacterials for systemic use J01 90–100
7b =7a receiving the recommended antibacterials J01CA or J01AA 80–100
7c =7a receiving quinolones J01M 0–5
Source: Adriaenssens et al. (2011).a Of those aged between 18 and 75 years with acute bronchitis/bronchiolitis prescribed antibacterials for systemic use (1a), this represents the
proportion that received recommended antibacterials. This notation is used throughout the table.
References
Adriaenssens N, Coenen S, Tonkin-Crine S, Verheij TJM, Little P, Goossens H (2011). European Surveillance of Antimicrobial Consumption (ESAC): disease-specific quality indicators for outpatient antibiotic prescribing. BMJ Qual Saf. 20:764–772. doi: 10.1136/bmjqs.2010.049049.
Coenen S, Ferech M, Haaijer-Ruskamp FM, Butler CC, Stichele RHV, Verheij TJM et al. (2007). European Surveillance of Antimicrobial Consumption (ESAC): quality indicators for outpatient antibiotic use in Europe. Qual Saf Health Care. 16:440–445. doi: 10.1136/qshc.2006.021121.
ECDC (2014). Surveillance of antimicrobial consumption in Europe 2012. Stockholm: European Centre for Disease Prevention and Control (http://ecdc.europa.eu/en/eaad/antibiotics-get-informed/antibiotics-resistance-consumption/pages/data-reports.aspx, accessed 5 January 2017).


World Health OrganizationRegional Office for EuropeUN City, Marmorvej 51DK-2100 Copenhagen Ø, DenmarkTel.: +45 45 33 70 00 Fax: +45 45 33 70 01 Email: [email protected] Website: www.euro.who.int
The WHO Regional Office for Europe
The World Health Organization (WHO) is a specialized agency of the United Nations created in 1948 with the primary responsibility for international health matters and public health. The WHO Regional Office for Europe is one of six regional offices throughout the world, each with its own programme geared to the particular health conditions of the countries it serves.
Member States
AlbaniaAndorraArmeniaAustriaAzerbaijanBelarusBelgiumBosnia and HerzegovinaBulgariaCroatiaCyprusCzech RepublicDenmarkEstoniaFinlandFranceGeorgiaGermanyGreeceHungaryIcelandIrelandIsraelItalyKazakhstanKyrgyzstanLatviaLithuaniaLuxembourgMaltaMonacoMontenegroNetherlandsNorwayPolandPortugalRepublic of MoldovaRomaniaRussian FederationSan MarinoSerbiaSlovakiaSloveniaSpainSwedenSwitzerlandTajikistanThe former Yugoslav Republic of MacedoniaTurkeyTurkmenistanUkraineUnited KingdomUzbekistan
9 789289 052382 >
ISBN 9789289052382