antileukemic potential of pegylated gold nanoparticle ... reduction method (samal et al. 2010) with...
TRANSCRIPT

ORIGINAL PAPER
Antileukemic potential of PEGylated gold nanoparticleconjugated with protein toxin (NKCT1) isolated from Indiancobra (Naja kaouthia) venom
Tanmoy Bhowmik & Partha Pratim Saha &
Anjan Dasgupta & Antony Gomes
Received: 24 January 2013 /Revised: 26 February 2013 /Accepted: 5 March 2013 /Published online: 10 April 2013# Springer-Verlag Wien 2013
Abstract Limited efficacy of current first-line treatment forleukemia calls attention for further development of efficientstrategies. Recently, much attention has been given tonanoparticle-based drug delivery systems loaded with dualdrugs to improve current disease therapies by overcomingtoxicity. In the present study, we document to explore anapproach to conjugate gold nanoparticles (GNPs) with proteintoxin (NKCT1), a protein toxin from the Indian cobra (Najakaouthia) venom, and to establish its antileukemic activity.GNP was prepared by NaBH4 reduction method. UV–visspectroscopy of GNP showed the absorbance at 530 nm forplasma resonance. Dynamic light scattering (DLS) size ofGNPs was 2–8 nm and the GNP-NKCT1 was 68–122 nm.CD spectra of GNP-NKCT1 showed change in percentage ofβ-turn as compared with NKCT1. GNP-NKCT1 significantlyinhibited leukemic cell growth in dose- and time-dependentmanner by two- to threefold more than NKCT1. For humanleukemic lymphoma cell line and human myelogenous leuke-mic cell line, the IC50 dose was found to be 1.2 and 0.75 μg/ml, respectively, observed by trypan blue exclusionmethod and tetrazolium bromide reduction assay. Flowcytometric analysis showed appreciable number of both celllines in early and late apoptotic stages and arrested cell cyclein the G1 phase by GNP-NKCT1. Resilient power of leuke-mic cell line after wound healing and migration or invasivepower of the cell line was significantly low in GNP-NKCT1-
treated plate than the control plate. These analyses reveal thatGNP-NKCT1 possesses significant and selective anticanceractivity, likely by inducing programmed cell death throughmitochondrial and/or lysosomal pathway.
Keywords GNP-NKCT1 . Nanoparticle . Leukemic cell .
Apoptosis . Flow cytometry . Cell cycle
1 Introduction
Snake venoms contain a wide range of proteins and peptides(90–95 %), amino acids, nucleotides, free lipids, carbohy-drates, and metallic elements bound to proteins (5 %). Snakevenoms contain a large number of biologically active pro-teins and peptides that are usually similar in structure but notidentical to that of prey physiological systems (de Lima etal. 2005; Heise et al. 1995; Tu 1988).
After discovery of “anticancer” activity of snake venom(Naja sp.) by Calmette et al. (1933), a number of studies hasbeen carried out on anticancer activity on venom (Gomes et al.2007; Zhang and Cui 2007; Chiu et al. 2009). Cancer, despiteof the all-out efforts from developed countries still causes onein five deaths. Surgery, chemotherapy, and radiotherapy pro-vide inadequate protection and instead affect normal cells alongwith cancer cells. The search for cancer cure from naturalproduct (plants and animals) has been practiced for over acentury and the use of purified chemicals to treat cancer stillcontinues. From the 1940s to 2007, of the 155 new cytotoxicmolecules developed, 47 % are actually either natural productor directly derived from them. Several studies have been un-dertaken during last three decades to establish the anticancerproperty of venoms and toxins (Gomes et al. 2010). These leadto the discovery of several promising molecule having antican-cer activity, some of which are in clinical trial andmay emergedto be a future drug in cancer therapy. In our earlier studies, we
T. Bhowmik : P. P. Saha :A. Gomes (*)Laboratory of Toxinology & Experimental Pharmacodynamics,Department of Physiology, University of Calcutta, 92 APC Road,Kolkata 700009, Indiae-mail: [email protected]
A. DasguptaDepartment of Biochemistry, University of Calcutta,35 Ballygunge Circular Road, Ballygunge,Kolkata 700019, India
Cancer Nano (2013) 4:39–55DOI 10.1007/s12645-013-0036-5

have established the anticancer/cytotoxic effect of a lethalprotein toxin NK-CT1 present in Indian monocellate cobra,Naja kaouthia (Debnath et al. 2010). Recently, Biswas et al.reviewed potential venoms and toxins along with nanoparticle-conjugated venom toxins of snake, amphibians, and bees, etcfor possible therapeutic clues against emerging disease (Biswaset al. 2012). The present study reports the increasing efficien-cies of anticancer/cytotoxic activity of protein toxin NK-CT1conjugating with gold nanoparticles.
Present-day nanomedicine exploits carefully a broad va-riety of structured nanoparticles. These nanoparticles mayserve as diagnostic and therapeutic antiviral, antitumor, oranticancer agents (Faraji et al. 2009; Ghosh et al. 2008; Huand Zhang 2012; Tiwari et al. 2011). The determinant suc-cess in therapeutic and diagnostic use of nanoparticle (NP)is the ability to deliver them to desired target. In this sense,NP can be conjugated with biological molecules to makethem recognize the biological target. From the point of viewof molecular recognition, proteins have a number of prop-erties participating in ligand–receptor and protein–proteinmolecular interactions. Gold is used for nanoparticle appli-cations because it is unreactive and is not sensitive to air orlight. However, gold does like to form bonds with itself andfor this reason their surfaces have to be covered with a layerof protective molecules, for example polyethylene glycol(PEG). Capping GNP with PEG could increase stabilityand biocompatibility. The aim of this work was to explorethe conjugation of protein toxin (NKCT1) on GNP surfaceand characterization of GNP-NKCT1 and their stability. Thepurpose was to increase the anticancer activity of GNP-NKCT1 from the native protein toxin NKCT1.
2 Materials and methods
2.1 Chemicals
Acrylamide, bis acrylamide, Coomassie brilliant blue, 3-(4,5-dimethylthiazol-2-yl)-2,5-diphenyltetrazolium bromide(MTT), sodium dodecyl sulfate (SDS), sodium bicarbonate(NaHCO3), ethidium bromide, RNase A, sodium borohydrate,carboxymethyl (CM) cellulose, propium iodide, acridine or-ange, trypan blue, hydrogen tetrachloroaurate (III) trihydrate,and de-methoxy sulphoxide (DMSO) were purchased fromSigma-Aldrich Co. (St. Louis, MO, USA). RPMI1640 medi-um, fetal bovine serum, and penicillium–streptomycin waspurchased from Invitrogen (USA). Annexin V-FITC, cellcycle kit, FITC-5-bromo-2′-deoxyuridine (BrdU) kit, andKi-67 antihuman antibody kits were purchased from BD-Bioscience, USA. All other chemicals were purchased locallyand were of analytical grade. Lyophilized N. kaouthia crudevenom was purchased from Calcutta Snake Park, Kolkata,India.
2.2 Purification of protein toxin NKCT1
NKCT1 protein toxin was purified by ion-exchange columnchromatography using CM cellulose and further purified byhigh-performance liquid chromatography (HPLC; Debnath etal. 2010). The fraction was desalted and concentrated byCentricon (Millipore MWCO 3 k). Purified NKCT1 waschecked by SDS-polyacrylamide gel electrophoresis (PAGE)gel electrophoresis method (Laemmli 1970).
2.3 Synthesis of gold nanoparticles and conjugationof NKCT1
The gold nanoparticles were prepared by sodium borohy-dride reduction method (Samal et al. 2010) with modifica-tions. The synthetic method developed for this experimentconsistently produces stable gold nanoparticles provided theconditions are properly controlled. A 25 ml conical was wellwashed with aqua regia and dried. HAuCl4 (20 mM) andPEG (10 mg/ml) were mixed with sterile phosphate buffer(Liu et al. 2007). Then 100 mM NaBH4 was added dropwiseinto the conical which was placed on magnetic stirrer at37 °C for 1 h (pH 7.2). Just after mixing the NaBH4, thecolor of the reaction mixture was light violet and afterseveral minutes, it changed to deep blue. After 1 h ofstirring, mixture is centrifuged at 8,000 rpm for 30 min.Pellet containing large nanoparticles was discarded and1 mg/ml of protein toxin NKCT1 was added into thesupernatant and suspension was kept at room 37 °C forproper conjugation (Table 1).
2.4 Structural characterization of GNP-NKCT1
Conjugation was confirmed by running the 12 % PAGE gelelectrophoresis along with low-range molecular marker. CDspectroscopy of the NKCT1 and GNP-NKCT1 was doneusing Jasco J-815 Circular Dichromism spectrometer with a0.1-cm cuvette at 25 °C for determination of change in sec-ondary structure of native protein toxin upon its conjugation(Liu et al. 2007; Higuchi et al. 2007).
2.5 Biophysical characterisation of GNP-NKCT1
UV–vis spectroscopy (Perkin Elmer, Lambda-25) measure-ments from 200 to 700 nm and 400 to 700 nmwere performedfor NKCT1, GNP-NKCT1, and GNPs only. Spectra weretaken at room temperature with 1 cm optical length cuvettewith special resolution of 1 nm (Sobczak-Kupiec et al. 2011;Bhattacharya and Srivastava 2003; Olmedo et al. 2008; Sau etal. 2001; Zubarev et al. 2006). Dynamic light scattering mea-surements were performed in a Malvern Zetasizer Nano ZSapparatus (Malvern Instruments, Milan, Italy) at 25 °C andstarted 2 min after the cuvette was placed in the dynamic light
40 T. Bhowmik et al.

scattering (DLS) apparatus to allow the temperature to equil-ibrate. Measurement was carried out 24 h after the preparationof conjugation (Sobczak-Kupiec et al. 2011). The TEM imagewas obtained on a JEOL JSM 1100 transmission electronmicroscope. A drop of sample solution was allowed to dryon copper grid overnight (Sau et al. 2001; Zubarev et al.2006). Atomic force microscope (AFM) image was takenusing Atomic Force Microscope (Park System, XE-70,South Korea) in a dark room at 25 °C in noncontact modefor confirmation of nanoparticle and conjugate size (Abdullinet al. 2009).
2.6 Cell culture
Human leukemic lymphoma cell line (U937) and humanmyelogenous leukemic cell line (K562) were provided byDr. Aparna Gomes, Scientist, Indian Institute of ChemicalBiology, Calcutta, India. Cells were cultured in RPMI 1640supplemented with 10 % heat-inactivated fetal bovine serum(FBS), NaHCO3 (1.5 g/L), penicillin (100 units), and strepto-mycin (10 μg/ml). Cells were grown to confluence at 37 °C ina humidified atmosphere of 5 % CO2 inside an incubator(Heal Force, China).
2.7 Separation and culture of normal lymphocytes
Blood was collected aseptically from the vein of healthyadults (aged 24–30), after informed consent, and transferredto heparinised vial. Lymphocytes were collected from wholeblood using Ficoll histopaque after proper dilution withautoclaved saline water (Giri et al. 2006). Then, it was washedwith 1× phosphate-buffered saline (PBS) and cultured insterile complete RPMI 1640 media. Cells were grown in aCO2 incubator at 37 °Cwith 5%CO2 in humidified condition.The experiment was approved by the institutional humanethical committee (Ref. No. IHEC/AG/HUM/P17/12).
2.8 IC50 dose determination of GNP-NKCT1
2.8.1 Cell growth inhibition studies on leukemic cellsand normal lymphocytes
U937, K562 (1×10⁶) were seeded in 96-well sterileplates and were treated with different concentrations(1–5 μg/ml for U937 cell and 0.5–2 μg/ml for K562cell of GNP-NKCT1 (I, II, and III)) for 24 and 48 h of
incubation. Normal lymphocytes (1×10⁶) were alsoseeded on 96-well and treated with IC50 dose of celllines with respect to standard drug imatinib mesylate(10 μg/ml). The cell growth inhibition studies weredone using 0.2 % trypan blue with direct count underlight microscope (Olympus, Tokyo) using hemocytome-ter chamber (Debnath et al. 2010).
2.8.2 Cytotoxicity studies on leukemic cells and normallymphocytes
Exponentially growing U937 and K562 cells and freshlycollected normal lymphocytes at a cell density of 1×10⁶/mlwere incubated with different concentrations (1–5 μg/ml forU937 cell and 0.5–2 μg/ml for K562 cell IC50 dose of bothcell line and imatinib mesylate (10 μg/ml for normal lympho-cytes)) of GNP-NKCT1 (I, II, and III) for 24 and 48 h atculturable conditions at CO2 incubator. MTT assay of treatedcells were done to confirm its cytotoxic effect (Sargent andTaylor 1989). Of the MTT solution, 40 μl (5 mg/ml) wasadded 4 h prior to the end of 24 and 48 h of incubation. Theformazan granules formed by viable cells were dissolved inDMSO and the absorbance at 570 nm was estimated bymeasuring with an ELISA reader (BioTek, ELx800).
2.9 Morphological studies for detection of apoptosis
2.9.1 Florescence microscope studies
U937 and K562 cells (1×10⁶) treated with IC50 dose ofGNP-NKCT1 (respective of two cell lines) for 24 hwere observed using a fluorescence microscope for mor-phological changes. The untreated control cells and theGNP-NKCT1-treated cells were harvested separately,washed with PBS, and then stained with acridine orange(100 μg/ml) and ethidium bromide (100 μg/ml, 1:1; Daset al. 2011). The cells were then immediately mountedon slides and observed under fluorescence microscope(Motic Image plus 2.0 software) for determination ofthe cells undergoing apoptosis.
2.9.2 Confocal microscopic studies
Leukemic cells (1×10⁶) were treated with IC50 dose of GNP-NKCT1 for 24 h. After 24 h, the untreated control and treatedcells were pulled out and washed with ice-cold PBS. The cell
Table 1 Three different typesgold nanoparticle conjugatedNKCT1 and their compositionof different chemicals
Type HAucl4 (20 mM) PBS (1×) PEG (10 mg/ml) NaBH4 (100 mM) NKCT1 (1 mg/ml )
GNP I 200 μl 8,000 μl 80 μl 40 μl 832 μl
GNP II 240 μl 6,240 μl 62.4 μl 40 μl 1,000 μl
GNP III 360 μl 5,760 μl 57.6 μl 60 μl 612 μl
GNP-NKCT1 inhibits leukemia 41

was then stained with 10μg/ml ethidium bromide and 5μg/mlof 4′,6-diamidino-2-phenylindole (DAPI), respectively, on L-lysine-coated slide for 5 min (Roy et al. 2008). After mountingon slides, the cells were observed to show the differences innuclear morphology between the untreated and GNP-NKCT1-treated cells under confocal laser scanning micro-scope (Leica TCS-SP2 system). Image for ethidium bromideand DAPI were acquired from argon/krypton laser and UVlaser line using 590 nm long-pass filter for ethidium bromide,488 nm long-pass filter for DAPI, and 450 nm bandpass filterfor UV images.
2.10 Wound-healing assay
Cells were grown to 99 % confluence in six-well plate at37 °C of 5 % CO2 incubator. A wound was created byscratching cells in 1.5-cm zone with sterile 200-μl pipettetip after the old medium was washed out. Then, cells wereincubated in newly added sterile medium in the absence orpresence of GNP-NKCT1 for 24, 48, and 72 h. Cell migra-tion into wound surface was determined under an invertedmicroscope (Labomed, India).
2.11 Detection of apoptosis by DNA fragmentationand agarose gel electrophoresis
U937 and K562 cells (1×10⁶) were treated with IC50
dose of GNP-NKCT1 for 24 h. The cells wereharvested and washed twice with PBS. The cells wereresuspended in 1 ml of digestion buffer (50 mM Tris-HCl, pH 8.0, 10 mM EDTA, and 0.5 % SDS),100 μg ml−1 of proteinase K was added and incubationwas done at 65 °C water bath overnight. DNA extrac-tion was done by following the general phenol–chloro-form extraction procedure. After centrifugation, theupper layer was mixed with the same volume ofisoamyl alcohol. Again after centrifugation, DNA pre-cipitates were washed with 70 % ethanol, dried, andevaporated at room temperature and dissolved in TEbuffer (pH 8.0) at 4 °C overnight. To detect DNA frag-ments, the isolated DNA samples were electrophoresedovernight at 20 V in 1 % agarose gel and stained withethidium bromide (Roy et al. 2008). DNA fragmentationwas observed in UV transilluminator.
2.12 Detection of apoptosis by flow cytometric analysis
In order to investigate the type of cell death induced byGNP-NKCT1, flow cytometric analysis was done byperforming dot plot assay (Debnath et al. 2010). Theleukemic cells (1×10⁶) were treated with IC50 dose and3/4 of IC50 dose for 24 h. The cells were pelleteddown, centrifuged at 2,000 rpm for 10 min at 4 °C,
and washed with Annexin V-FITC binding buffer(10 mM HEPES, 140 mM Nacl, and 2.5 mM CaCl2,2H2O; pH 7.4). Again after centrifuging at 2,000 rpm at4 °C, cell pellets were dissolved in Annexin V-FITCbinding buffer containing Annexin V-FITC andpropidium iodide. After 15-min incubation in the darkat room temperature, flow cytometric analysis was done.All data were acquired with a Becton-Dickinson FACSVerse double laser cytometer. Flow cytometric readingwas taken using 488 nm excitation and bandpass filtersof 527/32 nm (for FITC detection) and 585/42 nm (forPI detection).
2.13 Study of cell cycle arrest by flow cytometric analysis
Of the leukemic cells, 1×10⁶were treated with IC50 doseand 3/4 of IC50 dose of GNP-NKCT1 for 24 h. Cells werewashed with PBS, fixed with ice-cold 70 % ethanol whichwas added drop-wise in stirring condition on Vortex, andkept at −20 °C overnight. Cells were pelleted down, washedtwice with cold PBS, and finally dissolved in PBS treatedwith RNase A for 30 min at 37 °C and stained with propiumiodide (20 μl from 50 μg/ml) and kept in the dark for15 min. Cell cycle phase distribution of nuclear DNA wasdetermined on FACS, fluorescence detector equipped with488 nm laser light source and 623 nm bandpass filter (Hostaet al. 2009; Lin et al. 2006).
2.14 Estimation of total DNA by Ki-67 antihuman antibodyusing FACS
U937 and k562 cells (1×10⁶) were treated with IC50 doseand 3/4 of IC50 dose of GNP-NKCT1 for 24 h. Cells werewashed with PBS and fixed with ice-cold 70 % ethanol andkept at −20 °C overnight. Cells were washed with buffer(PBS with 1 % FBS, 0.09 % NaN3 pH 7.2) twice and thecells were resuspended in PBS. Of the Ki-67 antibody cell,20 μl/100 μl were added (Ross et al. 2003). After mixinggently, it was kept for 20 min at room temperature in thedark. After centrifugation at 1,000 rpm for 5 min, 500 μl ofPBS was dissolved and added to 10 μl (50 μg/ml) of PIstaining solution and incubated for 15 min at room temper-ature in the dark. Then, the sample was analyzed with FACSverse (BD Bioscience).
2.15 Estimation of replication cycle by BrdU incorporationusing FACS
Exponentially growing U937 and k562 cells (1×10⁶) werecultured on RPMI medium containing 10 μl BrdU(10 μg/ml; Jayat and Ratinaud 1993; Holm et al. 1998).After 1 h, cells were treated with IC50 dose and 3/4 of IC50
dose of GNP-NKCT1 and kept at CO2 incubator for 24 h.
42 T. Bhowmik et al.
Cells were washed with PBS and fixed with permealizationbuffer for 20 min. After washing again with PBS, Dnase(5 μg/ml) was added and incubated for 1 h at 37 °C. Anti-
BrdU antibody was added to it and kept in the dark for20 min after PBS washing. Incubated with 7-ADD for15 min at dark condition, the sample was analyzed with
Fig. 2 Surface plasmonresonance spectroscopy ofNKCT1 (λmax=220 nm) (c),GNP (λmax=530 nm) (a) andGNP-NKCT1 (both theλmax=220 nm and λmax=528 nm) (b) detected byUV–Vis. Hydrodynamicdiameter of GNP andGNP-NKCT1 were showed byDLS. The size of only GNP was2–8 nm with average size of4 nm (d) and GNP-NKCT1conjugate particle showed68–122 nm with average of92 nm (e)
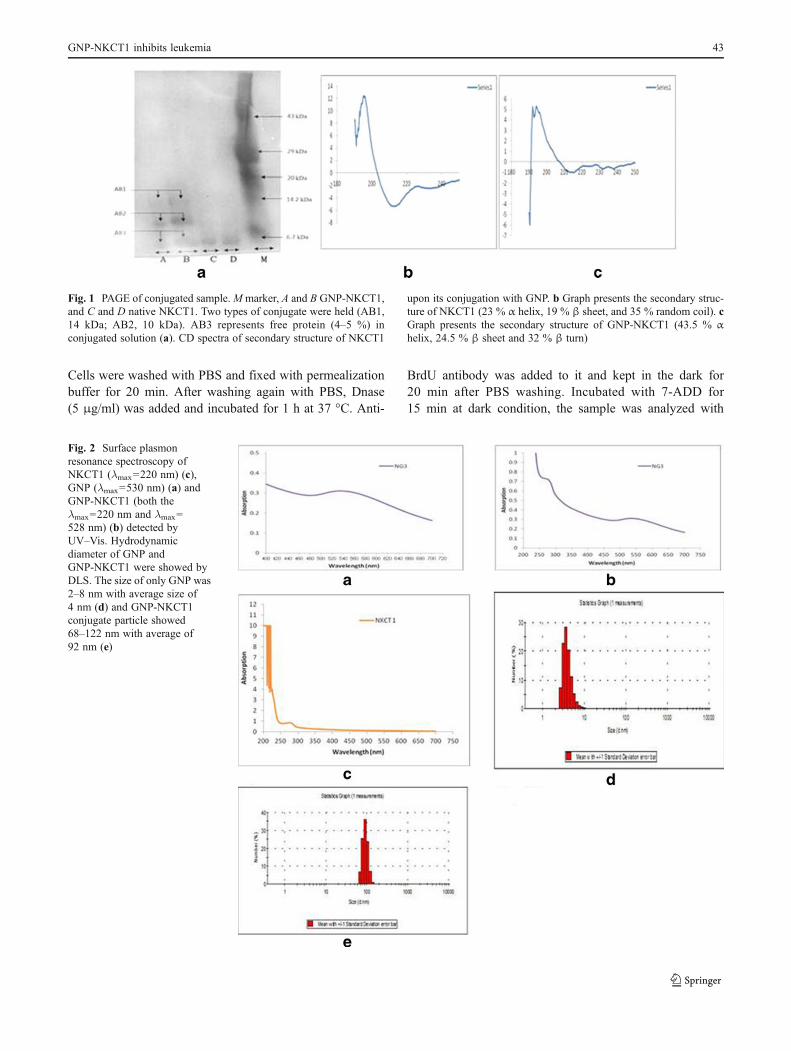
Fig. 1 PAGE of conjugated sample.M marker, A and B GNP-NKCT1,and C and D native NKCT1. Two types of conjugate were held (AB1,14 kDa; AB2, 10 kDa). AB3 represents free protein (4–5 %) inconjugated solution (a). CD spectra of secondary structure of NKCT1
upon its conjugation with GNP. b Graph presents the secondary struc-ture of NKCT1 (23 % α helix, 19 % β sheet, and 35 % random coil). cGraph presents the secondary structure of GNP-NKCT1 (43.5 % αhelix, 24.5 % β sheet and 32 % β turn)
GNP-NKCT1 inhibits leukemia 43

FACS verse using 507 nm long-pass filter, 527/32 bandpassdetector, and 488 nm laser light source.
2.16 Statistical analysis
All values are represented as arithmetic mean±SEM. Statisticalanalysis was done by Student’s t test. A probability value of lessthan 0.05 was chosen as the criterion of statistical significance.
3 Results
3.1 Purification of NKCT1
As previously reported by Debnath et al., NKCT1 waspurified by ion-exchange method and 3.24 mg/ml proteinwas estimated by Lowry’s method (Lowry et al. 1951).
HPLC showed only a single peak with a retention time of10 min. SDS-PAGE showed single band with molecularweight of 6.7 kDa (Fig. 1a).
3.2 Conjugation of GNP with protein toxin NKCT1
Polyacrylamide gel electrophoresis of GNP-NKCT1showed two bands as compared with the single band ofNK-CT1. Molecular weight of the two bands of GNP-NKCT1 was found to be 10 and 14 kD, respectively(Fig. 1a), unconjugated NK-CT1 (above 4–5 %) was presentand produced faint band in PAGE. CD spectra showed, nativeNK-CT1 contained 23 % α-helix, 19 % β-sheet, and 35 %random coil and GNP-NKCT1 contained 43.5 % α-helix, 24.5 % β-sheet, and 32 % β-turn. Percent change after conjuga-tion was found to be 20.5 % of α-helix, 5.5 % β-sheet. Foundin the secondary structure of GNP-NKCT1, 32 % of β-turn
Fig. 3 Transmission electronmicroscopy (TEM) photographof goldnanoparticle(bar 50 nm). Only GNP (a)and GNP with protein core (b).Arrow indicates protein corearound the GNP. Actual sizeof gold nanoparticle measuredby atomic force microscope.Where only GNP showed5–25 nm (c), GNP-NKCT1showed 40–220 nm (d)
44 T. Bhowmik et al.

was found in the secondary structure of GNP-NKCT1 ascompared with the 35 % random coil of NK-CT1. This dataconfirmed that cysteine/amide residue (Dolati et al. 2011) ofthe amino acid chain was conjugated with gold nanoparticledirectly with the surface or via PEG attached with the GNPsurface (Fig. 1b and c).
3.3 Biophysical characterization of GNP-NKCT1
The gold nanoparticle formed was light violet/pink colorhaving plasmon resonance at 530 nm (Fig. 2a). The plasmonresonance of GNP-NKCT1 was formed at the 528 and
220 nm, as compared with the plasmon resonance of NKCT1which was at 220 nm (Fig. 2b and c). The hydrodynamicdiameter of the nanoparticle measurement with DLS wasfound in the range of 2–8 nm, with an average size of 4 nm(Fig. 2d). GNP-NKCT1 diameter was 68–122 nm, with anaverage size of 92 nm (Fig. 2e). Figure 3 shows high-resolution TEM micrograph (HR-TEM) of bare GNP andNKCT1-coated GNP (Fig. 3a, b). The presence of layeraround the nanoparticle core was due to NKCT1, whichwas observed by uranyl acetate staining. As observed, thePEG and one/two protein molecule covered the whole surfaceof the nanoparticle and increased the hydrodynamic size
Fig. 4 Bar diagram presents the IC50 dose of GNP-NKCT1 (1, 2,and 3) on U937 cell line (a and b) and K562 cell line (c and d),determined by trypan blue exclusion method. On U937 cell after24 h IC50 dose=1.5 μg/ml (a) and after 48 h IC50 dose=1.2 μg/ml (b). OnK562 cell after 24 h. IC50 dose=0.8 μg/ml (c) and after 48 h IC50
dose=0.75 μg/ml (d). Result of MTT assay on U937 cell line
[e (24 h) and f (48 h)] and on K562 cell [g (24 h) and h (48 h)].Effect of GNP-N KCT1 and imatinib mesylate on normal lym-phocyte. Cell count by trypan blue exclusion (4i) and byMTTassays (4j).Each value represents quadruplicate samples of mean±SEM. *P<0.05 ascompared to control
GNP-NKCT1 inhibits leukemia 45

of NKCT1-capped gold nanoparticle. AFM showed thecluster of the gold nanoparticle size and it was found to
be 4–25 nm whereas with protein core, it was 45–225 nm(Fig. 3c, d).
Fig. 4 (continued)
46 T. Bhowmik et al.

3.4 Cell growth inhibition study and cytotoxicity study
GNP-NKCT1 at concentrations of 1–5 μg/ml (U937 cell line)and 0.5–2 μg/ml (K562 cell line) significantly inhibited thegrowth of the respective leukemic cells compared with thecontrol cell and normal lymphocyte cell in a time- andconcentration-dependent manner. Cell count (Fig. 4a–d) andMTT assay (Fig. 4e–h) revealed that IC50 value for U937 andK562 cells were 1.2 and 0.75 μg/ml of GNP-NKCT1-I only.When normal human lymphocytes were treated with GNP-NKCT1 (1.2 μg/ml) for 48 h, there was 15–16 % decrease incount as compared to untreated control (Fig. 4i–j). But whennormal human lymphocyte were treated with standard drugimatinib mesylate (10 μg/ml) for 24 h, there was 34–35 %decrease in count (Fig. 4i–j). This showed that cell death afterGNP-NKCT1 treatment was significantly less in case of nor-mal lymphocytes as compared to treated leukemic cells andalso in comparison to the standard imatinib mesylate, toxicityof GNP-NKCT1 towards normal cells is less. The other twoconjugated product, GNP-NKCT1 (1) and GNP-NKCT1 (2)did not show promising result. In U937 cells, IC50 dose were3.0 and 2.8 μg/ml, respectively, for GNP-NKCT1-II andGNP-NKCT1-III, whereas in K562 cells IC50 dose were1 μg/ml and more than 1 μg/ml, respectively, for GNP-NKCT1-II and GNP-NKCT1-III (Table 2). As GNP-NKCT1-I showed very promising result, it was selected asan experimental sample for rest of the experiment and it wasabbreviated GNP-NKCT1 only.
3.5 Morphological studies for detection of apoptosis
Morphological observations of treated cells from both the celllines under fluorescent microscope showed intact nuclei incontrol cell that gave bright green fluorescence (Fig. 5a and c)whereas treated cells showed intense orange–red fluorescenceshowing signs of apoptosis (Fig. 5b and d). Confocal micro-scopes revealed chromatin disintegration and formation ofapoptotic bodies (Fig. 5e, g, i, and k) whereas control cellshowed intact cell (Fig. 5f, h, j, and l).
3.6 GNP-NKCT1 inhibited leukemic cell migration
As shown in Fig. 6, the cell migration was obviously inhibitedby GNP-NKCT1 with time-dependent manner. Where controlcell (absence of GNP-NKCT1) showed growth in wound zonewithin 24 h, the treated cell showed very little growth inscratching zone after 48 h. After 72 h, 95.80 % controlU937 cells migrated in the wound zone but it was only 40.88 % in treated U937 cell; in case of K562 cells where in 99.10 % were filled, only 51.60 % were filled by treated cell.
3.7 Detection of apoptosis by DNA fragmentationand agarose gel electrophoresis
The gel pattern of DNA samples isolated from untreatedcontrol cell lines showed intact bands whereas the gel pat-tern of DNA samples isolated from GNP-NKCT1-treatedU937 (Fig. 7a) and K562 cells (Fig. 7b) showed smearyband. So, the observations confirmed that the treatment withGNP-NKCT1 causes apoptosis in human leukemic cells.
3.8 Detection of apoptosis by flow cytometric analysis
In the flow cytometric analysis, lower left (LL) quadrant(Annexin V–/PI–) is regarded as population of live cells, lowerright quadrant (LR; Annexin V+/PI−) is considered as the cellpopulation at early apoptotic stage, upper right quadrant (UR;Annexin V+/PI+) represents the cell population at late apoptoticstage and upper left quadrant (AnnexinV−/PI+) is considered asnecrotic cell population. Flow cytometric data analysis revealedthat after 24 h of treatment of GNP-NKCT1 (IC50 dose) 0.37 %in LL quadrant, 57.16 % in LR quadrant, and 42.47 % in URquadrant of U937 cells (Fig. 8b) with respect to 98.51 % in LLquadrant, 0.17% in LR quadrant, and 0.45% in UR quadrant ofcontrol cell (Fig. 8a) and 22.27 % in LL quadrant, 75.89 % inLR quadrant, and 1.81% inUR quadrant of K562 cells (Fig. 8d)with respect to 96.37 % in LL quadrant, 2.95%in LR quadrant,and 0.55 % in UR quadrant of control cell (Fig. 8c).
3.9 Study of cell cycle arrest by flow cytometric analysis
The flow cytometric analysis showed that when comparedwith that of the untreated control U937 cells and K562 cells,24 h of GNP-NKCT1 (3/4 of IC50 dose) treatment caused aprogressive increase in the number of cells with 2N DNAcontent, indicating that the GNP-NKCT1 treatment inhibitedthe growth of U937 and k562 cells by cell cycle arrest in G1phase. Where U937-treated cell showed 78.58 % G1+G0, 6.84 % S, and 8.81 % G2+M (Fig. 8f), the control cell showed48.88 % G1+G0, 40.80 % S, and 8.98 % G2+M (Fig. 8e)where k562 cells showed 62.47 % G1+G0, 31.62 % S, and 2.98 % G2+ M (Fig. 8h), the control cell showed 35.84% G1+G0, 50.03 % S, and 11.86 % G2+M (Fig. 8g).
Table 2 IC50 dose of GNP conjugated NKCT1 on leukemic cell lines
Cell line GNP type IC50 (μg/ml) of conjugatedGNP-NKCT1
24 h 48 h
U937 GNP-NKCT1-III 1.60±0.09 1.20±0.05
GNP-NKCT1-II 3.80±0.10 3.00±0.12
GNP-NKCT1-I 3.40±0.08 2.80±0.10
K562 GNP-NKCT1-III 0.80±0.07 0.75±0.03
GNP-NKCT1-II 1.10±0.06 1.00±0.05
GNP-NKCT1-I 1.25±0.07 1.20±0.01
GNP-NKCT1 inhibits leukemia 47

3.10 Estimation of total DNA by Ki-67 antihuman antibodyusing FACS
The flow cytometer detected, DNA content of control cellswas much higher than the treated cell lines. In case ofcontrol, U937 cell showed 97.06 % dividing phase andcontrol K562 cell showed 88.70 % (Fig. 9a and c), but intreated cell line dividing cell were 46.11 and 65.68 %,respectively (Fig. 9b and d). This result proved that control
cell showed more dividing phase (S phase and G2+Mphase) than treated cell line.
3.11 Estimation of replication cycle by BrdU incorporationusing FACS
The immunofluorescent staining of incorporated bromodeoxyuridine (BrdU) and flow cytometry analysis provide a high-resolution technique to determine the frequency and nature of
Fig. 5 Fluorescence microscopic images of control U937 (a), K562 (c),GNP-NKCT1 treated U937 (b), treated K562 (d) cell line. The controlcells gave bright green fluorescence for their intact nuclei whereas bothtreated cell line red fluorescence showing signs of apoptosis. Confocalmicroscopic images of control U937 (e and i), K562 (g and k) and
GNP-NKCT1 treated U937 (f and j), treated K562 (h and l) cell lines.The treated cells indicated apoptotic changes like nuclear disintegration,membrane disruption. e–hCells stained with propium iodide and i to l arecells stained with DAPI
48 T. Bhowmik et al.

individual cells that have synthesized DNA. In this method,BrdU (an analog of DNA precursor thymidine) is incorporatedinto newly synthesized DNAby cells entering and progressingthrough the S (DNA synthesis) phase of cell cycle. Often,staining with a dye that binds to total DNA such as 7-ADD iscoupled with immunofluorescent BrdU staining. With thiscombination, two-color combination and two-color flowcytometry analysis permits the enumeration and characteriza-tion of cells that are actively synthesizing DNA in terms oftheir cell cycle position. BrdU incorporation via replicationcycle (synthesis phase) was significantly decreased in GNP-NKCT1 treated cell with respect to control cell. Control U937cell showed 54.04 % synthesis phase and GNP-NKCT1 treat-ed cell showed 20.44 % (Fig. 9e and f). In other set ofexperiment, GNP-NKCT1 treated K562 cell showed 50.7 %BrdU incorporation with respect to 71.04 % of BrdU incontrol K562 (Fig. 9g and h).
4 Discussions
The number of natural product-derived drugs present in thetotal drug launches from 1940 to 2011 was recently analyzedand it was concluded that natural products are still a significantsource of new chemotherapeutic agent, especially anticancer(Newman et al. 2003). Although many chemotherapeuticdrugs are used clinically, the overall survival of leukemiapatients is far from satisfactory. Recent advances in nanotech-nology have stimulated different applications in biomedicinewhere nanoparticles are used as drug delivery vehiclesallowing rational manipulation of pharmacological profiles
of drugs encapsulated in them and hence their concomitanttherapeutic indices(Wang et al. 2009). The present investiga-tion confirmed the increase of percentage of cytotoxicityactivity and apoptosis against two human leukemic cell linesU937 and K562 including the conjugation of protein toxinNKCT1 with gold nanoparticle. Gold nanoparticle has specialattraction to sulfur bond (Fan et al. 2003). Though proteintoxin NKCT1 has cysteine residue, we used PEG for morestability of GNP-NKCT1. CD spectra showed the change insecondary structure that might be the bonding of N-terminalNH2 or internal amide group of NKCT1 via the hydroxyl(OH) group of PEG with gold nanoparticle; still some work(i.e., FTIR, XPS, EELS) should be done to investigate theproper bonding of GNP with NKCT1 (Liu et al. 2007; Shi etal. 2004). UV–vis spectroscopy showed surface plasmon res-onance at 520–540 nm which is the primary characteristics ofgold nanoparticle formation (Triulzi et al. 2008). For using ofstrong reducing agent like sodium borohydrate for the prepa-ration of GNP, it became very much polydisperse in size. Theformation of GNPs by NaBH4 and sodium citrate method wasdifferent. In sodium citrate method, after formation of GNPs,it became capped by citrate ion that is why they repelled eachother and stayed single in solution. But in NaBH4 method,they became as Au 0 state that is why they attracted each otherand formed the cluster of GNPs with time-dependent manner.Where HR-TEM confirmed the formation of various size ofgold nanoparticle formation, PAGE gel electrophoresisshowed molecular weight became 10 to 14 kDa which meansone or two protein chains were conjugated per gold nanopar-ticle. The GNP-NKCT1 is stable at room temperature andshowed the same efficiency effect after 1 month of storing at
Fig. 5 (continued)
GNP-NKCT1 inhibits leukemia 49

room temperature (30o±5 °C); GNP not only increases the lifespan of NKCT1. Our study emphasize on the alreadyestablished fact that GNP-NKCT1 were taken up more byleukemic cell in comparison to native protein NKCT1. Thelower uptake of native NKCT1 is attributed to the resistanceexperienced by them due to P-gp pump highly expressed onleukemia cells (Hui et al. 2008) which acts as an energy drugefflux pump and leads to decrease in cytotoxic protein accu-mulation. The nanoparticle conjugation system escapes the P-gp pump as their uptake is mediated by specific endocyticprocesses (Sahoo and Labhasetwar 2005). Thus, goldnanoparticle-conjugated NKCT1 preferentially delivered intothe cells or subcellular organelle like mitochondria or lyso-some for eliciting a better therapeutic effect than native proteinNKCT1. The antiproliferative and the cytotoxic activities ofGNP-NKCT1 were supported by observations in cell growthinhibition studies and in MTT assays, respectively. GNP-NKCT1 inhibited the growth and electron transport chain
via blocking of succinate dehydrogenase in mitochondria ofU937 and K562 cells in concentration- and time-dependentmanner. In separate study, we saw GNP-NKCT1 possessespotent immunomodulatory activity and that concentrations(IC50 dose of U937 cell) showed very less toxic effect onnormal lymphocyte cell line as observed by trypan blue ex-clusion and MTT assay. This finding reveals that GNP-NKCT1 preferentially acts on leukemic cells. Competencyof drug-loaded nanoparticles in inhibiting the growth ofK562 cells were recently studied by Palma et al., whereimatinib-loadedmicrocapsules were used to targeted leukemiastem cells more profoundly than native imatinib (Palma et al.2010). Similar approach was also taken up by Luo et al. andYang et al. who have used N succinyl chitosan nanoparticlesand lipid nanoparticles on K562 cells for better antitumoreffect (Luo et al. 2009; Yang et al. 2009).
There are two main strategies by which chemotherapeuticagents are capable of exerting their effect: (1) is by inductionof apoptosis and (2) is by cell cycle inhibition. Many of thecompounds under study as antitumor agents act at multiplesteps in cell cycle, and their effects may be cytostatic orcytotoxic, depending on the cell cycle status of the target cells(Shapiro andHarper 1999). In this context, our study indicatedthat at lower concentration (0.5μg/ml for K562 cell line and 0.9 μg/ml for U937 cell line) of GNP-NKCT1 was able to causecell cycle arrest at particular phase while at a higherconcentration (0.75 μg/ml for K562 cell line and 1.2 μg/ml for U937 cell line) it was capable of inducingapoptosis. Central dogma of the cell was inhibited bythe treatment of GNP-NKCT1. BrdU, which is the an-alog of the DNA precursor thymidine, is incorporatedduring the first major round of cell cycle activity. Flowcytometry detected inhibition of replication as treated
Fig. 7 The gel pattern of DNA samples isolated from a control U937cells (2), treated U937 cells (1), b control K562 cells (1) and treatedK562 cells (2). Treated with GNP-NKCT1 showed smeary band ofDNA in both cell lines indicating the process of apoptosis
Fig. 6 Migration of both celllines was affected byGNP-NKCT1. Only 40.88 and51.60 % cells were recoveredafter scratching in U937 andK562 cell line, respectively.All the value representsquadruplicate samples ofmean±SEM. *P<0.05 ascompared to control
Fig. 8 Flow cytometry analysis of U937 and K562 cells stained withAnnexin V-FITC-PI, after treatment with NK-CT1. Control U937 cells(a), treated U937 cells (b), control K562 cells (c), and GNP-NKCT1treated K562 (d). Flow cytometry analysis of cell cycle of untreatedcontrol U937 cells (e), GNP-NKCT1-treated U937 (f), control K562 cells(g), and treated K562 cells (h). Histogram of both the treated cell lineshowed the arrest of cell cycle in G1 phase (x-axis denotes fluorescenceintensity of propium iodide and y-axis denotes cell count)
b
50 T. Bhowmik et al.

GNP-NKCT1 inhibits leukemia 51
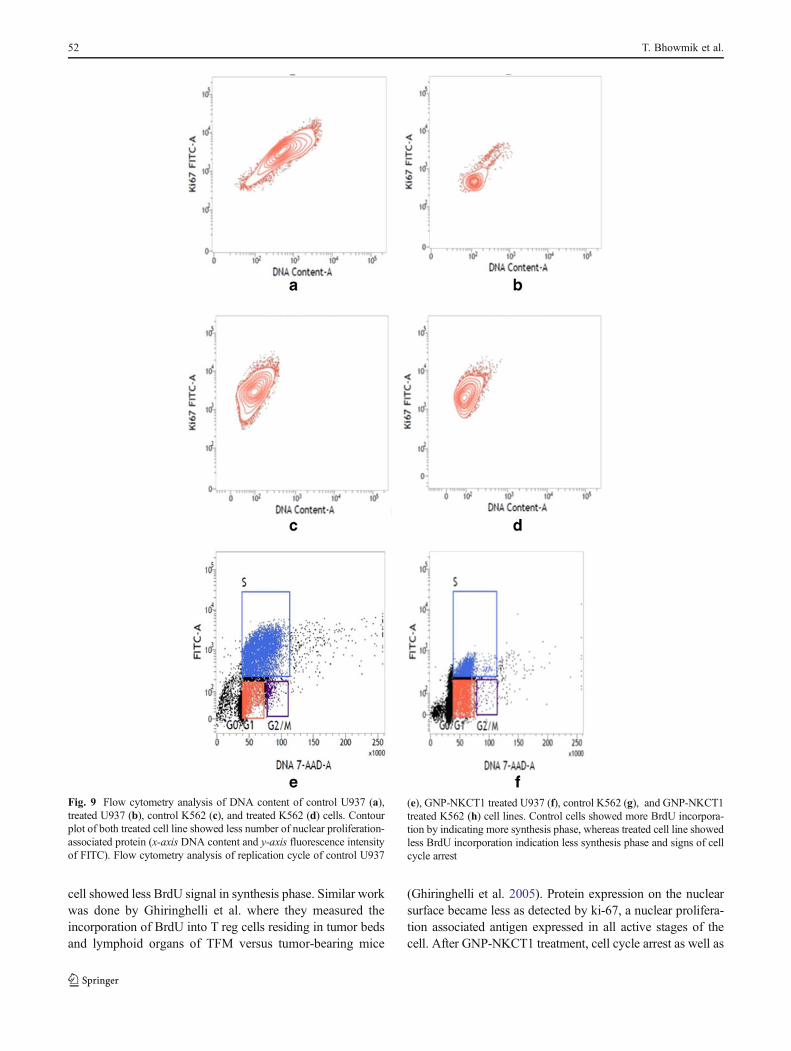
cell showed less BrdU signal in synthesis phase. Similar workwas done by Ghiringhelli et al. where they measured theincorporation of BrdU into T reg cells residing in tumor bedsand lymphoid organs of TFM versus tumor-bearing mice
(Ghiringhelli et al. 2005). Protein expression on the nuclearsurface became less as detected by ki-67, a nuclear prolifera-tion associated antigen expressed in all active stages of thecell. After GNP-NKCT1 treatment, cell cycle arrest as well as
Fig. 9 Flow cytometry analysis of DNA content of control U937 (a),treated U937 (b), control K562 (c), and treated K562 (d) cells. Contourplot of both treated cell line showed less number of nuclear proliferation-associated protein (x-axis DNA content and y-axis fluorescence intensityof FITC). Flow cytometry analysis of replication cycle of control U937
(e), GNP-NKCT1 treated U937 (f), control K562 (g), and GNP-NKCT1treated K562 (h) cell lines. Control cells showed more BrdU incorpora-tion by indicating more synthesis phase, whereas treated cell line showedless BrdU incorporation indication less synthesis phase and signs of cellcycle arrest
52 T. Bhowmik et al.

programmed cell death occurred via apoptosis and for thisreasonmigration of cell became very less after wound healing.
Apoptosis is an important continuous and highly regulatedcellular process resulting in destruction of undesirable cellsduring development or homeostasis in multicellular organisms(Kaufmann and Hengartner 2011). Apoptogenic activity ofGNP-NKCT1 was investigated by different morphologicalstudies like fluorescence microscopic, confocal microscopic,and phosphatidylserine externalization studies. The process ofapoptosis is characterized by several morphological changessuch as membrane blebbing, chromatin condensation, andnuclear fragmentation. Fluorescence microscopic image clear-ly showed nuclear disintegration of GNP-NKCT1-treated leu-kemic cells compared with control cell when stained withacridine orange and ethidium bromide. The control cellsshowed bright green fluorescence as the live cells with intactmembrane excluded ethidium bromide and only acridineorange could enter into them. On the contrary, GNP-NKCT1-treated cells showed more intense red fluorescence andreduced green fluorescence since apoptotic and necrotic cellscould not exclude the dyes and gave a combination of orange–red fluorescence. Apoptogenic activity of GNP-NKCT1 wasfurther evidenced from the confocal microscopy images oftreated leukemic cells when compared to control cell. AfterGNP-NKCT1, leukemic cell lines showed several signs ofapoptosis like chromatin condensation and nuclear fragmenta-tion whereas the untreated control cells were with intact nuclei.Externalization of PS from inner leaflet to outer leaflet of themembrane is the hallmark of apoptosis. Externally translocatedPS bind with Annexin V in a calcium-dependent manner. Flowcytometry detected Annexin V-FITC and showed the dot plotsupporting the fact that treatment with GNP-NKCT1-inducedapoptosis in the leukemic cells. Cells undergoing apoptosisusually exhibited fragmentation of the cell into membrane-bound apoptotic bodies, nuclear and cytoplasmic condensation,and endolytic cleavage of the DNA into small oligonucleosomal
fragments (Thatte et al. 2000). Further evidence in support ofapoptogenic activity of GNP-NKCT1 was obtained from gelpatterns of agarose gel electrophoresis. GNP-NKCT1 showedsmeary bands, a typical indication of apoptosis whereas theuntreated control cells showed intact DNA bands. Apoptosisis a tightly regulated process, which involves changes inexpression of distinct set of genes. Two of the major genesresponsible for regulating the mitochondrial apoptosis path-way are antiapoptic Bcl-2 and proapoptic bax (Tong et al.2004). Debnath et al. reported that NKCT1-induced the apo-ptosis in leukemic cell line like U937 and K562 via activationof Bcl2: bax and cleaved PRAP levels with increasing dose ofNKCT1. We also believed that our conjugated GNP-NKCT1follow the same signaling pathway. Further work is going onmolecular signaling.
5 Conclusion
This study exhibited that conjugation of gold nanoparticle withNKCT1 work in synergistic manner lowering both dose ofadministration and time of action of the NKCT1 ensuring thatGNP release the NKCT1 to the target cell by controlled man-ner and two- to threefold increase the cytotoxic effect whileminimizing the toxic effect of NKCT1. This conjugation wascapable of showing high antileukemic activity by inducing cellcycle arrest and promoting apoptosis regulating activities likenuclear fragmentation. Moreover, regulation of various bio-chemical pathways after inhibiting the transcriptional andtranslational level by GNP-NKCT1 treatment supports theevolving concept that such nanoparticle conjugation may behelpful for leukemia therapy in the near future.
Acknowledgments This project sponsored by the Department ofBiotechnology, Govt. of India, New Delhi, India (ref no.: .BT/PR14811/ NNT/28/500/2010).
Fig. 9 (continued)
GNP-NKCT1 inhibits leukemia 53

References
Abdullin IT, Bondar OV, Nikitina II, Bulatov ER, Morozov VM,Hilmutdinov KA, Salakhov KM, Culha M (2009) Effect of sizeand protein environment on electrochemical properties of goldnanoparticles on carbon electrodes. Bioelectrochemistry 77:37–42
Bhattacharya S, Srivastava A (2003) Synthesis of gold nanoparticlesstabilised by metal-chelator and the controlled formation of close-packed aggregates by them. Proc Indian Aacd Sci Chem Sci115:613–619
Biswas A, Gomes A, Sengupta J, Datta P, Singha S, Dasgupta AK et al(2012) Nanoparticle-conjugated animal venom toxins and theirpossible therapeutic potential. J Venom Res 3:15–21
Calmette A, Saenz A, Costil L (1933) Effects du venin de cobra sur lesgreffes cancereuses et sur le cancer spontane (adenocarcinoma) dela souris. C R Acad Sci 197:205–209
Chiu CC, Lin KL, Chien CM, Chang LS, Lin SR (2009) Effects ofcardiotoxin III on NF-kappa B functions, proliferation and apo-ptosis in human breast MCF-7 cancer cells. Oncol Res 17:311–321
Das T, Bhattacharya S, Halder B, Biswas A, DasGupta S, Gomes A etal (2011) Cytotoxicity and antioxidant property of a purifiedfraction (NN-32) of Indian Naja naja venom on Ehrlich ascitescarcinoma in BALB/c mice. Toxicon 57:1–8
de Lima DC, Abreu PA, de Freitas CC, Santos DO, Borges RO, dosSantos TC, Cabral LM, Rodrigues CR, Castro HC (2005) Snakevenom: any clue for antibiotics and CAM? eCAM 2:39–47
Debnath A, Saha A, Gomes A, Biswas S, Chakrabarti P, Giri B, BiswasAK, Dasgupta S, Gomes A (2010) A lethal cardiotoxic-cytotoxicprotein from the Indian monocellate cobra (Naja kaouthia) ven-om. Toxicon 56:569–579
Dolati A, Imanieh I, Salehi F, Farahani F (2011) The effect of cysteineon electrodeposition of gold nanoparticle. Mat Sci and Eng B176:1307–1312
Fan J, Chen S, Gao Y (2003) Coating gold nanoparticles with peptidemolecules via a peptide elongation approach. Colloids andSurfaces B: Biointerfaces 28:199–207
Faraji AH, Wipf P (2009) Nanoparticles in cellular drug delivery.Bioorg Med Chem 17:2950–2962
Ghiringhelli F, Puig PE, Roux S, Parcellier A, Schmitt E, Solary E et al(2005) Tumor cells convert immature myeloid dendritic cells intoTGF-β-secreting cells inducing CD4+ CD25+ regulatory T cellproliferation. J Exp Med 202:919–929
Ghosh P, Han G, De M, Kim CK, Rotello VM (2008) Goldnanoparticles in delivery applications. Adv Drug Deliver Rev60:1307–1315
Giri B, Gomes A, Debnath A, Saha A, Biswas AK, Dasgupta SC et al(2006) Antiproliferative, cytotoxic and apoptogenic activity ofIndian toad (Bufo melanostictus, Schneider) skin extract onU937 and K562 cells. Toxicon 48:388–400
Gomes A, Roy Choudhury S, Saha A, Mishra R, Giri B, Biswas AK,Debnath A, Gomes A (2007) A heat stable protein toxin (drCT-I)from the Indian Viper (Daboia russelli russelli) venom havingantiproliferative, cytotoxic and apoptotic activities. Toxicon49:46–56
Gomes et al (2010) Anticancer potential of animal venoms and toxins.Ind J Exp Biol 48:93–103
Heise PJ, Maxson LR, Dowling HG, Hedges SB (1995) Higher-levelsnake phylogeny inferred from mitochondrial DNA sequences of12s rRNA genes. Mol Biol Evol 12:259–265
Higuchi M, Ushiba K, Kawaguchi M (2007) Structural control ofpeptide-coated gold nanoparticle assemblies by the conformation-al transition of surface peptides. J Colloid Interface Sci 308:356–363
Holm M, Thomson M, Hoyer M, Hokland P (1998) Optimization of aflow cytometric method for the simultaneous measurement of cellsurface antigen, DNA content and in vitro BrdU incorporation intonormal and malignant hematopoietic cells. Cytometry 32:28–36
Hosta L, Pla-Roca M, Arbiol J, Iglesias CL, Samitier J, Cruz LJ et al(2009) Conjugation of Kahalalide F with gold nanoparticles toenhance in vitro antitumoral activity. Bioconjugate Chem 20:138–146
Hu CMJ, Zhang L (2012) Nanoparticle-based combination therapytoward overcoming drug resistance in cancer. Biochem Pharmacol83:1104–1111
Hui RC, Francis RE, Guest SK, Costa JR, Gomes AS, Myatt SS et al(2008) Doxorubicin activates FOXO3a to induce the expressionof multidrug resistance gene ABCB1 (MDR1) in K562 leukemiccells. Mol Cancer Ther 7:670–678
Jayat C, Ratinaud MH (1993) Cell cycle analysis by flow cytometry:principles and applications. Biol Cell 78:15–25
Kaufmann SH, Hengartner MO (2011) Pogrammed cell death: aliveand well in the new millennium. Trends Cell Biol 11:526–534
Laemmli UK (1970) Cleavage of structural proteins during the assem-bly of the head of bacteriophage T4. Nature 227:680–685
Lin PJ, Yang SJ, Lee WJ, Hsieh TW, Chung GJ (2006) Berberineinduces cell cycle arrest and apoptosis in human gastric carcinomaSNU-5 cell line. World J Gastroenterol 12:21–28
Liu Y, Shipton MK, Ryan J, Kaufman ED, Franzen S, Feldheim DL(2007) Synthesis, stability, and cellular internalization of goldnanoparticles containing mixed peptide-poly(ethylene glycol)monolayers. Anal Chem 79:2221–2229
Lowry OH, Rosebrough NJ, Farr AL, Randall RJ (1951) Proteinmeasurement with the folin phenol reagent. J Biol Chem193:265–275
Luo H, Li J, Chen X (2009) Antitumor effect of N-succinyl-chitosannanoparticles on K562 cells. Biomed Pharmacother 64:521–526
Newman DJ, Cragg GM, Snader KM (2003) Natural products assources of new drugs over the period 1981–2002. J Nat Prod66:1022–1037
Olmedo I, Araya E, Sanz F, Medina E, Arbiol J, Toledo P, Alvarez-Lueje A, Giralt E, Kogan J (2008) How changes in the sequenceof the peptide CLPFFD-NH2 can modify the conjugation andstability of gold nanoparticle and their affinity for β-amyloidfibrils. J Am Chem Soc 128:1154–1162
Palma E, Leporatti S, de Luca E, di Renzo N, Mafia M, Ganbacorti-Passerini C et al (2010) Imatinib-loaded polyelectrolyte micro-capsules for sustained targeting of BCR-ABL+ leukemia stemcells. Nanomedicine (Lond) 5:419–431
Ross JS, Linette GP, Stec J, Ross MS, Anwar S, Boguniewicz A (2003)DNA ploidy and cell cycle analysis in breast cancer. Am J ClinPathol 120:S72–S84
Roy S, Besra SE, De T, Banerjee B, Mukherjee J, Vedasiromoni JR(2008) Induction of apoptosis in human leukemic cell lines U937,K562 and HL-60 by Litchi chinensis leaf extract via activation ofmitochondria mediated caspase cascades. The Open Leukemia J1:1–14
Sahoo SK, Labhasetwar V (2005) Enhanced anti-proliferative activityof transferring conjugated paclitaxel loaded nanoparticle is medi-ated via sustained intracellular drug retention. Mol Pharm 2:373–383
Samal KA, Sreeprasad ST, Praddep T (2010) Investigation of role ofNaBH4 in the chemical synthesis of gold nanorods. J NanopartRes 12:1777–1786
Sargent MJ, Taylor GC (1989) Appraisal of the MTT assay as a rapidtest of chemosensitivity in acute myeloid leukaemia. Br J Cancer60:206–210
Sau TK, Pal A, Jana NR, Wang ZL, Pal T (2001) Size controlledsynthesis of gold nanoparticles using photo chemically preparedseed particles. J Nanopart Res 3:257–261
54 T. Bhowmik et al.

Shapiro GI, Harper JW (1999) Anticancer drug targets: cell cycle andcheckpoint control. J Clin Invest 104:1645–1653
Shi W, Sahoo Y, Swihart MT (2004) Gold nanoparticles surface-terminated with bifunctional ligands. Coll Surf A PhysicochemEng Aspects 246:109–113
Sobczak-Kupiec A, Malina D, Zimowska M, Wzorek Z (2011)Characterization of gold nanoparticle for various medical appli-cation. Dig J Nanomat Biostruc 6:803–808
Thatte U, Bagadey S, Dahanukar S (2000) Modulation of programmedcell death by medicinal plant. Cell Mol Biol 46:199–214
Tiwari PM, Vig K, Dennis VA, Singh SR (2011) Functionalized goldnanoparticles and their biomedical applications. Nanomaterials1:31–63
Tong XH, Lin SG, Fujii M, Hou DX (2004) Molecular mechanisms ofechinocystic acid induced apoptosis in HepG2 cells. BiochemBiophys Res Commun 321:539–546
Triulzi RC, Dai Q, Zoub J, Leblanc RM, Gud Q, Orbulescu J, Huob Q(2008) Photothermal ablation of amyloid aggregates by goldnanoparticles. Coll Surf B Biointerf 63:200–208
Tu AT (1988) Snake venoms: general background and composition.Venoms chemistry and molecular biology. Wiley, New York, pp 1–19
Wang X, Wang Y, Chen ZG, Shin DM (2009) Advances of cancertherapy by nanotechnology. Cancer Res Treat 41:1–11
Yang X, Koh CG, Liu S, Pan X, Santhanam R, Yu B et al (2009)Transferring receptor targeted lipid nanoparticles for delivery ofan antisense oligodeoxyribonucleotide against Bcl-2. Mol Pharm6:221–230
Zhang L, Cui L (2007) A cytotoxin isolated from agkistrodon acutussnake venom induces apoptosis via Fas pathway in A549 cells.Toxicol In Vitro 21:1095–1103
Zubarev RE, Xu J, Sayyad A, Gibson DJ (2006) Amphiphilic goldnanoparticles with V-shaped arms. J Am Chem Soc 128:4959–4974
GNP-NKCT1 inhibits leukemia 55