anti-counterfeiting business case report - · pdf filebridge – building radio frequency...
TRANSCRIPT

Building Radio frequency IDentification for the Global Environment
Anti-counterfeiting Business Case Report
Authors: Mikko Lehtonen (ETH Zürich), Jasser Al-Kassab (SAP), Florian Michahelles (ETH Zürich), Oliver Kasten (SAP)
December 2007 This work has been partly funded by the European Commission contract No: IST-2005-033546

About the BRIDGE Project: BRIDGE (Building Radio frequency IDentification for the Global Environment) is a 13 million Euro RFID project running over 3 years and partly funded (€7,5 million) by the European Union. The objective of the BRIDGE project is to research, develop and implement tools to enable the deployment of EPCglobal applications in Europe. Thirty interdisciplinary partners from 12 countries (Europe and Asia) are working together on : Hardware development, Serial Look-up Service, Serial-Level Supply Chain Control, Security; Anti-counterfeiting, Drug Pedigree, Supply Chain Management, Manufacturing Process, Reusable Asset Management, Products in Service, Item Level Tagging for non-food items as well as Dissemination tools, Education material and Policy recommendations. For more information on the BRIDGE project: www.bridge-project.eu This document results from work being done in the framework of the BRIDGE project. It does not represent an official deliverable formally approved by the European Commission. This document: In this report we outline the findings from WP5 Task 3 of the BRIDGE project. The overall goal of this deliverable is to evaluate the business case of anti-counterfeiting applications in order to support affected manufacturers and brand owners in their decision on the application of EPC/RFID technology in the fight against illicit trade.
Disclaimer: Copyright 2007 by (ETH Zurich, SAP) All rights reserved. The information in this document is proprietary to these BRIDGE consortium members This document contains preliminary information and is not subject to any license agreement or any other agreement as between with respect to the above referenced consortium members. This document contains only intended strategies, developments, and/or functionalities and is not intended to be binding on any of the above referenced consortium members (either jointly or severally) with respect to any particular course of business, product strategy, and/or development of the above referenced consortium members. To the maximum extent allowed under applicable law, the above referenced consortium members assume no responsibility for errors or omissions in this document. The above referenced consortium members do not warrant the accuracy or completeness of the information, text, graphics, links, or other items contained within this material. This document is provided without a warranty of any kind, either express or implied, including but not limited to the implied warranties of merchantability, satisfactory quality, fitness for a particular purpose, or non-infringement. No licence to any underlying IPR is granted or to be implied from any use or reliance on the information contained within or accessed through this document. The above referenced consortium members shall have no liability for damages of any kind including without limitation direct, special, indirect, or consequential damages that may result from the use of these materials. This limitation shall not apply in cases of intentional or gross negligence. Because some jurisdictions do not allow the exclusion or limitation of liability for consequential or incidental damages, the above limitation may not apply to you. The statutory liability for personal injury and defective products is not affected. The above referenced consortium members have no control over the information that you may access through the use of hot links contained in these materials and does not endorse your use of third-party Web pages nor provide any warranty whatsoever relating to third-party Web pages.

BRIDGE – Building Radio frequency IDentification solutions for the Global Environment
D5.3 Anti-counterfeiting Business Case Report 3/79 December 2007
Executive Summary
In this report we outline the findings from WP5 Task 3 of the BRIDGE project. The overall
goal of this deliverable is to evaluate the business case of anti-counterfeiting applications in
order to support affected manufacturers and brand owners in their decision on the application
of EPC/RFID technology in the fight against illicit trade.
We first evaluate how various product authentication technologies (barcodes, different RFID-
based approaches, direct object authentication, etc.) meet the requirements of several
industries (namely the automotive, aerospace, pharmaceutical, consumer goods, and IT
industry). The suitability of a technology is assessed by quantifying the properties of the
technology and the requirements of the industries as well as by evaluating how well
technology and industry match. The results suggest that RFID and track-and-trace based
product authentication methods meet the requirements of the considered industries, though
in some cases (particularly the consumer goods and IT industries) also other product
authentication techniques appear equally suitable.
Next, we provide a cost calculator for RFID/EPC-based anti-counterfeiting systems. We
identify different cost categories, differentiating between costs that are specific to anti-
counterfeiting activities and costs that are generic to all RFID-enabled business applications.
We present cost calculations for two exemplary cases: (1) item-level tagging for luxury goods
and (2) case-level tagging for fast-moving consumer goods. The exemplary cost calculations
show that anti-counterfeiting specific costs (inspection and reaction costs) account for almost
half of the overall cost.
Current literature does not provide means to estimate the financial benefits of a product
authentication application. Therefore we first build a benefit-estimation framework where
these benefits can be evaluated. Then we derive a method for quantifying the level of
security provided by the examined product-authentication techniques in a supply chain
environment. Example calculations of the level of security in our two cases suggest that
RFID and track-and-trace based product authentication is a very cost-efficient approach. The
marginal increase in the level of security of cryptographic tag authentication is very small,
given the assumed 0.50 EUR overhead of cryptographic UHF transponder. This finding is
based on the assumption that track-and-trace based checks can detect 66% of cloned
transponders in a supply chain. We believe that this assumption is conservative and it will be
assessed in greater detail in the upcoming deliverable D5.4.
Finally, our SWOT analysis suggests that RFID-based anti-counterfeiting solution is
financially most attractive when used in a combination with other business applications and
for a large number of checks. Furthermore, the potential weaknesses can be addressed
through careful security engineering and by avoiding pitfalls in the implementation.

BRIDGE – Building Radio frequency IDentification solutions for the Global Environment
D5.3 Anti-counterfeiting Business Case Report 4/79 December 2007
Table of Contents
EXECUTIVE SUMMARY .................................................................................................................................... 3
1 INTRODUCTION ......................................................................................................................................... 8
1.1 GOALS OF THIS REPORT........................................................................................................................ 9
1.2 METHODOLOGY ..................................................................................................................................... 9
1.3 STRUCTURE OF THIS REPORT ..............................................................................................................10
2 ANTI-COUNTERFEITING TECHNOLOGIES DESCRIPTION............................................................11
2.1 DESCRIPTION OF AUTO-ID BASED ANTI-COUNTERFEITING TECHNOLOGIES ......................................11
2.1.1 RFID or Barcode and track and trace.........................................................................................11
2.1.2 RFID and Weak Authentication ...................................................................................................11
2.1.3 RFID and Object Specific Features ............................................................................................12
2.1.4 RFID and Cryptographic Tag Authentication.............................................................................12
2.1.5 RFID e-pedigree ............................................................................................................................12
2.1.6 Verification of Unique Identifiers based on RFID......................................................................13
2.2 CONVENTIONAL ANTI-COUNTERFEITING TECHNOLOGIES ...................................................................13
2.2.1 Direct Authentication .....................................................................................................................13
2.2.2 Authentication Based on Difficult-to-Reproduce Physical Features ......................................14
2.2.3 Verification of Products with Unique Identifiers.........................................................................14
3 METHODOLOGY FOR TECHNOLOGY-SELECTION.........................................................................15
3.1 GOAL OF THE TECHNOLOGY-SELECTION.............................................................................................15
3.2 METHODOLOGY DESCRIPTION .............................................................................................................16
4 IDENTIFICATION OF ANTI-COUNTERFEITING APPROACHES FOR SELECTED
INDUSTRIES .......................................................................................................................................................19
4.1 INTRODUCTION OF IDENTIFICATION CRITERIA SETS............................................................................19
4.2 SUMMARY OF TECHNOLOGY CHARACTERISTICS.................................................................................28
4.3 INDUSTRY-SPECIFIC REQUIREMENTS ..................................................................................................29
4.3.1 Automotive Industry ......................................................................................................................29
4.3.2 Aerospace Industry .......................................................................................................................30
4.3.3 Pharmaceutical Industry ...............................................................................................................31
4.3.4 Consumer Goods and Retail Industry ........................................................................................32
4.3.5 Information Technology Industry .................................................................................................33
4.3.6 Summary Industry Requirements................................................................................................34
4.4 IMPORTANCE VALUES...........................................................................................................................35
4.4.1 Automotive Industry Importance Values ....................................................................................35
4.4.2 Aerospace Industry Importance Values .....................................................................................36
4.4.3 Pharmaceutical Industry Importance Values .............................................................................37
4.4.4 Consumer Goods and Retail Industry Importance Values ......................................................38
4.4.5 Information Technology Industry Importance Values...............................................................38
4.4.6 Technology-Industry Matching and Discussion ........................................................................39
4.5 SUMMARY OF SELECTION MATRIX FINDINGS ......................................................................................43
5 COST SIDE CALCULATIONS .................................................................................................................46
5.1 SOLUTION CONCEPT.............................................................................................................................46

BRIDGE – Building Radio frequency IDentification solutions for the Global Environment
D5.3 Anti-counterfeiting Business Case Report 5/79 December 2007
5.2 COST CALCULATOR ..............................................................................................................................47
5.3 CASE 1 – ACME LUXURY GOODS.......................................................................................................50
5.3.1 Description......................................................................................................................................50
5.3.2 Findings...........................................................................................................................................54
5.4 CASE 2 – ACME CONSUMER GOODS .................................................................................................54
5.4.1 Description......................................................................................................................................54
5.4.2 Findings...........................................................................................................................................59
6 BENEFIT SIDE CALCULATIONS ...........................................................................................................60
6.1 QUANTIFYING THE LEVEL OF SECURITY ..............................................................................................62
6.2 CASE 1 – ACME LUXURY GOODS.......................................................................................................68
6.3 CASE 2 – ACME CONSUMER GOODS .................................................................................................69
6.4 FINDINGS ..............................................................................................................................................71
7 SWOT ANALYSIS......................................................................................................................................72
8 DISCUSSION ..............................................................................................................................................75
REFERENCES ....................................................................................................................................................76
APPENDIX A – COST OF GEN-2 TAGS........................................................................................................78
APPENDIX B – SELECTION MATRIX VALUES ..........................................................................................79

BRIDGE – Building Radio frequency IDentification solutions for the Global Environment
D5.3 Anti-counterfeiting Business Case Report 6/79 December 2007
Table of Figures
FIGURE 1. THE ASSUMED ARCHITECTURE FOR TRACK AND TRACE BASED PLAUSIBILITY CHECKS (FOR MORE
DETAILS SEE D5.2 – ANTI-COUNTERFEITING REQUIREMENTS REPORT) ....................................................47
FIGURE 2. COST BENEFIT MODEL OF INVESTMENT IN SECURITY. THE TERMS IN PARENTHESES REPRESENT THE
METRICS HOW DIFFERENT ELEMENTS ARE MEASURED.................................................................................60
FIGURE 3. THE PROCESS OF SECURITY ................................................................................................................61
FIGURE 4. MODEL OF A DISTRIBUTION CHANNEL ..................................................................................................62
FIGURE 5. EXAMPLE FREQUENCIES OF ATTACK TYPES OF COUNTERFEIT PRODUCTS. AN AFFECTED COMPANY
MUST REVISE THESE NUMBERS BASED ON INTERNAL SEIZE STATISTICS TO CUSTOMIZE THE CALCULATION.
.......................................................................................................................................................................66
FIGURE 6. LEVEL OF SECURITY (PROBABILITY THAT A COUNTERFEIT PRODUCT IS DETECTED) IN THE LICIT
SUPPLY CHAIN VERSUS COST OF DIFFERENT PRODUCT AUTHENTICATION TECHNIQUES.............................69
FIGURE 7. LEVEL OF SECURITY (PROBABILITY THAT A COUNTERFEIT PRODUCT IS DETECTED) IN THE LICIT
SUPPLY CHAIN VERSUS COST OF DIFFERENT PRODUCT AUTHENTICATION TECHNIQUES.............................70
FIGURE 8. LEVEL OF SECURITY (PROBABILITY THAT A COUNTERFEIT PRODUCT IS DETECTED) IN THE ILLICIT
SUPPLY CHAIN VERSUS COST OF DIFFERENT PRODUCT AUTHENTICATION TECHNIQUES.............................70
FIGURE 9. PRICE OF ALIEN GEN2 SQUIGGLE TAG FOR DIFFERENT PURCHASING QUANTITIES IN
HTTP://WWW.RFIDSUPPLYCHAIN.COM/..........................................................................................................78

BRIDGE – Building Radio frequency IDentification solutions for the Global Environment
D5.3 Anti-counterfeiting Business Case Report 7/79 December 2007
Table of Tables
TABLE 1 EXEMPLARY COMPARISON BETWEEN TECHNOLOGY-PROPERTIES AND INDUSTRY-REQUIREMENTS ...16
TABLE 2 MEETING INDUSTRY-REQUIREMENTS - EXEMPLARY CALCULATION ......................................................17
TABLE 3 EXEMPLARY EVALUATION OF TECHNOLOGY PROPERTIES AND INDUSTRY-REQUIREMENTS ................19
TABLE 4 SUMMARIZING TABLE FOR SOLUTION ASPECTS .....................................................................................23
TABLE 5 SUMMARIZING TABLE FOR SUPPLY CHAIN CHARACTERISTICS ..............................................................24
TABLE 6 SUMMARIZING TABLE FOR PRODUCT CHARACTERISTICS ......................................................................25
TABLE 7 SUMMARIZING TABLE FOR AUTHENTICATION CHARACTERISTICS ..........................................................26
TABLE 8 SUMMARY OF THE AUTOMOTIVE INDUSTRY ............................................................................................29
TABLE 9 SUMMARY OF THE AEROSPACE INDUSTRY .............................................................................................30
TABLE 10 SUMMARY OF THE PHARMACEUTICAL INDUSTRY .................................................................................31
TABLE 11 SUMMARY OF THE CONSUMER GOODS AND RETAIL INDUSTRY...........................................................32
TABLE 12 SUMMARY OF THE INFORMATION TECHNOLOGY INDUSTRY .................................................................33
TABLE 13 IMPORTANCE VECTOR OF THE AUTOMOTIVE INDUSTRY ......................................................................36
TABLE 14 IMPORTANCE VECTOR OF THE AEROSPACE INDUSTRY........................................................................36
TABLE 15 IMPORTANCE VECTOR OF THE PHARMACEUTICAL INDUSTRY ..............................................................37
TABLE 16 IMPORTANCE VECTOR OF THE CONSUMER GOODS AND RETAIL INDUSTRY .......................................38
TABLE 17 IMPORTANCE VECTOR OF THE INFORMATION TECHNOLOGY INDUSTRY ..............................................38
TABLE 18 AGGREGATED IMPORTANCE VALUES FOR ALL CONSIDERED INDUSTRIES ...........................................39
TABLE 19 MATCHING BETWEEN INDUSTRY REQUIREMENTS AND TECHNOLOGY PROPERTIES ...........................44
TABLE 20. COST CALCULATION OF TOTAL ANNUAL COST .....................................................................................52
TABLE 21. BOTTOM-UP CALCULATION OF HARDWARE EXPENSES ........................................................................53
TABLE 22. PRESENT VALUE OF THE CASH FLOWS RESULTING FROM YEARLY COSTS ..........................................53
TABLE 23. SUMMARY OF THE COSTS ....................................................................................................................53
TABLE 24. COST CALCULATION OF TOTAL ANNUAL COST .....................................................................................57
TABLE 25. BOTTOM-UP CALCULATION OF HARDWARE EXPENSES ........................................................................58
TABLE 26. PRESENT VALUE OF THE CASH FLOWS RESULTING FROM YEARLY COSTS ..........................................58
TABLE 27. SUMMARY OF THE COSTS ....................................................................................................................58
TABLE 28. PARAMETERS OF THE METRIC TO ESTIMATE THE LEVEL OF SECURITY ...............................................64
TABLE 29. PROBABILITIES THAT COUNTERFEIT PRODUCTS OF DIFFERENT CATEGORIES (ATTACK TYPE) DO NOT
PASS DIFFERENT PRODUCT AUTHENTICATION CHECKS (CHECK TYPE) ........................................................65
TABLE 30. ESTIMATIONS OF THE LEVEL OF SECURITY OF DIFFERENT PRODUCT AUTHENTICATION TECHNIQUES
.......................................................................................................................................................................68
BRIDGE – Building Radio frequency IDentification solutions for the Global Environment
D5.3 Anti-counterfeiting Business Case Report 8/79 December 2007
1 Introduction
In the previous deliverables of BRIDGE WP5 Anti-Counterfeiting, we analyzed and described
the industry-specific problem of counterfeiting (D5.1 Problem Analysis Report on Illicit Trade,
[15]) and gathered industry-specific requirements for a technical product authentication
solution (D5.2 Anti-Counterfeiting Requirements Report, [3]). This deliverable deals with the
business case of anti-counterfeiting by investigating the costs and benefits of investments in
a product-authentication solution. To address the cost side, we derive a calculation tool that
can be used to assess the total cost of a track and trace based product authentication
system. Example cost calculations are provided for two exemplary companies from different
industries.
Addressing the benefit side in anti-counterfeiting business case is extremely challenging.
This is explained by certain characteristics of the problem. First, in contrast to most other
business applications such as logistics and fixed asset management, the mechanisms that
lead to the final financial benefits are not yet well known for product authentication. More
precisely, this is the case with for example increased reputation and goodwill due to lesser
amount of counterfeits. Second, some of the important factors on the benefit side are very
hard to quantify, such as the cost of human life when it comes to patient or passenger safety.
Third, the benefits are always linked to the level of security of the product authentication
solution, but the state-of-the-art literature provides only little help to assess or quantify
security in product authentication. Moreover, investment in an anti-counterfeiting system is
an investment in security. This is because the anti-counterfeiting system protects a
company’s distribution channel, reputation, and clients (in general: assets) from
counterfeiters (in general: adversaries). The general motivation to invest in security is to
mitigate the negative effects of adversaries’ actions. Thus, the benefits in anti-counterfeiting
investments depend on the actions of the adversaries. Therefore the presented business
case calculation differs profoundly from those RFID applications where the motivation to
invest is to increase efficiency and effectiveness of existing processes.
Owing to the above mentioned challenges and gaps in the state-of-the-art literature, our
contribution regarding the benefit side in this deliverable is twofold. On the one hand, we
provide an explanatory model for the benefit side of an anti-counterfeiting investment. On the
other hand, we provide a method to quantify the level of security of a product authentication
solution. Even though the provided analysis does not yield estimations of the final financial
benefits of a product authentication solution, a method to quantify the level of security of a
product authentication solution is highly beneficial when comparing different technologies
regarding the investment decision. Furthermore, the efforts to assess the benefit side in anti-
counterfeiting will continue in the related European research project SToP (see
http://www.stop-project.eu/) in order to enable the quantification of the final financial benefits.
Although BRIDGE WP5 deals uniquely with anti-counterfeiting based on RFID-technology,
more precisely on track and trace based checks, we also considered conventional
countermeasures in order to show against which other technologies Auto-ID-based anti-
counterfeiting solutions are “competing”. By the means of 16 criteria, applied on thirteen

BRIDGE – Building Radio frequency IDentification solutions for the Global Environment
D5.3 Anti-counterfeiting Business Case Report 9/79 December 2007
different anti-counterfeiting approaches and requirements of five industries, we address the
following three questions: i) “To which extent do the described technologies meet industries’
requirements in general?”, ii) “With which other technologies are they competing?”, and iii)
“Where are Auto-ID based technologies at their best?”.
For the information on industries’ requirements we used data from the previous BRIDGE
WP5 deliverables and from interviews which were conducted in the scope of this report. As in
the previous deliverable (requirements report), we consider the following five industries:
automotive, aerospace, pharmaceutical, consumer goods & retail and the information
technology industry. Moreover, the interviews confirmed that the majority of the considered
industries will not introduce an RFID-based solution purely for the usage in anti-
counterfeiting. Additional applications such as targeted product recall or for example
optimizations of supply chains will be possible, once a system such as EPCglobal is in place.
1.1 Goals of this report
The goals of this report are to provide affected companies with the necessary tools to
evaluate the business case of using EPC/RFID in product authentication. Since the goal of
this work package is not to assess the business case of anti-counterfeiting in any particular
setting but in general terms, the provided case calculations only serve as examples of how
these tools can be applied. Affected companies are furthermore provided an overview of anti-
counterfeiting approaches. The provided tools include:
• Cost calculation tool,
• Method to quantify the level of security (i.e. benefit calculation), and
• SWOT analysis.
1.2 Methodology
The different cost categories of the track and trace based anti-counterfeiting solution are
identified based on the assumed solution concept. The example cost calculations are
provided for two imaginary companies that represent a large manufacturer of luxury goods
and a medium manufacturer of fast moving consumer goods. The cost categories are
estimated based on literature sources and publicly available information. Findings are drawn
based on the general results of the example cases. Owing to the fact that the example cases
do not include an estimation of benefits in terms of future cash flows due to anti-
counterfeiting activities (i.e., increased sales), the net present value of the complete
investment cannot be calculated. Therefore only the present value of the costs is given.
Because the RFID system is to be used in multiple applications, we make difference between
general RFID system costs and anti-counterfeiting activities-specific costs. This division
helps to understand the nature of an EPC/RFID investment where the costs are covered by
the benefits of multiple business applications. It is important to note that we assume that all
costs are covered by the manufacturer, but some of them (such as hardware and software
costs for readers) may be allocated to the supply chain partner as well.

BRIDGE – Building Radio frequency IDentification solutions for the Global Environment
D5.3 Anti-counterfeiting Business Case Report 10/79 December 2007
1.3 Structure of this report
This report is organized as follows. Section 2 begins by presenting the technical anti-
counterfeiting approaches. We make difference between Auto-ID based approaches and
other, conventional approaches. In Sections 3-4 suitable anti-counterfeiting approaches are
identified for different industries based on a technology selection methodology. The resulting
evaluation of the suitability of different techniques in different industries is summarized in
Table 19, page 44. Section 5 continues by presenting the cost calculator of EPC/RFID based
product authentication system by identifying the different cost categories. Section 5 further
illustrates the calculations by providing two example companies, item-level tagging in luxury
goods industry and case-level tagging in consumer goods industry. Methodology to estimate
the benefit side with the focus on quantifying the level of security of product authentication in
supply chain is presented in Section 6 with example calculations for the two case companies.
We analyze the investment in RFID based product authentication system from a strategic
perspective by providing a SWOT analysis in Section 7 and we conclude with a discussion.

BRIDGE – Building Radio frequency IDentification solutions for the Global Environment
D5.3 Anti-counterfeiting Business Case Report 11/79 December 2007
2 Anti-Counterfeiting Technologies Description
In this section we present and briefly describe thirteen commonly used anti-counterfeiting
technologies, both, based on Auto-ID-technology and conventional approaches. These
technologies are described in BRIDGE deliverables “D5.2- Anti-counterfeiting Requirements
Report” [3], “D6.2 Pharma Traceability Pilot” [8], in SToP deliverables “D3.1-Report on
relevant state-of-the-art research, existing technologies and products” [13], “D4.1-Report and
Analysis on State-of-the-Art Tagging Technologies Specific to the SToP Project
Requirements” [9], and from several scientific publications (see references in the text).
Although BRIDGE uniquely deals with anti-counterfeiting based on RFID-technology, more
precisely on RFID- and track-and-trace based solutions, we will also consider conventional
countermeasures in order to show with which other technologies Auto-ID-based anti-
counterfeiting solutions are “competing” and in order to find out, (i) to which extent do the
described technologies meet industries’ requirements in general?, (ii) with which other
technologies are they competing?, and (iii) where are Auto-ID based technologies at their
best?
In the following subsection we start with the presentation of Auto-ID based approaches.
2.1 Description of Auto-ID based Anti-Counterfeiting Technologies
2.1.1 RFID or Barcode and track and trace
This work package explores how track and trace data, which originates from reading unique
products at different locations in a supply chain, can be used to detect suspicious
movements of products (e.g., [1]). In general, track and trace data can either be obtained by
using barcodes (like the Data Matrix), alphanumeric codes or RFID tags. When using RFID
tags, trace data can be either stored directly on the tag or on the network. In some cases,
both methods can be included in an integrated approach [2]. Special algorithms can be
applied in order to detect illicit trading activities and counterfeit products based on this data.
These techniques will be discussed in more details in the following deliverable of this work
package, D5.4. Though detected cloned tags are clear evidence for counterfeits, also other
“irregularities” in the track and trace data can give hints regarding illicit activities. Deviations
from assumed standard supply chain transactions can be investigated in more detail,
potentially supported by conventional anti-counterfeiting technologies.
2.1.2 RFID and Weak Authentication
Matching the transponder identification number (TID) of the RFID tag with the EPC number
which is stored on the tag is denoted as “weak authentication”, in contrast to the “strong
authentication” which is based on cryptographic algorithms (see below). The weak
authentication approach, however, already poses a barrier to counterfeiters against tag
cloning. This approach differs from the verification of unique identifiers explained above
insofar, as the tag-id of the RFID hardware has to match the EPC number, which is stored on
the tag, for example (see also [3, 4]).

BRIDGE – Building Radio frequency IDentification solutions for the Global Environment
D5.3 Anti-counterfeiting Business Case Report 12/79 December 2007
2.1.3 RFID and Object Specific Features
RFID tags can be detached and reapplied to other, possibly counterfeit objects. In order to
anticipate this practice, [5] proposes to store object specific information, along with the tag
identification number, the item-level number such as the EPC number and other information
on the tag. These feature information can describe the size, weight, color, structure of the
object (physical properties) and/or the ingredients, contents of the object (chemical
properties), which are very specific to the object.
Whenever a product has to be checked for authenticity, its actual chemical and physical
features can be matched with the data stored on the tag. In other words, this is direct object
authentication (2.2.1) which is powered by RFID-technology. The security is based on the
fact that the object specific features are hard to replicate. However, the features are
potentially also hard to check. Until now, this approach is just a concept and has not yet been
applied.
2.1.4 RFID and Cryptographic Tag Authentication
The purpose of a cryptographic tag is the authentication of the tag itself, i.e. the verifying
party gets a strong proof of the tag’s identity. From a cryptographic point of view, this is
possible by employing an authentication protocol. A secret key embedded within an RFID-tag
can serve as an authenticating feature. Several protocols exist for authenticating RFID-tags.
A survey can be found in [6]. According to [7], there are two basic possibilities for such
protocols: (i) password-based protocols and (ii) challenge response protocols. Tag costs of
cryptographic tags are higher than the costs of normal tags. Cryptographic tags for UHF are
not yet available. For more information about the cryptographic tag authentication, please
also refer to BRIDGE deliverables D4.1.1, D4.2.1, D5.2 [3], and to SToP deliverable D3.1
[13].
2.1.5 RFID e-pedigree
Pedigrees are an important topic for the pharmaceutical industry, especially in the United
States of America, where federal law requires drug pedigrees since December 2006. A
pedigree is a statement of origin that identifies each prior sale, purchase, and trade of a
product, including the date of those transactions as well as the names and addresses of all
parties involved. The term electronic pedigree, although in most cases used in the context of
pharmaceuticals, in general represents the complete history of the chain of custody of a
product in electronic form. An electronic pedigree, for example, could contain the business
name and address of each supply chain partner through whose ownership the product
passed [8]. To protect such an electronic pedigree from manipulations, each partner has a
valid digital certificate to sign the updated pedigree with its digital signature. These pedigrees
are usually transmitted in advance to the next partner within the supply chain. When the
shipped products arrive at their destination, their unique identifiers are compared to the ones
on the verified electronic pedigrees and thus authenticated. This technique is well suited for
use with RFID tags as the authentication process can be automated to a large degree ([9, p.
24-26]).

BRIDGE – Building Radio frequency IDentification solutions for the Global Environment
D5.3 Anti-counterfeiting Business Case Report 13/79 December 2007
One of the major drawbacks with this form of ‘non-networked’ system, however, is that the
pedigree can be copied, which represents a security problem of this approach. Moreover, a
data replication occurs, since at each point where an addition to the pedigree is required, the
entire collection of previous documents has to be added to the document. Thus, by the time
the pedigree is complete it contains many duplicate information (see also [8]).
Pedigrees are an important topic for the pharmaceutical industry, especially in the United
States of America, where federal law requires drug pedigrees since December 2006. In
addition, a majority of states have more stringent pedigree requirements than those stated in
the Prescription Drug Marketing Act (PDMA) and its amendments [10]. These pedigree
regulations do not demand electronic pedigrees, although there are many advantages in
comparison to paper-based pedigrees. EPCglobal has recently released Version 1.0 of an
electronic pedigree standard (see also [11] for more discussion).
Important to notice is that legislation in some states includes item-level product tracking
while, for example, Florida requires only electronic shipping-notice verification. Thus, there
are two important definitions of electronic pedigree today. The first type, a serialized RFID
approach, gives each product its own specific number which can be automatically captured
as the product moves from one point in the supply chain to the next. The second, a simple
file management approach, does not require product serialization [12].
2.1.6 Verification of Unique Identifiers based on RFID
Unique identifiers can be used to detect counterfeit products as well as to detect grey market activities. This can be done by choosing a numbering technique that is difficult to apply for illicit actors, but easy to check for supply chain partners or end users. For the storage of the unique identifier, either 2D barcodes or RFID tags can be used [13].
The basic operating principal of a unique ID system is quite simple: The manufacturer
generates a random number, writes it to the data carrier (RFID or barcode) and stores it in a
database. When the product ID is checked, e.g., in a store or at customs, a reader device
retrieves the product ID, sends it to a service offered by the manufacturer (or an IT provider),
which looks up the number in the database and returns the result to the reader device. An
operational implementation, however, should provide additional features such as a system
for user-access management that prevents illicit actors from discovering licit numbers or
competitors from monitoring the flow of goods. When the system is applied by a larger
number of vendors, the access management equally becomes more complex. Therefore, the
whole system should contain an access management lookup system which allows the
readers to retrieve the corresponding addresses and credentials from known online sources.
2.2 Conventional Anti-Counterfeiting Technologies
2.2.1 Direct Authentication
Direct authentication is based on something a product is, i.e. on a product’s inherent feature.
The exploitation of a natural product property distinguishes direct authentication from all
other authentication approaches described, as they are based on an artificial feature that is
added to a product with the purpose of enabling authentication. Therefore, the authentication

BRIDGE – Building Radio frequency IDentification solutions for the Global Environment
D5.3 Anti-counterfeiting Business Case Report 14/79 December 2007
is based on a set of properties that a product has. Ideally, the property (or their combination)
should be (i) unique to every single item, (ii) inimitable, i.e. should not be cloneable or easy
to reengineer, and (iii) stable, for example, it should not change during the product’s lifecycle.
The product properties that can be measured for authentication purposes are very diverse
and include: (i) physical properties (e.g., weight, density, etc.), (ii) chemical properties (e.g.,
chemical properties, ingredients, composition, etc.) and (iii) visual properties, either the
general appearance of a product or on characteristics measured on a microscopic level, e.g.,
the surface structure of a product, etc.
Relevant technologies for direct authentication that will be considered in this report comprise:
Manual photo comparison: the product at hand is compared to a photo of a genuine product
which is provided, e.g., by the manufacturer or by the brand owner.
Surface analysis with laser technology, e.g., with the LSA technology (laser-surface-
authentication) [14]: a fingerprint of a laser scan of the surface structure of a product is
captured at manufacturing time and is stored in a database. The fingerprint is unique to an
individual product and can later be used for authentication purposes. However, checking the
authenticity of a product then requires again a special laser device.
Forensic analysis of chemical and physical product characteristics, such as weight, color,
and chemical composition of the physical product. For more detailed information please refer
to [13, p. 13-15].
2.2.2 Authentication Based on Difficult-to-Reproduce Physical Features
This authentication approach is based on something the product has, i.e. on an artificial
feature that is in or on the product. The presence of the feature has to be checked first, and
in the next step its authenticity has to be evaluated. Examples include security printings,
holograms (optical overt features), microscopic particles, microprinting and labels (optical
covert), digital watermarks, copy detection patters (CDP) (digital covert) and taggants (covert
forensic) features (please refer to [13], for more detailed information).
2.2.3 Verification of Products with Unique Identifiers
As already stated above, the verification of unique identifiers can also be performed using
barcodes.

BRIDGE – Building Radio frequency IDentification solutions for the Global Environment
D5.3 Anti-counterfeiting Business Case Report 15/79 December 2007
3 Methodology for Technology-Selection
3.1 Goal of the Technology-Selection
Having introduced and described Auto-ID based and non Auto-ID based anti-counterfeiting
solutions in the previous section, this section deals with three questions:
1. To which extent do the described technologies meet industries’ requirements?
For the information on industries’ requirements we use data gathered in the scope of the
requirements analysis [3]. Here again, we consider the industries: automotive,
aerospace, pharmaceutical, consumer goods and retail and the information technology
industry. We want to provide a match between the technologies and the industry-specific
requirements.
2. Where are Auto-ID based technologies at their best?
We learned that the introduction of RFID-technology is not uniquely motivated by anti-
counterfeiting. However, the application of anti-counterfeiting will be an incentive for
companies and respectively industries to introduce this technology. We want to find out,
for which industry it makes most sense to use RFID-based anti-counterfeiting solutions in
general, and RFID- and track-and-trace based solutions in particular.
3. Which are the competing approaches?
We are equally interested, with which other approaches, Auto-ID and RFID-based
solutions are competing. This information can help us to improve our RFID-based anti-
counterfeiting solutions.
The result of this section will be an industry-technology matching, summarized in Table 19,
showing the most suitable anti-counterfeiting approach for each industry. The basic idea
behind this approach is that counterfeiting is industry-specific [15] and that anti-counterfeiting
solutions, in turn, should equally take industry requirements into account.
Taking the pharmaceutical industry as an example: we learned from industry-interviews,
which were conducted in the scope of the requirements analysis [3] that supply chains are
complex, including many actors and repackaging activities. The number of potential entry
points of counterfeit products are much higher than those in the other industries under
consideration (see also [16] and [17]). Moreover, the industry is subject to national and
international regulations that foresee the application of the ePedigree solution. The
requirements of the pharmaceutical therefore differ extremely from those in the automotive
industry for example, where supply chains are less complex, margins are lower and where
products like automotive spare parts are traded without packaging.
In order to answer the above stated questions, in this section, we present a methodology to
assess the suitability of a given technology for a given industry. The idea of the methodology
is to find the best matching of a technology to industry requirements. Some of the questions
include aspects concerning costs of the solution, supply chain characteristics, product
characteristics and aspects concerning legal compliance.

BRIDGE – Building Radio frequency IDentification solutions for the Global Environment
D5.3 Anti-counterfeiting Business Case Report 16/79 December 2007
3.2 Methodology Description
For the purpose of matching anti-counterfeiting technologies’ properties with industries’ requirements, we utilize a methodology that we describe in this section. From industry-interviews that we conducted in the scope of BRIDGE (for deliverables D5.2 Anti-counterfeiting Requirements Report [3], D2.1 Requirements document of serial level lookup service for various industries [18]), and SToP (for deliverables D3.1-Report on relevant state-of-the-art research, existing technologies and products [13] and D4.1-Report and Analysis on State-of-the-Art Tagging Technologies Specific to the SToP Project Requirements [9]), we deduced 16 evaluation criteria in total, categorized into five sets, each containing 2-5 questions.
All considered technologies will be judged according to their degree of fulfillment concerning
these criteria. Furthermore, all industries will be assessed, according to the findings in the
previous deliverables, concerning their requirements regarding the same set of criteria. For
each criterion, an industry-value and a technology-value are assigned, illustrated in “vectors”
of values for each industry and each technology. For the matching, the difference between
the technology value for each criterion and the corresponding industry-value is calculated.
The following table illustrates an exemplary comparison between technology-values
(assessed properties regarding the criterion) and industry-values (obtained through industry-
interviews):
Table 1 Exemplary Comparison between Technology-Properties and Industry-
Requirements
Technology-
Properties
Industry-
Requirements
T1 T2 A B C
Criterion 1 (range of values) 1 (low) 3 (high) 1 2 3
Criterion 2 (range of values)
Criterion 3 (range of values)
We use ranges of values from one to three in order to assess i.e. the degree of performance
for each criterion. Ranges, however, have the disadvantage that they are rather coarse and
sometimes difficult to interpret. Please therefore take into consideration that the values have
to be understood relative amongst each other and were partially adopted from the SToP
project [13].

BRIDGE – Building Radio frequency IDentification solutions for the Global Environment
D5.3 Anti-counterfeiting Business Case Report 17/79 December 2007
Table 2 Meeting Industry-Requirements - Exemplary Calculation
Technology Industry (Technology-Value –
Industry-Value) Interpretation
T1 A (1-1) = 0 Met
B (1-2) = -1 Under-achieved -
C (1-3) = -2 Under-achieved --
T2 A (3-1) = 2 Over-achieved ++
B (3-2) = 1 Over-achieved +
C (3-3) = 0 Met
Resulting negative values are interpreted as “not meeting the requirements” and thus as
“under-achieving”. All negative values are summed up. Resulting positive values are
interpreted as “meeting the requirements better than required”. The technology under
consideration is thus “over-achieving.” All positive values are summed up separately and
later compared to the negative values. Resulting zeros are interpreted as a good match
between the technology property and the industry requirement for the given criterion.
The closer the sums are to zero, the better is the fit of the technology for the industry. Higher
positive values imply that the technology is over-achieving the industry’s requirements,
relatively to the other technologies. High negative values imply that the technology, relatively
to the others, meets industry’s requirements less.
The approach has its weaknesses insofar, as the results will need a further discussion, which
is provided in the later part of this section. In order not to linearly compensate under-
achievement with over-achievement of the authentication approaches, we did not sum up the
resulting values.
The results might indicate that an anti-counterfeiting solution is suitable for an industry, which
has in turn legal aspects, for example, which require the use of a certain technology or where
the prices, margins, volumes of the products do not justify expensive anti-counterfeiting
technologies (“no-go” cases). These cases will be treated in the later discussion section.
“Importance-values” are introduced in order to more stress on the importance of selected
criteria for a given industry. Weighting the criteria accordingly assigns priorities for each
industry.
Our assessment approach is based on an approach described in [19]. [19] also uses a set of
criteria (such as security, reliability, maneuverability, simplicity etc.) for the assessment of
different weapon systems. The author then applies fuzzy Analytic Hierarchy Processes
(AHP) based on entropy weight to rank the systems regarding the criteria. The author builds
judgment vectors with requirements and properties and compares them to the corresponding
weapon system. By doing this, a multiple criteria decision making process, as in the example
of a weapon system selection example, can be solved.

BRIDGE – Building Radio frequency IDentification solutions for the Global Environment
D5.3 Anti-counterfeiting Business Case Report 18/79 December 2007
The choice of anti-counterfeiting technologies for a given industry is a multiple criteria
decision process, where a subset out of anti-counterfeiting technologies, varying in
properties and characteristics, is selected according to its adequateness for a given industry.
As a result we will receive for each of the considered industries a list that ranks the
technologies according to their suitability. Our approach is also similar to the approach of [20]
which ranks a given set of countries according to a set of criteria, thereby stressing the fact
that the ranking order depends also on the ranking approach and whether criteria are
weighted or not.
The methodology applied here is one possible approach. There are, however, other suitable
approaches which can be applied such as the usage of pure scoring tables, for example.

BRIDGE – Building Radio frequency IDentification solutions for the Global Environment
D5.3 Anti-counterfeiting Business Case Report 19/79 December 2007
4 Identification of Anti-Counterfeiting Approaches for
selected Industries
4.1 Introduction of Identification Criteria Sets
As already stated in the previous methodology section, the goal is to identify for each
industry the best matching anti-counterfeiting technology, while also taking the varying
importance of each criterion in the considered industry into account. In this section, we
present, list and structure the following five sets of criteria deduced from our previous
findings (from SToP deliverables [13] and [9], from BRIDGE deliverables [3] and [15], and
from work which was conducted in BRIDGE deliverable [8]) which are relevant for the
selection of an anti-counterfeiting solution:
1. Solution Aspects
2. Supply Chain Characteristics
3. Product Characteristics
4. Authentication Characteristics and
5. Aspects concerning Legal Compliance.
Besides the technology-evaluation using the criteria, industry-requirements (in the
automotive, aerospace, pharmaceutical, consumer goods & retail and in the information
technology industry) will also be assessed, using the same set of criteria. We estimate and
define industry-, technology- and importance-vectors accordingly (see Table 3). The
matching of technologies to industries is performed in the end of this section.
Table 3 Exemplary Evaluation of Technology Properties and Industry-Requirements
Technology-
Properties Industry-Requirements
Criteria T1 T2 Criteria A B
Height of Security Level
(ranges from Low: 1- 3
High)
1 (low) 3 (high)
Required Height
of Security Level
(ranges from
Low: 1-3 High)
2
Criterion 2 (range of
values)
The criteria in the first set deals with questions concerning the properties of the solution,
such as its maturity or production speed application. The criteria in the second set of
questions deals with supply chain characteristics. We learned from conducted and ongoing
industry-interviews that supply chains differ by size, complexity, number of partners, and
dynamic from industry to industry, therefore posing new requirements regarding the anti-
counterfeiting technology: each technology can - only to a certain extent - deal with highly
complex and dynamic supply chain structures. The third set of criteria is about characteristics
which are unique to the products to be secured. The fourth set of criteria copes with

BRIDGE – Building Radio frequency IDentification solutions for the Global Environment
D5.3 Anti-counterfeiting Business Case Report 20/79 December 2007
authentication characteristics specific to the technology but also relevant to the applying
industry. Criteria such as the possibility for consumers to check the authentication, the
“easiness to authenticate” and the questions whether a special device is required for the
authentication, are covered here. The fifth and very last criterion deals with the question
whether a special anti-counterfeiting method is required in an industry or whether the
technology has to be compliant with any kind of national, international or industry-specific
regulation. This criterion, however, will be only taken into account in the discussion section.
After we present the criteria in this section, each technology will be assessed according to its
degree of performance relatively to the other considered technologies. According to the
above presented methodology, we will estimate according to our interview information for
each industry, how relevant the presented criteria are and also express this in “importance
vectors” in order to illustrate the most important criteria for each industry.
Please take into consideration, that although we present a structured approach,
generalizations for the sake of comparability could not be avoided. We generalize on product
level for each industry according to the industry-interviews that we conducted for the
requirements analysis [3] and that are still ongoing. One of these generalizations, for
example, was performed for the pharmaceutical industry: although not all traded products in
the pharmaceutical industry are security or health relevant, we generalized the requirements
in this industry in a way that products are health and security relevant. Another example
concerns the automotive industry where we consider that due to surface structures and
forms it is difficult to tag products with an additional feature (important for anti-counterfeiting
technologies which require a supplementary feature or tag) and that many products are
made from metal.
Besides these generalizations we tried to identify criteria which are independent among each
other, such as a “complex supply” chain usually involves a “bigger number of supply chain
partners”. However, as in the case of “level of security” and “security and health relevance”
this was not always possible, since both aspects have different implications.
Solution Aspects
In the following section we will present relevant aspects concerning the anti-counterfeiting
solution. For every aspect we will explain why it is relevant for the choice of an anti-
counterfeiting solution, what it means to define the industry-value and what it means
regarding the technology properties.
Security Level (ranges from 1 “low” to 3 “high”): The security level in this deliverable is
defined according to the SToP deliverable [13]. The industry-requirements regarding the
level of security of the anti-counterfeiting solution will be assessed using a range which
varies from 1 (“low”) to 3 (“high”). The assessment of the required level of security in a given
industry depends mainly on the security and health relevance of the products in general and
on their financial importance for the affected company. Therefore, it is important as a means

BRIDGE – Building Radio frequency IDentification solutions for the Global Environment
D5.3 Anti-counterfeiting Business Case Report 21/79 December 2007
of evaluation. The level of security for each technology will be defined in relation to the other
technologies and will mainly assess the technology according to its potential to secure a
product against counterfeits, eventually for example measured as the “effort (e.g., know-how,
financial, personal) for an counterfeiter to produce a fake product”.
Authentication Speed on item-level (ranges from 1 “low” to 3 “high”): The required
authentication speed for an industry is linked with the number of products which are
produced in this industry, with the percentage / ratio of equipped products (in case of anti-
counterfeiting features to be tested) and the counterfeiting frequency of products in an
industry. Therefore, this aspect is crucial in industries with a large extent of counterfeiting
activities, because more products would have to be checked here than in other industries.
Verifying the authenticity of products could therefore become a bottleneck in supply chains.
These industries therefore require a faster authentication method. For the technology-value,
we will estimate the speed in which the technology provides an answer to an authentication
procedure. The authentication speed varies from 1 for “low” (e.g., several minutes) to 3 for
“high” (e.g., some seconds).
Maturity (ranges from 1 for “rather new technology (e.g., market novelty)” to 3 “rather
mature technology (e.g., technology is already used in the intended application by
numerous parties.)”): The maturity aspect ranges also from 1 (for “rather new technology”) to
3 (for “rather mature technology”). It depends on the industry whether it opts for a mature
solution or a rather new one. Both approaches have advantages and inconveniences,
regarding maintenance, installation and service costs for the solution, failure rates but also
regarding potential additional benefits from the solutions. However, the aspect “maturity” also
implies that standard solutions are available, that the solution has already been tested, and
that is has already proven its reliability. It is difficult to assess whether a given industry
requires a mature anti-counterfeiting solution. During our industry interviews, no company
has asked for a specific proven or mature industry. However, since some technologies are
more advanced than others, we will take this aspect also into consideration while taking
aspects such as security or health relevant products into account.
Difficulty of Product Application (ranges from 1 “easy” (“can easily be applied on
almost all surfaces) to 3 “difficult to apply” (e.g., the surface requires a special
treatment before the feature can be applied)): This aspect covers the difficulty to apply or
combine the anti-counterfeiting solution with the product. It depends mainly on the surface
structure and the form of the product and on the fact, whether the products of a given
industry are packed or sold as bare, bulk items, as this is often the case in the automotive
industry for example. The spectrum ranges from 1 for “easy” to 3 for “difficult to apply” a
feature etc. on the product. Aspects such as the resistance against very high and very low
temperatures, humidity, acids, oil and different pressures are also covered here. This aspect
is important in an anti-counterfeiting context, since many anti-counterfeiting technologies,

BRIDGE – Building Radio frequency IDentification solutions for the Global Environment
D5.3 Anti-counterfeiting Business Case Report 22/79 December 2007
including RFID-tags, require the tag to be easily applicable on the product. All tag based
features will therefore receive a similar evaluation. Other technologies (like LSA) are not
applicable on all surfaces, which will be also considered.
Possibility to Remove and Reapply (ranges from 1 “easy” to 3 “difficult): Along with the
difficulty to apply a feature we also consider the possibility to remove and to reapply it on
another product. It might be easier or more difficult to remove or reapply a “feature”,
depending on different product categories. This criterion is increasingly important the more
health or security relevant products are. All anti-counterfeiting approaches that are not
feature-based (like direct authentication approaches) will therefore receive a “3” in this
evaluation. RFID-tag based anti-counterfeiting technologies will receive a “2”, since RFID
tags can be designed in a way that they break upon removal, whereas barcodes (1D or 2D)
will most probably not break, except if the paper breaks.
In contrast to the criterion “security level” which was introduced in the beginning of this
subsection, this criterion does not affect the possible cloning of a security technology, but the
possibility – in case of feature-based approaches – to physically remove the feature or tag
and to reapply it on other products. Both criteria have therefore to be understood
complementarily.
Production Speed Application (ranges from 1 “not required” (e.g., only a small number
of parts are produced, an anti-counterfeiting feature would not hinder production) to 3
“crucial” (e.g., an anti-counterfeiting feature could be a bottle-neck for production)):
Depending again on the number of products and on the production speed of a given industry,
the speed in which an anti-counterfeiting “feature” can be applied to the product varies here
from 1 for “slow" to 3 for “fast”. For an industry with a high-volume production, a high
application speed is absolutely crucial. Since anti-counterfeiting is important, but should not
represent a bottleneck, not every solution fits in every industry. Concerning the technology,
we will again relatively to the other technologies assess the possible speed of application.
Other Benefits from the Solution: According to industry-interviews that were conducted in
the scope of the BRIDGE deliverable [3] and according to recently conducted interviews,
some companies, for example, in the automotive industry confirmed that they would not
introduce an RFID-based technology merely for anti-counterfeiting. Including another
technology, method or especially tag into or onto the product also requires technological,
business process and organizational changes but may nevertheless make new applications
possible and therefore allow for new benefits. Therefore, the decision for a tag on a product
will not only be motivated by anti-counterfeiting reasons.

BRIDGE – Building Radio frequency IDentification solutions for the Global Environment
D5.3 Anti-counterfeiting Business Case Report 23/79 December 2007
Table 4 Summarizing Table for Solution Aspects
ASPECTS SPECTRUM OF VALUES
a) Height of Security Level Low: 1 – 3 High
b) Authentication Speed per Item Low: 1 – 3 High
c) Maturity of the Anti-Counterfeiting Technology Low: 1 – 3 High
d) Difficulty of Product Application Low: 1 – 3 High
e) Production Speed Application Required Not Required: 1 – 3 Crucial
f) Possibility to Remove and Reapply Easy: 1 – 3 Difficult
In the next section we will discuss relevant supply chain characteristics for the choice of an
anti-counterfeiting technology.
Supply Chain Characteristics
Complexity of Supply Chains (ranges from 1 for “rather low level of complexity” to 3
for “rather complex”): The choice for an anti-counterfeiting solution has to take into account
the complexity of the supply chain of a given industry and/or product. The more complex the
supply chain, the higher the number of partners in the supply chain, the more potential entry
points for counterfeits and thus the more vulnerable the supply chain. The choice for an anti-
counterfeiting technology should therefore be better suited for more complex supply chains.
Feature-based methods such as holograms only include the manufacturer who applies them.
However, technologies that allow an easy authentication and that support the user with track-
and-trace records of the product in the supply chain are best suited in complex supply
chains. All track-and-trace data providing technologies will therefore receive a better
evaluation than technologies that do not provide this extra information, under the assumption
that an anti-counterfeiting application offers enough benefits to encourage data sharing
between supply chain partners. Technologies, however, that need a “very special” device
(e.g., for LSA, CDP, etc.; whether the Internet is considered as a “very special device” or is
industry-specific, depends on the supply chains, and on the countries) for authentication will
be evaluated with a “1” or “2” accordingly.
Data Sharing / Trust between Supply Chain Partners (ranges from 1 for “no trust” to 3
for “trust between partners”): A number of anti-counterfeiting technologies require the
sharing and propagation of information between supply chain partners (e.g., where has a
product been seen at which time?) and thus a trustful relationship between them (see also
Discovery Service Discussion in BRIDGE [8] and BRIDGE deliverable D4.1.2). According to
the industry and the supply chain structure, this aspect differs from industry to industry.
Moreover, there might be a correlation between the extent to which counterfeit products
BRIDGE – Building Radio frequency IDentification solutions for the Global Environment
D5.3 Anti-counterfeiting Business Case Report 24/79 December 2007
enter the supply chain, given a high or a low level of trust between supply chain partners.
Depending on the supply chain set-up in different industries, the extent of this trust can vary
from “requires no trust” up to “highly trusted” relationships between supply chain partners
and will be taken into account.
Technologies that require information interchange will receive a higher evaluation value than
those that are independent from data exchange, e.g., where the product itself provides is a
proof for its authenticity.
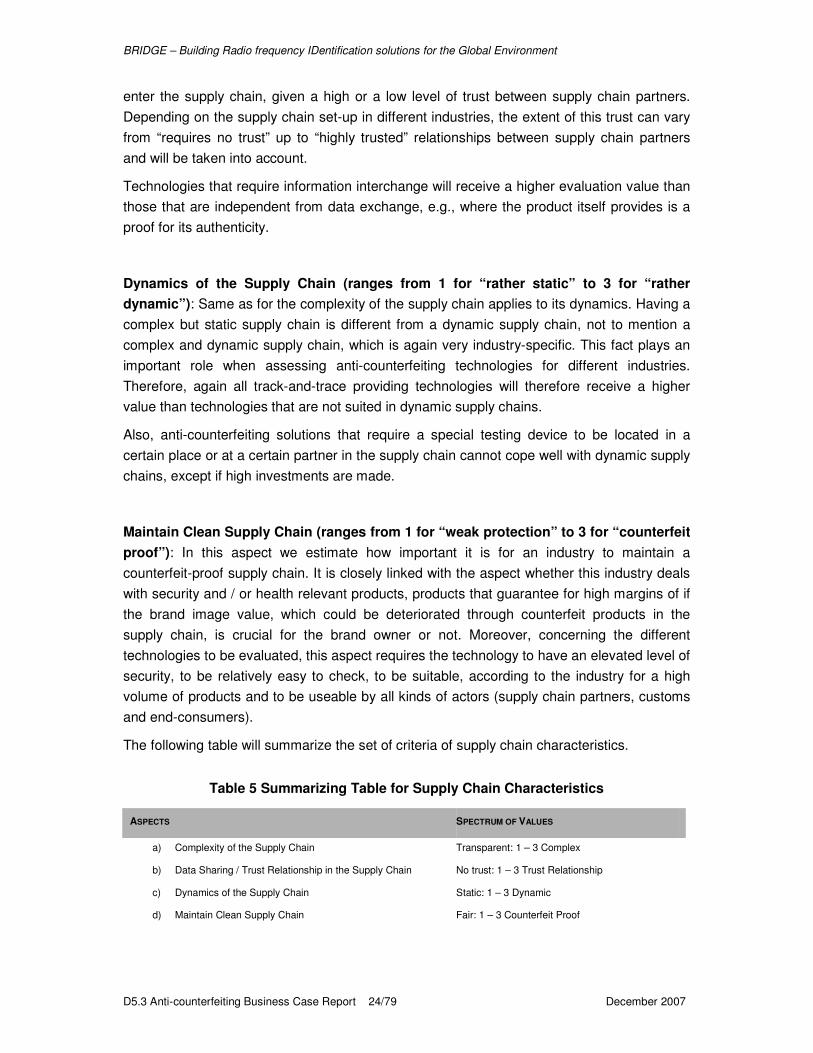
Dynamics of the Supply Chain (ranges from 1 for “rather static” to 3 for “rather
dynamic”): Same as for the complexity of the supply chain applies to its dynamics. Having a
complex but static supply chain is different from a dynamic supply chain, not to mention a
complex and dynamic supply chain, which is again very industry-specific. This fact plays an
important role when assessing anti-counterfeiting technologies for different industries.
Therefore, again all track-and-trace providing technologies will therefore receive a higher
value than technologies that are not suited in dynamic supply chains.
Also, anti-counterfeiting solutions that require a special testing device to be located in a
certain place or at a certain partner in the supply chain cannot cope well with dynamic supply
chains, except if high investments are made.
Maintain Clean Supply Chain (ranges from 1 for “weak protection” to 3 for “counterfeit
proof”): In this aspect we estimate how important it is for an industry to maintain a
counterfeit-proof supply chain. It is closely linked with the aspect whether this industry deals
with security and / or health relevant products, products that guarantee for high margins of if
the brand image value, which could be deteriorated through counterfeit products in the
supply chain, is crucial for the brand owner or not. Moreover, concerning the different
technologies to be evaluated, this aspect requires the technology to have an elevated level of
security, to be relatively easy to check, to be suitable, according to the industry for a high
volume of products and to be useable by all kinds of actors (supply chain partners, customs
and end-consumers).
The following table will summarize the set of criteria of supply chain characteristics.
Table 5 Summarizing Table for Supply Chain Characteristics
ASPECTS SPECTRUM OF VALUES
a) Complexity of the Supply Chain Transparent: 1 – 3 Complex
b) Data Sharing / Trust Relationship in the Supply Chain No trust: 1 – 3 Trust Relationship
c) Dynamics of the Supply Chain Static: 1 – 3 Dynamic
d) Maintain Clean Supply Chain Fair: 1 – 3 Counterfeit Proof

BRIDGE – Building Radio frequency IDentification solutions for the Global Environment
D5.3 Anti-counterfeiting Business Case Report 25/79 December 2007
In the next section we will discuss relevant product characteristics for the choice of an anti-
counterfeiting technology.
Product Characteristics
Security and/or Health Relevance of Products (ranges from 1 “not security/health relevant” to
3 “highly health/security relevant”): Due to their sensitivity, security and equally health
relevant products require an anti-counterfeiting technology with a high level of security.
Industries in which these kinds of goods are produced and traded may again require the anti-
counterfeiting technology to be of the highest security level possible. The security level will
be defined according to the SToP Deliverable [13] between 1, for industries with usually no
security or health relevant products up to 3 for industries with products that are highly health
or security relevant.
Space on the Product (ranges from 1 for “little space on the product” to 3 for “enough
space on the product”): This aspect is quite hard to generalize for a specific group of
products or an industry. However, as it is the practice for example in the automotive industry,
spare parts are often sold without a packaging, making is more difficult to apply an anti-
counterfeiting “feature” and making other anti-counterfeiting technologies based on direct
authentication more suitable in this regard. This aspect is highly product-specific. However,
we will generalize it for the whole industry. The range goes from 1, for “little space on the
product” up to 3, for “enough space on the product”.
The table below summarized the criteria that are product specific.
Table 6 Summarizing Table for Product Characteristics
ASPECTS SPECTRUM OF VALUES
a) Security and Health Relevance of Products Low: 1 – 3 High
b) Space on the Products for Features Little: 1 – 3 Big
In the next section we will discuss relevant authentication characteristics for the choice of an
anti-counterfeiting technology.
Authentication Characteristics
Device for Authentication (ranges from 1 for “no device is needed”, to 2, “a widespread
device is needed” and 3 for “a special device is needed”): This question is strongly related to
the question, whether consumers are supposed to check the authenticity of a product or
whether an industry does not allow consumers to do so (see below). Moreover, the term
“device” has to be first defined in this context. In anti-counterfeiting authentication devices,
the “Internet” can be a device where a website of a manufacturer is checked whether a serial
number is valid or not or a handheld reader that is connected to a special network, or as in

BRIDGE – Building Radio frequency IDentification solutions for the Global Environment
D5.3 Anti-counterfeiting Business Case Report 26/79 December 2007
the case of CDP (see [13]) where, for example, a mobile phone equipped with a digital
camera is needed along with a GPRS, GSM etc. connection with the backend or as in the
case for holograms, where a special lens is required in order to verify the authenticity of a
product.
Easiness to Check (ranges from 1 for “easy to check” up to 3 “relatively hard to
check”): This aspect is again very strongly linked to the question stated before, whether a
device is needed for the authentication or not. Depending also on the number of products
that have to be / should be checked, the easiness to check varies from 1, for “easy to check”
up to 3, for “relatively hard to check”. Concerning the industry-context, companies define
who, whether, how many (linked with volumes), etc. products can or have to be checked.
Automatic authentication required; also at high speed necessary (Not required “1” –
“3” automatic authentication required”): In some industries, due to the high volume of
products or due to low retail prices (especially if small margins are given), an automatic
authentication would be required. A more or less automated check would also support
customs to check more products entering, for example, the European Union (see also [3]).
Depending on the industry and of course on the anti-counterfeiting technology, this aspects
turns to either 1, meaning that an “automatic authentication (at high speed) is not required”,
and to 3 for “automatic authentication (also at high speed) is required”.
Useable by the consumer / Special Training or equipment Required (Required “1” - “3”
for Not Required): This aspect deals with question, whether the usability of the anti-
counterfeiting technology is important for the companies in the industry or not. This again is
linked with the question whether consumers shall be allowed to check the authenticity of a
product and whether they need a special education or training to do so. According to the
industry-interviews that were conducted in the scope of BRIDGE ( see also [3]), not all
considered industries foresee to allow the end-user to check for the authenticity of a product.
Moreover, not all anti-counterfeiting solutions can easily be used by the consumer.
Therefore, this aspect is binary, 0 for “useable by the consumer” and 1 for “not useable by
the consumer”.
The following table summarizes the criteria for the authentication characteristics.
Table 7 Summarizing Table for Authentication Characteristics

BRIDGE – Building Radio frequency IDentification solutions for the Global Environment
D5.3 Anti-counterfeiting Business Case Report 27/79 December 2007
ASPECTS SPECTRUM OF VALUES
a) Device for Authentication No: 1 – 3 Special Device Required
b) Easiness to Authenticate Easy: 1 – 3 Difficult
c) Automatic Authentication Not Required: 1 – 3 Required / Possible
d) Usage by the Consumer Required: 1 – 3 Not Required
In the next section we will discuss relevant aspects concerning legal compliance in an
industry for the choice of an anti-counterfeiting technology.
Aspects Concerning Legal Compliance
Legal Compliance (yes, no, potentially): This aspect covers the legal compliance of the
industry towards the introduction of i.e. a track and trace based anti-counterfeiting solution,
such as in the pharmaceutical industry, especially as it is defined by the US-American Food
and Drug Association (FDA). This aspect checks whether the proposed anti-counterfeiting
solution, in general, is technically capable to provide, for example, track-and-trace records.
In the following section we will summarize these aspects for five different industries
(automotive, aerospace, pharmaceutical, luxury goods, consumer goods and retail and the
information technology industry) in an “industry-vector” that can be later compared to the
anti-counterfeiting technology vector. An especially defined importance vector for each
industry supports to mark the most important aspect for a given industry.
Sources of information for these estimations are:
• Industry interviews,
• Literature Review, as stated in the document,
• BRIDGE deliverable D5.1 Problem Analysis Report on Counterfeiting and Illicit Trade [15]
• BRIDGE deliverable D5.2 Anti-Counterfeiting Requirements Report [3]
• SToP deliverable D3.1 Report on relevant state-of-the-art research, existing technologies
and products [13]
• SToP deliverable D4.1 – Report and Analysis on State-of-the-Art Tagging Technologies
Specific to the SToP Project Requirements [9]

4.2 Summary of Technology Characteristics
DIRECT AUTHENTICATION AUTHENTICATION BY MEANS OF A
DIFFICULT TO REPRODUCE FEATURE
VERIFICATION OF
UNIQUE IDENTIFIERS
PLAUSIBILITY CHECK OF TRACK
AND TRACE DATA
SECURE OBJECT
AUTHENTICATION RFID BASED AUTHENTICATION (OTHERS)
ASPECTS SPECTRUM
OF VALUES
PHOTO
COMP.
FORENSIC
ANALYSIS LSA CDP
TAGGANTS
(CHEMICAL ETC.) BARCODE RFID BARCODE (2D) RFID T&T
RFID
CRYPTOTAGS
RFID AND OBJECT
SPECIFIC FEATURES
WEAK
AUTH.(TID)
RFID
EPEDIIGREE
a) Height of Security Level Low: 1 – 3 High 1 3 3 3 2 2 2 2 2 3 2 2 2
b) Authentication Speed per Item Low: 1 – 3 High 1 1 2 2 1 2 3 2 3 3 3 3 3
c) Maturity of the ACF-Technology Low: 1 – 3 High 3 3 2 2 3 3 2 2 2 1 2 2 2
d) Difficulty of Product Application High: 1 – 3 Low 3 3 3 2 2 2 2 2 2 2 2 2 2
e) Production Speed Application Low: 1 – 3 High 1 1 1 2 2 2 2 2 2 2 2 2 2 I) S
olu
tio
n A
sp
ects
f) Easiness to Remove and Reapply Easy: 1 – 3 Difficult 3 3 3 2 3 1 2 2 2 2 2 2 2
ASPECTS SPECTRUM OF VALUES
g) Suitability in Complex Supply Chains Not Suitable: 1 – 3 Suitable 1 1 1 2 1 2 2 3 3 2 2 2 3
h) Requires Trust Relationship *) Does not require: 1 – 3 Requires 1 1 1 1 1 2 2 2 2 2 1 1 2
i) Functional Independent of SC Dynamics*) Not Functional: 1 – 3 Functional 2 1 1 2 1 2 2 3 3 3 2 2 3
II)
Su
pp
ly C
hain
Ch
ara
cte
risti
cs
j) Maintain Clean Supply Chain Low: 1 – 3 High 1 2 2 2 2 1 2 3 3 3 2 1 3
ASPECTS SPECTRUM OF VALUES
a) Suitable for Security/Health rel. Products Low: 1 – 3 High 1 3 3 2 2 2 3 3 3 3 2 2 3
III)
Pro
d.
Ch
ar.
b) Req. Space on the Products for Features Big: 1 – 3 Little 3 3 3 2 3 2 2 2 2 2 2 2 2
ASPECTS SPECTRUM OF VALUES
a) Device for Authentication Required Not Required: 1 – 3 Required 2 2 3 2 3 2 2 2 2 2 2 2 2
b) Easiness to Authenticate Difficult: 1 – 3 Easy 3 1 2 2 1 2 2 2 2 2 2 2 2
c) Automatic Authentication possible Not Possible: 1 – 3 Possible 1 1 1 1 1 1 3 1 3 3 3 3 3
IV)
Au
then
ticati
on
Ch
ara
cte
risti
cs
d) Educational Requirements for Usage by
the Consumer required *) Not Required: 1 – 3 Required 1 3 3 1 3 1 1 1 1 3 1 1 1
Note: The cells marked in light grey are adopted from SToP, [13, p. 44].
*) Here, these values are phrased negatively, in the calculations they are treated as the other values.

4.3 Industry-Specific Requirements
4.3.1 Automotive Industry
The automotive industry is characterized by a network of first tier suppliers that supply the
car manufacturers with modules and parts. A high percentage of automotive parts are
produced by these suppliers, according to norms that are set by different, mostly national car
associations. The margins of the products are rather low, however, their volumes are quite
high (see also [15] and [3]). The supply chain is quite international and thus involves a
number of supply chain partners. The manufacturer’s influence on its supply chain is in
general larger that in the pharmaceutical industry supply chain, since it involves less supply
chain partners. Product integrity problems arise from counterfeiting, the mixture with parallel
traded products, independent garages, tampering and partially the usage of refurbished
spare parts or spare parts traded on, for example, the Internet. Our focus in this report is on
security or health relevant parts like brakes, spark plugs or electronic components although
not all spare parts have this property.
Table 8 Summary of the Automotive Industry
ASPECTS SPECTRUM OF VALUES VALUES
a) Required Height of Security Level Low: 1 – 3 High 2
b) Required Authentication Speed per Item Low: 1 – 3 High 3
c) Desired Maturity of Anti-Counterfeiting Technology Low: 1 – 3 High 2
d) Max. Difficulty of Product Application Low: 1 – 3 High 1
e) Speed of Feature Application Required Low: 1 – 3 High 3
I) S
olu
tio
n A
sp
ec
ts
f) Req. against Possibility to Remove and Reapply Low: 1 – 3 High 2
ASPECTS SPECTRUM OF VALUES
a) Complexity of the Supply Chain Transparent: 1 – 3 Complex 2
b) Trust Relationship in the Supply Chain No Trust: 1 – 3 Trust Relationship 2
c) Dynamic of the Supply Chain Static: 1 – 3 Dynamic 1 II)
SC
Ch
ara
cte
ris
tic
s
d) Necessity of Maintain Clean Supply Chain Fair: 1 – 3 Counterfeit Proof 2
ASPECTS SPECTRUM OF VALUES
a) Security and Health Relevance of Products Low: 1 – 3 High 3
III)
Pro
d.
Ch
ar.
b) Space on the Products for Features Little: 1 – 3 Big 2
ASPECTS SPECTRUM OF VALUES
a) Device for Authentication No: 1 – 3 Special Device Possible 2
b) Easiness to Authenticate Easy: 1 – 3 Difficult 2
c) Automatic Authentication Required Not Required: 1 – 3 Required 3
V)
Au
th. C
ha
r-
d) Usage by the Consumer Required: 1 – 3 Not Required 3
The authentication methods currently used in the automotive industry are direct
authentication, the verification of copy protected features, and the verification of unique
identifiers especially for security relevant products and products that are frequently

BRIDGE – Building Radio frequency IDentification solutions for the Global Environment
D5.3 Anti-counterfeiting Business Case Report 30/79 December 2007
counterfeit. Secure object authentication or track-and-trace technologies are not or only
rarely used. The technologies most used are holograms, cast in charge or batch numbers,
alphanumeric codes or inkjet prints (see also [15] and [3]).
4.3.2 Aerospace Industry
According to the research results in BRIDGE [15] and SToP [13], the aerospace industry is
highly regulated, especially due to crucial passenger safety. Aircraft parts are very expensive
in manufacturing and in maintenance and do not have, as already stated in BRIDGE [15] and
[3] the high volume as parts in the automotive industry for example. Moreover, they can be
acquired as used spare parts when they are refurbished and tested. Usually, and in contrast
to many other industries, the supply chain is controlled by the manufacturer, however, the
maintenance is not supervised. Product integrity problems arise from counterfeiting activities
of parts and of parts of more complex parts, parallel trading activities and trade of refurbished
products (see also [13]).
Table 9 Summary of the Aerospace Industry
ASPECTS SPECTRUM OF VALUES VALUES
a) Required Height of Security Level Low: 1 – 3 High 3
b) Required Authentication Speed per Item Low: 1 – 3 High 1
c) Desired Maturity of Anti-Counterfeiting Technology Low: 1 – 3 High 3
d) Max. Difficulty of Product Application Low: 1 – 3 High 1
e) Speed of Feature Application Required Low: 1 – 3 High 1
I) S
olu
tio
n A
sp
ec
ts
f) Req. against Possibility to Remove and Reapply Low: 1 – 3 High 3
ASPECTS SPECTRUM OF VALUES VALUES
a) Complexity of the Supply Chain Transparent: 1 – 3 Complex 2
b) Trust Relationship in the Supply Chain No Trust: 1 – 3 Trust Relationship 2
c) Dynamic of the Supply Chain Static: 1 – 3 Dynamic 1 II)
SC
Ch
ara
cte
ris
tic
s
d) Necessity of Maintain Clean Supply Chain Fair: 1 – 3 Counterfeit Proof 3
ASPECTS SPECTRUM OF VALUES VALUES
a) Security and Health Relevance of Products Low: 1 – 3 High 3
III)
Pro
d.
Ch
ar.
b) Space on the Products for Features Little: 1 – 3 Big 3
ASPECTS SPECTRUM OF VALUES VALUES
a) Device for Authentication No: 1 – 3 Special Device Possible 2
b) Easiness to Authenticate Easy: 1 – 3 Difficult 2
c) Automatic Authentication Required Not Required: 1 – 3 Required 2
V)
Au
th. C
ha
r-
d) Usage by the Consumer Required: 1 – 3 Not Required 3
Direct authentication is not used in the aerospace industry, since the apparent check for
authenticity in complex aerospace spare parts is even for an expert not possible. Copy
protected features, however are used, as well as the verification of unique identifiers and
track-and-trace solutions. There is no information available on the use of secure object

BRIDGE – Building Radio frequency IDentification solutions for the Global Environment
D5.3 Anti-counterfeiting Business Case Report 31/79 December 2007
authentication. The main anti-counterfeiting technologies are pedigree documents, barcodes
and the proprietary “yellow tags”. Nevertheless, the most used anti-counterfeiting technology
are currently the implemented pedigree documents, but these are often not inspected
thoroughly (see also [13]).
4.3.3 Pharmaceutical Industry
Comparable to the aerospace industry, the pharmaceutical industry is highly regulated,
especially due to crucial consumer safety. Moreover, the product availability in this industry
has a high importance. Complex supply chains and a high number of intermediaries are
characteristic in this supply chain. As a consequence, the manufacturer’s influence on the
supply chain is limited and counterfeit products are often online available. Counterfeits and
parallel trading threat the integrity of products (see also [15] and [13]).
Table 10 Summary of the Pharmaceutical Industry
ASPECTS SPECTRUM VALUES
a) Required Height of Security Level Low: 1 – 3 High 3
b) Required Authentication Speed per Item Low: 1 – 3 High 3
c) Desired Maturity of Anti-Counterfeiting Technology Low: 1 – 3 High 3
d) Max. Difficulty of Product Application Low: 1 – 3 High 2
e) Speed of Feature Application Required Low: 1 – 3 High 3
I) S
olu
tio
n A
sp
ec
ts
f) Req. against Possibility to Remove and Reapply Low: 1 – 3 High 3
ASPECTS SPECTRUM OF VALUES
a) Complexity of the Supply Chain Transparent: 1 – 3 Complex 3
b) Trust Relationship in the Supply Chain No Trust: 1 – 3 Trust Relationship 2
c) Dynamic of the Supply Chain Static: 1 – 3 Dynamic 3 II)
SC
Ch
ara
cte
ris
tic
s
d) Necessity of Maintain Clean Supply Chain Fair: 1 – 3 Counterfeit Proof 3
ASPECTS SPECTRUM OF VALUES
a) Security and Health Relevance of Products Low: 1 – 3 High 3
III)
Pro
d.
Ch
ar.
b) Space on the Products for Features Little: 1 – 3 Big 1
ASPECTS SPECTRUM OF VALUES
a) Device for Authentication No: 1 – 3 Special Device Possible 3
b) Easiness to Authenticate Easy: 1 – 3 Difficult 2
c) Automatic Authentication Required Not Required: 1 – 3 Required 3
V)
Au
th. C
ha
r-
d) Usage by the Consumer Required: 1 – 3 Not Required 1
In the pharmaceutical industry, several anti-counterfeiting technologies are already in use,
such as direct authentication, which is already widely being used, as well as copy protected
features such as holograms, however, the verification of unique identifiers is only used on
batch level, and item-level verification is already planned. In what concerns track-and-trace
authentication, first pilots are already been implemented and the secure object authentication
is envisaged.

BRIDGE – Building Radio frequency IDentification solutions for the Global Environment
D5.3 Anti-counterfeiting Business Case Report 32/79 December 2007
The main technologies however are chemical procedures, and overt or also covert copy
protected features. The most used anti-counterfeiting measure is the direct authentication
(see also [13]).
4.3.4 Consumer Goods and Retail Industry
The consumer goods and retail industry can be characterized as a high volume industry with
products primarily bought for personal, family and household use. Counterfeiting activities
have increased in the last couple of years, for example, shoes and textiles ([15]). Every kind
of counterfeit product is available in the consumer goods and retail industry: from high quality
forgeries of products, where differences are not visible to the naked eye and which are
bought non-perceptively by the consumer, down to the adoption of a similar design, where
products are bought perceptively ([15]).. Security or health relevant products are usually not
traded. However, there are some product categories that have to be compliant to regulations.
For generalization purposes, we do not primarily consider these products. In case products
that have to meet regulations are affected, similar assumptions concerning the technology
can be made here as in the pharmaceutical industry for example. For this report, however,
only uncritical products will be considered.
Table 11 Summary of the Consumer Goods and Retail Industry
ASPECTS SPECTRUM OF VALUES VALUES
a) Required Height of Security Level Low: 1 – 3 High 1
b) Required Authentication Speed per Item Low: 1 – 3 High 2
c) Desired Maturity of Anti-Counterfeiting Technology Low: 1 – 3 High 2
d) Max. Difficulty of Product Application Low: 1 – 3 High 2
e) Speed of Feature Application Required Low: 1 – 3 High 3
I) S
olu
tio
n A
sp
ec
ts
f) Req. against Possibility to Remove and Reapply Low: 1 – 3 High 2
ASPECTS SPECTRUM OF VALUES
a) Complexity of the Supply Chain Transparent: 1 – 3 Complex 2
b) Trust Relationship in the Supply Chain No Trust: 1 – 3 Trust Relationship 2
c) Dynamic of the Supply Chain Static: 1 – 3 Dynamic 2 II)
SC
Ch
ara
cte
risti
c
s
d) Necessity of Maintain Clean Supply Chain Fair: 1 – 3 Counterfeit Proof 2
ASPECTS SPECTRUM OF VALUES
a) Security and Health Relevance of Products Low: 1 – 3 High 1
III)
Pro
d.
Ch
ar.
b) Space on the Products for Features Little: 1 – 3 Big 2
ASPECTS SPECTRUM OF VALUES
a) Device for Authentication No: 1 – 3 Special Device Possible 1
b) Easiness to Authenticate Easy: 1 – 3 Difficult 1
c) Automatic Authentication Required Not Required: 1 – 3 Required 3
V)
Au
th. C
ha
r-
d) Usage by the Consumer Required: 1 – 3 Not Required 1

BRIDGE – Building Radio frequency IDentification solutions for the Global Environment
D5.3 Anti-counterfeiting Business Case Report 33/79 December 2007
Until now, feature-based authentication (features such as holograms) is used in the
consumer goods and retail industry.
4.3.5 Information Technology Industry
The IT or ICT industry (Information and Communication Technology) is an umbrella term that
includes any communication device or application, encompassing: radio, television, cellular
phones, computer and network hardware and software, satellite systems and so on, as well
as the various services and applications associated with them. However, both software and
IT hardware are counterfeit and counterfeiters are very tricky in their business while, for
example, only counterfeiting parts of an IT system. For a more detailed description please
refer to [15].
Table 12 Summary of the Information Technology Industry
ASPECTS SPECTRUM OF VALUES VALUES
a) Required Height of Security Level Low: 1 – 3 High 2
b) Required Authentication Speed per Item Low: 1 – 3 High 2
c) Desired Maturity of Anti-Counterfeiting Technology Low: 1 – 3 High 2
d) Max. Difficulty of Product Application Low: 1 – 3 High 2
e) Speed of Feature Application Required Low: 1 – 3 High 2
I) S
olu
tio
n A
sp
ec
ts
f) Req. against Possibility to Remove and Reapply Low: 1 – 3 High 3
ASPECTS SPECTRUM OF VALUES
a) Complexity of the Supply Chain Transparent: 1 – 3 Complex 2
b) Trust Relationship in the Supply Chain No Trust: 1 – 3 Trust Relationship 2
c) Dynamic of the Supply Chain Static: 1 – 3 Dynamic 2 II)
SC
Ch
ara
cte
ris
tic
s
d) Necessity of Maintain Clean Supply Chain Fair: 1 – 3 Counterfeit Proof 2
ASPECTS SPECTRUM OF VALUES
a) Security and Health Relevance of Products Low: 1 – 3 High 1
III)
Pro
d.
Ch
ar.
b) Space on the Products for Features Little: 1 – 3 Big 2
ASPECTS SPECTRUM OF VALUES
a) Device for Authentication No: 1 – 3 Special Device Possible 2
b) Easiness to Authenticate Easy: 1 – 3 Difficult 2
c) Automatic Authentication Required Not Required: 1 – 3 Required 2
V)
Au
th. C
ha
r-
d) Usage by the Consumer Required: 1 – 3 Not Required 1
Mass serialization and product tracking is rudimentarily done in the Information Technology
(IT) industry by using customized bar codes. Different anti-counterfeiting technologies are
employed in this industry such as holograms or unique serial numbers, according to the
products.

4.3.6 Summary Industry Requirements
ASPECTS SPECTRUM
OF VALUES
AUTOMOTIVE
VALUES
AEROSPACE
VALUES
PHARMA
VALUES
RETAIL
VALUES
IT INDUSTRY
VALUES
a) Required Height of Security Level Low: 1 – 3 High 2 3 3 1 2
b) Required Authentication Speed per Item Low: 1 – 3 High 3 1 3 2 2
c) Desired Maturity of Anti-Counterfeiting Technology Low: 1 – 3 High 2 3 3 2 2
d) Max. Difficulty of Application to Product Low: 1 – 3 High 1 1 2 2 2
e) Speed of Feature Application Required Low: 1 – 3 High 3 1 3 3 2
I) S
olu
tio
n A
sp
ec
ts
f) Req. Against Possibility to Remove and Reapply Low: 1 – 3 High 2 3 3 2 3
ASPECTS SPECTRUM OF VALUES
a) Complexity of the Supply Chain Transparent: 1 – 3 Complex 2 2 3 2 2
b) Data Sharing / Trust Relationship in the Supply Chain No Trust: 1 – 3 Trust Relationship 2 2 2 2 2
c) Dynamics of the Supply Chain Static: 1 – 3 Dynamic 1 1 3 2 2
II)
Su
pp
ly
Ch
ain
Ch
ara
cte
ris
tic
s
d) Necessity of Maintaining Clean Supply Chain Fair: 1 – 3 Counterfeit Proof 2 3 3 2 2
ASPECTS SPECTRUM OF VALUES
a) Security and Health Relevance of Products Low: 1 – 3 High 3 3 3 1 1
III)
Pro
d.
Ch
ar.
b) Available Space on the Products for Features Little: 1 – 3 Big 2 3 1 2 2
ASPECTS SPECTRUM OF VALUES
a) Possibility of Special Device for Authentication No: 1 – 3 Special Device Possible 2 2 3 1 2
b) Desired Easiness to Authenticate Easy: 1 – 3 Difficult 2 2 2 1 2
c) Automatic Authentication Required Not Required: 1 – 3 Required 3 2 3 3 2
IV)
Au
the
nti
ca
tio
n
Ch
ar.
d) Usage by the Consumer Required: 1 – 3 Not Required 3 3 1 1 1

4.4 Importance Values
In section 3 we introduced the methodology for the selection matrix. Due to a high number of
aspects that have to be considered and due to their differences, a multiple criteria approach
was chosen. However, not all aspects are equally important for all industries. Therefore, in
the following subsections, we will shortly describe the industries, identify their most relevant
requirements and match them to the most important aspects that were presented in the
previous sections.
For the representation of different criteria-significances, we will present industry-specific
importance values whose entries vary from 1 for “least important” until 10 for “crucial”. The
evaluation will be done according to already conducted industry-interviews, the findings of
BRIDGE [3] and interviews conducted in the scope of this deliverable.
4.4.1 Automotive Industry Importance Values
The automotive industry is looking for a system that can be used for more than an anti-
counterfeiting application. The benefits of RFID-technology are clearly recognized. However,
the drawbacks such as relatively high tag prices compared to the margins (this is different
according to the usage in an open or closed loop environment; see detailed definition in [9])
of the parts and products and the still existing challenges regarding the usage of RFID-
technology with metals and liquids are overbalancing the advantages. For the usage in
closed loop environments, the German Automotive Association (VDA – Verband der
Automobilindustrie) has issued the recommendation VDA 5501 for the usage of RFID
technology in the bins logistics which even foresees the usage of active tags [21]. The VDA
is equally evaluating the potentials of RFID-technology in anti-counterfeiting.
According to the BRIDGE deliverable [3], the automotive industry is characterized by a large
network of suppliers surrounding the automotive manufacturers, low margins, high volumes
of products, difficult surfaces and structures of parts and thus a difficult feature application.
Besides, the tamper-evident property of features and their application at high speeds during
production were also mentioned. Moreover, strong physical requirements for parts, not only
regarding very high and very low temperatures and pressure, but also lifetime (partially more
than 15-20 years [21]), and the necessity for an extensible solution, which potentially could
support also logistical processes and the detection of parallel traded goods were mentioned
as requirements.
Thus, from the 16 criteria introduced in section 4.1 the following six have the highest
relevance in the automotive industry and should therefore be covered by the anti-
counterfeiting technology: production speed application, also linked with volumes, and
therefore also linked with the authentication speed per item, the difficulty of product
application, altogether with the available space on products (considering also their surface
structure and form), the security and health relevance of products, the automatic
authentication and the support of customs. The results are summarized in the table below.

BRIDGE – Building Radio frequency IDentification solutions for the Global Environment
D5.3 Anti-counterfeiting Business Case Report 36/79 December 2007
Table 13 Importance Vector of the Automotive Industry
I) II) III) IV)
1 2 3 4 5 6 7 8 9 10 11 12 13 14 15 16
Automotive Vector 2 3 2 1 3 2 2 2 1 2 3 2 2 2 3 3
Importance Vector 1 7 1 6 8 1 1 1 1 1 6 7 1 1 8 1
Resulting Vector 2 21 2 6 24 2 2 2 1 2 18 14 2 2 24 3
4.4.2 Aerospace Industry Importance Values
In contrast to the automotive industry, the aerospace industry is characterized by a small
number of producers and suppliers, which are to 70% common to the two biggest aircraft
manufacturers Boeing and Airbus SAS [3, p. 26]. The aerospace industry seeks to employ
RFID-technology on the one hand in the fields of logistics, aircraft reparation and warehouse
management systems, and on the other hand in product diversion, anti-counterfeiting and
tracking and tracing of spare parts for liability and warranty issues. Moreover, in
manufacturing, so called smart bins can be equipped with RFID-technology and be tracked
and traced through facilities for better accuracy of inventory data.
The major requirements in the aerospace industry summarize as follows: the storage of the
product information (description) and the product lifecycle report on the tag and the reduction
of the amount of data that is entered manually by the user – in order to reduce errors – are
crucial. Moreover, fast automatic or automated authentication checks also from outside the
aircraft (without a direct line of sight), a long lifetime of the feature or the technology and a
resistance against, for example, very high and very low temperatures (-60°C to +60°C),
humidity, acids, oil and different pressures (as defined in the Spec 2000 document) is also
very important. Due to the security relevance, tamper resistance features are of high
relevance.
Thus, from the 16 criteria presented in section 4.1, the following seven aspects have the
highest relevance in the aerospace industry, and should be covered by the anti-counterfeiting
technology: height of security level, the maturity of the solution, the difficulty of product
application, the possibility to remove and reapply, the maintenance of a clean supply chain,
the consideration of security and health relevant products (but also financial aspects such as
retail prices of products), the space of the products (along with the surface and the form of
the products), the usage of a device for authentication and an automatic authentication. The
table below summarizes the results.
Table 14 Importance Vector of the Aerospace Industry
I) II) III) IV)
1 2 3 4 5 6 7 8 9 10 11 12 13 14 15 16
Aerospace Vector 3 1 3 1 1 3 2 2 1 3 3 3 2 2 2 3
Importance Vector 10 1 7 1 1 8 1 1 1 1 9 5 8 1 8 1
Resulting Vector 30 1 21 1 1 24 2 2 1 3 27 15 16 2 16 3

BRIDGE – Building Radio frequency IDentification solutions for the Global Environment
D5.3 Anti-counterfeiting Business Case Report 37/79 December 2007
4.4.3 Pharmaceutical Industry Importance Values
The pharmaceutical industry is bound to national and international regulations. Mainly
security and health relevant products are traded and manufacturers fear for patient safety
and brand image. High volumes of products, partially with high margins and high retail prices
are traded. Along with very complex supply chains and a high number of supply chain
partners, this fact makes the pharmaceutical industry especially susceptible to counterfeiting
and other illicit trading activities (see also [15]). Distribution channels for counterfeits in the
pharmaceutical industry are very diverse and counterfeiters are especially creative in selling
their goods (see also reference to [17]).
One of the major challenges in the pharmaceutical industry is the fulfillment of national and
international regulations imposed by the legislation (compliance). Moreover, manufacturers
seek to bring more transparency into the sophisticated pharmaceutical supply chain and thus
gaining more control throughout the channel. As a result, the detection of counterfeit
products could be rendered far more effective, as well as the detection of repackaging
practices. Logistical reasons also require a more transparent supply chain, since there is
more potential for more effective supply chains and for more applications such as more
targeted product recall.
From an anti-counterfeiting point of view, the authentication should be possible on the level
of an individual drug and the tag or feature should be closely attached to the product (should
not be easily removable; tamper-resistance). Moreover, it should be readable from varying
distances, with handheld, fixed or mobile devices. However, crypto-tags are not necessary,
since online authentication is preferred. An international warning system, in case of the
detection of counterfeit goods, would be a big advantage in the pharmaceutical industry.
Thus, from the 16 criteria presented in section 4.1, twelve aspects have a very high
relevance in the pharmaceutical industry and should therefore be covered by the anti-
counterfeiting technology: height of security level, authentication speed per item, production
speed application, space on the product, possibility to remove and to reapply, maturity of the
technology, complexity of supply chain, trust relationship, structure and dynamic of the
supply chain, the possibility to maintain a clean supply chain, and the usage by consumer.
The table below summarizes the results.
Table 15 Importance Vector of the Pharmaceutical Industry
I) II) III) IV)
1 2 3 4 5 6 7 8 9 10 11 12 13 14 15 16
Pharmaceutical Vector 3 3 3 2 3 3 3 2 3 3 3 1 3 2 3 1
Importance Vector 8 8 7 1 8 8 9 7 7 8 9 5 1 1 1 4
Resulting Vector 24 24 21 2 24 24 27 14 21 24 27 5 3 2 3 4

BRIDGE – Building Radio frequency IDentification solutions for the Global Environment
D5.3 Anti-counterfeiting Business Case Report 38/79 December 2007
4.4.4 Consumer Goods and Retail Industry Importance Values
Supply chains for consumer goods can be quite complex, which is due to their structure and
the number of supply chain partners. Due to the generally low retail prices and often also low
margins, is it crucial that the fixed and the variable costs of an anti-counterfeiting technology
are rather low, compared to the product price itself. Due to the high volumes in this industry,
a production speed application would be required in order to avoid a potential bottle-neck in
the production. The products should be easy to authenticate and also easily used by the
consumer. The products, however, are in general not very security or health relevant.
The above mentioned requirements match six out of the 16 introduced criteria. These criteria
are of high relevance to the consumer goods and retail industry and should therefore be
covered by the anti-counterfeiting technology: production speed application, number of
supply chain partners, the structure and complexity of the supply chain. Moreover, the
solution should take high volumes of products into account and shall be easily useable by the
consumer.
Table 16 Importance Vector of the Consumer Goods and Retail Industry
I) II) III) IV)
1 2 3 4 5 6 7 8 9 10 11 12 13 14 15 16
CG and Retail Vector 1 2 2 2 3 2 2 2 2 2 1 2 2 2 2 1
Importance Vector 1 2 1 1 8 1 6 1 1 7 1 1 1 6 1 5
Resulting Vector 1 2 2 2 24 2 12 2 2 14 1 2 2 12 2 5
4.4.5 Information Technology Industry Importance Values
A major part of the IT hardware and software is manufactured in Far East Asia and is, from
there, distributed in the world all over, through complex supply chains with many supply
chain partners. Due to the high volumes, product-specific high retail prices and low margins,
a high production speed application of a potential anti-counterfeiting “feature” is required.
Moreover, the authentication should be made possible also for customs and for end users.
Thus, from the 16 criteria introduced in section 4.1, the following five aspects have the
highest relevance in the IT industry, and should thus be covered by the anti-counterfeiting
technology: high production speed required, consideration of the complexity of the supply
chain, its structure, its dynamic, its number of partners, and the usage by the consumer.
Table 17 Importance Vector of the Information Technology Industry
I) II) III) IV)
1 2 3 4 5 6 7 8 9 10 11 12 13 14 15 16
IT Industry Vector 2 2 2 2 2 3 2 2 2 2 1 2 2 2 2 1
Importance Vector 1 1 1 1 7 1 6 1 5 6 1 1 1 1 1 6
Resulting Vector 2 2 2 2 14 3 12 2 10 12 1 2 2 2 2 6

BRIDGE – Building Radio frequency IDentification solutions for the Global Environment
D5.3 Anti-counterfeiting Business Case Report 39/79 December 2007
The following table aggregates the importance vectors of all considered industries.
Table 18 Aggregated Importance Values for all considered Industries
I) II) III) IV)
L
ev
el
of
Se
cu
rity
Au
then
tica
tio
n S
pee
d
Matu
rity
o
f th
e
Te
ch
no
log
y
Dif
ficu
lty
of
Ap
pli
ca
tio
n
Sp
ee
d
of
Fe
atu
re
Ap
pli
cati
on
Dif
ficu
lty
to
R
em
ov
e
an
d R
ea
pp
ly
Co
mp
lex
ity o
f th
e S
C
Tru
st
Re
lati
on
sh
ip
an
d
Da
ta S
hari
ng
Dy
nam
ic o
f T
he
SC
Ne
ce
ss
ity
o
f
Main
tain
ing
a C
lea
n S
C
Se
cu
rity
an
d
He
alt
h
Re
lev
an
ce o
f P
rod
uc
ts
Av
ail
ab
le S
pa
ce o
n t
he
Pro
du
cts
fo
r F
ea
ture
s
Po
ss
ibilit
y
of
De
vic
es
for
Au
the
nti
ca
tio
n
De
sir
ed
E
as
ine
ss
to
Au
then
tica
te
Au
tom
ati
c
Au
then
tica
tio
n R
eq
.
Us
ag
e b
y t
he C
on
su
mer
Resulting Vector
Automotive 2 21 2 6 24 2 2 2 1 2 18 14 2 2 24 3
Resulting Vector
Aerospace 30 1 21 1 1 24 2 2 1 3 27 15 16 2 16 3
Resulting Vector
Pharmaceutical 24 24 21 2 24 24 27 14 21 24 27 5 3 2 3 4
Resulting Vector
CG and Retail 1 2 2 2 24 2 12 2 2 14 1 2 2 12 2 5
Resulting Vector
IT 2 2 2 2 14 3 12 2 10 12 1 2 2 2 2 6
4.4.6 Technology-Industry Matching and Discussion
The result of this part of the business case is the optimal matching between anti-
counterfeiting technologies and industries. We are mostly interested in the question: in which
industry are Auto-ID based anti-counterfeiting technologies superior to other, non Auto-ID
based technologies? Hence, in this section we will present and discuss the findings of our
analysis which was performed according to the methodology introduced in section 3.
The results confirm in the majority of our first assumptions. In some cases, however, the
resulting matchings are rather counter intuitive. Therefore, besides their presentation we also
discuss the matchings where necessary.
Automotive Industry
The results concerning the automotive industry imply that RFID-based anti-counterfeiting
solutions are rather well suited in this industry. The reasons are the authentication speed,
which is superior to other technologies, the possibility to perform an automated
authentication, which is important considering the high volumes and the potential bottle-neck
and also due to the height of the security level, which makes these technologies suitable for
security relevant products. Compared to other solutions, RFID-based solutions manage the
most important aspects for the automotive industry quite successfully. In detail,

BRIDGE – Building Radio frequency IDentification solutions for the Global Environment
D5.3 Anti-counterfeiting Business Case Report 40/79 December 2007
authentication based on RFID and unique identifiers, RFID and track-and-trace data, the
ePedigree and secure authentication using cryptographic tags are well suited.
Other solutions such as direct authentication solutions are in the intermediary ranks, since
they require no additional effort regarding the application on the product, nor do they have
any space requirements, however, they’re low authentication speed and the inexistent
possibility to authenticate automatically do not match the requirements of the automotive
industry. This applies very much to the laser surface authentication approach. Its strengths
lie in the absence of a special feature to be applied, in the little space which is consumed (no
space) and in the possibility to secure security and health relevant products. However,
considering the fact that a “fingerprint” would have to be scanned and stored (potentially for
every product or whenever a composition of the material is changed) would make an
application difficult. Moreover, almost every supply chain partner would have to have a laser
scanning device and an access to the fingerprint database, and since this technology
requires also more time for the authentication, it would only represent a bottleneck in the
supply chain of the automotive industry.
Taggants, together with photo comparison range in the end of the ranking. This position is
quite easy to explain. Counterfeit products in the automotive industry often strongly resemble
the genuine parts but do often not have any functionality. A photo comparison would
therefore mislead the user, customs, and supply chain partner. Moreover, counterfeiters
have successfully managed to copy taggants such as holograms, giving the consumers a
false sense of security.
Again considering Auto-ID based solutions for the automotive industry, we saw that they are
well suited to match the industry-specific requirements. However, a still relatively high price
for the tags (considering the margins in this industry) make these technologies more likely in
this industry (on item-level in an open-loop scenario) as soon as the tag prices decrease and
more applications, using the same hard- and software, are introduced. According to
interviews with representatives from the German Automobile Association (VDA), RFID-based
anti-counterfeiting is already being considered for the future in the automotive industry.
Aerospace Industry
The analysis results of the aerospace industry imply that RFID-based anti-counterfeiting
technologies only rank in the upper midfield of the considered solutions. It strikes that the
forensic analysis method achieves a very good ranking among the considered technologies.
However, considering that this method was assigned a high “security level” evaluation, which
was in turn required by the aerospace industry, its ranking does not astonish. Its use, is due
to technical and organizational reasons in this industry not applicable though. The CDP
technology ranked equally well and is placed in position two. Same applies for the LSA
analysis method. RFID-supported anti-counterfeiting technologies, based on the verification
of unique identifiers, secure object authentication using cryptographic tags, the analysis of
track-and-trace data and the ePedigree, however, do as in the automotive industry meet the
requirements of this industry quite well. Here again, these technologies are well-suited due to
the possibility of automated authentication, the height of the security level and therefore also
BRIDGE – Building Radio frequency IDentification solutions for the Global Environment
D5.3 Anti-counterfeiting Business Case Report 41/79 December 2007
their adequateness for security and/or health relevant products. Regarding the estimated
possibility to keep the supply chain clean of counterfeit products, the secure object
authentication and the authentication using unique identifiers, both based on RFID
technology underperformed though. One possible interpretation for this result is that the
requirements, regarding the necessity of the trace, especially of used spare parts, are high.
Moreover, authentication methods based on RFID technology have another important
advantage, as information regarding the lifecycle of the product can be stored in the memory
of the tag, thus making the use of RFID tags in general very beneficial. Data could also be
read independent of the connection to a remote database. Track-and-trace and the
verification of unique serial numbers, both based on the barcode range amongst the last
technologies. The inability to store additional data “on the part”, as it is required in this
industry, makes this “data carrier”, be it the 1D or the 2D barcode, less attractive. The same
reasons for a bad ranking apply for the CDP-technology in this industry. An engineer,
equipped with a mobile phone (with a camera) could check the authenticity of the products.
He would receive the required information from the backend, but writing important lifecycle
data “on the part” would again not be possible.
Again, the anti-counterfeiting approach of a mere photo comparison between the part and a
photo of it ranked on the last position, since counterfeits (or parts of them), especially in case
of used spare parts, are not visible to the naked eye.
A big German airline carrier is currently testing an RFID-based tracking and tracing solution
for spare parts based on RFID. Their results are encouraging and shall be pursued.
Pharmaceutical Industry
The results obtained for the pharmaceutical show that only a minority of the considered anti-
counterfeiting technologies meet industry’s requirements. RFID-based anti-counterfeiting
technologies, however, are adequate to secure pharmaceutical products and can quite well
cope with the requirements imposed by complex supply chains with many supply chain
partners. According to the results, RFID cryptographic tags, the electronic pedigree based on
RFID technology and an RFID track-and-trace solution suit best the requirements of the
industry. However, considering the higher price of the cryptographic tags, this technology
might only be suited for distinguished products within this industry.
A track-and-trace solution based on barcode (e.g., data matrix) is ranked less well than the
track-and-trace based on RFID technology, signifying that it is less suitable for this industry.
The main reason for this result might be that large volumes, tagged on item-level, have to be
handled across the supply chain and that a technology which requires the direct line of sight
between the reader and the feature would represent a bottle-neck, both in production, as well
as in the distribution in such complex supply chains as they are common in the
pharmaceutical industry. For the same reasons, the authentication based on the verification
of unique identifiers, both based on RFID or barcode does not range well among the other
technologies, whereas the RFID version is still represented in the upper midfield. The weak
authentication approach based on RFID also ranges in the last third of the considered
technologies. The missing capability of providing a required trace of a product by regulation

BRIDGE – Building Radio frequency IDentification solutions for the Global Environment
D5.3 Anti-counterfeiting Business Case Report 42/79 December 2007
authorities, disqualifies both the weak and strong authentication approaches where they are
deployed in isolation. Same applies for the authentication based on object features (RFID
supported) and for the CDP technology.
As for the technologies based on direct authentication (photo comparison, forensic analysis
and LSA), these do least meet the requirements (especially for regulation reasons stated
above) of the pharmaceutical industry. Using them in unique cases might be adequate, but
considering the fact that photo comparison is too coarse and cannot be used for pills, and
that both, forensic analysis and the LSA technology require special devices that should have
to be placed at each supply chain partner (in worst case), implying more hardware, a bottle-
neck in the supply chain, and maintenance and service costs, it appears unrealistic to use
these technologies for the necessities of pharmaceutical supply chains.
All in all, the results confirm that RFID-based anti-counterfeiting technologies, which provide
a trace of the products, are best suited in the pharmaceutical supply.
Consumer Goods and Retail Industry
The obtained results imply that RFID-based track-and-trace solutions, while not considering
the cost side, are well suited to meet the demands of the consumer goods and retail industry.
Track-and-trace solutions based on RFID technology, the ePedigree, object specific features
stored on RFID tags and the verification of unique identifiers based on RFID seem to be well
suited. However, track-and-trace enabled by the barcode technology has a very good
ranking as well. The main reason for this finding is again that in contrast to the aerospace
industry, the requirements concerning the information-writing “on the product”, are according
to industry-interviews, not existent. RFID-based approaches are followed by the CDP
technology and taggants that can be applied on products. Direct authentication approaches,
however, do again least meet the requirements of the pharmaceutical industry. Using them in
unique cases might be adequate, but considering the fact that photo comparison is too
coarse, and that both, forensic analysis and the LSA technology require special devices that
should have to be placed at each supply chain partner (in worst case), implying more
hardware, a bottle-neck in the supply chain, and maintenance and service costs, it appears
unrealistic to use these technologies for the necessities of the consumer goods and retail
industry. It might be interesting, however, that the photo comparison technique is better
ranked in this industry than the other direct authentication approaches.
To be upfront with the employment of RFID-based solutions for anti-counterfeiting in the
consumer goods and retail industry, these technologies will on the short term most probably
not be introduced for the pure purpose of anti-counterfeiting. This does not mean that this
technology will not be successful here. But considering the business process changes, the
investments into hard- and software and the high ratio between average product prices and
RFID-tag prices, from today’s point of view, the introduction for this industry cannot be yet
economically justified. This will surely change as soon as track-and-trace functionality is
associated with more benefits and RFID-prices drop further, making product-tagging on item-
level in the consumer goods and retail industry more realistic.

BRIDGE – Building Radio frequency IDentification solutions for the Global Environment
D5.3 Anti-counterfeiting Business Case Report 43/79 December 2007
The ranking of all feature-based solutions, however, is deteriorated by the criterion that
features can potentially be easily removed and reapplied on another, for example, counterfeit
product (see also page 21).
Information Technology Industry
According to the results, various anti-counterfeiting technologies would meet the major
requirements of the information technology industry: applicable features on production line
speed and maintaining a clean supply chain. RFID-based solutions, however, would receive
a better ranking if a solution, such as tamper resistance or “break-upon-removal” of the RFID
tags would be in place. Their ranking is deteriorated by the criterion that tags can potentially
be removed and reapplied on another, for example, counterfeit product. Apart from that,
track-and-trace based on RFID technology, the secure object authentication based on
cryptographic tags and the ePedigree meet the requirements well. In contrast to the
aerospace industry, track-and-trace based on the barcode as data carrier as well as CDP
technology are also quite well suited for meeting the industry-specific requirements.
However, they receive a slightly worse ranking since these technologies cannot be verified
automatically.
As for the technologies based on direct authentication (photo comparison, forensic analysis
and LSA), these do least meet the requirements of the information technology industry.
Using them in unique cases like the comparison of a professional photo by an expert might
be adequate, but considering the fact that photo comparison is too coarse, and that both,
forensic analysis and the LSA technology require special devices that should have to be
placed at each supply chain partner (in worst case), implying more hardware, a bottle-neck in
the supply chain, and maintenance and service costs, it appears unrealistic to use these
technologies for the necessities of the information technology industry supply chains.
4.5 Summary of Selection Matrix Findings
As stated in the beginning of the analysis, while matching industry-requirements regarding an
anti-counterfeiting technology with the properties of these technologies, we had to make
generalizations and estimations, both regarding the industries and the technologies, which
are expressed in the values ranging from one to three. Moreover, the estimations of the
technology properties are done relative to each other. However, using our methodology and
taking into account the industry-specific importance of the criteria in the industries, we
generally received a good overview of anti-counterfeiting technologies and their
adequateness regarding the considered industries.
Since we used numeric values to “calculate” the adequateness of the technology regarding
the industry, combined with industry-specific importance values, we also received industry-
specific numeric results. For the sake of a better comparability, interpretation, and
comparison of technologies among the industries, we replaced the numeric results (see
Appendix B) with use symbols. The resulting values are difficult to interpret due to several
reasons. Our approach has taken five different industries into account, each with different
industry- and industry-importance values. As a consequence, the matching of the
technologies to the industries is always industry-specific. Resulting numbers such as “35” or

BRIDGE – Building Radio frequency IDentification solutions for the Global Environment
D5.3 Anti-counterfeiting Business Case Report 44/79 December 2007
“-9” have different interpretations in the pharmaceutical industry, than in the “consumer
goods and retail industry”. Moreover, the numbers did not allow for a performance
comparison of technologies between industries, for example that secure object
authentication meets the requirements of one industry, but does not meet them in another
industry. For these reasons, we replaced the not meaningful values by symbols (“-/--“,”�”
and “+/++”). According to the final ranking of the technologies in each industry, we assigned
the symbols according to an industry-specific range of values:
• “-“ or “- -“: the single, or the double minus-symbol accordingly, signify an
inadequateness of the technology for the industry according the defined
requirements.
• “�”: the circular symbol represents a neither negative, nor negative match between
the technology and the industry requirements. It is up to the cost analysis to state
whether this technology is, from a financial point of view, better suited than other
technologies. From a technical point of view it is “neutral”.
• “+” or “++”: the single, or the double plus-symbol accordingly, signify an adequate
match between the technology’s properties regarding the industry-requirements.
Table 19 Matching between Industry Requirements and Technology Properties
Automotive
Industry
Aerospace
Industry
Pharma
Industry
CG & Retail
Industry
IT
Industry
Photo Comparison ▬ ▬ ▬ ▬ ▬ ▬ � ▬
Forensic Analysis ▬ ▬ ▬ ▬ ▬ ▬ ▬ ▬ ▬ Direct
Authentication
LSA ▬ ▬ ▬ ▬ ▬ ▬ ▬ ▬ ▬
CDP � ▬(▬) � � � Authentication by Means of
a Difficult to Reproduce
Feature Taggants (Chemical etc.) ▬ ▬ ▬ ▬ � �
Barcode � ▬ ▬ ▬ � � Verification of Unique
Identifiers RFID �(�) ▬ ▬ ▬ �� �
Barcode (2D) �(�) ▬ ▬ � �� � Plausibility Check of Track
and Trace Data RFID �� �� �� �� �
Secure Object
Authentication RFID Cryptographic tags �� �(�) �� � �
RFID and
Object Specific Features � �(�) ▬ �� �
Weak Authentication (TID) �(�) �(�) ▬ � � Other RFID based
Authentication Methods
RFID ePedigree �� �� �� �� �
It is quite interesting to see that the results of the IT industry do not diverge as much as the
results for the pharmaceutical industry, for example, where RFID-based anti-counterfeiting
technologies seem to be leading. Moreover, authentication methods based on direct
authentication seem to not sufficiently meet the requirements of any of the considered

BRIDGE – Building Radio frequency IDentification solutions for the Global Environment
D5.3 Anti-counterfeiting Business Case Report 45/79 December 2007
industries. The requirements, regarding checks in complex supply chains or the speed of
authentication, seem to be to too challenging to be met by these approaches. It also strikes
that the majority of the anti-counterfeiting technologies seem to be adequate for the
consumer goods and retail industry. However, our analysis was performed without
considering costs of the solutions. Since margins in the consumer goods and retail industry,
as well as in the automotive industry are not very high, some of the suiting technologies
might not be applicable due to cost reasons, unless this technology is not uniquely used for
anti-counterfeiting reasons and offers more applications.
Having taken more than only Auto-ID based anti-counterfeiting solutions into our
considerations allows us on the one hand to identify the industries where and why RFID-
based solutions are at their best, and on the other hand shows us with which other
technologies they are “competing”. This information is very important for the following
calculation of the business case, using two different scenarios in industries, where RFID-
technology is beneficial. Despite the high investments compared to other technologies, the
great advantages of RFID-employment along with an implementation of a track-and-trace
infrastructure, speak in favor of this technology.

BRIDGE – Building Radio frequency IDentification solutions for the Global Environment
D5.3 Anti-counterfeiting Business Case Report 46/79 December 2007
5 Cost side calculations
Costs of the solution are divided into one-time set-up and variable expenses. Set-up
comprises expenses for consulting and planning, hardware and software, system integration
in both existing (software) resource planning systems and (hardware) production processes.
Principle set-up costs are closely related to the installation of general RFID systems; the
calculations thereof are discussed in consulting papers (e.g., [22]).
Variable expenses stem from the cost of transponders and their product integration, system
maintenance, and expenses related to the inspection and reaction processes. The latter are
difficult to estimate. Depending on the application scenario, product inspections may be
seamlessly integrated into existing process steps (e.g., at checkouts at retail markets), may
be carried out by external stakeholders (e.g., by customs officials), or may require company
employees or external service providers to conduct inspections personally (e.g., by visiting
warehouses or shops). The detection of counterfeit articles requires the brand holder to
decide whether to have the articles seized, whether to initiate further investigations, or
whether claims for damages should be filed. Since the technical solution is likely to increase
the number of known cases, reaction measures can constitute an important cost factor. The
latter statement especially holds in markets with a high share of imitation products.
5.1 Solution concept
We choose to investigate the cost side of a track and trace based solution. The reason for
this is that such solution can be implemented without modifications to tag and reader
hardware, the track and trace infrastructure represents a basis for other countermeasures,
and it is under special attention in this Work Package. In these cost calculations, the
following implementation of the track and trace based product authentication system is
assumed: The functionality to detect suspicious products (products that do not have a valid
EPC number or products that have a copied EPC number) resides in the level of the core
services of the EPC network. We refer to this service as the EPC Trace Analysis Service
(EPC-TAS) (for more details see [3]) and it requires that all supply chain partners who handle
the products agree to share shipping and receiving notifications with the system. In this way,
the EPC-TAS will obtain a good visibility of the movement of the products and thus it can in
real time analyze the complete traces of products to detect the cloned tags, i.e. counterfeit
products. The primary functionality of this service is to receive queries of triplets {EPC,
Location, Time} and to answer whether the product under study is genuine or a suspicious
one. The assumed solution architecture is illustrated in Figure 1 which describes how an
accessing application where the authenticity of tagged products is verified can query EPC-
TAS to make sure the product under study is genuine.

BRIDGE – Building Radio frequency IDentification solutions for the Global Environment
D5.3 Anti-counterfeiting Business Case Report 47/79 December 2007
Figure 1. The assumed architecture for track and trace based plausibility checks (for
more details see D5.2 – Anti-Counterfeiting Requirements Report)
5.2 Cost calculator
System set-up costs
• Consulting and planning costs occur when the company must rely on external know-
how and workforce in the planning phase of the system set-up. This is the case
when the company lacks know-how or resources of the use of RFID in operational
improvements.
• Hardware expenses include the costs of RFID readers and antennas, work stations,
servers (e.g., the EPC-TAS, Figure 1), RFID printers, and network infrastructure.
The needed hardware depends on the case and properties of the supply chain; for
example, item tagging requires more readers than case and pallet level tagging,
mostly in the store level. In this business case calculation, these costs are estimated
using a bottom-up cost calculation using example prices of off-the-shelf hardware.
• Software expenses include all software licenses that are needed on work stations,
servers, and RFID middleware, for the depreciable lifetime of the investment (here

BRIDGE – Building Radio frequency IDentification solutions for the Global Environment
D5.3 Anti-counterfeiting Business Case Report 48/79 December 2007
four years). In the related literature, software expenses amount roughly as much as
the hardware expenses (e.g., [22], [23]). In addition, when standard application
software is used instead of in-house or custom development, the annual license
fees cost about 12-15% of the initial purchase price [24]. These license fees include
new releases which provide improved features and we consider them a part of
yearly system maintenance fees. If the legacy ERP systems do not support item-
level information and it is required by the system, the software expenses include
also ERP system updates. In this business case calculation, we estimate that the
cost of middleware is 1000 EUR per reader [25]. The average cost of software is
estimated to be 1000 EUR per server, work station and RFID printer.
• System integration costs consist of installation and configuration of hardware and
software including reader installation, EPC-IS and EPC-DS server installation as
well as integration with legacy systems such as ERP system, manufacturing system,
or point of sales system. We assume that the system integration is done in
collaboration of the company’s internal IT department and the software and
hardware vendors and integrators. In this business case calculation, we estimate
that the system integration costs are 20,000 EUR for the first manufacturing or
packaging location where the RFID tags are affixed (and 10,000 EUR for all further
ones), 20,000 EUR for the first customs import warehouse where a reading station
is built (and 10,000 EUR for all further ones), and 10,000 EUR for the first
distribution center, warehouse or a retail store where the tags are read (and 5,000
EUR for all further ones). The decreasing integration costs of further locations are
due to learning effects and economics of scale.
• Product line changes might be necessary to enable product tagging in the
manufacturing site. It is very undesirable that integration of tags to products would
decrease the speed of a production line, so production line changes are often a
more viable solution. These changes may include modifications in manufacturing
processes and equipment.
• Internal project team for set-up includes company’s employees from the IT
department and employees who have knowledge of the planned process changes.
An internal process team is necessary to plan and manage the process
transformation that introduction of RFID represents and it can be gathered from
existing employees. These expenditures are mostly opportunity costs.
• Initial EPCglobal subscription fee is asked from new EPCglobal subscribers. The
amount depends on the company’s turnover and country where the company is
headquartered [26].
Annual variable system costs
• Cost of RFID transponder is a major cost driver of the solution. The low-cost RFID
inlays – such as EPC Class-1 Gen-2 – cost less than ten Euro cents apiece in large
volumes today, but the five cent tag is not yet reality. The most expensive RFID
transponders resemble wireless smart card circuits and cost up to several Euros a
piece, providing improved security functions for product authentication. The average

BRIDGE – Building Radio frequency IDentification solutions for the Global Environment
D5.3 Anti-counterfeiting Business Case Report 49/79 December 2007
price for passive UHF tags is expected to drop to 16 dollar cents by 2008 [27]. Alien
Technology has sold EPC Class-1 RFID labels for 12.9 dollar cents apiece for
quantities 1 million or more [28]. Appendix A shows how basic EPC Class-1 Gen-2
labels can be bought for 15 dollar cents apiece in quantities of twenty thousand tags
today. Consequently, in this business calculation, we estimate that the cost of one
EPC Class-1 Gen-2 transponder during the investment period (2008-2011) is 0.11-
0.13 EUR, depending on the ordering quantity.
• Cost of integration is the variable cost due to integrating the RFID tag to the product,
including variable material costs (e.g., that of RFID printer device, adhesives etc.)
and labor cost (e.g., tagged cases are read manually). Together with the cost of
RFID transponder, the integration cost is multiplied with the number of items to be
tagged.
• Maintenance costs including operational support are needed to maintain the
operability of the infrastructure. Leung et al. [22] estimated that maintenance and
operational support for RFID reader network generates additional cost that is 10-
15% of the initial capital investment. In this business calculation, we estimate that
annual maintenance costs are 15% of the initial hardware expenditures plus 15% of
the software expenditures as annual license fees. A similar estimation is also used
in [29].
• EPCglobal subscribers need to pay an annual fee for the subscription. The amount
depends on the company’s turnover and country where the company is
headquartered.
Annual inspection and reaction costs
• Product inspection team consists of new employees whose job is to monitor the
supply chain for suspect products the RFID based product authentication system
detects, to assist personnel who are on site where suspect products are detected,
and to conduct additional inspections by test purchases. This cost category also
includes the additional hardware cost the inspection team needs. The inspection
team reports the incidents to the legal department that handles the cases. The total
cost of product inspection team can be calculated as the overall yearly working time
times the employee cost rate. This business case is calculated using the rate of 420
EUR per man day.
• Training is needed to assist the onsite personnel how to handle the suspected
counterfeit products and how to collaborate with the product inspection team. For
example, the training includes spreading the knowledge of existing security features
so that onsite personnel know that products that do not have RFID tags (in the case
that all genuine products are tagged) are suspicious. The training costs are partly
opportunity costs.
• Travel expenses occur when the product inspection team conducts inspections
outside the licit supply chain and moves inside the licit supply chain to support
closer inspections of suspicious, for example possibly cloned, products.

BRIDGE – Building Radio frequency IDentification solutions for the Global Environment
D5.3 Anti-counterfeiting Business Case Report 50/79 December 2007
• Test purchases are needed to inspect products outside the licit supply chain in order
to locate vendors of counterfeit goods.
• Reaction costs are the additional costs that occur when an incident is handled. They
can be evaluated by estimating the number of additional cases due to the product
inspection team and the RFID-based product authentication system and the average
reaction cost per case. The latter term is likely to be higher for small companies who
might not have the needed know-how (e.g., lawyers) to handle the cases in house.
Other parameters
• The up-front investment for system set-up, which contains hardware, software and
services expenditures, needs to be depreciated over the complete investment’s life
span. This business case is calculated using four years depreciation time.
• To calculate the present value of the investment (here the cost side), one needs to
assume the discount rate for future cash flows. The discount rate represents a
company’s cost of capital and is highest for small and growing companies. This
business case is calculated using the discount rate of 6% that is regarded typical for
a mature manufacturing company.
5.3 Case 1 – ACME Luxury Goods
This subsection presents an example cost calculation for an imaginary luxury good company.
Even though the luxury goods industry is not considered in the technology selection part of
this deliverable, the industry is nevertheless affected by counterfeiting and luxury goods
manufacturers are considering the use of EPC/RFID for item-level tagging. The figures are
based on the presented assumptions and prior experience for the example companies of that
size. However, it must be emphasized that they only represent an example scenario and
must be adjusted for real-life cases according to available data.
5.3.1 Description
The following analysis refers to the solution scenario as outlined in subsection 2.1.1. The
fictional company – ACME Luxury Goods1 – produces 4,000,000 frequently-counterfeited
articles annually that sell for an average price of 60 EUR. The product portfolio includes
watches, jewelry, perfumes, leather goods etc. The company’s turnover is 600 Mio EUR. The
associated brand serves as a sign of quality, personal taste and wealth and thus it is a
lucrative target for counterfeiters. Standard EPC Class-1 Gen-2 UHF transponders are
integrated into individual articles, and an inspection team protects and monitors the licit
supply chain and conducts inspections at suspicious vendors.
The company has its own retail network that sells about one third of the products and the
company’s main regional markets are Europe and North America. The international supply
chain consists of 5 production plants and packaging centers where the tags are affixed to
products, 5 regional distribution centers, 5 other warehouses, and 30 retail stores. Each of
these business locations will be equipped with RFID reading station(s) and a workstation
where the products are read. A lack of transponder or a false EPC number in a product
1 The example company is loosely based on a real luxury goods company

BRIDGE – Building Radio frequency IDentification solutions for the Global Environment
D5.3 Anti-counterfeiting Business Case Report 51/79 December 2007
indicates counterfeit origin. In addition, the product authentication system detects suspicious
products (e.g.,, possible cloned tags) for further investigations. A custom-built interface
allows an inspection team to monitor the complete supply chain for counterfeit products
Per year, 4,000,000 individual articles are to
be equipped with RFID transponders. The tag
is integrated in the product’s packaging. Since
the RFID system is integrated into an existing
manufacturing and packaging landscape,
some production-line-related changes are
required which are included in the calculation,
as are expenses for consulting and the cost of
an internal project team during set up. The
enterprise resource planning software is
already capable of managing serial numbers
at item level, but minor changes are required
to accommodate a new numbering system.
Six network servers are needed to run the
EPC-IS and EPC-DS services. Transponders
are an important cost driver; due to
interoperability with other supply chain
applications, UHF tags are used. They have to be integrated during the packaging process.
Inspection and reaction-related expenses mostly stem from the handling of suspect cases,
and from employees who deal with individual cases of counterfeit occurrences. The checks
are performed in the European and North American supply chains. In addition, the inspection
team conducts test purchases to discover further sources of counterfeits. Please note that
the additional number of cases does not equal the number of additionally seized counterfeits
as only a selection of counterfeit occurrences initiate legal actions, and one case may include
numerous articles. The yearly training costs are estimated to amount one man day per
supply chain location where RFID readers are installed. Table 20 presents the individual cost
factors. A brake-down of the hardware expenses can be seen in Table 21.
CASE 1: FACT SHEET
Company name: ACME Luxury Goods Turnover: 600 Mio EUR Production volume:
4,000,000 products per year Average sales price:
60 EUR Supply chain for RFID integration:
5 production / packaging centres, 5 regional distribution centres,
5 warehouses, 30 retail stores Total annual cost of AC solution: 1,287,706 EUR

BRIDGE – Building Radio frequency IDentification solutions for the Global Environment
D5.3 Anti-counterfeiting Business Case Report 52/79 December 2007
Table 20. Cost calculation of total annual cost
One-time costs for system set-up Factor Cost
Consulting and planning 100,000 €
Hardware expenses 271,265 €
Software expenses 116,000 €
System integration 275,000 €
Production line changes 50,000 €
Internal project team for set-up 100,000 €
Initial EPCglobal subscription fee 28,000 €
Sum (EUR) 940,265 €
Annual variable system costs Factor Cost
No. of products to be tagged 4,000,000
Cost of RFID transponder 0.11 €
Cost of integration 0.02 €
Total cost of transponders and integration 520,000 €
Maintenance costs 40,690 €
EPCglobal annual fee 8,450 €
Sum (EUR) 569,140 €
Annual inspection and reaction costs Factor Cost
Product inspection team 3 FTE
Cost per man day 420 €
Total cost of product inspection team 327,600 €
Training 18,900 €
Travel expenses 18,000 €
Test purchases 10,000 €
Number of additional cases 100
Reaction cost per case 1,000 €
Total reaction costs 100,000 €
Sum (EUR) 474,500 €
Total annual cost (EUR) (*) 1,278,706 €
(*) Depreciable life of one-time investment: four years

BRIDGE – Building Radio frequency IDentification solutions for the Global Environment
D5.3 Anti-counterfeiting Business Case Report 53/79 December 2007
Table 21. Bottom-up calculation of hardware expenses2
Cost of reader equipment Factor Cost
Alien 9800 EPC Gen 2 RFID Reader 1 1,247 €
Alien 915 MHz Linear Antenna 4 117 €
Omron 10m Antenna Cable 4 90 €
Mounting Brackets 1 16 €
SUM (EUR) 2,093 €
Cost of work station
HP xw9400 Workstation 1 2,202 €
Cost of RFID printer
Zebra R110xi RFID Printer 1 3,253 €
Cost of server
HP ProLiant DL380 G5 1 2,424 €
Cost of networking infrastructure
Router 1 300 €
Cables 100 €
Sum (EUR) 400 €
Hardware Expenses
Cost of reader equipment 55 115,094 €
Cost of work station 45 99,092 €
Cost of RFID printer 10 32,532 €
Cost of server 6 14,547 €
Cost networking infrastructure 25 10,000 €
SUM (EUR) 1 271,265 €
Table 22. Present value of the cash flows resulting from yearly costs
Cash flow Factor Present value
Year 1 -1,983,904 € 1.00 -1,983,904 €
Year 2 -1,043,640 € 0.94 -984,566 €
Year 3 -1,043,640 € 0.89 -928,836 €
Year 4 -1,043,640 € 0.84 -876,260 €
SUM (EUR) -5,114,824 € -4,773,566 €
Table 23. Summary of the costs
Total cost 5,114,824 €
per manufactured product 0.32 €
as percentage of sales price of a product 0.53%
Discount rate 6%
2 Price sources: http://www.rfidsupplychain.com/; http://www.hp.com/; http://www.nextag.com/rfid-printer/

BRIDGE – Building Radio frequency IDentification solutions for the Global Environment
D5.3 Anti-counterfeiting Business Case Report 54/79 December 2007
Present value of total cost 4,773,566 €
Anti-counterfeiting specific cost 1,898,000 €
percentage of the total cost 37%
per manufactured product 0.12 €
per new counterfeiting case 4,745 €
5.3.2 Findings
The biggest cost driver of the solution is the tagging cost, accounting more than half million
euros every year and 45% of the total cost. This is an expected result since the number of
tagged articles is high. Roughly half of the start-up investment is needed for hardware costs
and system integration. According to the estimations, other important start-up costs are due
to software, internal, and external project teams.
The annual inspection and reaction costs account roughly as much as the yearly tagging
expenditures. This is an important finding. It suggests that the anti-counterfeiting specific
costs are a significant cost driver of the overall solution. Overall, anti-counterfeiting specific
costs claim 37% of the overall costs. However, it should be kept in mind that active
inspections and reactions are crucial in establishing the overall deterrent effect that anti-
counterfeiting solution has on counterfeiters’ business.
The discounted cash flow of the total costs is presented in Table 22. Owing to the relatively
low assumed depreciation time (4 years) and somewhat large size of the upfront investment,
as well as the low assumed discount rate of 6%, the estimated present value of the
investment is not significantly lower than the estimated total cost.
Overall, the cost of the RFID anti-counterfeiting system is 0.32 EUR per manufactured
product which is 0.5% of the products’ average retail price. Most of this cost is not specific to
anti-counterfeiting activities but will generate returns also in other applications.
5.4 Case 2 – ACME Consumer Goods
This subsection presents an example cost calculation for an imaginary consumer good
company (that is loosely based on a real consumer goods company).
5.4.1 Description

BRIDGE – Building Radio frequency IDentification solutions for the Global Environment
D5.3 Anti-counterfeiting Business Case Report 55/79 December 2007
The following analysis addresses the
application of RFID to authenticate logistics
units rather than individual articles and
cooperation with customs. The fictional
company under study – ACME Consumer
Goods – produces 15,000,000 frequently
counterfeited nonperishable fast moving
consumer articles per year. The company’s
product portfolio consists of toiletries, soaps,
cosmetics, teeth cleaning products, shaving
products, etc. The articles sell for an average
of 2.00 EUR per item (wholesale price) and
the company has a turnover of 50 Mio EUR.
The production sites are offshore and the
products are shipped to the company’s own
distribution centers as well as to large
wholesalers inside the European Union and
the North American markets in sea and air
consignments.
The articles are shipped in logistic units (cases) of 144. Per year, approximately 105,000
logistic units are to be equipped with RFID transponders. Shipments originate from two
disparate pack centers where RFID labels are printed and affixed to the cases. Since the
transponders can be affixed after the manufacturing process, infrastructure changes are
rather limited. Standardized UHF EPC Class-1 Gen-2 transponders are used. Additionally,
RFID-related labor at the side of the manufacturer is limited to reading the serial number with
a terminal device to provide the link between identifier and target address. These extra labor
costs are allocated in tag integration cost and estimated to amount offshore labor rate times
the reading time (10 s): 10 EUR / hour * (10 / 3600) hour = 0.03 EUR. In addition, we assume
other variable cost for tag integration (e.g., adhesive) of 0.02 EUR.
Reader devices are installed in the two offshore packaging centers and the two regional
distributors. The hardware expenditures also include the reading stations that are made
available for the customs officers. Because no item-level information is gathered, no extra
expenditures occur from migration to new EPR and manufacturing systems that would
support this data. Additionally, the system integration costs are 20,000 EUR per customs
import warehouse where reader stations are installed.
Though part of the product checks are conducted by customs, the brand owner needs to
maintain a team to investigate products inside the company’s supply chain and to follow up
counterfeit cases in order to realize the beneficial effects of counterfeit seizures. The costs
thereof are highly dependent on the number of additional cases that are uncovered; for the
following calculation, it is assumed that 20 additional counterfeit cases are dealt with each
year. Please note that not every counterfeit occurrence is investigated. The average cost per
case is higher than in the previous example case because of the involvement of customs.
Moreover, the company is assumed to support customs over a public-private partnership that
CASE 2: FACT SHEET
Company name: ACME Consumer Goods Turnover: 50 Mio EUR Production volume:
15,000,000 products per year Average sales price:
2 EUR Supply chain for RFID integration:
2 packaging centers 2 regional distribution centers,
6 customs import warehouses Total annual cost of AC solution: 230,129 EUR

BRIDGE – Building Radio frequency IDentification solutions for the Global Environment
D5.3 Anti-counterfeiting Business Case Report 56/79 December 2007
includes training costs to assistance of customs officers in using the product authentication
system. The yearly training costs are estimated to amount two man days per supply chain
location where RFID readers are installed. Table 24 presents the individual cost factors.

BRIDGE – Building Radio frequency IDentification solutions for the Global Environment
D5.3 Anti-counterfeiting Business Case Report 57/79 December 2007
Table 24. Cost calculation of total annual cost
One-time costs for system set-up Factor Cost
Consulting and planning 25,000 €
Hardware expenses 104,619 €
Software expenses 45,000 €
System integration 115,000 €
Packaging line changes 10,000 €
Internal project team for set-up 25,000 €
Initial EPCglobal subscription fee 5,625 €
Sum (EUR) 330,244 €
Annual variable system costs Factor Cost
No. of products manufactured 15,000,000
No. of cases to be tagged 104,167
Cost of RFID transponder 0.13 €
Cost of integration 0.05 €
Total cost of transponders and integration 18,750 €
Maintenance costs 15,693 €
EPCglobal annual fee 1,125 €
Sum (EUR) 35,568 €
Annual inspection and reaction costs Factor Cost
Product inspection team 0.5 FTE
Cost per man day 420 €
Total cost of product inspection team 54,600 €
Training 8,400 €
Travel expenses 6,000 €
Test purchases 3,000 €
Number of additional cases 20
Reaction cost per case 2,000 €
Total reaction costs 40,000 €
Sum (EUR) 112,000 €
Total annual cost (EUR) (*) 230,129 €
(*) Depreciable life of one-time investment: four years

BRIDGE – Building Radio frequency IDentification solutions for the Global Environment
D5.3 Anti-counterfeiting Business Case Report 58/79 December 2007
Table 25. Bottom-up calculation of hardware expenses3
Cost of reader equipment Factor Cost
Alien 9800 EPC Gen 2 RFID Reader 1 1,247 €
Alien 915 MHz Linear Antenna 4 117 €
Omron 10m Antenna Cable 4 90 €
Mounting Brackets 1 16 €
SUM (EUR) 2,093 €
Cost of work station
HP xw9400 Workstation 1 2,202 €
Cost of RFID printer
Zebra R110xi RFID Printer 1 3,253 €
Cost of server
HP ProLiant DL380 G5 1 2,424 €
Cost of networking infrastructure
Routers 1 300 €
Cables 50 €
Sum (EUR) 350 €
Hardware Expenses
Cost of reader equipment 26 54,408 €
Cost of work station 12 26,425 €
Cost of RFID printer 4 13,013 €
Cost of server 3 7,273 €
Cost networking infrastructure 10 3,500 €
SUM (EUR) 1 104,619 €
Table 26. Present value of the cash flows resulting from yearly costs
Cash flow Factor Present value
Year 1 -477,812 € 1.00 -477,812 €
Year 2 -147,568 € 0.94 -139,215 €
Year 3 -147,568 € 0.89 -131,335 €
Year 4 -147,568 € 0.84 -123,901 €
SUM (EUR) -920,515 € -872,262 €
Table 27. Summary of the costs
Total cost 920,515 €
per manufactured product 0.015 €
per case of products 2.21 €
as percentage of sales price of a product 0.77%
Discount rate 6%
Present value of total cost 872,262 €
3 Price sources: http://www.rfidsupplychain.com/; http://www.hp.com/; http://www.nextag.com/rfid-printer/

BRIDGE – Building Radio frequency IDentification solutions for the Global Environment
D5.3 Anti-counterfeiting Business Case Report 59/79 December 2007
Anti-counterfeiting specific cost 448,000 €
percentage of the total cost 49%
per manufactured product 0.007 €
per case of products 1.08 €
per new counterfeiting case 5,600 €
5.4.2 Findings
In this example case, the tagging costs are under 10% of the total yearly costs compared to
45% in the previous case. This difference is explained by tagging of aggregated logistics
units instead of single items, which dramatically decreases the number of tagged items, and
the relatively high hardware investment costs that are needed to support customs. Overall,
the relatively low number of tagged units increases the importance of the upfront investment
as a cost driver of the RFID system.
The annual reaction and inspection costs are a significant part of the overall cost of the
system. Overall, anti-counterfeiting specific costs claim 49% of the overall costs. This
relatively high ratio is mostly explained by the relatively low number of tagged items.
The inspection and reaction costs include cost factors that do not necessarily decrease as
the company’s size decreases, such as expenditures of cooperation and training of customs.
It is also likely that the product inspection team has minimum costs due to the facts that
certain hardware is always needed and at least one person needs to be allocated to the team
(although not necessarily full-time). Furthermore, if a company has no existing process to
deal with the new cases that occur internally, the reaction costs per case are likely to be
much higher than estimated in the cases. These factors suggest that the inspection and
reaction costs are likely to be relatively higher for small companies, which makes the
business case less attractive for them in comparison to larger companies.

BRIDGE – Building Radio frequency IDentification solutions for the Global Environment
D5.3 Anti-counterfeiting Business Case Report 60/79 December 2007
6 Benefit side calculations
Investment in product authentication system as an anti-counterfeiting measure is an
investment of security. To know what security means in a certain context, one must define
what is being protected and what the threat is – otherwise the notion of security is vague. In
this analysis, the asset being protected is a distribution channel and the threat is a counterfeit
product that is injected there. The protected channel is typically that of the genuine articles,
but by enforcing customs the same thinking can be also applied to the illicit distribution
channel. If two anti-counterfeiting technologies provide different levels of security, regarding
anti-counterfeiting, the benefits of the more secure technology are higher compared to the
less secure one. Therefore security has a central role in the benefit side of an anti-
counterfeiting business case.
The benefit side of an anti-counterfeiting investment is characterized by a complex chain of
effects. We derive this chain by illustrating the different steps in the underlying reasoning,
marked by numbered arrows in Figure 2 that are also referred to in the text. The product
authentication solution provides (1) a certain level of security against the threat of
counterfeits (2). The level of security also has a deterrent, or discouraging, effect (3) on the
counterfeiter because it makes the business less profitable for him. The benefit, or positive
impact, of the level of security (4) is that the threat is not realized, i.e. counterfeit products
are either detected when they arrive in the distribution channel or they are not injected in the
first place, for example due to the fear of being detected and sanctioned. Thus, the actual
extent of benefits of the security also depends on the adversary (5), i.e. how many
counterfeit products he attempts to inject. Last, the non-realized threats lead to financial
benefits through direct and indirect mechanisms (6). These mechanisms can be very difficult
to quantify since they might include increased patient (or consumer) safety, the numeric
evaluation of which requires putting a price to the human life. These mechanisms also
include lesser losses of sales due to counterfeit products and increased brand value and
goodwill. This chain of effects is illustrated below.
Cost
Technology ($)Level of
security (S)
Adversary (A)
Non realizedthreats (B)
Financial
benefits ($)
Benefit
1
23
4 6
5
Figure 2. Cost benefit model of investment in security. The terms in parentheses
represent the metrics how different elements are measured.

BRIDGE – Building Radio frequency IDentification solutions for the Global Environment
D5.3 Anti-counterfeiting Business Case Report 61/79 December 2007
After explaining the mechanism that generates the final financial benefits in investments in
security, the benefit side of this business case report focuses on estimating and quantifying
the level of security of an anti-counterfeiting solution (arrows 1 and 2 in Figure 2). Even
though the provided analysis does not yield estimations of the final financial benefits of a
product authentication solution, a method to quantify the level of security of a product
authentication solution is highly beneficial when comparing different technologies regarding
the investment decision. The benefit of our method is highlighted by the fact that until today,
affected companies have had to do the product authentication investment decisions without
any sound method to quantify the level of security that different solutions provide. Finally,
precise analytical modeling of the complete chain of effects on the benefit side is well beyond
the scope of this deliverable and therefore this analysis will be complemented by the work of
SToP project, WP2.
As a first step to quantify the benefit side, one needs to estimate the level of security of the
product authentication solution. Estimating the level of security of an anti-counterfeiting
technology is challenging and the related research and practical literature are sparse. The
state-of-the-art research literature of information security addresses level of security as the
Cost to Break (CtB) a system [30] which is the lowest cost to detect and exploit vulnerability
in the system. The underlying reasoning is that when CtB is more than the financial benefit of
a successful attack, the system is secure from financially motivated adversaries. However,
this method has limited usability in anti-counterfeiting. First, it is very hard to compare the
cost to break of different technologies in terms of cost to copy a product and its security
features. This is hard due to the numerous assumptions that would be needed, including
assumed technical capabilities of the adversary, available equipment, the price of social
engineering, and the fact that all vulnerabilities are not known. Second, making copying of
products harder does not necessarily protect a distribution channel from counterfeits if the
check is too complex and costly to be applied in large scales. As a result, in the real life
usability also contributes towards better protection, which is not captured by the notion of
CtB. Schneier [31] argues that security is not a product but a process. This process includes
three steps: prevention, detection, and response (see Figure 3). The author further argues
that this process is employed to manage the involved risks (i.e. severity and frequency of
adversaries’ actions) and not the threats (i.e. sources of danger that are theoretically
possible). However, Schneier only describes the process of security and does provide a
method to benchmark it.
PreventionPrevention DetectionDetection ResponseResponse
Figure 3. The process of security
Because of the abovementioned flaws in existing metrics for the level of security, we derive a
new metric that correctly represents the level of protection a technology provides to a

BRIDGE – Building Radio frequency IDentification solutions for the Global Environment
D5.3 Anti-counterfeiting Business Case Report 62/79 December 2007
distribution channel from counterfeits. This metric is theoretically sound so that it represents
the real level of protection and its parameters can be estimated without specific knowledge of
the security mechanisms of different technologies. This metric takes into account the
technology as well as the adversary (arrows 1 and 2 in Figure 2) and therefore it can be used
in the general cost model of investment in security as described above.
6.1 Quantifying the Level of Security
In order to derive a metric for the level of security of a product authentication solution, we
model a distribution channel in the following way. A distribution channel is considered a black
box characterized by two variables, the probability that a product that enters the channel is
verified at least once, Pa, and the reliability of the authentication check, R. The Pa can be
further broken down to the product inspection rate (i.e. how many percent of products are
inspected), x, multiplied by the efficiency factor of a screening process, E, that determines
which articles are inspected. When the reliability R is high, a counterfeit product is not likely
to fool the authentication and pass as a genuine article, and vice-versa. Counterfeit products
enter the distribution channel and they are either detected due to anti-counterfeiting efforts or
not detected and thus sold to the customer. The counterfeit products that enter the
distribution channel have certain quality, Q. When this quality is high, it is less likely that the
product is detected when checked. Similarly, when Q is low, it is more likely that the product
is detected as counterfeit in an inspection. This model is illustrated in Figure 4.
distribution channel (Pa, R)Counterfeits (Q)
Not detected
Customer
Law
Enforcement
Detected
distribution channel (Pa, R)Counterfeits (Q)
Not detected
Customer
Law
Enforcement
Detected
Figure 4. Model of a distribution channel
We define the metric for the level of distribution channel security against counterfeits as the
probability that a counterfeit product that enters the distribution channel is detected. This is
given by the probability that a counterfeit product that enters the distribution is checked at
least once, Pa, times the probability that a counterfeit product does not pass the authenticity
check, Pb. Now the problem is transformed to how to derive Pb based on Q and R. We solve
this by considering five different categories of counterfeit products based on the quality of
imitation of the security features (adopted from [6]): By definition (see [3]), a product that
does not have an RFID tag is considered counterfeit and should not pass any RFID-enabled
authentication check. If a counterfeit product is tagged but has an invalid EPC number, it is
detected in a simple EPC validity check (i.e. “Is a product corresponding to this EPC
manufactured?”). If a counterfeit product is tagged and has a valid, i.e. cloned, EPC number
of a genuine product, but does not have other credentials of the genuine tag (e.g., TID
number, PIN or KILL passwords), a simple tag authentication scheme (e.g., [32]) or TID
number verification will detect the fraudulent tag. Finally, the RFID tag can also support for
strong cryptography in terms of storing a secret key and a way to verify it. When the key
length is long enough and the protocol does not have flaws, these tags provide a substantial

BRIDGE – Building Radio frequency IDentification solutions for the Global Environment
D5.3 Anti-counterfeiting Business Case Report 63/79 December 2007
barrier against copying. Only counterfeit products that have a fully cloned RFID tag, including
copied secret key, can pass strong cryptographic tag authentication check. It should be kept
in mind that a track and trace based plausibility check can detect fake tags with copied valid
EPC number, independent of whether other tag credentials are copied or not. As a result, the
following five quality categories of counterfeit products (different attacks) are considered.
1. Counterfeit product does not have RFID tag;
2. Counterfeit product has RFID tag with invalid EPC number;
3. Counterfeit product has RFID tag with valid EPC number (invalid TID number, KILL
password, PIN password and secret key);
4. Counterfeit product has RFID tag with valid EPC number, TID number, KILL
password, and PIN password (invalid secret key);
5. Counterfeit product has RFID tag with valid EPC, TID number, KILL password, PIN
password, and secret key (fully copied RFID tag).
Based on the abovementioned categories of attacks, we can evaluate the probability that a
counterfeit product does not pass an authenticity check, Pb. When Q indicates the ratio of
counterfeit products that fall into the four categories and R indicates the probability that a
counterfeit product of a given category does not pass the check, Pb is the scalar product of
vectors Q and R. This result can be formalized as,
}...,{ and 1... ,}...,{ where,, 2121
1
21 NN
N
i
Niib rrrRqqqqqqQrqRQP ==+++=>==< ∑=
(1)
It follows that the level of security, S, can be expressed as:
><⋅⋅=⋅= RQExPPS ba , (2)
The parameters of this method are summarized in Table 28 below.

BRIDGE – Building Radio frequency IDentification solutions for the Global Environment
D5.3 Anti-counterfeiting Business Case Report 64/79 December 2007
Table 28. Parameters of the metric to estimate the level of security
Parameter Explication Definition
Pa Probability that a counterfeit product that enters the
distribution channel is checked at least once ExPa ⋅=
Pb Probability that a counterfeit product does not pass a check >=< RQPb ,
x Inspection rate (ration of products that are inspected) -
E
Screening efficiency factor (e.g., if E=2, a product selected for
inspection is twice as probable to be counterfeit than a
product selected randomly)
-
Q Quality of counterfeit products as the ratio of counterfeit
products in different quality categories
{ }NqqqQ ..., 21= ,
1...21 =+++ Nqqq
R Reliability of the check as the probability that counterfeit
products in different categories do not pass the check { }NrrrR ..., 21=
S The level of security ><⋅⋅= RQExS ,
In this analysis, we consider the following five different methods of authenticating RFID-
tagged products, partly corresponding to the different categories of attacks:
1. Verify that the product has a tag;
2. Verify that the product has a tag with valid EPC number;
3. Verify that the product has a tag with valid EPC number, TID number, PIN password
and KILL password;
4. Verify that the product has a tag with valid EPC number and it is not cloned (track
and trace based plausibility check);
5. Verify that the product has a tag with valid EPC number and secret key
(cryptographic tag authentication).
We can estimate the parameter R for these product authentication methods in a somewhat
reliable way by reasoning how likely counterfeit products in different quality categories do not
pass the check. The only disputable value is the reliability of a track and trace based
plausibility check. Lehtonen et al. [33] have shown that even in the presence of rather
incomplete track and trace data (only maximum of one read event per supply chain location,
half of supply chain partners do not provide trace data), copied products can be detected in a
distribution channel with a probability of more than 40% using centralized track and trace
plausibility checks. With more read locations (e.g. both receiving and shipping notices, all
supply chain partners included), the clone detection rate substantially increases. We assume
that the product authentication solution provides a good visibility (e.g., a chain of shipping-
reception events) over the channel to be secured, and we conservatively estimate that the
probability to detect a cloned product is 66%. This estimate leaves room for counterfeiters
who can fool the track and trace based system, for example by exploiting forgery of product
history and manipulation of product history attacks (see D5.2). The exact clone detection rate

BRIDGE – Building Radio frequency IDentification solutions for the Global Environment
D5.3 Anti-counterfeiting Business Case Report 65/79 December 2007
depends on the adversary’s actions, visibility, the clone-detection method, as well as the
false alarm rate. The detection probabilities are summarized in Table 29 below.
Table 29. Probabilities that counterfeit products of different categories (attack type) do
not pass different product authentication checks (check type)4
Check type
Attack type
Verify that product
has RFID tag
Verify that product
has valid EPC
Verify that product
has valid EPC, TID,
PIN and KILL
Track and trace
based plausibility
check
Cryptographic tag
authentication
No RFID tag 100% 100% 100% 100% 100%
RFID tag with invalid EPC
0% 100% 100% 100% 100%
RFID tag with
valid EPC 0% 0% 100% 66% 100%
RFID tag with valid
EPC, TID, PIN, KILL 0% 0% 0% 66% 100%
Fully copied RFID tag
(incl. secret key) 0% 0% 0% 66% 0%
It follows that the reliability parameters R for techniques 1-5 are:
{ }
{ }
{ }
{ }
{ }..,.,.,.,.R
,.,.,.,.,.R
,.,.,.,.,.R
, .,.,.,.,.R
, .,.,.,.,.R
001001001001001
660660660001001
000000001001001
000000000001001
000000000000001
5
4
3
2
1
=
=
=
=
=
(3)
The next step is to estimate how frequently counterfeiters apply different attack types to fool
the authenticity check. We emphasize that this data is case specific and an affected
company should compile it from internal seizure statistics. For this underlined reason, the
presented analysis only discusses the principles of evaluating the quality of counterfeit
products, Q, and provides a rough estimation for the basis of first numeric evaluations.
Extensive interviews with several affected brand-owners as well as customs officers suggest
that the majority of counterfeit products only have “somewhat similar” (i.e. poorly imitated)
security features or no security features at all [23]. Today, most of these products pass the
point of control even despite the poor imitation quality of security features. This happens
because the time for closer inspections is missing, or, if the time is available, because
inspections are too complicated. In fact, many highly secure features are not effective
4 We here assume that there are no “insider attacks” from the supply chain, where a supply chain partner either
removes and reapplies or copies the RFID tag to a counterfeit product, and sells the counterfeit product as the
genuine inside the licit supply chain and disposes the genuine product outside the licit supply chain. This kind of
attack cannot be detected by any of the presented countermeasures, and it is most cheap to employ against a
track and trace based system. Overall, the “insider attack” would make the results less favourable for track and
trace based approach.

BRIDGE – Building Radio frequency IDentification solutions for the Global Environment
D5.3 Anti-counterfeiting Business Case Report 66/79 December 2007
because the required tests are impractical. We can conclude that overall, the majority of
counterfeit products are so called low quality fakes that even simple product authentication
checks can detect. Only a relative small number of counterfeit products have imitated or
copied security features of the genuine product. Based on this evidence, we can provide an
estimate for the counterfeit products’ quality parameter Q. We assume that after the
employment of an RFID-based product authentication system, counterfeiters adjust their
measures so that the frequencies of different attack types of counterfeit products that are
injected to a licit supply chain are given by Figure 5 below. It follows that the parameter Q
can be exemplified as follows5;
{ }03.0,070200100600 .,.,.,.Q = (4)
3%
12%
15%
10%
60%
0% 10% 20% 30% 40% 50% 60% 70%
RFID tag with valid EPC,
TID, PIN, and secret key
(fully copied tag)
RFID tag with valid EPC
but invalid secret key
RFID tag with valid EPC
but invalid TID and PIN
RFID tag with invalid EPC
No RFID tag
Figure 5. Example frequencies of attack types of counterfeit products. An affected
company must revise these numbers based on internal seize statistics to customize
the calculation.
Under these assumptions, we can estimate the probability that a random counterfeit product
does not pass the authentication check, Pb = <Q,R>. This metric represents the efficiency of
a product authentication technique given the assumed quality of counterfeit products, Q. As
defined above, the level of security of a distribution channel is obtained by multiplying Pb by
Pa. We also consider the additional cost drivers of these techniques, i.e. what they require in
addition to the standard EPC network system and equipment. Verification that a product has
a tag and that a product has a tag with a valid EPC can be implemented in basic EPC
network system without any additional costs. Verification that a product has a valid TID
number, PIN password or KILL password requires an additional server (as we assume this
information is normally not published in the EPC network and that standard EPC tags provide
these functionalities) and additional tag-reader communications, introducing an extra delay in
tag reading time. Track and trace based plausibility check –approach requires an additional
server that analyses the trace (which is not a significant cost factor) but has no tag-reader
communication overhead. However, a track and trace based system does require significant
5 In reality, this assumption is oversimplified because adversaries adjust their attacks according to the defences
which means that the Q parameter is a function of the applied countermeasures. More detailed analysis of this
relationship, however, is out of the scope of this deliverable.

BRIDGE – Building Radio frequency IDentification solutions for the Global Environment
D5.3 Anti-counterfeiting Business Case Report 67/79 December 2007
system integration so that the track and trace data can be shared. Finally, cryptographic tag
authentication requires additional server to store the secret keys and generate the
challenges, additional tag-reader communication, and most importantly, more expensive tags
that support for encryption. Summary of the level of security and addition cost factors of
different product authentication techniques are illustrated in Table 30.

BRIDGE – Building Radio frequency IDentification solutions for the Global Environment
D5.3 Anti-counterfeiting Business Case Report 68/79 December 2007
Table 30. Estimations of the level of security of different product authentication
techniques
Product authentication technique Level of Security Additional cost factor
Verify that product has RFID tag 60.0Pa ⋅=S -
Verify that product has valid EPC 70.0Pa ⋅=S -
Verify that product has valid EPC, TID, PIN and KILL 85.0Pa ⋅=S Additional server,
increased tag reading time
Track and trace based plausibility check 90.0Pa ⋅=S Additional server
Cryptographic tag authentication 97.0Pa ⋅=S Additional server,
increased tag reading time,
increased tag cost
6.2 Case 1 – ACME Luxury Goods
This subsection estimates the achieved level of security in Case 1, based on the
methodology presented in subsection 5.1. The level of security is defined as the probability
that a counterfeit product is detected in the licit distribution channel, and the estimations are
based on the intermediate results that are presented in Table 30. Further assumptions are
that techniques 2-5 require extra network hardware that generates expenditures
corresponding to the cost of 10 new servers and the price of a cryptographic tag (technique
5) is 0.50 EUR. In this case, single items are tagged and the tags are read in multiple
locations of the supply chain. The probability that a counterfeit product is scanned at least
once in the licit supply chain is set to 95%, which still leaves a small margin for counterfeit
products to go undetected. The results can be seen in Figure 6.

BRIDGE – Building Radio frequency IDentification solutions for the Global Environment
D5.3 Anti-counterfeiting Business Case Report 69/79 December 2007
0.57
0.67
0.810.85
0.92
0.00
0.20
0.40
0.60
0.80
1.00
0.00 € 0.10 € 0.20 € 0.30 € 0.40 € 0.50 € 0.60 € 0.70 € 0.80 €
Total cost per product
Leve
l o
f S
ecu
rity
Technique 1
Technique 2
Technique 3
Technique 4
Technique 5
Figure 6. Level of security (probability that a counterfeit product is detected) in the
licit supply chain versus cost of different product authentication techniques6
In this imaginary case, the extra network equipment cost needed in techniques 2-5 has only
a remote impact on the total cost of solutions. The use of cryptographic tags, however, has a
major impact on the total cost per product, increasing it from 0.32 EUR to 0.71 EUR. The
security analysis shows that the marginal benefit of cryptographic tags is only small,
increasing the level of security from 85% (track and trace based check) to 92%. The reason
why this increase is so small is the assumption that only a small portion of counterfeit
products are of so high quality that they cannot be detected by other techniques.
6.3 Case 2 – ACME Consumer Goods
This subsection estimates the achieved level of security in Case 2. Owing to collaboration
with customs, the product authentication solution can detect counterfeit products in both the
licit and illicit distribution channel. The methodology presented in subsection 6.1 can be used
to evaluate the achieved level of security, i.e. the probability that a counterfeit product is
detected, in both these channels. This case employs case level tagging. We assume that the
probability that a counterfeit product is scanned in the licit supply chain is 90%, somewhat
lower than in the abovementioned case where item-level tagging is used. Furthermore, we
assume that customs officers inspect in average 2.5% of all goods but three times more
those of ACME Consumer Goods because of the RFID-solution, and that customs has a
good ability to identify suspect consignments (E=2). As a result, the probability that a
counterfeit good is scanned in the illicit supply chain is 2.5%·3·2 = 15%. Further assumptions
are that techniques 2-5 require extra network hardware that generates expenditures
corresponding to the cost of 5 new servers and the price of a cryptographic tag (technique 5)
is 0.50 EUR. The results can be seen in Figure 7 and Figure 8.
6 Techniques 1-5: Verify that product has a tag; Verify that tag has valid EPC; Verify that tag has valid EPC,
TID number, KILL and PIN password; Track and trace based check; Cryptographic tag authentication.

BRIDGE – Building Radio frequency IDentification solutions for the Global Environment
D5.3 Anti-counterfeiting Business Case Report 70/79 December 2007
0.54
0.63
0.770.81
0.87
0.00
0.20
0.40
0.60
0.80
1.00
0.00 € 0.50 € 1.00 € 1.50 € 2.00 € 2.50 € 3.00 €
Total cost per case (144) of genuine products
Level
of
Secu
rity
Technique 1
Technique 2
Technique 3
Technique 4
Technique 5
Figure 7. Level of security (probability that a counterfeit product is detected) in the
licit supply chain versus cost of different product authentication techniques7
0.00
0.20
0.40
0.60
0.80
1.00
0.00 € 0.50 € 1.00 € 1.50 € 2.00 € 2.50 € 3.00 €
Total cost per case (144) of genuine products
Lev
el
of
Secu
rity
Technique 1
Techniques 2-4
Technique 5
Figure 8. Level of security (probability that a counterfeit product is detected) in the
illicit supply chain versus cost of different product authentication techniques
The results show that the relative efficiency of the different techniques is the same as in
Case 1. However, the cost difference between the cryptographic tag authentication approach
(technique 5) and the other approaches is relatively smaller. This is explained by the fact that
in case-level tagging the tagging cost claims a relatively smaller part of the total cost of the
solution than in item-level tagging. The level of security of the illicit supply chain is much
lower than that of the licit supply chain, only about 9-15%. However, because the volume of
counterfeit products in the illicit supply chain is much higher, the actual benefit of these
detections is considerable. Overall, the analysis clearly suggests that increasing the number
of checks is a more efficient way to increase the number of detected counterfeit products
than increasing the reliability of the check itself.
7 Techniques 1-5: Verify that product has a tag; Verify that tag has valid EPC; Verify that tag has valid EPC,
TID number, KILL and PIN password; Track and trace based check; Cryptographic tag authentication.

BRIDGE – Building Radio frequency IDentification solutions for the Global Environment
D5.3 Anti-counterfeiting Business Case Report 71/79 December 2007
6.4 Findings
The results suggest that the track and trace based check is very cost efficient way to
authenticate products in the licit distribution channel where supply chain partners are capable
and willing to share RFID information – the only additional cost factor for a company that
already has an EPC track and trace infrastructure in place is the server that analyses the
track and trace data (EPC-PAS, see subsection 5.1). The use of cryptographic tags is
expensive and provides only marginal increase in the real level of protection from counterfeit
products. However, in case-level tagging the relative cost difference is much smaller and can
be considered. Additionally, the increased tag-reader communication that comes with
cryptographic tags is potentially a cost factor in time critical processes, increasing the tag
identification time at least two-fold. The use of track and trace based checks does not
increase the tag identification time.
The limitations of track and trace based check include bigger vulnerability to such an insider
threat where a supply chain partner copies tags to counterfeit products, sells the counterfeits
in the licit supply chain and disposes of the genuine articles ouside the licit supply chain
where they are not verified for authenticity. All RFID-based approaches are vulnerable to this
because of the possibility of tag removal and reapplying, but it is potentially cheapest to
employ for tags that are not copy-protected. However, to be financially interesting for
counterfeiters, this scenario would require that the genuine products can be sold with a good
price outside the licit supply chain where their authenticity is not verified.
In the case where the track and trace based check takes time (e.g. the trace data is not yet in a local cache and needs to be gathered), the product might have already passed the check point and needs to be tracked down when an alarm is triggered. Given that the trace data is available, however, time should not be a limiting factor. In addition, it is not yet known how an insider could attack the system by publishing falsified track and trace data. Furthermore, track and trace is no longer a reliable authentication method after the product reaches the customer and thus it has only limited usability in product authentication in after sales services. However, even in the light of these limitiations, track and trace based product authentication appears cost-efficient approach in supply chains where products are traced.

BRIDGE – Building Radio frequency IDentification solutions for the Global Environment
D5.3 Anti-counterfeiting Business Case Report 72/79 December 2007
7 SWOT analysis
SWOT analysis is a commonly used tool in strategic planning. It evaluates the internal
factors (strengths and weaknesses) of a company’s strategic decision, as well as factors of
the operating environment (opportunities and threats). We apply the SWOT analysis to
assess the strategic decision of investing in an RFID-based product authentication system.
The assumed current status is a company that is affected by product counterfeiting and that
is not using RFID, and the assumed vision of the company is to have its distribution channels
secured from counterfeit products. The strengths, weaknesses, opportunities and threats
regarding the employment of an RFID-based product authentication are listed below.
• Strengths:
o RFID enables automated product authenticity check that can be done
whenever the product is identified in the supply chain. Multiple products can
be authenticated at once without line of sight. This suggests that the check is
substantially easier to do than with competing product authentication
technologies and that the number of checks and consequently the number of
counterfeit products found are relatively high.
o Since the check is automated, the variable cost to check one product is very
low. This is a considerable benefit when the check is to be employed in large
scales.
o The security of an RFID-based product authentication system can be
engineered to a relatively high level, if the security requirements (see BRIDGE
D5.2) are satisfied by implementing tag authentication techniques (e.g.,
cryptographic transponders) as well as techniques that detect cloned tags
(e.g., track and trace based checks).
o RFID represents high-tech in the field of automatic identification of products.
Though this is not security per se, the fact that genuine products are tagged
with high-tech labels has a discouraging effect on counterfeiters who attempt
to forge the product. This effect will become smaller and smaller once the
technology is deployed in larger scales for item level tagging.
o In addition to anti-counterfeiting, RFID technology generates benefits in
various supply chain applications (see WP6-WP11). Therefore the total
returns from investment in RFID are due to increased efficiency and
effectiveness in multiple business applications.
• Weaknesses:
o When RFID is used only in anti-counterfeiting, the variable cost to secure one
product is relatively high. The prices of existing low-cost UHF tags are higher
than the labeling cost of most other state-of-the-art product authentication
techniques. If the costs of the technology can be shared by multiple
applications, the variable cost to secure one product for anti-counterfeiting
decreases substantially.

BRIDGE – Building Radio frequency IDentification solutions for the Global Environment
D5.3 Anti-counterfeiting Business Case Report 73/79 December 2007
o When RFID is used only in anti-counterfeiting, the fixed set-up cost of the
infrastructure is relatively high. If the set-up cost can be shared by multiple
applications, or the volume of products that the infrastructure processes is
high, this factor has a decreasing effect.
o When the security requirements are not satisfied (e.g., not enough trace data
is provided clone detection, or the tag authentication protocol is not secure),
the level of security is substantially lower. Also, if tag authentication is used,
the tag’s credential (e.g., transponder ID number (TID), secret key) should be
different in each tag, otherwise a so called class break is possible where
breaking of one genuine tags can be used to reproduce a great number of
counterfeit tags.
o The automation of the check is limited by the fact that when a counterfeit
product does not have a tag, the RFID system does not detect the product.
Therefore, when automatically checking multiple products, the system must
count how many products are to be checked and compare this number to
identified RFID tags to detect products that are not tagged.
o RFID still suffers from relative low reliability when compared with other auto-ID
technologies such as 1D and 2D barcodes. Reading products in the presence
of liquids and metal is still challenging and careful RF-engineering is needed
to guarantee high reading rates in these situations. As the technology
matures, these problems can be expected to be solved from their most parts.
• Opportunities:
o The emerging of near-field technology (NFC) could dramatically increase the
number of RFID reader devices that can authenticate the genuine products.
Currently EPC and NFC technologies are not compatible, but if these two
standards would merge, consumers who have an NFC-enabled mobile phone
could potentially also authenticate the genuine products.
o Currently there are no global standards for product authentication. RFID
standards such as EPCglobal could, in the foreseeable future, incorporate
also standard procedures for product authentication. This would foster the
diffusion of the technology and increase the compatibility of different devices,
leading to economics of scale for brand owners (e.g., the customs worldwide
could invest in one product authentication technology, sponsored by brand
owners).
o RFID technology can be used to comply with laws or mandates that require
automatic collection of electronic pedigree or similar records.
• Threats:
o The privacy threats of RFID-tagged products can lead to decreased goodwill
and reputation by negative campaigning of privacy advocates and
misperception of the privacy risks by the public in general.

BRIDGE – Building Radio frequency IDentification solutions for the Global Environment
D5.3 Anti-counterfeiting Business Case Report 74/79 December 2007
o Lack of global RFID standards can lead to systems incompatibility between
different countries or different regions of the world. As a result, it might not be
guaranteed that the same tags can be read for example in Europe and in the
U.S.
The findings of the presented SWOT analysis suggest that RFID-based anti-counterfeiting solution is financially most attractive when it is used in a combination of business applications and for a large number of checks. The technology has potential to achieve a high level of security through careful security engineering and by avoiding pitfalls in the implementation. Currently, the relatively low reliability in the presence of liquids and metal might prohibit the use of RFID in certain cases. Last, the opportunities regarding NFC technology, standardized product authentication processes and compliance with laws and mandates outweigh the privacy threats and the threat of lacking global standards.

BRIDGE – Building Radio frequency IDentification solutions for the Global Environment
D5.3 Anti-counterfeiting Business Case Report 75/79 December 2007
8 Discussion
When RFID technology is deployed not solely as an anti-counterfeiting technology but also
for other purposes, as examined in the BRIDGE project, not all hardware and tagging costs
need to be allocated as anti-counterfeiting costs. We estimated that the anti-counterfeiting
specific cost (inspections and follow-up) per manufactured luxury good is 0.12 EUR
(compared with the total cost of the RFID solution per product 0.32 EUR). It is important to
note that this anti-counterfeiting specific cost is independent of the chosen product
authentication technology, since similar inspection and reaction activities would be needed
also when considering other product authentication technologies, such as special holograms
or taggants.
One way to compare the costs of RFID and competing technologies for product
authentication is to allocate some portion of the general RFID-related costs to product
authentication application. If we assume that 20% of the general RFID-related costs need to
be covered by the product authentication application, the hardware and infrastructure cost for
product authentication are about 4 cents per product. Interviews with providers of product
authentication techniques8 have confirmed that this figure is in the same order of magnitude
as tagging costs of other secure product authentication techniques. This suggests that the
costs of an RFID-based product authentication system are comparable to those of competing
solutions.
Throughout this case study, we have assumed that the case companies do not utilize any
product authentication technologies and thus do not have product inspection teams in place.
However, if existing product authentication systems are in place, the cost calculations should
be corrected by subtracting the current annual anti-counterfeiting related costs from the total
annual cost of the system. This makes the cost calculation more favorable for RFID by
eliminating existing anti-counterfeiting related costs. However, in that case in the benefit side
calculations one needs to estimate the marginal benefit of RFID-based product
authentication by estimating the level of security of the legacy systems as well.
8 According to an expert interview, costs of securing one product with multiple features (overt and covert) falls
between 1-9 Euro cents, depending on quantities.

BRIDGE – Building Radio frequency IDentification solutions for the Global Environment
D5.3 Anti-counterfeiting Business Case Report 76/79 December 2007
References
[1] PackAgent (2007). Packagent.
[2] Diekmann, T., Melski, A., and Schumann, M. Data-on-Network vs. Data-on-Tag: Managing Data in Complex RFID Environments. in Proceedings of the 40th Hawaii International Conference on System Sciences. 2007.
[3] Al-Kassab, J., Lehtonen, M., Dubach, E., and Michahelles, F. (2007). Anti-counterfeiting Requirements Report. Deliverable D5.2 of BRIDGE Project, July 2007.
[4] Lehtonen, M., Michahelles, F., and Fleisch, E., Trust and Security in RFID-based Product Authentication Systems. IEEE Systems Journal, Special Issue on RFID Technology: Opportunities and Challenges, First Quarter of 2008. 1(1).
[5] Nochta, Z., Staake, T., and Fleisch, E. Product Specific Security Features Based on RFID technology. in International Symposium on Applications and the Internet Workshops (SAINTW'06). 2006.
[6] Lehtonen, M., Staake, T., Michahelles, F., and Fleisch, E. From Identification to Authentication - A Review of RFID Product Authentication Techniques - Printed handout of Workshop on RFID Security. in RFIDSec 06. 2006.
[7] Menezes, A.J., Oorschot, P.C., and Vanstone, S.A., Handbook of Applied Cryptography. 1996: CRC Press.
[8] BRIDGE-Project (2006). Pharma Traceability Pilot - The Drug Pedigree Requirements Analysis. Deliverable D6.2 of BRIDGE Project, July 2007.
[9] Vogt, H., Graf von Reischach, F., Oertel, N., and Lehtonen, M. (2007). Report and Analysis on State-of-the-Art Tagging Technologies Specific to the SToP Project Requirements. Deliverable 4.1 of SToP Project.
[10] FDA http://www.fda.gov/cder/regularoty/PDMA.
[11] Huang, D., Verma, M., Ramachandran, A., and Zhou, Z. A Distributed ePedigree Architecture. in Proceedings of the 11th International Workshop on Future Trends of Distributed Computing Systems. 2007.
[12] Pearson, J., RFID Tag Data Security Infrastructure: A Common Ground Approach for Pharmaceutical Supply Chain Safety. 2006.
[13] Oertel, N., Müller, J., Dada, A., Graf von Reischach, F., Vogt, H., and Lehtonen, M. (2007). Report on relevant state-of-the-art research, existing technologies and products. Deliverable 3.1 of SToP Project.
[14] Bayer (2007). Protexxion from Bayer.
[15] Lehtonen, M., Al-Kassab, J., Graf von Reischach, F., Kasten, O., and Michahelles, F. (2006). Problem-Analysis Report on Counterfeiting and Illicit Trade. Deliverable D5.1 of BRIDGE Project, July 2007.
[16] deKieffer, D., Trojan drugs: counterfeit and mislabeled pharmaceuticals in the legitimate market. American Journal of Law and Medicine, 2006. 32(2-3): p. 325-349.
[17] Eban, K., Dangerous Doses: A True Story of Cops, Counterfeiters, and the Contamination of America's Drug Supply. 2006: Harvest Books. 504.
[18] BRIDGE-Project (2007). Requirements document of serial level lookup service for various industries. Deliverable D2.1 of BRIDGE Project, August 2007.
[19] Mon, D.-L. Evaluating weapon system using fuzzy analytic hierarchy process based on entropy weight. in Proceedings of 1995 IEEE International Conference on International Joint Conference of the Fourth IEEE International Conference on Fuzzy Systems and The Second International Fuzzy Engineering Symposium. 1995.

BRIDGE – Building Radio frequency IDentification solutions for the Global Environment
D5.3 Anti-counterfeiting Business Case Report 77/79 December 2007
[20] Korhonen, P. and Soismaa, M., An Interactive Multiple Criteria Approach to Ranking Alternatives. The Journal of the Operational Research Society, 1981. 32(7): p. 577-585.
[21] Automobilindustrie, V.d. (2006). RFID im Behältermanagement der Supply Chain.
[22] Leung, Y., Cheng, F., Lee, Y., and Hennessy, J. (2006). A Business Value Modeling Tool Set for Exploring the Value of RFID in a Supply Chain. IBM Research Report.
[23] Staake, T. (2007). Counterfeit Trade – Economics and Countermeasures. PhD Thesis, University of St. Gallen, Switzerland.
[24] Chavez, A., Tornabene, C., and Wiederhold, G., Software component licensing: a primer. Software, IEEE, 1998. 15(5): p. 47-53.
[25] Schönfeld, W., Rekik, Y., Pennesi, P., and Wong, A. (2007). Business Case Report. Deliverable D10.3 of BRIDGE project.
[26] GS1-Germany (2007). Gebührenstruktur und Einstufungsformular für Vollmitglieder des RFID/EPC-Umsetzungsnetzwerkes. Available: http://www.gs1-germany.de/content/e39/e466/e468/datei/epc_rfid/gebuehrenstrucktur_einstufungsformular.pdf.
[27] Ward, D. (2004). 5-Cent Tag Unlikely in 4 Years. RFIDJournal. Available: http://www.rfidjournal.com/article/view/1098/1/1$.
[28] AlienTechnology (2005). Alien Technology Corporation Achieves Another Step Toward Pervasive, Economic RFID with Announcement of 12.9 cent RFID Labels. September 13, 2005, Morgan Hill, CA. Available http://www.alientechnology.com/newsevents/2005/press091305a.php.
[29] BRIDGE-Project (2007). Returnable Transport Items: Business Case(s). Deliverable D9.3 of BRIDGE project, August 2007.
[30] Schechter, S.E. (2002). Quantitatively differentiating system security. The First Workshop on Economics and Information Security, Berkeley, CA. May, 2002.
[31] Schneier, B. (2000). The process of security. Information Security Magazine, April 2000. Available: http://www.schneier.com/essay-062.html.
[32] Juels, A. (2005). Strengthening EPC Tags Against Cloning. Proceedings of the 4th ACM workshop on Wireless security, 2005.
[33] Lehtonen, M., Michahelles, F., and Fleisch, E. (2007). Probabilistic Approach for Location-Based Authentication. 1st International Workshop on Security for Spontaneous Interaction IWSSI 2007, organized in 9th International Conference on Ubiquitous Computing, Austria, September 2007.
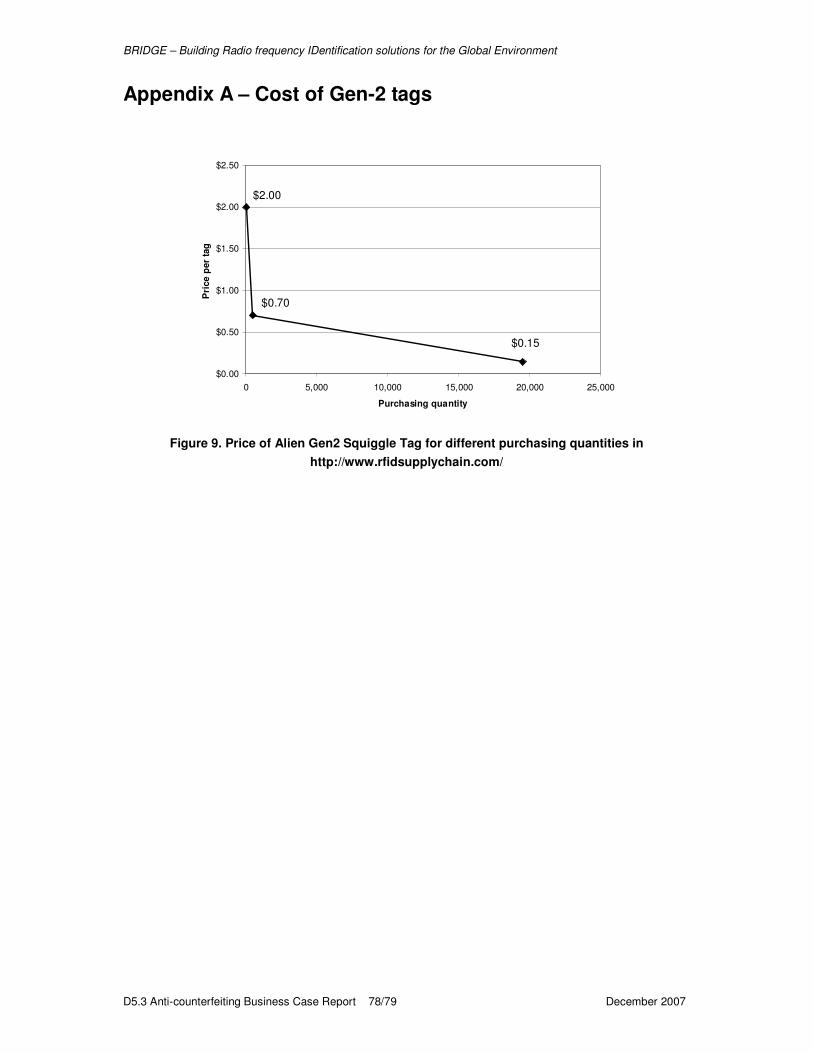
BRIDGE – Building Radio frequency IDentification solutions for the Global Environment
D5.3 Anti-counterfeiting Business Case Report 78/79 December 2007
Appendix A – Cost of Gen-2 tags
$0.15
$2.00
$0.70
$0.00
$0.50
$1.00
$1.50
$2.00
$2.50
0 5,000 10,000 15,000 20,000 25,000
Purchasing quantity
Pri
ce p
er
tag
Figure 9. Price of Alien Gen2 Squiggle Tag for different purchasing quantities in
http://www.rfidsupplychain.com/

BRIDGE – Building Radio frequency IDentification solutions for the Global Environment
D5.3 Anti-counterfeiting Business Case Report 79/79 December 2007
Appendix B – Selection Matrix Values
Automotive
Industry
Aerospace
Industry
Pharma
Industry
CG & Retail
Industry
IT
Industry
Neg.
Values
Pos.
Values
Neg.
Values
Pos.
Values
Neg.
Values
Pos.
Values
Neg.
Values
Pos.
Values
Neg.
Values
Pos.
Values
Photo Comparison -17 47 -9 64 -12 87 -18 30 -24 24
Forensic Analysis -22 53 -13 90 -10 116 -17 35 -24 35 Direct
Authentication
LSA -19 57 -10 92 -13 111 -17 31 -26 25
CDP -18 49 -11 73 -10 111 -14 40 -21 37 Authentication by Means of
a Difficult to Reproduce
Feature Taggants (Chemical etc.) -22 50 -13 83 -11 110 -17 40 -23 30
Barcode -17 49 -10 65 -10 105 -15 35 -20 33 Verification of Unique
Identifiers RFID -23 75 -18 89 -8 116 -16 39 -19 32
Barcode (2D) -20 52 -15 72 -10 132 -16 49 -21 48 Plausibility Check of Track
and Trace Data RFID -20 66 -15 84 -14 137 -18 49 -24 48
Secure Object
Authentication RFID Cryptographic tags -23 66 -18 87 -14 138 -17 41 -24 54
RFID and
Object Specific Features -17 63 -11 78 -14 111 -16 40 -23 37
Weak Authentication
(TID) -16 63 -9 78 -14 106 -16 35 -23 33
ther RFID based
Authentication Methods
RFID ePedigree -20 66 -15 84 -14 137 -18 49 -24 48