anthropometric profile, physical fitness and differences between...
TRANSCRIPT
Original article
312 Arch Med Deporte 2016;33(5):312-316
Resumen
Introducción: Los objetivos del presente estudio fueron determinar el perfil antropométrico y condición física de los prac-ticantes de Parkour y establecer diferencias en función del nivel de rendimiento. Método: Trece practicantes de Parkour participaron en este estudio. Se valoró la agilidad, extensibilidad isquiosural, dis-tancia de salto horizontal, altura de salto vertical, potencia de salto vertical, estimación del consumo de oxígeno máximo, composición corporal y somatotipo con un batería de seis test. Se llevó a cabo, además, un test específico que simulaba una situación de competición para establecer los dos grupos (A: mayor rendimiento; B: menor rendimiento) en función de los resultados obtenidos. Resultados: Los grupos A y B obtuvieron, respectivamente, un somatotipo de 1,7-5,3-2,5 y 2,2-4,2-2,8; 7,50 ± 0,52 y 8,67 ± 2,13% en porcentaje de masa grasa; 47,44 ± 2,03 y 45,91 ± 2,68% en masa muscular esquelética; 12,47 ± 0,70 y 12,53 ± 1,21% en masa ósea; 72,80 ± 11,01 y 55,19 ± 6,06 ml•Kg-1•min-1 en consumo máximo de oxígeno estimado; 14,36 ± 0,47 y 15,29 ± 0,44 s en el test de Illinois (agilidad); 13,77 ± 5,20 y 7,86 ± 12,70 cm en sit and reach; 50,09 ± 3,47 y 37,19 ± 4,82 cm en altura de salto vertical; 2.820,84 ± 453,72 y 2.105,84 ± 237,24 W en potencia de salto vertical y 2,97 ± 0,71 y 2,60 ± 0,22 m en distancia de salto horizontal. Comparando ambos grupos, el A obtuvo valores significativamente inferiores en ectomorfia y superiores en mesomorfia, estimación del consumo máximo de oxígeno, agilidad, distancia de salto horizontal, potencia y altura de salto vertical. Conclusiones: Tras determinar el perfil antropométrico y condición física, observamos que el salto vertical se presentó como el parámetro más importante en el rendimiento en Parkour, además de otras variables como el consumo máximo de oxígeno, la potencia de salto vertical, la distancia de salto horizontal, la mesomorfia y la ectomorfia.
Key words: Parkour. Rendimiento.
Antropometría.
Summary
Introduction: The aims of this study were to determinate the anthropometric profile and physical fitness of Parkour practi-tioners and to establish differences by performance level. Method: Thirteen Parkour practitioners participated on this study. Agility, hamstring extensibility, horizontal jump distance, vertical jump height, vertical jump power, estimation of maximal oxygen consumption, body composition and somatotype were assessed with a battery of six tests. Also, a specific test which simulated a competition situation was performed in order to establish two groups (A: high performance; B: low performance) by the obtained score. Results: Groups A and B obtained respectively 1.7-5.3-2.5 and 2.2-4.2-2.8 on somatotype; 7.50 ± 0.52 and 8.67 ± 2.13% on fat mass; 47.44 ± 2.03 and 45.91 ± 2.68% on skeletal muscle mass; 12.47 ± 0.70 and 12.53 ± 1.21% on bone mass; 72.80 ± 11.01 and 55.19 ± 6.06 ml•Kg-1•min-1 on estimated oxygen consumption; 14.36 ± 0.47 and 15.29 ± 0.44 s on Illinois test (agility); 13.77 ± 5.20 and 7.86 ± 12.70 cm on sit and reach test; 50.09 ± 3.47 and 37.19 ± 4.82 cm on vertical jump height; 2820.84 ± 453.72 and 2105.84 ± 237.24 W on vertical jump power and 2.97 ± 0.71 and 2.60 ± 0.22 m on horizontal jump distance. Group A obtained significant lower values on ectomorphy and higher on mesomorphy, estimated oxygen consumption, agility, horizontal jump distance and vertical jump height and power. Conclusions: After determining anthropometrical profile and physical fitness, we observe that vertical jump seems to be the most important parameter on Parkour performance, also other variables like estimated maximal oxygen consumption, agility, vertical jump power, horizontal jump distance, mesomorphy and ectomorphy appear as possibly determinant factors on Parkour performance.
Palabras clave: Parkour. Performance.
Anthropometry.
Received: 07.12.2015Accepted: 05.01.2016
Anthropometric profile, physical fitness and differences between performance level of Parkour practitioners
Oriol Abellán-Aynés1, Fernando Alacid2
1International Chair of Sports Medicine. Faculty of Medicine. Catholic University San Antonio of Murcia (UCAM). Spain. 2Department of Physical Activity and Sport Science. Faculty of Sport Sciences. Catholic University of Murcia, Murcia. Spain.
Perfil antropométrico, condición física y diferencias por nivel de rendimiento en practicantes de Parkour
Correspondence: Oriol Abellan-Aynés E-mail: [email protected]
Trabajo presentado y premiado con Premio FEMEDE a la Investigación 2015.
Anthropometric profile, physical fitness and differences between performance level of Parkour practitioners
313Arch Med Deporte 2016;33(5):312-316
Introduction
Parkour has been defined as an extreme recreational activity in which a practitioner (traceur) reaches obstacles in the fastest and most efficient way possible, where it intervenes runs, jumps, vaults and climbing1. As Thibault & Roberts2 indicate, there is a lot of controversy on Parkour definition. The word Parkour comes from the French word “parcours”, which means route and it appeared in France in the 80’s decade.
Research on Parkour is not as developed as other sportive activities. Previous studies have reported injuries produced on the practice3-8. Later, other studies with a sociological objective are focused on Parkour, studying how the -traceur- is involved on the environment, liberation of homogenization and globalization9, the bad conception of this activity in society10. Other authors analysed the relationship of narcissist behavior and leadership among young people who practice risk sports, specially Parkour11,12 and interviews for defining experiences13.
Otherwise Leite et al.14 determined physical fitness of Parkour prac-titioners in thirteen male traceurs, measuring performance variables such as aerobic capacity, vertical and horizontal jumps, hamstrings extensibility among others, concluding that Parkour improves upper limb more than lower limb and that its practice does not seem to need high values on physical fitness. Other authors have designed specific training sessions for this activity, focusing on the strenght-resistance development15. Grosprêtre & Lepers16 compared Parkour practitioners with gymnast and power athletes, pointing out that traceurs have high plyometric abilities, great upper-to-lower limb coordination, high long jump, high vertical jump performance or knee extensors strenght. Puddle & Maulder17 demonstrated that Parkour technique for landing gets lower ground reaction forces than traditional sports landing techniques.
Some authors also have treated the topic of incursion of Parkour in Physical Education classes18, and Soto et al.19 affirmed that children who practiced Parkour in Physical Education classes, avoided low motor coordination, which can carry to a lower adherence to sportiest prac-tice, being Parkour an useful way to contribute to the improvement of coordination in childhood.
The aims of the present study were to determinate anthropometric profile and physical fitness of Parkour practitioners and to establish the differences between different performance groups in order to determine Parkour performance factors.
Material and method
Thirteen traceurs participated in this study. They were informed about the aims and procedures of the study and signed an informed consentient before starting the data collection. Inclusion criteria that traceurs had to achieve were: at least 3 years on Parkour practice, be older than 18 years old, not having any injury during data collection and not to practice any other kind of sport habitually (Table 1).
Measurements were done in three not consecutive days. Anthro-pometric data was collected on the first day, physical fitness test were done on the second day and the third day was for dividing the group by performance levels.
Twenty anthropometric measurements were performed following the guidelines proposed by the International Society for the Advancement of Kinanthropometry (ISAK)20.
Body mass and stretch stature were measured with a balance with stadiometer Seca 720 (Hamburg, Germany) with a precision of 100 g and 1mm. A total of 8 skinfolds (triceps, biceps, subscapular, iliac crest, Supraspinale, abdominal, front thigh and medial calf ) with a Holtain® skinfold caliper (Holtain Ltd, Crymych, United Kingdom) with 0.2 mm of precision; 6 girths (arm relaxed, arm flexed and tensed, waist, gluteal, mid thigh and calf ) with an anthropometric tape Cescorf® (Cescorf Ltda., Brasil) with a precision of 1 mm, and 4 breadths (biepicondylar humerus and femur, bistyloid and bimaleolar) with a modified Vernier caliper with 0.5 mm of precision.
All measures were taken twice and on the right side of the partici-pants, the two measurements were compared with a tolerance of 5% for skinfolds and 1% for girths, breadths, body mass and height. In the case of a tolerance overcome, a third measurement was taken.
Dependent variables calculated using the anthropometric measu-rements were somatotype, using the Heath-Carter method21, skeletal muscle mass through the Lee22 formula, bone mass through Martin23
formula and Yuhasz24 formula for fat mass.For the estimation of maximal oxygen consumption, it was used
the 20 m shuttle run test25.Twenty meters shuttle run test consisted on running continuously
between two point that were 20 m apart from side to side. These runs are synchronized with a pre-recorded audio tape. As the test proceeds, the athletes have to increase their speed over the course of the test until it is impossible to keep in sync with the recording. Initial speed is set on 8 Km•h-1, increasing to 9 Km•h-1 the first minute, then it increased a half kilometer per hour each minute. It was performed only one try per athlete.
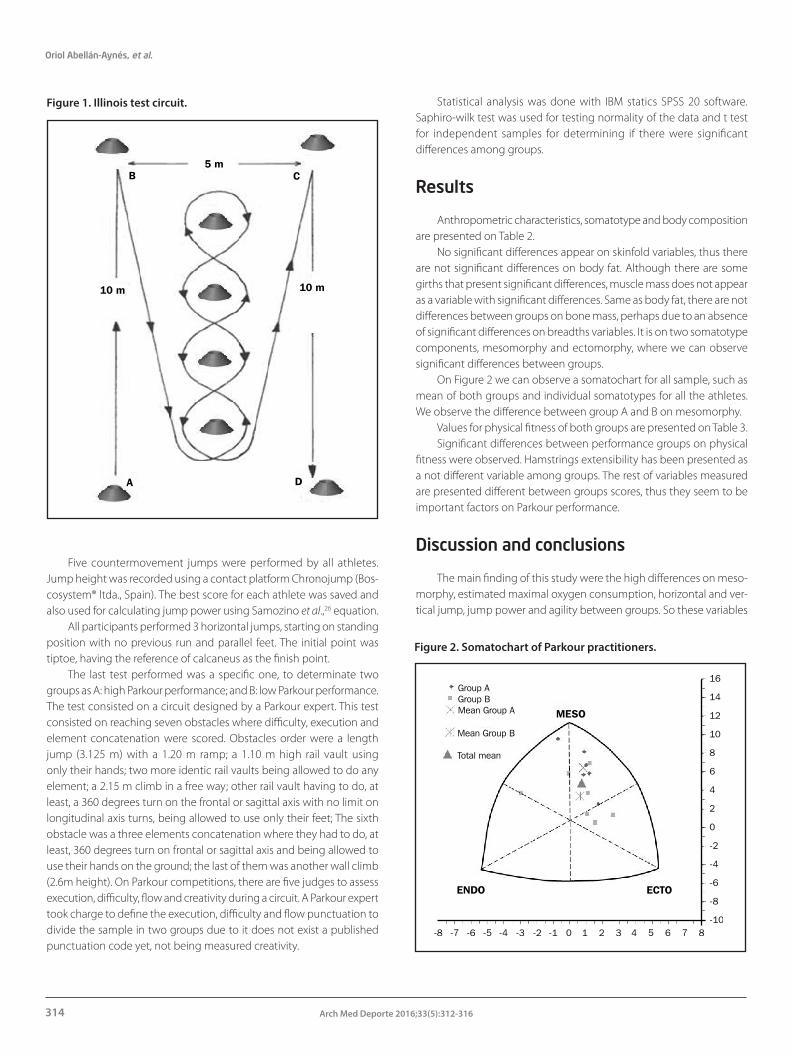
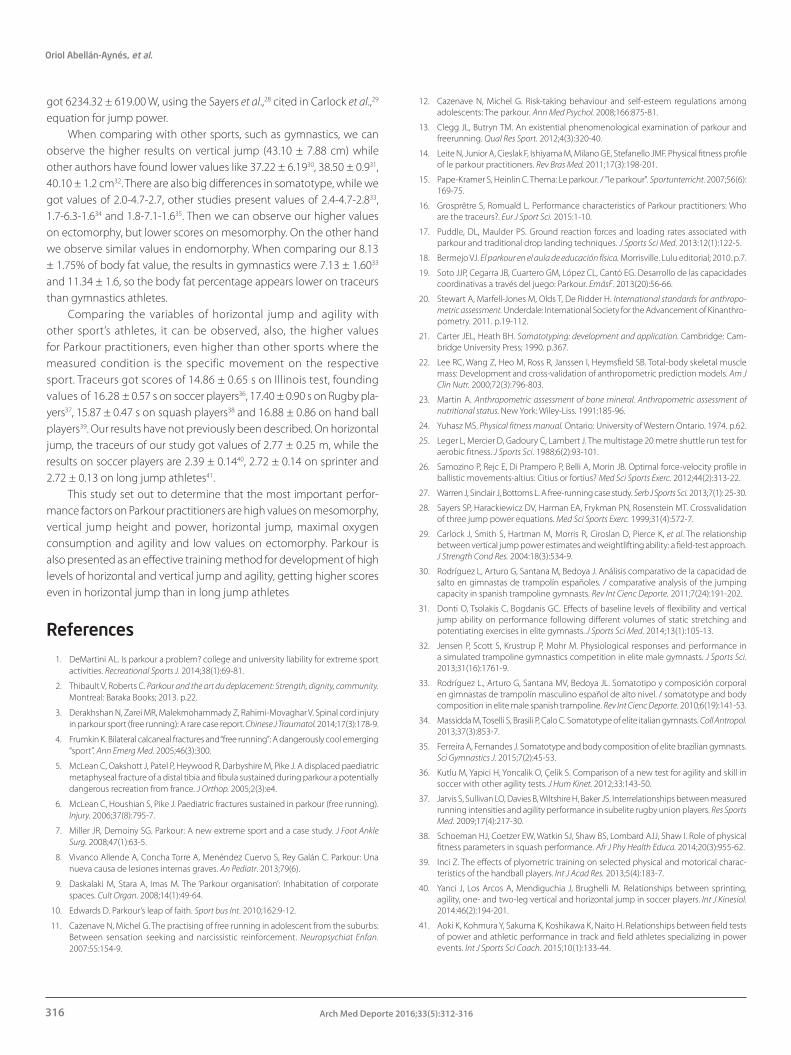
For testing agility, we used the Illinois test, which consisted on running in a circuit with 10 x 5 m as area. Four cones in the corner and other four cones on the middle of the rectangle were used. The cone A marks the beginning of the test, B and C the turning points, and D as the end of the test. Athletes had to touch with one of their hands cones B and C, the end of the test was when they crossed the cone D. The circuit is presented in Figure 1. All athletes performed 2 attempts, saving the best score for each athlete.
Sit & reach test was used for the measurement of hamstring exten-sibility, having every athlete 3 attempts. They sat with their feet against the testing box and their knees extended. Then they placed the right hand over the left hand and reached forward as far as they were able. They were allowed to rest for one minutes among tries. The best score was the saved one.
N Age Stretch Body mass Experience (years) stature (cm) (Kg) (years)
13 21.16 ± 2.52 177.25 ± 6.42 70.55 ± 9.06 5.57±2.34
Table 1. General characteristics of the traceurs.
Oriol Abellán-Aynés, et al.
314 Arch Med Deporte 2016;33(5):312-316
Five countermovement jumps were performed by all athletes. Jump height was recorded using a contact platform Chronojump (Bos-cosystem® ltda., Spain). The best score for each athlete was saved and also used for calculating jump power using Samozino et al.,26 equation.
All participants performed 3 horizontal jumps, starting on standing position with no previous run and parallel feet. The initial point was tiptoe, having the reference of calcaneus as the finish point.
The last test performed was a specific one, to determinate two groups as A: high Parkour performance; and B: low Parkour performance. The test consisted on a circuit designed by a Parkour expert. This test consisted on reaching seven obstacles where difficulty, execution and element concatenation were scored. Obstacles order were a length jump (3.125 m) with a 1.20 m ramp; a 1.10 m high rail vault using only their hands; two more identic rail vaults being allowed to do any element; a 2.15 m climb in a free way; other rail vault having to do, at least, a 360 degrees turn on the frontal or sagittal axis with no limit on longitudinal axis turns, being allowed to use only their feet; The sixth obstacle was a three elements concatenation where they had to do, at least, 360 degrees turn on frontal or sagittal axis and being allowed to use their hands on the ground; the last of them was another wall climb (2.6m height). On Parkour competitions, there are five judges to assess execution, difficulty, flow and creativity during a circuit. A Parkour expert took charge to define the execution, difficulty and flow punctuation to divide the sample in two groups due to it does not exist a published punctuation code yet, not being measured creativity.
Statistical analysis was done with IBM statics SPSS 20 software. Saphiro-wilk test was used for testing normality of the data and t test for independent samples for determining if there were significant differences among groups.
Results
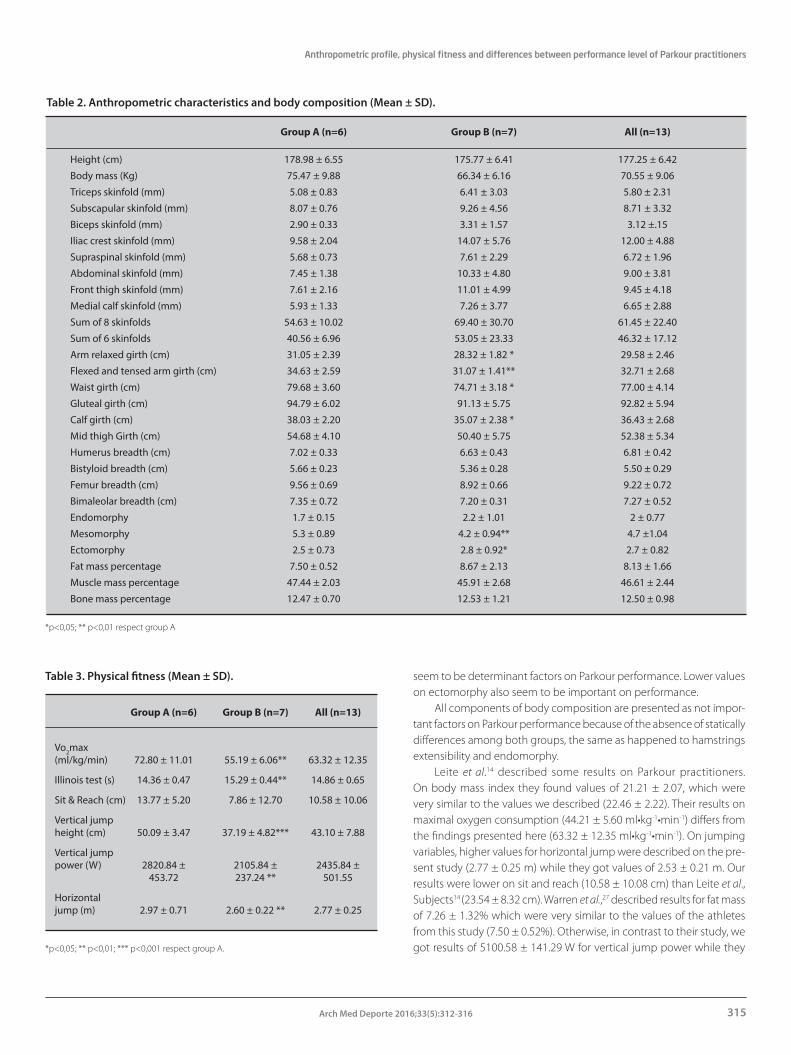
Anthropometric characteristics, somatotype and body composition are presented on Table 2.
No significant differences appear on skinfold variables, thus there are not significant differences on body fat. Although there are some girths that present significant differences, muscle mass does not appear as a variable with significant differences. Same as body fat, there are not differences between groups on bone mass, perhaps due to an absence of significant differences on breadths variables. It is on two somatotype components, mesomorphy and ectomorphy, where we can observe significant differences between groups.
On Figure 2 we can observe a somatochart for all sample, such as mean of both groups and individual somatotypes for all the athletes. We observe the difference between group A and B on mesomorphy.
Values for physical fitness of both groups are presented on Table 3.Significant differences between performance groups on physical
fitness were observed. Hamstrings extensibility has been presented as a not different variable among groups. The rest of variables measured are presented different between groups scores, thus they seem to be important factors on Parkour performance.
Discussion and conclusions
The main finding of this study were the high differences on meso-morphy, estimated maximal oxygen consumption, horizontal and ver-tical jump, jump power and agility between groups. So these variables
Figure 1. Illinois test circuit.
Figure 2. Somatochart of Parkour practitioners.
Anthropometric profile, physical fitness and differences between performance level of Parkour practitioners
315Arch Med Deporte 2016;33(5):312-316
seem to be determinant factors on Parkour performance. Lower values on ectomorphy also seem to be important on performance.
All components of body composition are presented as not impor-tant factors on Parkour performance because of the absence of statically differences among both groups, the same as happened to hamstrings extensibility and endomorphy.
Leite et al.14 described some results on Parkour practitioners. On body mass index they found values of 21.21 ± 2.07, which were very similar to the values we described (22.46 ± 2.22). Their results on maximal oxygen consumption (44.21 ± 5.60 ml•kg-1•min-1) differs from the findings presented here (63.32 ± 12.35 ml•kg-1•min-1). On jumping variables, higher values for horizontal jump were described on the pre-sent study (2.77 ± 0.25 m) while they got values of 2.53 ± 0.21 m. Our results were lower on sit and reach (10.58 ± 10.08 cm) than Leite et al., Subjects14 (23.54 ± 8.32 cm). Warren et al.,27 described results for fat mass of 7.26 ± 1.32% which were very similar to the values of the athletes from this study (7.50 ± 0.52%). Otherwise, in contrast to their study, we got results of 5100.58 ± 141.29 W for vertical jump power while they
Group A (n=6) Group B (n=7) All (n=13)
Height (cm) 178.98 ± 6.55 175.77 ± 6.41 177.25 ± 6.42
Body mass (Kg) 75.47 ± 9.88 66.34 ± 6.16 70.55 ± 9.06
Triceps skinfold (mm) 5.08 ± 0.83 6.41 ± 3.03 5.80 ± 2.31
Subscapular skinfold (mm) 8.07 ± 0.76 9.26 ± 4.56 8.71 ± 3.32
Biceps skinfold (mm) 2.90 ± 0.33 3.31 ± 1.57 3.12 ±.15
Iliac crest skinfold (mm) 9.58 ± 2.04 14.07 ± 5.76 12.00 ± 4.88
Supraspinal skinfold (mm) 5.68 ± 0.73 7.61 ± 2.29 6.72 ± 1.96
Abdominal skinfold (mm) 7.45 ± 1.38 10.33 ± 4.80 9.00 ± 3.81
Front thigh skinfold (mm) 7.61 ± 2.16 11.01 ± 4.99 9.45 ± 4.18
Medial calf skinfold (mm) 5.93 ± 1.33 7.26 ± 3.77 6.65 ± 2.88
Sum of 8 skinfolds 54.63 ± 10.02 69.40 ± 30.70 61.45 ± 22.40
Sum of 6 skinfolds 40.56 ± 6.96 53.05 ± 23.33 46.32 ± 17.12
Arm relaxed girth (cm) 31.05 ± 2.39 28.32 ± 1.82 * 29.58 ± 2.46
Flexed and tensed arm girth (cm) 34.63 ± 2.59 31.07 ± 1.41** 32.71 ± 2.68
Waist girth (cm) 79.68 ± 3.60 74.71 ± 3.18 * 77.00 ± 4.14
Gluteal girth (cm) 94.79 ± 6.02 91.13 ± 5.75 92.82 ± 5.94
Calf girth (cm) 38.03 ± 2.20 35.07 ± 2.38 * 36.43 ± 2.68
Mid thigh Girth (cm) 54.68 ± 4.10 50.40 ± 5.75 52.38 ± 5.34
Humerus breadth (cm) 7.02 ± 0.33 6.63 ± 0.43 6.81 ± 0.42
Bistyloid breadth (cm) 5.66 ± 0.23 5.36 ± 0.28 5.50 ± 0.29
Femur breadth (cm) 9.56 ± 0.69 8.92 ± 0.66 9.22 ± 0.72
Bimaleolar breadth (cm) 7.35 ± 0.72 7.20 ± 0.31 7.27 ± 0.52
Endomorphy 1.7 ± 0.15 2.2 ± 1.01 2 ± 0.77
Mesomorphy 5.3 ± 0.89 4.2 ± 0.94** 4.7 ±1.04
Ectomorphy 2.5 ± 0.73 2.8 ± 0.92* 2.7 ± 0.82
Fat mass percentage 7.50 ± 0.52 8.67 ± 2.13 8.13 ± 1.66
Muscle mass percentage 47.44 ± 2.03 45.91 ± 2.68 46.61 ± 2.44
Bone mass percentage 12.47 ± 0.70 12.53 ± 1.21 12.50 ± 0.98
Table 2. Anthropometric characteristics and body composition (Mean ± SD).
*p<0,05; ** p<0,01 respect group A
Table 3. Physical fitness (Mean ± SD).
Group A (n=6) Group B (n=7) All (n=13)
Vo2max (ml/kg/min) 72.80 ± 11.01 55.19 ± 6.06** 63.32 ± 12.35
Illinois test (s) 14.36 ± 0.47 15.29 ± 0.44** 14.86 ± 0.65
Sit & Reach (cm) 13.77 ± 5.20 7.86 ± 12.70 10.58 ± 10.06
Vertical jump height (cm) 50.09 ± 3.47 37.19 ± 4.82*** 43.10 ± 7.88
Vertical jump power (W) 2820.84 ± 2105.84 ± 2435.84 ± 453.72 237.24 ** 501.55
Horizontal jump (m) 2.97 ± 0.71 2.60 ± 0.22 ** 2.77 ± 0.25
*p<0,05; ** p<0,01; *** p<0,001 respect group A.
Oriol Abellán-Aynés, et al.
316 Arch Med Deporte 2016;33(5):312-316
got 6234.32 ± 619.00 W, using the Sayers et al.,28 cited in Carlock et al.,29 equation for jump power.
When comparing with other sports, such as gymnastics, we can observe the higher results on vertical jump (43.10 ± 7.88 cm) while other authors have found lower values like 37.22 ± 6.1930, 38.50 ± 0.931, 40.10 ± 1.2 cm32. There are also big differences in somatotype, while we got values of 2.0-4.7-2.7, other studies present values of 2.4-4.7-2.833, 1.7-6.3-1.634 and 1.8-7.1-1.635. Then we can observe our higher values on ectomorphy, but lower scores on mesomorphy. On the other hand we observe similar values in endomorphy. When comparing our 8.13 ± 1.75% of body fat value, the results in gymnastics were 7.13 ± 1.6033 and 11.34 ± 1.6, so the body fat percentage appears lower on traceurs than gymnastics athletes.
Comparing the variables of horizontal jump and agility with other sport’s athletes, it can be observed, also, the higher values for Parkour practitioners, even higher than other sports where the measured condition is the specific movement on the respective sport. Traceurs got scores of 14.86 ± 0.65 s on Illinois test, founding values of 16.28 ± 0.57 s on soccer players36, 17.40 ± 0.90 s on Rugby pla-yers37, 15.87 ± 0.47 s on squash players38 and 16.88 ± 0.86 on hand ball players39. Our results have not previously been described. On horizontal jump, the traceurs of our study got values of 2.77 ± 0.25 m, while the results on soccer players are 2.39 ± 0.1440, 2.72 ± 0.14 on sprinter and 2.72 ± 0.13 on long jump athletes41.
This study set out to determine that the most important perfor-mance factors on Parkour practitioners are high values on mesomorphy, vertical jump height and power, horizontal jump, maximal oxygen consumption and agility and low values on ectomorphy. Parkour is also presented as an effective training method for development of high levels of horizontal and vertical jump and agility, getting higher scores even in horizontal jump than in long jump athletes
References
1. DeMartini AL. Is parkour a problem? college and university liability for extreme sport activities. Recreational Sports J. 2014;38(1):69-81.
2. Thibault V, Roberts C. Parkour and the art du deplacement: Strength, dignity, community. Montreal: Baraka Books; 2013. p.22.
3. Derakhshan N, Zarei MR, Malekmohammady Z, Rahimi-Movaghar V. Spinal cord injury in parkour sport (free running): A rare case report. Chinese J Traumatol. 2014;17(3):178-9.
4. Frumkin K. Bilateral calcaneal fractures and “free running”: A dangerously cool emerging “sport”. Ann Emerg Med. 2005;46(3):300.
5. McLean C, Oakshott J, Patel P, Heywood R, Darbyshire M, Pike J. A displaced paediatric metaphyseal fracture of a distal tibia and fibula sustained during parkour a potentially dangerous recreation from france. J Orthop. 2005;2(3):e4.
6. McLean C, Houshian S, Pike J. Paediatric fractures sustained in parkour (free running). Injury. 2006;37(8):795-7.
7. Miller JR, Demoiny SG. Parkour: A new extreme sport and a case study. J Foot Ankle Surg. 2008;47(1):63-5.
8. Vivanco Allende A, Concha Torre A, Menéndez Cuervo S, Rey Galán C. Parkour: Una nueva causa de lesiones internas graves. An Pediatr. 2013;79(6).
9. Daskalaki M, Stara A, Imas M. The ‘Parkour organisation’: Inhabitation of corporate spaces. Cult Organ. 2008;14(1):49-64.
10. Edwards D. Parkour’s leap of faith. Sport bus Int. 2010;162:9-12.
11. Cazenave N, Michel G. The practising of free running in adolescent from the suburbs: Between sensation seeking and narcissistic reinforcement. Neuropsychiat Enfan. 2007:55:154-9.
12. Cazenave N, Michel G. Risk-taking behaviour and self-esteem regulations among adolescents: The parkour. Ann Med Psychol. 2008;166:875-81.
13. Clegg JL, Butryn TM. An existential phenomenological examination of parkour and freerunning. Qual Res Sport. 2012;4(3):320-40.
14. Leite N, Junior A, Cieslak F, Ishiyama M, Milano GE, Stefanello JMF. Physical fitness profile of le parkour practitioners. Rev Bras Med. 2011;17(3):198-201.
15. Pape-Kramer S, Heinlin C. Thema: Le parkour. / "le parkour". Sportunterricht. 2007;56(6): 169-75.
16. Grosprêtre S, Romuald L. Performance characteristics of Parkour practitioners: Who are the traceurs?. Eur J Sport Sci. 2015:1-10.
17. Puddle, DL, Maulder PS. Ground reaction forces and loading rates associated with parkour and traditional drop landing techniques. J Sports Sci Med. 2013:12(1):122-5.
18. Bermejo VJ. El parkour en el aula de educación física. Morrisville. Lulu editorial; 2010. p.7.
19. Soto JJP, Cegarra JB, Cuartero GM, López CL, Cantó EG. Desarrollo de las capacidades coordinativas a través del juego: Parkour. EmásF. 2013(20):56-66.
20. Stewart A, Marfell-Jones M, Olds T, De Ridder H. International standards for anthropo-metric assessment. Underdale: International Society for the Advancement of Kinanthro-pometry. 2011. p.19-112.
21. Carter JEL, Heath BH. Somatotyping: development and application. Cambridge: Cam-bridge University Press; 1990. p.367.
22. Lee RC, Wang Z, Heo M, Ross R, Janssen I, Heymsfield SB. Total-body skeletal muscle mass: Development and cross-validation of anthropometric prediction models. Am J Clin Nutr. 2000;72(3):796-803.
23. Martin A. Anthropometric assessment of bone mineral. Anthropometric assessment of nutritional status. New York: Wiley-Liss. 1991:185-96.
24. Yuhasz MS. Physical fitness manual. Ontario: University of Western Ontario. 1974. p.62.
25. Leger L, Mercier D, Gadoury C, Lambert J. The multistage 20 metre shuttle run test for aerobic fitness. J Sports Sci. 1988;6(2):93-101.
26. Samozino P, Rejc E, Di Prampero P, Belli A, Morin JB. Optimal force-velocity profile in ballistic movements-altius: Citius or fortius? Med Sci Sports Exerc. 2012;44(2):313-22.
27. Warren J, Sinclair J, Bottoms L. A free-running case study. Serb J Sports Sci. 2013;7(1): 25-30.
28. Sayers SP, Harackiewicz DV, Harman EA, Frykman PN, Rosenstein MT. Crossvalidation of three jump power equations. Med Sci Sports Exerc. 1999;31(4):572-7.
29. Carlock J, Smith S, Hartman M, Morris R, Ciroslan D, Pierce K, et al. The relationship between vertical jump power estimates and weightlifting ability: a field-test approach. J Strength Cond Res. 2004:18(3):534-9.
30. Rodríguez L, Arturo G, Santana M, Bedoya J. Análisis comparativo de la capacidad de salto en gimnastas de trampolín españoles. / comparative analysis of the jumping capacity in spanish trampoline gymnasts. Rev Int Cienc Deporte. 2011;7(24):191-202.
31. Donti O, Tsolakis C, Bogdanis GC. Effects of baseline levels of flexibility and vertical jump ability on performance following different volumes of static stretching and potentiating exercises in elite gymnasts. J Sports Sci Med. 2014;13(1):105-13.
32. Jensen P, Scott S, Krustrup P, Mohr M. Physiological responses and performance in a simulated trampoline gymnastics competition in elite male gymnasts. J Sports Sci. 2013;31(16):1761-9.
33. Rodríguez L., Arturo G, Santana MV, Bedoya JL. Somatotipo y composición corporal en gimnastas de trampolín masculino español de alto nivel. / somatotype and body composition in elite male spanish trampoline. Rev Int Cienc Deporte. 2010;6(19):141-53.
34. Massidda M, Toselli S, Brasili P, Calo C. Somatotype of elite italian gymnasts. Coll Antropol. 2013;37(3):853-7.
35. Ferreira A, Fernandes J. Somatotype and body composition of elite brazilian gymnasts. Sci Gymnastics J. 2015;7(2):45-53.
36. Kutlu M, Yapici H, Yoncalik O, Çelik S. Comparison of a new test for agility and skill in soccer with other agility tests. J Hum Kinet. 2012;33:143-50.
37. Jarvis S, Sullivan LO, Davies B, Wiltshire H, Baker JS. Interrelationships between measured running intensities and agility performance in subelite rugby union players. Res Sports Med. 2009;17(4):217-30.
38. Schoeman HJ, Coetzer EW, Watkin SJ, Shaw BS, Lombard AJJ, Shaw I. Role of physical fitness parameters in squash performance. Afr J Phy Health Educa. 2014;20(3):955-62.
39. Inci Z. The effects of plyometric training on selected physical and motorical charac-teristics of the handball players. Int J Acad Res. 2013;5(4):183-7.
40. Yanci J, Los Arcos A, Mendiguchia J, Brughelli M. Relationships between sprinting, agility, one- and two-leg vertical and horizontal jump in soccer players. Int J Kinesiol. 2014:46(2):194-201.
41. Aoki K, Kohmura Y, Sakuma K, Koshikawa K, Naito H. Relationships between field tests of power and athletic performance in track and field athletes specializing in power events. Int J Sports Sci Coach. 2015;10(1):133-44.
