anthony knight market update - wordpress.com · anthony knight city overview longmont, co monday...
TRANSCRIPT

MARKET UPDATEAnthony Knight
· Current Real Estate Market Conditions for Single Family Homes· Trends in Pricing· Current Levels of Supply and Demand· Value Metrics
· Report for the week ofFebruary 01, 2010
· Presented by Anthony KnightTRG National Titlewww.positiveangles.wordpress.com /303.594.2013
LONGMONT, CO
Powered by Altos Research LLC | www.altosresearch.com | Copyright © 2005-2009 Altos Research LLC

Median List Price
Median Lot Size
16.4
Percent Relisted (reset DOM)
2327
3.0
4 %
Median Number of Bathrooms
215
Inventory of Properties Listed
$ 146
Percent Flip (price increased)
8,001 - 10,000 sqft
Median House Size (sq ft)
$ 300,000
40 %
3.0
Market Action Index
Median Number of Bedrooms
Asking Price Per Square Foot
9 %
Percent of Properties with Price Decrease
Strong Buyer's
±+
≠≠
≠≠
≠≠
==
Altos Research Value Statistics
Most Expensive Listing
Average Days on Market (DoM)
Bottom/Fourth
Lower/Third
Upper/Second
Top/First
This Week Real-Time Market Profile Trend
The Market Action Index answers the question "How's the Market?" By measuringthe current rate of sale versus the amount of the inventory. Index above 30implies a seller's advantage. Below 30, conditions give the advantage to thebuyer.
Supply and Demand
Characteristics per Quartile
10 24642
1483.0 16
3.0
1
223
3.0 34
74
1
4
0.50 - 1.0acre
36
$ 242,450
6
1
34
4.0
6,501 -8,000 sqft
23.0
1388 6,501 -8,000 sqft
34
$ 165,450
4.0
423
0.25 - 0.50acre$ 433,500
4.0$ 1,049,000
12
8
2818
The Market Action Index has beenclimbing lately while days-on-marketare trending down, these point to apositive near-term outlook for themarket.
Monday February 1, 2010
Anthony Knight
33
1838
2.0
The median list price in LONGMONT,CO this week is $300,000. The 135properties have been on the marketfor an average of 215 days.
Most expensive 25% of properties
Upper-middle 25% of properties
Lower-middle 25% of properties
Least expensive 25% of properties
Quartile Median Price Lot Size Beds Baths Age Inventory New Absorbed DOMSq. Ft.
No change
Strong upward trend Strong downward trend
Slight upward trend Slight downward trend±+
== ≠≠
≠=
LONGMONT, COCity Overview
Least Expensive Listing
Average List Price
Average Age of Listing
135
$ 9,850,000
$ 89,900
$ 607,768
29
Trend Key:
Home sales have been exceedingnew inventory for several weeks.However because of excessinventory, prices have not yetstopped falling. Should the salestrend continue, expect prices tolevel off soon and potentially toresume their climb from there.Watch prices as the markettransitions from a Buyer's market toa Seller's market.
Page 2 of 16
Single Family Homes in

Anthony Knight
City OverviewLONGMONT, CO
Monday February 1, 2010
Median PriceAgain this week we see a downward notch for prices. Pricing has been weak in recent weeks and versus their absolute-highlevels. The Market Action Index is a good leading indicator for the durability of this trend.
90-day Average7-day Average
Quartile PricesPrice weakness is evident across the board. All four quartiles have been in price decline in recent weeks. Look to the MarketAction Index as a leading indicator of the bottom of the market.
First/Top Second/Upper Third/Lower Fourth/Bottom
Page 3 of 16
Single Family Homes in

Anthony Knight
City OverviewLONGMONT, CO
Monday February 1, 2010
Price per Square FootThe market's downward trends are shared across both price and value. People are recently placing less value on homes (you cansee the recent declines in price per square foot as evidence.) Look for significant changes in the Market Action Index as aprecursor to price and value changes, possibly as inflection points for good investment opportunities.
90-day Average7-day Average
Inventory of Properties Listed for SaleInventory has been relatively steady around these levels in recent weeks.
90-day Average7-day Average
Page 4 of 16
Single Family Homes in

Anthony Knight
City OverviewLONGMONT, CO
Monday February 1, 2010
Market Action IndexThe LONGMONT market is currently quite strongly in the Buyer's Advantage zone (below 30). The 90-day Market Action Indexstands at 16.41. With several months of inventory available at the current sales rate, buyers should find ample choice.
Buyers/Sellers Cutoff90-day Average
Market Action Index per QuartileNot surprisingly given the overall Market Action Index, all quartiles are in the Buyer's Market zone with several months ofinventory given the current rate of demand for homes in the quartile. Watch the quartile for changes before the overall marketshifts. Often one end of the market (e.g. the low end) will improve and signal a strengthening market before the whole group
First/Top Second/Upper Third/Lower Fourth/Bottom
Buyers/Sellers Cutoff
Residential house prices are a function of supply and demand, and market conditions can be characterized byanalyzing those factors. Watch this index for sustained changes: if the index falls into the Buyer’s Advantagezone (below 30) for a long period, prices are likely in for a downward correction.
The Market Action Index (MAI) illustrates a blance between supply and demand using a statistical function of thecurrent rate of sale versus current inventory.
Page 5 of 16
Single Family Homes in

Anthony Knight
City OverviewLONGMONT, CO
Monday February 1, 2010
Days on MarketThe properties have been on the market for an average of 215 days. Half of the listings have come newly on the market in thepast 133 or so days.
90-day Average7-day Average
Days on Market per QuartileIt is not uncommon for the higher priced homes in an area to take longer to sell than those in the lower quartiles.
First/Top Second/Upper Third/Lower Fourth/Bottom
Page 6 of 16
Single Family Homes in

Median List Price
Median Lot Size
17.8
Percent Relisted (reset DOM)
1670
2.0
5 %
Median Number of Bathrooms
158
Inventory of Properties Listed
$ 123
Percent Flip (price increased)
6,501 - 8,000 sqft
Median House Size (sq ft)
$ 220,000
43 %
3.0
Market Action Index
Median Number of Bedrooms
Asking Price Per Square Foot
10 %
Percent of Properties with Price Decrease
Strong Buyer's
±+
≠≠
==
≠≠
==
Altos Research Value Statistics
Most Expensive Listing
Average Days on Market (DoM)
Bottom/Fourth
Lower/Third
Upper/Second
Top/First
This Week Real-Time Market Profile Trend
The Market Action Index answers the question "How's the Market?" By measuringthe current rate of sale versus the amount of the inventory. Index above 30implies a seller's advantage. Below 30, conditions give the advantage to thebuyer.
Supply and Demand
Characteristics per Quartile
13 12416
1022.0 41
3.0
1
154
3.0 15
70
1
3
8,001 -10,000 sqft
44
$ 200,000
5
0
16
3.0
6,501 -8,000 sqft
23.0
1344 6,501 -8,000 sqft
15
$ 151,200
3.0
312
6,501 -8,000 sqft$ 255,000
3.0$ 345,000
16
5
2192
The Market Action Index has beenclimbing lately while days-on-marketare trending down, these point to apositive near-term outlook for themarket.
Monday February 1, 2010
Anthony Knight
15
1376
2.0
The median list price in LONGMONT,CO 80501 this week is $220,000. The61 properties have been on themarket for an average of 158 days.
Most expensive 25% of properties
Upper-middle 25% of properties
Lower-middle 25% of properties
Least expensive 25% of properties
Quartile Median Price Lot Size Beds Baths Age Inventory New Absorbed DOMSq. Ft.
No change
Strong upward trend Strong downward trend
Slight upward trend Slight downward trend±+
== ≠≠
≠=
LONGMONT, CO80501
Neighborhood Detail
Least Expensive Listing
Average List Price
Average Age of Listing
61
$ 940,500
$ 89,900
$ 255,443
43
Trend Key:
The market has settled in at arelative stasis in inventory and salesconditions. It's a Buyer's market thathas seen prices trend lower. Expectthat consistent up trends in demandwill be required before price trendschange significantly.
Page 7 of 16
Single Family Homes in

Anthony Knight
Neighborhood DetailLONGMONT, CO
80501
Monday February 1, 2010
Median PriceAgain this week in this zip code we see a downward notch for prices. Pricing has been weak in recent weeks and versus theirabsolute-high level. At this point, we will be looking for a persistent upward shift in the Market Action Index as a leadingindicator for a trough in prices.
90-day Average7-day Average
Quartile PricesIn the quartile market segments, we see the market's price weakness evident across the board. All four quartiles have been inprice decline in recent weeks. Look to the Market Action Index as a leading indicator of the bottom of the market.
First/Top Second/Upper Third/Lower Fourth/Bottom
Page 8 of 16
Single Family Homes in
Anthony Knight
Neighborhood DetailLONGMONT, CO
80501
Monday February 1, 2010
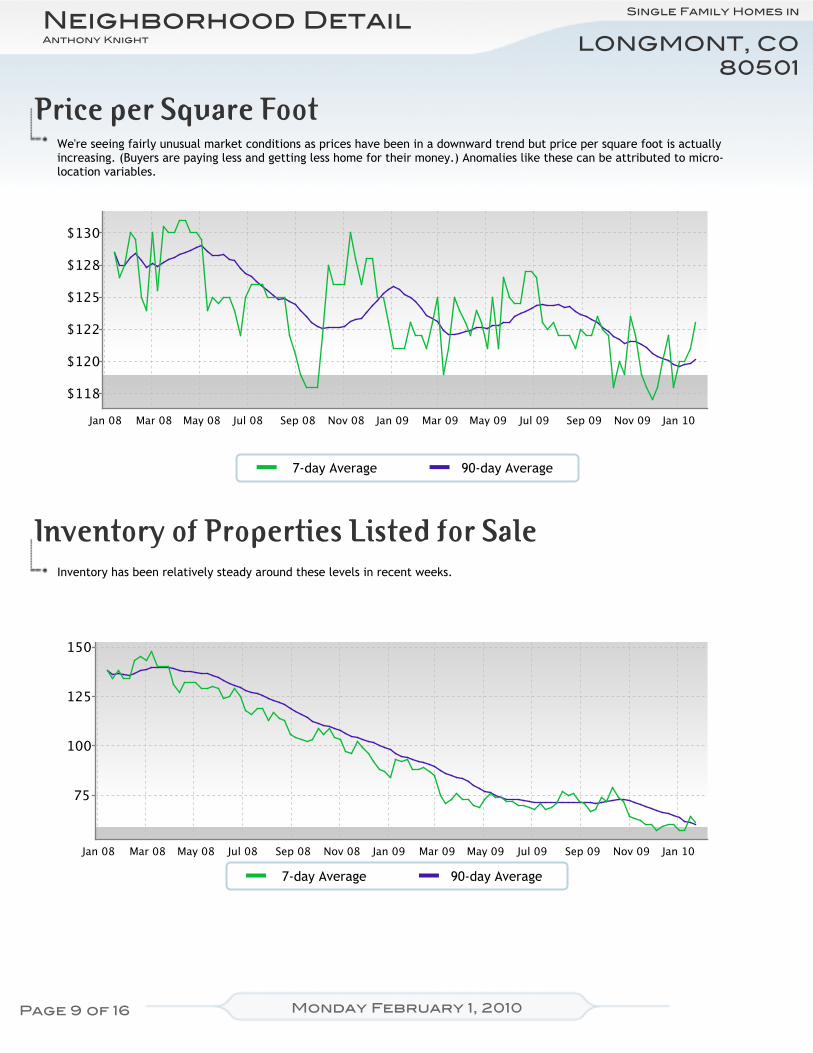
Price per Square FootWe're seeing fairly unusual market conditions as prices have been in a downward trend but price per square foot is actuallyincreasing. (Buyers are paying less and getting less home for their money.) Anomalies like these can be attributed to micro-location variables.
90-day Average7-day Average
Inventory of Properties Listed for SaleInventory has been relatively steady around these levels in recent weeks.
90-day Average7-day Average
Page 9 of 16
Single Family Homes in

Anthony Knight
Neighborhood DetailLONGMONT, CO
80501
Monday February 1, 2010
Market Action IndexThe LONGMONT, 80501 market is currently quite strongly in the Buyer's Advantage zone (below 30). The 90-day Market ActionIndex stands at 17.83. With several months of inventory available at the current sales rate, buyers should find ample choice.
Buyers/Sellers Cutoff90-day Average
Market Action Index per QuartileNot surprisingly, all quartiles are in the Buyer's Market zone with several months of inventory given the current levels ofdemand. Watch the quartiles for changes before the overall market shifts.
First/Top Second/Upper Third/Lower Fourth/Bottom
Buyers/Sellers Cutoff
Residential house prices are a function of supply and demand, and market conditions can be characterized byanalyzing those factors. Watch this index for sustained changes: if the index falls into the Buyer’s Advantagezone (below 30) for a long period, prices are likely in for a downward correction.
The Market Action Index (MAI) illustrates a blance between supply and demand using a statistical function of thecurrent rate of sale versus current inventory.
Page 10 of 16
Single Family Homes in

Anthony Knight
Neighborhood DetailLONGMONT, CO
80501
Monday February 1, 2010
Days on MarketThe properties have been on the market for an average of 158 days. Half of the listings have come newly on the market in thepast 77 or so days.
90-day Average7-day Average
Days on Market per QuartileIt is not uncommon for the higher priced homes in an area to take longer to sell than those in the lower quartiles.
First/Top Second/Upper Third/Lower Fourth/Bottom
Page 11 of 16
Single Family Homes in

Median List Price
Median Lot Size
14.7
Percent Relisted (reset DOM)
3404
4.0
4 %
Median Number of Bathrooms
263
Inventory of Properties Listed
$ 158
Percent Flip (price increased)
0.25 - 0.50 acre
Median House Size (sq ft)
$ 527,000
38 %
4.0
Market Action Index
Median Number of Bedrooms
Asking Price Per Square Foot
8 %
Percent of Properties with Price Decrease
Strong Buyer's
≠≠
≠≠
≠≠
≠≠
==
Altos Research Value Statistics
Most Expensive Listing
Average Days on Market (DoM)
Bottom/Fourth
Lower/Third
Upper/Second
Top/First
This Week Real-Time Market Profile Trend
The Market Action Index answers the question "How's the Market?" By measuringthe current rate of sale versus the amount of the inventory. Index above 30implies a seller's advantage. Below 30, conditions give the advantage to thebuyer.
Supply and Demand
Characteristics per Quartile
8 15396
1473.0 14
3.0
1
386
4.0 19
84
1
1
0.50 - 1.0acre
15
$ 425,000
0
0
19
5.0
8,001 -10,000 sqft
14.0
1588 4,501 -6,500 sqft
18
$ 214,900
4.0
449
1.0 - 2.5acres$ 691,668
4.0$ 1,505,000
13
2
3889
Inventory is tightening and days-on-market is falling. The Market ActionIndex shows demand heating up.These are relatively bullish signs forprices.
Monday February 1, 2010
Anthony Knight
18
2867
3.0
The median list price in LONGMONT,CO 80503 this week is $527,000. The74 properties have been on themarket for an average of 263 days.
Most expensive 25% of properties
Upper-middle 25% of properties
Lower-middle 25% of properties
Least expensive 25% of properties
Quartile Median Price Lot Size Beds Baths Age Inventory New Absorbed DOMSq. Ft.
No change
Strong upward trend Strong downward trend
Slight upward trend Slight downward trend±+
== ≠≠
≠=
LONGMONT, CO80503
Neighborhood Detail
Least Expensive Listing
Average List Price
Average Age of Listing
74
$ 9,850,000
$ 124,900
$ 898,198
18
Trend Key:
Home sales have been exceedingnew inventory for several weeks.However because of excessinventory, prices have not yetstopped falling. Should the salestrend continue, expect prices tolevel off soon and potentially toresume their climb from there.Watch prices as the markettransitions from a Buyer's market toa Seller's market.
Page 12 of 16
Single Family Homes in

Anthony Knight
Neighborhood DetailLONGMONT, CO
80503
Monday February 1, 2010
Median PricePrices in this zip code have been on a downward trend recently and this week, while essentially flat, doesn't break us out of thatcycle.
90-day Average7-day Average
Quartile PricesIn the quartile market segments, we see the market's price weakness evident across the board. All four quartiles have been inprice decline in recent weeks. Look to the Market Action Index as a leading indicator of the bottom of the market.
First/Top Second/Upper Third/Lower Fourth/Bottom
Page 13 of 16
Single Family Homes in
Anthony Knight
Neighborhood DetailLONGMONT, CO
80503
Monday February 1, 2010
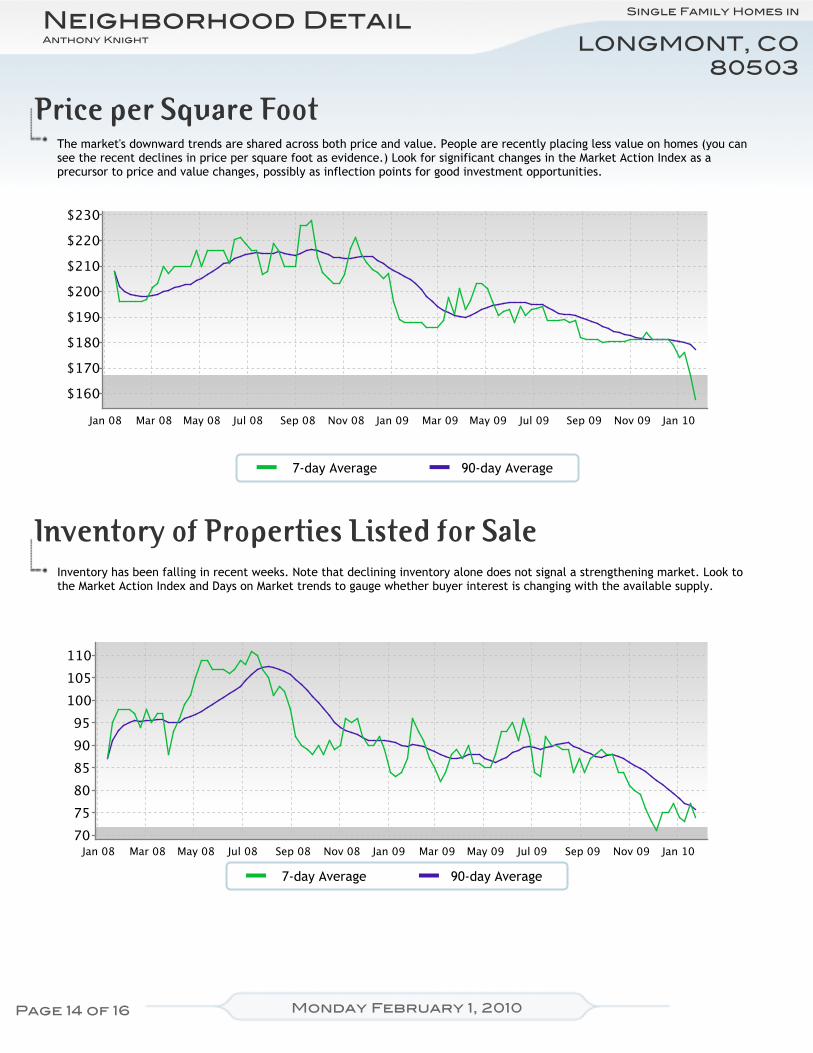
Price per Square FootThe market's downward trends are shared across both price and value. People are recently placing less value on homes (you cansee the recent declines in price per square foot as evidence.) Look for significant changes in the Market Action Index as aprecursor to price and value changes, possibly as inflection points for good investment opportunities.
90-day Average7-day Average
Inventory of Properties Listed for SaleInventory has been falling in recent weeks. Note that declining inventory alone does not signal a strengthening market. Look tothe Market Action Index and Days on Market trends to gauge whether buyer interest is changing with the available supply.
90-day Average7-day Average
Page 14 of 16
Single Family Homes in

Anthony Knight
Neighborhood DetailLONGMONT, CO
80503
Monday February 1, 2010
Market Action IndexThe LONGMONT, 80503 market is currently quite strongly in the Buyer's Advantage zone (below 30). The 90-day Market ActionIndex stands at 14.68. With several months of inventory available at the current sales rate, buyers should find ample choice.
Buyers/Sellers Cutoff90-day Average
Market Action Index per QuartileNot surprisingly, all quartiles are in the Buyer's Market zone with several months of inventory given the current levels ofdemand. Watch the quartiles for changes before the overall market shifts.
First/Top Second/Upper Third/Lower Fourth/Bottom
Buyers/Sellers Cutoff
Residential house prices are a function of supply and demand, and market conditions can be characterized byanalyzing those factors. Watch this index for sustained changes: if the index falls into the Buyer’s Advantagezone (below 30) for a long period, prices are likely in for a downward correction.
The Market Action Index (MAI) illustrates a blance between supply and demand using a statistical function of thecurrent rate of sale versus current inventory.
Page 15 of 16
Single Family Homes in

Anthony Knight
Neighborhood DetailLONGMONT, CO
80503
Monday February 1, 2010
Days on MarketThe properties have been on the market for an average of 263 days. Half of the listings have come newly on the market in thepast 182 or so days.
90-day Average7-day Average
Days on Market per QuartileIt is not uncommon for the higher priced homes in an area to take longer to sell than those in the lower quartiles.
First/Top Second/Upper Third/Lower Fourth/Bottom
Page 16 of 16
Single Family Homes in