antenna ground system test setup - antennas by n6lf€¦ · rx power ⎟⎟ ⎠ ⎞ ⎜⎜ ......
TRANSCRIPT

1
Test set-up and instrumentation for the vertical ground system experiments
Rudy Severns, N6LF
16 May 2008 The purpose of this series of experiments was to examine how different ground system arrangements would affect the behavior of a vertical antenna and to see if field measurements on a real antenna would correlate with NEC modeling. The physical layout of the test range, the instrumentation employed and the test procedures were all key elements in obtaining reliable results. The following discussion provides descriptions of these elements which remained essentially constant for most of the experiments. The majority of the measurements were performed at 7.2 MHz although there was some work at 160, 30, 20, 17, 15 and 10 meters. The information given here is intended to provide information common to all the experiments. Reports on individual experiments are presented separately. Test concept The test procedure is well known: a test antenna is excited with a known power and the resulting signal measured at a remote point. A change is then made in the test antenna and the measurement repeated. The difference between the two measurements is a measure of the effect of the change in the antenna and/or ground system on performance.

2
2
1
Rr
RgRX
power
⎟⎟⎠
⎞⎜⎜⎝
⎛+
∝RgRr
RrPiS21antenna equivalent circuit
antenna 1
antenna 2
Figure 1, traditional measurement scheme. Figure 1 shows the traditional scheme for measuring antenna performance. A transmitter combined with a forward and reflected power meter is used to excite the test antenna with a known power. A calibrated receiver is connected to a remote receiving antenna to measure the resulting signal. In my initial tests I used both a HP3586C and an HP3585A spectrum analyzer for the receiver. I wished to measure the performance differences between configurations to within 0.1 dB if possible and these instruments were capable of that. However, the limiting factor turned out to be my ability to measure the excitation power. 0.1 dB corresponds to about 2%. To make repeatable measurements to 0.1 dB you would need to measure power to better than 1%. This is possible but not all that easy. To get around that problem I decided to use different instrumentation scheme illustrated in figure 2. I chose a vector network analyzer (VNA) in the transmission mode (S21, response at port 2 to the excitation at port 1) to make the measurements. The transmission path was from the VNA output port, out to the test antenna via a transmission line, from there to the receive antenna and back to the VNA input port via another transmission line.

S21
rx antenna test antenna
Figure 2, vector network analyzer approach for measuring antenna performance. Amplitude measurements with a professional VNA are typically displayed to 0.001 dB but of course nothing else in the system is stable to that level. In practice I found that measurements made over a short period of time (2-3 hours) were repeatable to within +/- 0.05 dB. More than adequate for these experiments. A weakness of this method of measurement is that as the separation between the test antenna and the receiving antenna is increased, the attenuation around the transmission loop becomes quite large, -40 to -60 dB. For instrumentation and a physical setup with a noise floor and stray coupling below -110 dBm, this is acceptable but it did limit the separation distance on 40 m to about 2.25 wavelengths for the particular receiving antenna employed. This is in the far field but
3

just. Another limitation was that +/- 0.05 dB repeatability was possible only when the antenna under test and the receive antennas were actually stable to that level. This usually meant that measurements had to be made in early morning when the test range was in the shade or late in the day when things had reached thermal equilibrium. It was very easy to detect a cloud passing over by the small changes due to temperature changes in the antennas. I could also readily detect the effect of the wind on the vertical, causing it to move slightly. In the end the A-B comparison measurements were probably within a few tenths of a dB but only when all the details were carefully attended to. Which brings us to an important point. The purpose of the experiments was to determine the effect of different ground system arrangements from their effect on S21. All the measurements were relative A-B comparisons: i.e. a comparison between two different configurations. There was no attempt to measure absolute signal strengths or radiation patterns. The separation distance between the test antenna and the receiving antenna was sufficient to place the receiving antenna outside the reactive near field but the groundwave was still significant. This was not a problem for the type of measurements being made. The presence of a metal pump house and a travel trailer, both of which are small in terms of a wavelength might have had an impact on pattern measurements but should not have affected the type of A-B measurements being made in this series of experiments. Physical arrangement The test range was set up in a field as shown in the photo in figure 3, with an area for the test antennas (including ground systems), a remote receiving antenna (in the far distance) and a small travel trailer to provide shelter for the instrumentation.
4
Figure 3, view of the test antenna area and shelter for test equipment. The receiving antenna is at the far end of the pasture.

The eight poles, in an 80' diameter circle around the test antenna, were used to support elevated radials as needed. When more than eight elevated radials were needed, a 1/2" Dacron line was stretched around the posts at the desired height and tightened with a turn-buckle. Each post has a backstay to a buried deadman anchor so the radials could be well tensioned. Radial heights on each post were located using a laser level to keep the radial fan flat around the circle.
Figure 4, typical test antenna and center post support.
5

In the center of the circle there is a support post (PVC pipe) as shown in figure 4, with Dacron support lines attached to the top. This is intended to hold the antenna under test and allow it to move up and down to vary the height for elevated radial tests. An example of the base plate at ground level with 64 radials attached is shown in figure 5.
Figure 5, test antenna base at ground level with 64 radials.
The base plate is isolated from ground but there are three ground stakes (4' copper clad steel rods) close to the plate for those tests where grounding is desired. The ground stakes have short pig-tail leads to connect to the base plate when desired. An example of the base plate positioned for elevated radial tests is shown in figure 6. The base plate, the radials and the entire test antenna are elevated by sliding them along the support pipe. This arrangement made it very easy to change the height of the radials in small increments up to 4.5' above ground. The radials lying on the ground in figure 6 were not present during elevated radial tests!
6
As shown in figures 5 and 6, a coaxial common mode choke (balun) was used to isolate the transmission line from the test antenna. This was done for all measurements whether or not ground stakes were engaged. The choke has an impedance of >3 kOhm at 7.2 MHz. For those tests in

which the SteppIR vertical was employed, the balun that comes with that antenna was used in lieu of the choke shown in the photos.
Figure 6, base plate in position for elevated radials.
Figure 7, loop receiving antenna.
7

The receiving antenna was a 3-turn diamond loop as shown in figure 7, with a diagonal dimension of 24". The loop was resonant at 8.2 MHz. This loop was installed at the top of a 40' mast as shown in figure 8.
Figure 8, receiving antenna atop a 40' mast. N7MQ assisting!
The distance from the base of the test antenna to the receiving loop is a little over 300', about 2.25 wavelengths at 7.2 MHz. The elevation angle f rom the base of the test vertical was about 8 degrees. The coax from the VNA output port to the base of the test antenna was 1/2" Andrews Heliax with "N" connectors. The coax from the receiving antenna back to the VNA was LMR 400. Low loss coax was used because it provided better shield attenuation to reduce coupling and in the case of the heliax running out to the test antenna, the very low loss removed the need for an additional correction factor for the change in cable loss with variations in SWR.
8

Test instrumentation Feed-point impedance, transmission gain (S21) and radial current measurements were all made using a VNA. Two analyzers were available: an HP3577A with an HP35677A S-parameter test box and an N2PK analyzer with dual fast detectors. Photos of these instruments are given in figures 9 and 10.
Figure 7, HP3577A with an HP35677A S-parameter test box.
Note the organic automatic heating unit on top! Critical for maximum accuracy. The common mode choke in the photo is undergoing characterization for transmission loss and series impedance at 7.2 MHz. It turned out however, that the impedance of the choke was much greater than the 50 Ohm reference impedance of the VNA. Above about 2 kOhm even an HP VNA becomes inaccurate for a direct measurement. For choke measurements I went back to an HP4815 analyzer which is well suited for hi-impedance measurements.
9

Figure 8, the N2PK VNA with the associated laptop computer and HP calibration loads.
After careful comparisons between the HP and N2PK VNA's, the N2PK was selected for most of the measurements as it's performance was very close to the HP and had the advantage of direct readout to a computer which made data reduction much easier. The N2PK was also much lighter than the HP (70+ pounds!) and more suitable for field measurements. On several occasions it was necessary to measure the current division ratios between the radials and in some cases, the relative current distribution along a radial. To make these measurements a set of current transformers like that shown in figure 11, were used.
10
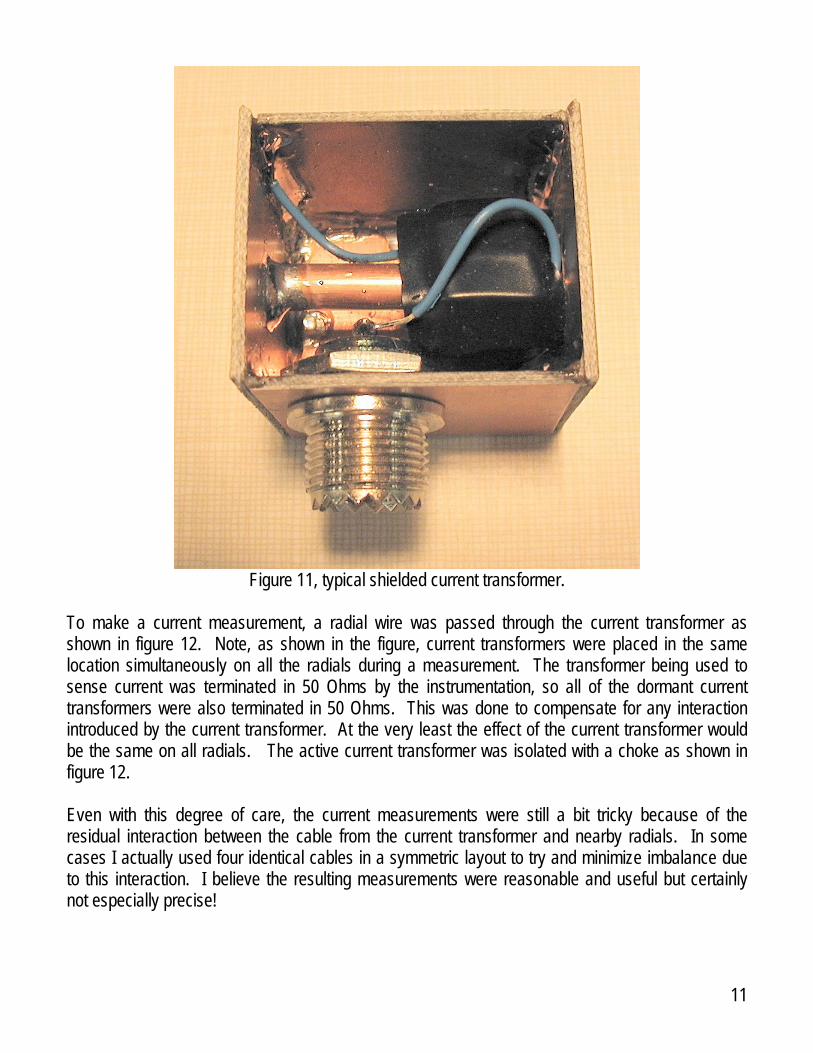
Figure 11, typical shielded current transformer.
To make a current measurement, a radial wire was passed through the current transformer as shown in figure 12. Note, as shown in the figure, current transformers were placed in the same location simultaneously on all the radials during a measurement. The transformer being used to sense current was terminated in 50 Ohms by the instrumentation, so all of the dormant current transformers were also terminated in 50 Ohms. This was done to compensate for any interaction introduced by the current transformer. At the very least the effect of the current transformer would be the same on all radials. The active current transformer was isolated with a choke as shown in figure 12. Even with this degree of care, the current measurements were still a bit tricky because of the residual interaction between the cable from the current transformer and nearby radials. In some cases I actually used four identical cables in a symmetric layout to try and minimize imbalance due to this interaction. I believe the resulting measurements were reasonable and useful but certainly not especially precise!
11

terminated current transformer
active current transformer
Figure 12, typical radial current measurement. The relative value of the current was determined by using the VNA in the transmission mode, measuring S21 for the loop from the VNA output port, to the base of the antenna, out along the radial to the current transformer and back to the input port of the VNA.. This was a convenient way to measure the current division between radials and the relative current distribution along a radial. Comments on test procedures A good physical setup and professional instrumentation are very good start but to obtain reliable data great care must be exercised in using and calibrating this equipment. For feed-point impedance measurements, at the beginning and end of every test run an OSL (open, short, reference load) calibration was performed with the calibration plane at the test antenna feed-point. At the beginning and end of each test run a transmission calibration was also performed. In addition, before beginning a series of measurements a measurement of stray coupling and possible interference was performed. The procedure was to disconnect the feedline from the base of the test antenna, terminate the feedline with a 50 Ohm load and then measure the transmission gain of the entire system in this state. Throughout the series of experiments this transmission level was never higher than -110 dBm and usually -115 dBm or lower, at 7.2 MHz.
12

13
As a further check on results, most experiments were run several times to verify consistency and repeatability. All of this was very time consuming but absolutely necessary to assure the best possible measurements. However, I did not delude myself into thinking the measurements were perfect and cannot be improved on. But I do believe the results make sense, fit well with NEC modeling predictions, give useful insights into vertical antenna/ground system behavior and potentially can be of practical help in optimizing a given antenna installation.