antecedents and outcomes of employee …
TRANSCRIPT

California State University, San Bernardino California State University, San Bernardino
CSUSB ScholarWorks CSUSB ScholarWorks
Electronic Theses, Projects, and Dissertations Office of Graduate Studies
5-2021
ANTECEDENTS AND OUTCOMES OF EMPLOYEE ANTECEDENTS AND OUTCOMES OF EMPLOYEE
ORGANIZATIONAL ORIENTATION PERCEPTION ORGANIZATIONAL ORIENTATION PERCEPTION
Kaleb Garcia
Follow this and additional works at: https://scholarworks.lib.csusb.edu/etd
Part of the Applied Behavior Analysis Commons, Cognition and Perception Commons, Industrial and
Organizational Psychology Commons, Leadership Studies Commons, and the Organization Development
Commons
Recommended Citation Recommended Citation Garcia, Kaleb, "ANTECEDENTS AND OUTCOMES OF EMPLOYEE ORGANIZATIONAL ORIENTATION PERCEPTION" (2021). Electronic Theses, Projects, and Dissertations. 1275. https://scholarworks.lib.csusb.edu/etd/1275
This Thesis is brought to you for free and open access by the Office of Graduate Studies at CSUSB ScholarWorks. It has been accepted for inclusion in Electronic Theses, Projects, and Dissertations by an authorized administrator of CSUSB ScholarWorks. For more information, please contact [email protected].

ANTECEDENTS AND OUTCOMES OF EMPLOYEE ORGANIZATIONAL
ORIENTATION PERCEPTION
A Thesis
Presented to the
Faculty of
California State University,
San Bernardino
In Partial Fulfillment
of the Requirements for the Degree
Master of Science
in
Psychology:
Industrial/Organizational
by
Kaleb Noel Deleon Garcia
May 2021

ANTECEDENTS AND OUTCOMES OF EMPLOYEE ORGANIZATIONAL
ORIENTATION PERCEPTION
A Thesis
Presented to the
Faculty of
California State University,
San Bernardino
by
Kaleb Noel Deleon Garcia
May 2021
Approved by:
Dr. Ismael Diaz, Committee Chair, Psychology
Dr. Janet Kottke, Committee Member
Dr. Janelle Gilbert, Committee Member

© 2021 Kaleb Garcia
iii
ABSTRACT
The current study investigated the antecedents and outcomes of
organizational orientation (production or employee oriented) through path-way
analysis with maximum liklihood estimation procedures. This is a preliminary
study to investigate the advantages organization will receive as a result of
focusing on either employees (employee orientation) or production (production
orientation). Additionally, this study contributes to the larger body of IO research
by presenting a foundational model for organization in terms of employee and
leadership selection, recruitment, and cultivation along with types of policies to
implement to become more employee oriented. The antecedents investigated are
healthy workplace policies (HWP), leadership behaviors (directive and authentic),
and employee exchange ideology (social and economic). performance, intent to
quit, and psychological safety were outcomes investigated resulting from
organizational orientation (employee or production). There was overall support
for the computational model. Findings indicated that employee oriented
organization with authentic leaders, social exchange ideology employees, and
healthy workplace policies will have decreased turnover intentions and increased
psychological safety. These findings also indicate that the employee oriented
organizational model is superior to a more antiquated production oriented model.
Further methodology, procedures, and analysis will be discussed.
Keywords: organizational orientation, healthy workplace policies,
leadership behaviors, exchange ideology, psychological safety

iv
TABLE OF CONTENTS
ABSTRACT ......................................................................................................... III
LIST OF TABLES ............................................................................................... VII
CHAPTER ONE: LITERATURE REVIEW ............................................................ 1
Introduction ................................................................................................ 1
Organizational Orientation ......................................................................... 4
Healthy Workplace Practices ..................................................................... 7
Psychological Safety ................................................................................ 14
Leadership Behaviors .............................................................................. 15
Exchange Ideologies ............................................................................... 18
Summary ................................................................................................. 26
CHAPTER TWO: METHODS ............................................................................. 27
Participants .............................................................................................. 27
Materials .................................................................................................. 28
Leadership Behaviors ................................................................... 28
Exchange Ideology ........................................................................ 28
Employee Perception of Organizational Orientation ...................... 29
Healthy Workplace Policies ........................................................... 30
Psychological Safety ..................................................................... 30
Intent to Quit and Performance ..................................................... 30
Controls ......................................................................................... 31
Procedure ................................................................................................ 31
Data and Analysis .................................................................................... 32

v
CHAPTER THREE: RESULTS ........................................................................... 33
Data Screening ........................................................................................ 33
Analyses Overview .................................................................................. 33
Hypotheses .............................................................................................. 36
Confirmatory Factor Analysis ................................................................... 40
Intent to Quit ................................................................................. 40
Healthy Workplace Practices ........................................................ 40
Organizational Orientation Validity Scale ...................................... 41
Sentiment Analysis .................................................................................. 43
CHAPTER FOUR: DISCUSSION ....................................................................... 45
Practical and Theoretical Implications ..................................................... 49
Practical Implications .................................................................... 49
Theoretical Implications ................................................................ 50
Directions for Future Research ................................................................ 53
Limitations ................................................................................................ 55
Conclusion ............................................................................................... 57
APPENDIX A: AUTHENTIC LEADERSHIP ........................................................ 59
APPENDIX B: DIRECTIVE LEADERSHIP ......................................................... 61
APPENDIX C: SOCIAL EXCHANGE IDEOLOGY .............................................. 63
APPENDIX D: ECONOMIC EXCHANGE IDEOLOGY ....................................... 65
APPENDIX E: EMPLOYEE ORIENTATION ....................................................... 67
APPENDIX F: PRODUCTION ORIENTATION; BOTTOM LINE MENTALITY SCALE ................................................................................................................ 70
APPENDIX G: ORGANIZATIONAL ORIENTATION VALIDITY SCALE ............. 72

vi
APPENDIX H: HEALTHY WORKPLACE POLICIES .......................................... 74
APPENDIX I: PSYCHOLOGICAL SAFETY ........................................................ 76
APPENDIX J: INTENT TO QUIT ........................................................................ 78
APPENDIX K: CONTROLS ................................................................................ 80
APPENDIX L: EMPLOYED MODEL RESULTS ................................................. 87
APPENDIX M: IRB APPROVAL LETTER .......................................................... 93
APPENDIX N: FIGURE 1 ................................................................................... 95
APPENDIX O: FIGURE 2 ................................................................................... 97
REFERENCES ................................................................................................... 99
vii
LIST OF TABLES
Table 1. Descriptive Statistics............................................................................. 34
Table 2. Correlations Matrix................................................................................ 35
Table 3. Confirmatory Factor Analysis ................................................................ 42

1
CHAPTER ONE
LITERATURE REVIEW
Introduction
In a fast-paced global economy, organization must adopt strategies that
the keep them competitive and successful. While many organizations choose to
become production or bottom-line focused to remain competitive, others focus on
employee wellbeing hoping that the investment will produce organizational
benefits. Organization that focus on employees or production tend to have an
organizational culture that is reflected in their policies and practices.
Organization oriented towards a production focus tend to view employees
as organizational tools, disregarding employee wellbeing which leads to a
multitude of negative employee and organizational outcomes such as increased
Intent to quit and a toxic climate (Greenbaum et al., 2012; Mandis 2013; Mawritz
et al. 2017; Mesdaghinia, Rawat, & Nadavulakere, 2019; Sims & Brinkman
2002). However, interest in the efficiency and bottom-line leads to performance
and profit expectations being met at the expense of other employee wellbeing
outcomes (Greenbaum et al, 2012). These organization will be referred to as
Production oriented for the remainder of the thesis.
Organization oriented towards an employee focus tend to implement
practices that promote wellbeing, and thus make employees feel cared about and
intrinsically motivated to perform well for the organization (Baker, Grenberg &
Hemingway 2006; Janz & Prasarnphanich, 2003; Lings & Greenley, 2005; Litwin

2
& Stringer, 1968). These practices are associated with positive outcomes such
as increase job satisfaction, organizational commitment and decreased Intent to
quit (Baker et al., 2006; Berman, Wicks, Kotha & Jones, 1999; Kuvaas, 2008;
Lings & Greenley, 2005; Kuvaas, 2008). These organization will be referred to as
Employee oriented for the remainder of the thesis.
Employees who fit in organization of either orientation likely have views
that align with their organization and the leadership style of their superiors.
According to the Attraction-Selection-Attrition model (ASA) employees who feel
their values, treatment, and perception of work fit in with their organization and
leadership will stay and those who do not will leave (Shnieder, Goldstein &
Smith, 1995). Thus, employees who believe their organization should be focused
on profits and production will likely expect a more direct and transactional
relationship with leadership rather than a close relationship, and also be more
understanding of organizational policies and practices that promote production
over them as the employee. Conversely, those who believe that their
organization should emphasize the wellbeing of their employees will likely enjoy
a closer relationship with leadership and support organizational policies and
practices that promote employee wellbeing.
In addition to ASA, Social information processing theory would help to
explain the alignment between employees, leadership, and the organization.
According to Social information processing theory, people tend to pay attention to
environmental cues regarding appropriate behavior and decision-making

3
processes and develop new attitudes as a result (Salancik & Pfeffer, 1978).
Thus, it is likely that employees and leaders would adapt and cultivate new
attitudes because of policies, practices, and leadership behaviors that create
environment of their organization.
As a result of ASA and social information processing theory, both types of
employees should develop a sense of fit within their organization either because
their views already align or are cultivated over time to align with their leaders and
organization. One sign that employees feel a sense of fit within their organization
is psychological safety, which is the belief that the workplace is safe for
interpersonal risk taking (Edmondson, 1999; Kahn, 1990). Psychological safety
has been positively associated with the organizational outcomes of task
performance, commitment, and satisfaction both in the individual and team level
(Frazier et al., 2017). Organization that care about Psychological safety tend to
also care about other employee related outcomes, while those who do not likely
care more about organizational outcomes related to performance and production.
Taken together, the research question that drove this investigation this study was
what factors lead to organization being perceived as Production or Employee
oriented? Furthermore, what outcomes result from these divergent approaches
that allows both to stay competitive? The following literature review expands on
the ideas and theory just discussed to begin answering the questions posed.

4
Organizational Orientation
Employee orientation refers to treatment of subordinates with a strong
human relations emphasis (Northouse, 2018). Organization and leadership that
are employee oriented take an interest in workers as human beings, value their
individuality, and give special attention to their personal needs (Bowers &
Seashore, 1966). Employee oriented behaviors can be likened to consideration
behaviors, which show concern for employee wellbeing and foster trusting
interpersonal relationships. Employee oriented organization promote an
employee focused climate (Plakoyiannaki, Tzokas, Dimitratos & Saren, 2008).
They will also have value systems that reflect their focus on employees such as:
reward systems, support, focus on employee wellbeing, and safe and healthy
environment (Baker, Grenberg & Hemingway 2006; Janz & Prasarnphanich,
2003; Lings & Greenley, 2005; Litwin & Stringer, 1968). Employee oriented
practices have been associated with decreased stress, enhanced satisfaction,
increased commitment (Baker et al., 2006; Lings & Greenley, 2005), increased
trust, reduced turnover (Berman et al., 1999; Kuvaas, 2008), alignment with
organizational objectives (Ahmed & Rafiq, 1993; Wasmer & Brunner, 1991),
increased cooperation, and knowledge sharing (Janz & Prasarnphanich, 2003).
Additionally, Employee oriented organization that promote knowledge gain and
sharing effectively have a competitive advantage in innovation industries leading
to increased success (Brockman & Morgan, 2003; Calantone & Di Benedetto,
1988).

5
One possible reason as to why employee focused organization can
compete and succeed is that their focus on employee wellbeing increases the
longevity of the organization by retaining employees, especially high talent
employees. Employees that are treated well are likely to stay and be committed
to organizational goals (Grawitch, Gottschalk & Munz, 2006). Thus, a possible
explanation for employee focused organization survival is that they retain high
level talent and mitigate the costs of turnover through promoting employee health
and wellbeing.
Production orientation consists of behaviors that stress the technical and
production aspects of a job in which workers are viewed as a means for getting
work accomplished (Bowers & Seashore, 1966). Production orientation parallels
initiating structure behaviors that define roles and clarify tasks. Similarly, those
with a Production orientation tend to have a Bottom-line mentality (BLM) which is
single-minded focus on bottom line outcomes at the expense of other outcomes
(Greenbaum et al., 2012).
Research on BLM has been limited (Mesdaghinia et al., 2019), but current
research suggests that the approach is a “mixed blessing” (Babalola et al, 2017).
BLM has been shown to invigorate performance because employees become
mentally preoccupied with work as a result of the environment that a Bottom-line
mentality creates (Little et al., 2011; Neustadt et al., 2011; Vohs, 2015). More
specifically, BLM leads employees to evaluate their actions in a more
transactional cost benefit analysis that will serve their own immediate concerns

6
tied directly to the bottom-line of their organization (Baker & Jimerson, 1992;
Gasiorowska et al., 2016; Kouchaki et al., 2013; Pfeffer & DeVoe, 2009;
Tenbrunsel & Messick, 1999; Vohs et al., 2008). Overall, BLM has been tied to
enhanced performance outcomes and customer civility, which helps to retain
customers and meet production standards in organization (Babalola et al, 2017).
On the other hand, BLM has been associated with various negative
organizational outcomes such as unethical toxic climates that includes
subordinate deviant behaviors and supervisor abuse (Greenbaum et al., 2012;
Mandis, 2013; Mawritz et al., 2017; Sims & Brinkman, 2002). These toxic
climates and unethical behaviors are a result of the employee being more likely
to engage in behaviors that satisfy bottom line demands that they feel are
promoted by their leader (Babalola et al, 2017). Furthermore, leaders high in
BLM have less regard for measures beyond financial incentives and thus care
less for the longevity of their organization (Raven et al., 1998; Yukl & Falbe,
1991) and employees who serve under high BLM leaders are more likely to feel
compelled to engage in their leader’s unethical behavior as well as have higher
turnover intent (Mesdaghinia et al., 2019).
A possible explanation that Production oriented organization are
competitive is their ability to produce high volumes of short-term profit by
maximizing the efficiency of their systems and employees in various ways. For
example, creating cheap labor jobs that need little to no training allows employee
turnover costs to be minimal. Thus, possible factors leading to the success of

7
Production oriented organization could be the maximization of efficiency of
employees while reducing the cost of turnover. Regardless, many organization
would likely benefit from implementing policies and practices that promote a
healthy and positive workplace, whereby doing so has been shown to relate to a
multitude of positive employee related outcomes like reduced stress, turnover,
and satisfaction (Grawitch et al., 2006).
Healthy Workplace Practices
Production and Employee oriented organization tend to implement
systems, policies, procedures, and practices that reflect what is important to
them. While Production oriented organization tend to implement systems that
treat employees like efficient tools, Employee oriented organization implement
systems that have the health and wellbeing of the employee in mind. Hence, the
more Healthy workplace practices (HWP) an organization utilizes, the more
Employee oriented they likely are.
A healthy workplace is any organization that “maximizes the integration of
worker goals for well-being and company objectives for profitability and
productivity” (Sauter, Lim & Murphy, 1996). There are four guiding principles of
organizational health that Employee oriented organization strive to achieve and
maintain. First, health exists on a continuum from mortality to vibrant wellbeing.
Second, organizational health is a continuous process, not an obtainable state.
Third, organizational health is the result of interconnections between multiple
factors. Fourth, organizational health is reliant on fulfilling relationships. There

8
are currently five healthy workplace dimensions in the known literature: work-life
balance, employee growth and development, health and safety, recognition, and
employee involvement (Grawitch et al., 2006).
Work-life balance can be defined as the individual perception that work
and nonwork activities are compatible and promote growth in accordance with an
individual’s current life priorities (Kalliath & Brough, 2008). Current literature on
work and family focuses on the work-family conflict produced between roles as
an employee and familial figure (spouse/parent), gender roles, the division of
household labor, pay, work-family stress and health, and work-family policy
(Bianchi & Milkie, 2010). Research has indicated that conflict between work and
family diminishes employee perceptions in the quality of both their work and life,
which in turn negatively affects productivity, absenteeism, turnover, and more
(Higgins, Duxbury & Irving, 1992). Establishing work-life balance programs helps
individuals balance the multiple demands of the various aspects of their lives
(Jamison & O’Mara, 1991). Examples of work-life balance programs include
flexible scheduling, childcare, eldercare, and provision of job security (Grawitch
et al, 2006). Organization that promote work-life balance make employees feel
valued and cared for by the organization because the organization is
accommodating their personal needs. Thus, organization that promote these
work-life balance practices and policies are more likely to have employees that
view their organization as Employee oriented. Work-life balance practices
conducted by organization are associated with positive outcomes for employees

9
that include job satisfaction, organizational commitment, and employee morale
(Grawitch et al., 2006). For organization, work-life balance is associated with
increased productivity, decreased absenteeism, and decreased turnover
(Grawitch et al., 2006). In contrast, organization that are Production oriented are
less likely to take employees into account when making decisions and more likely
to increase work-life conflict (WFC), which is associated with increased emotional
exhaustion and by extension lower employee engagement and performance
ratings (Wayne, Lemmon, Hoobler, Cheung & Wilson, 2017). A classic example
of WFC would be an organization ramping up production to meet new goals and
making employees feel they need to stay longer hours to meet these new goals
and deadlines. Authentic and Supportive leaders have been associated with
consideration behaviors such as flexible work schedules that help employees
manage their work and home loads more effectively (Eagly, Johannesen-Schmidt
& Van Engen, 2003; Lowe, Kroeck & Sivasubramaniam, 1996; Northouse, 2018;
Walumbwa et al., 2008).
Employee growth and development refers to the opportunity of employees
to gain skills and experience, which motivates them and leads to positive
outcomes such as job satisfaction (Pfeffer,1994). Organization that promote
employee growth and development are likely to be perceived as Employee
oriented because they active steps they take to ensure employee wellbeing. This
is exemplified through positive employee benefits these practices are associated
with: increased job satisfaction, motivation, and decreased stress (Grawitch et

10
al., 2006). It is also associated with positive organizational benefits such as
organizational effectiveness, work quality, and grants a competitive advantage
(Grawitch et al., 2006). Production oriented organization may also promote
employee growth and development, but likely for the organizational benefits
instead of employee benefits. Regarding leadership, Transformational and
Authentic leaders are likely to take an active role in the growth and development
of their employees (Eagly et al., 2003; Lowe et al., 1996; Walumbia at al., 2008).
Organization that proactively promote health and safety are Employee
oriented due to the association with employee wellbeing outcomes such as
decreased stress and physical health risks, and increased organizational
commitment (Grawitch et al., 2006). Organizational benefits include decrease in
health care costs, absenteeism, and accident injury rates. Production oriented
organization are more likely to take a reactive-avoid approach with health and
safety by creating safety policies and procedures only when it begins to hurt the
bottom-line or when there are government regulations. Regarding leadership,
leaders that motivate through empowerment and autonomy are more likely to
proactively promote health and safety initiatives amongst employees (Northouse,
2018).
Recognition is another important predictor of outcomes such as
organizational effectiveness, job satisfaction, and stress (Brown, 2000). For
employees, recognition is associated with increased job satisfaction and
motivation along with decreased job stress. For organization, recognition

11
increases hiring selectivity, productivity, and decreased turnover (Grawitch et al.,
2006). Organization that recognize their employee’s contributions and
achievements are more likely to be perceived as Employee oriented because
they take the time and resources to acknowledge their employees. This in turn
increases employee wellbeing through increased job satisfaction and reduced
stress. Production oriented organization are likely to not have little to no
employee recognition practices in place. Organization that employ Authentic
leaders are more likely to make efforts to have the organization recognize the
employee, as these leaders are known for fostering close relationships with their
employees and doing what they can to motivate their employees to work (Eagly
at al., 2003; Lowe et al., 1996; Walumbia at al., 2008).
Employee involvement is associated with employee well-being variables,
such as increased job satisfaction and employee morale, as well as
organizational improvement variables, such as decreases in both turnover and
absenteeism along with increases in work quality (e.g., Lawler, 1991;
Vandenberg, Richardson, & Eastman, 1999). Organization that involve their
employees in important decision-making processes make employees feel valued
by their organization and more likely to be perceived as Employee oriented as a
result. Production oriented organization care little about employee opinion that is
not directly tied to the bottom line. Leadership that is transformational, authentic
and participative often involve employees in important decision-making

12
processes (Eagly at al., 2003; Lowe et al., 1996; Northouse, 2018; Walumbia at
al., 2008).
Organization that employ healthy workplace practices and policies care
about employee wellbeing outcomes in addition to organizational outcomes
which is indicative of employee oriented organization. Thus, we expected
organization that employ Healthy workplace policies to be perceived as
Employee oriented. Furthermore, organization that lack Healthy workplace
policies while prioritizing production and the bottom line seem to care little about
employee wellbeing, which is indicative of Production oriented organization.
Thus, we expected organization that lack Healthy workplace policies to be
perceived as Production oriented organization.
Hypothesis 1: Healthy workplace policies would predict organizational
orientation perception.
Hypothesis 1a: Healthy workplace policies would positively predict
employee orientation perception. Organization with more HWP would be
perceived as more Employee oriented.
Hypothesis 1b: Healthy workplace policies would negatively predict
production orientation perception. Organization low in HWP would be
perceived as more Production oriented.

13
Research has shown that production oriented organization adopt bottom-
line mentalities that treat workers as expendable tools (Greenbaum et al., 2012),
which tends to lead to high performance outcomes (Babalola et al, 2017). This
treatment results in high turnover for organization that treat their workers as
expendable (Greenbaum et al., 2012). Intent to quit (turnover intent) has been
shown to strongly associated with turnover (Li, Lee, Mitchell, Horn & Griffeth,
2016) and thus it is likely Production oriented organization will have employees
with high Intent to quit which will result in high turnover. This high turnover is
likely to result in low institutional memory since few employees stay to pass down
organizational knowledge. In contrast, organization that are Employee oriented
and utilize HWP will have low Intent to quit given the negative relationship
between HWP and turnover (Grawitch et al., 2006). Thus, they are more likely to
retain talented employees and maintain long standing institutional memory as a
result.
Given previous research and the discussion above on Production oriented
organization with bottom line mentalities, and how Employee oriented
organization tend to utilize healthy workplace practices and policies, we expected
the following:
Hypothesis 2: Organizational orientation (production oriented) would
positively predict performance and negatively predict Intent to quit.

14
Hypothesis 2a: Job performance would be higher in Production oriented
organization.
Hypothesis 2b: Intent to quit would be higher in Production oriented
organization.
Psychological Safety
Organization that utilize HWP promote employee wellbeing outcomes
(decreased stress, turnover etc.). Psychological safety is one employee outcome
highly associated with employee wellbeing but has yet to be researched in
relation to HWP. Psychological safety is the belief that the workplace is safe for
interpersonal risk taking (Edmondson, 1999; Kahn, 1990). Research on
Psychological safety has revealed that it allows employees to feel safe at work
which helps employees to grow, learn, contribute and perform effectively
(Edmondson & Lei, 2014). Psychological safety has been found to be
significantly related to employee engagement, task performance, satisfaction,
commitment, sharing & learning behaviors that give organization a competitive
advantage (Frazier, Fainshmidt, Klinger, Pezeshkan, & Vracheva, 2017).
Interpersonal relationships, group dynamics, leadership, and organizational
norms are four antecedents to Psychological safety. Positive relationships with
leaders that consist of support, resilience, consistency, and trust are positively
related to Psychological safety, whereby it was found that transformational and
inclusive leadership had a moderate association (Frazier et al., 2017).

15
Furthermore, social exchange variables such as organizational support
(Tuker,2007) and trust in the organization (Carmeli & Zisu, 2009) is positively
related to Psychological safety, and thus Psychological safety is related to a
supportive work context (Frazier et al., 2017).
Organization that are Employee oriented are more likely to promote HWP
and organization that are Production oriented do not promote HWP. Furthermore,
HWP is part of a supportive work context that Psychological safety has been
shown to be positively associated with. Given the above, we expected the
following:
Hypothesis 3: Employee perception of the Organizational orientation
(production or employee focused) would predict Psychological safety.
Hypothesis 3a: Organizational orientation (employee focused) would
positively predict Psychological safety. Employee oriented organization
would be higher in Psychological safety.
Hypothesis 3b: Organizational orientation (production focused) would
negatively predict Psychological safety. Respondents in Production
oriented organization would report lower Psychological safety.
Leadership Behaviors
The interactions between employees and leaders greatly contributes to
how employees perceive their work, organization, and subsequently the

16
outcomes associated with those perceptions. Two prominent behavioral styles
that many often encounter are Directive and Authentic leadership.
Directive leaders’ direct employees without regard to their input and tend
to assign employees their roles and performance objectives (Pearce & Sims,
2002). They rely on their positional or legitimate power (French and Raven,
1959) to influence and motivate employees. They tend to lack trust in their
employees and assume employees lack motivation and drive to achieve goals
that benefit the organization (McGregor, 1960). Authentic leaders are highly self-
aware leaders that foster positive self-development (Jensen & Luthans, 2006),
promote positive organizational contexts (Illies, Mereson & Nargang, 2005), and
relational transparency (Walumbia et al., 2008).
Organizational Embodiment theory states that employees tend to view their
treatment by their direct leader as treatment from their organization (Eisenberger,
2014). Thus, we expected Authentic and Directive leadership to have an impact
on employee perceptions of their organization. Due to the need to examine this
relationship in our proposed model, we propose the following:
Proposition 1: Leader behaviors would be related to employee perceptions
of organization orientation (employee or production focused).
It seemed likely that Authentic leadership would positively relate to Employee
orientation since Authentic leaders encourage autonomy, empowerment,

17
transparency, and close relationships with employees that foster positive
organizational contexts. However, there was research to support the claim that
the relationship is negative. A possible reason for Authentic leadership having a
negative relationship with Employee orientation perception is that perhaps these
leaders may authentically be transactional, and thus care more about the work
than the actual employees themselves. It may have been the case then, that
employees with this kind of authentic leader will perceive their organization as
Production oriented since research has shown that employees often conflate
leadership support for organizational support (Eisenberger, 2014).
Past research serves as the basis to propose a relationship between
Authentic leadership behaviors and Employee Organizational orientation, and
given the plausibility of arguments above, we had reason to expect that Authentic
leadership would relate to perceptions of the organization as being Employee
oriented. Due to the need to examine this relationship in our proposed model, we
proposed the following:
Proposition 1a: Authentic leadership would be related to employee
perceptions of organization orientation (Employee or Production focused).
Similarly, although we expected Directive leadership to be positively
related to Production orientation since Directive leaders treat employees more
like tools without regard for their input or wellbeing, there was also reason to

18
support the claim that the relationship is negative. A possible reason for Directive
leadership having a negative relationship with production orientation perception
is that perhaps subordinates would try to please and meet their directive
supervisors. It could be possible that employees focus much on the transactional
facets (rewards) of Directive leadership to the point where meeting the
expectations of the Directive Leader will include them in that leaders in group,
and the type of relationship formed with them in the ingroup may make the
employee more inclined to perceive their organization as Employee oriented.
Again, past research served as the basis to propose a relationship
between directive leadership behaviors and production organizational orientation,
and given the plausibility of arguments above, we had reason to expect that
directive leadership would relate to perceptions of the organization as being
production oriented. Due to the need to examine this relationship in our proposed
model, we proposed the following:
Proposition 1b: Directive leadership would be related to employee
perceptions of organization orientation (employee or production focused).
Exchange Ideologies
Exchange ideologies are the “strength of an employee’s belief that work
effort should depend on treatment by the organization” (Eisenberger et al., 1986).
In essence, exchange ideology is how the employee expects to be treated at
work, which likely has a salient effect on employee perception. There are

19
currently two exchange ideologies in the literature, economic and social
exchange.
Economic exchanges are based on quid pro quo relationships and low
levels of trust. More specifically, economic exchanges are short-term (Song,
Tsui, & Law, 2009), and based on well-defined obligations, with an emphasis on
equivalence, whereby each party must repay an obligation in a quid pro quo
manner in a relatively short period of time (Song et al., 2009). Low levels of trust
and low relationship investment (Shore, Tetrick, Lynch, & Barksdale, 2006;
Shore, Bommer, Rao, & Seo, 2009) have been associated with a narrowing of
job roles to encompass only required performance (Kamdar & Van Dyne, 2007).
Social exchanges feature a socio-emotional emphasis involving a high
level of trust between employees and the organization (Shore et al. 2006; Song
et al., 2009). As the quality of the relationship increases, employees tend to focus
on the mutual interest of the organization and themselves (Uhl-Bien and Maslyn,
2003). Thus, social exchanges are characterized as long-term relationships that
have lasting duration and increased investment where the employee expects the
exchanges and interactions to continue for an extended period of as time
(Chiaburu, Diaz, & Pitts, 2011).
Based on ASA theory, we expected that Leadership behaviors will cause
employees to either be attracted and retained by organization whose leadership
style aligns with their exchange ideology, or leave should it not. For example,
employees who prefer being directed by supervisors with transactional

20
reward/punishment systems are likely to be attracted to organization that have
supervisors that do so. Additionally, based on social information processing
theory, we also expected leader behaviors to provide environmental cues for
appropriate behaviors that will eventually alter employee exchange ideology. For
example, employees might pay attention to the reward systems their leader has
in place and, as a result, change their behavior and attitudes about their
relationship with their supervisor and/or organization.
Combining the two theories, we expected employees to be attracted to
organization that already have leadership that aligns with their exchange
ideology or develop an alternate exchange ideology because of their leaders’
behavioral cues (e.g., reward systems). Thus, we expected leadership behaviors
to predict employee exchange ideology. Specifically, we expected authentic
leaders to have employees who have a social exchange ideology since authentic
leaders build trusting relationships with their employees (Jensen & Luthans,
2006; Walumbia et al., 2008), which is what employees with Social exchange
ideologies prefer and expect (Shore et al. 2006; Song et al., 2009).
Hypothesis 4: Leader behaviors will predict Exchange ideology.
Hypothesis 4a: There will be a positive linear relationship between
authentic leadership and social exchange ideology. Authentic leadership
will predict higher employee social exchange ideology.

21
Furthermore, we expected Directive leaders to have employees who have
Economic exchange ideologies since Directive leaders are more transactional in
their approach and exhibit low levels of trust (Pearce & Sims, 2002) which is
exemplary of what employees with Economic exchanges prefer and expect
(Kamdar & Van Dyne, 2007; Shore et al., 2006; Shore et al, 2009; Song et al.,
2009).
Hypothesis 4b: There will be a positive linear relationship between
Directive leadership and Economic exchange ideology. Directive
leadership will predict higher employee Economic exchange ideology.
Social information processing theory and ASA may also explain a potential
relationship between HWP and the Exchange ideology of employees. According
to Social information processing theory individuals are likely to change their
attitudes based on environmental cues (Salancik & Pfeffer, 1978). Drawing from
ASA theory, individuals are attracted to organization that are similar to them and
select out of organization they do not align with (Schneider et al., 1995). In the
context of an organization, policies are an environmental cue. Specifically,
Healthy workplace policies are cues that an employee will examine and use to
determine their attraction and compatibility with an organization (ASA) and may
eventually change their attitudes towards work as a result of these types of
policies either being in place or being absent (Social information processing

22
theory). For example, an organization with a policy that promotes developmental
mentorship might transition the attitudes of employees who once thought that the
relationship between employee and supervisor was supposed to be transactional
(Economic exchange ideology) into having attitudes that relationships between
employee and supervisor should be strong, trusting, and developmental (Social
exchange ideology).
As research indicates that Exchange ideology is malleable (Chiaburu,
Diaz, & Pitts, 2011), and given the above two theories paired along with the
characteristics of Social exchange ideology, we expected that organization that
employ Healthy workplace policies will have more employees with Social
exchange ideologies, either because they will be attracted to and remain with the
organization (ASA) or their attitudes will be change based on the policies set in
place (Social information processing theory).
Hypothesis 5: Healthy workplace policies will predict Employee Exchange
ideology.
Hypothesis 5a: Healthy workplace policies will have a positive linear
relationship with employee Social exchange ideology. We expected
organization with high HWP will have employees with higher Social
exchange ideology.

23
Additionally, we expected that organization that lack HWP will have
employees with strong Economic exchange ideology because they are more
likely to be accepting of the lack of HWP and thus choose not to leave the
organization (ASA), or change their attitudes based on the environment created
by the lack of HWP (Social information processing theory).
Hypothesis 5b: Healthy workplace policies will have a negative linear
relationship with employee Economic exchange ideology. We expected
organization with low HWP will have employees who report higher
Economic exchange ideology.
Since we expected employees with a Social exchange ideology to
predominantly reside in organization high in HWP and relate these practices to
organization that are Employee oriented, we then expected employees with a
Social exchange ideology to be related to Employee orientation Perception.
Although we expected employees with a Social exchange ideology to also
perceive their organization as Employee oriented (positive relationship) based on
the case just made, it may be the case that the relationship is negative. A
possible reason for Social exchange ideology having a negative relationship with
Employee orientation perception, and thus a stronger positive relationship with
production orientation, is that perhaps those with Social exchange ideologies
build a normative commitment to work in which they feel obligated to meet the

24
expectations of a Production oriented organization. For example, an employee
with a Social exchange ideology may feel obligated to meet the demanding
production and performance expectations set to them. Thus, it could be possible
that those with Social exchange ideologies may still perceive their organization
as Production oriented given this type of relationship.
Additionally, since we expected employees with an Economic exchange
ideology to reside in organization with a lack of HWP, which we posit equates an
organization to being Production oriented, we then expected employees with
stronger Economic exchange ideologies will be related to Production orientation
perception. Although we expected employees with stronger Economic exchange
ideologies will be more likely to perceive their organization as Production
oriented (positive relationship), it may be the case that the relationship is
negative. A possible reason for Economic exchange ideology having a negative
relationship with Production orientation perception (and thus a stronger
relationship with Employee orientation) is the possibility of a relationship
developing from high quality LMX relationships in high quality teams. Over time,
it may be likely that economic and transactional relationships foster team efficacy
and trust, whereby higher performers develop high quality LMX relationships with
their supervisors and become part of the ingroup. This type of employee-leader
relationship may start off and even continue to be economic and transactional in
nature, but over time the interpersonal relationships flourish as work becomes
easier and more mechanically transactional, whereby this high quality LMX

25
relationship may be reflected in the organization being perceived as Employee
oriented given the theory of organizational embodiment (Eisenberger, 2014).
Based on the research and theoretical work that has been laid out, we had
reason to expect a relationship between Exchange ideology and Organizational
orientation (employee or production). Due to the need to examine this
relationship in our proposed model, we propose the following.
Proposition 2: Exchange ideology will be related to employee perceptions
of organization orientation (employee or production focused).
Proposition 2a: Social exchange ideology will be related to employee
perceptions of organization orientation (employee or production focused).
Past research serves as the basis to propose a relationship between
Social exchange ideology behaviors and Employee Organizational orientation,
and given the plausibility of arguments above, we had reason to expect that
Social exchange ideology would be related to perceptions of the organization as
being Employee oriented. As mentioned, we conclude based on past research
that relationship is possible. And given the discussion above, we lean towards a
directional prediction.
Proposition 2b: Economic exchange ideology will be related to employee
perceptions of organization orientation (Employee or Production focused).

26
Past research serves as the basis to propose a relationship between
Economic exchange ideology and Production Organizational orientation, and
given the plausibility of arguments above, we had reason to expected that
Economic exchange ideology will relate to perceptions of the organization as
being Production oriented. As mentioned, we conclude based on past research
that relationship is possible. And given the discussion above, we lean towards a
directional prediction.
Summary
In summary, we expected HWP to be predictive of employee’s perception
of their organization being either employee orientated (high HWP) or production
oriented (low HWP). Furthermore, based on ASA and social information
processing theories we expected both organizational policies and leaders to
attract and/or cultivate their employees exchange ideologies, with high HWP
organization with authentic leaders attracting/cultivating social exchange
ideologies while low HWP organization with directive leaders attracting/cultivating
economic exchange ideologies. Lastly, we expected employees who reported
their organization to be Employee oriented to have higher overall psychological
safety and less Intent to quit than those who report their organization to be more
production oriented, while production oriented Organization are expected to have
higher performance. For the full proposed model, see figure 1.

27
CHAPTER TWO
METHODS
Participants
There were a total of N = 320 valid participants in the sample with a total
of N = 401 participants recruited for the study, drawn from both SONA University
students, LinkedIn, and word of mouth. Both employed (N = 248) and
unemployed (N = 134) participants were surveyed to be able to analyze the
samples separately to account for any impact layoffs may have had during the
pandemic. Intent to quit items were different between employed and unemployed
participants, whereby unemployed participants were asked to think about their
intent to quit retrospectively. Unemployed participants must have been employed
at least once, where 20% stated they were unemployed for at least a year or
more and only 5% of unemployed participants indicating it was due to layoffs.
Employed participants indicated they had been with their current organization for
1-5 years (30.4%), less than a year (18.2%), 5-10 years 7.5%, 10+ years (5.5%).
Both employed and unemployed participants indicated that their job level is/was
entry level (47.6%), mid-level (33.2%), senior level (11%), and executive level
(2.7%). Participant ethnicities were as follows: White 40.4%, Hispanic/Latino
41.9%, Black or African American 5.5%, Native American 1%, Asian/Pacific
Islander 3.2%, Other 3.2%, Unidentified 4.7%. There were N = 77 (19.2%) Males
and N = 305 Females (76.1%) who participated in this study. Over 93% of

28
participants graduated high school or more. Most participants stated they had
enough to get by or more growing up (78%). Participants were at least 18 years
or older. Participation was completely voluntary.
Materials
Leadership Behaviors
Items for Authentic leadership were drawn from the 8-item sample ALQ on
a 5-point Likert scale ranging from strongly disagree = 1 to strongly agree = 5,
(Walmbwa, Aviolo, Gardner, Wernsing & Peterson, 2008). Appendix A.
Items for Directive leadership were drawn from the four-item scale of
Hwang et al. (2015). Sample items are as follows: “Conveys clear expectations
for assignment,” and “Clarifies roles and responsibilities with team members.”
The items were measured using a 5-point Likert scale ranging from “strongly
disagree” to “strongly agree,”. Appendix B.
Exchange Ideology
Although the full 17 item scale was utilized to measure Social and
Exchange ideologies of employees, only the ones with the highest factor loadings
were used as developed and used by Shore et al. (2006). For social exchange (a
= .82) was measured with four items with an example item being “I don’t mind
working hard today – I know I will be eventually rewarded by the organization.”
Appendix C.

29
Three items were used to assess Economic exchanges, an example item
being “my relationship with the organization is strictly economic one – I work and
they pay me.” Appendix D.
Employee Perception of Organizational Orientation
Items from Janz and Prasarnphanich (2003) were utilized to measure
Employee orientation. The scale was originally designed to reflect the managers’
values and beliefs about rewards and about providing a warm and supportive
environment. These were modified to reflect the organization rather than the
leader. All 10 items were measured but only items 1, 2, and 4 will be analyzed
from the “Organizational Climate: Warmth” scale and only items 1, 2, 4, and 5
were analyzed for the “Organizational Climate: Support” scale. The scale was a
7-point Likert scale (strongly agree = 7; strongly disagree = 1). Appendix E.
Items for production orientation were drawn from Greenbaum et al.’s
(2012) 4-item BLM scale (a= .86) since production oriented organization have
bottom line mentalities. The items were modified to reflect respondent’s opinions
of their organization rather than their supervisor’s opinion of themselves, and was
measured on a 7-point Likert scale (strongly agree = 7; strongly disagree = 1).
Appendix F.
A five-item measure was created to assess the validity of the
Organizational Support, Warmth, and Bottom-line mentality Scales. The measure
asks participants to rate the extent to which they agree from 0 (Strongly

30
Disagree) to 100 (Strongly Agree). An example item being “My organization is
employee focused.” Appendix G.
Healthy Workplace Policies
Since no current HWP scale exists to the knowledge of this researcher, a
measurement was created which asked participants to indicate their level of
agreement that their organization utilizes HWP on each of the 5 dimensions
(Work/life balance, employee growth and development, employee involvement,
employee recognition, and employee health and safety) on a 100-point sliding
bar where 0 = Strongly Disagree and 100 = Strongly Agree. Additionally,
participants were asked to list the HWP their organization has in place which
provided qualitative examples of each dimension to be used in further studies.
Appendix H.
Psychological Safety
A 6- item Psychological safety scale from Edmonson (1999) was adapted
in reference to the organization to measure Psychological safety. The items were
measured on a 5-point Likert scale (e.g., “If you make a mistake on this team, it
is often held against you; reverse-coded item). Appendix I.
Intent to Quit and Performance
Intent to quit and Performance measurements was measured on a 5- point
Likert scale (strongly agree = 5; strongly disagree = 1) to ask about job
performance and job Intent to quit. For unemployed participants, items were

31
modified to past tense. A CFA analysis was conducted to examine the reliability
of the items. Appendix J.
Controls
The Servant Leadership scale drawn from Barbuto and Wheeler (2006)
was modified by replacing “this person” with “my supervisor,” and used as a
control variable when measuring the authenticity of a leader. Positive and
negative affectivity was measured to account for possible factors that may affect
employee perception of their leader and Organizational orientation (Watson,
Clark, & Tellegen, 1988). LMX was also measured as a possible factor that
explains employee perception of Organizational orientation, whereby the 7-item
recommended scale was utilized (Graen & Uhl-Bien, 1995). Lastly, some items
about COVID 19 were drafted to help account for some of the effects the
pandemic may have had on employee perceptions about their organization’s
orientation. Items about the pandemic included a question asking participants
about their perception of their organization’s orientation given their organization’s
response to the pandemic and an open text response asking them to explain
their choice in order to assess how much the pandemic may have impacted
perceptions of organizational orientation. Appendix K.
Procedure
The survey that was created on Qualtrics was distributed on SONA at
CSUSB, social media, and MTURK. Data was downloaded from Qualtrics and
cleaned on SPSS. Descriptives, T-tests for Employed and Unemployed

32
Participants, Cronbach’s alpha reliabilities, and CFA Analysis were all conducted
on SPSS v.26. Separate Intent to quit items for employed and unemployed
participants were collected to address each participant’s turnover intent more
accurately, whereby skip logic was used in Qualtrics so that participants would
see the items relevant to their employment status. Data from both sets of
participants was then combined into aggregate intent to quit data, which was
used in the path-way analysis of our model. Additionally, data from the employed
and unemployed samples was analyzed separately to denote possible skewness
of the model. Lisrel was used to run the path-way analysis of the final model.
Data and Analysis
Lisrel was utilized to conduct a SEM path analysis of the hypothesized
model. When measuring propositions 1 and 2, zero order correlations were
examined and followed by 2 tailed regressions to determine a predictive
relationship between leadership behaviors and employee perception of
organizational orientation (proposition 1) and exchange ideology and employee
perception of organizational orientation (proposition 2). Data from the employed
and unemployed samples was analyzed separately to denote possible skewness
effects on the model. Furthermore, CFA analysis for the developed HWP, Intent
to quit, and the five-item Organizational orientation scale were conducted for the
purposes of formative scale validation and convergent validity purposes.

33
CHAPTER THREE
RESULTS
Data Screening
To address possible control for skewness and outliers when addressing
assumptions of normality, scores were standardized to normalize each variable.
Additionally, path-way analysis was utilized to address assumptions of
multicollinearity and independence.
Analyses Overview
Descriptive statistics run for each variable included means, standard
deviations, and skewness, as shown in table 1. Zero Order correlations were
conducted between all variables to gage the relationship between variables and
help to establish convergent validity of some scales, see table 2. Cronbach’s
alpha item correlations were utilized to establish scale reliabilities, whereby all
scales were found to be reliable at p < .05 and the α > .70 criteria except for the
performance scale, see table 2. Confirmatory factor analyses were conducted on
the healthy workplace practice, intent to quit aggregate, and organizational
orientation scales to establish scale validities, see table 4. Sentiment analysis
was conducted on HWP and COVID 19 responses to receive qualitative support
for HWP quantitative outcomes, and gain understanding of the potential impact
the pandemic may have had on the study. Several Path-Way Analyses were
conducted in Lisrel to investigate proposed hypotheses. The model with only

34
LMX as a control was found to be the best fit as there was a lack of variable
suppression in this model and models with more controls lacked substantive
differences for results.
Table 1. Descriptive Statistics
Variable Mean SD Skewness Std. Error Z Skew Z Std Error
HWP 61.24 26.90 -0.44 0.13 -0.44 0.13
Employee Orientation 4.47 1.06 -0.39 0.14 -0.03 0.14
Production Orientation 4.06 1.57 -0.03 0.14 -0.39 0.14
Psych Safety 3.33 0.90 -0.21 0.14 -0.03 0.14
Employed Intent Quit 2.85 1.35 0.08 0.16 -0.21 0.14
Unemployed Intent Quit 3.13 1.29 -0.27 0.25 0.08 0.16
Intent to Quit Aggregate 2.93 1.34 -0.03 0.14 -0.27 0.25
Performance 3.82 0.84 -0.11 0.14 -0.11 0.14
Economic Exchange 2.93 1.03 0.07 0.14 0.07 0.14
Social Exchange 3.34 1.03 -0.47 0.14 -0.47 0.14
Directive Leadership 3.92 1.00 -0.97 0.14 -0.97 0.14
Authentic Leadership 3.51 0.94 -0.33 0.14 -0.33 0.14
LMX 3.28 0.98 -0.25 0.14 -0.25 0.14
Note: This table display’s the Means, Standard Deviations (SD), Skewness, and SE , Z Skewness and Z SE for each variable.

35
Table 2. Correlations Matrix
1 2 3 4 5 6 7 8 9 10 11
HWP 0.9*
Organizational Orientation
.705** 0.72*
Employee Orientation
.642** .784** 0.75*
Production Orientation
-.414** -.696** .646** 0.88*
Psych Safety .583** .758** .752** .672** 0.81*
Intent to Quit Aggregate
-.414** -.561** .485** .501** .515** 0.84*
Performance 0.092 0.036 0.054 -0.024 .114* -0.034 0.61*
Economic Exchange
-.376** -.569** .470** .585** .535** .557** -0.009 0.71*
Social Exchange .546** .700** .740** .507** .650** -.481** 0.034 -.454** 0.88*
Directive Leadership
.482** .537** .594** .394** .572** -.366** 0.095 -.272** .592** 0.94*
Authentic Leadership
.581** .648** .702** .506** .654** -.443** 0.056 -.335** .656** .701** 0.92*
Note: This table represents the zero order correlations between variables, where the ** indicates significance at p < .01. The diagonals represent Cronbach’s alpha reliabilities of each scale, where* denotes significance at the p < .05 level and the α > .70 criteria.

36
Hypotheses
SEM path analysis with maximum liklihood estimation procedures were
used to investigate the relationship between the likely antecedents
(authentic/directive leadership, exchange ideology, and healthy workplace
practices) and outcomes (performance, intent to quit, and psychological safety)
of employee and production oriented organization. The computational model had
more adequate fit compared to the Independence model, and thus was used in
the reporting of this analysis, χ2 (2) = 84.26, p < .05; Independence χ2 (55) =
2109.75, p > .05, RMSEA = .36, NFI = .96, CFI = .96, RMR = .04, Standardized
RMR = .04. There was a total of N = 320 participants when using complete
cases. SPSS v. 27 and Liseral were used to run the analysis. See figure 2 for the
full computational model. For results with employed participants only, see
appendix L.
Hypothesis 1 was partially supported. Healthy workplace practices
significantly predicted organizational orientation perception. As predicted, there
was a significant positive direct relationship between HWP and employee
oriented organization (H1A); (β= .21, SE=.07, Wald Z= 4.98, p < .05). However,
there was a non-significant relationship between HWP and production oriented
organization (H1B; (β = -.016, SE=.06, Wald Z= -.29, p > .05). Thus, H1A was
supported while H2B was not supported. However, HWP had a significant total
effect and indirect effect on Employee oriented organization (H1A); (Total β =
.64, SE=.04, Wald Z= 15.27, p < .05; Indirect β = .42, SE=.04, Wald Z= 10.62, p

37
< .05) and Production oriented Organization (Total β = -.41, SE=.05, Wald Z= -
8.14, p < .05; Indirect β = -.40, SE=.05, Wald Z= -8.22, p < .05) which indicates
signs of mediation through LMX.
Hypothesis 2 was partially supported. Production orientation did not
significantly predict performance (H2A); (β = .013, SE=.08, Wald Z= .16, p > .05)
but did significantly predict intent to quit (H2B), (β = .13, SE=.06, Wald Z= 2.07, p
< .05). Furthermore, Employee orientation did not significantly predict
performance (H2A); (β = -.003, SE=.11, Wald Z= -.03, p > .05) nor did it
significantly predict intent to quit (H2B), (β = .02, SE=.06, Wald Z= .201, p > .05).
Thus, H2A was not supported since neither Production or Employee oriented
organization had a significant relationship to performance, while H2B was
supported since as predicted Production oriented Organization had a significantly
higher positive relationship to Intent to quit than Employee oriented Organization.
Hypothesis 3 was supported. Organizational orientation significantly
predicted psychological safety whereby there was a significant positive direct
relationship between Employee orientation and Psychological safety (H3A); (β =
.27, SE=.06, Wald Z= 4.49, p < .05). There was also a significant negative direct
relationship between production orientation and psychological safety (H3B), (β =
-.24, SE=.05, Wald Z= -.517, p < .05). Thus hypothesis 3 was supported.
Proposition 1 was supported. Leader Behaviors were significantly related
to employee perceptions of Organizational orientation. Specifically, (P1A) there
was a significant positive relationship between authentic leadership and

38
employee orientation (Zero Order R = .70, p < .05) and a significant negative
relationship with production orientation (Zero Order R = -.50, p < .05).
Additionally, directive leadership had a significant positive relationship with
employee orientation (P1B), (Zero Order R = .59, p < .05) and a significant
negative relationship with production orientation; (Zero Order R = -.39, p < .05).
Additional SEM path analysis revealed that Authentic leadership significantly
positively predicted Employee orientation (β = .24, SE= .05, Wald Z= 5.10, p <
.05) and negatively predicted Production orientation (β = -.24, SE=.06, Wald Z= -
3.90, p < .05). Directive leadership did not significantly predict Employee
orientation (β = .06, SE= .04, Wald Z= 1.46, p > .05) or Production orientation (β
< 0.00, SE=.05, Wald Z= .005, p > .05).
Hypothesis 4 was partially confirmed. Leader behaviors significantly
predicted exchange ideology. Specifically, there was a significant positive
predictive relationship between authentic leadership and social exchange
ideology (H4A); (β = .27, SE=.06, Wald Z= 4.91, p < .05). Since this is higher
compared to the significant predictive relationship between directive leadership
and social exchange ideology (β = .18, SE=.05, Wald Z= 3.72, p < .05),
hypothesis 4A is supported. Additionally, there was a nonsignificant positive
predictive relationship between directive leadership and economic exchange
ideology, (H4B); β = .02, SE=.06, Wald Z= .325, p > .05) and a nonsignificant
negative predictive relationship between authentic leadership and economic

39
exchange (β = -.04, SE=.07, Wald Z= -.58, p > .05), thus not supporting
hypothesis 4B.
Hypothesis 5 was supported. HWP significantly predicted exchange
ideology. Specifically, there was a significant positive predictive relationship
between HWP and Social exchange ideology (H5A); (β = .15, SE=.05, Wald Z=
2.85, p < .05) and a significant negative predictive relationship between HWP
and Economic exchange ideology (H5B), (β = -.18, SE=.07, Wald Z= -2.71, p <
.05). Additionally, HWP had significant total and indirect effects on both social
exchange ideology (Total β = .55, SE=.05, Wald Z= 11.88, p < .05; Indirect β =
.40, SE=.04, Wald Z= 9.44, p < .05) and economic exchange ideology (Total β =
-.38, SE=.05, Wald Z= -7.26, p < .05; Indirect β = -.20, SE=.05, Wald Z= -4.21, p
< .05) which indicates possible mediation through LMX.
Proposition 2 was supported. There was a significant relationship between
exchange ideology and organizational orientation (employee and production).
Specifically, there was a significant positive relationship between Social
exchange ideology and employee orientation (P2A); (Zero Order R = .74, p < .05)
and a significant positive relationship between economic exchange ideology and
production oriented organization (P2B); (Zero Order R = .59, p < .05), thus
supporting Proposition 2. Additionally, there was also a significant negative
relationship between Social exchange ideology and Production oriented
organization (Zero Order R = -.51, p < .05) and a significant negative relationship
between economic exchange ideology and Employee orientation (Zero Order R =

40
-.47, p < .05). Follow up SEM analysis revealed that social exchange ideology
had a significant positive predictive direct relationship with Employee orientation
(β = .35, SE=.05, Wald Z = 7.45, p < .05) and a nonsignificant negative
relationship with production orientation (β = -.10, SE=.06, Wald Z= -1.70, p >
.05). Economic exchange ideology had a significant negative predictive
relationship with employee orientation (β = -.12, SE=.04, Wald Z= -3.17, p < .05)
and a significant positive predictive relationship with production orientation (β =
.42, SE=.05, Wald Z= 8.86, p < .05).
Confirmatory Factor Analysis
Intent to Quit
Confirmatory factor analysis revealed that the Intent to quit Aggregate
Scale created from the three items were part of a single factor solution with an
Eigenvalue = 2.28, which explained 76.13% of the variance. All Item loadings
were above the λ = .6 standard: “I am/was actively looking for another job,” λ =
.89; “I will/was going to probably look for a new job during the next year,” λ =.78; I
would/would have loved to quit this job,” λ =.74. See Table 3.
Healthy Workplace Practices
Confirmatory factor analysis revealed that the developed HWP Scale
created from the five items were part of a single factor solution with an
Eigenvalue = 3.64, which explained 72.78% of the variance. All Item loadings
were above the λ = .6 standard: “My organization has policies in place the
promote with work/life balance,” λ = .78; “My organization has policies in place
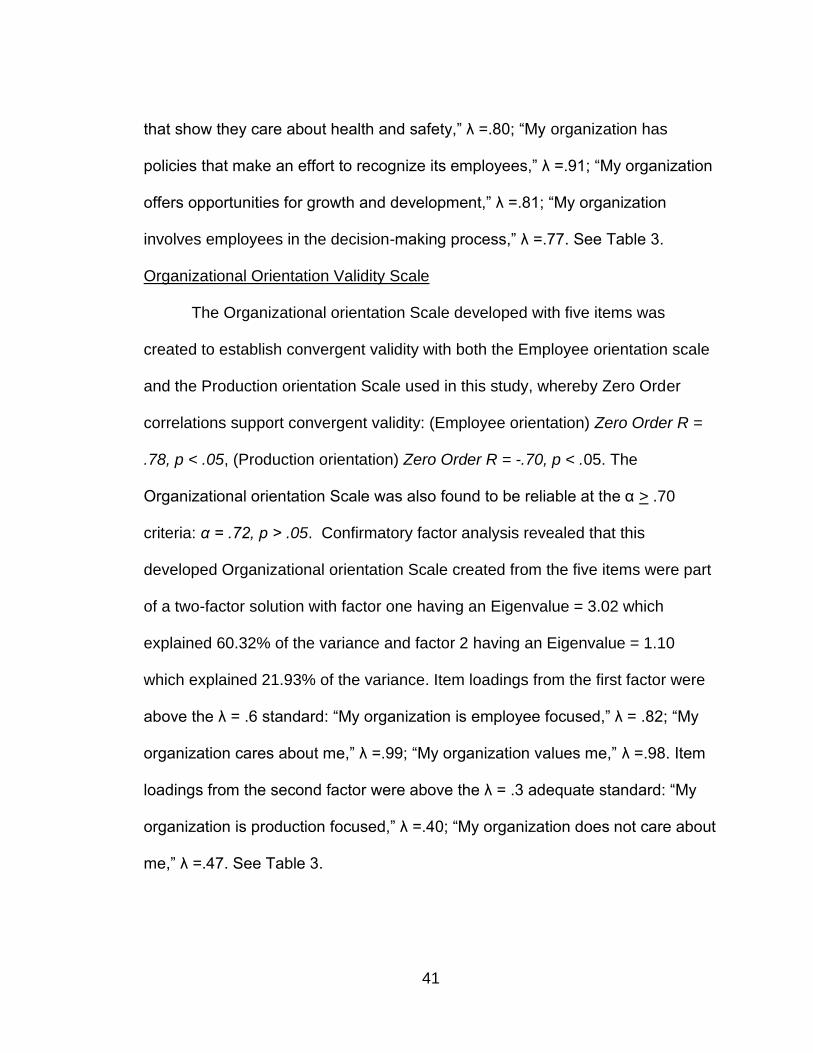
41
that show they care about health and safety,” λ =.80; “My organization has
policies that make an effort to recognize its employees,” λ =.91; “My organization
offers opportunities for growth and development,” λ =.81; “My organization
involves employees in the decision-making process,” λ =.77. See Table 3.
Organizational Orientation Validity Scale
The Organizational orientation Scale developed with five items was
created to establish convergent validity with both the Employee orientation scale
and the Production orientation Scale used in this study, whereby Zero Order
correlations support convergent validity: (Employee orientation) Zero Order R =
.78, p < .05, (Production orientation) Zero Order R = -.70, p < .05. The
Organizational orientation Scale was also found to be reliable at the α > .70
criteria: α = .72, p > .05. Confirmatory factor analysis revealed that this
developed Organizational orientation Scale created from the five items were part
of a two-factor solution with factor one having an Eigenvalue = 3.02 which
explained 60.32% of the variance and factor 2 having an Eigenvalue = 1.10
which explained 21.93% of the variance. Item loadings from the first factor were
above the λ = .6 standard: “My organization is employee focused,” λ = .82; “My
organization cares about me,” λ =.99; “My organization values me,” λ =.98. Item
loadings from the second factor were above the λ = .3 adequate standard: “My
organization is production focused,” λ =.40; “My organization does not care about
me,” λ =.47. See Table 3.

42
Table 3. Confirmatory Factor Analysis
Scale Items Lambda Eigenvalue Variance
Intent to quit Aggregate 1. I am/was actively looking for another job. 0.89* 2.28 76.13% 2. I will/was going to probably look for a new job during the next year.
0.78*
3. I would/ would have loved to quit this job. 0.74*
HWP 1. My organization has policies in place the promote with work/life balance.
0.78* 3.64 72.78%
2. My organization has policies in place that show they care about health and safety.
0.8*
3. My organization has policies that make an effort to recognize its employees.
0.91*
4. My organization offers opportunities for growth and development. 0.81*
5. My organization involves employees in the decision-making process.
0.77*
Org Orientation Validity Scale
1. My organization is employee focused. 0.82* 3.02 60.32%
2. My organization cares about me. 0.99*
3. My organization values me. 0.98*
4. My organization is production focused. ® 0.3** 1.1 21.93%
5. My organization does not care about me. ® 0.4**
Note: This table displays Confirmatory Factor Analysis for the Intent to quit, Healthy workplace practices, and Organizational orientation Validity Scale. Displayed is each item with its corresponding Lambda, Eigenvalue, and explained Variance. The * denotes a significant Lambda at the λ = .6 standard. The ** denotes an adequate Lambda at the λ = .3 standard.

43
Sentiment Analysis
Sentiment analysis of HWP free response items were conducted by
coding 20 random participant responses from each item.
For work life balance policies and practices (item HWP1), 75% of
responses were flexibility in schedule which includes flextime, shift trades, and
schedule building. The other 25% of response included PTO, sick leave,
holidays, and emergency time off. For employee growth and development
policies (HWP2), training opportunities made up 70% of responses, with the
other 30% being promotions, mentorships, and internship opportunities. For
recognition policies (HWP3), 70% of responses involved employee merit awards
and nominations such as employee of the month/year or gift cards. the other
30% contained newsletter recognition, bonuses, and increased hours. For health
and safety policies (HWP4), with 50% of response being some form of periodic
safety and health trainings, 20% of responses being one time or annual training,
20% or responses being related to COVID 19 testing and planning, and the
remaining 10% being some form of wellness checks and recommendations. For
employee involvement policies (HWP5), where 65% of responses included some
form of staff meeting or voting systems, while the other 35% included: choosing a
supervisor, promotion requests, online employee forums, and forced
participation.

44
Sentiment Analysis for the COVID 19 items were conducted by coding 20
random responses for both those who responded that their Organization was
Production oriented and those who responded Employee oriented.
For participants who responded that their organization response
was Production oriented in response to COVID 19, 60% stated it was because
they only cared about the production and money, 20% responded that the
organization did not care about employee health, 15% responded that their
organization was even more customer and client focused (e.g., students), and
the remaining 5% of responses were miscellaneous (e.g., hours cut, care about
reputation only). For participants who responded that their organization response
was Employee oriented in response to COVID 19, 45% responded that their
wellbeing and health is considered, 15%responded that they were allowed to
work from home, 15% responded that their organization followed COVID 19
protocols, 10% responded that their organization focuses on getting work done,
10% responded that they focus on the customer, and 15% were miscellaneous
responses (eg., caregiving provided).

45
CHAPTER FOUR
DISCUSSION
This study investigated the impact of Leadership behaviors, employee
Exchange ideology, and Healthy workplace practices on Organizational
orientation Perception (Production/Employee focus), and the subsequent impact
of Organizational orientation on Performance, Psychological safety, and Intent to
quit. All hypotheses were either fully or partially supported, indicating strong
support for the proposed model and the theories that support them. In other
words, findings suggest that this model can be utilized by organization in shaping
policies, recruitment, selection, and training practices of both leadership and
employees based on the desired Organizational orientation
(Employee/Production) and subsequent organizational benefits (Performance,
Psychological safety, and Turnover Intentions) aligns with their goals.
Hypothesis 1 predicted that HWP would positively predict
Employee orientation (H1A) and negatively predict Production orientation (H2B).
This was partially supported since HWP did positively predict Employee
orientation but did not significantly negatively predict Production orientation.
However, further mediation analysis of the relationship between HWP and
Production orientation revealed that LMX was a likely mediator, since when
accounted for in the model the total and indirect effects between HWP and
Production orientation was significant. This finding provides support for the
negative relationship between HWP and Production orientation and should be

46
noted by organization that the more HWP implemented by an organization, the
less the organization is perceived as Production oriented by its employees.
Propositions 1 predicted a strong association between Authentic
(P1A) and Directive (P1B) Leadership behaviors with Organizational orientation
(Employee/Production), whereby support was found for both P1A and P1B.
Further SEM analysis revealed that Authentic leadership had a significant
positive linear relationship with Employee orientation and a significant negative
relationship with Production orientation, likely because the supportive and warm
behaviors of Authentic leaders (Illies et al., 2005) increase employee perceptions
of their organization being Employee oriented, and decrease their perceptions
that their organization is Production oriented due to Organizational Embodiment
Theory (Eisenberger, 2014). However, further SEM analysis revealed that
Directive leadership did not have a significant predictive relationship with either
Employee or Production orientation. These findings could perhaps because
every leader is expected to have directive qualities to some degree and thus do
not present themselves as characteristic of either Organization Orientation.
Proposition 2 predicted a strong association between Social (P2A)
and Economic (P2B) Exchange ideology and Organizational orientation, whereby
support was found for both relationships. Further SEM analysis revealed that
Social exchange ideology had a significant positive linear relationship with
Employee orientation but not with Production orientation. This finding is in line
with the case made that employees with Social exchange ideologies will choose

47
to reside in organization high in HWP based on ASA and Social information
processing theory and will thus perceive their organization as more Employee
oriented. Analysis also revealed that Economic exchange ideology had a
significant negative predictive relationship with Employee orientation and a
positive predictive relationship with Production orientation. This finding is in line
with the case made that employee with Economic exchange ideologies will
choose to reside in organization with a lack of HWP based on ASA and Social
information processing theory, and will thus perceive their organization as more
Production oriented.
Hypotheses 4 and 5 predicted that Leadership behaviors (Authentic
H4A; Directive H4B) and HWP (H5A and H5B) will have an impact Employee
Exchange ideologies (Social and Economic). Hypothesis 4A was supported,
where it was predicted that Authentic leaders will have more employees with
Social exchange ideologies due to ASA and Social information processing
theory. However, Hypothesis 4B was not supported, where it was predicted that
Directive leaders would have more Economic exchange Employee’s. Perhaps
this is due to Directive leadership behaviors being expected among all types of
employees, and thus it is not one of the ASA or Social information processing
theory factors considered amongst employees when choosing to enter and
remain within an organization. Hypothesis 5A and B were both supported,
meaning that Healthy workplace practices and Policies have an impact on
employee Exchange ideology. Specifically, that organization with more HWP will

48
have more Social exchange ideology Employees and less Economic exchange
ideology Employees due to ASA and Social information processing theory.
Moving now to findings regarding the impact Organizational
orientation has on organizational outcomes, most of the hypotheses were
supported. As predicted, Production oriented organization increased turnover
intentions due to the Bottom-line mentality of these organization that results in
negative employee treatment (H2B), (Greenbaum et al., 2012; Mandis, 2013;
Mawritz et al., 2017; Mesdaghinia et al., 2019; Rawat, & Nadavulakere, 2019;
Sims & Brinkman, 2002; Raven et al., 1998; Yukl & Falbe, 1991). However,
Production orientation did not positively impact performance as predicted (H2A),
(Babalola et al, 2017; Greenbaum et al, 2012). This likely is more of an indication
of the flaws in the Performance scale used, which had lower than acceptable
reliability (a = .61). Alternatively, it is possible that the Bottom-line mentality
utilized by Production oriented Organization produces a negative environment
and psychological toll on employees great enough to mitigate any positive impact
to performance (Greenbaum et al., 2012; Mandis 2013; Mawritz et al. 2017;
Mesdaghinia, Rawat, & Nadavulakere, 2019; Sims & Brinkman 2002), creating a
net loss to performance. This explanation is supported by the results of the
subsequent hypothesis, whereby Psychological safety was negatively impacted
by Production orientation (H3B), while it was positively impacted by Employee
orientation (H3A). Support for this hypothesis shows that organization who orient
their organization around employees (Baker et al., 2006; Janz & Prasarnphanich,

49
2003; Lings & Greenley, 2005; Litwin & Stringer, 1968), such as by increasing
HWP (Sauter et al., 1996; Grawitch et al., 2006), will increase the liklihood of
increasing the psychological safety of their Employees. On the other hand,
organization that orient themselves around production and utilize a Bottom-line
mentality will hinder Psychological safety of their employees by creating a toxic
climate less conducive to Psychological safety, a variable which has been shown
to positively impact task performance (Frazier et al., 2017).
Practical and Theoretical Implications
Practical Implications
Overall support for this model has several theoretical and practical
implications. First, practical scales for HWP and organizational orientation were
developed to investigate hypotheses in this study, thereby providing a foundation
for both use and refinement for those who seek to measure these variables.
Next, it provides a model as to what types of leaders, employees, and
policies impact employee perceptions of their organization orientation (employee
of production focus). Results from the model suggests that most organization
should consider orienting their organization by focusing on employees. In other
words, organization should strive towards an Employee oriented model where
they hire and cultivate Authentic leaders, recruit and select employees with a
Social exchange ideology, and implement more Healthy workplace policies and
practices in order to maximize desired organizational outcomes like
Psychological safety and decreased turnover intentions.

50
Additionally, sentiment analysis provides examples of the kinds of policies
characterize HWP, which in turn are characteristic of Employee oriented
Organization. Examples for each of the five dimensions of HWP given by
employee respondents include: increased work schedule flexibility (work-life
balance), increased training opportunities (employee growth and development),
merit-based awards and ceremonies (employee recognition) periodic health and
safety training (Health and Safety), and staff meetings or voting systems
(employee involvement). Results from this investigation point out that the older
production oriented model that utilizes a bottom-line mentality is seemingly more
antiquated, less refined, and less humane than its employee oriented counterpart
in achieving positive organizational outcomes in a modern society. Hopefully, the
current evidence persuades organization to proactively investigate and
implement healthy workplace practices and policies into their own organization
as they work towards becoming more Employee oriented and humanistic in their
approach to handling issues pertaining to employees.
Theoretical Implications
One theoretical implication is that ASA (Shnieder et al., 1995), Social
information processing (SIP) theory (Salancik & Pfeffer, 1978), and
organizational embodiment (OE) theory (Eisenberger, 2014) provide sound
explanations for the impact variables had on each other. Specifically, that
Healthy workplace policies and Authentic leadership behaviors with attract, retain
(ASA), and cultivate (SIP) employees with Social exchange ideologies to their

51
organization. Furthermore, Organizational Embodiment Theory helps to explains
the positive relationship between Authentic leadership and Employee orientation
in that employees with a leader that invested time and cultivated a relationship
with them were felt by extension that their organization also cared about them as
well.
Furthermore, lack of support for hypotheses regarding Directive leadership
may highlight that this leadership behavior is a subset of other leadership
behaviors and characteristics that employees have come to expect from all
leadership styles, and thus is not a critical enough variable to have substantial
direct impacts on Economic exchange ideology or Production orientation as
initially predicted.
Additionally, the incorporation of LMX into the model allowed for the
significance of the impact of HWP on Production orientation Perceptions to be
showcased more effectively. This is noteworthy because it further exemplifies the
importance of LMX in organizational models and the further refinement needed to
incorporate it effectively into the current model of this study.
This study also contributes preliminarily to increased knowledge about the
potential long-term benefits of being an Employee oriented organization. Findings
regarding Healthy workplace practices showcase that employees perceived their
organization as more Employee oriented the more HWP is implemented. They
also indicated that the more Employee oriented an Organization is perceived to
be, the more Psychologically Safe and employee feels in that environment and

52
the less likely they intend to leave that organization. Taken together, it is
theoretically sound to justify that implementing more HWP into your organization
cultivates a more humane environment in which employees feel taken care of,
feel more comfortable at their organization, and are thus less likely to leave. This
helps to underscore earlier guiding research presumptions given in the
introduction that denote our theory that Employee oriented Organization will last
longer since they retain talented employees through implementing employee
focused policies (HWP) as well as the recruitment and cultivation of the Authentic
leaders and Social exchange employees. Given the potential positives of being
Employee oriented, organization with power and prestige that employ these
policies can inspire other’s organization follow suit in implementing HWP,
cultivating both Authentic leaders and Social exchange ideologies in their
employees to improve the workplace and society on a broader scale.
Current findings also indicate that production oriented organization
perceptions did not positively predict performance as hypothesized. If this finding
is not tied to the previously mentioned reliability issues pertaining to our
performance scale, it could indicate that Production oriented Organization do not
have a competitive advantage compared to Employee oriented Organization due
to performance as previously theorized. As previously noted, this could indicate
that employee oriented organization have the overall edge compared to the
antiquated model of production oriented organization. Thus, organization

53
currently utilizing a production oriented model should consider shifting to a more
Employee focused model.
Overall, findings contribute to the larger body of research that aims to
develop and refine organizational models that increase positive organizational
outcomes through the exploration of the impact of leadership (leadership
behaviors), employee characteristics (exchange ideology), and organizational
culture (HWP) have on employee perceptions of their organization (Employee or
Production oriented). Furthermore, the impact these perceptions have on
important outcomes such as Intent to quit and Psychological safety was
explored, whereby Psychological safety was a particularly important outcome
given the relative novelty of research on this variable and increasing
organizational interest on the impact it has to other important organizational
outcomes. Evidence further suggests theoretical support that Employee oriented
Organization do likely have a competitive advantage over Production oriented
Organization in longevity given the outcomes measured (Intent to quit and
Psychological safety), while there was no theoretical support for the notion that
Production oriented Organization have an advantage in performance. Hence,
there is more support towards organization adopting more Employee oriented
approach.
Directions for Future Research
There are several directions for future research as a result of this
investigation. First, future research should incorporate additional leadership

54
styles and attitudes to the model, such as transformational, transactional, servant
leadership, theory x and theory y leadership attitudes. The addition of more
leadership styles into the model would help to increase the accuracy of the fit
model and help to increase the understanding of how leadership affects
employee perceptions of their organization.
Additionally, future research should look to incorporate LMX into the
model to investigate the predictive power it has in employee perceptions of their
organization and compare it to the predictive power HWP has on employee
perceptions. This would help to clarify the role HWP has in predicting employee
perceptions and drive new questions regarding the impact of HWP on
organization.
As mentioned previously, future studies should also seek to develop and
validate scales pertaining to Employee orientation and the HWP framework to
help increase the power and validity of the model. Future longitudinal studies
should also be conducted to be able to gather turnover data and even examine
the model fit for specific industries. Furthermore, it is highly recommended that
this study be replicated once the pandemic is over, as results may be different in
a non-pandemic economy.
Finally, future research should delve more in depth about organizational
outcomes that would seek to answer the guiding research question for this
investigation, are Employee oriented organization more suited to lasting longer
than Production oriented Organization while Productions Oriented Organization

55
are best suited towards high performance? Variables to be investigated include
turnover, actual performance data from organization (rather than self-report) and
comparing longevity data of Production and Employee oriented Organization.
Such investigations would require much more time and resources and are
beyond the scope of this current investigation.
Limitations
As with most psychological research, the data collected was self-report
data. This method presents well known limitations to this study, namely the
subjectiveness of the method rises questions of accuracy. As such, it is important
to note that this study is no exception to the limitations of self-report methods in
psychological research, and should be read and understood with this limitation in
mind.
Another limitation of this study is the conflation of organizational
leadership literature with supervisors. Much of the research cited in this paper
regarding leadership references organizational leadership (Executives), and
although it has practical and inferential application to supervisors, they are not
the intended group to which the literature referred to. Thus, it must be noted that
the current deficiencies in the leadership literature presents a limitation to this
study as organizational leadership literature and measures were utilized to
hypothesize and measure supervisory behaviors.
Given the size and scope of this study, we were unable to obtain turnover
data longitudinally to analyze if Employee oriented organization have an

56
advantage in longevity over their Production oriented counterparts. As such, this
study measured Intent to quit (turnover intent) data as a the most logical
substitute for turnover data.
It must be noted that some scales used have yet to be refined or are
unreliable. The performance scale used did not meet the a > .70 criteria, which
likely explains why hypotheses regarding this variable were not supported.
Furthermore, Employee orientation literature and methods are still being refined
and largely conflated with concepts of organizational climate. The relative novelty
of Employee orientation research has limited our measurements to that of
Organizational Warmth and Support scales that were originally intended to
capture organizational climate. Although the Organizational orientation Scale
created did show some support for convergent validity for the Employee
orientation Scale used in this investigation, much more research must be done to
refine an actual Employee orientation scale. Thus, the measures used in this
study must be noted as a possible limitation of the study and its subsequent
outcomes.
Analysis between employed and unemployed participants were also
conducted to gauge the possible impact layoffs may have had on the model. It
must be noted that preliminary t-test analysis did find significant differences
between employee and unemployed participants. However, further analysis of a
path-way model with employed participants only (see appendix L) showcases
strong similarities to the model analyzed for this study where both employed and

57
unemployed participants are analyzed together. Differences that were of note in
the employed only model were the pathway between production orientation and
intent to quit was non-significant. Thus, it is seemingly safe to conclude that the
model that aggregates both employed and unemployed participants is similar to a
model with employed participants only, and thus employment may did not have a
significant impact on results.
Lastly, this study was conducted during the COVID 19 pandemic.
Although sentiment analysis was conducted to understand the effects this may
have had on the study, it must be noted that this is a possible confound for the
results of our investigation.
Conclusion
The driving questions behind this study was to understand what makes
both Production and Employee oriented organization competitive and able to
survive in today’s global marketplace. As such, a model that included the
antecedents and outcomes of both Employee and Production oriented
Organization was investigated. Support for the overall model was found, with
results indicating favorable outcomes regarding decreased turnover intent and
increased Psychological safety for Employee oriented Organization who employ
Authentic leaders, have employees with Social exchange ideologies, and
implement Healthy workplace practices and Policies. Although much there is
more research and model refinement to be done, this model provides a solid

58
foundation for which to explore and improve the effectiveness of organization in a
more ethical and humane society.

59
APPENDIX A
AUTHENTIC LEADERSHIP

60
Please indicate the extent to which your immediate or most recent supervisor
behaves in the following ways.
1. Seeks feedback to improve interactions with others.
2. Accurately describes how others view his or her capabilities.
3. Says exactly what he or she means.
4. Is willing to admit mistakes when they are made.
5. Demonstrates beliefs that are consistent with actions.
6. Makes decisions based on his/her core beliefs.
7. Solicits views that challenge his or her deeply held positions.
8. Listens carefully to different points of view before coming to conclusions.
(Walmbwa, Aviolo, Gardner, Wernsing & Peterson, 2008).

61
APPENDIX B
DIRECTIVE LEADERSHIP
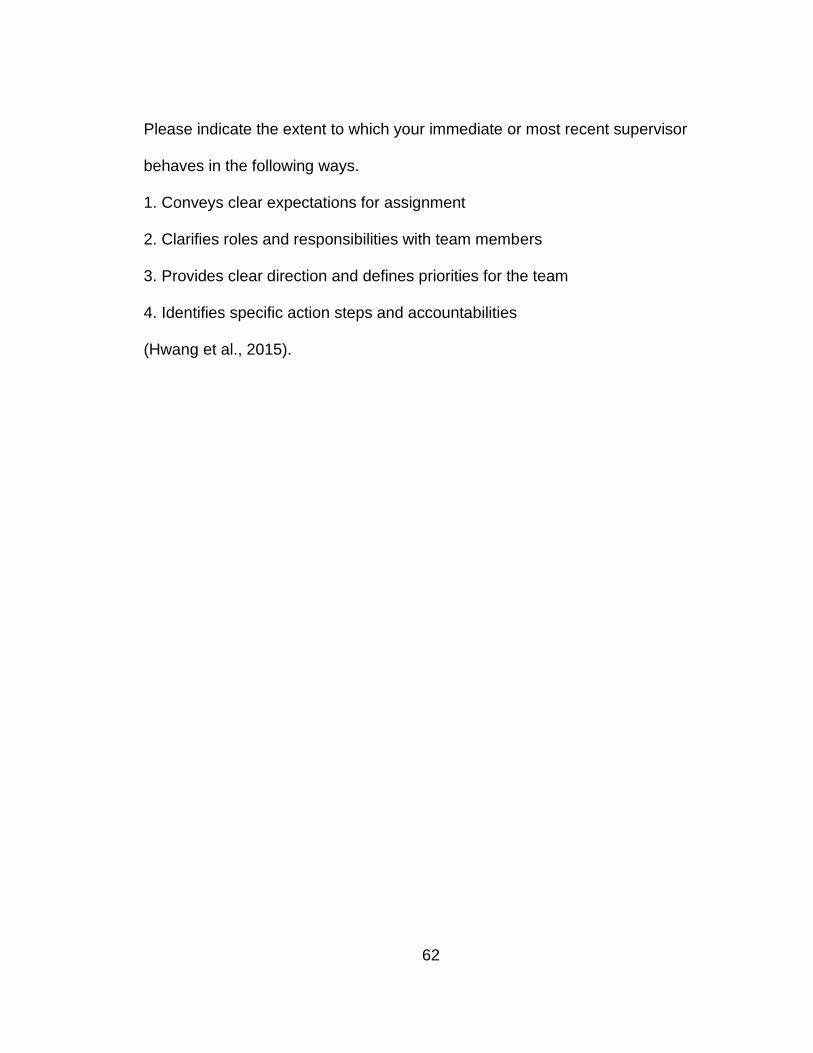
62
Please indicate the extent to which your immediate or most recent supervisor
behaves in the following ways.
1. Conveys clear expectations for assignment
2. Clarifies roles and responsibilities with team members
3. Provides clear direction and defines priorities for the team
4. Identifies specific action steps and accountabilities
(Hwang et al., 2015).

63
APPENDIX C
SOCIAL EXCHANGE IDEOLOGY

64
Please indicate the degree to which you agree with the following statements as a
current or former employee.
1. My organization has made a significant investment in me.
2. The things I do on the job today will benefit my standing in this organization in
the long run.
3. There is a lot of give and take in my relationship with my organization.
4. I worry that all my efforts on behalf of my organization will never be rewarded
5. I don't mind working hard today - I know I will eventually be rewarded by my
organization.
6. My relationship with my organization is based on mutual trust.
7. I can try to look out for the best interest of the organization becuase I can rely
on my organization to take care of me.
8. Even though I may not always receive the recognition I deserve from my
organization, I know my efforts will be rewarded in the future.
(Shore et al. 2006).

65
APPENDIX D
ECONOMIC EXCHANGE IDEOLOGY
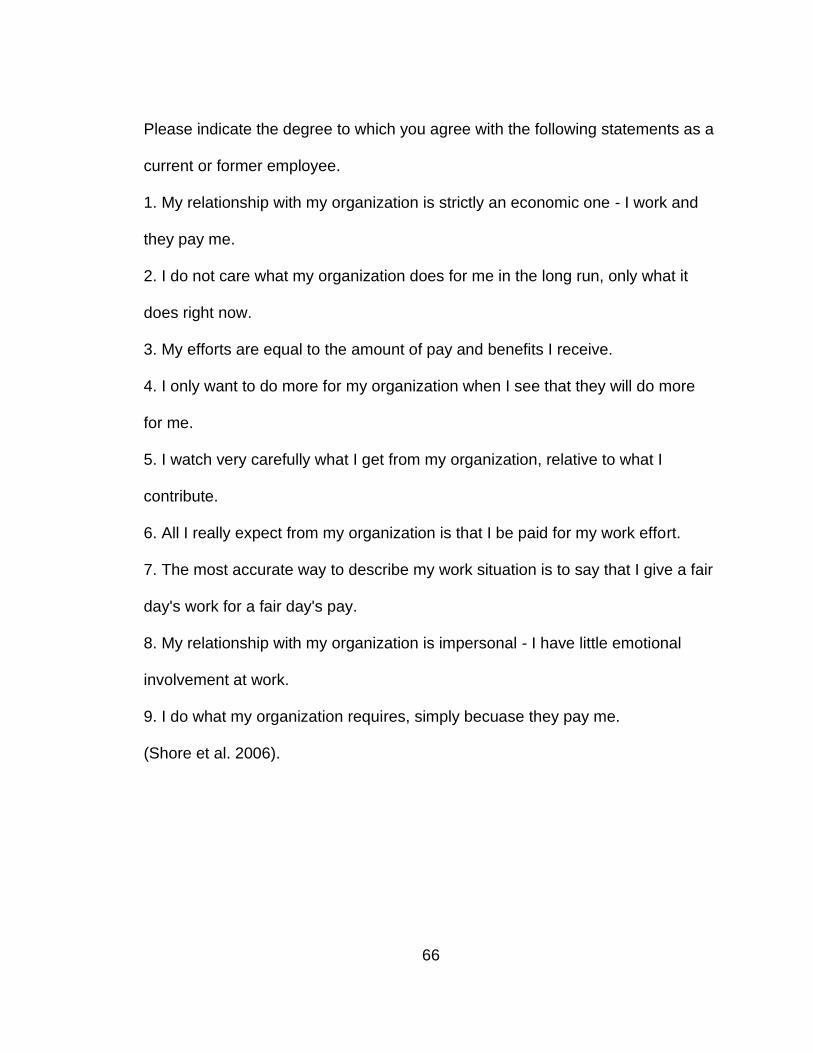
66
Please indicate the degree to which you agree with the following statements as a
current or former employee.
1. My relationship with my organization is strictly an economic one - I work and
they pay me.
2. I do not care what my organization does for me in the long run, only what it
does right now.
3. My efforts are equal to the amount of pay and benefits I receive.
4. I only want to do more for my organization when I see that they will do more
for me.
5. I watch very carefully what I get from my organization, relative to what I
contribute.
6. All I really expect from my organization is that I be paid for my work effort.
7. The most accurate way to describe my work situation is to say that I give a fair
day's work for a fair day's pay.
8. My relationship with my organization is impersonal - I have little emotional
involvement at work.
9. I do what my organization requires, simply becuase they pay me.
(Shore et al. 2006).

67
APPENDIX E
EMPLOYEE ORIENTATION

68
WARMTH
Please indicate the degree to which you agree with the following statements
about your organization.
1. A friendly atmosphere prevails among people in this organization.
2. It is very hard to get to know people in this organization.
3. This organization is characterized be a relaxed, easy-going working climate.
4. There is a lot of warmth in the relationships between management and
workers in this organization.
5. If you are paying attention, please select Agree.*
6. People in this organization tend to be cool and aloof toward each other.
* Attention check item
SUPPORT
Please indicate the degree to which you agree with the following statements
about your organization.
1. The philosophy of our management emphasizes the human factor, how people
feel, etc.
2. Management makes an effort to talk with you about your career aspirations
within the organization.
3. When I am on a difficult assignment I can usually count on getting assistance
from my boss and coworkers.
4. People in this organization don't really trust each other enough.

69
5. You don't get much sympathy from higher-ups in this organization if you make
a mistake.
(Janz & Prasarnphanich 2003)

70
APPENDIX F
PRODUCTION ORIENTATION;
BOTTOM LINE MENTALITY SCALE
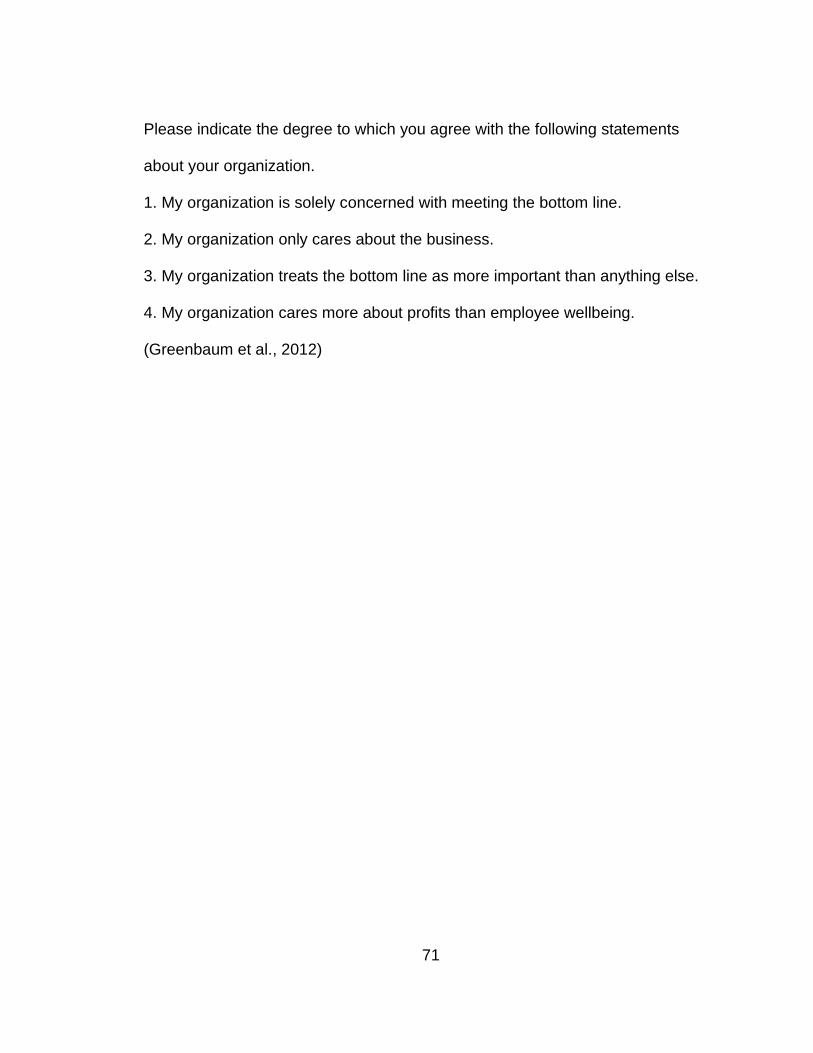
71
Please indicate the degree to which you agree with the following statements
about your organization.
1. My organization is solely concerned with meeting the bottom line.
2. My organization only cares about the business.
3. My organization treats the bottom line as more important than anything else.
4. My organization cares more about profits than employee wellbeing.
(Greenbaum et al., 2012)

72
APPENDIX G
ORGANIZATIONAL ORIENTATION VALIDITY SCALE

73
Please indicate the degree to which you agree with the following statements
about your organization
1. My organization is employee focused.
2. My organization cares about me.
3. My organization values me.
4. My organization is production focused. ®
5. My organization does not care about me. ®
® indicates reverse coded items
(Developed by author)

74
APPENDIX H
HEALTHY WORKPLACE POLICIES

75
Please indicate the extent to which you agree with the following statements about
your organization policies and practices.
1. My organization has policies in place the promote with work/life balance.
2. My organization has policies in place that show they care about health and
safety.
3. My organization has policies that make an effort to recognize its employees.
4. My organization offers opportunities for growth and development.
5. My organization involves employees in the decision-making process.
Healthy Workplace Policy free response items
1. Please enter policies your current or most recent organization had concerning
work/life balance. (Eg. Flextime)
2. Please enter policies your current or most recent organization had concerning
employee growth and development. (Eg. Mentorship Program)
3. Please enter policies your current or most recent organization had concerning
employee recognition. (Eg. Reward Ceremonies)
4. Please enter policies your current or most recent organization had concerning
health and safety. (Eg. regular safety trainings)
5. Please enter policies your current or most recent organization had concerning
employee involvement. (Eg. vote for manager)
(Developed by author)

76
APPENDIX I
PSYCHOLOGICAL SAFETY

77
The following items pertain to your perceptions about your relationship with your
ORGANIZATION. Please review each item and state to what extent you agree.
1. If you make a mistake in this organization, it is often held against you.
2. I am able to bring up problems and tough issues in my organization.
3. This organization sometimes rejects others for being different.
4. It is safe to take a risk in this organization.
5. It is difficult to ask my organization for help.
6. This organization would never deliberately act in a way that undermines my
efforts.
(Edmonson, 1999)

78
APPENDIX J
INTENT TO QUIT

79
Please indicate the degree to which you agree with the following statements
about your current job.
1. I am actively looking for another job.
2. I will probably look for a new job during the next year.
3. I would love to quit this job.
*Employed Version
Please indicate the degree to which you agreed with the following statements
about YOUR MOST RECENT JOB.
1. I was actively looking for another job.
2. I was probably going to look for a new job during the next year.
3. I would have loved to quit that job.
*Unemployed Version
PERFORMANCE
Please indicate the degree to which you agree with the following statements
about your current or most recent job.
1. I am performing well in my job.
2. I really need to improve my performance in my job.
3. I am not performing as well as others at my job.
(Developed by author)

80
APPENDIX K
CONTROLS

81
COVID 19
1. Given your current or recent organization response to the COVID 19
pandemic, would you label your organization as production or employee
oriented?
2. Please explain your answer.
(Developed by author)
LMX
1. Do you know where you stand with your leader… do you usually know how
satisfied your leader is with what you do?
2. How well does your leader understand your job problems and needs?
3. How well does your leader recognize your potential?
4. Regardless of how much formal authority he/she has built into his/ her
position, what are the chances that your leader would use his/ her power to help
you solve problems in your work?
5. Again, regardless of the amount of formal authority your leader has, what are
the chances that he/she would “bail you out,” at his/ her expense?
6. I have enough confidence in my leader that I would defend and justify his/ her
decision if he/she were not present to do so?
7. How would you characterize your working relationship with your leader?
(Graen & Uhl-Bien, 1995).
SERVANT LEADERSHIP

82
Please indicate the degree to which you agree to the following about your
immediate supervisor, or most recent supervisor if currently unemployed.
1. My Supervisor puts my best interests ahead of his/her own.
2. My Supervisor does everything he/she can to serve me.
3. My Supervisor sacrifices his/her own interests to meet my needs.
4. My Supervisor goes above and beyond the call of duty to meet my needs.
5. My Supervisor is one I would turn to if I had a personal trauma.
6. My Supervisor is good at helping me with my emotional issues.
7. My Supervisor is talented at helping me to heal emotionally.
8. My Supervisor is one that could help me mend my hard feelings.
9. My Supervisor seems alert to what’s happening.
10. My Supervisor is good at anticipating the consequences of decisions.
11. My Supervisor has great awareness of what is going on.
12. My Supervisor seems in touch with what’s happening.
13. My Supervisor seems to know what is going to happen.
14. My Supervisor offers compelling reasons to get me to do things.
15. My Supervisor encourages me to dream “big dreams” about the organization.
16. My Supervisor is very persuasive.
17. My Supervisor is good at convincing me to do things.
18. My Supervisor is gifted when it comes to persuading me.
19. My Supervisor believes that the organization needs to play a moral role in
society.

83
20. My Supervisor believes that our organization needs to function as a
community.
21. My Supervisor sees the organization for its potential to contribute to society.
22. My Supervisor encourages me to have a community spirit in the workplace.
23. My Supervisor is preparing the organization to make a positive difference in
the future.
(Barbuto & Wheeler 2006)
POSITIVE AFFECTIVITY
This scale consists of a number of words that describe different feelings and
emotions. Read each item and indicate to what extent you generally felt this way
in the last 6 months. Ranked from 1 (slightly not at all) to 5 ( very much).
1. Interested
2. Excited
3. Strong
4. Enthusiastic
5. Proud
6. Alert
7. Inspired
8. Determined
9. Attentive
10. Active
NEGATIVE AFFECTIVITY

84
This scale consists of a number of words that describe different feelings and
emotions. Read each item and indicate to what extent you generally felt this way
in the last 6 months. Ranked from 1 (slightly not at all) to 5 (very much).
1. Distressed
2. Upset
3. Guilty
4. Scared
5. Hostile
6. Irritable
7. Ashamed
8. Nervous
9. Jittery
10. Afraid
POSITIVE AFFECTIVITY SUPERVISOR
Read each item and indicate to what extent YOUR SUPERVISOR/LEADER
matches these feelings and emotions in the last 6 months. Please answer to the
best of your knowledge. Ranked from 1 (slightly not at all) to 5 (very much).
1. Interested
2. Excited
3. Strong
4. Enthusiastic
5. Proud

85
6. Alert
7. Inspired
8. Determined
9. Attentive
10. Active
NEGATIVE AFFECTIVITY SUPERVISOR
Read each item and indicate to what extent YOUR SUPERVISOR/LEADER
matches these feelings and emotions in the last 6 months. Please answer to the
best of your knowledge. Ranked from 1 (slightly not at all) to 5 (very much).
1. Distressed
2. Upset
3. Guilty
4. Scared
5. Hostile
6. Irritable
7. Ashamed
8. Nervous
9. Jittery
10. Afraid
(Watson, Clark, & Tellegen, 1988).
DEMOGRAPHICS

86
1. Are you 18 years or older?
2. Please indicate your ethnicity.
3. Please indicate your sex.
4. What is your highest level of education?
5. How would you describe your family's financial situation when you were
growing up (0-16 years old):
6. Are you currently employed?
7. How long have you NOT been employed?
8. Why are you currently unemployed?
9. How long have you worked at your current organization?
10. How long have you worked with your CURRENT supervisor?
11. Before unemployment, how long did you work with your MOST RECENT
supervisor?
12. My job is (or was):
(Developed by author)

87
APPENDIX L
EMPLOYED MODEL RESULTS

88
An additional Path-Way Analysis with maximum liklihood estimation
procedures were used to investigate the relationship between the likely
antecedents and outcomes of employee and production oriented organization for
employed participants. Model fit for the model with employed participants only is
as follows, χ2 (2) = 50.91, p < .05; Independence χ2 (55) = 1495.20, p > .05,
RMSEA = .33, NFI = .96, CFI = .96, RMR = .04, Standardized RMR = .04. There
was a total of N = 229 participants when using complete cases. SPSS v. 27 and
Liseral were used to run the analysis. See figure 2 for the full computational
model.
Hypothesis 1 was partially supported. Healthy workplace practices
significantly predicted organizational orientation perception. As predicted, there
was a significant positive direct relationship between HWP and employee
oriented organization (H1A); (β= .18, SE=.05, Wald Z= 3.58, p < .05). However,
there was a non-significant relationship between HWP and production oriented
organization (H1B; (β = -.03, SE=.06, Wald Z= -.45, p > .05). Thus, H1A was
supported while H2B was not supported. However, HWP had a significant total
effect and indirect effect on employee oriented organization (H1A); (Total β = .61,
SE=.05, Wald Z= 11.78, p < .05; Indirect β = .43, SE=.05, Wald Z= 8.94, p < .05)
and Production oriented Organization (Total β = -.43, SE=.06, Wald Z= -7.15, p <
.05; Indirect β = -.40, SE=.05, Wald Z= -7.40, p < .05) which indicates signs of
mediation through LMX.

89
Hypothesis 2 was not supported. Production orientation did not
significantly predict performance (H2A); (β = .03, SE=.10, Wald Z= -.35, p > .05)
nor did it significantly predict intent to quit (H2B), (β = .13, SE=.06, Wald Z= 1.96,
p < .05). Furthermore, Employee orientation did not significantly predict
performance (H2A); (β = -.05, SE=.12, Wald Z= .42, p > .05) nor did it
significantly predict intent to quit (H2B), (β = .07, SE=.09, Wald Z= .856, p > .05).
Thus, hypothesis 2 was not supported for the model with employed participants
since neither Production or Employee oriented organization had a significant
relationship to performance or intent to quit.
Hypothesis 3 was supported. Organizational orientation significantly
predicted psychological safety whereby there was a significant positive predictive
relationship between employee orientation and psychological safety (H3A); (β =
.22, SE=.07, Wald Z= 3.14, p < .05). There was also a significant negative direct
relationship between production orientation and psychological safety (H3B), (β =
-.27, SE=.06, Wald Z= -7.84, p < .05). Thus hypothesis 3 was supported.
Proposition 1 was supported. Leader Behaviors were significantly related
to employee perceptions of Organizational orientation. Specifically, (P1A) there
was a significant positive relationship between authentic leadership and
employee orientation (Zero Order R = .71, p < .05) and a significant negative
relationship with production orientation (Zero Order R = -.52, p < .05).
Additionally, directive leadership had a significant positive relationship with
employee orientation (P1B), (Zero Order R = .56, p < .05) and a significant

90
negative relationship with production orientation; (Zero Order R = -.42, p < .05).
Additional SEM path analysis revealed that authentic leadership significantly
positively predicted employee orientation (β = .25, SE= .06, Wald Z= 4.32, p <
.05) and negatively predicted production orientation (β = -.17, SE=.08, Wald Z= -
2.25, p < .05). Directive leadership did not significantly predict employee
orientation (β = .09, SE= .05, Wald Z= 1.94, p > .05) or production orientation (β
= 0.08, SE=.06, Wald Z= -1.36, p > .05).
Hypothesis 4 was partially confirmed. Leader behaviors significantly
predicted exchange ideology. Specifically, there was a significant positive
predictive relationship between authentic leadership and social exchange
ideology (H4A); (β = .36, SE=.07, Wald Z= 5.41, p < .05). Since this is higher
compared to the significant predictive relationship between directive leadership
and social exchange ideology (β = .12, SE=.06, Wald Z= 2.16, p < .05),
hypothesis 4A is supported. Additionally, there was a nonsignificant positive
predictive relationship between directive leadership and economic exchange
ideology, (H4B); β = -.005, SE=.07, Wald Z= .08, p > .05) and a nonsignificant
negative predictive relationship between authentic leadership and economic
exchange (β = -.04, SE=.08, Wald Z= -.47, p > .05), thus not supporting
hypothesis 4B.
Hypothesis 5 was supported. HWP significantly predicted exchange
ideology. Specifically, there was a significant positive predictive relationship
between HWP and Social exchange ideology (H5A); (β = .15, SE=.06, Wald Z=

91
2.55, p < .05) and a significant negative predictive relationship between HWP
and Economic exchange ideology (H5B), (β = -.23, SE=.07, Wald Z= -3.12, p <
.05). Additionally, HWP had significant total and indirect effects on both social
exchange ideology (Total β = .53, SE=.06, Wald Z= 9.5, p < .05; Indirect β = .38,
SE=.05, Wald Z= 7.81, p < .05) and economic exchange ideology (Total β = -.43,
SE=.06, Wald Z= -7.15, p < .05; Indirect β = -.20, SE=.05, Wald Z= -4.08, p <
.05) which indicates possible mediation through LMX.
Proposition 2 was supported. There was a significant relationship between
exchange ideology and organizational orientation (employee and production).
Specifically, there was a significant positive relationship between social
exchange ideology and employee orientation (P2A); (Zero Order R = .74, p < .05)
and a significant positive relationship between economic exchange ideology and
production oriented organization (P2B); (Zero Order R = .59, p < .05), thus
supporting Proposition 2. Additionally, there was also a significant negative
relationship between social exchange ideology and production oriented
organization (Zero Order R = -.53, p < .05) and a significant negative relationship
between economic exchange ideology and Employee orientation (Zero Order R =
-.40, p < .05). Follow up SEM path analysis revealed that social exchange
ideology had a significant positive predictive direct relationship with Employee
orientation (β = .37, SE=.06, Wald Z = 6.5, p < .05) and a nonsignificant negative
relationship with production orientation (β = -.12, SE=.07, Wald Z= -1.70, p >
.05). Economic exchange ideology had a significant negative predictive

92
relationship with employee orientation (β = -.11, SE=.05, Wald Z= -2.41, p < .05)
and a significant positive relationship with production orientation (β = .40,
SE=.06, Wald Z= 6.77, p < .05).

93
APPENDIX M
IRB APPROVAL LETTER

94

95
APPENDIX N
FIGURE 1

96
Leadershi
p
Behaviors
(Directive
;
Exchange
Ideology
(Economic
; Social)
Organizational
Orientation
Perception
(Production;
Employee)
Psychologic
al safety
Performance
Intent to
Quit
H1
P2
H
5
P1 H
4
H
3
H2A
H2
B
Healthy
workplace
policies
Caption: Proposed Conceptual Model

97
APPENDIX O
FIGURE 2

98

99
REFERENCES
Babalola, M. T., Greenbaum, R. L., Amarnani, R. K., Shoss, M. K., Deng,
Y.,Garba, O. A., & Guo, L. (2020). A business frame perspective on
why perceptions of top management's bottom‐line mentality result
in employees’ good and bad behaviors. Personnel Psychology,
73(1), 19-41. DOI: 10.1111/peps.12355
Baker, D., Greenberg, C., & Hemingway, C. (2006). What happy companies
know.New Jersey,USA: Pearson Education.
Baker, W. E., & Jimerson, J. B. (1992). The sociology of money. American
Behavioral Scientist, 35(6), 678–693
Barbuto Jr, J. E., & Wheeler, D. W. (2006). Scale development and construct
clarification of servant leadership. Group & Organization
Management, 31(3), 300-326.
Berman, S. L., Wicks, A. C., Kotha, S., & Jones, T. M. (1999). Does stakeholder
orientation matter? The relationship between stakeholder
management models and firm financial performance. Academy of
Management Journal,42(5), 488-506.
Bowers, D. G., & Seashore, S. E. (1966). Predicting organizational effectiveness
with a four-factor theory of leadership. Administrative Science
Quarterly, 238-263.

100
Brockman, B. K., & Morgan, R. M. (2003). The role of existing knowledge in new
product innovativeness and performance. Decision Sciences, 34(2),
385-419.
Calantone, R. J., & Di Benedetto, C. A. (1988). An integrative model of the new
product development process: An empirical validation. Journal of
Product Innovation Management: An International Publication of the
Product Development & Management Association, 5(3), 201-215.
Chiaburu, D. S., Diaz, I., & Pitts, V. E. (2011). Social and economic exchanges
with the organization: Do leader behaviors matter? Leadership &
Organization Development Journal, 32(5), 442-461.
doi:10.1108/01437731111146569
Eagly, A. H., Johannesen-Schmidt, M. C., & Engen, M. L. (2003).
Transformational, transactional, and laissez-faire leadership styles:
A meta-analysis comparing women and men. Psychological
Bulletin, 129(4), 569-591. doi:10.1037/0033-2909.129.4.569
Edmondson, A. (1999). Psychological safety and learning behavior in work
teams. Administrative Science Quarterly, 44(2), 350–383.
https://doi org.libproxy.lib.csusb.edu/10.2307/2666999
Edmondson AC, Lei Z. (2014). Psychological safety: The history, renaissance,
and future of an interpersonal construct. Annual Review of
Organizational Psychologyand Organizational Behavior, 1, 23–43.
http://dx.doi.org/10.1146/annurev orgpsych-031413-091305

101
Eisenberger, Robert. (2014). The supervisor POS–LMX–subordinate POS chain:
Moderation by reciprocation wariness and supervisor's
organizational embodiment. Journal of Organizational Behavior.,
35(5), 635-656.
Frazier, M. L., Fainshmidt, S., Klinger, R. L., Pezeshkan, A., & Vracheva, V.
(2017). Psychological safety: A meta‐analytic review and extension.
Personnel Psychology, 70(1), 113-165.
Gasiorowska, A., Chaplin, L. N., Zaleskiewicz, T., Wygrab, S., & Vohs, K. D.
(2016). Money cues increase agency and decrease prosociality among
children: Early signs of market-mode behaviors. Psychological Science,
27(3), 331–344.
Graen, G. B., & Uhl-Bien, M. (1995). Development of leader member exchange
(LMX) theory of leadership over 25 years: Applying a multi-level multi domain
perspective. The Leadership Quarterly, 6, 219–247.
https://doi.org/10.1016/10489843(95)90036-5
Greenbaum, R. L., Mawritz, M. B., & Eissa, G. (2012). Bottom-line mentality as
an antecedent of social undermining and the moderating roles of core self
evaluations and conscientiousness. Journal of Applied Psychology, 97,
343–359.
Hwang, S. J., Quast, L. N., Center, B. A., Chung, C. T. N., Hahn, H. J., &
Wohkittel, J. (2015). The impact of leadership behaviors on leaders’
perceived job performance across cultures: Comparing the role of

102
charismatic, directive, participative, and supportive leadership behaviors
in the US and four Confucian Asian countries. Human Resource
Development International, 18(3), 259-277.
Janz, B. D., & Prasarnphanich, P. (2003). Understanding the antecedents of
effective knowledge management: The importance of a knowledge
centered culture. Decision Sciences, 34(2), 351-384.
Jamison, D., & O’Mara, J. (1991). Managing workforce 2000. San Francisco:
Jossey-Bass.
Kahn WA. (1990). Psychological conditions of personal engagement and
disengagement at work. Academy of Management Journal, 33, 692–724.
http://dx.doi.org/10.2307/256287
Kamdar, D. and Van Dyne, L. (2007), The joint effects of personality and
workplace social exchange relationships in predicting task performance
and citizenship performance. Journal of Applied Psychology, Vol. 92 No.
5, pp. 1286-98.
Kalliath, T., & Brough, P. (2008). Work-life balance: A review of the meaning of
the balance construct. Journal of Management & Organization, 14,
323–327.
Kouchaki, M., Smith-Crowe, K., Brief, A. P., & Sousa, C. (2013). Seeing green:
Mere exposure to money triggers a business decision frame and unethical
outcomes. Organizational Behavior and Human Decision Processes, 121,
53 61.

103
Kuvaas, B. (2008). An exploration of how the employee–organization relationship
affects the linkage between perception of developmental human resource
practices and employee outcomes. Journal of Management Studies, 45(1),
1-25.
Lawler, E. E., III. (1991). Participative management strategies. In J. W. Jones, B.
D. Steffy, & D.W. Bray (Eds.), Applying Psychology in Business: The
Handbook for Managers and Human Resource Professionals (pp. 578
586). Lexington, KY: Lexington Books.
Li, J. (Jason), Lee, T. W., Mitchell, T. R., Hom, P. W., & Griffeth, R. W. (2016).
The effects of proximal withdrawal states on job attitudes, job searching,
intent to leave, and employee turnover. Journal of Applied
Psychology,101(10), 1436 1456.
https://doiorg.libproxy.lib.csusb.edu/10.1037/apl0000147
Lings, I. N., & Greenley, G. E. (2005). Measuring internal market orientation.
Journal of Service Research, 7(3), 290-305.
Little, L. M., Nelson, D., Wallace, J., & Johnson, P. (2011). Integrating
attachment style, vigor at work, and extra-role performance. Journal of
Organizational Behavior, 32, 464–484.
Lowe, K. B., Kroeck, K. G., & Sivasubramaniam, N. (1996). Effectiveness
correlates of transformational and transactional leadership: A meta
analytic review of the MLQ literature. The Leadership Quarterly, 7(3),
385-425.

104
Mandis, S. (2013). What happened to Goldman Sachs: An insider’s story of
organizational drift and its unintended consequences. Boston, MA:
Harvard Business Review Press.
Mawritz, M., Greenbaum, R. L., Butts, M., & Graham, K. (2017). I just can’t
control myself: A self-regulation perspective on the abuse of deviant
employees. Academy of Management Journal, 60, 1482–1503.
Mesdaghinia, S., Rawat, A., & Nadavulakere, S. (2019). Why moral followers
quit: Examining the role of leader bottom-line mentality and unethical pro
leader behavior. Journal of Business Ethics, 159(2), 491-505.
https://doi.org/10.1007/s10551-018-3812-7
Neustadt, E. A., Chamorro-Premuzic, T., & Furnham, A. (2011). Attachment at
work and performance. Attachment & Human Development, 13(5), 471
488.
Northouse, P. G. (2018). Leadership: Theory and practice. 7th edition. Sage
publications.
Pfeffer, J. (1994). Competitive advantage through people: Unleashing the power
of the workforce. Boston: Harvard Business School Press.
Pfeffer, J., & DeVoe, S. E. (2009). Economic evaluation: The effect of money and
economics on attitudes about volunteering. Journal of Economic
Psychology, 30(3), 500–508.

105
Plakoyiannaki, E., Tzokas, N., Dimitratos, P., & Saren, M. (2008). How critical is
employee orientation for customer relationship management? Insights
from a case study. Journal of Management Studies, 45(2), 268-293.
Rafiq, M., & Ahmed, P. K. (1993). The scope of internal marketing: defining the
boundary between marketing and human resource management. Journal
of Marketing Management, 9(3), 219-232.
Raven, B. H., Schwarzwald, J., & Koslowsky, M. (1998). Conceptualizing and
measuring a power/interaction model of interpersonal influence. Journal of
Applied Social Psychology, 28(4), 307–332.
Salancik, G. R., & Pfeffer, J. (1978). A social information processing approach to
job attitudes and task design. Administrative Science Quarterly, 23,
224-253.
Schneider, B., Goldstein, H. W., & Smith, D. B. (1995). The ASA framework: An
update. Personnel psychology, 48(4), 747-773.
Sims, R. R., & Brinkman, J. (2002). Leaders as moral role models: The case of
John Gutfreund at Salomon Brothers. Journal of Business Ethics, 35(4),
327–339.
Shore, L.M., Bommer, W.H., Rao, A.N. and Seo, J. (2009). Social and economic
exchange in the employee-organization relationship: the moderating role
of reciprocation wariness. Journal of Managerial Psychology, Vol. 24 No.8,
pp. 701-21.

106
Shore, L.M., Tetrick, L.E., Lynch, P. and Barksdale, K. (2006). Social and
economic exchange: construct development and validation. Journal of
Applied Social Psychology, Vol. 36 No. 4, 837-867.
Song, L.J., Tsui, A.S. and Law, K.S. (2009). Unpacking employee responses to
organizational exchange mechanisms: the role of social and economic
exchange perceptions. Journal of Management, Vol. 35 No. 1, pp. 56-93.
Tenbrunsel, A. E., & Messick, D. M. (1999). Sanctioning systems, decision
frames, and cooperation. Administrative Science Quarterly, 44, 684–707.
Vandenberg, R. J., Richardson, H. A., & Eastman, L. J. (1999). The impact of
high involvement work processes on organizational effectiveness: A
second-order latent variable approach. Group and Effect: A Spillover
Organization Management, 24, 300 –339.
Vohs, K. D. (2015). Money priming can change people’s thoughts, feelings,
motivations, and behaviors: An update on 10 years of experiments.
Journal of Experimental Psychology: General, 144(4), 1–8.
Vohs, K. D., Mead, N. L., & Goode, M. R. (2008). Merely activating the concept
of money changes personal and interpersonal behavior. Current
Directions in Psychological Science, 17, 208–212.
Walumbwa, F. O., Avolio, B. J., Gardner, W. L., Wernsing, T. S., & Peterson, S.
J. (2008). Authentic leadership: Development and validation of a theory
based measure. Journal of Management, 34(1), 89-126.

107
Wasmer, D. J., & Bruner, G. C. (1991). Using organizational culture to design
internal marketing strategies. Journal of Services Marketing.
Watson, D., Clark, L. A., & Tellegen, A. (1988). Development and validation of
brief measures of positive and negative affect: the PANAS scales. Journal
of Personality and Social Psychology, 54(6), 1063.
Wayne, S. J., Lemmon, G., Hoobler, J. M., Cheung, G. W., & Wilson, M. S.
(2017). The ripple model of the detrimental impact of work–family
confliction job success. Journal of Organizational Behavior, 38(6),
876-894.https://doi.org.libproxy.lib.csusb.edu/10.1002/job.2174
Yukl, G., & Falbe, C. M. (1991). Importance of different power sources in
downward and lateral relations. Journal of Applied Psychology, 76(3)