answers to activities - pearson education · as economics for ocr answers to activities ... other...
TRANSCRIPT
�
AS Economics for OCR
Answers to activitiesEconomist’s tool kit
Activity pAge viiTable 1 shows the average unemployment rates for economies in the CARICOM organisation in 2005.The rates of unemployment are variable – they are also high by UK standards. Although given to one decimal point, the data may not be particularly accurate as presumably only those who have registered as unemployed are included in the data. There will be many others who are out of work but not registered. Also, it is unclear whether women who might be seeking work have been included.
Activity pAge viiia) Time period is 1995–2005. Data is annual, recorded in the mid-point of each year.
b) • GDP at current prices has risen consistently over the whole period. • It increased more steadily from 1995 to 1999 and then increased more rapidly thereafter. • Largest increases in GDP are those from 2003 to 2005. • The annual rate of change in real GDP fluctuates. • This rate falls from 1995 to 1999 but then increases to 2003 and is then relatively stable.
Activity pAge xa) i) Contracted FDI fluctuates significantly over the period; utilised FDI is much more stable. Contracted FDI falls each year from 1993 to 1999 but increases thereafter. ii) The gap between contracted and utilised FDI is variable – it is highest in 1993 and lowest in 1999. Otherwise, there does not seem to be any statistical relationship.
Chapter 1
Activity pAge 3 (right)It is likely that responses will be made similar to those below. • Should I go out on Friday night or save my money to go to a club on Saturday? • Do I buy some new trainers or put the money towards a holiday? • Do we change the car or have the kitchen modernised? • Should we travel by car or go by train to your cousin’s wedding? • Should more money be spent on reducing road congestion or should it go to the NHS? • Should income tax be reduced for low earners?
Activity pAge 4b) It is expected that some of the topics selected will fit easily into either microeconomics or macroeconomics.
Other topics will not, since they can be considered from a micro as well as a macro perspective. An example could be (say) a newspaper article on air pollution in Beijing. This is evidence of market failure (see Chapter 3) but also has macroeconomic consequences since it could mean that overseas visitors might be put off going to Beijing because of poor air quality.
�
Activity pAge 7Scarcity arises because the budgets of local health authorities in some parts of the country may not be able to fund this expensive drug.
Choices therefore have to be made. These are normally on the basis of maximising patient welfare in relation to the expenditure that is involved.
Opportunity cost applies in so far that, if some of the budget is spent on Herceptin, then this is at the expense of the best alternative such as some other form of treatment either for cancer patients or, indeed, any other patients.
Activity pAge 9 (left)a) The simple reason is that each is able to specialise because of their factor mix. Land is particularly relevant
in these cases.
b) The benefits include: • a source of employment • greater overall output than if a much wider range of crops was produced • positive effect on the balance of payments • Caribbean producers can get better prices when selling their cane for fuel use.
Risks include: • Crop devastation from bad weather • A fall in sugar prices due to decreasing demand.
Activity pAge 9 (right)The obvious pattern to emerge is that most clothing and footwear items are likely to have been made in southern and south-east Asia – China, the Philippines, Malaysia, Korea, India, Thailand. Electronic goods are also extensively made in China, but also increasingly in the new member states of the EU.
Specialisation takes place as a result of cheap but relatively skilled labour, the use of the latest technology in some industries, the entrepreneurial skills of local producers and, in some cases, the availability of locally produced natural resources.
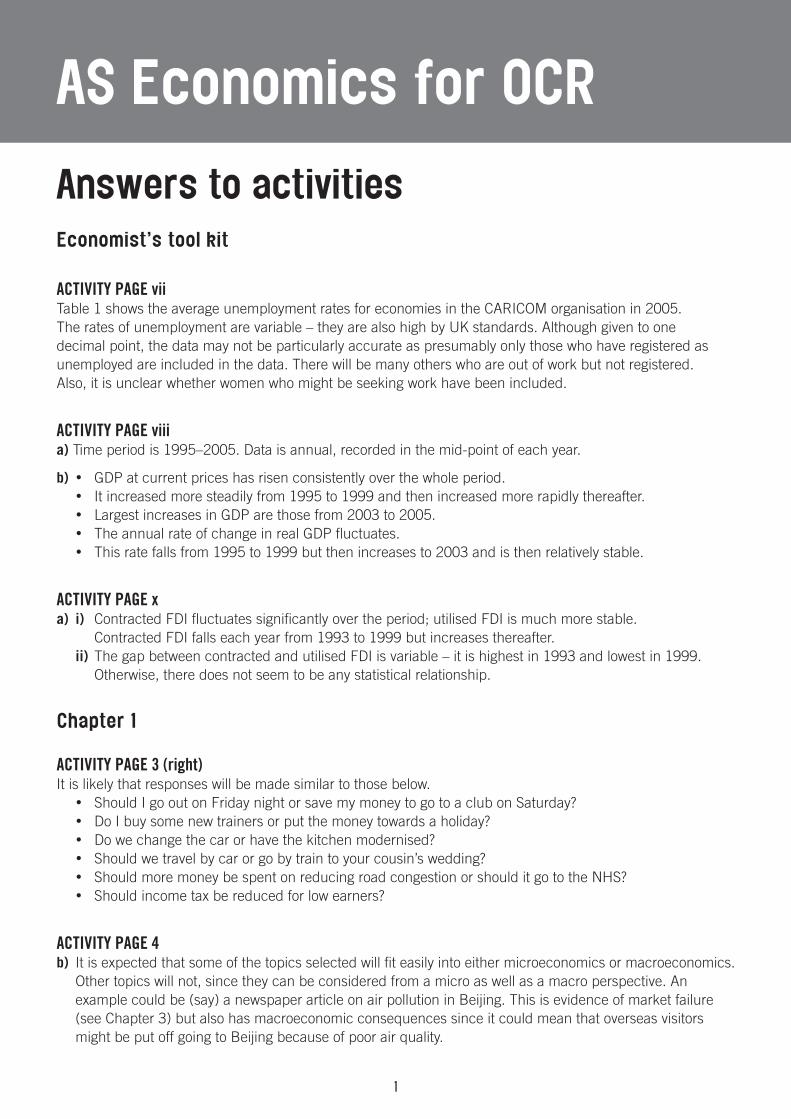
Activity pAge 11a) See figure below.
Quantity of cars produced
1000
800
600
400
200
Quantity of televisions produced400 800 1200 1600 20000
b) 600 televisions. When car production is reduced, more television sets can be made (900).
c) i) Choice can be shown in so far as any point on the PPC shows the respective choices between the two types of product.
ii) Scarcity can be shown by any point that is outside the PPC since there are not sufficient resources available to produce what might be the perceived wants/needs of the economy.
�
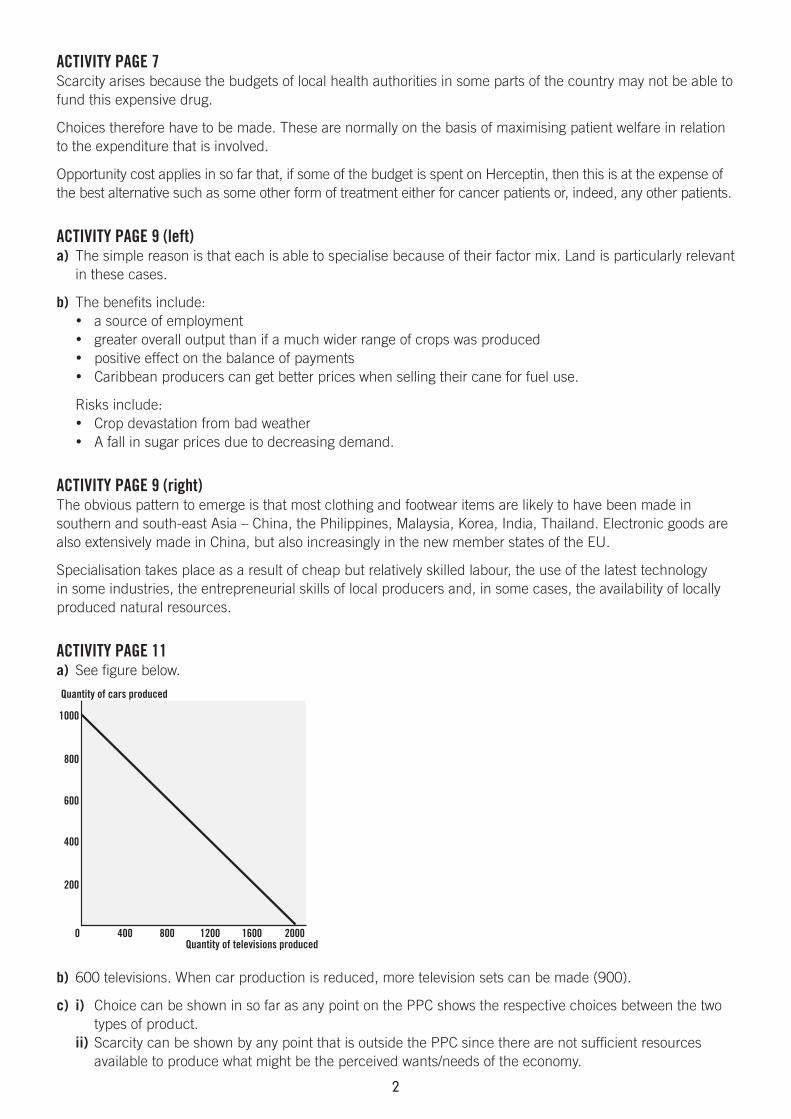
Activity pAge 13a) See figure below.
Quantity of cars produced
1000
1200
800
600
400
200
Quantity of televisions produced400 800 1200 1600 20000
b) An increase of around 100 cars.
c) As television production falls below 1,000, the quantity of cars that can be produced increases at an increasing rate as fewer and fewer televisions are made.
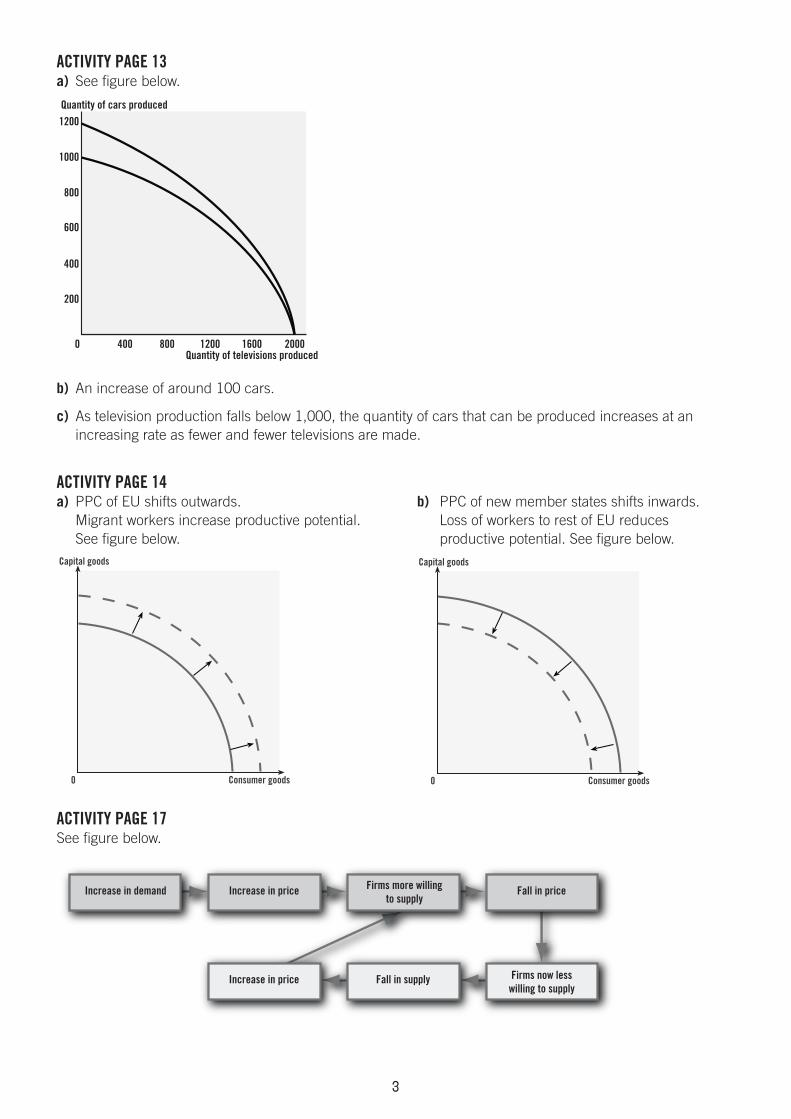
Activity pAge 14a) PPC of EU shifts outwards. b) PPC of new member states shifts inwards. Migrant workers increase productive potential. Loss of workers to rest of EU reduces See figure below. productive potential. See figure below.Capital goods
Consumer goods0
Capital goods
Consumer goods0
Activity pAge 17See figure below.
Firms more willingto supply
Firms now lesswilling to supply
Increase in priceIncrease in demand Fall in price
Fall in supplyIncrease in price

�
Activity pAge 19
a) See figure below.
Quantity of agricultural goods
mid-1990s
Note: no data on production isgiven. It can, though, be assumedthat production of agriculturalgoods in 2006 was less than halfthat of the mid-1990s
2006
Quantity of vehicles0
b) Other production possibility curves could be drawn. For manufactured goods, these would shift outwards over time to reflect the country’s high rate of economic growth.
c) The shape of the production possibility curve will change to show how, as the Czech Republic becomes more efficient at producing vehicles, increasing quantities of other products have to be given up in order to produce more vehicles.
d) The fall in public consumption from 80 to 20 per cent and the opportunities for foreign firms to set up in the Czech Republic following privatisation.
Chapter 2
Activity pAge 22a) Annual house price inflation fluctuated wildly over the period 1977–2007. In most years there was an
increase, apart from 1991 to 1994 when the rate of increase was negative resulting in a fall in the average price. The most extreme position was from 1989 to 1991, when the market went from a 30 per cent increase to a 10 per cent decrease.
b) The housing market is like any other market. When demand is high (due to low interest rates, easy credit, positive expectations) prices invariably rise as supply is unable to respond in the short term. Prices tend to fall during periods of low economic confidence when supply is increased through mortgage repossessions. Housing is a complex market although the principles of demand and supply can be applied.
Activity pAge 23 (top)a) Tesco must clearly have purchased a huge supply of both products, resulting in an overall fall in the
price that was paid by consumers. As both products had been on the market for some time, consumers’ demand was becoming much more price sensitive. (This is a highly simplistic response, however.)
b) Consumers clearly benefit. Tesco obviously benefit, especially if these low prices attract more people to their stores. Other retailers will lose out as they cannot compete on price; there may be moral and ethical issues relating to the way in which both products were produced in low-wage economies.

�
Activity pAge 23 (bottom)Various possibilities include:
• a geographical segmentation• price segmentation• holiday type segmentation, e.g. hotel, villa, self-catering• inclusive tour, independent traveller• mode of transport.
Activity pAge 24a) The products seem to be good substitutes. Therefore, the quantity demanded of ‘Taste the Difference’ orange
juice is likely to increase as a result of the large fall in price. The demand for Tropicana is expected to fall.
b) The expected change is likely to be based on the assumption that price is the only determinant of demand. Tropicana is a premier brand – brand loyalty (taste) may mean that not as many consumers switch their demand as might have been expected.
Activity pAge 26a) See figure below.
Price per person(£)
500
400
300
200
100
Quantity of holidays200 400 600 800 10000
b) Approximately 330 holidays.
Activity pAge 28 (top)a) See figure below.
Price
P
P1
Quantity demanded
D
New consumer surplus
Loss of consumer surplus
QQ1
Q1
0
b) The increase in price means that some consumers who would have bought the product will now not do so. These are the ones who would have been prepared to pay between P and P1. OQ minus OQ1 consumers would have paid less than P1 to acquire the good.

�
Activity pAge 28 (bottom)a) £20 increase.
b) The area is PEFP1.
Activity pAge 31a) Demand would fall, resulting in a shift to the left of the demand curve for self-catering holidays to Ibiza
(substitute).
b) Demand would increase, resulting in a shift to the right of the demand curve (substitute).
c) Demand would fall, resulting in a shift to the left of the demand curve (taste/fashion).
Diagrams would be as in Figure 2.5.
Activity pAge 32a) See figure below.
Price per person (£)1000
800
D1
D
600
400
200
Quantity demanded100 200 300 400 500 6000
b) Approximately £550.
c) The new demand curve D1 has shifted a little to the right of D. The gap between the two widens very slightly as price falls. The new price charged should be around £600 per holiday.
Activity pAge 35a) See figure below.
Price (£)4.00
3.50
3.00
2.50
2.00
Quantity supplied1000 200 300
b) The producer surplus can be calculated by working out the area on the graph that is below the price line of £3.25 and the supply curve. It is approximately £2,400.
�
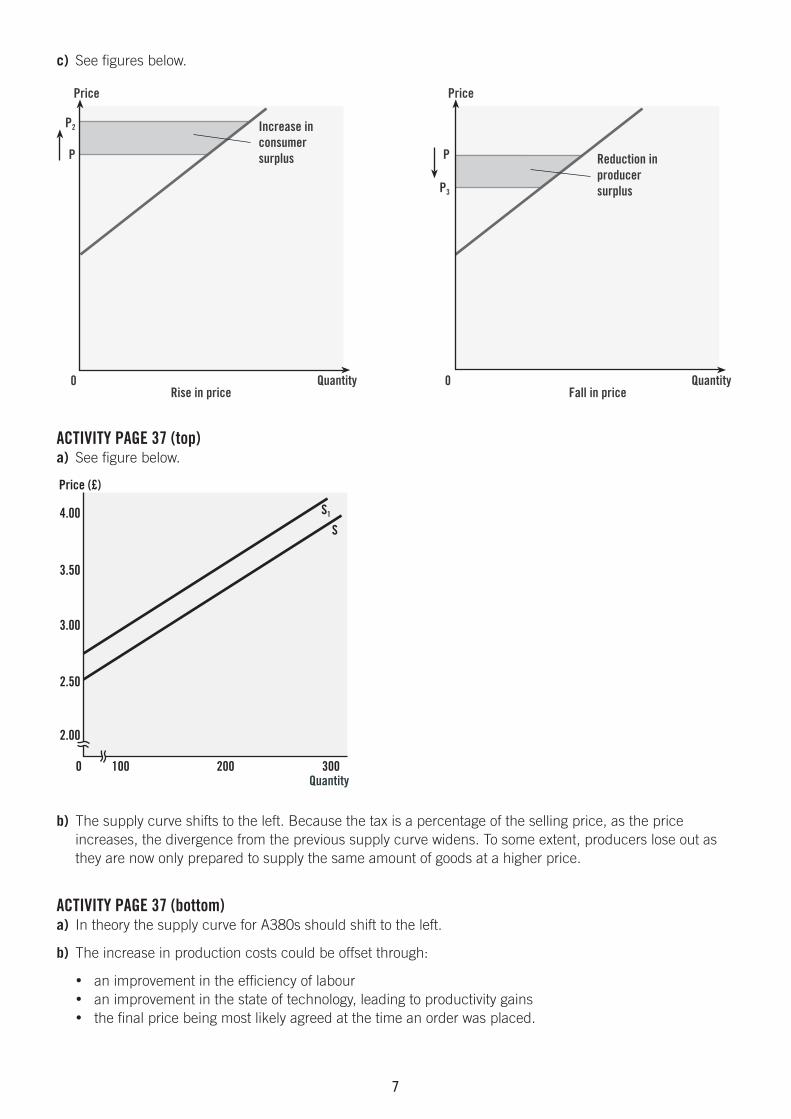
c) See figures below.
Price
QuantityRise in price Fall in price
Increase in consumersurplus
0
P
P2
Price
Quantity
Reduction in producersurplus
0
P
P3
Activity pAge 37 (top)a) See figure below.
Price (£)
S1
S4.00
3.50
3.00
2.50
2.00
1000 200 300Quantity
b) The supply curve shifts to the left. Because the tax is a percentage of the selling price, as the price increases, the divergence from the previous supply curve widens. To some extent, producers lose out as they are now only prepared to supply the same amount of goods at a higher price.
Activity pAge 37 (bottom)a) In theory the supply curve for A380s should shift to the left.
b) The increase in production costs could be offset through:
• an improvement in the efficiency of labour • an improvement in the state of technology, leading to productivity gains • the final price being most likely agreed at the time an order was placed.
�
Activity pAges 39–40a) i) If price is set at P1, there is excess supply. Producers are more willing to supply a larger quantity than
consumers are prepared to buy.
ii) If price is set at P2, there is excess demand. Consumers are willing to buy more at P2 than producers are willing to supply.
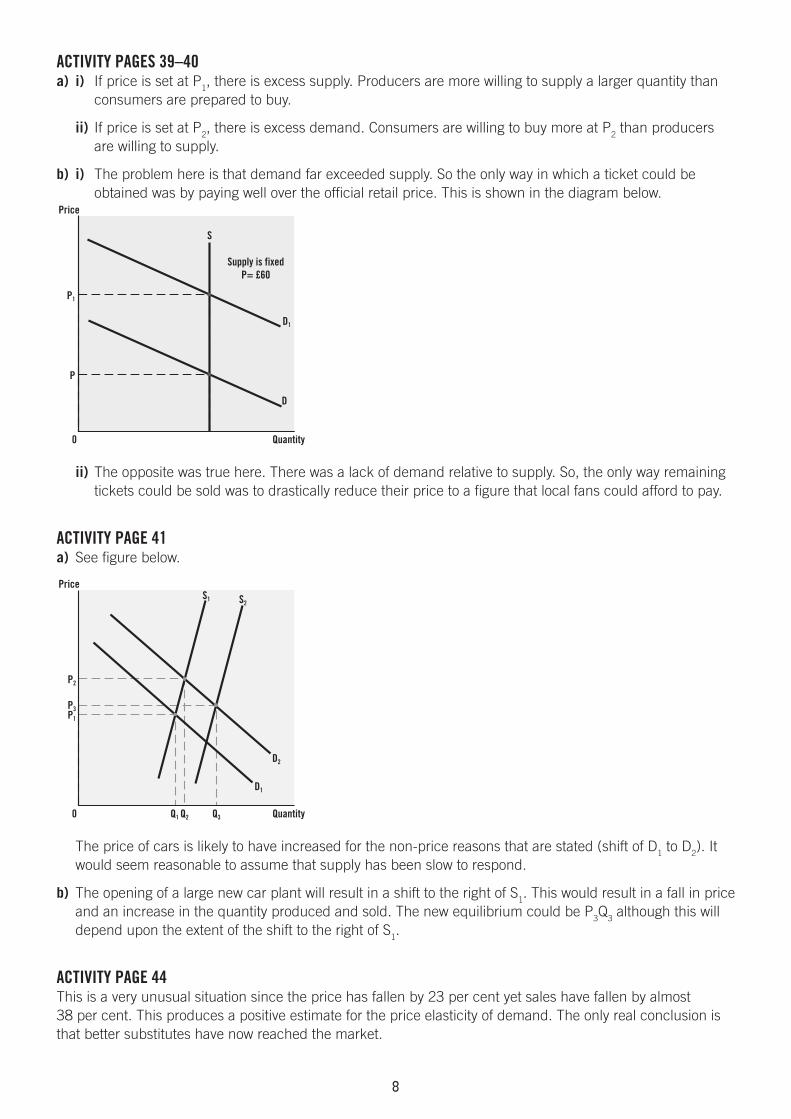
b) i) The problem here is that demand far exceeded supply. So the only way in which a ticket could be obtained was by paying well over the official retail price. This is shown in the diagram below.
Price
S
Supply is fixedP= £60
D
D1
Quantity0
P
P1
ii) The opposite was true here. There was a lack of demand relative to supply. So, the only way remaining tickets could be sold was to drastically reduce their price to a figure that local fans could afford to pay.
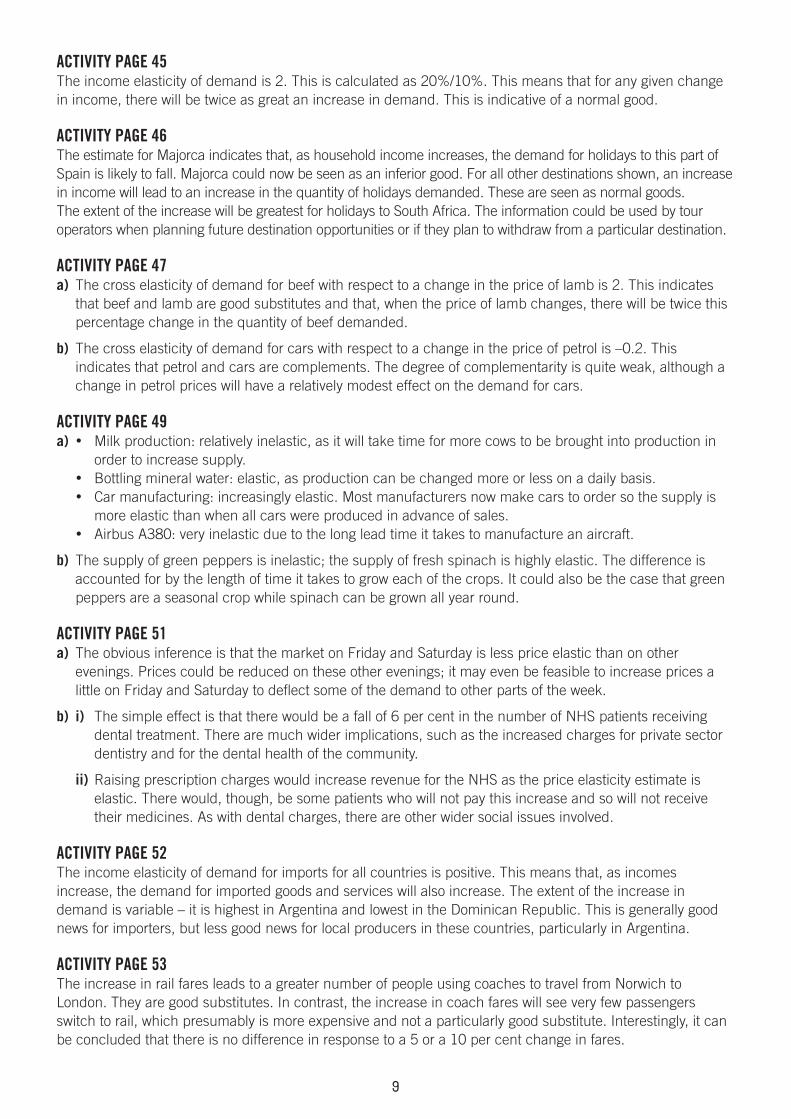
Activity pAge 41a) See figure below.
Price
P1
P3
P2
S1 S2
D1
D2
Q1 Q2 Q3 Quantity0
The price of cars is likely to have increased for the non-price reasons that are stated (shift of D1 to D2). It would seem reasonable to assume that supply has been slow to respond.
b) The opening of a large new car plant will result in a shift to the right of S1. This would result in a fall in price and an increase in the quantity produced and sold. The new equilibrium could be P3Q3 although this will depend upon the extent of the shift to the right of S1.
Activity pAge 44This is a very unusual situation since the price has fallen by 23 per cent yet sales have fallen by almost 38 per cent. This produces a positive estimate for the price elasticity of demand. The only real conclusion is that better substitutes have now reached the market.
�
Activity pAge 45The income elasticity of demand is 2. This is calculated as 20%/10%. This means that for any given change in income, there will be twice as great an increase in demand. This is indicative of a normal good.
Activity pAge 46The estimate for Majorca indicates that, as household income increases, the demand for holidays to this part of Spain is likely to fall. Majorca could now be seen as an inferior good. For all other destinations shown, an increase in income will lead to an increase in the quantity of holidays demanded. These are seen as normal goods. The extent of the increase will be greatest for holidays to South Africa. The information could be used by tour operators when planning future destination opportunities or if they plan to withdraw from a particular destination.
Activity pAge 47a) The cross elasticity of demand for beef with respect to a change in the price of lamb is 2. This indicates
that beef and lamb are good substitutes and that, when the price of lamb changes, there will be twice this percentage change in the quantity of beef demanded.
b) The cross elasticity of demand for cars with respect to a change in the price of petrol is –0.2. This indicates that petrol and cars are complements. The degree of complementarity is quite weak, although a change in petrol prices will have a relatively modest effect on the demand for cars.
Activity pAge 49a) • Milk production: relatively inelastic, as it will take time for more cows to be brought into production in
order to increase supply. • Bottling mineral water: elastic, as production can be changed more or less on a daily basis. • Car manufacturing: increasingly elastic. Most manufacturers now make cars to order so the supply is
more elastic than when all cars were produced in advance of sales. • Airbus A380: very inelastic due to the long lead time it takes to manufacture an aircraft.
b) The supply of green peppers is inelastic; the supply of fresh spinach is highly elastic. The difference is accounted for by the length of time it takes to grow each of the crops. It could also be the case that green peppers are a seasonal crop while spinach can be grown all year round.
Activity pAge 51a) The obvious inference is that the market on Friday and Saturday is less price elastic than on other
evenings. Prices could be reduced on these other evenings; it may even be feasible to increase prices a little on Friday and Saturday to deflect some of the demand to other parts of the week.
b) i) The simple effect is that there would be a fall of 6 per cent in the number of NHS patients receiving dental treatment. There are much wider implications, such as the increased charges for private sector dentistry and for the dental health of the community.
ii) Raising prescription charges would increase revenue for the NHS as the price elasticity estimate is elastic. There would, though, be some patients who will not pay this increase and so will not receive their medicines. As with dental charges, there are other wider social issues involved.
Activity pAge 52The income elasticity of demand for imports for all countries is positive. This means that, as incomes increase, the demand for imported goods and services will also increase. The extent of the increase in demand is variable – it is highest in Argentina and lowest in the Dominican Republic. This is generally good news for importers, but less good news for local producers in these countries, particularly in Argentina.
Activity pAge 53The increase in rail fares leads to a greater number of people using coaches to travel from Norwich to London. They are good substitutes. In contrast, the increase in coach fares will see very few passengers switch to rail, which presumably is more expensive and not a particularly good substitute. Interestingly, it can be concluded that there is no difference in response to a 5 or a 10 per cent change in fares.
�0
Chapter 3
Activity pAge 61a) Private costs: • cost of discharging detergent into the river.
External costs: • cost to angling club of replacing fish stocks • cost to river authority of purifying the water • cost to owners of wildlife habitat of damage caused by pollution • cost of loss of amenity to walkers.
Social costs = private costs + external costs.
b) Private costs: • cost to parrot’s owners of veterinary treatment (polluter pays in this case).
External costs: • cost to parrot (!) of suffering from having to breathe in polluted air from owners’ smoking.
Social costs = private costs + external costs.
Activity pAge 62a) Private benefit: • the pleasure that thousands of visitors get from the displays of lights • revenue accruing to the local authority from voluntary contributions.
External benefit: • additional business for hotels, guest houses and the town • general global awareness of Blackpool as a famous resort.
Social benefit = private benefit + external benefit.
b) Private benefit: • increased profits for Tesco • pleasure gained by users of the new sports centre.
External benefit: • improved sports facilities for people of Huddersfield • local authority can use any money allocated to its sports centre for another purpose • improved urban landscape due to demolition of unsightly flats.
Social benefit = private benefit + external benefit.
Activity pAge 66a) i) National defence is a good example of a public good on account of its high degree of non-rivalry and
non-excludability. ii) The differences in non-excludability are related to the ability and ease with which broadcasters are able
to charge directly for the services they provide.
b) i) Pavements – a public good. ii) Higher education – a merit good in principle, increasingly a private good. iii) Dental services – a merit good in principle, increasingly a private good. iv) The environment – a public good. v) Local bus services – a private good. vi) Old folks’ retirement homes – increasingly a private good.
Apart from pavements and the environment, these examples do not fit easily into the categories as defined in economics.
��
Activity pAge 70Market failure arises because the price that customers pay at London’s lesser theatres is not a true cost of the tickets they purchase. An increase in all West End ticket prices may help to support less commercial theatres; it would, though, mean that prices at more commercial theatres would be above what they should be. A subsidy to fund modernisation would be controversial since only a small section of the community would benefit from the large sums of money that would have to be expended.
Activity pAge 73b) The ban on smoking in public places has reduced the negative externalities from such actions. The air is
cleaner, the ambiance for diners especially is more pleasant and the potential health threats from passive smoking have been reduced. It is, though, difficult to say whether this action has reduced the negative externalities associated with smoking, although evidence would seem to indicate that this is so.
ExamCafé
Quick-fire Quiz1. If all resources are being used then any point on the production curve itself shows the possible combinations of
output. If all resources are not being used then any point within the production possibility curve will also show this.
2. Price of the product, consumer income, the prices of substitutes and complements, tastes and fashion.
3. A firm should raise its price as this will increase revenue. Lowering price is not sensible since revenue will decrease.
4. There is information failure insofar as consumers are not fully or properly aware of their private benefits.
5. Various possibilities including an indirect or green tax, various forms of regulation and control and tradable permits.
exAm prActice Questionsa) i) The cost of the best alternative that is foregone. (The key elements are ‘best alternative’ and the idea of
giving up something else, i.e. ‘foregone’.)
ii) The opportunity cost to the UK economy is: • the alternative use that could be made by the government of the £7.4 billion paid out in incapacity
benefits • Some people claiming incapacity benefit could take on jobs that are currently being taken up by
migrant workers.
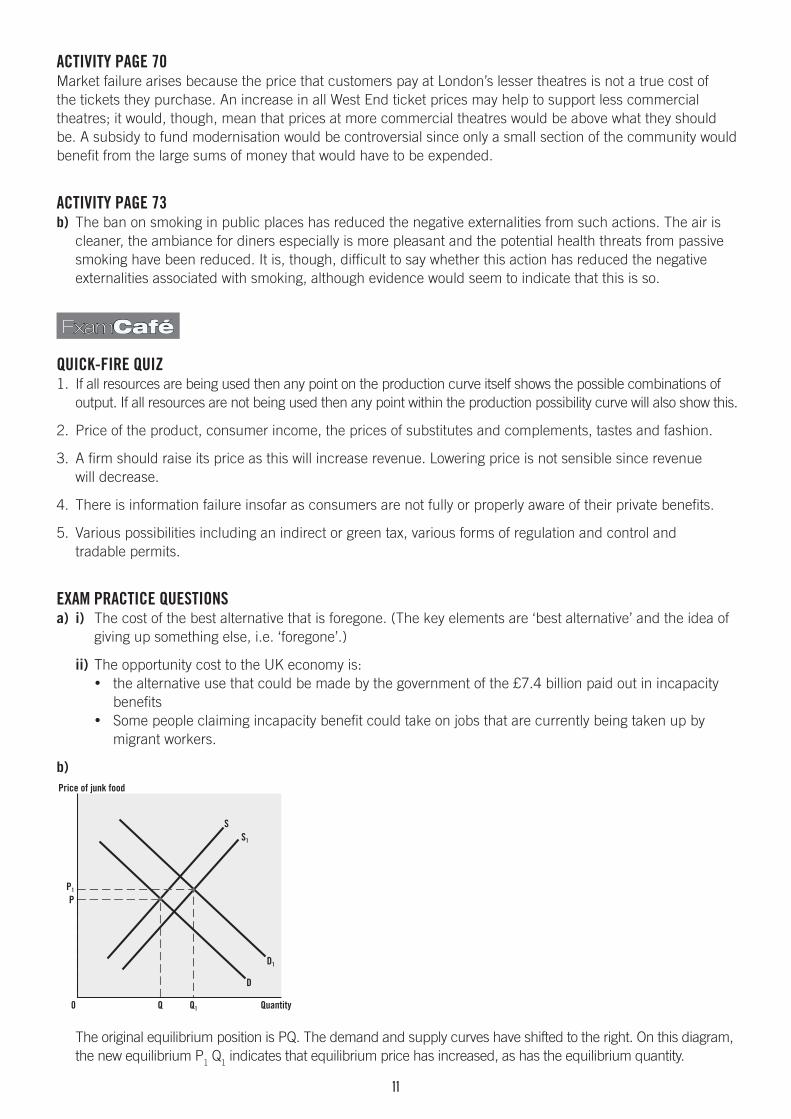
b)Price of junk food
SS1
D
D1
Q1Q Quantity0
PP1
The original equilibrium position is PQ. The demand and supply curves have shifted to the right. On this diagram, the new equilibrium P1 Q1 indicates that equilibrium price has increased, as has the equilibrium quantity.

��
c) i) The demand for a premium-grade hamburger meal and the healthy-meal option are price inelastic. The demand for ice-cream sundaes is elastic. The price elasticity of demand for a hamburger meal is less responsive to a change in price compared with that for the healthy-meal option. The demand for ice-cream sundaes is responsive to a change in price.
ii) The figures have implications for the revenue of a business. There is a good case for increasing the price of a hamburger meal and the healthy-meal option, as the sales/revenue of the fast-food outlet would increase. In the case of the ice-cream sundae, a fall in price will lead to an increase in revenue.
The data are only estimates and should be handled with care. Price may not be the only determinant of demand. There are fewer substitutes for the premium-grade hamburger meal – this ought to be a good product for the business.
d) i) A demerit good is one where, because of information failure, consumers do not properly recognise the harm that can occur through excessive consumption.
ii) Fast food outlets are unlikely to publish nutritional information about their products, especially those with a high fat content. Persuasive advertising is likely to influence demand in a positive manner, not necessarily in the best interests of consumers.
iii) Junk food is a demerit good if it is over-consumed. It can be addictive. Where this is so it could be because consumers do not have adequate information on the fat content of junk food or choose to ignore this information. Consumption in moderation makes junk food a private good.
e)
Price of junk food
S
S1
D
Q1 Q Quantity0
P
P1
The original equilibrium is PQ. Imposing a new indirect tax on junk food will shift the supply curve to the left, to S1. The new equilibrium will be at P1Q1 – the price has increased and the quantity provided has fallen.
f) Indirect taxation is widely used to reduce the consumption of demerit goods. It is simple and cheap to apply. Effectiveness is dependent on the price elasticity of demand for the product. Most demerit goods tend to be price inelastic so the resultant fall in demand of imposing a new tax could be small. Tobacco products and some forms of alcohol are like this.
Regulations and controls – again well used, for example in the case of cigarettes and tobacco, where age limits for consumption apply. There are also considerable controls on where but not when these products can be consumed. The main problems are in setting the right controls and standards, as this is often done in the absence of accurate information. There are also real problems of enforcement – breaches, such as sale of cigarettes and alcohol to under-age people, are difficult to control. Stiff penalties for violations may help.

��
Chapter 4
Activity pAge 84a) Aggregate demand is C + I + G + (X –M). In this case the USA’s AD was $11,688bn.
b) The USA had a trade deficit since the value of its exports was less than the value of its imports. The deficit was $1,171bn – $1,780bn = – $609bn.
Activity pAge 85a) Consumption, also known as consumer expenditure, is spending by households on consumer products.
b) Two from investment, government spending and net exports.
c) A rise in wealth would increase households’ ability to spend. For instance, if the price of shares rises, then shareholders could sell some of their shares or borrow against the value of their shares to buy consumer products. Becoming wealthier is also likely to make households more willing to spend as they will be more confident about the future.
Activity pAge 87a) One possible reason why the UK savings ratio was low in 2007 may have been that UK households were
confident about the future. When people are optimistic they tend to spend a relatively high proportion of their income. (UK consumers were actually feeling more confident at the start of 2007 than at the end of 2007.)
b) i) The Chinese savings ratio may fall if the Chinese government or private sector develop effective pension and medical insurance schemes.
ii) It may rise as Chinese incomes rise. When people become richer they can buy more products and still have even more income left as a proportion of the total that they can save.
Activity pAge 88a) Investment is spending on capital goods by firms whilst consumption is spending on consumer products
by households.
b) There is a positive relationship between business optimism and investment. Firms spend more on capital goods when they are confident that demand for their products will increase in the future.
c) The Indian interest rate is likely to have fallen. Such a change would encourage Indian entrepreneurs to spend more on capital goods.
Activity pAge 89a) The USA. Whilst government spending accounts for a higher proportion of GDP in Canada, the USA is a
much larger economy than China.
b) One factor is whether the government guarantees a health care system open to all, irrespective of income, or just to those unable to afford private health care. Another factor is the average age of the population. An older population places more burden on a health care system as older people tend to have more health problems.
Activity pAge 90a) Germany’s trade position made a positive contribution to the country’s AD. This is because spending on the
country’s products by people living in other countries was greater than Germans’ spending on foreign products.
b) One cause of an increase in exports is a fall in the country’s exchange rate. This is because such a depreciation will lower the price of exports and so make them more price competitive. Another cause is a rise in incomes abroad. If people who are living in other countries become richer, they are likely to buy more products, some of which they may import from the country.
��
Activity pAge 91a) Argentina, since a rise in the price level leads to a fall in AD.
b) Japan. A fall in the prices of Japanese products would make them cheaper relative to other countries’ products.
Activity pAge 92a) This means that the extent to which import expenditure exceeded export revenue increased. So, adding
net exports to total demand reduced AD by an increasing amount.
b) Investment.
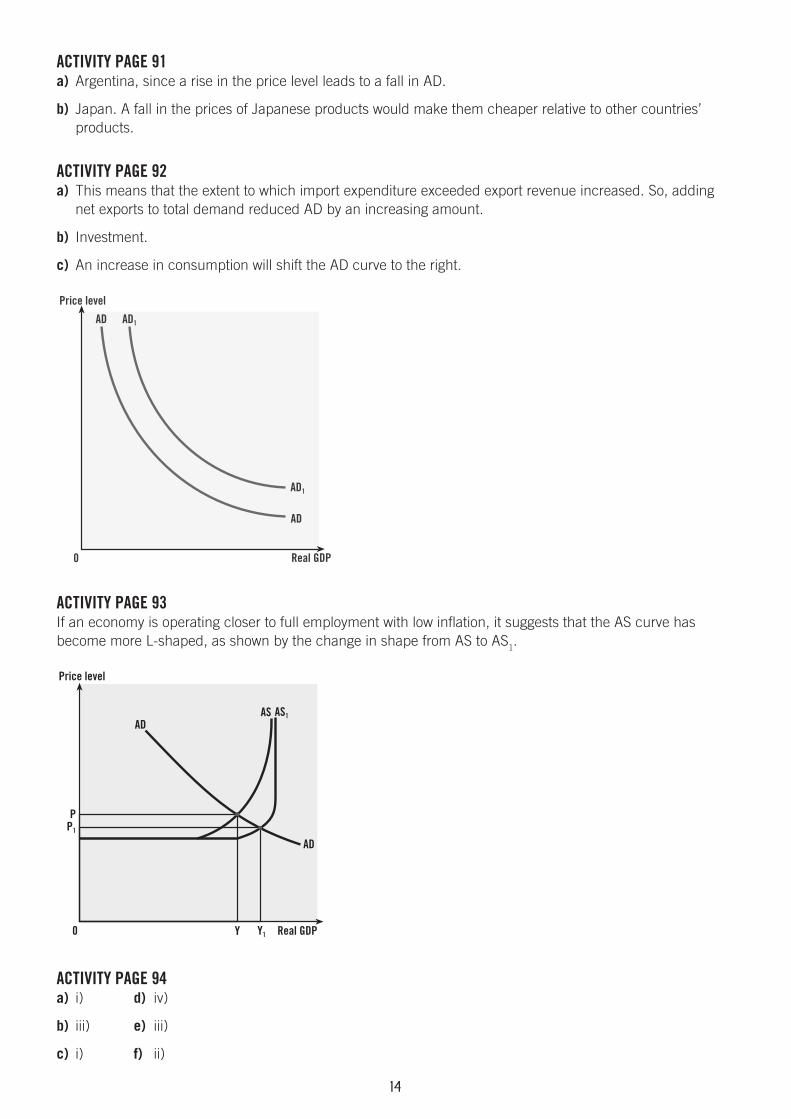
c) An increase in consumption will shift the AD curve to the right.
Price level
Real GDP
AD
AD AD1
AD1
0
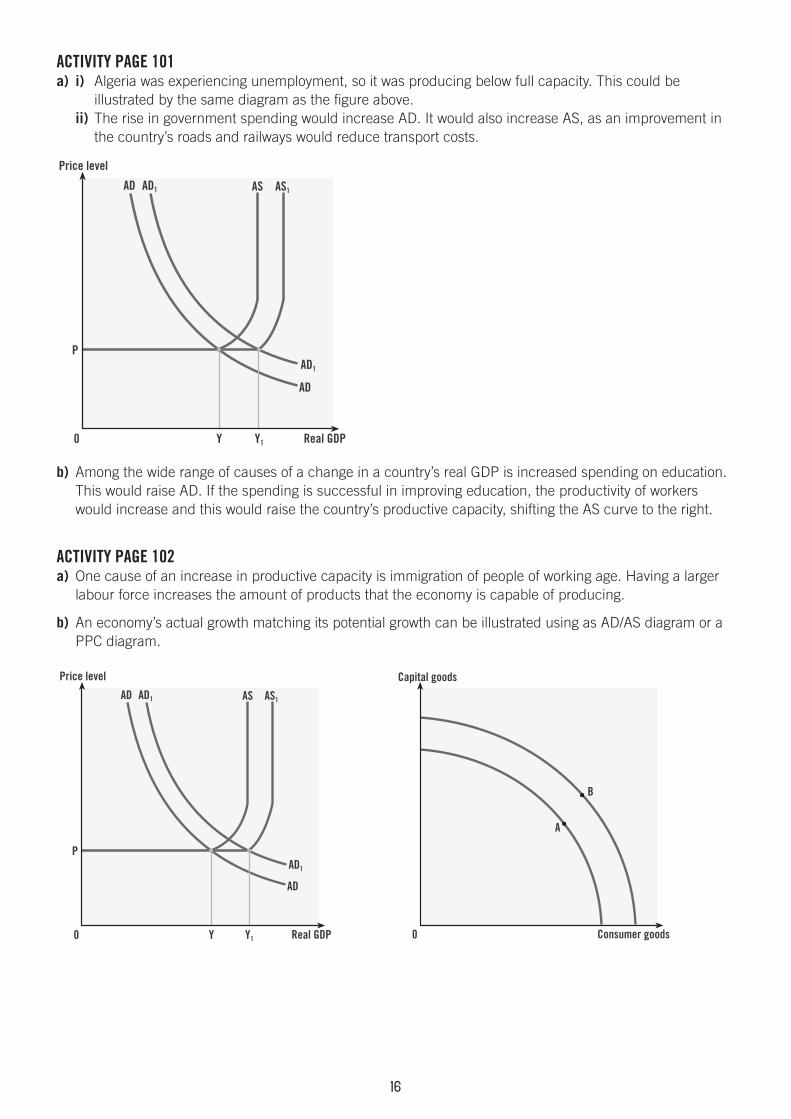
Activity pAge 93If an economy is operating closer to full employment with low inflation, it suggests that the AS curve has become more L-shaped, as shown by the change in shape from AS to AS1.
Price level
ADAS
AD
AS1
Real GDP0
PP1
Y1Y
Activity pAge 94a) i) d) iv)
b) iii) e) iii)
c) i) f) ii)

��
Activity pAge 95a) The economy is not in macro-economic equilibrium as AS exceeds AD.
b) The surplus of AS over AD will drive down the price level until the two are equal.
Activity pAge 97a) Imports are a leakage from the circular flow. This is because spending on imports takes income out of
the economy.
b) M exceeding X would reduce real GDP. If real GDP is nevertheless increasing, it must mean that injections are greater than leakages. So I + G must be greater than S + T.
Activity pAge 98a) The government would have to increase its spending by £150bn/2.5 = £60bn.
b) The multiplier would be £12bn/£8bn = 1.5.
Activity pAge 99a) A fall in the rate of interest would be likely to increase AD. This is because it is likely to stimulate
consumption as borrowing would be cheaper, saving would be less financially rewarding and borrowers would have more money to spend after paying interest on past loans. Investment would be expected to increase as again borrowing is cheaper, saving profit in financial institutions would be less rewarding and entrepreneurs would expect demand for their products to rise. Net exports may also increase. A lower interest rate may discourage people from buying the currency to place in the country’s financial institutions and so reduce the exchange rate. A lower exchange rate reduces export prices whilst raising import prices. This should increase demand for exports whilst reducing demand for imports.
b) The emigration of young people from the country will mean that there will be fewer people in the country to buy goods and services. A rise in taxes would reduce people’s ability to buy products. For instance, higher income tax lowers people’s disposable income and an increase in corporation tax will reduce firms’ ability and willingness to invest.
Activity pAge 100a) The passage suggests that not all of China’s productive capacity is being used.
Price level
Real GDP
AS
AD
AD
0
P
Y YFe
b) An important factor that could encourage firms to expand is the expectation that demand for their products will rise in the future. If they anticipate higher sales they may buy more capital goods. Another factor is advances in technology. More advanced equipment is likely to produce better quality products at lower unit cost.
��
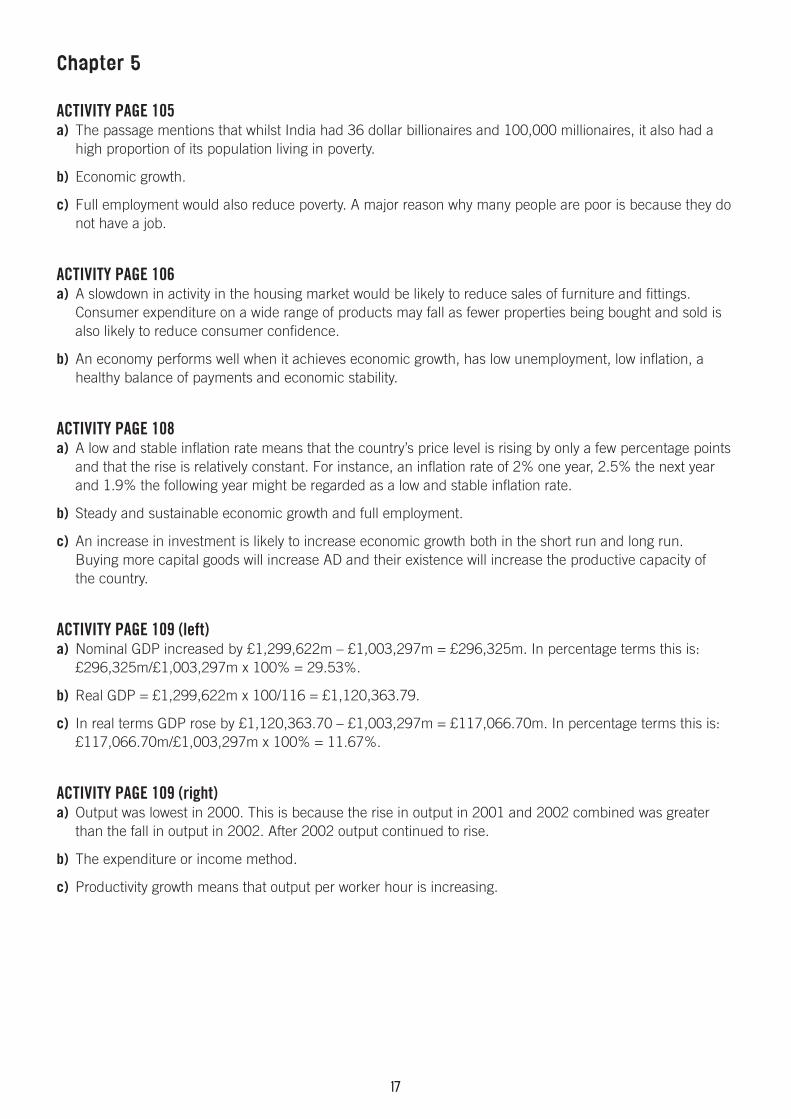
Activity pAge 101a) i) Algeria was experiencing unemployment, so it was producing below full capacity. This could be
illustrated by the same diagram as the figure above. ii) The rise in government spending would increase AD. It would also increase AS, as an improvement in
the country’s roads and railways would reduce transport costs.
Price level
Real GDP
AS AS1
AD
AD AD1
AD1
0
P
Y Y1
b) Among the wide range of causes of a change in a country’s real GDP is increased spending on education. This would raise AD. If the spending is successful in improving education, the productivity of workers would increase and this would raise the country’s productive capacity, shifting the AS curve to the right.
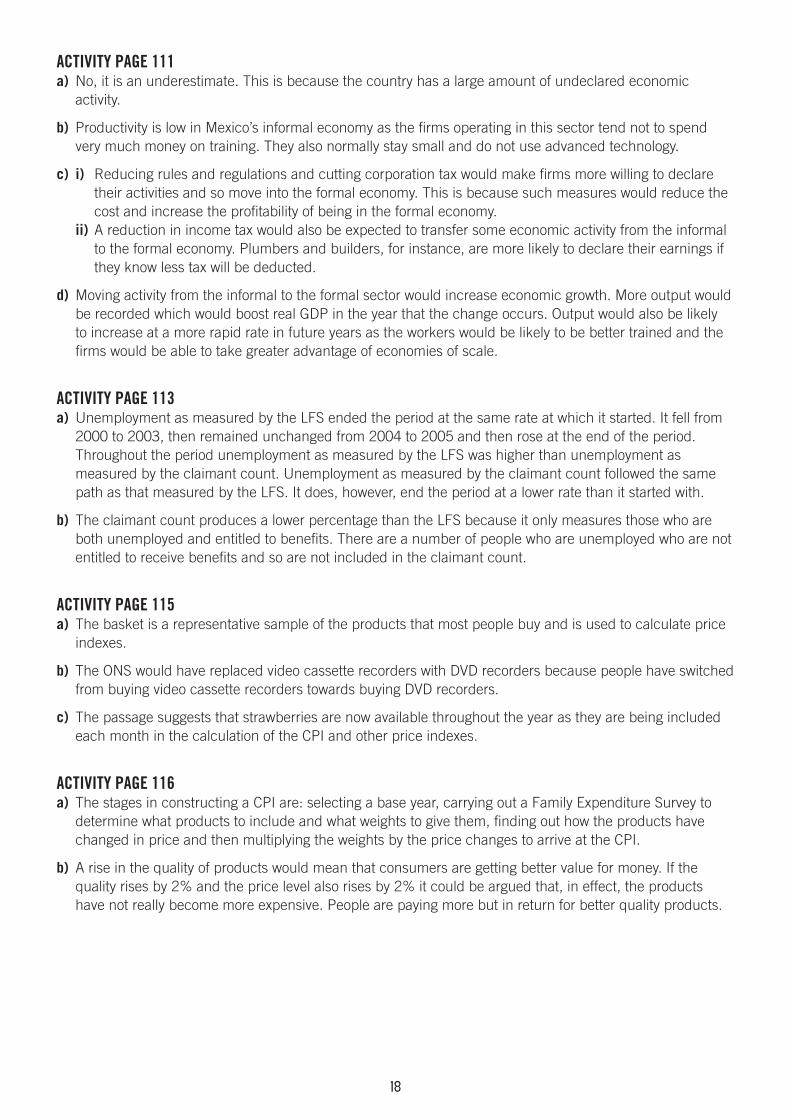
Activity pAge 102a) One cause of an increase in productive capacity is immigration of people of working age. Having a larger
labour force increases the amount of products that the economy is capable of producing.
b) An economy’s actual growth matching its potential growth can be illustrated using as AD/AS diagram or a PPC diagram.
Capital goods
Consumer goods0
Price level
Real GDP
AS AS1
A
B
AD
AD AD1
AD1
0
P
Y Y1
��
Chapter 5
Activity pAge 105a) The passage mentions that whilst India had 36 dollar billionaires and 100,000 millionaires, it also had a
high proportion of its population living in poverty.
b) Economic growth.
c) Full employment would also reduce poverty. A major reason why many people are poor is because they do not have a job.
Activity pAge 106a) A slowdown in activity in the housing market would be likely to reduce sales of furniture and fittings.
Consumer expenditure on a wide range of products may fall as fewer properties being bought and sold is also likely to reduce consumer confidence.
b) An economy performs well when it achieves economic growth, has low unemployment, low inflation, a healthy balance of payments and economic stability.
Activity pAge 108a) A low and stable inflation rate means that the country’s price level is rising by only a few percentage points
and that the rise is relatively constant. For instance, an inflation rate of 2% one year, 2.5% the next year and 1.9% the following year might be regarded as a low and stable inflation rate.
b) Steady and sustainable economic growth and full employment.
c) An increase in investment is likely to increase economic growth both in the short run and long run. Buying more capital goods will increase AD and their existence will increase the productive capacity of the country.
Activity pAge 109 (left)a) Nominal GDP increased by £1,299,622m – £1,003,297m = £296,325m. In percentage terms this is:
£296,325m/£1,003,297m x 100% = 29.53%.
b) Real GDP = £1,299,622m x 100/116 = £1,120,363.79.
c) In real terms GDP rose by £1,120,363.70 – £1,003,297m = £117,066.70m. In percentage terms this is: £117,066.70m/£1,003,297m x 100% = 11.67%.
Activity pAge 109 (right)a) Output was lowest in 2000. This is because the rise in output in 2001 and 2002 combined was greater
than the fall in output in 2002. After 2002 output continued to rise.
b) The expenditure or income method.
c) Productivity growth means that output per worker hour is increasing.
��
Activity pAge 111a) No, it is an underestimate. This is because the country has a large amount of undeclared economic
activity.
b) Productivity is low in Mexico’s informal economy as the firms operating in this sector tend not to spend very much money on training. They also normally stay small and do not use advanced technology.
c) i) Reducing rules and regulations and cutting corporation tax would make firms more willing to declare their activities and so move into the formal economy. This is because such measures would reduce the cost and increase the profitability of being in the formal economy.
ii) A reduction in income tax would also be expected to transfer some economic activity from the informal to the formal economy. Plumbers and builders, for instance, are more likely to declare their earnings if they know less tax will be deducted.
d) Moving activity from the informal to the formal sector would increase economic growth. More output would be recorded which would boost real GDP in the year that the change occurs. Output would also be likely to increase at a more rapid rate in future years as the workers would be likely to be better trained and the firms would be able to take greater advantage of economies of scale.
Activity pAge 113a) Unemployment as measured by the LFS ended the period at the same rate at which it started. It fell from
2000 to 2003, then remained unchanged from 2004 to 2005 and then rose at the end of the period. Throughout the period unemployment as measured by the LFS was higher than unemployment as measured by the claimant count. Unemployment as measured by the claimant count followed the same path as that measured by the LFS. It does, however, end the period at a lower rate than it started with.
b) The claimant count produces a lower percentage than the LFS because it only measures those who are both unemployed and entitled to benefits. There are a number of people who are unemployed who are not entitled to receive benefits and so are not included in the claimant count.
Activity pAge 115a) The basket is a representative sample of the products that most people buy and is used to calculate price
indexes.
b) The ONS would have replaced video cassette recorders with DVD recorders because people have switched from buying video cassette recorders towards buying DVD recorders.
c) The passage suggests that strawberries are now available throughout the year as they are being included each month in the calculation of the CPI and other price indexes.
Activity pAge 116a) The stages in constructing a CPI are: selecting a base year, carrying out a Family Expenditure Survey to
determine what products to include and what weights to give them, finding out how the products have changed in price and then multiplying the weights by the price changes to arrive at the CPI.
b) A rise in the quality of products would mean that consumers are getting better value for money. If the quality rises by 2% and the price level also rises by 2% it could be argued that, in effect, the products have not really become more expensive. People are paying more but in return for better quality products.
��
Activity pAge 117a) The current account position includes the trade in goods, trade in services, income and current transfers.
In this case trade in goods, income and current transfers are –£83,631m + £18,555m – £6,759m = £47,781m. So trade in services was –£71,835m + ? = –£47,781m. So trade in services = £24,054m.
b) Another section of the balance of payments is the capital and financial accounts.
Activity pAge 118a) The Indian economy is not working at full capacity. The passage indicates that a high proportion of the
country’s city slum dwellers are unemployed. If these people were working, the country would be making more use of its resources and would be producing more goods and services.
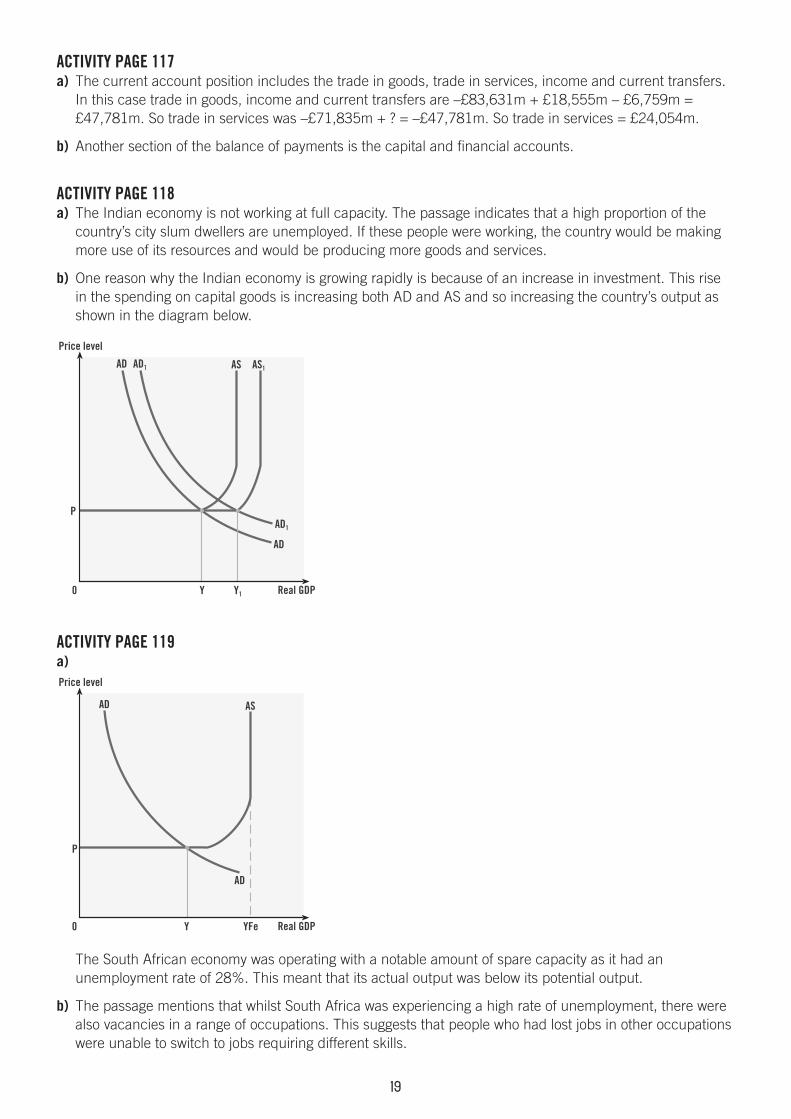
b) One reason why the Indian economy is growing rapidly is because of an increase in investment. This rise in the spending on capital goods is increasing both AD and AS and so increasing the country’s output as shown in the diagram below.
Price level
Real GDP
AS AS1
AD
AD AD1
AD1
0
P
Y Y1
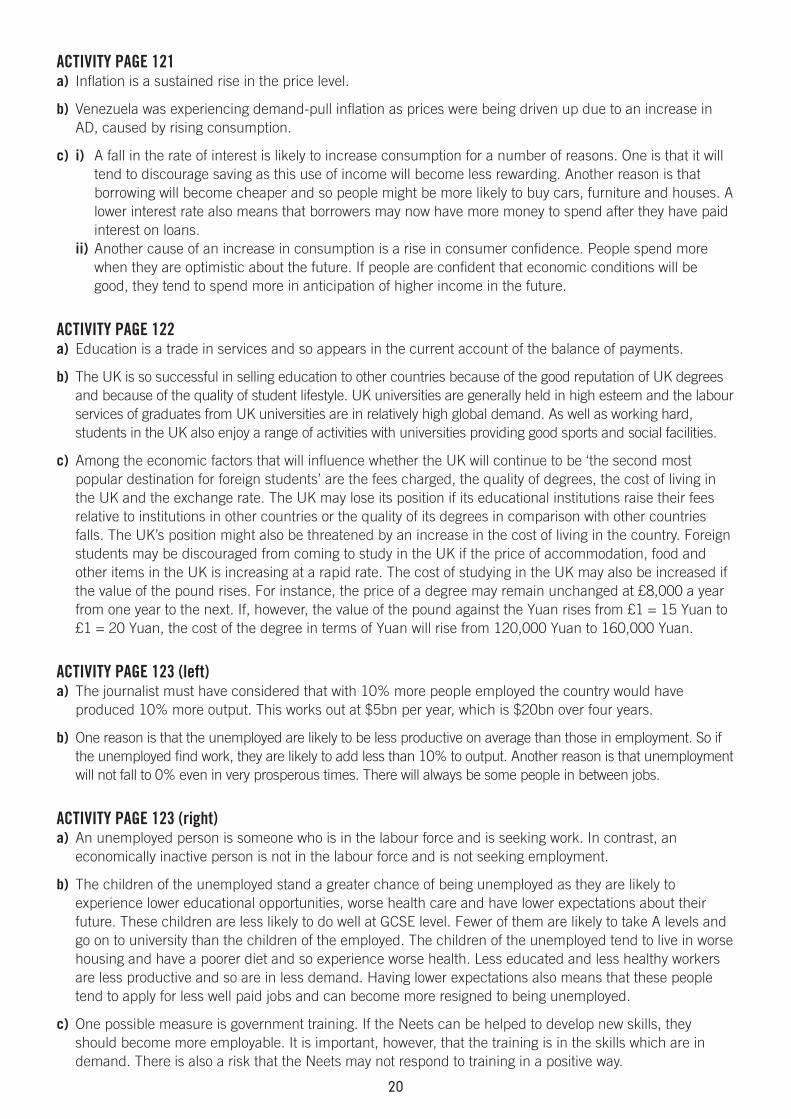
Activity pAge 119a)Price level
Real GDP
AS
AD
AD
0
P
Y YFe
The South African economy was operating with a notable amount of spare capacity as it had an unemployment rate of 28%. This meant that its actual output was below its potential output.
b) The passage mentions that whilst South Africa was experiencing a high rate of unemployment, there were also vacancies in a range of occupations. This suggests that people who had lost jobs in other occupations were unable to switch to jobs requiring different skills.
�0
Activity pAge 121a) Inflation is a sustained rise in the price level.
b) Venezuela was experiencing demand-pull inflation as prices were being driven up due to an increase in AD, caused by rising consumption.
c) i) A fall in the rate of interest is likely to increase consumption for a number of reasons. One is that it will tend to discourage saving as this use of income will become less rewarding. Another reason is that borrowing will become cheaper and so people might be more likely to buy cars, furniture and houses. A lower interest rate also means that borrowers may now have more money to spend after they have paid interest on loans.
ii) Another cause of an increase in consumption is a rise in consumer confidence. People spend more when they are optimistic about the future. If people are confident that economic conditions will be good, they tend to spend more in anticipation of higher income in the future.
Activity pAge 122a) Education is a trade in services and so appears in the current account of the balance of payments.
b) The UK is so successful in selling education to other countries because of the good reputation of UK degrees and because of the quality of student lifestyle. UK universities are generally held in high esteem and the labour services of graduates from UK universities are in relatively high global demand. As well as working hard, students in the UK also enjoy a range of activities with universities providing good sports and social facilities.
c) Among the economic factors that will influence whether the UK will continue to be ‘the second most popular destination for foreign students’ are the fees charged, the quality of degrees, the cost of living in the UK and the exchange rate. The UK may lose its position if its educational institutions raise their fees relative to institutions in other countries or the quality of its degrees in comparison with other countries falls. The UK’s position might also be threatened by an increase in the cost of living in the country. Foreign students may be discouraged from coming to study in the UK if the price of accommodation, food and other items in the UK is increasing at a rapid rate. The cost of studying in the UK may also be increased if the value of the pound rises. For instance, the price of a degree may remain unchanged at £8,000 a year from one year to the next. If, however, the value of the pound against the Yuan rises from £1 = 15 Yuan to £1 = 20 Yuan, the cost of the degree in terms of Yuan will rise from 120,000 Yuan to 160,000 Yuan.
Activity pAge 123 (left)a) The journalist must have considered that with 10% more people employed the country would have
produced 10% more output. This works out at $5bn per year, which is $20bn over four years.
b) One reason is that the unemployed are likely to be less productive on average than those in employment. So if the unemployed find work, they are likely to add less than 10% to output. Another reason is that unemployment will not fall to 0% even in very prosperous times. There will always be some people in between jobs.
Activity pAge 123 (right)a) An unemployed person is someone who is in the labour force and is seeking work. In contrast, an
economically inactive person is not in the labour force and is not seeking employment.
b) The children of the unemployed stand a greater chance of being unemployed as they are likely to experience lower educational opportunities, worse health care and have lower expectations about their future. These children are less likely to do well at GCSE level. Fewer of them are likely to take A levels and go on to university than the children of the employed. The children of the unemployed tend to live in worse housing and have a poorer diet and so experience worse health. Less educated and less healthy workers are less productive and so are in less demand. Having lower expectations also means that these people tend to apply for less well paid jobs and can become more resigned to being unemployed.
c) One possible measure is government training. If the Neets can be helped to develop new skills, they should become more employable. It is important, however, that the training is in the skills which are in demand. There is also a risk that the Neets may not respond to training in a positive way.

��
Activity pAge 124a) Germany and France both had high rates of unemployment, whilst Japan’s, UK’s and USA’s
unemployment rates were close to full employment.
b) Unemployment rose in Germany, Japan and the USA whilst it fell in France and the UK. The changes in unemployment in each country were relatively small.
c) There were more people unemployed in the USA than in France. This is because whilst the USA had a lower percentage than France, it has a much larger labour force.
Activity pAge 126a) When people are unemployed they are likely to eat a poorer diet and may not be able to afford to send
their children to school. Even if state education is provided free, there may be a range of costs involved in sending children to school. These include transport costs, possibly costs of books and an opportunity cost – children cannot be earning or helping in the family business or at home.
b) The passage refers to Zimbabwe experiencing a very high rate of unemployment, with more than half its labour force being jobless, and a high rate of emigration. The first feature would mean that the country is producing well inside its PPC. The second feature indicates that the country’s PPC has shifted to the left and will shift further if the emigration continues. These two features are shown in the figure below.
Capital goods
Consumer goods
Production point
0
Activity pAge 130a) i) Teachers’ purchasing power fell in 2007 as their pay rose by less than the rate of inflation. They would
not have been able to buy as much in 2007 as they were able to in 2006. ii) Teachers’ purchasing power would be determined by how much their pay rose in relation to inflation.
If their pay rose by more than the inflation rate in 2008, they would have experienced a rise in their purchasing power.
b) If a country’s price level is rising at a more rapid rate than its competitors’, its firms will find it more difficult to sell their products to other countries.
Activity pAge 131a) Exports are products sold to other countries whereas imports are products bought from other countries.
b) ‘Australia growing more rapidly than its trading partners’ would mean that incomes would have been rising at a more rapid rate in Australia than in other countries. This is likely to have meant that Australians’ rise in demand for imports would have been greater than foreigners’ increase in demand for Australian products. This would have increased the country’s current account deficit.
c) A current account deficit makes a negative contribution to aggregate demand. This may mean that AD is less than the maximum amount that the economy is capable of producing. In this case, actual output will be lower than potential output.

��
Activity pAge 132a) The passage mentions investment and exports.
b) The passage mentions that, while poverty has been reduced, income inequality has increased. This indicates that the gap between the rich and the poor has widened.
Activity pAge 135a) The information indicates that the value of the Singapore dollar has increased. This means that less
Singaporean money had to be given in exchange for a US dollar.
b) The Singaporean economy was booming. This is likely to have caused the demand for the country’s currency to rise for two reasons. One is that more FDI would have been attracted as foreign firms would have expected to do well by operating in the country. The other reason is that speculators are likely to have bought the currency, expecting it to rise in the future.
Activity pAge 136a) ‘The Canadian dollar rose in price against the US dollar’ means that a Canadian dollar would now be
exchanged for more US currency.
b) An increase in Canada’s current account surplus would probably mean that demand for exports exceeds demand for imports. This would mean that demand for the Canadian currency would be rising. Foreigners would be buying more Canadian dollars to buy Canadians products than Canadians would be selling their dollars to buy foreign currency.
c) Some Canadians felt a sense of pride when the loonie reached parity with the dollar. Canadians who travel abroad and firms which buy imported raw materials would have been pleased as the rise in the value of the loonie would have reduced the cost of their journeys and costs of production. In contrast, exporters would have been disappointed by the rise as it would have made their products less competitive abroad. Firms competing with finished imported products in the home market would also have experienced a decrease in their price competitiveness.
Activity pAge 137a) A depreciation is a fall in the value of a currency caused by market forces.
b) One cause could be a decrease in demand for the country’s exports. This would cause a fall in demand for the currency and so its value would decrease.
c) A depreciation would reduce the price of exports and raise the price of imports. This is likely to result in a rise in net exports and so a rise in AD. If there is spare capacity in the economy, higher AD will lead to an increase in real GDP and so actual economic growth will occur.

��
Chapter 6
Activity pAge 140a) To raise revenue and to discourage consumption of the product.
b) The Chinese government is likely to raise more tax revenue in the future as Chinese income will increase. As the Chinese become richer, there will be more income and more spending to tax.
c) The changes in taxes are likely to make income more evenly distributed. This is because new taxes have been placed on products bought mainly by the rich whilst taxes on products which are now regarded as necessities have been removed.
Activity pAge 141a) The passage suggests that the size of Italy’s informal economy declined in 2007. This is because the
Italian government thought that approximately half the increase in the tax revenue it received was due to a decrease in tax evasion.
b) There is a direct positive relationship between the two. As economic growth occurs, tax revenue will increase. When the country produces more, income will be higher and so more tax revenue will be received. An expanding economy also usually means higher profits and so more corporation tax. In addition tax revenue will also increase as higher income will generate more spending.
c) The Italian government may have raised the top rate of income tax in order to receive more tax revenue and to make the distribution of income more even. Taking a higher percentage of the income of the rich will raise tax revenue as long as it does not act as a disincentive to work and effort. Increasing the top rate of tax will make the tax system more progressive and will narrow the gap between the rich and the poor.
Activity pAge 142a) Government spending in cash terms is the amount the government spends in the prices of the year in
question. In contrast, government spending in real terms is government spending in constant prices that are adjusted for inflation.
b) i) An increase in government spending on health care will, in itself, increase AD. Government spending is a component of AD.
ii) If the increase in spending on health care makes workers fitter it will increase labour productivity. Higher labour productivity will increase productive capacity and so shift the AS curve to the right.
c) i) UK planned government spending on defence was 5.45 per cent of total government spending in 2007–08. This is considerably below the USA’s spending in percentage terms.
ii) Having more weapons and more people in the armed forces in itself may or may not increase people’s living standards. It will depend on whether it makes people feel safer or not. An increase in government spending on defence, by increasing demand, however, may increase output and employment. Such an effect would increase people’s material living standards.

��
Activity pAge 143a) Germany and Norway both had a budget surplus in 2007.
b) A cut in corporation tax would increase the profit that firms can keep. This would be likely to lead to an increase in investment. Higher investment would increase both AD and AS as shown in the figure below.
Price level
Real GDP
AS AS1
AD
AD AD1
AD1
0
P
Y Y1
c) A cut in corporation tax is likely to increase a budget deficit in the short run as the government will receive less tax revenue. In the long run, however, it could reduce a budget deficit. This is because the cut could stimulate a rise in real GDP. If firms do expand their output, employment, income and spending will rise, which will bring in more tax revenue.
Activity pAge 145a) In October 2007 Sweden and India were pursuing a deflationary monetary policy. Sweden’s central bank
was raising the country’s interest rate and India’s central bank was reducing the growth of the money supply. Both measures are designed to reduce aggregate demand.
b) i) The Swedish inflation rate might have risen because unemployment was falling in the country. A reduction in unemployment would be increasing AD and may have been increasing the inflation rate.
ii) A reduction in economic growth in the USA, one of Sweden’s main trading partners, may have been slowing down the rise in net exports and so reducing demand-pull inflation.
c) Sweden was seeking to achieve the lowest rise in the price level as it had the lowest inflation rate.
Activity pAge 147a) Assessing people to see if they can work and providing financial incentives to encourage lone parents to
undertake training courses or work experience are supply-side policies as they seek to increase the size of the labour force. Some who are sick, disabled and lone parents are economically inactive. If these can be brought into the labour force, the country will be capable of producing more goods and services.
b) Someone may be reluctant to come off benefits because s/he may be afraid that even if there is work available, the pay may be lower than the benefit currently being received. Another reason is that the person may be concerned that s/he may not be able to cope with working.
c) An increase in training financed by the government would increase government spending. The government would be spending more on the training schemes. If the training schemes are successful in getting people back to work, government spending on benefits will fall.

��
Activity pAge 149a) By discouraging early retirement of public sector workers, the French government may increase the supply
of the French labour force. If it does so, the country’s productive potential will increase as illustrated by a shift to the right of the AS curve.
Price level
Real GDP
AS AS1
AD
AD
0
PP1
Y Y1
b) A cut in unemployment benefit would reduce unemployment if it encourages the unemployed to seek work more actively and if there is work available. If, however, the unemployment is of a cyclical or structural nature, there may be no jobs or the jobs available may not match the skills of the unemployed or may be in different parts of the country. In this case reducing unemployment benefit would reduce aggregate demand, as the unemployed would have lower incomes and would not be able to spend as much. The lower AD would increase unemployment.
Activity pAge 151a) The inflation was largely cost-push. The price of food was driven up by the increased cost of
producing food.
b) i) The poor particularly need help with rising food prices as they spend a higher proportion of their income on food and they have less income.
ii) The weighting is likely to fall. This is because, as people’s income rises, they spend proportionally less on food.
c) The Chinese’s inflation target differs from the UK’s in two respects. One is that it is slightly higher – by 1 percentage point. The other is that China’s target is asymmetrical whereas the UK’s is symmetrical. This means that while China sets an upper limit, the UK has a central limit with a 1 per cent margin either side.
d) i) The subsidies given to farmers to raise pigs is designed to reduce cost-push inflation. Such subsidies should help to offset rises in costs of production and keep prices down.
ii) A rise in the rate of interest would be likely to reduce AD. Consumption and investment are likely to fall as saving would become more rewarding, borrowing would be more expensive. Net exports may decline as a higher interest rate may attract hot money flows which will push up the exchange rate, making the country’s exports less price competitive. Lower AD would reduce demand–pull inflation.
Activity pAge 152a) Economic growth is measured as a percentage change in real GDP.
b) Denmark’s output grew in 2007 but at a slower rate than in 2006.
c) Cutting the top rate of income tax may provide an incentive for highly paid workers and increase their disposable income. The first effect, by encouraging more enterprise and effort, may increase AS and the second effect is likely to increase AD. Allowing more immigrant workers into the country would also increase AD and AS. Raising AD and AS should increase both actual and potential output.

��
Activity pAge 154a) A change from a budget deficit to a budget surplus will reduce aggregate demand. For instance, a rise in
taxation would reduce people’s disposable income. This would reduce spending, including spending on imports. A reduction in import expenditure would reduce a current account deficit.
b) Labour productivity and export competitiveness are directly linked. A rise in labour productivity would reduce the costs of production and raise the quality of products made. This would result in a rise in price competitiveness and quality competitiveness.
c) A rise in government spending on training could increase the skills and adaptability of workers. This should increase the output per worker hour.
Activity pAge 155a) A cut in US corporate tax rate would effectively reduce firms’ costs and this may encourage them to invest
in more advanced technology. Both effects would enable US firms to sell their products at a lower price.
b) Firms might prefer to locate in the USA rather than the UK, despite the USA’s higher corporate tax rate, because of a more skilled labour force and because of government subsidies.
c) A cut in the corporate tax rate is likely to reduce tax revenue in the short run. In the long run, however, a lower corporate tax may increase tax revenue if it encourages firms to expand their output. Such an expansion may increase corporate, income and indirect tax revenue.
Activity pAge 157a) Mexico’s inflation target is slightly higher than the UK’s.
b) The poor may be particularly hard hit by inflation because their money income does not tend to rise in line with inflation. So their real income normally falls. The poor may be living on benefits which do not tend to keep pace with inflation. If they are working, they are likely to have low bargaining power, as again their wages do not tend to rise at the same rate as inflation.
c) A rise in the rate of interest may cause a slowdown in economic growth as it may reduce the growth of both AD and AS. The increase in AD may be reduced as a higher interest rate may reduce consumption, investment and net exports – all components of AD. Households may save more and borrow less. Net exports may fall due to the exchange rate rising as foreigners buy more pounds to place into UK financial institutions. Firms would find it more expensive to borrow to buy capital goods and instead may save their money. If the growth of investment is reduced, the growth of productive potential will also slow down.
d) Another policy instrument that may be used to reduce inflation is a rise in income tax rates. This measure would lower people’s disposable income, which in turn may reduce consumer expenditure. Such a fall in consumer expenditure could reduce demand-pull inflation. There is a chance, however, that if consumer confidence is high, people may continue to spend the same amount – by reducing the amount they save. There is also the possibility that a rise in income tax rates may reduce the incentive to work.
Activity pAge 158a) The FOMC meets less often than the MPC and does not have a formal inflation rate target.
b) A cut in the interest rate could reduce cyclical unemployment. This is because a lower interest rate should stimulate a rise in AD with C + I + (X – M) increasing. Higher AD should encourage firms to expand their output and take on more workers.
c) The FOMC’s cut in interest rate in September 2007 might have achieved its objectives. This is because a lower interest rate should have increased AD and so raised employment. A lower interest rate should also have encouraged more borrowing and so more bank lending. If, however, consumer and business confidence was low, households and firms may not have increased their borrowing and spending.
��
Activity pAge 160a) i) Imports from India in January 2007 were £257,548m + 28.3% = £257,548m + £72,886m =
£330,434m. ii) The UK’s trade in goods balance in January 2007 was £230,523m – £330,434m = –£99,911m.
b) The UK may import textiles from Indian firms because they are cheaper than those sold by domestic producers and producers in other countries. Another reason is that Indian textiles may be of a higher quality than can be found elsewhere.
c) India may appear in the top ten destinations of UK exports in the future because of rising incomes in India and because of developing ties between the two countries. India is experiencing rapid growth. The resulting rise in income means that India is becoming a significant importer. Ties between the UK and India are being strengthened by more Indian investment coming into the UK and more UK investment in India.
Activity pAge 161a) The export of Scotch whisky probably increased because of a rise in income in the product’s traditional
markets and a spread of sales to new markets.
b) The passage does not mention either Europe or Africa experiencing a rise in sales of Scotch whisky.
c) A rise in the sales of Scotch whisky increases output and employment in Scotland. There would be a direct increase in the output and employment in the industry but also a knock on (multiplier effect) on the rest of the economy. Output and employment will increase in related industries, as more components will be demanded, and in other industries as incomes and spending rises.
d) An increase in the sales of Scotch whisky would in itself reduce the UK’s current account deficit by increasing export revenue. But this current account deficit may not be reduced if export revenue from other products falls or if import expenditure rises by more than the increase in export revenue from the sales of Scotch whisky.
Activity pAge 162a) An annual growth rate of 10 per cent means that the country’s output as measured by real GDP increased
by 10 per cent.
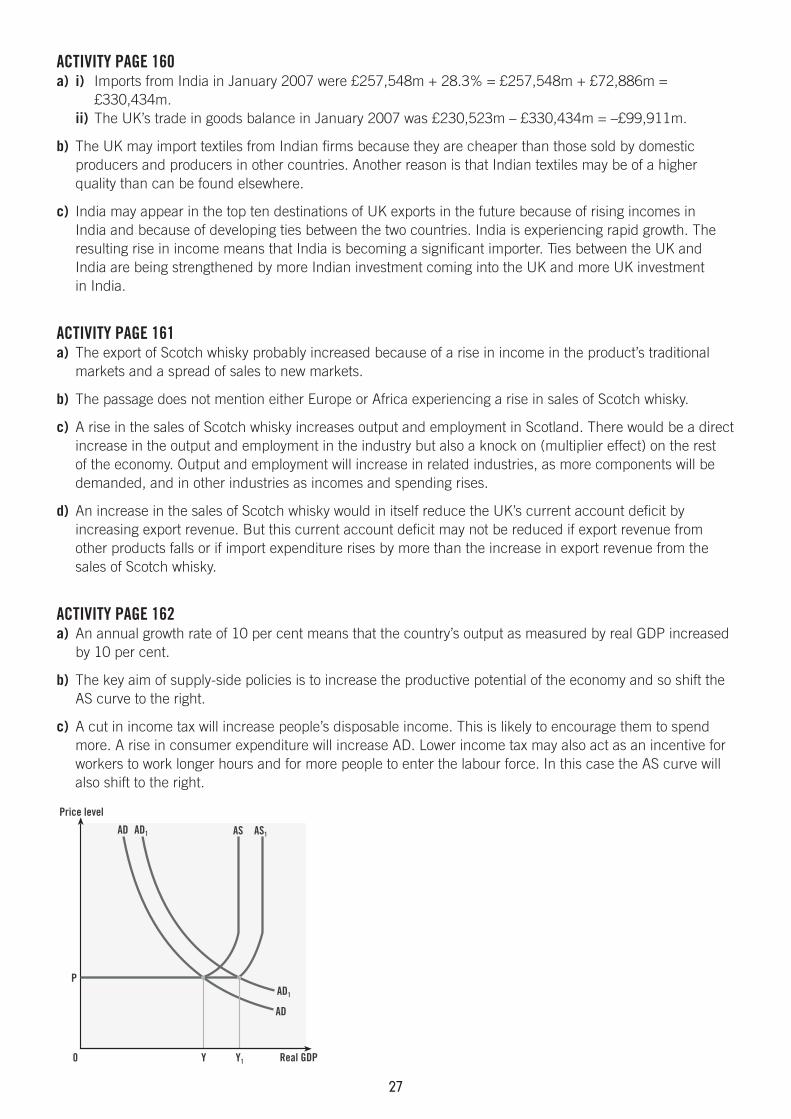
b) The key aim of supply-side policies is to increase the productive potential of the economy and so shift the AS curve to the right.
c) A cut in income tax will increase people’s disposable income. This is likely to encourage them to spend more. A rise in consumer expenditure will increase AD. Lower income tax may also act as an incentive for workers to work longer hours and for more people to enter the labour force. In this case the AS curve will also shift to the right.
Price level
Real GDP
AS AS1
AD
AD AD1
AD1
0
P
Y Y1
��
The diagram shows both an increase in AD and AS. These movements cause an increase in real GDP. If AS rises in line with AD, the price level will remain unchanged.
d) The information suggests that a cut in taxation has led to an increase in tax revenue as the cut has stimulated a rise in economic activity.
e) i) An embargo is a ban on the import of a product or on the import of products from a particular country. ii) Tariffs and quotas.f) i) An appreciation of the currency may reduce both demand-pull and cost-push inflation. A rise in the
exchange rate increases export prices and lowers import prices. These changes may result in a fall in net exports and so a fall in AD.
Lower imported raw material prices will reduce firms’ costs of production. The lower prices of imports will also put more competitive pressure on domestic producers to keep their prices low.
ii) The consequences of inflation will depend on its cause, the rate of inflation, whether it was anticipated or not and whether it is stable.
Cost-push inflation tends to be more harmful than demand-pull inflation. Firms facing higher costs of production may cut back on their output. So cost-push inflation can be accompanied by a fall in real GDP and a rise in unemployment. In contrast, a low rate of demand-pull inflation may stimulate a rise in production and employment.
Whilst a low rate of inflation may be beneficial for an economy, a high rate is likely to be harmful. If it is higher than the rate prevailing in its trading partners, the country’s products will become less price competitive. This might worsen its current account position. A high rate also increases menu and shoe leather costs. Firms will have to change their prices more frequently and both firms and households will have to move money around in search of the highest interest rate.
Hyperinflation will be particularly damaging. If the inflation rate is above 50 per cent, there will be considerable costs. Inflationary noise, for instance, will be particularly severe with firms and households finding it difficult to make the most efficient choices of what products to produce, what products to buy and what jobs to take.
Unanticipated and unstable inflation can also cause major problems. If the inflation is unexpected it means that the government, firms and households will not have time to adjust. Fiscal drag may occur with people being dragged into higher tax brackets. There is likely to be a redistribution of income from savers to borrowers. This is because the nominal rate of interest does not tend to move in line with inflation and so the real rate of interest falls. State benefits may also not rise with inflation and so the unemployed, for instance, may experience a fall in their real income. Those workers with weak bargaining power are also likely to lose out.
A fluctuating rate of inflation makes it more difficult for the government, firms and households to predict the future. This creates uncertainty. One of the costs of such uncertainty is that it raises firms’ administrative costs. They have to devote more time and effort to estimating what inflation will be and making the necessary adjustments to prices. A potentially more significant cost is the discouragement of investment. If firms invest less because they are unsure about future costs and prices, the economic growth rate of the country will slow down.
Despite the potential costs of inflation, governments do not aim for zero inflation. They regard price stability as a low and stable rate of inflation. This is, in part, because measures of inflation tend to overstate price rises. It is also because, as previously mentioned, a low rate of demand-pull inflation can stimulate production.

��
ExamCafé
Quick-fire Quiz1. ‘Demand’ is demand for a particular product whereas ‘aggregate demand’ is total demand for all products
produced in a country.
2. The causes of shifts in the AS curve are changes in the costs of production, the quantity of resources and the quality of resources.
3. Demand-pull inflation is a sustained rise in the price level caused by an increase in AD. Cost-push inflation is also a sustained rise in the price level but this time caused by an increase in the costs of production.
4. Fiscal policy covers government decisions on taxation and its spending. Monetary policy covers decisions on the rate of interest, the money supply and the exchange rate. In the case of monetary policy, the decisions may be made by the central bank and/or the government.
5. Consumers can benefit from more choice, lower prices and better quality products as a result of international trade. Producers can gain from being able to purchase raw materials more cheaply. They also have access to a larger market and so may be able to take greater advantage of economies of scale.
exAm prActice Questionsa) i) Gross domestic product is the total output produced in an economy over a given time period. ii) A trade deficit is when the value of imports exceeds the value of exports.
b) i) Investment. ii) Consumer expenditure and government spending.
c) India’s unemployment rate rose from 2002 to 2003 and then fell continuously from 2003 to 2007. The unemployment rate was highest in 2003 and lowest in 2007. Over the whole period the unemployment rate fell by 1.4 percentage points.
d) i) One benefit of a fall in inflation may be an increase in the price competitiveness of the country’s firms. If the country’s inflation rate falls below that of its trading rivals, it is likely to sell more exports and buy fewer imports. Another possible benefit is a fall in menu costs. With prices rising less rapidly, firms would not have to change their prices so frequently. This will save them time and money.
ii) A rise in the rate of interest may reduce the inflation rate by lowering three of the components of AD. A higher interest rate is likely to lower consumption by increasing the reward for saving, increasing the cost of borrowing and reducing the amount of money people have left after paying interest on past loans.
Investment may fall as the cost of borrowing to buy capital goods would rise and the opportunity cost of using retained profits would also increase. The higher interest rate may also discourage investment as firms will probably expect consumer expenditure to fall.
Net exports tend to decline as a rise in the interest rate is often associated with a rise in the exchange rate. A higher interest rate usually attracts more money from abroad into the country’s financial institutions. This leads to a rise in demand for the country’s currency which pushes up the exchange rate. A higher exchange rate raises export prices and lowers import prices.
Lower AD will reduce demand-pull inflation.

�0
e) i) A rise in the exchange rate is likely to reduce AD by raising export prices and lowering import prices. A reduction in AD may lower real GDP and so raise unemployment and reduce inflationary pressure as shown in the diagram below.
Price level
Real GDP
AS
AD
ADAD1
AD1
0
P
P1
YY1
The effect on the economy will depend on the initial state of the economy and the size of the decrease in AD. If the economy is initially operating at full employment with a high inflation rate, a fall in AD may reduce the price level without affecting output. In contrast, if initially the economy is experiencing significant unemployment, a fall in AD is likely to reduce real GDP but not affect the price level. NB a second benefit may be experienced on the supply side of the economy. A stronger rupee will lower import prices. This will reduce import cost-push inflation.
ii) Another cause of a trade deficit is a fall in incomes abroad. If the countries which are the main buyers of the country’s exports experience a recession, its inhabitants are likely to buy fewer products, including products from this country.
f) One policy measure that could be used to reduce unemployment is a cut in income tax. Such a measure would increase people’s disposable income. This is likely to increase consumer expenditure. The resulting increase in AD would be expected to encourage firms to expand their output and take on more workers.
There is a chance, however, that a cut in income tax may not increase spending if households are pessimistic about the future. Even if consumption does rise, unemployment may not fall if firms produce more output by paying current workers to work overtime. They may do this if they are not certain that the higher demand will last. Higher output may also be produced by using more advanced technology and more capital goods. In addition, whilst higher AD will reduce cyclical unemployment, it will not reduce structural unemployment arising from geographical and occupational immobility.
g) An increase in productive capacity results in potential economic growth, also called long run economic growth. It enables an economy to produce more goods and services and is illustrated by a shift to the right of the AS curve or a shift to the right of a production possibility curve.
The impact that such a change has on an economy depends crucially on the level of economic activity. An increase in productive capacity is particularly useful if the economy is initially operating at or close to full capacity. The diagram shows that in this case an increase in AS would cause an increase in real GDP and a fall in the price level.
Price level
Real GDP
AS AS1
AD
AD
0
PP1
Y Y1
��
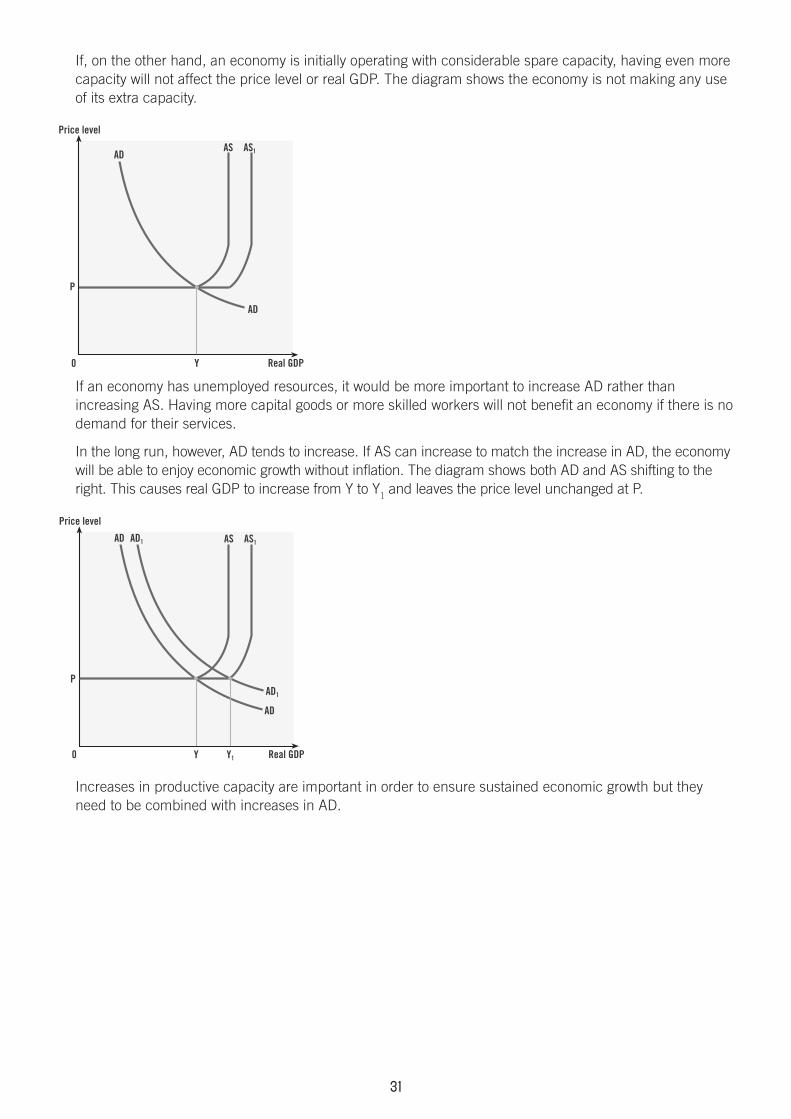
If, on the other hand, an economy is initially operating with considerable spare capacity, having even more capacity will not affect the price level or real GDP. The diagram shows the economy is not making any use of its extra capacity.
Price level
Real GDP
AS AS1
AD
AD
0
P
Y
If an economy has unemployed resources, it would be more important to increase AD rather than increasing AS. Having more capital goods or more skilled workers will not benefit an economy if there is no demand for their services.
In the long run, however, AD tends to increase. If AS can increase to match the increase in AD, the economy will be able to enjoy economic growth without inflation. The diagram shows both AD and AS shifting to the right. This causes real GDP to increase from Y to Y1 and leaves the price level unchanged at P.
Price level
Real GDP
AS AS1
AD
AD AD1
AD1
0
P
Y Y1
Increases in productive capacity are important in order to ensure sustained economic growth but they need to be combined with increases in AD.