another day, another janazah
TRANSCRIPT
ANOTHER DAY, ANOTHER JANAZAH:
An Investigation into Violence, Homicide and Somali-Canadian Youth in Ontario
April 25th, 2018

Dedicated to the memory of:
Ali Mohamud Ali
Son, brother and friend.

AN
OTH
ER DAY, A
NO
THER JA
NA
ZA
H: A
n Investigation into Violence, Hom
icide and Somali-C
anadian Youth in Ontario
ContentsPreface . . . . . . . . . . . . . . . . . . . . . . . . . . . . . . . . . . . . . . . . . . . . . . . . . . . . . . . . . . . . . . . . . . . . 2
About Youth LEAPS . . . . . . . . . . . . . . . . . . . . . . . . . . . . . . . . . . . . . . . . . . . . . . . . . . . . . . . . 3
Acknowledgements . . . . . . . . . . . . . . . . . . . . . . . . . . . . . . . . . . . . . . . . . . . . . . . . . . . . . . . 3
Executive Summary . . . . . . . . . . . . . . . . . . . . . . . . . . . . . . . . . . . . . . . . . . . . . . . . . . . . . . . . 4
Introduction: The Somali Youth Research Initiative . . . . . . . . . . . . . . . . . . . . . . . . . . 6
Methodology: Collecting and Analyzing Data on Somali Youth Homicides . . . . 8
Demographic Data Collection . . . . . . . . . . . . . . . . . . . . . . . . . . . . . . . . . . . . . . . . . . . . . . . 9
Literature Review . . . . . . . . . . . . . . . . . . . . . . . . . . . . . . . . . . . . . . . . . . . . . . . . . . . . . . . . . . . 9
Focus Group Discussions . . . . . . . . . . . . . . . . . . . . . . . . . . . . . . . . . . . . . . . . . . . . . . . . . . . . 9
Survey . . . . . . . . . . . . . . . . . . . . . . . . . . . . . . . . . . . . . . . . . . . . . . . . . . . . . . . . . . . . . . . . . . . . . 10
The Homicide Data Base . . . . . . . . . . . . . . . . . . . . . . . . . . . . . . . . . . . . . . . . . . . . . . . . . . . 11
Limitations . . . . . . . . . . . . . . . . . . . . . . . . . . . . . . . . . . . . . . . . . . . . . . . . . . . . . . . . . . . . . . . . 12
Demographic Profile: Legacy of Precarity . . . . . . . . . . . . . . . . . . . . . . . . . . . . . . . . . . 14
Literature Review: Mapping Out Youth Violence . . . . . . . . . . . . . . . . . . . . . . . . . . . . 17
Key Findings . . . . . . . . . . . . . . . . . . . . . . . . . . . . . . . . . . . . . . . . . . . . . . . . . . . . . . . . . . . . . 20
Toronto Homicide Victims . . . . . . . . . . . . . . . . . . . . . . . . . . . . . . . . . . . . . . . . . . . . . . . . . . 20
Homicide Victim Profile . . . . . . . . . . . . . . . . . . . . . . . . . . . . . . . . . . . . . . . . . . . . . . . . . . . . 23
Personal belonging and Connection to violence . . . . . . . . . . . . . . . . . . . . . . . . . . . . 26
Call to Action: Sharpening the Focus . . . . . . . . . . . . . . . . . . . . . . . . . . . . . . . . . . . . . . . 30
Recommendations . . . . . . . . . . . . . . . . . . . . . . . . . . . . . . . . . . . . . . . . . . . . . . . . . . . . . . . . 32
References . . . . . . . . . . . . . . . . . . . . . . . . . . . . . . . . . . . . . . . . . . . . . . . . . . . . . . . . . . . . . . . 34
Tables . . . . . . . . . . . . . . . . . . . . . . . . . . . . . . . . . . . . . . . . . . . . . . . . . . . . . . . . . . . . . . . . . . . . 36
Table 1 . Homicide Incidence Rate (annual)-Toronto . . . . . . . . . . . . . . . . . . . . . . . . . . 36
Table 2 . Disproportionality index-Somali Homicides in Toronto . . . . . . . . . . . . . . 37
Table 3 . Homicide Database N=40 (Toronto) . . . . . . . . . . . . . . . . . . . . . . . . . . . . . . . . 37
Table 4: Perception of safety post-violent crime . . . . . . . . . . . . . . . . . . . . . . . . . . . . . 38
Table 5: Perceptions and Experiences of Violence Among Somali youth in Ontario . . . . . . . . . . . . . . . . . . . . . . . . . . . . . . . . . . . . . . . . . . . . . . . . . . . . . . . . . 39
Table 6: Somali community leadership impact on violence prevention . . . . . . . 40
Table 7: Institutional impact on homicide reduction (ranked) . . . . . . . . . . . . . . . . 40
Table 8: Stakeholder responsibility in reducing youth violence (ranked) . . . . . . 40
Table 9: Prioritizing youth community engagement (ranked) . . . . . . . . . . . . . . . . 41
Table 10: Community level of responsibility around violence prevention and reduction . . . . . . . . . . . . . . . . . . . . . . . . . . . . . . . . . . . . . . . . . . . . . . . . . . . . . . . . . . . 41
Table 11 . Socio-demographic characteristics of participants citing ‘homicides’ in experiences of violence . . . . . . . . . . . . . . . . . . . . . . . . . . . . . . . . . . . . 42

2
AN
OTH
ER D
AY, A
NO
THER
JA
NA
ZA
H: A
n In
vest
igat
ion
into
Vio
lenc
e, H
omic
ide
and
Som
ali-C
anad
ian
Yout
h in
Ont
ario
PrefacePhone rings.
Liban: Hey, what’s up? How are you?
Friend: Not much . At work . Just calling to let you know I won’t be at Jummah Salat (Friday Prayer) today .
Liban: How come?
Friend: I’m actually going to Khalid Bin Walid Mosque to pray today . They are holding a janazah (funeral) for the boy that was killed last week .
Liban: Inna lillahi wa inna ilayhi raji’un (We belong to ALLAH and to Him we shall return) . It feels like another Somali boy is being killed every other day . Right?
Friend: I know . It’s almost become routine – another day, another janazah .

3
AN
OTH
ER DAY, A
NO
THER JA
NA
ZA
H: A
n Investigation into Violence, Hom
icide and Somali-C
anadian Youth in Ontario
About Youth LEAPSYouth LEAPS’ vision is to improve educational and employment outcomes for at-risk youth by removing systemic barriers that impede their achievement.
AcknowledgementsAuthors:
Muna Aden (MPH – University of Waterloo)
Abdiasis Issa (M.A., Queen’s University)
Siham Rayale (Ph.D., SOAS)
Liban Abokor (Executive Director, Youth LEAPS)
Project Advisors
Abdi Aidid
This report would not have been possible without the contributions of the following individuals and organizations:
Samiya Abdi – Public Health Ontario
Farhia Ahmed – Justice4Abdirahman
Fadomo Awow – Labour Council
Liben Gebrimikael – TAIBU Community Health Centre
Ifrah Hassan – Awakening: Reviving the Spirit of Somali Youth
Yasin Osman – Shoot4Peace
Abu Huraira Community Centre
Aspire2Lead
The Somali Centre for Family Services (Ottawa)
United Way Greater Toronto
We acknowledge the generous contributions of:
Laidlaw Foundation
United Way Greater Toronto

4
AN
OTH
ER D
AY, A
NO
THER
JA
NA
ZA
H: A
n In
vest
igat
ion
into
Vio
lenc
e, H
omic
ide
and
Som
ali-C
anad
ian
Yout
h in
Ont
ario
Executive SummaryThe Somali Youth Research Initiative is a response to a call for action from Somali-Canadian families and communities in Ontario who are continuing to lose their young men at an alarming rate to gun violence and homicide.
The first phase of the initiative, summarized in this report, has been to identify the nature and scope of the crisis by detailing the problem so future work can tailor better solutions. Other phases will include building awareness of the issues in Somali- Canadian Ontario communities, developing action partnerships and strategizing solutions to end the violence.
The researchers used a mixed methods approach, including (1) creating a demographic profile of the Somali community in Canada, (2) conducting an academic literature review of the seeds of marginalization and violence in Somali-Canadian communities, (3) undertaking a survey of police records and other sources, including media scans and community consultations, to create a first-ever Somali Homicide Database (for Toronto), (4) undertaking a provincial survey of young Somali-Canadians and (5) holding focus groups to explore the issues in greater depth (held in Toronto, Ottawa, and Kitchener-Waterloo).
Among the report’s key findings are the evidence of disproportionality with respect to the number of homicides and the size of the Somali-Canadian population. (Dispro-portionality is the extent to which a specific population is over- or under-represented within a certain phenomenon – for example, this study reveals disproportionately more homicides among ethnic Somali-Canadians in Toronto, compared to all reported homicides in Toronto, from 2004 to 2014.) Other findings underscore the negative and spiraling impact that this level of violence is having on families and communities who continue to struggle with issues of poverty, racism, Islamophobia and marginalization. Alarmingly, homicide rates among Somali-Canadian men continue to increase, while victims are getting younger and unsolved homicides are on the rise.

5
AN
OTH
ER DAY, A
NO
THER JA
NA
ZA
H: A
n Investigation into Violence, Hom
icide and Somali-C
anadian Youth in Ontario
Key recommendations focus on:
(1) Improving ethno-cultural data collection by police and government agencies and the sharing of this information across a range of stakeholder groups to build greater awareness of the nature and scope of the problem
(2) Partnering with relevant stakeholders and others to get better clearance rates on Somali homicides so that families will have some closure on their lost loved ones
(3) Bolstering mental health and other supports for Somali-Canadian families so that can begin to heal and build stronger communities.
…so future work can tailor better solutions
6
Introduction: The Somali Youth Research Initiative
This report is a response to a call for action from Somali-Canadian families and communities in Ontario who are continuing to lose their young men at an alarming rate to gun violence and homicide. Community members from masjids/mosques and community organizations to government agencies and social services – have attempted to implement solutions to end the violence but so far they have not had their intended impact. While families and friends of victims mourn the loss of their loved ones, and communities and organizations struggle to implement solutions, the homicide rate rises among Somali youth and these murders continue to go unsolved.
We quickly realized that before we could begin to identify strategies and programs to help end the crisis, we would need to better understand its root causes and the structural conditions fueling it. And we would need more than anecdotal evidence about the nature and scope of the problem as our research base. The first phase of the Somali Youth Research Initiative, summarized in this report, has been to build this research base. We have used a mixed methods approach to provide as best as we could a rich, reliable evidence-base of how serious the problem is and of the underlying conditions contributing to it.

7
AN
OTH
ER DAY, A
NO
THER JA
NA
ZA
H: A
n Investigation into Violence, Hom
icide and Somali-C
anadian Youth in Ontario
We began by creating a demographic profile of the Somali community in Canada and conducting a literature review mapping out the socio-economic factors that contribute to the seeds of marginalization and youth violence in the Somali community that is not unlike other racialized communities. Surveying police records and other sources, and searching for names and faces across communities, we developed a Somali Homicide Database that has enabled us to show the disproportionate numbers of young Somali men who have been victims of homicide in Toronto over a period of time (2004 – 2016).1 And because our research has a practical mandate, we attempted to capture the lived experiences of gun violence and homicide in Somali communities by undertaking a provincial survey of just over 100 young Somali-Canadians and holding focus groups with young men and women in three cities – Toronto, Ottawa, and Kitchener-Waterloo. We sought to make connections between the voices of our focus group participants and survey participants as well as the actual data we collected. The conclusions are largely driven by these conversations we had in these three cities and is a reflection of what Somali communities across Ontario have echoed in the past and continue to speak out on in the present.
Following our methodology, literature review and the discussion of our key findings, we offer several recommendations.
In the next phases of the Somali Youth Research Initiative, we will be sharing our findings with Somali communities across Ontario, including those who were instrumental in helping us prepare our initial approach. Our outreach will include strategizing ways to implement our recommendations as we work with partners across sectors to design sustainable solutions to end the violence of young Somali Canadian men in Ontario.
It is important to stress that while our methods have been thorough and innovative, we have seen the impact “data gaps” have had and continue to have on developing holistic strategies/solutions. Given this, our hope is that representatives of community- organizations, researchers, and policy leaders will be able to build upon the foundation of this research project and create a network of knowledge-based and data-driven work on the scope of youth violence in marginalized Ontario communities. As we will outline shortly, we saw more comprehensive datasets from the City of Toronto than other municipalities in Ontario, and as such, used this as an opportunity to test our community’s hypothesis – namely, that Somalis are dying at a greater rate than members of other communities impacted by gun violence/stabbings. Our hope is that the approach we took can be replicated in other municipalities (Ottawa, Kitchener-Waterloo, London etc.) and that by working collaboratively, creatively and persistently with a range of stakeholders, we can increase understanding of the problem of Somali youth violence across the province as we design lasting solutions.
1 See Tables for complete database

8
Methodology:Collecting and Analyzing Data on Somali Youth Homicides
The research question driving this initiative asks: What is the scope and experience of gun violence and homicides among Somali-Canadian Youth in Ontario? To attempt to answer this, we reviewed demographic data, policy and academic literature on racialized communities and youth violence, and collected and analyzed data over a period of six months from January 2017 to June 2017. Through our combined efforts, we successfully connected with 300 to 350 (through focus groups, surveys and informal conversations) Somali youth as active participants in this research project, our touch-stone for our insights and analyses. Our mixed methods approach encompassed:
◗ Demographic data collection focusing on language, race, and ethnicity (where available) to create a profile of the Somali community in Ontario.
◗ A broader literature review to understand what data were available on Somali youth violence – How is the problem understood? What are the data gaps that exist?

9
AN
OTH
ER DAY, A
NO
THER JA
NA
ZA
H: A
n Investigation into Violence, Hom
icide and Somali-C
anadian Youth in Ontario
◗ Focus group discussions with 50 participants held in three cities – five in Toronto, one in Kitchener-Waterloo, and one in Ottawa.
◗ An online and in-person survey that collected the perceptions, attitudes, and experiences of violence in the lives of 102 Somali-Canadians, between the ages of 14 and 30.
◗ A review of legislation (Criminal Code), Toronto, Peel, and Ottawa Police Service websites, and the work that community-based organizations have done thus far to address the problem of Somali youth violence.
◗ Finally, a “homicide database” of Somali victims to underscore one of our vital working hypotheses – namely, that better data will lead to better problem solving.
Demographic Data Collection
The study drew on data from Statistics Canada to compile basic demographic data about Somali communities, including age, sex, household size, employment and income status etc.
Literature Review
In the academic literature, four key themes are linked to heightened incidences of youth violence – namely, (1) the interaction with the criminal justice system, (2) social exclusion, (3) housing, and (4) employment opportunities. These themes emerged as significant, systemic realities for Somali communities throughout the course of our study.
Focus Group Discussions
The review of the academic literature laid the foundations for the five focus groups that began in February 2017, with the first one in Ottawa, the next one in Kitchener- Waterloo, and three in Toronto. Recruitment for the focus groups was conducted through Facebook, Twitter, Snapchat, Email, Eventbrite flyers, and phone calls to contacts in community organizations and high schools, university Somali associations as well as local mosques. These methods yielded over 50 participants allowing for at least 10 participants per focus group. However, following our recruitment campaign, young women participants greatly outnumbered young men which was problematic since the majority of Somali homicide victims are young men. The secondary literature and news media points to the majority (if not all) of Somali youth homicide victims being young men. To redress the imbalance in participants, we changed recruitment strategies to directly target young men including taking more time to invite young men to the discussions and utilizing personal and professional contacts to solicit the participation of young men. This change in strategy resulted in one particular focus group in Toronto that included 9 young men out of 11 participants in total.

10
AN
OTH
ER D
AY, A
NO
THER
JA
NA
ZA
H: A
n In
vest
igat
ion
into
Vio
lenc
e, H
omic
ide
and
Som
ali-C
anad
ian
Yout
h in
Ont
ario
The discussions were structured in three parts as follows:
(1) Perceptions/Violence/Violent Actions (e.g., Why do you think it’s important to understand Somali youth violence? How do you define violence? Where do you see it happen the most in your community? Does anyone know about a young Somali person who was the victim of homicide? Why do you think Somali youth homicides are not solved?)
(2) Causes & Impact (e.g., What institution/s do you believe have a Positive or Negative impact on Somali youth homicides?? Household? Police/courts? Masjids/Mosques? Broader Somali community? What impact do you believe Somali community leaders have in your neighbourhood/community on Somali youth homicides/crime? How safe do you feel in your neighbourhood/community after a violent crime occurs?
(3) Solutions (e. g., How much do you believe the authorities/police “understand” the issue of Somali youth violence? Who do you believe is responsible for reducing the rate of Somali youth violence in your community/household? What do you believe is a good approach to reducing Somali youth homicide rates? What do you believe can help youth take an active role in reducing violence in their communities/neighbourhoods?
Additional questions arose out of those listed above as participants raised additional issues/topics that were important to their communities. Among the most important additions to the focus group discussions was the insistence that Somali youth homicides were of little priority to police forces while Somali communities reiterated that youth were dying at greater rates than other populations of violence. These anecdotal comments corroborated our initial research endeavour – which included verifying through data collection methods whether Somali youth were victims of homicide at a greater rate in comparison to their population. Focus Group transcripts also corroborated survey findings; this perceptual data indicates the police were slow and indifferent when it came to investigating Somali youth homicides, along with the lack of meaningful engagement by community leaders (i.e., masjid leaders).
Survey
Using our community contacts, and including some of our focus group participants who were not able to complete the survey online, we were able to include 102 participants in a detailed survey, collecting data for preliminary analysis of four key areas including: demographics, socio-economic status, prevalence of violence, and identity (i.e., usage of Somali language in households).
The survey, completed between March 2017 – May 2017 and analyzed in June 2017, consisted of 32 questions and took participants an average of 30 minutes to complete. Like the focus group discussions, the survey was divided into three parts. The first part of the survey included socio-demographic questions such as age, sex, etc. The second delved into experiences of violence and perceptions of violence in the community,

11
AN
OTH
ER DAY, A
NO
THER JA
NA
ZA
H: A
n Investigation into Violence, Hom
icide and Somali-C
anadian Youth in Ontario
while the final part focused on potential solutions and suggestions on ways forward. There were a variety of questions types including multiple choice, mixed Likert scale/matrix scale, yes/no, and open-ended qualitative questions. SurveyMonkey™ was used as the online survey platform, while paper questionnaires were used by peer recruiters and research staff to collect data in-person. All information was entered by a research assistant into the main SurveyMonkey™ database. An excel database was created for further analysis.
Table 1 provides data that shows the extent to which our online survey findings with a sample size of 80 participants can be considered representative of the views and experiences of the wider Somali-Canadian population in Ontario. The population of Somali-Canadians in Ontario is 33,970, as of 2011 The sample size in a full study should be at least approximately 10% of the total population, and the sample size in a pilot study should be at least 1% of the total population. Our study, an initial exploration into the topic, akin to a pilot study, may be particularly robust because while only 38 respondents were required, 80 took part.
Table 1. Sampling Frame for online survey
Jurisdiction Survey Participants (analyzed)
Population (Somali’s in
Ontario)
Sample Size for a full study
Sample Size for a pilot study
Ontario 80 33,970 380 38 .0
The Homicide Data Base
The Homicide Database utilizes a quantitative approach to provide further context to understand the issue of Somali youth violence. By using publicly available data and records, the database attempts to answer questions that so far have been missing from the conversation. As noted earlier, we aimed to quantify anecdotal concerns raised by the Somali community regarding the propensity and severity of Somali youth violence – particularly the idea that Somali youth fall victim to violent crime at a higher rate than youth from other communities. This data, and the analysis that accompanies it, is important in that it outlines the impact of the ongoing marginalization, stigma, and alienation of Somali youth (ultimately contributing to their deaths). More importantly, this data helps identify key patterns that lead to the death of Somali youth – useful information that will inform policy makers, law enforcement, community organizations, and stakeholders interested in mitigating this crisis.
The homicide database uses primary data from various municipal and provincial law enforcement agencies across Ontario, with the most attention given to the police forces of the following cities and regions where there are large Somali populations: Toronto, Peel, Kitchener-Waterloo, Ottawa, and London. The initial step to gathering the data was conducting a survey of each agency’s website to find what types of data are available to the public. Open data sourcing (the movement behind making data

12
AN
OTH
ER D
AY, A
NO
THER
JA
NA
ZA
H: A
n In
vest
igat
ion
into
Vio
lenc
e, H
omic
ide
and
Som
ali-C
anad
ian
Yout
h in
Ont
ario
publicly accessible and easily attainable) has gathered steam among police agencies and has made gathering some data relatively accessible, including identifying information on homicides in their jurisdiction.
However, complete datasets on homicides, such as who were the victims, where were they murdered, their age, gender, occupation, and ethno-cultural identity, are unavailable. This led us to search for secondary data from various other publicly available sources such as news reports to develop a homicide incidence rate among the Somali population and subsequently a disproportionality index to determine if indeed the data supports community assertions that ethnic Somalis are disproportionately impacted by homicide. Due to limitations with respect to the collection of the data for the province of Ontario as a whole, a case-study of Toronto was undertaken as it is the largest sub-set of the Somali population in the province and would yield a sufficient number of cases for further analysis. As well, we drew upon personal networks whereby we contacted members of the Somali-Canadian community with whom we were acquainted, to populate the database.
Disproportionality can be considered as the extent to which a specific population is over- or under-represented within a certain phenomenon (in this case, homicides among ethnic Somalis) in comparison to the level of that same phenomenon within the general population (in this case, all reported homicides among all Torontonians). The proportion of Somali homicides per total homicides was divided by the proportion of the Somali population per the entire population to provide a rate relative to the population as a whole (i.e. disproportionality). These two databases are strong beginnings of further research that can benefit the Somali community in their search not only for evidence-based solutions but also for strategies that can lead to sustainable solutions.
Limitations
Very little empirical research has been conducted thus far on the scope and experience of violence and homicide among Somali-Canadian youth in Ontario or elsewhere and our research has been an attempt to remedy that – or at least to take a first step by conducting some primary research and developing a foundation for further inquiry. We identify the major limitations of our research below.
As noted, our focus groups consisted mostly of young women, an over-representation that we were not entirely able to rectify. In order to support ongoing analysis, we also solicited – through dialogue – the input of young men who were reticent to attend focus groups.
With respect to the survey, we recruited participants via contacts in the Somali community who then suggested others (snowball technique). Because our sample was selective, generalizing our results for the Somali population as a whole is not possible; the potential for bias, including self-selection and over-representation of subsets of the target population is an inevitable aspect of this approach. However, the technique did

13
AN
OTH
ER DAY, A
NO
THER JA
NA
ZA
H: A
n Investigation into Violence, Hom
icide and Somali-C
anadian Youth in Ontario
allow us to access a hard-to-reach population – namely, first- and second-generation Somali-Canadian youth whose lives have been impacted by systemic racism and exclusion, socio-economic and other challenges, and over-representation in the criminal justice system. To mitigate the limitations associated with this type of recruitment strategy, all datasets that did not meet the inclusion criteria of place of residence (Ontario) and ethnic self-identification (Somali) were removed, resulting in an analysis sample of 80 participants. Descriptive statistics, including counts and frequencies of responses, were conducted on quantitative data, and qualitative data were coded and analyzed thematically.
Finally, while we were able to acquire a list of all Ontario homicides between 2004-2016, using a range of sources including police websites and media reports, we were only able to glean the identities and locations of victims; we found it impossible to access all case statuses. Indeed, police are not obliged to divulge case statuses and the time-frame of our study made a Freedom of Information request impractical. Therefore, the status of all homicides in the province regarding Somali youth could not be known before the project’s end.
Standard police practice for cataloguing victim information presented a number of challenges for us. Police keep records of homicide victims based on routine categories of age, gender, and race, but they do not catalogue the ethnicity of the victim, which meant we had to devise an identification and validation scheme for Somali-Canadian victims ourselves. Through this identification scheme, using the available and accessible data, we were able to create a first-of-its-kind Somali Homicide Database. Through the development of this database, we were able to track homicides of Somali-Canadians from as early as 1996 to as recently as 2016. The homicide data base, however, may not include all Somali-Canadian victims because of the limitations of our validation scheme – we relied on a picture, a name, and corroboration from family members or associates. Consequently, we may have excluded Somali-Canadian victims – those we could not validate. Therefore, the homicide database is a resource that should be seen as requiring ongoing verification and expansion to improve accuracy and utility.2
2 Please visit: www.youthleaps.ca to access the full database
Very little empirical research has thus far been conducted on scope and experience of violence and homicide among Somali- Canadians in Ontario and our research has been an attempt to remedy and fill that gap.

14
Demographic Profile:Legacy of Precarity
According to Statistics Canada’s National Household Survey report (2011), there are approximately 44,995 Canadians who identify as Somali, of which 37,115 identified as Somali-speaking and 4,315 were identified as recent immigrants. Moreover, Black-identified Canadians made up 15.1% of ethnic minorities in Canada (the third largest ethnic group), of which 4.4% were Somalis. The Somali population has continued to grow and thrive in major cities in Ontario from 28,140 in 2001 to 40,000+ in 2011. Some statistics also point to an estimated 60% of Somalis predominately residing in Ontario (specifically Toronto and Ottawa). Among that, the ratio of dependents for Somali families in 2:1, suggesting that a large proportion of Somali households include youth as dependents, not unlike other Black or African ancestry groups.3 These data points helped us frame our approach to developing a demographic profile of Somali- Canadian youth and the preponderance of violence in Somali communities. While the Statistics Canada’s National Household Survey report (2011) offers useful population information, it remains difficult to obtain demographic data on Somali youth homicides
3 https://www12.statcan.gc.ca/nhs-enm/2011/as-sa/99-010-x/99-010-x2011001-eng.cfm

15
AN
OTH
ER DAY, A
NO
THER JA
NA
ZA
H: A
n Investigation into Violence, Hom
icide and Somali-C
anadian Youth in Ontario
(age, sex, status of homicide investigation, employment and housing status, etc.). The challenges in finding demographic data on Somali youth homicides is largely due to the general absence of data and the lack of data collection focused on ethno-racial communities (including the Somali population in Ontario). Graph 1 shows the growth of the Somali population relative to the growth of Toronto population. Three decades have passed since the first waves of Somali immigration, yet socio-economic challenges continue to exist. Additional data would help to illuminate the situation.
Graph 1: Relative Growth of the Somali Population in Toronto (2004 to 2016)
Refugee settlement policies such as the Immigration Act Bill-C86 of 1993 saw Somali refugee claimants enter through family reunification or through the United Nations High Commissioner for Refugees (UNHCR) convention. It is likely that the socio-economic challenges hold a relationship to earlier settlement strategies and patterns, as will be discussed below. Many came through the Government Assisted Refugee program (GAR), which lasts for a year, thereafter requiring refugee households to secure viable employment and/or social service assistance. Economically vulnerable refugee house-holds were caught in a cycle of precarious living, struggling with under-employment or unemployment, low English-literacy rates, housing discrimination, and so on. Young Somali men and women were not able to acquire the documentation necessary to pursue higher education or formal employment while awaiting permanent status.4 These problems persisted when, after 2000, the Immigration Act required more invasive identification strategies to reunify families, often resulting in DNA testing claimants to prove familial ties.
Employment status hugely impacts access to affordable housing and is compounded by the resultant discrimination that persists by landlords. In 1995, the unemployment rate for Somali refugees was 48% for men and 66% for women. By 2001, the unemploy-ment rate for Somalis was nationally at 14.5% which is nearly twice the national average of 6.8%. Among the issues that were cited leading to unemployment were racism and discrimination, familial obligations, and lack of qualifications.5
4 Somali Refugee Resettlement in Canada Paper presented at the 18th National Metropolis Conference in Toronto on Getting Results: Migration, Opportunities and Good Governance, March 20165 McMurtry, Roy, and Alvin Curling. The Review of the Roots of Youth Violence: Literature Reviews. [Government of ] Ontario, 2008.
Somalis represent less than
1% of the population
in Toronto .

16
AN
OTH
ER D
AY, A
NO
THER
JA
NA
ZA
H: A
n In
vest
igat
ion
into
Vio
lenc
e, H
omic
ide
and
Som
ali-C
anad
ian
Yout
h in
Ont
ario
Psychosocial trauma and poor social integration contributed immensely to the immigration experience of Somali families. In recent years, second-generation Somali youth have grown to negotiate these issues differently, and yet what remains is an almost identical scenario to the first generation where Somali youth have continued to be viewed as vulnerable, with limited educational opportunities, and compromised access to the labour market. The research report Cashberta (2011) suggests that the immigration struggles of the 1990s established a firm legacy of precarity that contributed to the post-millennial migration of Somali youth to Alberta, often for better employment prospects. Despite initial hopes, many Somali youth were confronted by heightened conditions of precarity with many working as labourers in the camps of oil fields in low-skilled and seasonal work. Frequent unemployment led many young Somali men to engage in the solicitation or trafficking of drugs. The alarming rate of homicides among Somali men/boys in Alberta from 2005 to 2011 was not, however, entirely due to the drug trade; rather, many cases involved non-Somali assailants attacking Somali men/boys in cases of mistaken identity and racism. They were simply targeting a group they believed that police and society at large viewed with apathy, having little respect for the value of their lives.6
While there is no evidence to suggest that violence is ever linked to particular groups or identities7, there are many studies about the stigmatizing of racialized8 youth and the intersecting conditions of poverty, inequality, isolation, and exclusion that lead to vulnerability and often to violence. This is the legacy of precarity experienced by Somali youth in Ontario today, all of which can unfortunately be linked to policies, practices, and systems – from schools to workplaces. Here in Ontario, the young male Somali population is different from the young men who fled to Alberta some ten years prior in search of opportunity; the subjects of our study are not migrants to Toronto, Ottawa, Windsor, or Kitchener-London-Waterloo, but long-time residents with deep connections to the education system, to housing, social supports and families.
6 Jibril, Sagal. ““Cashberta:” Migration Experiences of Somali-Canadian Second Generation Youth in Canada.” (2011).7 Reinke, Wendy M., and Keith C. Herman. “Creating school environments that deter antisocial behaviors in youth.” Psychology in the Schools 39, no. 5 (2002): 549-559.8 We are utilizing the Ontario Human Rights Commission definition on racialization: “The process of social construction of race is called racialization: the process by which societies construct races as real, different and unequal in ways that matter to economic, political and social life.” http://www.ohrc.on.ca/en/racial-discrimination-race-and-racism-fact-sheet

17
Literature Review:Mapping Out Youth Violence
Over the past decade, there have been innumerable stories in the media highlighting the alarming rate of gun violence in the Somali-Canadian community. Since 2000, there have been over fifty cases involving the murders of Young Somali men in Ontario and Alberta.9 The problem is most severe in low-income communities in Toronto, particularly in the west end where there is a high concentration of Somali families. While there have not been specific studies on the scope and experience of violence in Somali-Canadian communities, there have been several studies on Somali-Canadian communities and their struggle with racism, discrimination, poverty and crime. Some studies have looked at the broader intergenerational challenges facing Somali-Canadians, including challenges with education, employment, and criminality.10 Other studies have looked at the general experiences of several different immigrant communities in Canada,
9 Livingstone, David. “Broken dreams in little Mogadishu: Canada’s Somali community continues to struggle with higher-than-average levels of violence, unemployment and discrimination.” UC Observer (2013)
10 Adan, 2016; Jibril, 2011; Berns-McGown, Rima. ““ I Am Canadian”: Challenging Stereotypes about Young Somali Canadians.” IRPP Study 38 (2013): 1.; Daniel, L., and W. Cukier. “The 360 project: Addressing the discrimination experienced by Somali Canadians & racialized LGBTQ homeless youth in Toronto.” (2015).

18
AN
OTH
ER D
AY, A
NO
THER
JA
NA
ZA
H: A
n In
vest
igat
ion
into
Vio
lenc
e, H
omic
ide
and
Som
ali-C
anad
ian
Yout
h in
Ont
ario
particularly the “other-ization” of minorities (over-policing, over-criminalization); these are particularly useful in contextualizing the experiences of Somali-Canadians.11
Daniel and Cukier’s (2015) seminal research study of Somali-Canadian experiences of discrimination based on race, skin colour, and religion offers a conceptual starting point to understanding the lack of integration of Somalis in Canadian society. They found that Somali newcomers to Canada endure “three strikes against them”12: (1) being newcomers/refugees, (2) being Muslim, and (3) being Black. Extremely fruitful to our own discussion is their examination of the interconnectedness of the various institutions that fundamentally shape, alter, and shift the experiences of Somali-Canadians— especially youth. Daniel and Cukier (2015) found that Somali youth are concerned by the “interconnectedness between policing and other institutions that wield authority: specifically, between police, policy-makers, and the school systems.” One participant stated that the presence of law-enforcement incites “fear [to] over come [him]” echoing sentiments and concerns expressed in our survey and focus groups.13
Another study has sought to examine the sociological factors underlying the rising rate of violence among Somali-Canadian youth. Adan utilizes “social disorganization theory” to explain the potential correlation between crime and community structure in the Somali-Canadian community (Adan 2016, 1). Sampson and Groves (1989) identified social disorganization as “the lack of community structures that can develop strategies to deal with social problems such as crime and youth violence” (Sampson and Groves, 1989 cited in Adan, 2016, 2). They hypothesize that “there [exists] a high level of social disorganization among the Somali community in Toronto due to systemic barriers and cultural challenges the community faces” (Ibid 3). These barriers are often perverse, uncontrollable and “may mediate gun violence among Somali young males.” Adan (2016) identifies three themes impacting the Somali-Canadian community in Toronto: (1) unemployment, (2) racism and discrimination, and (3) social cohesion and community strategies. Each of these themes plays a role in contributing to the social disorgani-zation of the Somali community, ultimately limiting the ability to curb or respond to the increasing rate of crime. Many of the challenges that newcomer Somalis faced throughout the 1990s seem to be consistent with contemporary trends. Adan, citing several other studies examining the employment opportunities of Somalis in Toronto, highlights that Somalis “had the lowest job opportunities despite their high level of education” (Ibid 9).
Adan causally connects low socio-economic status with social disorganization, arguing that it creates a situation in which communities “are susceptible to crime [due to] the inability of the community to develop effective control mechanisms” (Ibid 10). Such patterns create situations in which poverty validates criminal behaviour. Other studies
11 Galabuzi, Grace-Edward. Canada’s economic apartheid: The social exclusion of racialized groups in the new century. Canadian Scholars’ Press, 2006. ; Li, Peter S. Destination Canada: Immigration debates and issues. Don Mills, Ont.: Oxford University Press, 2003; Bannerji, Himani. Dark side of the nation: Essays on nationalism, multiculturalism and gender. Toronto: Canadian Scholar’s Press and Women’s Press, 2000.12 Daniel, L. and Cukier, W., 2015. pp.1313 Ibid, 14

19
AN
OTH
ER DAY, A
NO
THER JA
NA
ZA
H: A
n Investigation into Violence, Hom
icide and Somali-C
anadian Youth in Ontario
have also shown that young people who lack economic opportunities often fall prey to the cycles of poverty and crime.14 In the Ontario context, some studies (McMurtry and Curling 2008) have found that poverty coupled with a number of other factors (racism, exclusion, isolation, hunger) can contribute to immediate risk factors for violence (Ibid, 30; Daniel and Cukier 2015, 18). Because Somali Canadians experience three different identities (Black, Muslim, and newcomer), they are often faced with greater challenges and are likely to experience racism and discrimination.
The combination of these three identities creates a sort of “triple consciousness” that is further evident in the identity politics of Somali youth (Daniel and Cukier 2015, 10).15 The identity of Somali-Canadian youth is often politicized, particularly in public areas due to “[the tendency] of Canadian Somali youth to gather in groups and talk in public areas” (Adan 2016, 12). This problem is further compounded by studies suggesting that the subjugation of discrimination can serve as a mitigating factor leading to increased crime.16 Discrimination, in any form, continues to present challenges in successfully integrating Somali youth.
Daniel and Cukier’s (2015) study suggests that for good reason Somalis are apprehensive about the presence of police in their communities, resonating with what participants told us in our focus groups. One respondent, for example, spoke about the visceral experience of having her older male siblings pulled over and carded by Toronto police on their way to school (Ibid 14). These responses validate consistent anecdotal evidence heard throughout Somali communities in Toronto about the discriminatory practice of carding. However, it should be emphasized that it is the Toronto Police Service’s use and employment of the Toronto Anti-Violence Intervention Strategy (TAVIS) that gives the most pause. One respondent described TAVIS actions as being confined to poor racialized communities, such as Rexdale. In Berns-McGown’s (2013, 11) study, respondents also reported feeling victimized by the actions of police in their communities.
14 Groenqvist, Hans. “Youth unemployment and crime: new lessons exploring longitudinal register data.” (2011); Western, Bruce, and Becky Pettit. “Incarceration & social inequality.” Daedalus 139, no. 3 (2010): 8-19; Bunge et al. Exploring crime patterns in Canada. Canadian Centre for Justice Statistics and Time Series Research and Analysis Centre, Statistics Canada, 2005; Muncie, John. Youth and crime. Sage, 2014.15 See also W.E.B. DuBois’s theory African American on “double consciousness.” The term refers to the way in which a marginalized group experiences oppression in a society that also contributes to the construction of their identity in some way. This struggle is extended by Daniel and Cukier to illustrate that Somali youth in general wrestle with their ‘Blackness, Somaliness, and Canadian-ness’ and the way in which these are in constant conflict with one another.16 McMurtry and Curling, 2008: 42

20
Key FindingsBelow we address three key findings that arose from the data we collected on Ontario homicides and the transcript analyses from our survey and focus groups.
Toronto Homicide Victims
In an effort to establish a more precise understanding of the problem of youth violence in Somali communities in Ontario, we researched homicide victims in a number of cities from 2004–2016, taking note of whether cases were solved or unsolved. The result was the development of our Homicide Database.17 Using publicly available data and records, the database attempts to fill some of the gaps in the conversation. Legislators, police, and others often ask for evidence about the scope of the problem when advocacy is done by the Somali community to raise awareness about the rate at which their young men are dying as a consequence of violence. Our researchers sought to verify if victims of homicide in Ontario were disproportionately Somali.
17 See Table 3

21
AN
OTH
ER DAY, A
NO
THER JA
NA
ZA
H: A
n Investigation into Violence, Hom
icide and Somali-C
anadian Youth in Ontario
Answering the question required first establishing a comparison, for example, with Black youth in general. But data were either missing or incomplete. As indicated earlier in the report, the homicide database used primary data from various municipal and provincial law enforcement agencies across Ontario,18 with the most attention given to the following cities and regions: Toronto, Peel, Kitchener-Waterloo, Ottawa, and London. The initial step to gathering the data was conducting a survey of each agency’s website to find what types of data were available to the public. However, complete datasets were unavailable to answer questions such as: In what neighbourhood were victims found? What was their age, gender, and occupation at the time of death? Were they residents of the city in which they were murdered? This was the data we needed not only to identify Somali victims, but to determine the extent to which Somali youth have been affected by violence and violent crime in relation to others, Black youth, for example. As mentioned previously, more detailed ethno-racial data collection could deepen understanding on these issues and perhaps lead to better advocacy and policy around youth violence in Ontario in general. That being said, Graph 2 below shows that:
◗ In 2004, Somalis made up 1.6% of total homicides in Toronto.
◗ In 2014, Somalis made up 16% of total homicide victims in Toronto.
◗ Total homicides declined by 12% between 2004–2014.
Graph 2: Percentage of Somali Homicides in Toronto versus Total Homicides in Toronto (2004 to 2014)
18 The following law enforcement agencies were included in the data collection phase: Toronto Police Service, Peel Regional Police, Waterloo Region Police Service, London Police Service, and Ottawa Police Service
Somalis represented
16% of total homicide victims in 2014 .
0
10
20
30
40
50
60
70
80
90
100
2004 2005 2006 2007 2008 2009 2010 2011 2012 2013 2014
[blue line] Somali Homicides (% of Total Homicides)
[orange line] Total Homicides (Number of individuals)

22
AN
OTH
ER D
AY, A
NO
THER
JA
NA
ZA
H: A
n In
vest
igat
ion
into
Vio
lenc
e, H
omic
ide
and
Som
ali-C
anad
ian
Yout
h in
Ont
ario
Initial analysis reveals that rates of Somali homicides per 100,000 have been consistently higher compared to all homicides per 100,000 of the city’s population, with a dramatic difference in the period spanning 2011 to 2016.19
This analysis lends credibility to the claim made by survey respondents that “Somali youth are dying at a disproportionate rate due to homicide than other youth.” As we have discussed, disproportionality can be considered as the extent to which a specific population is represented within a certain phenomenon (in this case homicides among ethnic Somalis) in comparison to the level of that same phenomenon within the general population (in this case, all reported homicides among all Torontonians). As such, when we say “disproportionate” we mean when compared to the overall Somali population in Toronto.
Every year for the past 13 years, the rate of Somali homicides has been disproportionately high to the rate of total homicides among all groups living in Toronto. The data we collected shows that in 2006 ethnic Somalis were 0.64% of the general population, but 1.4% of all homicides – that is, more than twice (2.22) the rate expected in the general population. More dramatic differences arise in 2012 (15.8 times the number expected) and 2014 (23.2 times the general population). Overall, there is not a single year where deaths by homicide were proportional; the closest proportionality rate achieved was in 2007 where the gap was reduced to 1.64 times the general population.
An analysis of differences between groups (e.g., between Somali and other Black ethnic groups, or between Somalis and Whites, or between Somalis and Southeast Asians) was not possible with the limited resources of this research study and the lack of readily available ethno-racial data. This means that further research needs to be done and as noted previously, better data collection methods need to be deployed. More information, especially with respect to disparity would allow for a more nuanced understanding of the prevalence of homicides in the Somali community compared to other communities. For instance, between-group differences may demonstrate which factors are at play in determining vulnerability. A significant difference in homicide rates among Somalis and other Black Canadian groups would suggest other factors including systemic racism. Indeed a similarity between these groups would illustrate that anti-Black racism is a significant factor in homicides among Black youth (of which Somali youth are a significant group); the relationship to Islamophobia and anti-Muslim bigotry directed at Somali communities, although little researched, may be factors as well.
19 Data from the NHS (National Household Survey) were used to determine population size (N) for ethnic Somalis in Toronto as well as the general Toronto population. All population data for both target populations were extracted from the Toronto the census subdivision or ‘city’ / ‘municipality’ figures as it is defined by Stats Canada. Therefore the most recently available data from the 2016 Census and 2011 NHS census collection was used to cover the Somali population for the entire period of (2007-2016). Somali homicide figures and total homicide figures were collected from publicly available data sources (See Table 1 in Annex).

23
AN
OTH
ER DAY, A
NO
THER JA
NA
ZA
H: A
n Investigation into Violence, Hom
icide and Somali-C
anadian Youth in Ontario
Graph 3 below shows a comparison of solved (55%) versus unsolved (45%) of Somali homicide clearance rates from 2004 to 2014. This data provides further context to the issue of Somali homicide rates.
Graph 3: Somali Homicide Clearance Rates (2004 to 2014)
Researchers in Ontario have cited expert opinion and estimates of homicide prevalence and disproportionality while community members have attempted to understand these incidents in a similar way, through memory and lived experience.20 However, this is not enough, neither on the part of the community nor on the part of researchers, scientists and, policy makers – which is what led our researchers to develop a database for the Somali community.21 Certainly using data from a variety of sources is useful, but challenges in access remain formidable. Much like provincial and municipal police data, there are clear issues of accessibility that hinder public inquiry. There is a clear need for comprehensive quantitative research in this area in order to move beyond the anecdotal and to inspire real policy change.
It is no longer a question of how certain groups are different but rather why they are different. Why are some groups at greater risk of crime and victimization? We believe it is incumbent on those who have access to data to make it available to those who need it to establish an evidence base for the study of this pressing social problem.
Homicide Victim Profile
Statistics Canada researchers have also sought to understand victimization, providing a breakdown on their website according to age.22 Although they reference all of Canada, our figures are for Somali homicides in Toronto. In general, though, victims
20 Galabuzi, 200621 The homicide database and disproportionality index presented in this report have been a conscious attempt to systematically organize information to answer questions which have plagued racialized communities. (See Tables)22 http://www.statcan.gc.ca/tables-tableaux/sum-som/l01/cst01/legal10a-eng.htm
45% UNSOLVED
55% SOLVED

24
AN
OTH
ER D
AY, A
NO
THER
JA
NA
ZA
H: A
n In
vest
igat
ion
into
Vio
lenc
e, H
omic
ide
and
Som
ali-C
anad
ian
Yout
h in
Ont
ario
of homicide in Canada are concentrated in the 30-39 age range whereas for Somali homicide victims, the concentration is a decade younger. Graph 4 below shows that 82.5 percentage of identified Somali homicide victims are youth (under the age of 29); 62% died due to shootings, and 95% are male.
Graph 4: Age, Cause of Death and Gender of Identified Somali Homicide Victims, 2004 to 2014
Please note that the data for Graph 4 was taken from the Toronto homicide database from 2004-2016, as presented below which shows the age ranges and year of death for Somali-Canadian homicide victims:23
Age 2004 2005 2006 2007 2008 2009 2010 2011 2012 2013 2014 2015 2016
0 – 11 1
12 – 17 1 1 1 1 1
18 – 24 2 1 1 1 1 1 2 1 3
25 – 29 1 1* 1 5 1 3 2
30 – 39 1 1
40 – 49 1 2*
50 – 59 1 1
60 years and older
age not known
*Indicates Female victim (one in 2014; one in 2009)
23 See Table 3
Percentage of Somali-Canadian homicide victims are between 18-29 years old67.5
0
20
40
60
80
100
82.5%under theage of 29
95%male
62%shooting
Perc
enta
ge
Most frequently-occurring demographic of victim
Other demographics of victim
AGE CAUSE OF DEATH GENDER

25
AN
OTH
ER DAY, A
NO
THER JA
NA
ZA
H: A
n Investigation into Violence, Hom
icide and Somali-C
anadian Youth in Ontario
While Statistics Canada points to an overall decline in youth offenders facing incarceration, it relies on police-reported data and three survey sets in particular: the Youth Corrections Key Indicator Report, the Youth Custody and Community Services (YCCS) survey, and the Integrated Correctional Services Survey (ICSS) which is provided by the provinces since they are responsible for youth correctional services.24 Their data show that youth crime has generally been declining. The issue then is, What accounts for such high homicide rates among Somali youth – particularly young men? Data on Somali youth has to be derived from police divisions operating in communities with significant Somali residents. Police Division 23 in the Dixon area has gone so far as to establish a “Somali Liaison Unit” for a number of years.25 The name and its relationship to com-munity members is controversial. Discrimination, racial profiling, and harassment have been documented as significant factors for high interactions with police officers by Somalis residing in Division 23 neighbourhoods.
To assess the level at which police interactions are impacted by systemic racism, we might consider the practice of “carding” or collecting personal information about passers-by at intersections. The practice has been deemed racist because of the overwhelming number of stops conducted by police on Black community members.26 In this way, police forces play a part of in a wider system perpetuating discriminatory practices that often target racialized youth.27
There is a close correlation as well between police interaction and educational attainment – often termed the “school to prison pipeline .” Disciplinary policies in Ontario schools have been understood to have a disproportionate impact on racialized students who historically have been more likely to be suspended or expelled from school for behavioural issues, making it less likely for them to complete their education, thus minimizing employment opportunities and embroiling them in a vicious cycle of poverty, hopelessness, and crime.28 Studies have been highly critical of the use of zero-tolerance policies, and in 2003, the Ontario Humans Right Commission reported that the use of such policies formulated negative perceptions in racialized communities since often when students were disciplined, police in schools were involved.29 In the context of suspensions, expulsions, and zero tolerance, Somali students have
24 Statistics Canada. “Youth Correctional Statistics in Canada, 2013/2014.” Retrieved: http://www.statcan.gc.ca/pub/ 85-002-x/2015001/article/14164-eng.htm25 The Somali Liasion Unit is no longer operating26 https://ca.news.yahoo.com/blogs/dailybrew/toronto-police-controversy--what-is--carding--and-is-it-le-gal-192840113.html27 Meng, Y., et al. “Is There Racial Discrimination in Police Stop-and-Searches of Black Youth? A Toronto Case Study.” Canadian Journal of Family and Youth/Le Journal Canadien de Famille et de la Jeunesse 7, no. 1 (2015): 115-148.28 Kovalenko, Sofiya. “Ontario Safe Schools Act and its effects on racialized immigrant youth:’school to prison pipeline’.” Unpublished master’s thesis. Ryerson University. Retrieved from file:///C:/Users/Owner/Downloads/OBJ% 20Datastream 20, no. 5 (2012); Daniel, Yvette, and Karla Bondy. “Safe Schools and Zero Tolerance: Policy, Program and Practice in Ontario.” Canadian Journal of Educational Administration and Policy 70 (2008): 1-20; Birrell, Jennifer, and Paul Marshall. “Suspensions and Expulsions: Safer Schools for Whom?.” Students at the Center (2007): 33-5029 Bhattacharjee, Ken. The Ontario safe schools act: School discipline and discrimination. Ontario Human Rights Commission, 2003

26
AN
OTH
ER D
AY, A
NO
THER
JA
NA
ZA
H: A
n In
vest
igat
ion
into
Vio
lenc
e, H
omic
ide
and
Som
ali-C
anad
ian
Yout
h in
Ont
ario
been pushed out from schools, their life chances seriously jeopardized, and their vulnerability to violence dangerously increased.
Personal belonging and Connection to violence
Among one of the most compelling achievements of this research has been finding a way to give voice to the perceptions and experiences of Somali youth. Our survey approach was useful in extrapolating not only what many felt was true about violence in their midst, but also what the possible solutions might be to reducing youth violence in Somali communities. The survey results give voice and agency to the Somali com-munities who participated in our research. When conducting our survey, among the key issues that we sought to quantify were perceptions and attitudes among Somali youth with respect to their experience of homicides in their communities. Survey findings indicated that the greatest social connection (and sense of belonging) that youth have is to their neighbourhoods and not to their immediate households.
When youth violence is concentrated in particular neighbourhoods, often it is merely the proximity to violence that may be detrimental to youth as they mature. Our survey sought to measure and evaluate “personal safety” among Somali youth in their neigh-bourhoods. We also hoped to understand how participants felt after a violent crime occurred in their community or household. Our results showed that 16.96% of all respondents did not feel safe at all, while on the opposite end of the spectrum, only a small fraction of participants felt very safe (6.78%).30 The majority of participants had a neutral sense of safety after a homicide occurred and considering the frequency of homicides in particular neighbourhoods, the conversation during focus groups discussed coping strategies after a homicide. This is telling because, in a study of second-generation immigrant youth, belief in diversity was found to be bolstered by strong neighbourhood connections and the presence of other visible racialized youth within their respective neighbourhoods.31 Survey findings support this line of thinking with the majority of respondents indicating that neighbourhood connections were vital to their social environment. It meant, despite a homicide occurring in their neighbourhood, youth still felt relatively safe or found ways to cope. However, when youth look beyond their neighbourhoods and considered the disparity between how racialized and non-racialized people are treated by institutions, they are forced to
30 See Table 4 31 Aisenberg, Eugene, and Todd Herrenkohl. “Community violence in context: Risk and resilience in children and families.” Journal of interpersonal violence 23, no. 3 (2008): 296-315
of survey respondents directly connected with a victim of homicide75%

27
AN
OTH
ER DAY, A
NO
THER JA
NA
ZA
H: A
n Investigation into Violence, Hom
icide and Somali-C
anadian Youth in Ontario
renegotiate their sense of belonging. It should be recognized that personal belonging/ connections change over time and are not static. But certainly, neighbourhoods are an extremely important source of belonging while simultaneously also spaces where violence (re)emerges.
Somali-Canadians living in Ontario have largely settled in immigrant communities in a handful of geographic areas: Greater Toronto, Ottawa, Kitchener-Waterloo, and London/ Windsor. Many of these families are forced into settling into low-income communities due to their economic situation and discriminatory housing practices. Early Somali immigrants had difficulty finding appropriate housing, because private landlords were unwilling to rent out to Somali immigrants; they subsequently had no choice but to settle in government-subsidized housing and low-income neighbourhoods.
Today, the legacy of those early challenges has manifested itself into the reality of many Somali families living in subsidized housing. Studies have shown that living in subsidized housing or low-income communities limits the number of opportunities available and diminishes the quality of community and social services provided. Looking at Toronto Community Housing (TCH), the principal social housing provider in Toronto, it is evident that this is a reality. As both survey and focus group partici-pants told us, by living in these communities, Somali youth are simultaneously targets and victims. Toronto Police Services’ drug and gangs unit, TAVIS, has been known—both empirically and anecdotally—to focus on these communities in their policing efforts. The end result of these practices is that Somali youth are continuously carded, and in the worst cases, harassed or assaulted, by police. In Ottawa, this experience is consistent with the practices of the Ottawa police’s Direct Action Response Team (DART) program. In both Toronto and Ottawa, focus group participants suggested that Somali youth feel alienated and disturbed by their interactions with police in their neighbourhoods. The psychological effect of these practices has created distrust, resentment and fear of police, and a general sentiment of feeling unsafe in their own homes.32
The experience of Somali youth is further compounded by identity challenges. Somali youth are equally Black, Muslim, and Somali, a reality that creates a real challenge impacting their connectedness to their communities and other indicators like employ-ment. In many cases, as we have seen recently, Somali youth continue to be prevented from entering the job market because of their identity and the neighbourhoods they reside in – all contributing to their sense of personal belonging. The discrimination they face, together with high drop-out rates creates a situation in which Somali youth are forced into precarious jobs both within the formal and informal labour market.
Oftentimes the jobs that are available are low-skilled, low-wage, and unstable — for instance, many young Somali men and women find various jobs at the airport, while others find temporary work in the security industry.
32 Berns-McGown, 2013

28
AN
OTH
ER D
AY, A
NO
THER
JA
NA
ZA
H: A
n In
vest
igat
ion
into
Vio
lenc
e, H
omic
ide
and
Som
ali-C
anad
ian
Yout
h in
Ont
ario
Our survey sample33 shows participants tend to live in their neighbourhoods for long periods of time, 69.74% residing for ten years or greater; however, the extent to which this translates into having better neighbourhood relationships and a greater sense of personal belonging and connection requires further study beyond our purposeful sample. However, many did speak about experiencing discrimination outside of their neighbourhoods which was felt to have an impact on social and economic margin-alization. Again, many mentioned that simply being stopped by the police has had negative consequences on self-image. More troubling still are recalled stories of how early interaction with the criminal justice system led to even greater involvement with it, producing negative effects that reinforced marginalization.34
Alleviating marginalization needs to be the responsibility of institutions inside and outside of these communities. Our data35 addresses community leaders and their impact on violence prevention. Notably, participants in this sample felt disconnected from community leadership – in the case of Toronto’s Somali community, this often means the “elders” at the helm of social, cultural, and religious organizations. The majority of respondents (50%) stated that community leaders had some impact, but could do more to prevent youth violence, while 27.59% stated that community leadership had no impact at all on violence prevention. These sentiments may hint at generational tensions and/or youth exclusion from community decision-making. However, further research is required to investigate these hypotheses.
According to our focus groups, participants were underwhelmed by the impact of religious institutions on preventing youth violence as mosques were seen as exclud-ing certain populations, including young Black men either through implicit or explicit means. However as our data shows,36 for some respondents (29.8%), mosques may be a positive site of intervention, as are households (28.07%) compared to the police/ courts which 62.05% of respondents cite as having the least positive impact on homicide reduction. This illustrates that Somali youth still feel very connected to their neighbourhood institutions/social spaces despite acknowledging the problems that persist and negatively impact belonging. Masjids/mosques that cater to a significant Somali population may be seen as potential sites for positive engagement after a homicide occurs. Indeed, this trend of focusing on Somali-led spaces continued when asked about which members of the community were the most responsible stakeholders with respect to taking action against youth violence.37 Survey respondents first looked inward and expanded their expectations outward citing youth themselves (45.76%), followed by community leaders and family members (39.66% and 37.93%, respectively), educators (31.03%) and police as (17.54%) as the most important stakeholders. Participants also had clear ideas about the pathway towards improving the role of youth in their
33 Participants household income were self-reported34 Wiley, Stephanie A., and Finn-Aage Esbensen. “The effect of police contact: does official intervention result in deviance amplification?.” Crime & Delinquency 62, no. 3 (2016): 283-30735 See Table 636 See Table 737 See Table 8

29
AN
OTH
ER DAY, A
NO
THER JA
NA
ZA
H: A
n Investigation into Violence, Hom
icide and Somali-C
anadian Youth in Ontario
communities.38 They cited increased involvement in community organizing (42.37%), greater opportunities for leadership roles (43.10%), and more training in capacity to engage communities and personal development (43.10%). Despite occasional disillusionment with community leaders, youth continue to credit their community as at least potentially responsible for reducing violence (79.66% ranking the responsibility level as high).39 Given the opportunity to participate in decision-making and if provided with the necessary resources, youth may no longer feel excluded and may be in a better position to reduce youth violence among their peer group.
With respect to experiences of violence,40 16.67% of respondents had never experienced any form of violence either directly or indirectly, while 29.17% stated that violent events occurred monthly in their community, similar to those who encountered community-level violence at least once a year (23.62%). Homicides were cited as the leading form of violence among the majority of participants (52.17%) and young men were deemed the most vulnerable to or likeliest targets of violence (81.43%). More than a third knew one to four victims of violence (38%) and a similar proportion knew five to 10 victims of violence (36.6%). For participants citing homicide as a form of violence experienced directly or indirectly41, 50% were female and 50% were male, which may indicate that although young men are more often than not the targets of violent crime, the impact of these homicides is felt and internalized universally. This group was also more likely to be a long-term resident of a neighbourhood (>10 years) and more likely to speak English than any other language (97%).
38 See Table 939 See Table 1040 See Table 541 See Table 11

30
Call to Action:Sharpening the Focus
The data has shown us that the homicide rate among Somali-Canadians is indeed a crisis for the Somali community. While the homicide rate is increasing for Somali- Canadians, it is decreasing overall for other Ontario populations. The Somali homicide rate is highly disproportionate to the size of the Somali population. Even more disturbing, Somali homicide victims are getting younger and as the average age of Somali victims decreases, so, too, do police clearance rates. Therefore, this research has attempted to draw attention to a worsening crisis and calls on all relevant stakeholders to contribute to the recommendations included in this report in order to improve outcomes for Somali-Canadians in Ontario.
To Community Organizations/Service Providers:
◗ Continue to raise awareness of the issue and coordinate with other organizations to build and maintain momentum.
◗ Develop collaborative approaches to build knowledge and research, exchange of lessons, data sharing processes, and intervention efforts.
◗ Establish better supports and services for victims, families, and communities.

31
AN
OTH
ER DAY, A
NO
THER JA
NA
ZA
H: A
n Investigation into Violence, Hom
icide and Somali-C
anadian Youth in Ontario
To Institutional stakeholders, police, policy-makers, and legislators:
◗ Improve data collection and cataloguing processes to include ethno-cultural and linguistic indicators so we can get a better sense of how different communities are experiencing key institutions in our society and respond more readily to instances of crisis.
◗ Consult with community members around the review and improvement of inter-vention strategies.
◗ Set goals, establish measurements, and commit resources to address and improve outcomes for Somali-Canadians not only with respect to the issue of gun-violence but also in areas of social inclusion, employment, housing, and education for these are undoubtedly leading contributors to existing crisis.
Set goals, establish measurements and commit resources to address and improve outcomes for Somali-Canadian

32
RecommendationsBased on our focus group discussions, survey results, and our research findings, we have compiled the following recommendations to support future research and community programs/initiatives. They include:
(1) Collect and publicize ethno-cultural and linguistic data
o Address where significant gaps exist in Somali-specific data not only regarding gun violence/homicides but also in education, housing, mental health, and criminal justice.
o Address capacity to determine, understand, and analyze the scale and scope of challenges facing the Somali community.
o Aim to make existing ethno-cultural data easier to access and include ethno-cultural and linguistic identifiers as part of Ontario’s ongoing collection of disaggregated race-based data.
33
AN
OTH
ER DAY, A
NO
THER JA
NA
ZA
H: A
n Investigation into Violence, Hom
icide and Somali-C
anadian Youth in Ontario
(2) Convene Somali stakeholders to review homicide investigation practices and criminal justice reform relevant to Somali populations in Ontario
o Respondents and community have identified that solving Somali victims of homicides are a high priority.
o Convene a working group consisting of victims’ families, police services, and community organizations to review homicide investigation procedures to improve clearance rates.
o Target education campaigns to inform Somali community about existing investigation practices and criminal justice reform initiatives as well as how they can participate.
(3) Invest in Somali specific healing and mental health resources
o Develop and institute culturally sensitive training for practitioners most likely to serve Somali’s in regions like West Windsor, South Ottawa, Kitchener- London-Waterloo and North West/East Toronto. Examples include bringing together a collective of Somali stakeholders to work with institutional partners like Centre for Addiction and Mental Health (CAMH) to develop guides for providing mental health supports to the Somali community.
o Increase number of Enhanced Youth Outreach Workers (YOWs) focusing on mental health services to support Somali Communities in regions like West Windsor, South Ottawa, Kitchener-London-Waterloo and North West/East Toronto
o Invest in Somali Mental Health Workers/Counsellors

34
ReferencesAdan, Abdullahi M. What Explains the Escalating Gun Violence among Somali Canadian Youth in Toronto? Somali Think Tank, 2016.
Aisenberg, Eugene, and Todd Herrenkohl. “Community violence in context: Risk and resilience in children and families.” Journal of interpersonal violence 23, no. 3 (2008): 296-315.
Bannerji, Himani. Dark side of the nation: Essays on nationalism, multiculturalism and gender. Toronto: Canadian Scholar’s Press and Women’s Press, 2000.
Berns-McGown, Rima. ““ I Am Canadian”: Challenging Stereotypes about Young Somali Canadians.” IRPP Study 38 (2013): 1.
Bhattacharjee, Ken. The Ontario safe schools act: School discipline and discrimination. Ontario Human Rights Commission, 2003.
Birrell, Jennifer, and Paul Marshall. “Suspensions and Expulsions: Safer Schools for Whom?.” Students at the Center (2007): 33-50.
Bunge, Valerie Pottie, Holly Johnson, and Thierno A. Baldé. Exploring crime patterns in Canada. Canadian Centre for Justice Statistics and Time Series Research and Analysis Centre, Statistics Canada, 2005.

35
AN
OTH
ER DAY, A
NO
THER JA
NA
ZA
H: A
n Investigation into Violence, Hom
icide and Somali-C
anadian Youth in Ontario
Daniel, Yvette, and Karla Bondy. “Safe Schools and Zero Tolerance: Policy, Program and Practice in Ontario.” Canadian Journal of Educational Administration and Policy 70 (2008): 1-20.
Daniel, L., and W. Cukier. “The 360 project: Addressing the discrimination experienced by Somali Canadians & racialized LGBTQ homeless youth in Toronto.” (2015).
Galabuzi, Grace-Edward. Canada’s economic apartheid: The social exclusion of racialized groups in the new century. Canadian Scholars’ Press, 2006.
Groenqvist, Hans. “Youth unemployment and crime: new lessons exploring longitudinal register data.” (2011).
Jibril, Sagal. ““Cashberta:” Migration Experiences of Somali-Canadian Second Generation Youth in Canada.” (2011).
Kovalenko, Sofiya. “Ontario Safe Schools Act and its effects on racialized immigrant youth:’school to prison pipeline’.” Unpublished master’s thesis. Ryerson University. Retrieved from file:///C:/Users/Owner/Downloads/OBJ% 20Datastream 20, no. 5 (2012).
Li, Peter S. Destination Canada: Immigration debates and issues. Don Mills, Ont.: Oxford University Press, 2003.
Livingstone, David. “Broken dreams in little Mogadishu: Canada’s Somali community continues to struggle with higher-than-average levels of violence, unemployment and discrimination.” UC Observer (2013).
Meng, Yunliang, Sulaimon Giwa, and Uzo Anucha. “Is There Racial Discrimination in Police Stop-and-Searches of Black Youth? A Toronto Case Study.” Canadian Journal of Family and Youth/Le Journal Canadien de Famille et de la Jeunesse 7, no. 1 (2015): 115-148.
McMurtry, Roy, and Alvin Curling. The Review of the Roots of Youth Violence: Literature Reviews. [Government of ] Ontario, 2008.
Muncie, John. Youth and crime. Sage, 2014.
Reinke, Wendy M., and Keith C. Herman. “Creating school environments that deter antisocial behaviors in youth.” Psychology in the Schools 39, no. 5 (2002): 549-559.
Sampson, Robert J., and W. Byron Groves. “Community structure and crime: Testing social-disorganization theory.” American journal of sociology 94, no. 4 (1989): 774-802.
Western, Bruce, and Becky Pettit. “Incarceration & social inequality.” Daedalus 139, no. 3 (2010): 8-19.
Wiley, Stephanie A., and Finn-Aage Esbensen. “The effect of police contact: does official intervention result in deviance amplification?.” Crime & Delinquency 62, no. 3 (2016): 283-307.

36
AN
OTH
ER D
AY, A
NO
THER
JA
NA
ZA
H: A
n In
vest
igat
ion
into
Vio
lenc
e, H
omic
ide
and
Som
ali-C
anad
ian
Yout
h in
Ont
ario
TablesTable 1. Homicide Incidence Rate (annual)-Toronto
Incidence Rate By Year – TorontoYear Somali
Homicides (N)1
Total Homicides
(N)2
Somali Population
(N)3
Total Population
(N)4
Somali Homicide
Rate
Somali Rate per 100,000
TotalHomicide
Rate
Total Rate per 100,000
2004 1 64 16,085 2,503,281 6 .21697e-05 6 .216972334 2 .55664e-05 2 .556645
2005 2 79 16,085 2,503,281 0 .000124339 12 .43394467 3 .15586e-05 3 .155858
2006 1 70 16,085 2,503,281 6 .21697e-05 6 .216972334 2 .79633e-05 2 .79633
2007 1 86 18,580 2,615,060 5 .38213e-05 5 .382131324 3 .28864e-05 3 .288643
2008 2 70 18,580 2,615,060 0 .000107643 10 .76426265 2 .6768e-05 2 .676803
2009 2 62 18,580 2,615,060 0 .000107643 10 .76426265 2 .37088e-05 2 .370883
2010 1 63 18,580 2,615,060 5 .38213e-05 5 .382131324 2 .40912e-05 2 .409123
2011 2 51 18,580 2,615,060 0 .000107643 10 .76426265 1 .95024e-05 1 .950242
2012 6 56 18,580 2,731,571 0 .000322928 32 .29278794 2 .0501e-05 2 .050102
2013 3 57 18,580 2,731,571 0 .000161464 16 .14639397 2 .08671e-05 2 .086711
2014 9 57 18,580 2,731,571 0 .000484392 48 .43918192 2 .08671e-05 2 .086711
2015 4 56 18,580 2,731,571 0 .000215285 21 .5285253 2 .0501e-05 2 .050102
2016 6 69 18,580 2,731,571 0 .000322928 32 .29278794 2 .52602e-05 2 .5260191 See methodology of the homicide database
2 Toronto Police (2005, 2010, 2012) Statistical Reports .
3 2004-2006- Stats Canada (2006) . Ethnic origins, 2006 counts, for census subdivisions (municipalities) with 5,000-plus population – 20% sample data
2007-2016- Stats Canada (2011) . Ethnic origins, NHS Profile, Toronto, C, Ontario, 2011
4 2004-2006- Stats Canada (2006) . 2006 Community Profiles .
2007-2011- Stats Canada (2016) . Census Profile, 2016 Census Toronto, Toronto [Census subdivision], Ontario and Toronto, Census division [Census division], Ontario
2011-2016- Stats Canada (2016) . Census Profile, 2016 Census Toronto, Toronto [Census subdivision], Ontario and Toronto, Census division [Census division], Ontario
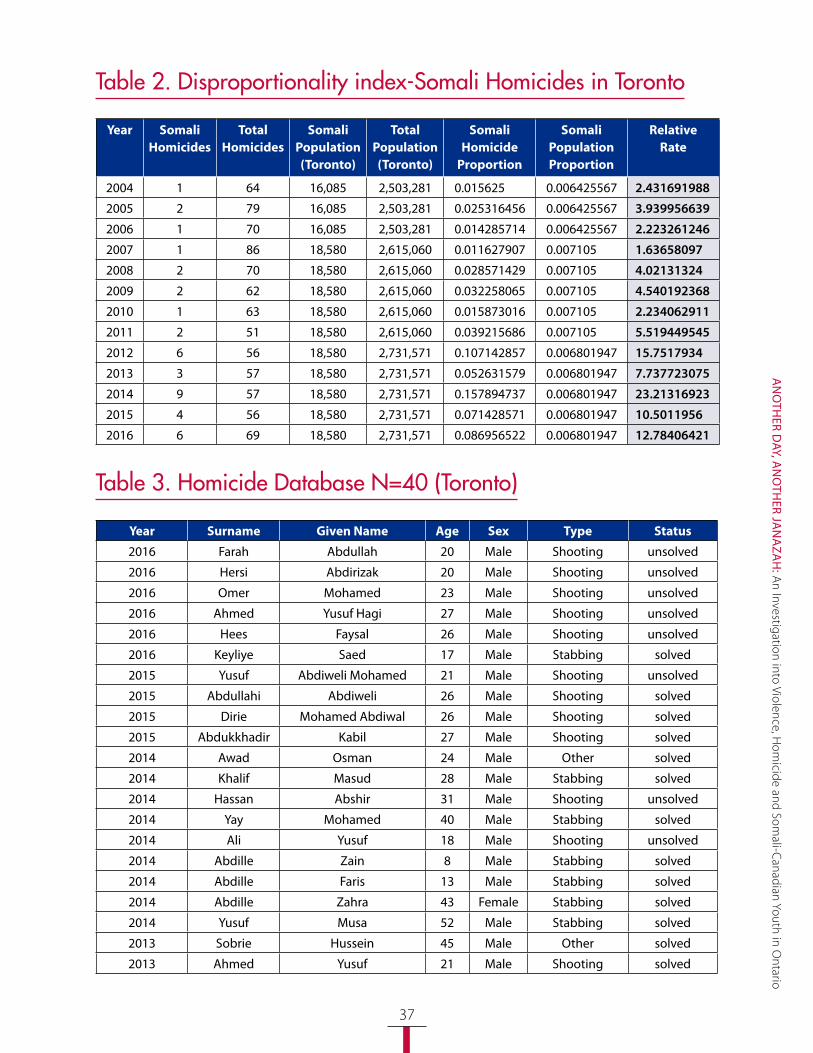
37
AN
OTH
ER DAY, A
NO
THER JA
NA
ZA
H: A
n Investigation into Violence, Hom
icide and Somali-C
anadian Youth in Ontario
Table 2. Disproportionality index-Somali Homicides in Toronto
Year Somali Homicides
Total Homicides
Somali Population(Toronto)
Total Population (Toronto)
Somali Homicide
Proportion
Somali Population Proportion
Relative Rate
2004 1 64 16,085 2,503,281 0 .015625 0 .006425567 2 .431691988
2005 2 79 16,085 2,503,281 0 .025316456 0 .006425567 3 .939956639
2006 1 70 16,085 2,503,281 0 .014285714 0 .006425567 2 .223261246
2007 1 86 18,580 2,615,060 0 .011627907 0 .007105 1 .63658097
2008 2 70 18,580 2,615,060 0 .028571429 0 .007105 4 .02131324
2009 2 62 18,580 2,615,060 0 .032258065 0 .007105 4 .540192368
2010 1 63 18,580 2,615,060 0 .015873016 0 .007105 2 .234062911
2011 2 51 18,580 2,615,060 0 .039215686 0 .007105 5 .519449545
2012 6 56 18,580 2,731,571 0 .107142857 0 .006801947 15 .7517934
2013 3 57 18,580 2,731,571 0 .052631579 0 .006801947 7 .737723075
2014 9 57 18,580 2,731,571 0 .157894737 0 .006801947 23 .21316923
2015 4 56 18,580 2,731,571 0 .071428571 0 .006801947 10 .5011956
2016 6 69 18,580 2,731,571 0 .086956522 0 .006801947 12 .78406421
Table 3. Homicide Database N=40 (Toronto)
Year Surname Given Name Age Sex Type Status
2016 Farah Abdullah 20 Male Shooting unsolved
2016 Hersi Abdirizak 20 Male Shooting unsolved
2016 Omer Mohamed 23 Male Shooting unsolved
2016 Ahmed Yusuf Hagi 27 Male Shooting unsolved
2016 Hees Faysal 26 Male Shooting unsolved
2016 Keyliye Saed 17 Male Stabbing solved
2015 Yusuf Abdiweli Mohamed 21 Male Shooting unsolved
2015 Abdullahi Abdiweli 26 Male Shooting solved
2015 Dirie Mohamed Abdiwal 26 Male Shooting solved
2015 Abdukkhadir Kabil 27 Male Shooting solved
2014 Awad Osman 24 Male Other solved
2014 Khalif Masud 28 Male Stabbing solved
2014 Hassan Abshir 31 Male Shooting unsolved
2014 Yay Mohamed 40 Male Stabbing solved
2014 Ali Yusuf 18 Male Shooting unsolved
2014 Abdille Zain 8 Male Stabbing solved
2014 Abdille Faris 13 Male Stabbing solved
2014 Abdille Zahra 43 Female Stabbing solved
2014 Yusuf Musa 52 Male Stabbing solved
2013 Sobrie Hussein 45 Male Other solved
2013 Ahmed Yusuf 21 Male Shooting solved

38
AN
OTH
ER D
AY, A
NO
THER
JA
NA
ZA
H: A
n In
vest
igat
ion
into
Vio
lenc
e, H
omic
ide
and
Som
ali-C
anad
ian
Yout
h in
Ont
ario
Year Surname Given Name Age Sex Type Status
2013 Tifow Yusuf 16 Male Shooting solved
2012 Hassan Ahmed 24 Male Shooting solved
2012 Hussein Hussein 28 Male Shooting solved
2012 Elmi Abdulle 25 Male Shooting unsolved
2012 Farah Abdulaziz 28 Male Shooting solved
2012 Ali Suleiman 26 Male Shooting unsolved
2012 Ali Warsame 26 Male Shooting unsolved
2011 Wasughe Mohamed 55 Male Shooting unsolved
2011 Khan Abdikadir 23 Male Shooting unsolved
2010 Sulub Yusuf 26 Male Shooting unsolved
2009 Hassan Jamila 27 Female Stabbing solved
2009 Aden Ayoob Abdulgadir 16 Male Stabbing unsolved
2008 Abdikarim Abdikarim 18 Male Shooting unsolved
2008 Warsame Mahamed 16 Male Other solved
2007 Handouleh Sharmarke 20 Male Stabbing solved
2006 Mahamed Abdiaziz 37 Male Other solved
2005 Ali Ali Mahamud 19 Male Shooting unsolved
2005 Gilao Loyan 23 Male Shooting unsolved
2004 Ali Ahmed 27 Male Stabbing solved
Table 4: Perception of safety post-violent crime
Level of safety N (%)
Not safe at all 10 (16 .95)
Moderately unsafe 12 (20 .34)
Neutral 19 (32 .20)
Safe 9 (15 .25)
Very safe 4 (6 .78)
Prefer not to answer 2 (3 .39)
Other 3 (5 .08)
Total 59
Table 3. Homicide Database N=40 (Toronto) (continued)

39
AN
OTH
ER DAY, A
NO
THER JA
NA
ZA
H: A
n Investigation into Violence, Hom
icide and Somali-C
anadian Youth in Ontario
Table 5: Perceptions and Experiences of Violence Among Somali youth in Ontario
Variable Total Sample
Number of Responses
N (%)
Frequency of violence experienced in community 80 72
Never 12 (16 .67)
Daily 1 (1 .39)
Weekly 9 (12 .50)
Monthly 21 (29 .17)
Yearly 17 (23 .61)
Prefer not to answer 3 (4 .17)
Other 9 (12 .50)
Types of violence experienced in community 80 69
Shootings 17 (24 .64)
Stabbings 28 (40 .58)
Homicides 36 (52 .17)
Suicides 7 (10 .14)
Domestic violence 23 (33 .33)
Prefer not to answer 4 (5 .80)
Other 16 (23 .19)
Populations deemed vulnerable to violence 80 70
Young men 57 (81 .43)
Young women 18 (25 .71)
Adults 3 (4 .29)
Elderly 5 (7 .14)
Everyone 7 (10 .0)
Prefer not to answer 1 (1 .43)
Other 3 (4 .29)
Number of victims of violence known 80 71
None 4 (5 .63)
1-4 27 (38 .03)
5-10 26 (36 .62)
11-20 8 (11 .27)
Prefer not to answer 3 (4 .23)
Other 3 (4 .23)

40
AN
OTH
ER D
AY, A
NO
THER
JA
NA
ZA
H: A
n In
vest
igat
ion
into
Vio
lenc
e, H
omic
ide
and
Som
ali-C
anad
ian
Yout
h in
Ont
ario
Table 6: Somali community leadership impact on violence prevention
Impact N (%)
Positive 5 (8 .62)
Negative 4 (6 .90)
No impact at all 16 (27 .59)
Some impact but could do more 29 (50)
Prefer not to answer 1 (1 .72)
Other 3 (5 .17)
Total 58
Table 7: Institutional impact on homicide reduction (ranked)
Institution1
Least Positive
2 3 4 5Most
Positive
TotalN
N (%)
Schools 11 (18 .97) 16 (27 .59) 19 (32 .76) 7 (12 .07) 5 (8 .62) 58
Households 4 (7 .025) 11 (19 .30) 18 (31 .58) 8 (14 .04) 16 (28 .07) 57
Police/Courts 35 (62 .05) 9 (16 .07) 7 (12 .50) 4 (7 .14) 1(1 .79) 56
Masjids (Mosques) 5(8 .77) 9 (15 .79) 13 (22 .81) 13 (22 .81) 17 (29 .82) 57
Broader Somali Community
5 (8 .93) 14(25 .00) 14 (25 .00) 13 (23 .21) 10 (17 .86) 56
Table 8: Stakeholder responsibility in reducing youth violence (ranked)
Stakeholders1
Not at all2 3 4 5
Very responsible
TotalN
N (%)
Youth 9 (15 .25) 7 (11 .86) 7 (11 .86) 9 (15 .25) 27 (45 .76) 59
Family members 3 (5 .17) 3 (5 .17) 13 (22 .41) 17 (29 .31) 22 (37 .93) 58
Police 14 (24 .56) 11 (19 .30) 12 (21 .05) 10 (17 .54) 10 (17 .54) 57
Educators 4 (6 .90) 13 (22 .41) 10 (17 .24) 13 (22 .41) 18 (31 .03) 58
Community Leaders 9 (15 .52) 5 (8 .62) 9 (15 .52) 12 (20 .69) 23 (39 .66) 58

41
AN
OTH
ER DAY, A
NO
THER JA
NA
ZA
H: A
n Investigation into Violence, Hom
icide and Somali-C
anadian Youth in Ontario
Table 9: Prioritizing youth community engagement (ranked)
Engagement strategies1
Least useful
2 3 4 5Most
useful
TotalN
N (%)
Greater youth involvement in community organizing
5 (8 .47) 6 (10 .17) 9 (15 .25) 14 (23 .73) 25 (42 .37) 59
Greater leadership roles for Somali youth in communities
6 (10 .34) 2 (3 .45) 8 (13 .79) 17 (29 .31) 25 (43 .10) 58
Increased access to religious/family counselling services
5 (8 .62) 11 (18 .97) 13 (22 .41) 10 (17 .24) 19 (32 .76) 58
Improved training/ development opportunities for Somali youth
2 (3 .45) 8 (13 .79) 11 (18 .97) 12 (20 .69) 25 (43 .10) 58
Greater support for youth offenders and youth victims
12 (21 .05) 4 (7 .02) 10 (17 .54) 12 (21 .05) 19 (33 .33) 57
Table 10: Community level of responsibility around violence prevention and reduction
Intra Community Responsibility N (%)
High 47 (79 .66)
Low 0 (0)
Some and growing 10 (16 .95)
Some but diminishing 0 (0)
None at all 2 (3 .39)
Prefer not to answer 0 (0)
Other 0 (0)
Total 59

42
AN
OTH
ER D
AY, A
NO
THER
JA
NA
ZA
H: A
n In
vest
igat
ion
into
Vio
lenc
e, H
omic
ide
and
Som
ali-C
anad
ian
Yout
h in
Ont
ario
Table 11. Socio-demographic characteristics of participants citing ‘homicides’ in experiences of violence
Variable Total Sample
Number of Responses
N (%)
Self Identification (Somali) 36 36 Yes 36 (100) No 0 (0)Age 36 36 14-19 4 (11 .11) 20-24 22 (61 .11) 25-30 8 (22 .22) Prefer not to answer 1 (2 .78) Other 1 (2 .78)Sex 36 36 Female 18 (50 .0) Male 18 (50 .0) Prefer not to answer 0 (0)Reside in Ontario 36 36 Yes 36 (100) No 0 (0)Household size 36 36 <5 21 (58 .33) 6-9 13 (36 .11) >10 1 (2 .78) Prefer not to answer 1 (2 .78)Length of neighbourhood residence (years) 36 35 <1 3 (8 .57) 2-5 3 (8 .57) 6-9 2 (5 .71) >10 27 (77 .14) Prefer not to answer 0 (0)Languages spoken at home 36 36 Somali 33 (91 .67) English 35 (97 .22) French 5 (13 .89) Arabic 4 (11 .11) Kiswahili 0 (0) Prefer not to answer 0 (0) Other 0 (0)Highest education completed (household) 36 36 High school 7 (19 .44) College/ vocational training 5 (13 .89) Bachelors Degree 12 (33 .33) Masters Degree 9 (25 .0) Doctorate/PhD 2 (5 .56) Prefer not to answer 1 (2 .78) Other 0 (0)


CONTACT US:
EMAIL: INFO@YOUTHLEAPS .CA
WEBSITE: WWW .YOUTHLEAPS .CA
TWITTER: @YOUTHLEAPS
ADDRESS: 105-1911 KENNEDY ROAD, TORONTO, ONTARIO M1P 2L9