anomaly detection and trend analysis of critical … · anomaly detection and trend analysis of...
TRANSCRIPT

Anomaly detection and trend analysis of criticalsystem states based on Nagios payload
Daniel Borkmann <[email protected]>
(Open Source Monitoring Conference 2009)
Leipzig University of Applied Science, Faculty of Computer Science,Mathematics, and Natural Sciences
Max Planck Institute for Human Cognitive and Brain Sciences, IT Department
October 28, 2009

Motivation
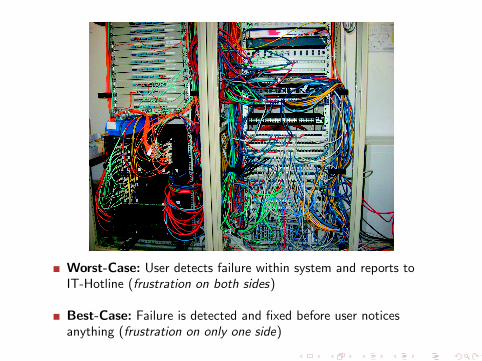
Worst-Case: User detects failure within system and reports toIT-Hotline (frustration on both sides)
Best-Case: Failure is detected and fixed before user noticesanything (frustration on only one side)

We face the situation ...
Nagios can only detect failures via static thresholds1
Is perfect for requesting boolean values (e.g. host is up or not)
But not so much in combination with numerical data fromcertain processes ...
... process behaviour changes over the time, our staticthresholds do not
... what if behaviour is anomalous within thresholds?
Network traffic,# Mail users,Temperature sensors, ...
1OK, WARNING, CRITICAL, UNKNOWN
We face the situation ...
Can we predict the future?2
Nagios has no possibility for payload extrapolation (trend)
Possible Use Cases
Software licences (e.g. Matlab),Network: volume-based restrictions,HD capacity,Stock quotes ;)
2... rhetorical question

1 Data collectionSniffing bytes over the net ... netsniff-ngIntegration into Nagios
2 Data analysisAssumptions about our data ...Anomaly detection techniques
Holt-Winters-Forecasting (and some improvements)Clusteranalysis approachInterface to NagiosGrapher
Trend analysisLevenberg-MarquardtREA-Framework
3 Links & Q+A

Data collection

Data collection Data analysis Links & Q+A
Data collection
For our analysis we need some numerical data ...
... as an example, we fetch network packets and generatestatistics
Let’s have a short look ...
Daniel Borkmann Anomaly detection and trend analysis

Sniffing bytes over the net ...netsniff-ng

Data collection Data analysis Links & Q+A
tcpdump, libpcap
Lets evaluate what could be used ...
tcpdump is a userspace network sniffer based on libpcap
libpcap: libpcap is a system-independent interface foruser-level packet capture. libpcap provides a portableframework for low-level network monitoring. Applicationsinclude network statistics collection, security monitoring,network debugging, etc.3
3http://sourceforge.net/projects/libpcap/
Daniel Borkmann Anomaly detection and trend analysis
Data collection Data analysis Links & Q+A
tcpdump, libpcap
libpcap programming isn’t hard, so here we go ... writing asniffer for Nagios based on libpcap
Sounds great, doesn’t it?
Daniel Borkmann Anomaly detection and trend analysis

Data collection Data analysis Links & Q+A
tcpdump, libpcap
tcpdump -i eth0 -n arp
strace clarifies our question ...
recvfrom(3, "\377\377\377\377\377\377\0\32ME|\211\10\6\0\1\10\0\6\4"..
., 96, MSG_TRUNC, {sa_family=AF_PACKET, proto=0x806, if50, pkttype=
PACKET_BROADCAST, addr(6)={1, 001a4d457c89}, [18]) = 60
ioctl(3, SIOCGSTAMP, 0xbfb43e70) = 0
write(1, "16:14:50.538813 arp who-has 10.0"..., 5516:14:50.538813 arp
who-has 10.0.53.26 tell 10.0.63.10) = 55
recvfrom(3, "\377\377\377\377\377\377\0\4v\243\330\242\10\6\0\1\10\0"..
., 96, MSG_TRUNC, {sa_family=AF_PACKET, proto=0x806, if50, pkttype=
PACKET_BROADCAST, addr(6)={1, 000476a3d8a2}, [18]) = 60
ioctl(3, SIOCGSTAMP, 0xbfb43e70) = 0
write(1, "16:14:50.624868 arp who-has 10.0"..., 5616:14:50.624868 arp
who-has 10.0.63.53 tell 10.0.54.184) = 56
Daniel Borkmann Anomaly detection and trend analysis

Data collection Data analysis Links & Q+A
tcpdump, libpcap
For every incoming frame a recvfrom-Syscall is executed
What does that mean?
recvfrom(...)Buffer will be copied from Userspace to Kernelspace4
Context switch (done by Scheduler / Dispatcher)Buffer will be copied from Kernelspace back to Userspace5
Context switch (done by Scheduler / Dispatcher)
... very time intensive if done for each frame!
... possible frame drops for socket during high traffic
4copy from user()5copy to user()
Daniel Borkmann Anomaly detection and trend analysis

Data collection Data analysis Links & Q+A
netsniff-ng
High performance network sniffer
Consists of
netsniff-ngcheck packets (client for Nagios)
Daniel Borkmann Anomaly detection and trend analysis
Data collection Data analysis Links & Q+A
netsniff-ng features
The sniffer itself ...
Runs in promiscuous mode
Bypasses the complete network stack
Uses Kernelspace Berkeley Packet Filter (BPF)
Allocates 128 MB or less (probing) Kernelspace Receive Ring(RX RING)
Ring is Memory-Mapped into Userspace (so no Syscalls likerecvfrom() needed → Zero-Copy)
Branchfree critical path (so we won’t smash the Pipeline)
Tested on Gigabit without packet loss
Can be run as Sysdaemon (silent, creates UDSServer for communication) or in foreground
Daniel Borkmann Anomaly detection and trend analysis

Data collection Data analysis Links & Q+A
netsniff-ng features
netsniff-ng -d eth0 -f /etc/netsniff-ng/rules/arp.bpf-C
strace again, looks better now ...
rt_sigprocmask(SIG_BLOCK, [USR1 ALRM], NULL, 8) = 0
rt_sigprocmask(SIG_UNBLOCK, [USR1 ALRM], NULL, 8) = 0
poll([{fd=3, events=POLLIN|POLLERR, revents=POLLIN}], 1, -1) = 1
write(2, "I: ", 3I: ) = 3
write(2, "60 bytes from 00:1a:4d:45:7c:89 "..., 5360 bytes from 00:
1a:4d:45:7c:89 to ff:ff:ff:ff:ff:ff) = 53
rt_sigprocmask(SIG_BLOCK, [USR1 ALRM], NULL, 8) = 0
rt_sigprocmask(SIG_UNBLOCK, [USR1 ALRM], NULL, 8) = 0
poll([{fd=3, events=POLLIN|POLLERR, revents=POLLIN}], 1, -1) = 1
write(2, "I: ", 3I: ) = 3
write(2, "60 bytes from 00:10:5a:d8:9a:a4 "..., 5360 bytes from 00:10:
5a:d8:9a:a4 to ff:ff:ff:ff:ff:ff) = 53
Daniel Borkmann Anomaly detection and trend analysis

Data collection Data analysis Links & Q+A
netsniff-ng features
netsniff-ng -d eth0 -f /etc/netsniff-ng/rules/icmp.bpf
ICMP-Flooding; only 0-3% CPU usage of netsniff-ng during tests
I: elapsed time: 0 d, 0 h, 4 min, 45 s
I: -----------+------------------+------------------+------------------
I: | per sec | per min | total
I: -----------+------------------+------------------+------------------
I: frames | 80201 | 4696273 | 20149411
I: -----------+------------------+------------------+------------------
I: in B | 119622775 | 7003546464 | 30048067864
I: in KB | 116819 | 6839400 | 29343816
I: in MB | 114 | 6679 | 28656
I: in GB | 0 | 6 | 27
I: -----------+------------------+------------------+------------------
[...]
I: 23724545 frames incoming
I: 23724545 frames passed filter
I: 0 frames failed filter (due to out of space)
I: captured frames: 23724545, captured bytes:
35377999772 [34548827 KB, 33739 MB, 32 GB]
Daniel Borkmann Anomaly detection and trend analysis
Data collection Data analysis Links & Q+A
check packets features
Is a Unix Domain Socket Client for netsniff-ng
Fetches collected network statistics at runtime via UDS inode
-n option for creating Nagios one-liner → Performance data
Simple Nagios integration with NRPE or check by ssh
Daniel Borkmann Anomaly detection and trend analysis

Integration into Nagios
Data collection Data analysis Links & Q+A
Integration into Nagios
Runs 24x7 on MPI router (DMZ ⇔ Router ⇔ Internet)
6 instances running with following BPFs:
AllHTTPBroadcastSSHWebserverMailserver traffic
Data will be passed via check by ssh6 (Port 22) through our internalFirewall to our Nagios server
Visualization realized by NagiosGrapher viaRound Robin Databases
6NRPE inappropriate in our case
Daniel Borkmann Anomaly detection and trend analysis

Data collection Data analysis Links & Q+A
Some results
({Sec|}IMAP, {Sec|}SMTP, POP3, HTTP traffic to our Zimbramailserver)
Daniel Borkmann Anomaly detection and trend analysis
Data collection Data analysis Links & Q+A
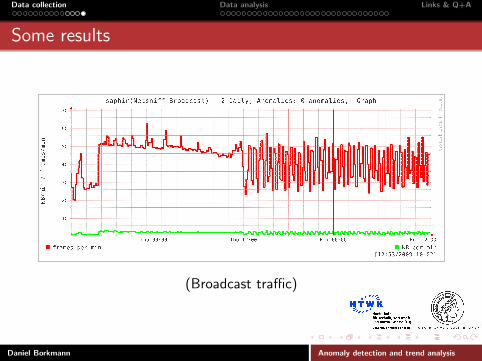
Some results
(Broadcast traffic)
Daniel Borkmann Anomaly detection and trend analysis
Data analysis

Assumptions about our data ...

Data collection Data analysis Links & Q+A
Assumptions
Generally our monitored processes equal Stochastic processes
Incoming anomalies itself are regarded as Poisson processes
A single data point has ...
Baseline (”intercept“) or irregular component
Linear trend (”slope“) component
Seasonal trend (at least one)
We assume components are additive
Daniel Borkmann Anomaly detection and trend analysis
Anomaly detection techniques

Holt-Winters-Forecasting (and someimprovements)

Data collection Data analysis Links & Q+A
Holt-Winters-Forecasting
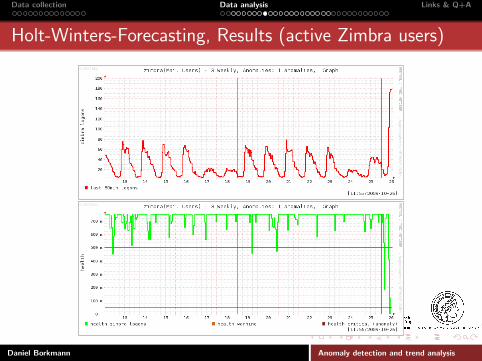
Based on exponential smoothing (recent data have higherweights than older ones): yt+1 = αyt + (1− α)yt with0 < α < 1
Decomposition of time series into components with tripleexponential smoothing technique
Multiplicative and additive versions
Forecast of the near future (with +/− deviation), check ifactual value falls into expected interval (if not: anomaly afterbreaking thresholds)
Daniel Borkmann Anomaly detection and trend analysis

Data collection Data analysis Links & Q+A
Holt-Winters-Forecasting
What the math model looks like:Prediction:yt+1 = at + bt + ct+1−m
at = α(yt − ct−m) + (1− α)(at−1 + bt−1) Baseline,
bt = β(at − at−1) + (1− β)bt−1 Linear trend,
ct = γ(yt − at) + (1− γ)ct−m Seasonal trend
0 < α, β, γ < 1
m: Len season
Confidence band coefficient:dt = γ|yt − yt |+ (1− γ)dt−m
Confidence band itself:I(yt − δ− ∗ dt−m, yt + δ+ ∗ dt−m) 2 < δ−, δ+ < 3
Sliding window as threshold foranomalies
Daniel Borkmann Anomaly detection and trend analysis

Data collection Data analysis Links & Q+A
Holt-Winters-Forecasting
Possible improvements:
Double seasonality (periods of week, day)Up to now only single seasonality (day) → parameterdisturbances of passing business days into non-business daysand vice versa
Parameter stabilization via Kalman filter [Gelper et al. 2007]Will make parameters more robust towards interferences ofanomalies
Miller extension for improving prediction of low trafficvalues [Miller 2007]
Longterm zero-values decreases confidenceband to minimal width → slightpayload variance will result in anomalyeven though it isn’t
Daniel Borkmann Anomaly detection and trend analysis

Data collection Data analysis Links & Q+A
Holt-Winters-Forecasting, Results (all traffic)
Daniel Borkmann Anomaly detection and trend analysis
Data collection Data analysis Links & Q+A
Holt-Winters-Forecasting, Results (active Zimbra users)
Daniel Borkmann Anomaly detection and trend analysis

Clusteranalysis approach

Data collection Data analysis Links & Q+A
Clusteranalysis approach
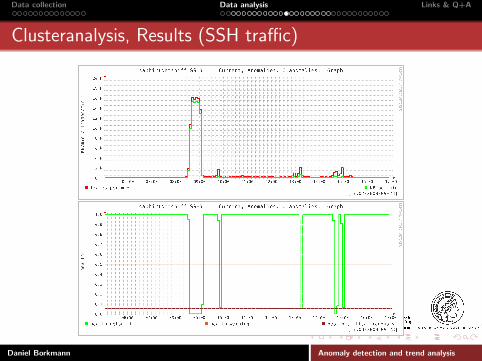
Idea: one-dimensional grouping of data points to intervalbands in order to separate anomalous from normal behaviour
Segregation of business days and non-business days
Grouping threshold set by standard deviation of PoissonProcess (adapted with coeffcient)
Groups consist of at least 25 per cent of data points (as perdefinition)
Daniel Borkmann Anomaly detection and trend analysis

Data collection Data analysis Links & Q+A
Clusteranalysis approach
Daniel Borkmann Anomaly detection and trend analysis
Data collection Data analysis Links & Q+A
Clusteranalysis, Results (SSH traffic)
Daniel Borkmann Anomaly detection and trend analysis

Data collection Data analysis Links & Q+A
Clusteranalysis, Results (Broadcast traffic)
Daniel Borkmann Anomaly detection and trend analysis

Interface to NagiosGrapher

Data collection Data analysis Links & Q+A
Interface to NagiosGrapher
Three thread queues filled during NGs collect2.pl runtime(patched against nagiosgrapher (1.6.1rc5-6), Debian Lenny(stable))
Detached threads check for anomalies according to givenalgorithm (start baseline.pl delegate after RRD update)
Module Baseline::Algorithm::CalcRRD with calc rrd() andcheck baseline() implemented for specific algorithm
Daniel Borkmann Anomaly detection and trend analysis

Data collection Data analysis Links & Q+A
Interface to NagiosGrapher
Algorithms swappable during runtime without payload loss!
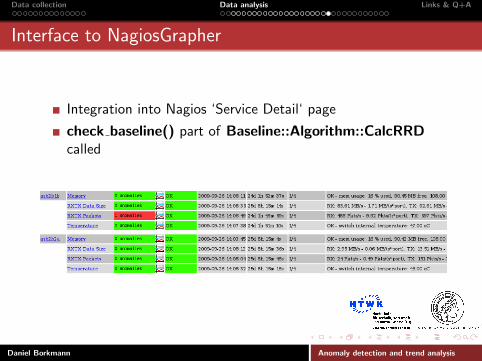
Anomaly information on Nagios ‘Service Detail‘ page
Baseline::Util::Routines contain helper routines for CalcRRDimplementation (as fetch stepping(), fetch lastupdate(),fetch table(), ...)
Daniel Borkmann Anomaly detection and trend analysis

Data collection Data analysis Links & Q+A
Interface to NagiosGrapher
Daniel Borkmann Anomaly detection and trend analysis

Data collection Data analysis Links & Q+A
NagiosGrapher GUI, config integration
define ngraph{
service_name Netsniff *
graph_log_regex .*per\sminute:\s+([0-9\.]+)\sframes
graph_value pktfr
graph_units frames/min
graph_legend frames per min
rrd_plottype LINE2
rrd_color FF0000
hide no
page data
}
define ngraph{
service_name Netsniff *
type BASELINE <-- unknown, will be ignored within perfdata parsing
graph_value pktfrbase
graph_units health
graph_legend health temperature
rrd_plottype LINE2
rrd_color 00ff00
hide no
page health_frames
}
Daniel Borkmann Anomaly detection and trend analysis

Data collection Data analysis Links & Q+A
Interface to NagiosGrapher
Two (or more) pages per Service (‘data‘, ‘health *‘)Actual data (payload, anomaly) still separated
Daniel Borkmann Anomaly detection and trend analysis
Data collection Data analysis Links & Q+A
Interface to NagiosGrapher
Integration into Nagios ‘Service Detail‘ page
check baseline() part of Baseline::Algorithm::CalcRRDcalled
Daniel Borkmann Anomaly detection and trend analysis

Trend analysis

Levenberg-Marquardt

Data collection Data analysis Links & Q+A
Levenberg-Marquardt
Non-linear fitting algorithm
Fits a math model (e.g. f (x) := acos(bx) + bsin(ax) + c) intoa series of data points with minimal residuals (parametersearch → {a, b, c})
More ‘stable‘ in finding local minimum (even with a badchosen start vector) than Gauss-Newton method (with‘lambda decay‘)
Non-linearity approximated by iterative solving of linearequation systems (Taylor series)
Note: quality of the fit depends on yourdefined model!
Daniel Borkmann Anomaly detection and trend analysis

REA7-Framework
7RRD extrapolation and analysis

Data collection Data analysis Links & Q+A
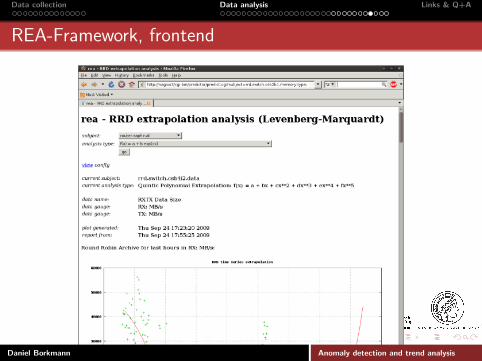
REA-Framework
NG-independet script collection (works with all possible RRDs)
generate.plCalled via nightly cronjobAutomatically extracts RRD payload (extract raw.pl) →triple: (timestamp, normalized idx, data value)Runs configured plugins via gnuplot processorGenerates graph images (if possible) and copies them intoWWW-dir
predict.cgiUser interfaceUser assigns configured ‘subject‘ (e.g. host service) to ‘analysistype‘ (e.g. monomial extrapolation)All RRA specific graphs with chosen fitsare shown
Daniel Borkmann Anomaly detection and trend analysis

Data collection Data analysis Links & Q+A
REA-Framework
Daniel Borkmann Anomaly detection and trend analysis

Data collection Data analysis Links & Q+A
REA-Framework, plugin for Monomial extrapolation
#!/usr/bin/gnuplot
FIT_LIMIT = 1e-6
FIT_MAXITER = 80
f(x) = a * (x - b)**n + c
fit f(x) "exp.dat" using 2:3 via a, b, c, n
set grid
set title "RRD time series extrapolation"
set timefmt "%s"
set xdata time
set format x "%d.%m.%Y, %H/%M"
set xlabel " "
set ylabel " "
set xtics rotate by 90 scale 0
set key below
plot "< cat exp.dat fore.dat" using 1:(f($2)) title "best \’a * (x - b)^n + c\’ fit" with lines, \
"exp.dat" using 1:3 title "time series data" with points
set term png size 1024, 768
set output "plot.png"
replot
set term dumb
Daniel Borkmann Anomaly detection and trend analysis
Data collection Data analysis Links & Q+A
REA-Framework, frontend
Daniel Borkmann Anomaly detection and trend analysis

Data collection Data analysis Links & Q+A
REA-Framework, Results (Traffic to webserver, KB/min)
Daniel Borkmann Anomaly detection and trend analysis

Data collection Data analysis Links & Q+A
REA-Framework, Results (Broadcast traffic, Frames/min)
Daniel Borkmann Anomaly detection and trend analysis

Data collection Data analysis Links & Q+A
REA-Framework, Results (SSH traffic, Frames/min)
Daniel Borkmann Anomaly detection and trend analysis

Data collection Data analysis Links & Q+A
Acknowledgement
Dr. Helmut Hayd, Max Planck Institute for Human Cognitiveand Brain Sciences
Prof. Dr.-Ing. Dietmar Reimann, Leipzig University of AppliedScience, Faculty of Computer Science, Mathematics, andNatural Sciences
Daniel Borkmann Anomaly detection and trend analysis

Data collection Data analysis Links & Q+A
Links
Thesis: http://edoc.mpg.de/437809
netsniff-ng: http://netsniff-ng.googlecode.com
All the rest8: <[email protected]>
8It’s still a prototype ...
Daniel Borkmann Anomaly detection and trend analysis
Data collection Data analysis Links & Q+A
Q+A?
Daniel Borkmann Anomaly detection and trend analysis