anomalous shear wave delays and surface wave velocities … · tions in shear wave velocities, ......
TRANSCRIPT

JOURNAL OF GEOPHYSICAL RESEARCH, VOL. 87, NO. B4, PAGES 2731-2744, APRIL 10, 1982
Anomalous Shear Wave Delays and Surface Wave Velocities at Yellowstone Caldera, Wyoming
ROBERT G. DANIEL 1 AND DAVID M. BOORE 1
Department of Geophysics, Stanford University, Stanford, California 94305
To investigate the effects of a geothermal area on the propagation of intermediate-period (1-30 s) teleseismic body waves and surface waves, a specially designed portable seismograph system was operated in Yellowstone Caldera, Wyoming. Travel time residuals, relative to a station outside the caldera, of up to 2 s for compressional phases are in agreement with short-period residuals for P phases measured by other investigators. Travel time delays for shear arrivals in the intermediate-period band range from 2 to 9 s and decrease with increasing dT/dA. Measured Rayleigh wave phase velocities are extremely low, ranging from 3.2 km/s at 27-s period to 2.0 km/s at 7-s period; the estimated uncertainty associated with these values is 15%. We propose a model for compressional and shear velocities and Poisson's ratio beneath the Yellowstone caldera which fits the teleseismic body and surface wave data: it consists of a highly anomalous crust with an average shear velocity of 3.0 km/s overlying an upper mantle with average velocity of 4.1 km/s. The high average value of Poisson's ratio in the crust (0.34) suggests the presence of fluids there; Poisson's ratio in the mantle between 40 and approximately 200 km is more nearly normal (0.29) than in the crust. A discrepancy between normal values of Poisson's ratio in the crust calculated from short-period data and high values calculated from teleseismic data can be resolved by postulating a viscoelastic crustal model with frequency-dependent shear velocity and attenuation.
INTRODUCTION
A widely accepted model for a geothermal resource area consists of a permeable section of crust with circulating water or steam heated from below by a high-temperature cooling pluton. We investigated the potential use of interme- diate-period (1-30 s) seismic body and surface waves in locating and outlining the source of upper crustal heat anomalies and present results of field work conducted on a site of intense geothermal activity, Yellowstone Caldera, Wyoming. The obvious surface hydrothermal displays and large volumes of extrusive volcanic rock there imply abun- dant recent volcanic activity [Eaton et al., 1975]. Geophysi- cal evidence from several studies, including aeromagnetic anomalies and shallow seismicity [Smith et al., 1977], heat flow [Morgan et al., 1977], gravity [Eaton et al., 1975], and teleseismic P travel times [Iyer, 1975; Iyer et al., 1981], suggests the presence of a body with anomalously high
_ temperature and low compressional wave velocity, extend- ing from near the surface to perhaps over 200-km depth. The Yellowstone area therefore provides a natural laboratory in which to study the effects on seismic wave propagation of a large zone known to have a high heat content. In addition, determination of the shear velocity structure of the Yellow- stone hot spot is expected to contribute to our understanding of the evolution of this feature and the adjacent Snake River Plain volcanic province, to which it bears a close relation- ship.
It is well known that as materials approach their melting points, changes in shear modulus can be larger than for other elastic constants [Mavko, 1980]. This suggests that varia- tions in shear wave velocities, if they can be resolved, could be a diagnostic property of localized crustal heat sources. S waves from local and regional earthquakes in the Katmai,
• Now at U.S. Geological Survey, Menlo Park, California 94025.
This paper is not subject to U.S. copyright. Published in 1982 by the American Geophysical Union.
Paper number 1B0862.
Alaska, region were studied by Kubota and Berg [1967]. They used the lack of S phases on seismograms recorded by short-period vertical component instruments to infer the presence of about ten zones of magma. A similar study was done by Einarsson [1978] in Iceland. Data from Yellowstone presented by Pitt [1974] show attenuation of short-period P and S waves from local events, although the amount of attenuation observed in the caldera varies greatly, depending on the location of both source and receiver.
From the results of these studies, it is apparent that a unified experiment investigating anomalies in teleseismic compressional, shear, and surface wave velocity in an area such as Yellowstone would be a logical step in the applica- tion of seismic methods to geothermal exploration and to crustal-structure studies. Because much of the energy in these types of seismic signal lies outside the frequency range of standard portable microearthquake recording equipment, it was necessary to design and construct a recording system with an unconventional passband, as described in the follow- ing section.
INTERMEDIATE-PERIOD INSTRUMENTATION
In seismograms of shallow teleseisms recorded world- wide, there is practically no usable shear wave energy at frequencies higher than 0.2 Hz because of attenuation occur- ring principally in the low-velocity zone at depths between approximately 90 and 160 km [Marshall et al., 1975]. Consid- erable teleseismic S and surface wave energy is concentrated at frequencies between 0.03 and 0.2 Hz, and teleseismic P wave energy is seldom recorded above 3 Hz. To record signals in the 0.03- to 1.0-Hz band on portable instruments, we constructed a three-component seismograph system us- ing the low-pass-filtered output of short-period seismome- ters [Daniel, 1979a] to maximize portability, ruggedness, and ease of installation in remote areas. The system's velocity response was fiat from 0.08 to 0.8 Hz. Analog records using 10-day FM magnetic tape recorders were made at each field site, with playback and digitizing done in the
2731
2732 DANIEL AND BOORE: ANOMALOUS SHEAR WAVE DELAYS AT YELLOWSTONE
HEN . ./",.../- • Refere nce,•,
ß .
GlIB .... •,•? • • '. / .... Y•'• .... OTT
,,' •,.• ?' DEL • •."7•'•'"
, '"., .............. - • o I I I o , kdometers II 0 ø
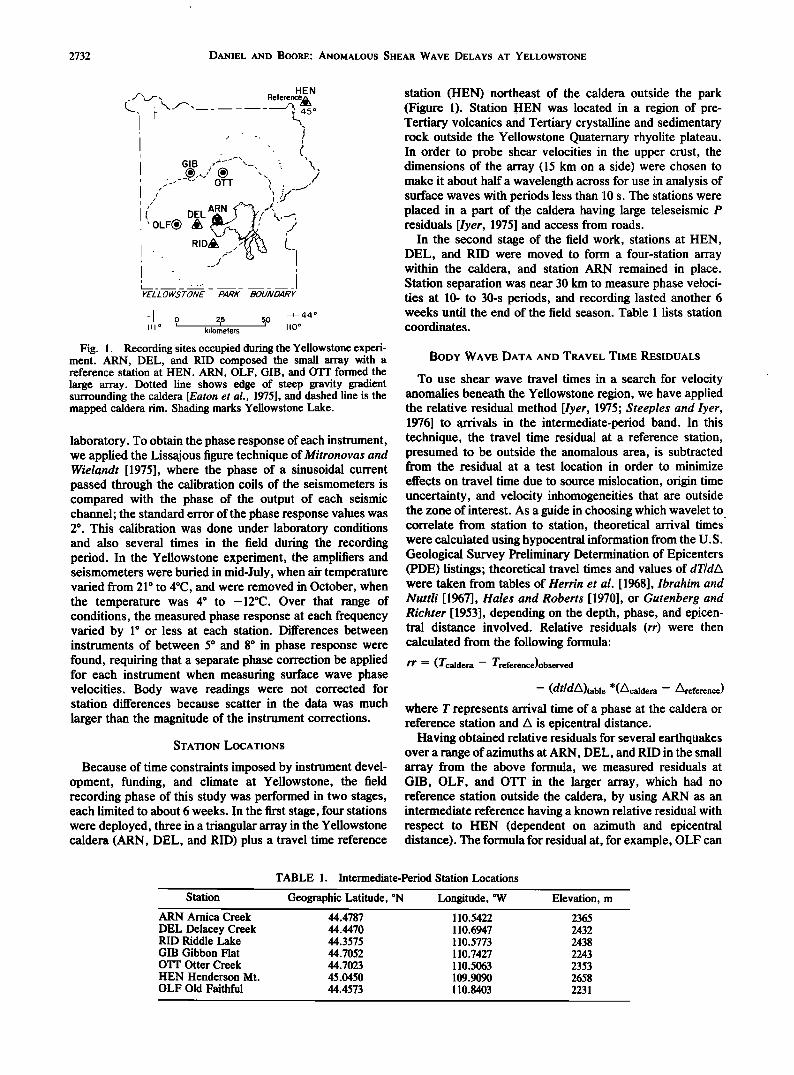
Fig. 1. Recording sims occupied du•g the Yellowstone cxpc•- merit. ARN, DEL, and •D composed the smMl a•ay with a rc•crc•cc statio• at HEN. A•, OLF, GIB, a•d OTT •o•cd the large a•ay. Dotted ]i•c shows cdgc o• smcp •avity •adic•t su•ou•di•g the cMdcra [•a•o• • aL, 1975], a•d dashed ]inc is the mapped cMdcra •m. Shading marks Yc]]owstonc Lake.
laboratory. To obtain the phase response of each instrument, we applied the Lissajous figure technique of Mitronovas and Wielandt [1975], where the phase of a sinusoidal current passed through the calibration coils of the seismometers is compared with the phase of the output of each seismic channel; the standard error of the phase response values was 2 ø . This calibration was done under laboratory conditions and also several times in the field during the recording period. In the Yellowstone experiment, the amplifiers and seismometers were buried in mid-July, when air temperature varied from 21 ø to 4øC, and were removed in October, when the temperature was 4 ø to -12øC. Over that range of conditions, the measured phase response at each frequency varied by 1 ø or less at each station. Differences between instruments of between 5 ø and 8 ø in phase response were found, requiring that a separate phase correction be applied for each instrument when measuring surface wave phase velocities. Body wave readings were not corrected for station differences because scatter in the data was much
larger than the magnitude of the instrument corrections.
STATION LOCATIONS
Because of time constraints imposed by instrument devel- opment, funding, and climate at Yellowstone, the field recording phase of this study was performed in two stages, each limited to about 6 weeks. In the first stage, four stations were deployed, three in a triangular array in the Yellowstone caldera (ARN, DEL, and RID) plus a travel time reference
station (HEN) northeast of the caldera outside the park (Figure 1). Station HEN was located in a region of pre- Tertiary volcanics and Tertiary crystalline and sedimentary rock outside the Yellowstone Quaternary rhyolite plateau. In order to probe shear velocities in the upper crust, the dimensions of the array (15 km on a side) were chosen to make it about half a wavelength across for use in analysis of surface waves with periods less than 10 s. The stations were placed in a part of the caldera having large teleseismic P residuals [Iyer, 1975] and access from roads.
In the second stage of the field work, stations at HEN, DEL, and RID were moved to form a four-station array within the caldera, and station ARN remained in place. Station separation was near 30 km to measure phase veloci- ties at 10- to 30-s periods, and recording lasted another 6 weeks until the end of the field season. Table 1 lists station
coordinates.
BODY WAVE DATA AND TRAVEL TIME RESIDUALS
To use shear wave travel times in a search for velocity anomalies beneath the Yellowstone region, we have applied the relative residual method [Iyer, 1975; Steeples and Iyer, 1976] to arrivals in the intermediate-period band. In this technique, the travel time residual at a reference station, presumed to be outside the anomalous area, is subtracted from the residual at a test location in order to minimize
effects on travel time due to source mislocation, origin time uncertainty, and velocity inhomogeneities that are outside the zone of interest. As a guide in choosing which wavelet to correlate from station to station, theoretical arrival times were calculated using hypocentral information from the U.S. Geological Survey Preliminary Determination of Epicenters (PDE) listings; theoretical travel times and values of dT/dA were taken from tables of Herrin et al. [1968], Ibrahim and Nuttli [1967], Hales and Roberts [1970], or Gutenberg and Richter [1953], depending on the depth, phase, and epicen- tral distance involved. Relative residuals (rr) were then calculated from the following formula:
rr = (Tcalder a -- Treference)observed
-- (dtldA)tabl½ *(Acaldera -- Areference)
where T represents arrival time of a phase at the caldera or reference station and A is epicentral distance.
Having obtained relative residuals for several earthquakes over a range of azimuths at ARN, DEL, and RID in the small array from the above formula, we measured residuals at GIB, OLF, and OTT in the larger array, which had no reference station outside the caldera, by using ARN as an intermediate reference having a known relative residual with respect to HEN (dependent on azimuth and epicentral distance). The formula for residual at, for example, OLF can
TABLE 1. Intermediate-Period Station Locations
Station Geographic Latitude, øN Longitude, øW Elevation, m
ARN Arnica Creek 44.4787 110.5422 2365 DEL Delacey Creek 44.4470 110.6947 2432 RID Riddle Lake 44.3575 110.5773 2438 GIB Gibbon Flat 44.7052 110.7427 2243 OTT Otter Creek 44.7023 110.5063 2353 HEN Henderson Mt. 45.0450 109.9090 2658 OLF Old Faithful 44.4573 110.8403 2231
DANIEL AND BOOgE: ANOMALOUS SHEAR WAVE DELAYS AT YELLOWSTONE 2733
Date, 1976
TABLE 2. Earthquakes Used for Shear Wave Relative Residuals (USGS PDE Data) Location
Origin Time, Depth, Delta, Azimuth, UT Latitude Longitude Region km mb deg deg
July 26 0256:39.3 4.9øN 118.3øE Borneo 33 5.8 114 304 July 27 1942:54.6 39.6øN 118.0øE Tangshan 23 6.3 85 324 July 28 1045:35.2 39.7øN 118.4øE Tangshan 26 6.3 85 324 July 31 0046:38.0 30.3øS 178.0øW Kermadec 20 5.8 96 234 Aug. 2 1055:25.7 20.6øS 169.3øE New Hebrides 52 6.1 98 249 Aug. 10 0010:26.9 2.1øN 79.0øW Panama 33 5.5 50 137 Aug. 16 1406:45.9 32.7øN 104.2øE Szechuan 16 6.1 97 331 Aug. 16 1611:07.3 6.3øN 124.0øE Mindanao 33 6.4 109 301 Aug. 17 0419:27.3 7.2øN 122.9øE Mindanao 22 6.2 109 301 Aug. 20 0654:11.3 20.4øS 70.0øW N. Chile 81 5.6 75 141 Sept. 15 0921:19.1 46.3øN 13.1øE Italy 17 5.4 77 36 Sept. 16 0326:52.0 84.3øN 0.8øE Svalbard 8 5.3 48 7 Oct. 12 0040:52.9 10.5øS 161.3øE Solomon Islands 106 6.3 96 261
be found by subtracting the relative residuals at two stations as follows:
rrOLF = rrnRN + (TOLF- TARN)observed- (dT/dA)table * (AOLF ' /• ARN)
Similar formulas can be applied to stations GIB and OTT in the larger array.
To obtain travel time differences between the reference
and caldera stations, seismograms for a desired arrival at each station were plotted to identical time scales and man- ually overlaid and shifted along the time axis until the maximum correspondence between traces appeared. To separate SV from SH motion, the digital horizontal compo- nent seismograms were rotated into radial and transverse components using azimuths determined from PDE listings. Emphasis in the manual correlation was given to the early part of the arrival and to the first zero crossing. To check results, numerical cross correlation was performed on shear arrivals from two teleseisms, and results agreed with those
of the visual method to within a few tenths of a second for
waveforms with dominant periods near 20 s. We relied primarily on the visual method because it was cheaper and faster, gave results equivalent to the digital method, and was less subject to error caused by contamination from nearby phases with different dT/dA from the phase of interest. The technique was also used to measure relative residuals from P and PP for three teleseisms to the northwest of the array, and results for caldera stations agreed to within 0.2 s with the P residual measurements at short periods reported by Iyer [1975].
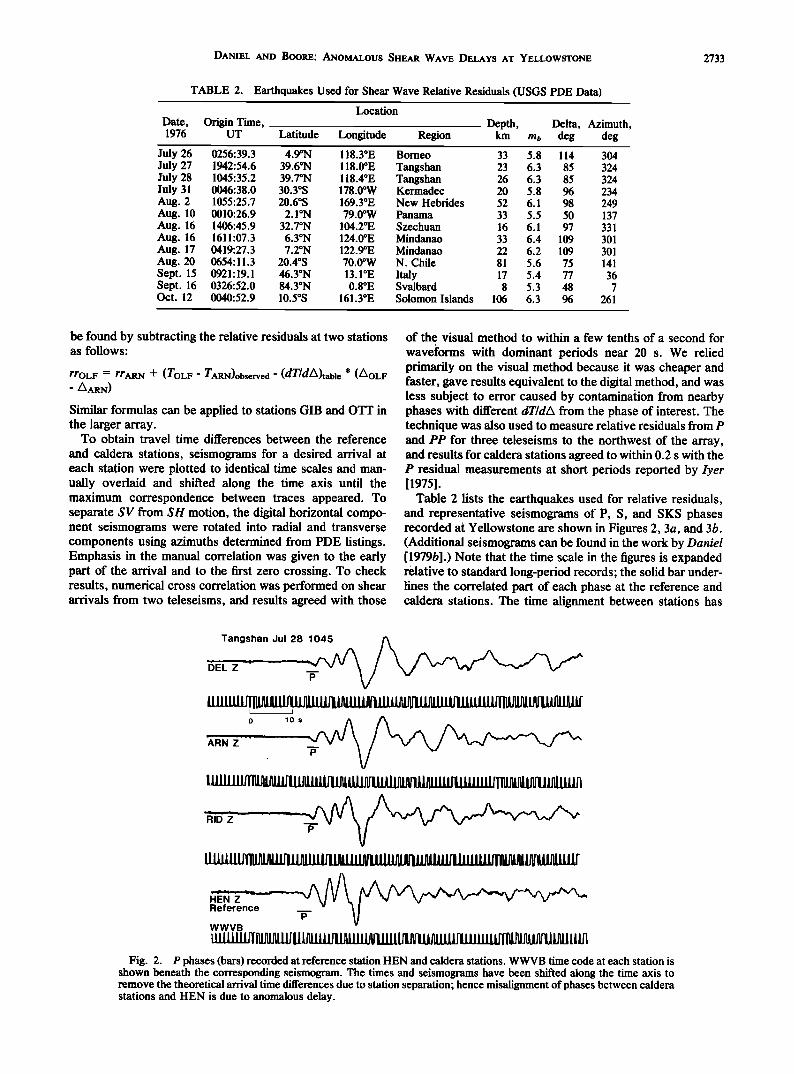
Table 2 lists the earthquakes used for relative residuals, and representative seismograms of P, S, and SKS phases recorded at Yellowstone are shown in Figures 2, 3a, and 3b. (Additional seismograms can be found in the work by Daniel [1979b].) Note that the time scale in the figures is expanded relative to standard long-period records; the solid bar under- lines the correlated part of each phase at the reference and caldera stations. The time alignment between stations has
Tangshan Jul 28 1045
0 10s_ ,
Reference • ' WWVB
Fig. 2. P phases (bars) recorded at reference station HEN and caldera stations. WWYB time code at each station is shown beneath the corresponding seismogram. The times and seismograms have been shifted along the time axis to remove the theoretical arrival time differences due to station separation; hence misalignment of phases between caldera stations and HEN is due to anomalous delay.
2734 DANIEL AND BOORE: ANOMALOUS SHEAR WAVE DELAYS AT YELLOWSTONE
o. Kermadec Jul 31 0046
SKS
DEL tran • • SKS
HENtran._•_._ ' '• • V VV • ' Reference SKS
b. Kermadec Jul 31 0046
SKS S
A .X",,
Reference SKS S¾
WWVB •[J•[•[J•l•t 0 10s
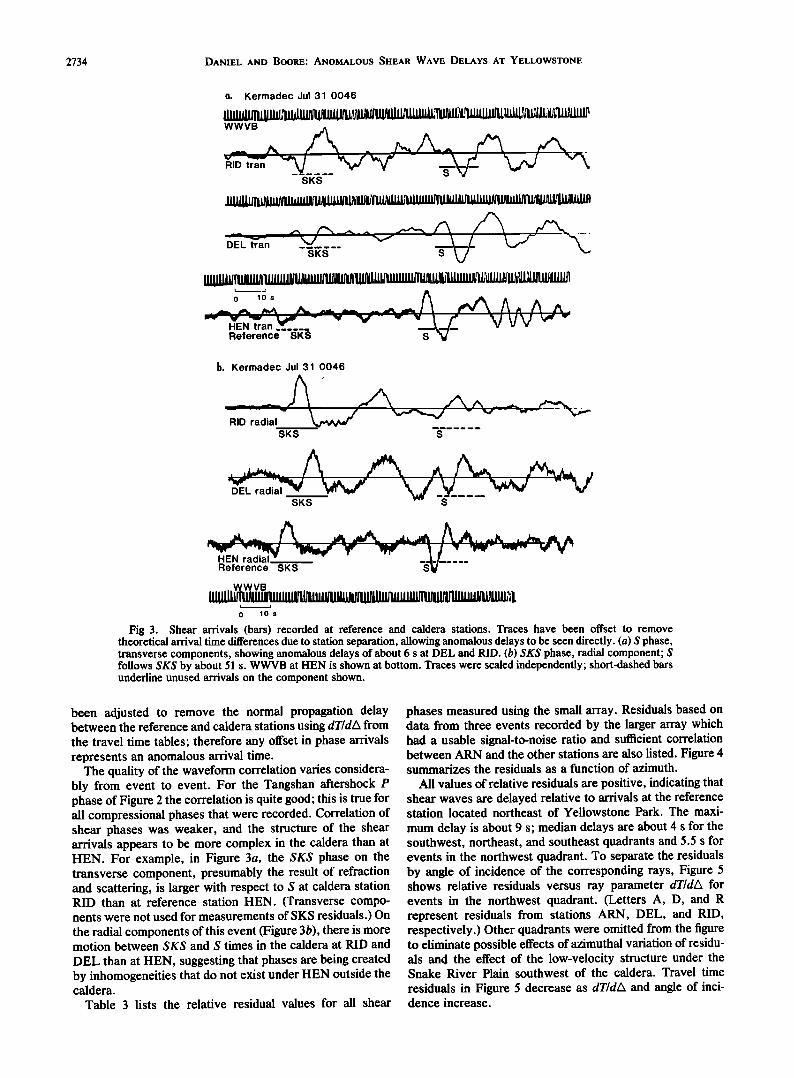
Fig 3. Shear arrivals (bars) recorded at reference and caldera stations. Traces have been offset to remove theoretical arrival time differences due to station separation, allowing anomalous delays to be seen directly. (a) S phase, transverse components, showing anomalous delays of about 6 s at DEL and RID. (b) SKS phase, radial component; S follows SKS by about 51 s. WWVB at HEN is shown at bottom. Traces were scaled independently' short-dashed bars underline unused arrivals on the component shown.
been adjusted to remove the normal propagation delay between the reference and caldera stations using dT/dA from the travel time tables; therefore any offset in phase arrivals represents an anomalous arrival time.
The quality of the waveform correlation varies considera- bly from event to event. For the Tangshan aftershock P phase of Figure 2 the correlation is quite good; this is true for all compressional phases that were recorded. Correlation of shear phases was weaker, and the structure of the shear arrivals appears to be more complex in the caldera than at HEN. For example, in Figure 3a, the SKS phase on the transverse component, presumably the result of refraction and scattering, is larger with respect to S at caldera station RID than at reference station HEN. (Transverse compo- nents were not used for measurements of SKS residuals.) On the radial components of this event (Figure 3b), there is more motion between SKS and S times in the caldera at RID and DEL than at HEN, suggesting that phases are being created by inhomogeneities that do not exist under HEN outside the caldera.
Table 3 lists the relative residual values for all shear
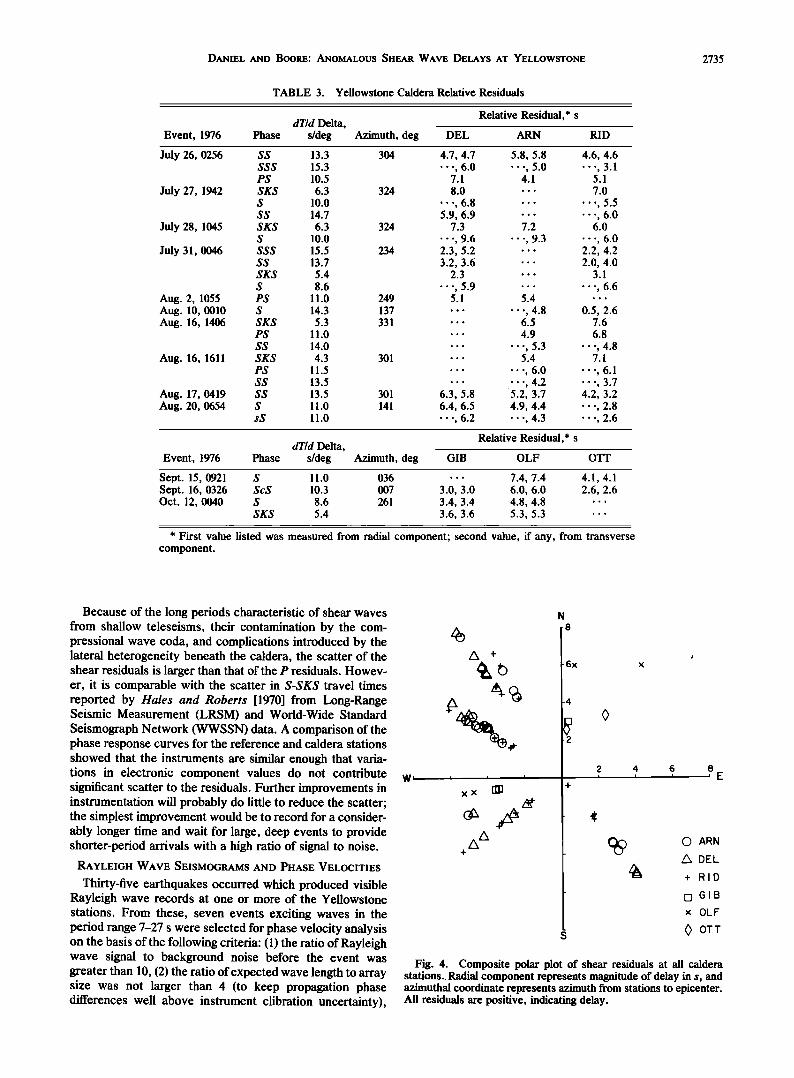
phases measured using the small array. Residuals based on data from three events recorded by the larger array which had a usable signal-to-noise ratio and sufficient correlation between ARN and the other stations are also listed. Figure 4 summarizes the residuals as a function of azimuth.
All values of relative residuals are positive, indicating that shear waves are delayed relative to arrivals at the reference station located northeast of Yellowstone Park. The maxi- mum delay is about 9 s; median delays are about 4 s for the southwest, northeast, and southeast quadrants and 5.5 s for events in the northwest quadrant. To separate the residuals by angle of incidence of the corresponding rays, Figure 5 shows relative residuals versus ray parameter dT/dA for events in the northwest quadrant. (Letters A, D, and R represent residuals from stations ARN, DEL, and RID, respectively.) Other quadrants were omitted from the figure to eliminate possible effects of azimuthal variation of residu- als and the effect of the low-velocity structure under the Snake River Plain southwest of the caldera. Travel time residuals in Figure 5 decrease as dT/dA and angle of inci- dence increase.
DANIEL AND BOORE: ANOMALOUS SHEAR WAVE DELAYS AT YELLOWSTONE 2735
TABLE 3. Yellowstone Caldera Relative Residuals
Relative Residual,* s dT/d Delta,
Event, 1976 Phase s/deg Azimuth, deg DEL ARN RID
July 26, 0256 SS 13.3 304 4.7, 4.7 5.8, 5.8 4.6, 4.6 SSS 15.3 ..., 6.0 ..., 5.0 ..., 3.1 PS 10.5 7.1 4.1 5.1
July 27, 1942 SKS 6.3 324 8.0 ... 7.0 S 10.0 ..., 6.8 ...... ,5.5 SS 14.7 5.9, 6.9 ...... ,6.0
July 28, 1045 SKS 6.3 324 7.3 7.2 6.0 S 10.0 .--, 9.6 ..-, 9.3 ..., 6.0
July 31, 0046 SSS 15.5 234 2.3, 5.2 ... 2.2, 4.2 SS 13.7 3.2, 3.6 ... 2.0, 4.0 SKS 5.4 2.3 ß ß ß 3.1
S 8.6 ..-, 5.9 ...... ,6.6 Aug. 2, 1055 PS 11.0 249 5.1 5.4 ... Aug. 10, 0010 S 14.3 137 ...... ,4.8 0.5, 2.6 Aug. 16, 1406 SKS 5.3 331 ... 6.5 7.6
PS 11.0 . ß ß 4.9 6.8
SS 14.0 ...... ,5.3 ..., 4.8 Aug. 16, 1611 SKS 4.3 301 ... 5.4 7.1
PS 11.5 ...... ,6.0 ß ß., 6.1 SS 13.5 ...... ,4.2 ß ß., 3.7
Aug. 17, 0419 SS 13.5 301 6.3, 5.8 5.2, 3.7 4.2, 3.2 Aug. 20, 0654 S 11.0 141 6.4, 6.5 4.9, 4.4 ..-, 2.8
sS 11.0 ..., 6.2 ..., 4.3 ..., 2.6
Relative Residual,* s dT/d Delta,
Event, 1976 Phase s/deg Azimuth, deg GIB OLF OTT
Sept. 15, 0921 S 11.0 036 ... 7.4, 7.4 4.1, 4.1 Sept. 16, 0326 ScS 10.3 007 3.0, 3.0 6.0, 6.0 2.6, 2.6 Oct. 12, 0040 S 8.6 261 3.4, 3.4 4.8, 4.8 ...
SKS 5.4 3.6, 3.6 5.3, 5.3 ...
* First value listed was measured from radial component; second value, if any, from transverse component.
Because of the long periods characteristic of shear waves from shallow teleseisms, their contamination by the com- pressional wave coda, and complications introduced by the lateral heterogeneity beneath the caldera, the scatter of the shear residuals is larger than that of the P residuals. Howev- er, it is comparable with the scatter in S-SKS travel times reported by Hales and Roberts [1970] from Long-Range Seismic Measurement (LRSM) and World-Wide Standard Seismograph Network (WWSSN) data. A comparison of the phase response curves for the reference and caldera stations showed that the instruments are similar enough that varia- tions in electronic component values do not contribute significant scatter to the residuals. Further improvements in instrumentation will probably do little to reduce the scatter; the simplest improvement would be to record for a consider- ably longer time and wait for large, deep events to provide shorter-period arrivals with a high ratio of signal to noise.
RAYLEIGH WAVE SEISMOGRAMS AND PHASE VELOCITIES
Thirty-five earthquakes occurred which produced visible Rayleigh wave records at one or more of the Yellowstone stations. From these, seven events exciting waves in the period range 7-27 s were selected for phase velocity analysis on the basis of the following criteria: (1) the ratio of Rayleigh wave signal to background noise before the event was greater than 10, (2) the ratio of expected wave length to array size was not larger than 4 (to keep propagation phase differences well above instrument clibration uncertainty),
W L
N
4 6 8
0 ARN
Zl DEL
+ RID
[] GIB x OLF
• OTT
Fig. 4. Composite polar plot of shear residuals at all caldera stations.. Radial component represents magnitude of delay in s, and azimuthal coordinate represents azimuth from stations to epicenter. All residuals are positive, indicating delay.
2736 DANIEL AND BOORE: ANOMALOUS SHEAR WAVE DELAYS AT YELLOWSTONE
I I I I I ! I I I I I ! I I I
Northwest events] _
I I I I I I I ] I I I I I I I I I s I•
dT/dA, s/deg
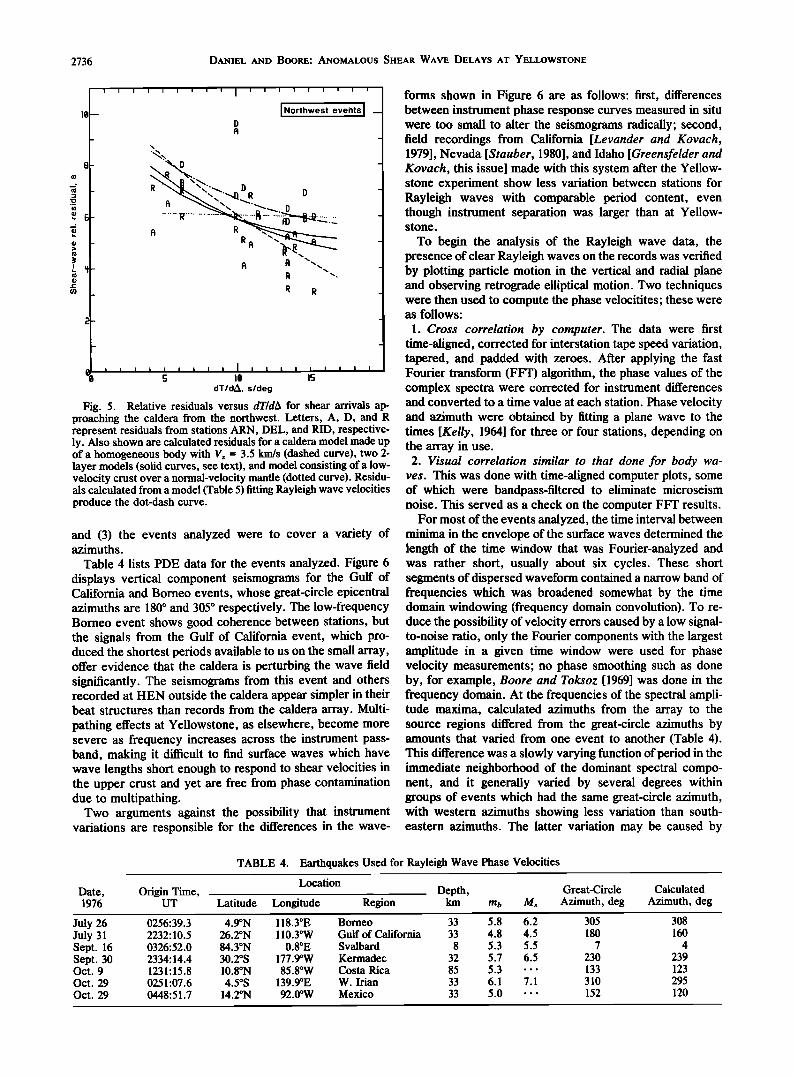
Fig. 5. Relative residuals versus dT/dA for shear arrivals ap- proaching the caldera from the northwest. Letters, A, D, and R represent residuals from stations ARN, DEL, and RID, respective- ly. Also shown are calculated residuals for a caldera model made up of a homogeneous body with Vs = 3.5 km/s (dashed curve), two 2- layer models (solid curves, see text), and model consisting of a low- velocity crust over a normal-velocity mantle (dotted curve). Residu- als calculated from a model (Table 5) fitting Rayleigh wave velocities produce the dot-dash curve.
and (3) the events analyzed were to cover a variety of azimuths.
Table 4 lists PDE data for the events analyzed. Figure 6 displays vertical component seismograms for the Gulf of California and Borneo events, whose great-circle epicentral azimuths are 180 ø and 305 ø respectively. The low-frequency Borneo event shows good coherence between stations, but the signals from the Gulf of California event, which pro- duced the shortest periods available to us on the small array, offer evidence that the caldera is perturbing the wave field significantly. The seismograms from this event and others recorded at HEN outside the caldera appear simpler in their beat structures than records from the caldera array. Multi- pathing effects at Yellowstone, as elsewhere, become more severe as frequency increases across the instrument pass- band, making it difficult to find surface waves which have wave lengths short enough to respond to shear velocities in the upper crust and yet are free from phase contamination due to multipathing.
Two arguments against the possibility that instrument variations are responsible for the differences in the wave-
forms shown in Figure 6 are as follows: first, differences between instrument phase response curves measured in situ were too small to alter the seismograms radically; second, field recordings from California [Levander and Kovach, 1979], Nevada [Stauber, 1980], and Idaho [Greensfelder and Kovach, this issue] made with this system after the Yellow- stone experiment show less variation between stations for Rayleigh waves with comparable period content, even though instrument separation was larger than at Yellow- stone.
To begin the analysis of the Rayleigh wave data, the presence of clear Rayleigh waves on the records was verified by plotting particle motion in the vertical and radial plane and observing retrograde elliptical motion. Two techniques were then used to compute the phase velocitites; these were as follows:
1. Cross correlation by computer. The data were first time-aligned, corrected for interstation tape speed variation, tapered, and padded with zeroes. After applying the fast Fourier transform (FFT) algorithm, the phase values of the complex spectra were corrected for instrument differences and converted to a time value at each station. Phase velocity and azimuth were obtained by fitting a plane wave to the times [Kelly, 1964] for three or four stations, depending on the array in use. 2. Visual correlation similar to that done for body wa-
ves. This was done with time-aligned computer plots, some of which were bandpass-filtered to eliminate microseism noise. This served as a check on the computer FFT results.
For most of the events analyzed, the time interval between minima in the envelope of the surface waves determined the length of the time window that was Fourier-analyzed and was rather short, usually about six cycles. These short segments of dispersed waveform contained a narrow band of frequencies which was broadened somewhat by the time domain windowing (frequency domain convolution). To re- duce the possibility of velocity errors caused by a low signal- to-noise ratio, only the Fourier components with the largest amplitude in a given time window were used for phase velocity measurements; no phase smoothing such as done by, for example, Boore and Toksoz [1969] was done in the frequency domain. At the frequencies of the spectral ampli- tude maxima, calculated azimuths from the array to the source regions differed from the great-circle azimuths by amounts that varied from one event to another (Table 4). This difference was a slowly varying function of period in the immediate neighborhood of the dominant spectral compo- nent, and it generally varied by several degrees within groups of events which had the same great-circle azimuth, with western azimuths showing less variation than south- eastern azimuths. The latter variation may be caused by
TABLE 4. Earthquakes Used for Rayleigh Wave Phase Velocities
Date, 1976
Origin Time, UT
Location Depth, Latitude Longitude Region km mb Ms
Great-Circle
Azimuth, deg Calculated
Azimuth, deg
July 26 July 31 Sept. 16 Sept. 30 Oct. 9 Oct. 29 Oct. 29
0256:39.3 2232:10.5 0326:52.0 2334:14.4 1231:15.8 0251:07.6 0448:51.7
4.9øN 118.3øE Borneo 33 5.8 6.2 26.2øN 110.3øW Gulf of California 33 4.8 4.5 84.3øN 0.8øE Svalbard 8 5.3 5.5 30.2øS 177.9øW Kermadec 32 5.7 6.5 10.8øN 85.8øW Costa Rica 85 5.3 ... 4.5øS 139.9øE W. Irian 33 6.1 7.1
14.2øN 92.0øW Mexico 33 5.0 ß ß ß
305 180
7 230 133 310 152
308 160
4
239 123 295 120

DANIEL AND BOORe: ANOMALOUS SHEAR WAVE DELAYS AT YELLOWSTONE 2737
a G. u fl of Calif July 31 2232 , •
0 60s ß
b. Borneo July 26 0256
0 300 600s I • I I I I I I I I ß
Fig. 6. Unfiltered vertical component seismograms recorded at reference station HEN and caldera stations showing effect of caldera on surface wave complexity. All stations have common time alignment, and underlined segments were used in phase velocity analysis. (a) Gulf of California event. (b) Borneo event.
refraction due to lateral variations in structure southeast of
the caldera, such as the Absaroka Range. Figure 7 shows the Yellowstone caldera phase velocities
(symbols), and, for comparison, values from the Great Basin province [Priestley and Brune, 1978], which is also charac- terized by unusually low phase velocities. The dotted curves show the estimated upper and lower standard deviation limits on the measured phase velocity according to the analysis presented in the appendix. Values for Yellowstone are extremely low, ranging from 2.0 km/s at 7-s period to 3.2 km/s at 27-s period. In view of the multipathing visible on the seismograms, the measurements form a surprisingly well- defined dispersion curve which shows consistent values from more than one azimuth.
DISCUSSION
Teleseismic P delay data of Iyer [1975] indicate that a body with low compressional velocity exists beneath the Yellow- stone caldera, causing residuals of up to 2 s in the caldera, with smaller delays occurring at instruments deployed in a 100-km-wide area around the caldera. The spatial distribu- tion and magnitude of the P delays show that a body of anomalous material with horizontal dimensions approxi- mately equal to those of the caldera extends to a depth of
200-250 km. Using data from their extended array, Iyer [1979] and Iyer et al. [1981] used ray tracing and a three- dimensional inversion technique to estimate a P velocity decrease, with respect to the surrounding rock, of 15% in the upper crust and 5% in the lower crust and upper mantle. The same inversion technique is not available to us in the present study, however, because of the limited duration of the experiment and the small size of the array. Instead, we will use simple ray tracing to first show the trade-off relationship between the relative shear velocity decrease and the thick- ness of the anomalous body. Second, guided by the general shape of the compressional velocity anomaly proposed by Iyer et al. [1981], we construct a preliminary model for its shear velocity and Poisson's ratio versus depth, using the observed dependence of shear residual on dT/dA. Finally, we use the surface wave data to construct a more detailed
shear velocity model of the crust in the caldera.
Body Wave Inversion
To make an initial estimate of the a. verage velocity de- crease in the Yellowstone anomaly, we first consider verti- cally ascending rays impinging on the lower surface of the anomaly, which we assume extends fiom the surface to a variable maximum depth h (Figure 8a). Using an average value of all shear residuals of 5.0 s and the shear velocity

2738 DANIEL AND BOORE: ANOMALOUS SHEAR WAVE DELAYS AT YELLOWSTONE
3.0
2.0 • ¸ ¸ Gulf of California _ • Costa Rica _ /• Kermadec
t- [] Mexico + Svalbard x W. Irian
3•' Borneo
1.0 0 5 10 25 30 15 20 35
Period , s
Fig. 7. Raleigh wave phase velocities versus period for Yellowstone caldera. Symbols denote earthquake used for each measurement. Solid line shows velocities calculated for a shear velocity model obtained by inversion of the measured phase velocities (see Table 5), and dot-dashed line shows velocities calculated for the same velocity model but with top layer having Vs = 2.4 km/s instead of 1.97 km/s. Dotted lines show estimated standard deviation of the measured velocities (see appendix for derivation). Phase velocities are compared with results for the Great Basin province (dashed line) from Priestley and Brune [1978].
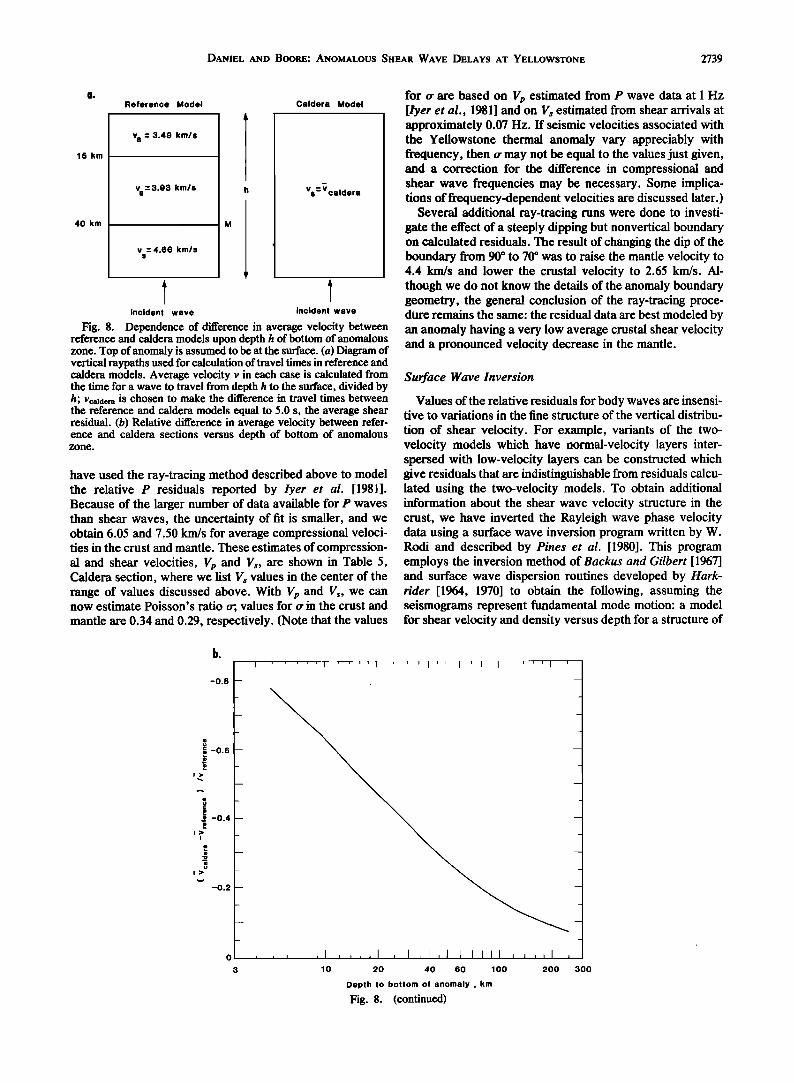
reference model shown in Table 5, we can calculate, as a function of h, the difference in average velocities between the reference and caldera models required to give the 5.0-s residual. The results are shown in Figure 8b: for example, if the anomaly is confined to the crust (h = 40 km), then the relative difference in velocity is 32%; if the anomaly extends to h = 200 km, the difference is 9%.
We next use ray tracing to estimate the shear wave velocity distribution beneath the caldera by modeling the shear wave residuals from teleseisms to the northwest of Yellowstone. We consider data only from this quadrant because the anomaly boundary southwest of the caldera is indistinct [lyer et al. 1981] and data from the other quadrants are sparse.
Consider the simplest model, a single uniform body with vertical sides extending beneath the caldera from the surface to the greatest depth at which the anomaly affects teleseis- mic P arrivals, approximately 200 km. To calculate theoreti- cal shear wave relative residuals, we subtract travel times resulting from the velocity-depth profile for the reference model listed in Table 5 from travel times through the anomaly. The shear velocity reference model was obtained by assuming a Poisson ratio of 0.25 and using the compres- sional velocity results of Hill [1978], Smith et al. [1979], and Lehman and Smith [1980]. Upper mantle velocity was taken from tables of Herrin [1968]. Reasonable variations in refer- ence velocities do not critically affect the caldera model.
From the three-dimensional Yellowstone compressional velocity model of lyer et al. [ 1981] based on P delays, it can be shown that rays from teleseisms at northwestern azi- muths enter the anomaly beneath a point approximately 70 km northwest of the stations. Hence the theoretical relative residual is equal to the difference in the times required for a ray to traverse the paths from the initial wavefront, shown in
Figure 9, to the recording stations. In this discussion we consider the size of the array to be insignificant in compari- son with the anomalous path length, so we are treating residuals from the entire small array as data from one station. We can now explore the relationship between the value of the anomalous shear velocity, the angle of incidence of the teleseismic ray (or, equivalently, its ray parameter dT/dA), the depth at which it enters the anomaly, and the value of the travel time residual calculated from the pro-
posed model. Calculated residuals for a homogeneous body with shear
velocity of 3.5 km/s are shown in Figure 5 (dashed curve); this model gives residuals which are too high for dT/dA between 5 and 6 s/deg and too low for dT/dA between 14 and 15 s/deg. If the bottom of the anomalously slow zone is placed at a depth of 40 km above a normal mantle, the computed residuals are nearly independent of ray parameter. In this case, a homogeneous crust with shear velocity of 2.1 km/s over a normal mantle gives residuals that are too low for dT/dA between 5 and 6 s/deg and too high for dT/dA near 15 s/deg (dotted curve in Figure 5). It can also be shown that models with normal crust over an anomalous mantle do not
give an acceptable fit to the measured residuals (residuals are too small for large dT/A).
To illustrate the range of two-velocity models which fit the measured residuals, the two solid curves in Figure 5 show calculated residuals from the following models: (1) crust and mantle velocities of 2.9 and 4.2 km/s, respectively (solid curve with smaller slope), and (2) crust and mantle velocities of 3.1 and 4.0 km/s, respectively (solid curve with larger slope). These values are lower than the corresponding values for the reference model by between 16-22% and 10-14%, respectively.
To obtain the compresional velocity for this model, we
DANIEL AND BOORE: ANOMALOUS SHEAR WAVE DELAYS AT YELLOWSTONE 2739
Reference Model Caldera Model
15 km
40 km
v s: 3.49 km/s
vs= 3.93 km/s
v :4.66 km/s 8
vs:• caldera
incident wave incident wave
Fig. 8. Dependence of difference in average velocity between reference and caldera models upon depth h of bottom of anomalous zone. Top of anomaly is assumed to be at the surface. (a) Diagram of vertical raypaths used for calculation of travel times in reference and caldera models. Average velocity v in each case is calculated from the time for a wave to travel from depth h to the surface, divided by h; Vc•lder• is chosen to make the difference in travel times between the reference and caldera models equal to 5.0 s, the average shear residual. (b) Relative difference in average velocity between refer- ence and caldera sections versus depth of bottom of anomalous zone.
have used the ray-tracing method described above to model the relative P residuals reported by Iyer et al. [1981]. Because of the larger number of data available for P waves than shear waves, the uncertainty of fit is smaller, and we obtain 6.05 and 7.50 km/s for average compressional veloci- ties in the crust and mantle. These estimates of compression- al and shear velocities, V•, and Vs, are shown in Table 5, Caldera section, where we list Vs values in the center of the range of values discussed above. With V•, and Vs, we can now estimate Poisson's ratio rr; values for rr in the crust and mantle are 0.34 and 0.29, respectively. (Note that the values
for rr are based on V•, estimated from P wave data at 1 Hz [lyer et al., 1981] and on V• estimated from shear arrivals at approximately 0.07 Hz. If seismic velocities associated with the Yellowstone thermal anomaly vary appreciably with frequency, then rr may not be equal to the values just given, and a correction for the difference in compressional and shear wave frequencies may be necessary. Some implica- tions of frequency-dependent velocities are discussed later.)
Several additional ray-tracing runs were done to investi- gate the effect of a steeply dipping but nonvertical boundary on calculated residuals. The result of changing the dip of the boundary from 90 ø to 70 ø was to raise the mantle velocity to 4.4 km/s and lower the crustal velocity to 2.65 km/s. Al- though we do not know the details of the anomaly boundary geometry, the general conclusion of the ray-tracing proce- dure remains the same: the residual data are best modeled by an anomaly having a very low average crustal shear velocity and a pronounced velocity decrease in the mantle.
Surface Wave Inversion
Values of the relative residuals for body waves are insensi- tive to variations in the fine structure of the vertical distribu-
tion of shear velocity. For example, variants of the two- velocity models which have normal-velocity layers inter- spersed with low-velocity layers can be constructed which give residuals that are indistinguishable from residuals calcu- lated using the two-velocity models. To obtain additional information about the shear wave velocity structure in the crust, we have inverted the Rayleigh wave phase velocity data using a surface wave inversion program written by W. Rodi and described by Pines et al. [1980]. This program employs the inversion method of Backus and Gilbert [1967] and surface wave dispersion routines developed by Hark- rider [1964, 1970] to obtain the following, assuming the seismograms represent fundamental mode motion: a model for shear velocity and density versus depth for a structure of
-0.8
-0.4
-0.2
10 20 40 60 100 200 300
Depth to bottom of anomaly ,km
Fig. 8. (continued)

2740 DANIEL AND BOORE: ANOMALOUS SHEAR WAVE DELAYS AT YELLOWSTONE
TABLE 5. Seismic Velocity Models
Layer
Standard Deviation of Poisson's
Depth, km V•,, km/s Vs, km/s Vs, km/s Ratio Density, g/cm 3
1 2 3
4
5
6
half space
Reference Section* 0-15 6.05 3.49 0.25
15-40 6.80 3.93 0.25 half space 8.07 4.66 0.25
Caldera Section, Surface Wave Model, 0-5 5.00 1.97 0.13 0.41 5-10 5.70 2.47 0.32 0.38
10-20 5.70 2.87 0.15 0.33 20-30 6.80 3.10 0.23 0.37 30-40 6.80 3.51 0.22 0.32 40-55 7.50 4.11 0.15 0.29
55 7.50 4.10 fixed 0.29
Caldera Section, Body Wave Model$ 0-40 6.05 3.0 0.34
half space 7.50 4.1 0.29
2.40 2.65 2.65 2.70 2.70 2.70 2.70
Layer
Layer 1 2 3 4 5 6 Surface Wave Model Resolution Matrixõ
1 0.104 0.135 0.146 0.084 0.051 0.022 2 0.135 0.401 0.247 -0.099 -0.075 -0.010 3 0.291 0.495 0.635 0.188 -0.023 -0.031 4 0.168 -0.197 0.188 0.542 0.315 0.081 5 0.103 -0.150 -0.023 0.315 0.275 0.106 6 0.065 -0.033 -0.047 0.121 0.159 0.080
* Compressional velocities and densities in reference model are modified from Lehman and Smith [1980] for crust and Herrin [1968] for mantle; shear velocities computed assuming Poisson's ratio of 0.25.
•' Shear velocity model derived from inversion of Rayleigh wave phase velocities. $ Body wave model derived from ray-tracing comparison of reference and caldera travel times. õ Columns represent resolving kernel for layer indicated in left column; diagonal elements are
underlined.
laterally homogeneous plane layers, infinite in horizontal extent (see Table 5); a vertical resolution matrix for the corrections to the initial shear velocity model; and the standard deviations of the estimated shear velocities result-
ing from the inversion. Vp and density were held fixed during the inversion calculations, and their values were based on the results of lyer et al. [1981] and Lehman and Smith [1980]. Vs in the halfspace was obtained from the body wave model. Test runs of the inversion program with Vp and density different from the original model by +-8% and Moho depths of both 30 and 40 km showed that crustal shear velocities
calculated from the inversion are not sensitive to reasonable variations in density or Vv. From the values of the resolution matrix elements, it can be seen that midcrustal layers 2, 3, and 4 at depths between 5 and 30 km are the best resolved; values at the top and bottom of the crust are rather poorly resolved because of the limited period range recorded.
The Rayleigh wave dispersion curve calculated for the surface wave model (model RW) is shown as the solid curve in Figure 7. As a check on the validity of the surface wave inversion, we calculated shear wave travel time residuals using model RW, and the results are shown as the dot-dash curve in Figure 5. The residuals are about 0.7 s (12%) larger than residuals calculated from the body wave model; a reasonable explanation for this discrepancy is that the veloc- ity in the topmost crustal layer has been underestimated. Raising the velocity of this layer to 2.40 km/s produces calculated residuals indistinguishable from the solid curves
in Figure 5 and yields the calculated Rayleigh wave disper- sion shown by the dot-dash curve in Figure 7. The body wave results therefore suggest that the measured Rayleigh wave phase velocities at periods less than 13 s (based on data from a single event) are about 15% too low. In view of the uncertainties associated with the phase velocity measure- ments described earlier, we find the overall consistency between the body wave and surface wave results encourag- ing, although, considering the strong lateral heterogeneity associated with the caldera, the surface wave model must still be regarded as preliminary.
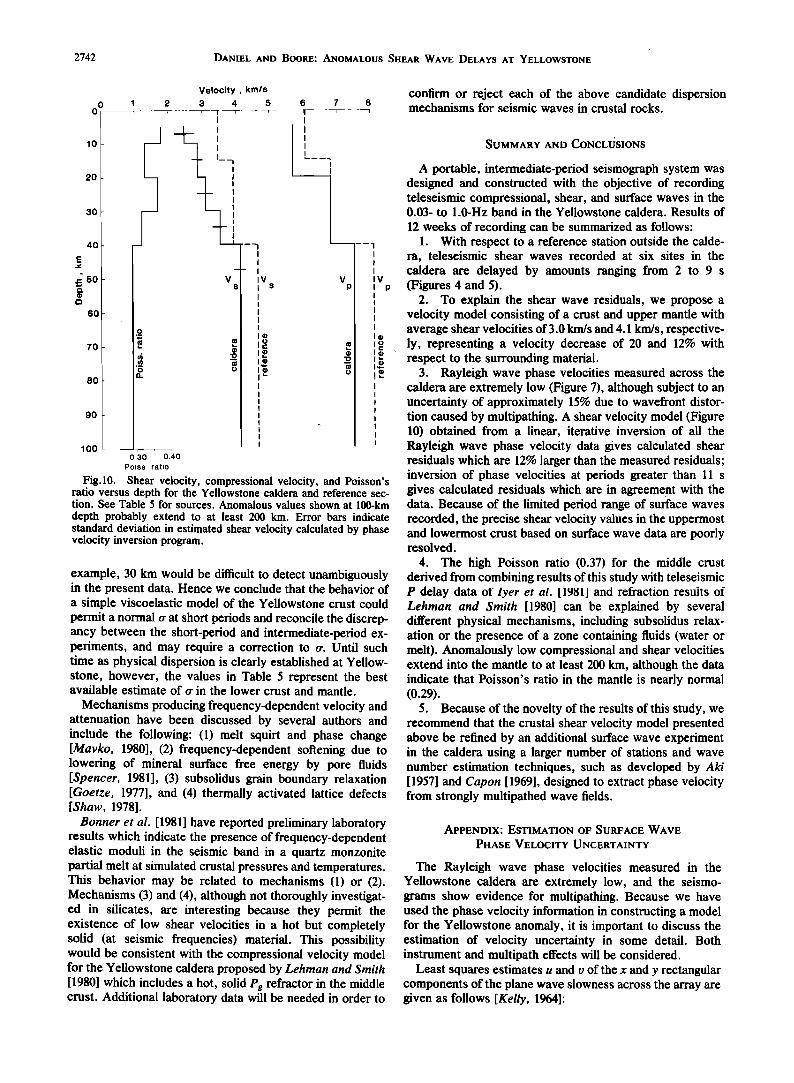
Poisson's ratio •r in each layer is listed in Table 5 and plotted versus depth in Figure 10, along with velocity in the caldera and reference models. (Here we have assumed V•, and Vs independent of frequency.) At depths between 20 and 30 km, •r reaches a value of 0.37, significantly higher than that for standard dry rocks under pressure [Fielitz, 1971; Christensen and Fountain, 1975]. In addition, anomalous values of average compressional and shear wave velocity exist in the crust and mantle down to approximately 200-km depth. We will now briefly discuss possible causes for these anomalies.
Iyer and Stewart [1977] have considered several rock properties, variations in which could produce the P wave travel time anomalies measured at Yellowstone. These are
stress, mineralogy, chemistry, rock fabric, crack and pore properties, and fluid quantity and pressure. Of these, they have concluded on the basis of the admissible range of

DANIEL AND BOO•E: ANOMALOUS SHEAR WAVE DELAYS AT YELLOWSTONE 2741
a. Normal section b. Yellowstone anomalous section
-- 70 km • reference station ; I normal V_ /I
•/ I
•'/ I
• 70 km Z
•ow v•/ normal V s ..
xcaldera stations
depth 40 km
Fig. 9. Raypaths for comparison of normal and anomalous travel times versus angle of incidence of the teleseismic ray. Times begin at the initial wave front. (a) Raypath beneath reference station. (b) Raypath beneath caldera stations.
velocity changes with respect to these variables that the presence of fluids can best explain the low compressional velocity at Yellowstone. Recent theoretical calculations of viscoelastic moduli in cracked solids by Mavko [1980] show that, depending on the fluid phase geometry and volume percentage, a wide range of both compressional and shear velocities and Poissons's ratio can be explained by the presence of partial melt. It is impossible at present to determine the amount of fluid phase which could be beneath Yellowstone, although it is possible for a small amount of water or melt to have a significant effect on compressional and shear velocities. For example, a 2% fluid fraction can lower V v by 5% and Vs by 15% compared to rocks without cracks; this would be sufficient to raise rr to 0.32. However, the number of parameters controlling the values of the viscoelastic moduli is too large for a unique determination of fluid quantity to be made.
Arrival times of P and S from local earthquakes and explosions recorded by a linear array of short-period instru- ments crossing the Yellowstone caldera boundary [Weaver and Pitt, 1978] can be adequately modeled by the presence of layers with normal compressional and shear velocities. and Poisson's ratio (0.25) without requiring a lateral change in velocity at the caldera boundary or partial melt in large sections of the caldera crust. There are two ways in which these results can be reconciled with the teleseismic data
presented here: first, because the teleseismic body waves are traveling through the caldera at nearly vertical incidence, values of the relative residuals depend on the velocities in a large range of depths in the crust and mantle, and they cannot be expected to be capable of resolving the velocity of anomalous layers which may have thicknesses much less than that of the crust. This does not, however, explain why the surface wave experiment detected no layers with shear velocity equal to that outside the caldera.
Second, the results reported here are based on measure- ments made at frequencies as much as two decades lower than those recorded by the short-period studies. It is there- fore possible that the elevated temperature in the caldera region causes the elastic moduli of the caldera crustal layers to have more relaxed (lower) values at intermediate periods than they do at short periods. If shear wave velocity dispersion is present, then two facts become evident: (1) Poisson's ratio calculated using Vp at 1 Hz and Vs at 0.07 Hz will be too large and should instead be based on the value of shear velocity corrected to its value at the frequency of Vp measurement; (2) velocity dispersion presents a possible explanation for the possible inconsistency between the ex- perimental results at short and intermediate periods.
To estimate an upper bound for the effect of physical dispersion in the caldera crust on the calculated Poisson ratio, we assume a non-constant-Q, linear, viscoelastic earth model with a single peak in its relaxation spectrum and calculate the ratio of relaxed and unrelaxed body wave phase velocities at low and high frequencies [Kanarnori and Ander- son, 1977]'
Vso/Vs•- 1/(1 + Qsm -1) where Vso and Vs• are the low- and high-frequency limits of shear wave phase velocity and Qs m is the quality factor Qs at the frequency of the absorption peak. For various values of Qsm, we list the following values for Vso/Vs• and the corrected Poisson ratio for the crust at short periods, using Vso = 3.0 km/s and V• = const = 6.05 km/s (Table 5): Qs m --- 6, Vso/Vs• = 0.86, rr = 0.25; Qs m -- 30, Vso/Vs• = 0.97, rr = 0.32; Qs m = 150, Vso/Vs• = 0.99, rr = 0.34. Thus it is not unreasonable for a normal Poisson ratio to occur at short periods if Qs m is very low (e.g., 6). Because of the large wavelengths of shear waves from teleseisms, the amplitude attenuation (30%) produced by a zone with this Qs m and a thickness of, for
2742 DANIEL AND BOORE: ANOMALOUS SHEAR WAVE DELAYS AT YELLOWSTONE
00
10
20
30
40
70
80
90
lOO
Velocity , km/s 3 4 5 T--- -r --T-- --- --T -
I
I
I--- I I I
, I I I
I
I 1 i
ß ' •-1 I I
- I iv I s I
'$ o
6 7 8
v p
v p
' o.•o' o.:•o Poiss. ratio
Fiõ.10. Shear velocity, compressional velocity, and Poisson's ratio versus depth for the Yellowstone caldera and reference sec- tion. See Table 5 for sources. Anomalous values shown at 100-km depth probably extend to at least 200 km. Error bars indicate standard deviation in estimated shear velocity calculated by phase velocity inversion program.
example, 30 km would be difficult to detect unambiguously in the present data. Hence we conclude that the behavior of a simple viscoelastic model of the Yellowstone crust could permit a normal •r at short periods and reconcile the discrep- ancy between the short-period and intermediate-period ex- periments, and may require a correction to •r. Until such time as physical dispersion is clearly established at Yellow- stone, however, the values in Table 5 represent the best available estimate of •r in the lower crust and mantle.
Mechanisms producing frequency-dependent velocity and attenuation have been discussed by several authors and include the following: (1) melt squirt and phase change [Mavko, 1980], (2) frequency-dependent softening due to lowering of mineral surface free energy by pore fluids [Spencer, 1981], (3) subsolidus grain boundary relaxation [Goetze, 1977], and (4) thermally activated lattice defects [Shaw, 1978].
Bonner et al. [1981] have reported preliminary laboratory results which indicate the presence of frequency-dependent elastic moduli in the seismic band in a quartz monzonite partial melt at simulated crustal pressures and temperatures. This behavior may be related to mechanisms (1) or (2). Mechanisms (3) and (4), although not thoroughly investigat- ed in silicates, are interesting because they permit the existence of low shear velocities in a hot but completely solid (at seismic frequencies) material. This possibility would be consistent with the compressional velocity model for the Yellowstone caldera proposed by Lehman and Smith [1980] which includes a hot, solid Pg refractor in the middle crust. Additional laboratory data will be needed in order to
confirm or reject each of the above candidate dispersion mechanisms for seismic waves in crustal rocks.
SUMMARY AND CONCLdSIONS
A portable, intermediate-period seismograph system was designed and constructed with the objective of recording teleseismic compressional, shear, and surface waves in the 0.03- to 1.0-Hz band in the Yellowstone caldera. Results of
12 weeks of recording can be summarized as follows: 1. With respect to a reference station outside the calde-
ra, teleseismic shear waves recorded at six sites in the caldera are delayed by amounts ranging from 2 to 9 s (Figures 4 and 5).
2. To explain the shear wave residuals, we propose a velocity model consisting of a crust and upper mantle with average shear velocities of 3.0 km/s and 4.1 km/s, respective- ly, representing a velocity decrease of 20 and 12% with respect to the surrounding material.
3. Rayleigh wave phase velocities measured across the caldera are extremely low (Figure 7), although subject to an uncertainty of approximately 15% due to wavefront distor- tion caused by multipathing. A shear velocity model (Figure 10) obtained from a linear, iterative inversion of all the Rayleigh wave phase velocity data gives calculated shear residuals which are 12% larger than the measured residuals; inversion of phase velocities at periods greater than 11 s gives calculated residuals which are in agreement with the data. Because of the limited period range of surface waves recorded, the precise shear velocity values in the uppermost and lowermost crust based on surface wave data are poorly resolved.
4. The high Poisson ratio (0.37) for the middle crust derived from combining results of this study with teleseismic P delay data or' lyer et al. [19811 and refraction results of Lehman and Smith [1980] can be explained by several different physical mechanisms, including subsolidus relax- ation or the presence of a zone containing fluids (water or melt). Anomalously low compressional and shear velocities extend into the mantle to at least 200 km, although the data indicate that Poisson's ratio in the mantle is nearly normal (0.29).
5. Because of the novelty of the results of this study, we recommend that the crustal shear velocity model presented above be refined by an additional surface wave experiment in the caldera using a larger number of stations and wave number estimation techniques, such as developed by Aki [1957] and Capon [1969], designed to extract phase velocity from strongly multipathed wave fields.
APPENDIX: ESTIMATION OF SURFACE WAVE
PHASE VELOCITY UNCERTAINTY
The Rayleigh wave phase velocities measured in the Yellowstone caldera are extremely low, and the seismo- grams show evidence for multipathing. Because we have used the phase velocity information in constructing a model for the Yellowstone anomaly, it is important to discuss the estimation of velocity uncertainty in some detail. Both instrument and multipath effects will be considered.
Least squares estimates u and u of the x and y rectangular components of the plane wave slowness across the array are given as follows [Kelly, 1964]:

DANIEL AND BOORE: ANOMALOUS SHEAR WAVE DELAYS AT YELLOWSTONE 2743
u = D-•[Cov (x, y) Cov (y, t) - Vary Cov (x, t)] (A1)
v = D-•[Cov (x, y) Cov (x, t) - Var x Cov (y, t)]
where u = sin (az)/c and v = cos (az)/c, az being the azimuth from network to epicenter and c the phase velocity. Other terms used here and below are defined by the following examples:
N N
X-- Z xn[N r-- Z yn[N n=l n=l
N
Varx= • (xn - X)2/N n=l
N
Cov (x, y) = Z (Xn - X)(yn - Y)/N n=l
where Xn, Yn are x coordinate and y coordinate at each of the N stations and t represents equivalent arrival time calculated from the phase of the Fourier component of the windowed seismogram; definitions of the other variance and covariance terms have similar forms.
Two additional definitions are as follows:
D = Var x Vary - Coy 2 (x, y)
M = Var x cos 2 (az) - 2 Coy(x, y) sin (az) cos (az) + Vary sin 2 (az)
The rms relative error dc/c in phase velocity from a given event is related to the variance rrt 2 in the mesurements tn as follows:
(dc/c) 2= (crrt)2(M/ND) (A2)
In the frequency domain, our primary measurement is of phase rather than time; thus rrt = r%T/2,r, where T is period and rr, 2 is variance in phase.
We next estimate the magnitude of the uncertainties involved and consider first the case where seismic noise is
not coherent between stations. Let o 2 -- rr, 2 = rri 2 + %2, where rri 2 is the instrument calibration uncertainty and %2 is the error in phase of ground motion due to perturbation of the wave front from a plane wave. Parameter rri 2 contains a
Calculation of the probability distribution P(On) for the exact and approximate expressions in (A3) shows that the variance of the approximate term is an excellent approximation to the variance obtained from the exact formula. Therefore %2 = a2/2 and 02 = 0.0015 + a2/2 rad 2. By comparing relative amplitudes of the maxima and minima in the beat envelopes, we estimate an upper bound for a as a < 0.35 (a < 0.45 for the Gulf of California event). Then 02 = 0.063 rad 2 for the large array and 02 = 0.10 rad 2 for the small array.
Substitution of parameter values from the large and small arrays into (A2) leads to the following formulas for the phase velocity uncertainty:
Large array
dc = -0.0017Tc 2
Small array
dc = -0.0054Tc 2 (A4)
The larger proportionality constant for the small array reflects the smaller array size as well as the sronger multi- pathing observed at the shorter periods. These phase veloci- ty standard deviations are plotted as the upper and lower dotted curves in Figure 7.
We next consider the variation in phase velocity given by (A1) when the seismic noise is assumed to be perfectly correlated between stations. For this case, the range of calculated phase velocities was estimated by performing a group of numerical experiments with synthetic data of the form
dfit) = cos (kxj- o•t) + a cos (k'xj- o•t + 15•)
where 0 -< a -< 0.45, xj is position vector of the jth station of the Yellowstone arrays, 0 -< &b -< •r/2, and k, k' are propagation vectors differing only in direction. The angle between k and k' was varied from 0 ø to 90 ø, and the standard deviation of the calculated phase velocities was close to 15% of the mean velocity for values of a observed at Yellow- stone. For this case also, the dotted curves in Figure 7 well represent the estimated uncertainties in phase velocity.
Acknowledgments. We are grateful to the National Park Ser- vice, Yellowstone National Park, Wyoming, for furnishing access to recording site and use of their facilities. At the U.S• Geological
term due to the error in the instrument phase calibration (2 ø ) Survey, Menlo Park, California, many persons generously shared plus a term representing an upper bound for the effect of their knowledge and resources; in particular, we thank H. M. Iyer temperature changes between calibrations (1ø). Therefore for technical advice and encouragement and J. Coakley for help with
rri 2 = (22 + 12)(,d180) 2 = 0.0015 rad 2
We postulate that the term %2 arises from random pertur- bations of the wave front caused by lateral changes in phase velocity near the array and by arrivals following non-least time paths from the epicenter. Consider the ground motion at a particular frequency at each station to be represented by a dominant coherent component of unit amplitude plus an incoherent noise component with amplitude a. If the phase differences ½n between the principal and noise components at each station can range randomly from 0 to 2•r and are correlated between stations, then the phase difference On between the dominant component and the recorded ground motion is
On = •n/2 -- arctan [(1 - a)/(1 + a) tan •n/2] = a sin ½n
(A3)
the field work. T. V. McEvilly suggested the intermediate-period instrument technique that we used in this study, and A. Levander of Stanford University very capably maintained the field experiment. We also thank D. Stauber, C. Stephens, and the anonymous reviewers for critical reviews of the manuscript. This work was supported by U.S. Geological Survey grants 14-08-0001-G208 and 14-08-0001-G360.
REFERENCES
Aki, K., Space and time spectra of stationary stochastic waves, with special reference to microtremors, Bull. Earthquake Res. Inst. Tokyo Univ., 35, 415-456, 1957.
Backus, G., and F. Gilbert, Numerical application of a formalism for geophysical inverse problems, Geophys. J. R. Astron $oc., 13, 247-276, 1967.
Bonner, B. P., L. Thigpen, and G. W. Hedstrom, Anelastic creep of partially melted quartz monzonite with implications for the fre- quency dependence of Q (abstract), Earthquake Notes, 52, 33, 1981.
Boore, D. M., and M. N. Toksoz, Rayleigh wave particle motion and crustal structure, Bull. $eismol. $oc. Am., 59, 331-346, 1969.
2744 DANIEL AND BOORE: ANOMALOUS SHEAR WAVE DELAYS AT YELLOWSTONE
Capon, J., High-resolution frequency-wavenumber spectrum analy- sis, Proc. IEEE, 57, 1408-1418, 1969.
Christensen, N., and D. Fountain, Constitution of the lower conti- nental crust based on experimental studies of seismic velocities in granulite, Geol. Soc. Am. Bull., 86, 227-236, 1975.
Daniel, R. G., An intermediate-period field system using a short- period seismometer, Bull. Seismol. Soc. Am., 69, 1623-1626, 1979a.
Daniel, R. G., Evaluation of intermediate-period seismic waves as a geothermal exploration tool, Ph.D. thesis, Dep. of Geophys., Stanford Univ., Stanford, Calif., 1979b.
Eaton, G. P., R. L. Christiansen, H. M. Iyer, A.M. Pitt, D. R. Mabey, H. R. Blank, I. Zietz, and M. E. Gettings, Magma beneath Yellowstone National Park, Science, 188, 787-796, 1975.
Einarsson, P., S-wave shadows in the Kratla caldera in northeastern Iceland, evidence for a magma chamber in the crust, Bull. Volcanol., 41, 1-9, 1978.
Fielitz, K., Elastische Wellengeschwindigkeiten in verschiedenen Gesteinen unter hohem Druck und bei Temperaturen bis 750C, Z. Geophys., 37, 943-956, 1971.
Goetze, C., A brief summary of our present day understanding of the effect of volatiles and partial melt on the mechanical proper- ties of the upper mantle, in High Pressure Research: Application in Geophysics, edited by H. Maghnani and S.-I. Akimoto, pp. 3- 23, Academic, New York, 1977.
Greensfelder, R. W., and R. L. Kovach, Shear wave velocities and crustal structure of the eastern Snake River Plain, Idaho, J. Geophys. Res., this issue.
Gutenberg, B., and C. Richter, Travel time tables of seismic waves, Calif. Inst. of Technol., Pasadena, 1953.
Hales, A. L., and J. Roberts, The travel times of S and SKS, Bull. Seismol. Soc. Am., 60, 461--489, 1970.
Harkrider, D. G., Surface waves in multilayered elastic media, I, Rayleigh and Love waves from buried sources in a multilayered elastic half-space, Bull. Seismol. Soc. Am., 54, 627-679, 1964.
Harkrider, D. G., Surface waves in multilayered elastic media, II, Higher mode spectra and spectral ratios from point sources in plane layered earth models, Bull. Seismol. Soc. Am., 60, 1937- 1987, 1970.
Herrin, E. (Ed.), 1968 seismological tables for P phases, Bull. Seismol. Soc. Am., 58, 1196-1219, 1968.
Hill, D. P., Seismic evidence for the structure and Cenozoic tectonics of the Pacific coast states, Cenozoic Tectonics and Reginal Geophysics of the Western Cordillera, Mere. Geol. Soc. Am., 152, 145-174, 1978.
Ibrahim, A., and D. Nuttli, Travel time curves and upper mantle structure from long period S waves, Bull. Seismol. Soc. Am., 57, 1063-1092, 1967.
Iyer, H. M., Anomalous delays of teleseismic P-waves in Yellow- stone National Park, Nature, 253, 425-247, 1975.
Iyer, H. M., Deep structure under Yellowstone National Park, U.S.A.: A continental 'hot spot,' Tectonophysics, 56, 165-197, 1979.
Iyer, H. M., and R. M. Stewart, A teleseismic technique to locate magma in the crust and upper mantle, in Proceedings of the Chapman Conference on Partial Melting of the Upper Mantle, Bull. 56, edited by H. R. Dick, pp. 281-299, State of Oregon Department of Geology and Mineral Industries, Portland, Oreg., 1977.
Iyer, H. M., J. Evans, G. Zandt, R. M. Stewart, J. Coakley, and J. Roloif, A deep magma body under the Yellowstone caldera, Wyoming: Delineation using teleseismic P-wave residuals and tectonic interpretation, Geol. Soc. Am. Bull., 92, 792-798 and 1471-1646, 1981.
Kanamori, H., and D. L. Anderson, Importance of physical disper- sion in surface wave and free oscillation problems: Review, Rev. Geophys. Space Phys., 15, 105-112, 1977.
Kelly, E., J., Limited network processing of seismic signals, MIT Group Rep. 1964--44, Mass. Inst. of Technol., Cambridge, 1964.
Kubota, S., and E. Berg, Evidence for magma in the Katmai Volcanic Range, Bull. Volcanol., 31, 175-186, 1967.
Lehman, J., and R. B. Smith, Upper-crustal structure of the Yellowstone region from refraction and gravity data (abstract), Eos Trans. AGU, 61, 1026, 1980.
Levander, A., and R. L. Kovach, Rayleigh wave phase and group velocity observations in the Franciscan terrane, central Califor- nia, Eos Trans. AGU, 60, 875, 1979.
Marshall, P., A. Douglas, B. Barley, and J. Hudson, Short period teleseismic S waves, Nature, 253, 181-182, 1975.
Mavko, G., Velocity and attenuation in partially molten rocks, J. Geophys. Res., 85, 5173-5189, 1980.
Mitronovas, W., and E. Wielandt, High precision phase calibration of long period electromagnetic seismographs, Bull. Seismol. Soc. Am., 65, 411-424, 1975.
Morgan, P., D. Blackwell, R. Spafiord, and R. B. Smith, Heat flow measurements in Yellowstone Lake and the thermal structure of
the Yellowstone caldera, J. Geophys. Res., 82, 3719-3732, 1977. Pines, I., T. Teng, and R. Rosenthal, A surface wave dispersion
study of the crustal and upper mantle structure of China, J. Geophys. Res., 85, 3829-3844, 1980.
Pitt, A.M., Evidence from local earthquakes for the existence of a region of seismic body wave attenuation in the upper crust under the Yellowstone caldera (abstrac0, Eos Trans. AGU, 50, 1190, 1974.
Priestley, K., and J. Brune, Surface waves and the structure of the Great Basin of Nevada and western Utah, J. Geophys. Res., 83, 2265-2272, 1978.
Shaw, G. H., Interpretation of the low velocity zone in terms of the presence of thermally activated point defects, Geophys. Res. Lett., 5, 629-632, 1978.
Smith, R. B., R. T. Shuey, J. R. Pelton, and J. Bailey, Yellowstone hot spot: Contemporary tectonics and crustal properties from earthquakes and aeromagnetic data, J. Geophys. Res., 82, 3665- 3676, 1977.
Smith, R. B., L. Braile, M. Schilly, J. Ansorge, C. Prodehl, J. Healy, J. Pelton, S. Mueller, R. Greensfelder, and K. Olsen, The Yellowstone-Snake River Plain seismic profiling experiment: Yellowstone (abstract), Eos Trans. AGU, 60, 942, 1979.
Spencer, J. W., Stress relaxation at low frequencies in fluid- saturated rocks: Attenuation and modulus dispersion, J. Geophys. Res., 86, 1803-1812, 1981.
Stauber, D., Crustal structure in the Battle Mountain heat flow high in northern Nevada from seismic refraction profiles and Rayleigh wave phase velocities, Ph.D. thesis, Dep. of Geophys., Stanford Univ., Stanford, Calif., 1980.
Steeples, D. W., and H. M. Iyer, Low-velocity zone under Long Valley as determined from teleseismic events, J. Geophys. Res., 81,849-860, 1976.
Weaver, C., and A.M. Pitt, Traveltime curves and apparent velocities across the Yellowstone caldera (abstract), Earthquake Notes, 49, 70, 1978.
(Received December 29, 1980; revised May 4, 1981;
accepted May 11, 1981.)