anodic cell-protein deposition on inverse inkjet printed micro structured gold surfaces
TRANSCRIPT
A
ttaiwvetcCt©
K
1
ustaorrSilt
0d
Biosensors and Bioelectronics 22 (2007) 1493–1500
Anodic cell-protein deposition on inverse inkjet printedmicro structured gold surfaces
R. Zehbe a,∗, U. Gross b, C. Knabe b, R.J. Radlanski b, H. Schubert a
a Technical University Berlin, Institute of Material Science and Technologies, Englische Strasse 20, 10587 Berlin, Germanyb Charite University Medicine Berlin, Laboratory of Biomaterials Research, Department of Experimental Dentistry/Oral Biology,
Aßmannshauser Strasse 4-6, 14197 Berlin, Germany
Received 26 January 2006; received in revised form 5 April 2006; accepted 4 July 2006Available online 17 August 2006
bstract
The transformation of fibrinogen into fibrin is biologically activated in a complex multi-step process known as the coagulation cascade. Thisransformation can also be triggered by anodic surfaces. It has been suggested that this mechanism is a result of an electron transfer from the anodeo the fibrinogen molecule resulting in the formation of fibrin. In this study we used this pathway to simultaneously deposit vital cells (fibroblastsnd keratinocytes) and fibrin on micro structured gold electrodes. The electrodes were produced using a novel inverse inkjet-printing technologyn combination with subsequent gold-sputtering, resulting in minimal structure-sizes of 35 �m (±6 �m). Cell deposition and fibrin-coagulationere found to occur on the anode only, following exactly the micro structured electrode surface. Successful deposition was limited by the minimaloltage (0.8 V) needed for the formation of fibrin and the maximum voltage (1.85 V) resulting in the deterioration of the Au-electrodes due tolectrolysis and possible damaging of the deposited cells due to the formation of molecular chlorine. Furthermore, it was demonstrated that this
echnique is suitable to co-cultivate different cell types in a layered fashion. Subsequent to the electrically mediated anodic cell-protein deposition,ells were cultivated for up to 4 days and then characterized by vital fluorescence staining, methyl violet-staining and scanning electron microscopy.ell-vitality was found to be dependent on the experimental setup; in this study non-vital cells were only observed, when sequentially depositingwo different cell types. Finally, the coagulation mechanism was studied using HPLC, SDS-gel-chromatography and ATR/FTIR.2006 Elsevier B.V. All rights reserved.
e
I(aaataafipS
eywords: Fibrinogen; Fibrin; Electrode; Coagulation; Fibroblast; Keratinocyt
. Introduction
The transformation of the soluble fibrinogen into the insol-ble fibrin is a process which is biologically activated in theecondary hemostasis which takes place after blood vessel stric-ure (primary hemostasis), when vascularized tissue is damagednd blood flow occurs. The coagulation cascade involves a seriesf enzymes which catalyze different biochemical processes,esulting in the thrombin-mediated removal of two pairs of fib-inopeptides in the central domain of the fibrinogen-molecule.ubsequently, the electrically charged fragments are polymer-
zed and a network of fibrin fibers is established. The exactocations of the molecular binding sites were identified by crys-al structure studies on fibrinogen and fibrin (Russel et al., 2000).
∗ Corresponding author. Tel.: +49 30 314 24072; fax: +49 30 314 24072.E-mail address: [email protected] (R. Zehbe).
efrtabt
956-5663/$ – see front matter © 2006 Elsevier B.V. All rights reserved.oi:10.1016/j.bios.2006.07.002
t is known that blood clotting can occur on positively chargedanodic) surfaces, which can be a limiting factor in vascularnd cardiac appliances due to thrombus formation. Sawyer etl. (1965) first studied the contact activation of fibrinogen inn electrochemical experiment using platinum electrodes forhe electrolysis of blood. Blood clotting only occurred on thenode indicating an electron transfer at the interface from thenode to the fibrinogen molecule. This is in accordance withndings reported by Szent-Gyorgyi (1941) who concluded thatroteins isolated from cells can function as semiconductors.ubsequently Baurschmidt and Schaldach (1977) showed inxperiments with germanium electrodes that an electron trans-er from the germanium electrode to the fibrinogen moleculeesulted in the irreversible formation of fibrin. It was suggested
hat the relaxation energy resulting from the oxidation of themino acids at the electrode is sufficiently high to split peptideonds (Rzany and Schaldach, 1999). It was further stated thathe peptide separation by electron transfer is not specific and
1 Bioel
pe
b2warcr
trePftantpFe2
imwc
eib
tttlatosss
2
2
fmwr
dp
FtmgbUD6t(crT“fpTswisFtfid
2
SwdTssv
2t
mLahfipuasfli
494 R. Zehbe et al. / Biosensors and
eptides are released at random sites where thrombin is not nec-ssarily biochemically active in the natural enzymatic system.
Another methodology for establishing a protein-layer coatingy electrochemical means has been reported (Haruyama et al.,005) suggesting the introduction of a peptidic tag into a proteinhich is then electrochemically reduced at a platinum electrode
nd thereby immobilized. Haruyama et al. further state that cur-ently most protein-immobilization methods are based on eitherhemical bonding or specific/unspecific adsorption and brieflyeviewed the respective literature.
The other important aspect in this study is the immobiliza-ion of cells on electrodes. This is currently an important area ofesearch in the context of cochlear implants, cardiac pacemak-rs, nerve-stimulation and retinal prosthesis (Rutten et al., 2001;alanker et al., 2004; Wilkinson, 2004). These concepts mainlyocus on the use of electrodes for the stimulation of cells andissues or for purposes in the axonal guidance in nerve regener-tion (Lago et al., 2005; Heller et al., 2005). In applications forerve repair fibrin has been described as a potential therapeuticarget in inflammatory demyelinating diseases, such as Multi-le Sclerosis (Rummler and Gupta, 2004; Adams et al., 2004).ibrin has been further described to be potentially useful in thearly stages of nerve regeneration (Akassoglou and Strickland,002; Akassoglou et al., 2002).
Another promising technology with an electrode-cell-nterface has recently been described reporting on a method to
anipulate live bacteria on micro scaled electrode structuresith possible applications in sensory or nano scale electronic
ircuits (Beck et al., 2005).To our knowledge, the combination of a cell-protein-
lectrode system with the perspective of using different cellsn a co-cultivation setup on micro structured electrodes has noteen reported so far.
In this study we suggest a methodology for the simultaneousransformation of the soluble fibrinogen from an aqueous solu-ion into the insoluble fibrin attached to an electrode surface andhe immobilization of cells in and on top of the formed fibrinayer. The exclusive use of epithelial cells (fibroblasts and ker-tinozytes) in this study is due to our approach to demonstratehe described methodology as an elegant way to establish anrganotypic culture system with the additional means to microtructure the formed tissue. This is in contrast to other cultureystems like the combi ring dish, where no controllable microtructure can be achieved (Noser and Limat, 1988).
. Materials and methods
.1. Electrode fabrication
For the analytical characterization of the fibrinogen trans-ormation a planar graphite electrode was machined from bulkaterial with a resulting electrode area of 1.0 cm2, the surfaceas polished with abrasive paper to approximately 5 �m surface
oughness.For the cell-protein deposition, three different electrode-
esigns (as detailed in Section 2.5) were made from non-coatedolyester-foils commonly used in laser printing (type “X-70”,
vil(
ectronics 22 (2007) 1493–1500
olex Imaging, Switzerland) opposed to inkjet polyester-foilshat are coated to better immobilize the printing ink. Electrode
icro structures were realized by inverse inkjet-printing andold-sputtering. The inverse electrode structure was establishedy CAD-software (PowerPoint 2003, Microsoft Corporation,SA) and printed as black & white on a polyester-foil (HPeskjet 3520-inkjet printer with HP-print cartridge #27) in00 dpi resolution with printing-enhancement-technology “Pho-oREt” enabled. The ink is composed (by weight) of water<80.0%), 2-pyrrolidone (<15.0%), isopropanol (<2.5%) andarbon black (<5.0%), a powdered form of elemental carbonesulting from vapor-phase pyrolysis of hydrocarbon mixtures.he ink is detailed in Hewlett-Packard’s MSDS-InformationC8727A” Hewlett-Packard Company (2003). The printing wasollowed by gold-sputtercoating (Emitech K550) in argon-lasma for 4 min with a sputter-current of approximately 25 mA.he gold-coated polyester-foil with the inverse printed microtructure was then ultrasonically cleaned in deinonized waterith the addition of 10% isopropanol to remove the printing
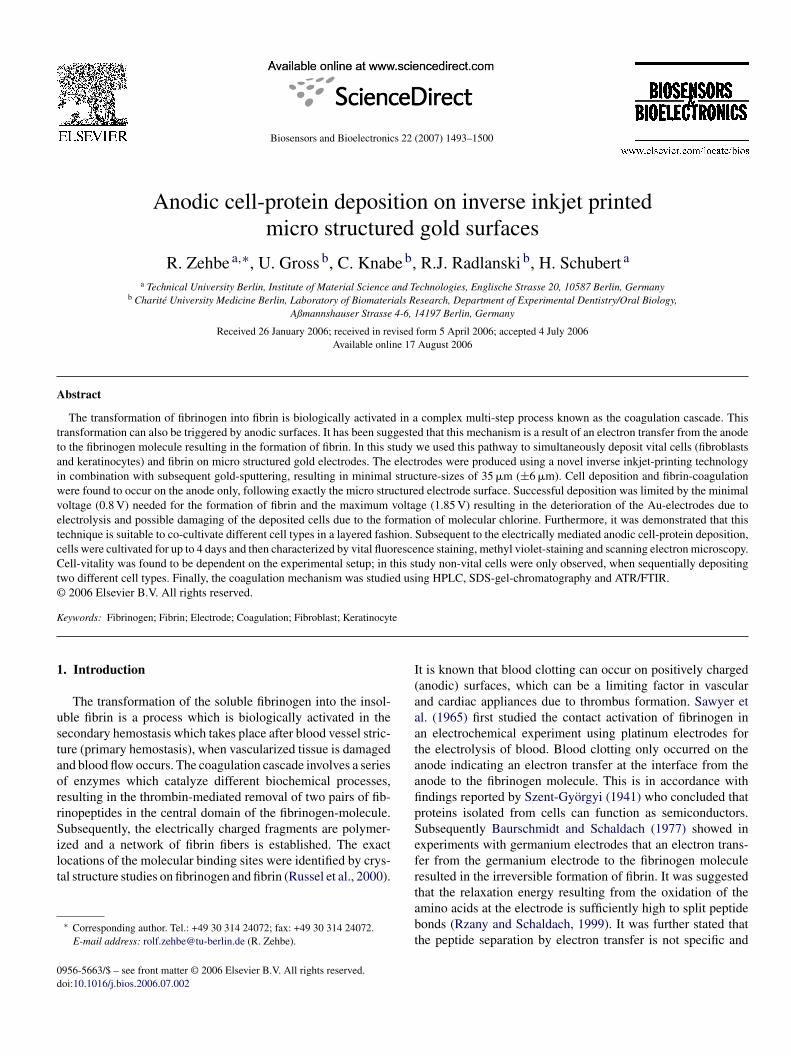
nk with the on-top gold-layer resulting in the positive-electrodetructure. The inverse inkjet-printing technique is displayed inig. 1 with a resulting electrode (top of the figure) that was bent
o fit into a 12-well-plate. The electrical conductivity was con-rmed after bending using a voltmeter. Finally, electrodes wereisinfected and stored in 70% ethanol until further use.
.2. Preparation of fibrinogen solution
A 1.0% solution of bovine fibrinogen (fraction I,igma–Aldrich) in phosphate buffered saline (PBS-Dulbecco,ithout Ca2+/Mg2+, Biochrom AG, Germany) was prepared byissolving fibrinogen in PBS for 5 h under constant stirring.his was followed by centrifugation at approximately 750 × g toeparate remaining non-dissolved fibrinogen particles from theolution. The supernatant was pipetted carefully into an emptyial for further use under sterile conditions.
.3. Characterization of the electrically mediated fibrinransformation
The anodic coagulation of soluble fibrinogen and its transfor-ation into insoluble fibrin was analyzed using High Pressureiquid Chromatography (HPLC) according to Kehl et al. (1981)nd Ebert and Bell (1985), and SDS-gel-chromatography oneat-, thrombin- and electrically coagulated samples from a 2%brinogen, 0.9% NaCl-solution. An electrically coagulated sam-le was prepared from a 1.0 ml fibrinogen solution processednder a voltage of 3.5 V on a planar graphite electrode withn electrode area of 1.0 cm2 for 30 min. Graphite was cho-en due to the better removability of the coagulated productrom the electrode. To ensure formation of a thick coagulation-ayer, necessary to synthesize enough material for the follow-ng HPLC and SDS-gel-electrophoresis measurements, a higher
oltage was used compared to the lower voltage (1.2 V) appliedn the cell-protein deposition experiments. A thrombin coagu-ated sample was prepared by adding 100 �l thrombin-solution8.8 units ml−1) to 500 �l of a fibrinogen solution. And finally
R. Zehbe et al. / Biosensors and Bioelectronics 22 (2007) 1493–1500 1495
F , inkw
as
ttcf
cafus
eaSDps
2
9ntcwa
1
c1
(t1P
2d
ec(fnbsit0fiTce3w
ig. 1. Inverse inkjet-printing technology (bottom) with subsequent gold coatinghich was used in experiments as indicated in Section 3.1.
heat coagulated sample was prepared by heating a fibrinogenolution to 70 ◦C for 10 min.
For HPLC measurements the coagulated samples (heat,hrombin and electrically mediated) as well as the fibrinopep-ides A and B resulting from the thrombin-mediated fibrinogen-leavage were dissolved in 0.1% trifluoroacetic acid (ratio 1:1)or 5 min using an ultrasonic bath and were filtered afterwards.
SDS-gel-electrophoresis was performed on the differentlyoagulated samples and also on the non-coagulated fibrinogenll being dissolved in buffer-solution containing 1,4-dithiotreitolor disulfide reduction. The molecular weight was determinedsing a reference marker. Coomassie-reagent was used fortaining.
Differences in chemical bonding between fibrinogen and thelectrically coagulated fibrinogen were analyzed using Attenu-ted Total Reflectance Fourier Transform Infrared (ATR/FT-IR)pectrometry (Jasco-Spectrometer, Model FT-IR 300E, TGSetector). Samples were dissolved in D2O to prevent H2O-eaks that would result from the usage of normal water asolvent.
.4. Cell culture
A human keratinocyte [HaCaT] and a mouse fibroblast [L-29] cell line were used in this study. HaCaT-cells were origi-ally derived from histologically normal adult human body skinhat was spontaneously transformed in vitro into a permanentell line (Boukamp et al., 1988). The L-929 fibroblast cell line
as derived by Sanford et al. (1948) from normal subcutaneousreolar and adipose tissue of a 100-day-old male C3H/An mouse.Cells were cultured in RPMI culture medium (RPMI
640, Biochrom AG, Germany) supplemented with 10% fetal
tdra
removal and anodic cell-protein deposition and resulting sample electrode (top)
alf serum (FCS) and penicillin-streptomycin (P/SA 2212,0000 U ml−1, Biochrom AG, Germany).
Cells were harvested by trypsinization using trypsin/EDTA0.05%/0.02%) and were resuspended in the cell cul-ure medium described above, resulting in approximately.5 × 106 cells ml−1. These cell suspensions were mixed withBS-based fibrinogen solutions as described in Section 2.5.
.5. Anodic fibrin-coagulation and electrophoretic celleposition
The experimental setup consisted of a 12-well-plate with 4lectrode-pairs, as described above, which were contacted byorresponding pairs of gold-coated clamps. A voltage of 1.2 VDC) was generated by a Hewlett-Packard 33120A 15 MHzunction/arbitrary waveform generator in DC-mode. In prelimi-ary experiments (not displayed) we investigated the processingoundaries being characterized by the minimal voltage neces-ary for the coagulation of fibrinogen and the voltage resultingn the deterioration of the sputter coated Au-layer due to elec-rolysis. Coagulation (solution containing 1% fibrinogen and.9% NaCl) started at approximately 0.8 V which was identi-ed visually and recorded as image-series of the first 10 min.he experimental setup for the simultaneous electrical pro-essing and microscopic imaging consisted of a grid shapedlectrode made by inverse inkjet printing, the Hewlett-Packard3120A as DC-generator and the Leica DM 4000 M microscopehich is described in Section 2.6. In the same experimen-
al setup we identified the voltage for the electrolysis inducedeterioration of the Au-layer to be above 1.85 V for a 1% fib-inogen, 0.9% NaCl-solution indicated by formation of blisterst the cathode. The voltage of 1.2 V was chosen randomly
1 Bioel
bi
tFsieuieum1e
lb
lcuro(0inafbat20j
rPflpnrcfAFws
2
m(tw
nflusaptc
2
cs6aasitna
3
3transformation
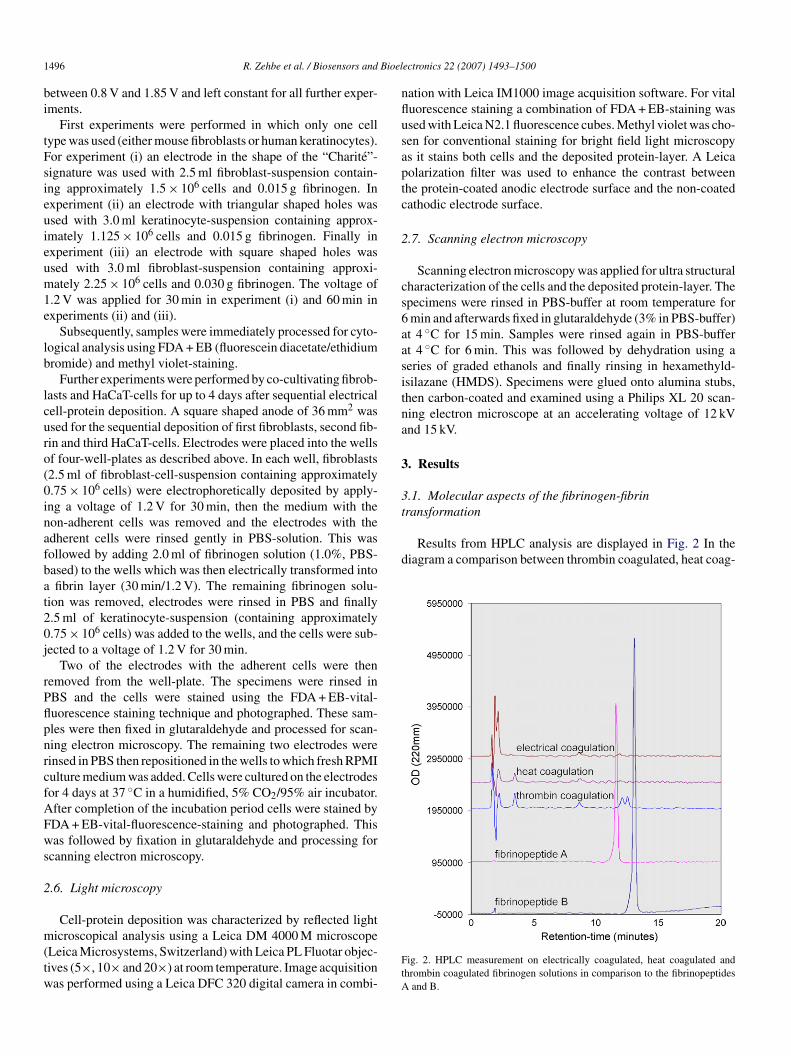
Results from HPLC analysis are displayed in Fig. 2 In thediagram a comparison between thrombin coagulated, heat coag-
496 R. Zehbe et al. / Biosensors and
etween 0.8 V and 1.85 V and left constant for all further exper-ments.
First experiments were performed in which only one cellype was used (either mouse fibroblasts or human keratinocytes).or experiment (i) an electrode in the shape of the “Charite”-ignature was used with 2.5 ml fibroblast-suspension contain-ng approximately 1.5 × 10⁶ cells and 0.015 g fibrinogen. Inxperiment (ii) an electrode with triangular shaped holes wassed with 3.0 ml keratinocyte-suspension containing approx-mately 1.125 × 10⁶ cells and 0.015 g fibrinogen. Finally inxperiment (iii) an electrode with square shaped holes wassed with 3.0 ml fibroblast-suspension containing approxi-ately 2.25 × 10⁶ cells and 0.030 g fibrinogen. The voltage of
.2 V was applied for 30 min in experiment (i) and 60 min inxperiments (ii) and (iii).
Subsequently, samples were immediately processed for cyto-ogical analysis using FDA + EB (fluorescein diacetate/ethidiumromide) and methyl violet-staining.
Further experiments were performed by co-cultivating fibrob-asts and HaCaT-cells for up to 4 days after sequential electricalell-protein deposition. A square shaped anode of 36 mm2 wassed for the sequential deposition of first fibroblasts, second fib-in and third HaCaT-cells. Electrodes were placed into the wellsf four-well-plates as described above. In each well, fibroblasts2.5 ml of fibroblast-cell-suspension containing approximately.75 × 106 cells) were electrophoretically deposited by apply-ng a voltage of 1.2 V for 30 min, then the medium with theon-adherent cells was removed and the electrodes with thedherent cells were rinsed gently in PBS-solution. This wasollowed by adding 2.0 ml of fibrinogen solution (1.0%, PBS-ased) to the wells which was then electrically transformed intofibrin layer (30 min/1.2 V). The remaining fibrinogen solu-
ion was removed, electrodes were rinsed in PBS and finally.5 ml of keratinocyte-suspension (containing approximately.75 × 106 cells) was added to the wells, and the cells were sub-ected to a voltage of 1.2 V for 30 min.
Two of the electrodes with the adherent cells were thenemoved from the well-plate. The specimens were rinsed inBS and the cells were stained using the FDA + EB-vital-uorescence staining technique and photographed. These sam-les were then fixed in glutaraldehyde and processed for scan-ing electron microscopy. The remaining two electrodes wereinsed in PBS then repositioned in the wells to which fresh RPMIulture medium was added. Cells were cultured on the electrodesor 4 days at 37 ◦C in a humidified, 5% CO2/95% air incubator.fter completion of the incubation period cells were stained byDA + EB-vital-fluorescence-staining and photographed. Thisas followed by fixation in glutaraldehyde and processing for
canning electron microscopy.
.6. Light microscopy
Cell-protein deposition was characterized by reflected light
icroscopical analysis using a Leica DM 4000 M microscopeLeica Microsystems, Switzerland) with Leica PL Fluotar objec-ives (5×, 10× and 20×) at room temperature. Image acquisitionas performed using a Leica DFC 320 digital camera in combi-
FtA
ectronics 22 (2007) 1493–1500
ation with Leica IM1000 image acquisition software. For vitaluorescence staining a combination of FDA + EB-staining wassed with Leica N2.1 fluorescence cubes. Methyl violet was cho-en for conventional staining for bright field light microscopys it stains both cells and the deposited protein-layer. A Leicaolarization filter was used to enhance the contrast betweenhe protein-coated anodic electrode surface and the non-coatedathodic electrode surface.
.7. Scanning electron microscopy
Scanning electron microscopy was applied for ultra structuralharacterization of the cells and the deposited protein-layer. Thepecimens were rinsed in PBS-buffer at room temperature formin and afterwards fixed in glutaraldehyde (3% in PBS-buffer)t 4 ◦C for 15 min. Samples were rinsed again in PBS-buffert 4 ◦C for 6 min. This was followed by dehydration using aeries of graded ethanols and finally rinsing in hexamethyld-silazane (HMDS). Specimens were glued onto alumina stubs,hen carbon-coated and examined using a Philips XL 20 scan-ing electron microscope at an accelerating voltage of 12 kVnd 15 kV.
. Results
.1. Molecular aspects of the fibrinogen-fibrin
ig. 2. HPLC measurement on electrically coagulated, heat coagulated andhrombin coagulated fibrinogen solutions in comparison to the fibrinopeptides
and B.
R. Zehbe et al. / Biosensors and Bioelectronics 22 (2007) 1493–1500 1497
Fp
ua
amdrelarme
DfilB1fdtgaubs
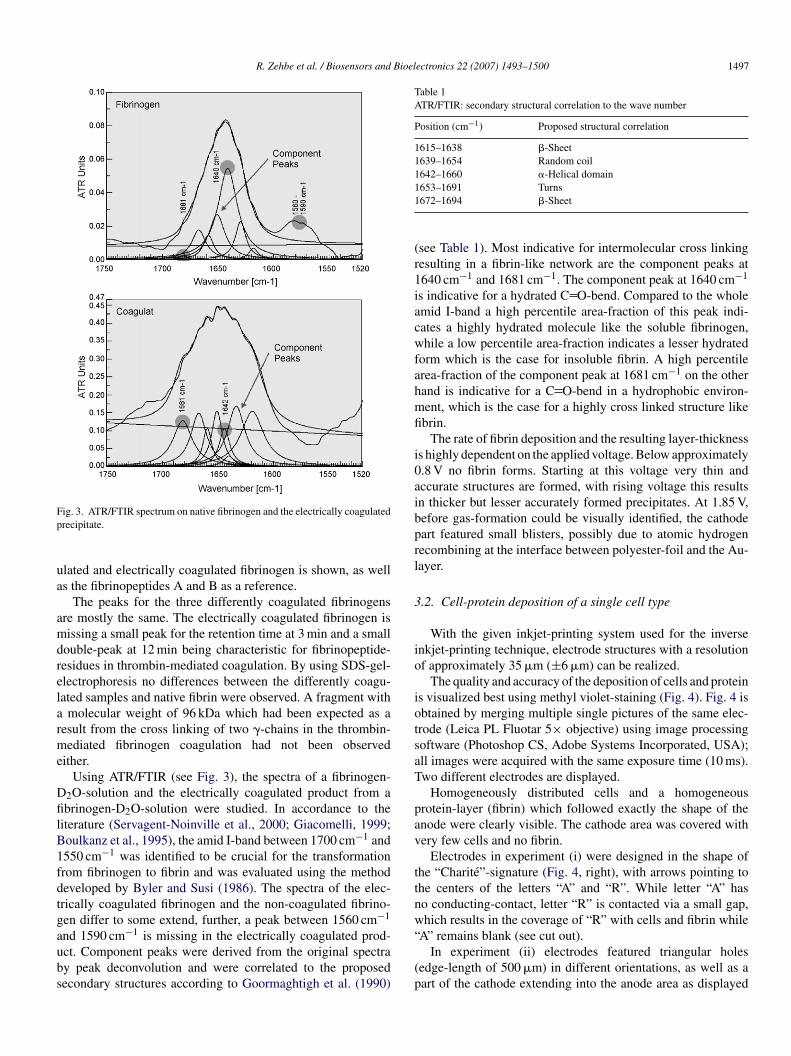
Table 1ATR/FTIR: secondary structural correlation to the wave number
Position (cm−1) Proposed structural correlation
1615–1638 �-Sheet1639–1654 Random coil1642–1660 �-Helical domain11
(r1iacwfahmfi
i0aibprl
3
io
iotsaT
pav
ttnw“A” remains blank (see cut out).
ig. 3. ATR/FTIR spectrum on native fibrinogen and the electrically coagulatedrecipitate.
lated and electrically coagulated fibrinogen is shown, as wells the fibrinopeptides A and B as a reference.
The peaks for the three differently coagulated fibrinogensre mostly the same. The electrically coagulated fibrinogen isissing a small peak for the retention time at 3 min and a small
ouble-peak at 12 min being characteristic for fibrinopeptide-esidues in thrombin-mediated coagulation. By using SDS-gel-lectrophoresis no differences between the differently coagu-ated samples and native fibrin were observed. A fragment with
molecular weight of 96 kDa which had been expected as aesult from the cross linking of two �-chains in the thrombin-ediated fibrinogen coagulation had not been observed
ither.Using ATR/FTIR (see Fig. 3), the spectra of a fibrinogen-
2O-solution and the electrically coagulated product from abrinogen-D2O-solution were studied. In accordance to the
iterature (Servagent-Noinville et al., 2000; Giacomelli, 1999;oulkanz et al., 1995), the amid I-band between 1700 cm−1 and550 cm−1 was identified to be crucial for the transformationrom fibrinogen to fibrin and was evaluated using the methodeveloped by Byler and Susi (1986). The spectra of the elec-rically coagulated fibrinogen and the non-coagulated fibrino-en differ to some extend, further, a peak between 1560 cm−1
nd 1590 cm−1 is missing in the electrically coagulated prod-
ct. Component peaks were derived from the original spectray peak deconvolution and were correlated to the proposedecondary structures according to Goormaghtigh et al. (1990)(p
653–1691 Turns672–1694 �-Sheet
see Table 1). Most indicative for intermolecular cross linkingesulting in a fibrin-like network are the component peaks at640 cm−1 and 1681 cm−1. The component peak at 1640 cm−1
s indicative for a hydrated C O-bend. Compared to the wholemid I-band a high percentile area-fraction of this peak indi-ates a highly hydrated molecule like the soluble fibrinogen,hile a low percentile area-fraction indicates a lesser hydrated
orm which is the case for insoluble fibrin. A high percentilerea-fraction of the component peak at 1681 cm−1 on the otherand is indicative for a C O-bend in a hydrophobic environ-ent, which is the case for a highly cross linked structure likebrin.
The rate of fibrin deposition and the resulting layer-thicknesss highly dependent on the applied voltage. Below approximately.8 V no fibrin forms. Starting at this voltage very thin andccurate structures are formed, with rising voltage this resultsn thicker but lesser accurately formed precipitates. At 1.85 V,efore gas-formation could be visually identified, the cathodeart featured small blisters, possibly due to atomic hydrogenecombining at the interface between polyester-foil and the Au-ayer.
.2. Cell-protein deposition of a single cell type
With the given inkjet-printing system used for the inversenkjet-printing technique, electrode structures with a resolutionf approximately 35 �m (±6 �m) can be realized.
The quality and accuracy of the deposition of cells and proteins visualized best using methyl violet-staining (Fig. 4). Fig. 4 isbtained by merging multiple single pictures of the same elec-rode (Leica PL Fluotar 5× objective) using image processingoftware (Photoshop CS, Adobe Systems Incorporated, USA);ll images were acquired with the same exposure time (10 ms).wo different electrodes are displayed.
Homogeneously distributed cells and a homogeneousrotein-layer (fibrin) which followed exactly the shape of thenode were clearly visible. The cathode area was covered withery few cells and no fibrin.
Electrodes in experiment (i) were designed in the shape ofhe “Charite”-signature (Fig. 4, right), with arrows pointing tohe centers of the letters “A” and “R”. While letter “A” haso conducting-contact, letter “R” is contacted via a small gap,hich results in the coverage of “R” with cells and fibrin while
In experiment (ii) electrodes featured triangular holesedge-length of 500 �m) in different orientations, as well as aart of the cathode extending into the anode area as displayed

1498 R. Zehbe et al. / Biosensors and Bioelectronics 22 (2007) 1493–1500
F ts) ana exact
ittd3odrsth
3e
ili
Fs1
ig. 4. Sample electrodes with deposited cells: right: human fibroblasts (dark dond fibrin. Small triangular shapes (500 �m edge-length) were used as proof of
n Fig. 4, left. The triangular holes were used as an indicator forhe printing resolution obtainable by the inverse inkjet-printingechnique. Generally, electrode edges were jagged to a smallegree with jag-like structures smaller than approximately0 �m. There is no apparent correlation between the coveragef cells and fibrin and the varying electrical potential overistance. Finally, in experiment (iii) the electrodes featured
ectangular holes of 900 �m × 250 �m for FDA + EB-vital-taining of mouse fibroblasts (Fig. 5a). All cells were identifiedo be vital and to follow the contour of the rectangularoles.fobT
ig. 5. Fluorescence light micrographs (FDA + EB-vital staining) showing: (a) cells aequential co-deposition of fibroblasts, fibrin and HaCaT-cells (bar: 100 �m); (c) fib00 �m); (d) darker fibroblast-like cells in the background with bright round-shaped
d fibrin (grey/violett) in the shape of the “Charite”-signature. left: HaCaT-cellsness of the deposition.
.3. Co-cultivation of two different cell types afterlectrical cell-protein deposition
Shortly after the sequential cell-protein deposition describedn Section 2.5, samples were FDA + EB-stained and showed aayer of non-vital cells in the background, with some vital cellsn the foreground. This was demonstrated by focussing and de-ocussing the microscope objective (Fig. 5b). In addition, it was
bserved that only vital cells covered parts of the non-vital cellseing another indicator for foreground/background cell-layers.he morphology of the deposited protein-network is displayed infter 1 h of electrical cell-protein deposition (1.2 V, bar: 500 �m); (b) cells afterroblast-like cells after 4 days in culture following the electrode boundary (bar:cell-clusters on top after 4 days in culture (bar: 100 �m).

R. Zehbe et al. / Biosensors and Bioel
Fig. 6. Scanning electron micrograph demonstrating: top: the morphology oftwi
FmsiCc4ccieue
aFli
iafifidi
iom
4
idava
btstfsdetih(
V
AAhvcα
otbbe
mfiefinum
taas lamellipodia and filopodia indicated a good biocompatibil-ity of the fibrin-functionalized gold-coated polymer substrate
he deposited fibrin layer shortly after deposition (day 0). Two cells are visiblehich are surrounded by a fibrin layer (bar: 5 �m). bottom: lamellipodia (arrows)
ndicating good cell adhesion after 4 days in vitro (bar: 20 �m).
ig. 6, top. The scanning electron micrograph demonstrates theorphology of the thin fibrous structure which has formed and
urrounds two cells of unidentified cell type. Initial cell spread-ng behaviour was comparable with results found by Rosen andulp (1977) for mouse fibroblasts after 60 min to 120 min on aoverslip. FDA + EB-staining showed most cells to be vital afterdays of incubation indicated by a dense layer of fibroblast-like
ells which had formed in the background being covered withlusters of round-shaped cells in the foreground (Fig. 5d). Cellsn the foreground seemed brighter. This might be due to a differ-nce in FDA-metabolism between the two different cell typessed in this experiment. Cells were following the contour of thelectrode even stretching along the electrode-border (Fig. 5c).
SEM examination demonstrated that cells only covered thenode, with very few cells extending over the electrode surface.urther, most cells displayed cell–cell contacts. Development of
amellipodia (Fig. 6, bottom) was demonstrated in SEM imag-ng.
Cell spreading was further analyzed using statistical imag-ng software (ImageJ, National Institutes of Health, USA) on
rectangular area of 1.0 mm2 covered with keratinocytes and
broblasts (FDA + EB stained) immediately after electrical cell-brin deposition and after 4 days in culture. Immediately aftereposition the area covered by cells was calculated to be approx-mately 15% (0.15 mm2) including non-vital cells as describedaivs
ectronics 22 (2007) 1493–1500 1499
n Section 3.2. After 4 days in culture the cells covered an areaf approximately 60% (0.60 mm2). Consequently cell coverageultiplied by 4 over a period of 4 days.
. Discussion
Anodic fibrin-formation commenced at a voltage of 0.8 V ands limited in applications including vital cells by the electrolyticecomposition voltage which was determined to be 1.85 V forgold-based electrode-system in PBS-solution. In this study a
oltage of 1.2 V was used which is set between these maximumnd minimum process parameters.
Cells having a negative surface charge due to their cell mem-rane structure which is comprised of a phospholipid bi-layer areherefore attracted to anodic electrode surfaces by electrophore-is as well. The cell-vitality-status achieved depends mainly onwo factors. First, it has to be prevented that molecular chlorineorms due to electrolysis and second, the resulting electrical fieldtrength has to be low enough to not induce membrane break-own which becomes critical when the membrane potentialxceeds a value between 150 mV and 500 mV for microsecondo millisecond voltage pulses (Cole, 1972). For the given exper-mental setup an approximate value for the membrane potentialas been obtained by (1) which has been previously describedHeida et al., 2002).
membrane = 1.5rcellEfield cos α = 13.5 mV (1)
n approximate cell-radius of rcell = 7.5 �m has been assumed.n approximate field strength for the inverse printed electrodesas been calculated (electrode-spacing of 1.0 mm and an appliedoltage of 1.2 V) to be Efield = 1.2 kV m−1. The angle α indi-ating the cell orientation in the electric field has been set to= 0◦ (or 180◦). The resulting induced membrane potentialf 13.5 mV had no observable effect on cell-vitality even ifhe voltage was applied for 1 h. Although it has been reportedy Poo (1981) that a low hyperpolarization of the cell mem-rane in the range of 1.5–15 mV can have some cell-biologicalffects.
By combining the electrically mediated fibrinogen transfor-ation with the electrophoretic cell deposition, a homogeneousbrin layer with on top cells is easily established along thelectrode micro structure. The subsequent deposition of firstbroblasts, second fibrin and third HaCaT-cells resulted in theon-vitality of some of the bottom fibroblasts. It is not yet fullynderstood, if this is an effect due to membrane breakdown,embrane poration or hyperpolarization.After 4 days of incubation, cells extended partly over the elec-
rode structure but were still vital. Moreover, we did not observeny non-vital cells. Establishment of cell–cell contacts as well
nd good growth conditions which was proven using statisticalmage processing. Cell area coverage was 4 times higher after initro cultivation for 4 days compared to the initial cell coveragehortly after deposition.
1 Bioel
5
oisiccfittetetbp
tpoowfisrooaoa
A
Dafi
R
A
AABB
B
B
BC
EGG
H
H
H
H
K
L
NP
PRRR
R
RS
S
Appleton-Century-Crofts, New York, pp. 337–348.
500 R. Zehbe et al. / Biosensors and
. Conclusion
In this study a novel technology for shaping electrodesn thin gold-coated polymer-foils has been established bynverse inkjet-printing and subsequent gold-coating. The pos-ible structure-size of approximately 35 �m by this technologys in the proximity of the cell-diameter of most mammalianells and opens up promising pathways to co-deposit and too-cultivate different cells and fibrin. The transformation ofbrinogen into fibrin by electrical means is very specific to
his protein; nevertheless this mechanism might also be appliedo other proteins. The applied voltage of 1.2 V is below thelectrolysis-voltage for PBS which would otherwise result inhe formation of cell-toxic molecular chlorine but is still highnough to enable the electrically mediated fibrin-formation. Fur-hermore, it has been shown that cell membrane breakdown cane avoided by carefully choosing the electrical and geometricrocessing parameters.
In this first work on anodic cell-fibrin co-deposition no func-ional characterization of the deposited cells was performed likerotein expression behavior or cell signaling. These aspects aref high interest concerning the development of a functionalrganotypic epithelial culture and will be addressed in futureork. The layered deposition of fibroblasts, keratinocytes andbrin by electrically mediated deposition in a co-cultivationetup is possibly easier to handle than a setup with a combiing dish as described by Noser et al. Future work will focusn the functional characterization of the deposited cells andn the improvement of the co-cultivation of different cells tochieve organotypic conditions in vitro. Additionally, the use ofther cell types including cartilage cells and nerve cells will beddressed.
cknowledgements
The authors would like to thank Ms. M. Dilger-Rein, Ms. B.anielowski and Ms. I. Schwarz for their technical assistance
nd Dr. Daniel Rosch for his help in the characterization of thebrinogen-fibrin transformation.
eferences
dams, R.A., Passino, M., Sachs, B.D., Nuriel, T., Akassoglou, K., 2004. Mol.Interv. 4, 163–176.
S
SW
ectronics 22 (2007) 1493–1500
kassoglou, K., Strickland, S., 2002. Biol. Chem. 383, 37–45.kassoglou, K., Yu, W.M., Akpinar, P., 2002. Neuron 33, 861–875.aurschmidt, P., Schaldach, M., 1977. J. Bioeng. 1, 261–278.eck, J.D., Shang, L., Marcus, M.S., Hamers, R.J., 2005. Nano Lett. 5 (4),
777–781.oukamp, P., Petrussevska, R.T., Breitkreuz, D., Hornung, J., Markham, A.,
Fusenig, N.E., 1988. J. Cell Biol. 106, 761–771.oulkanz, L., Balcar, N., Baron, M.H., 1995. Appl. Spectrosc. 49 (12),
1737–1746.yler, D.M., Susi, H., 1986. Biopolymers 25, 469–487.ole, K.S., 1972. Membranes Ions and Impulses. A Chapter of Classical Bio-
physics. University of California Press, CA, 569 pp.bert, R.F., Bell, W.R., 1985. Anal. Biochem. 148, 70–78.iacomelli, C.E., 1999. J. Colloid Interface Sci. 220, 13–23.oormaghtigh, E., Cabiaux, V., Ruysschaert, J.M., 1990. Eur. J. Biochem. 193,
409–420.aruyama, T., Sakai, T., Matsuno, T., 2005. Biomaterials 26, 4944–
4947.eida, T., Wagenaar, J.B.M., Rutten, W.L.C., Marani, E., 2002. IEEE Trans.
Biomed. Eng. 49 (10), 1195–1203.eller, D.A., Garga, V., Kelleher, K.J., Lee, T.C., Mahbubani, S., Sigworth, L.A.,
Lee, T.R., Rea, M.A., 2005. Biomaterials 26, 883–889.ewlett-Packard Company, Hewlett-Packard Company, Material Safety Data
Sheet (MSDS 15665) “C8727A”, 04-30-2003, pp. 1–6.ehl, M., Lottspeich, F., Henschen, A., 1981. Hoppe-Seyler’s Z. Physiol. Chem.
362, 1661–1664.ago, N., Ceballos, D., Rodriguez, F.J., Stieglitz, T., Navarro, X., 2005. Bioma-
terials 26, 2021–2031.oser, F.K., Limat, A., 1988. In Vitro Cell Dev. Biol. 23 (8), 541–545.alanker, D.V., Huie, P., Vankov, A., Freyvert, Y., Fishman, H., Mar-
mor, M.F., Blumenkranz, M.S., 2004. Ophthal. Technol. 5314, 306–313.
oo, M., 1981. Ann. Rev. Biophys. Bioeng. 10, 245–276.osen, J.J., Culp, L.A., 1977. Exp. Cell Res. 107, 139–149.ummler, L.S., Gupta, R., 2004. Curr. Opin. Orthop. 15, 215–219.ussel, R.F., Yang, Z., Mochalkin, I., 2000. Annals of the New York Academy
of Sciences—Fibrinogen XVIth International Fibrinogen Workshop, 936,pp. 31–44.
utten, W., Mouveroux, J.M., Buitenweg, J., Heida, C., Ruardij, T., Marani,E., Lakke, E., 2001. Proceedings of the IEEE 89 (7), pp. 1013–1029.
zany, A., Schaldach, M., 1999. Prog. Biomed. Res. 4 (1), 59–70.anford, K.K., Earle, W.R., Likely, G., 1948. J. Natl. Cancer Inst. 9, 229–
246.awyer, P.N., Brattain, W.H., Boddy, P.J., 1965. In: Sawyer, P.N. (Ed.), Bio-
physical mechanism in vascular hemostasis and intravascular thrombosis.
ervagent-Noinville, S., Revault, M., Quiquampoix, H., Baron, M.H., 2000. J.Colloid Interface Sci. 221, 273–283.
zent-Gyorgyi, A., 1941. Nature 148, 157–158.ilkinson, C.D.W., 2004. Eur. Cells Mater. 8, 21–26.