annualreport - asx · on market buy-back over the year, fiducian bought 14,500 shares on market...
TRANSCRIPT

ANNUALREPORT FIDUCIAN GROUP LIMITED | 2015
ACN 602 423 610
For
per
sona
l use
onl
y

The name Fiducian is derived from the Latin word ‘Fiducia’. Over the years, persons of high integrity in positions of responsibility and who command trust and respect for their knowledge and expertise have been spoken of as exercising their duties in a fiduciary capacity.
The Company logo of a lion symbolises Strength, Character and Security – characteristics which sit well with the Integrity, Trust and Expertise associated with the meaning of our name.
It is, therefore, within the ambit of working in a fiduciary manner and with high transparency, that we have built our services for the benefit of our clients, members, staff and shareholders. We pride ourselves on having a high level of integrity and in inspiring a similar level among all our group members.
integrity trust expert ise
For
per
sona
l use
onl
y

A N N U A L R E P O R T 2 0 1 5 F I D U C I A N G R O U P L I M I T E D A C N 6 0 2 4 2 3 6 1 0 P A G E 1
J O I N T R E P O R T O F T H E C H A I R M A N 2 A N D T H E M A N A G I N G D I R E C T O R
C O R P O R A T E D I R E C T O R Y 9
D I R E C T O R S ’ R E P O R T 1 0
A U D I T O R ’ S I N D E P E N D E N C E D E C L A R A T I O N 2 2
S H A R E H O L D E R I N F O R M A T I O N 2 3
F I N A N C I A L R E P O R T 2 6
C O N S O L I D A T E D S T A T E M E N T O F C O M P R E H E N S I V E I N C O M E 2 7
C O N S O L I D A T E D S T A T E M E N T O F F I N A N C I A L P O S I T I O N 2 8
C O N S O L I D A T E D S T A T E M E N T O F C H A N G E S I N E Q U I T Y 2 9
C O N S O L I D A T E D S T A T E M E N T O F C A S H F L O W S 3 0
N O T E S T O T H E F I N A N C I A L S T A T E M E N T S 3 1
D I R E C T O R S ’ D E C L A R A T I O N 7 0
I N D E P E N D E N T A U D I T O R ’ S R E P O R T T O T H E M E M B E R S 7 1
CONTENTS
For
per
sona
l use
onl
y

P A G E 2 F I D U C I A N G R O U P L I M I T E D A C N 6 0 2 4 2 3 6 1 0 A N N U A L R E P O R T 2 0 1 5
JOINT REPORT OF THE CHAIRMAN AND THE MANAGING DIRECTORDear Shareholder,
On behalf of the directors, we jointly report on the consolidated operating performance of Fiducian Group Limited and its controlled operating entities for the year ended 30 June 2015.
For
per
sona
l use
onl
y

A N N U A L R E P O R T 2 0 1 5 F I D U C I A N G R O U P L I M I T E D A C N 6 0 2 4 2 3 6 1 0 P A G E 3
FINANCIAL INFORMATIONResults for 2014-2015
The Fiducian Group result demonstrates positive momentum in operational activity and application of the Board’s strategy to grow earnings.
During the year Underlying Earnings Before Interest, Tax, Depreciation and Amortisation and Restructure Costs (Underlying EBITDA) increased by 19% to $8.07 million. Underlying Net Profit After Tax (UNPAT) is $5.75 million, an increase of 28% over the 2014 UNPAT. This represents an Underlying earnings per share of 19 cents as reported in the Financial Highlights below. Underlying NPAT does not include amortisation or one-off restructure costs and therefore gives a clearer picture of the Group’s cash-generating ability going forward.
Once deductions are made for one-off costs and non-cash items such as depreciation and amortisation, the Consolidated Reportable Profit after income tax for the 2015 financial year is $4.62 million which still represents an increase of 16% in comparison to $3.98 million for the previous year. On this basis, the EBITDA was $7.45 million compared with $6.76 million for the same period last year – an increase of 10%.
In summary, all operational divisions contributed positively to the result. The Corporate Restructure was completed by end February after a difficult and time-consuming exercise carried out to satisfy regulatory changes and recent superannuation legislation. The Board believes that it had complied with its obligations and managed potential or actual conflicts successfully since inception of the Company; however, the Restructure brings Fiducian Group into the sphere of “best practice”. After the Restructure, the group now operates with the following model:
For
per
sona
l use
onl
y

P A G E 4 F I D U C I A N G R O U P L I M I T E D A C N 6 0 2 4 2 3 6 1 0 A N N U A L R E P O R T 2 0 1 5
A number of new senior appointments have been made to support our corporate changes. A new Trustee Board has been established for Fiducian Superannuation Service (FSS), our public offer superannuation wrap fund with a majority of independent directors. In addition a Chief Risk Officer, General Manager Superannuation and 11 new financial planners and 11 support staff have been appointed to handle acquired financial planning businesses and expansion of the financial planner network. As a consequence, cash operating expenses have increased by 16.7% in 2015 (2014 decreased by 6.9%). The Board is comfortable with the increased staff numbers which should further add to the Group’s growth initiatives.
Fiducian follows a policy of training, building and retaining quality staff in good and poor economic times, so they can participate in the future expansion of the business and more importantly at this juncture, bring to bear their expertise which has been gained through years of loyal service.
Our diversity policy encourages persons of different sexes, ethnic backgrounds, ages and skills to participate and receive recognition, reward and management responsibility commensurate with their performance. Some senior management positions changed during the year which allowed for a refreshing of some positions. Employees are from over 19 different countries of origin, 26.0% are over 55 years of age and 43.8% are female with 31% in senior roles.
CAPITAL MANAGEMENTA key feature of the Company is that it currently remains debt-free and exhibits a positive working capital and cash flow
position.
Final Dividend The Board remains prudent, but is confident that the future of the business is positive and likely to continue to strengthen. As a result, a fully franked final dividend of 5.5 cents per share has been declared which will bring the total fully franked dividend declared for the 2015 financial year to 10 cents, an increase of 10% (2014: 9.1 cents). The final dividend will be paid on 24 September 2015 on issued shares held on 10 September 2015.
AcquisitionsSubsequent to the year-end, we added to our existing salaried operations in Sydney by acquiring two financial planning client bases with around $145 million under advice. The financial planners are now operating under Fiducian licence and contributions to revenue have begun from July this year. As acquisitions continue to assimilate into our processes, they should deliver increased revenue and demonstrate our disciplined approach to balancing growth and returns. Our funds under advice now stand at around $1.71 billion. The two acquisitions above were partly acquired through the issue of shares to the value of $612,000 to the vendors. The number of shares to be issued will be calculated at dates set in the respective contracts at the weighted volume market price of trades executed in the 30 days before issue date.
JO INT REPORT OF THE CHA I RMAN AND THE MANAGING D I RECTOR CONT INUED
For
per
sona
l use
onl
y

A N N U A L R E P O R T 2 0 1 5 F I D U C I A N G R O U P L I M I T E D A C N 6 0 2 4 2 3 6 1 0 P A G E 5
JO INT REPORT OF THE CHA I RMAN AND THE MANAGING D I RECTOR CONT INUED
On Market Buy-BackOver the year, Fiducian bought 14,500 shares on market (2014: 774,532) for a total consideration, including brokerage, of $0.03 million (2014: $0.91 million) at an average price per share of $1.82 (2014: $1.17). There are 30.883 million shares on issue at year end (2014: 30.758 million).
Cash FlowNet operating cash flows of $6.51 million were achieved (2014: $5.86 million) – an increase of 11.1%. After adjusting for investing activities ($2.5 million) and financing activities ($2.8 million), net cash increased by $1.18 million (2014: increase $1.75 million). Cash at year-end was $12.4 million (2014: $11.2 million). An amount of $5.1 million is required for regulatory purposes. Business acquisitions should assist our future revenue and earning capacity.
Staff and Managing Director Options In accordance with the terms and conditions of the approved Employee and Director Share Option Plan, no options will be issued to employees or the Managing Director in accordance with their contracts of employment.
FINANCIAL PLANNINGDuring the year Funds under Advice grew from $1.37 billion to $1.71 billion as financial planner numbers, net inflow and financial markets lifted. Fiducian expects the highest level of compliance and client service from its financial planning network. Even though the generation of higher inflows is important, our commitment is to quality. As such, our extensive internal training programs, that differentiate our financial planners from the marketplace and enable them to deliver superior quality advice, continue. As a consequence and despite financial market volatility, client retention remains high.
As was the case through the year, our focus will remain at generating inflows through organic growth and inorganic growth, implying further acquisitions of financial planning client bases that satisfy our strict quality criteria.
Salaried OfficesCompany owned offices with salaried financial planners are based in New South Wales, Victoria, Western Australia, Queensland and Tasmania and continue to contribute to overall results. Salaried offices now comprise over 52.6% of funds under advice. Acquisitions made have assimilated well into our existing presence in Tasmania and Sydney and should add to our results.
Franchised OfficesFranchised offices now comprise around 47.4% of our funds under administration. Another five franchisees were added during the financial year resulting in a total of 35 franchised financial planners nationally which we continue to assist through practice development. In addition, referral arrangements continue to be initiated with accountants, who themselves have shown an interest in holistic financial planning given regulation changes to Self-Managed Super Funds. As such, an additional 5 accountants have joined our ‘Associate’ franchise program which can also convert them to a full operating franchise when educational requirements are completed.
BUSINESS SERVICESFiducian Business Services (FBS) is our subsidiary established to provide support to accountants for bookkeeping, accounts preparation and self-managed superannuation fund administration. It now has two accounting practices which operate as Fiducian Accountants & Business Advisers (FABA) in New South Wales and Queensland. Cross-referrals of our financial planning clients needing accounting help and our accounting clients needing financial planning help further supports Fiducian’s value proposition of service to all our clients. Our Self-Managed Superannuation Fund administration facility has been showing steady growth in the number of funds administered and additional staff have been appointed to maintain service quality.
For
per
sona
l use
onl
y

P A G E 6 F I D U C I A N G R O U P L I M I T E D A C N 6 0 2 4 2 3 6 1 0 A N N U A L R E P O R T 2 0 1 5
PLATFORM ADMINISTRATIONPlatform Administration offers portfolio wrap administration for superannuation and investment services to financial planners. The hallmark of the Fiducian administration offering is quality in terms of daily processing, accuracy and customer service.
Funds Under AdministrationFunds under administration increased in total by 13.6 % to $1.17 billion (2014: $1.03 billion). Net Inflow continued to be positive from our aligned financial planners, both salaried and franchised.
Independent Financial Planners (IFAs)Funds under administration for IFAs are around 7.0% of total funds under administration. Some IFAs have sold their businesses to other Dealer Groups, which generally have their own recommended product lists and platform arrangements which can result in funds being withdrawn from Fiducian. The bulk of our withdrawals are from IFAs, but we believe that the rate of IFA withdrawals has slowed as many of their clients have been with Fiducian for a long time. Efforts are underway to build new relationships and net inflow from non-aligned financial planner groups. Our full service offer, supported by last year’s product restructure, could allow a non-aligned small dealer with a Fiducian relationship to become competitive against large-scale financial planning dealer groups.
Corporate SuperannuationAs advised last year, corporate superannuation and MySuper do not encourage personalised financial planning advice and therefore the fund has been closed. Those members who wished to stay with Fiducian were transferred to the Fiducian Superannuation Service.
INVESTMENT MANAGEMENTFiducian is a multi-asset, multi-style investment manager. We design Funds that seek to deliver above-average returns over the short- to medium-term and deliver superior returns, compared with their peers, over the longer term.
Blending of underlying portfolios within asset sectors and tilts towards different managers’ styles, depending on the economic cycle, also has the potential to reduce volatility. The investment team and investment committee remain confident that the Fiducian philosophy of liquidity and transparency will also benefit investors.
In investment performance surveys to 30 June, our diversified funds remain regularly in the top quartile or top of the second quartile over multiple time periods, which is what our investment process is designed to deliver. There were some notable performances over the last year for our flagship diversified funds. The Growth and Balanced Funds were ranked 3rd and 8th out of 188 funds, the Capital Stable Fund was ranked 5th out of 117 funds and the Ultra Growth Fund was ranked 2nd out of 113 funds. Returns from Fiducian specialist funds – the Fiducian India Fund at 41%, and Fiducian
Technology Fund at 41.2% – were also pleasing.
INFORMATION TECHNOLOGYFiducian Information Technology division has been busy with enhancements and delivering straight-through processing functionality to FasTrack, our administration system which provides greater control, efficiency and substantial cost savings and as well, opens up new business opportunities. These improvements are now in place and provide greater integration with our on line reporting tools and financial planning software FORCe which is licensed to our aligned financial planning
groups. Further improvements towards electronic application and processing are currently being considered.
JO INT REPORT OF THE CHA I RMAN AND THE MANAGING D I RECTOR CONT INUED
For
per
sona
l use
onl
y

A N N U A L R E P O R T 2 0 1 5 F I D U C I A N G R O U P L I M I T E D A C N 6 0 2 4 2 3 6 1 0 P A G E 7
JO INT REPORT OF THE CHA I RMAN AND THE MANAGING D I RECTOR CONT INUED
HUMAN RESOURCESManagement and StaffA number of staff changes occurred during the year, some through retirement and some through a career change. Key persons have been replaced by equally competent and energetic managers. Staff numbers have grown as advised above so has the management team on whom we place a great deal of reliance. Effective reporting processes are in place for all subsidiaries which enhance Group Board oversight of business activity. Key performance indicators have been identified for management in each area of the business which are used to monitor performance at least on a quarterly basis.
Planners Council, IT and Platform User GroupsThe Planners Council is drawn from our supporting financial planners and has again made a significant contribution to the Company during the past year. It continues to fulfil its role as a sounding board for the Company’s management and Boards and is a valuable resource and forum to allow financial planners to alert the Company to issues that may need consideration. The IT User Group and the Platform User Group again deserve commendation for their contributions to the developments and enhancements to our financial planning software (FORCe), on-line reporting tool (Fiducian OnLine) and platform administration system (FasTrack).
Board of Directors The Board of directors is working constructively to evaluate and support management’s recommendations for the Company. The Business Plan for the year ahead has adopted key measures for performance to lift profits including by acquisitions. Future performance can also be influenced by continuing strength in financial markets and decisive political leadership. Management remains committed to achieving the goals and objectives set down in these plans.
CURRENT ECONOMIC AND MARKET ENVIRONMENTOur economic analysis indicates that although there was some slowing of global activity early in calendar 2015 the general economic activity seems to be gradually improving. Widespread implementation of expansionary monetary stimulus has also dispelled the threat of deflation. Interest rates remain at record lows and sharp declines in the price of oil, in particular, could support domestic expenditure in developed economies. In Australia, the Federal Budget lifted business confidence with its tax support to small business. Unfortunately elevated corporate tax rates, a high minimum wage rate and rising electricity prices are holding back the economy. Nevertheless, we feel that the US should strengthen in 2016 and support world growth. China and India should continue to grow along with Japan and also Europe is showing some recovery. On the other hand, share markets now appear more fully valued than in recent times and some declines have occurred already while the spectre of an interest rate rise in the US remains. Interest rates remain low and even though some developed nations offer negative yields to investors in fixed-interest securities, the mountain of cash continues to build. This environment sets the scene for potentially some renewed confidence in global economic activity and it could only be a matter of time before some of the cash on the sidelines returns to invest in the share markets.
As always, we recommend that investors should consult a Fiducian financial planner to develop a diversified investment strategy that could help them achieve their financial goals.
For
per
sona
l use
onl
y

P A G E 8 F I D U C I A N G R O U P L I M I T E D A C N 6 0 2 4 2 3 6 1 0 A N N U A L R E P O R T 2 0 1 5
JO INT REPORT OF THE CHA I RMAN AND THE MANAGING D I RECTOR CONT INUED
OUTLOOKThe Board expects profit growth to continue steadily in the coming year as management focuses on realising the full potential of financial planning, platform administration, investment management, information technology and business/accounting services. The foundations of our business pillars are solid and growth strategies are in place by building scale on existing capacity and leveraging its relatively fixed cost base.
The revenue from recent business acquisitions has started to be received and should benefit the bottom line in this financial year. Additionally synergy benefits from these businesses are expected.
Expenditure controls and profits remain a priority. The Board intends to build scale quicker and a range of funding means may be explored to achieve acquisition momentum and deliver consistent double-digit earnings growth in coming years.
We would like to thank all participants for their individual contributions to the growth and success of Fiducian in what has been an eventful yet successful year with many accompanying changes in legislation.
Robert Bucknell Indy Singh Chairman Managing Director
27 August 2015 27 August 2015
For
per
sona
l use
onl
y

A N N U A L R E P O R T 2 0 1 5 F I D U C I A N G R O U P L I M I T E D A C N 6 0 2 4 2 3 6 1 0 P A G E 9
DIRECTORS R Bucknell FCAChairman
I Singh CFP, BTech, MComm (Bus), ASIA, ASFA, Dip. FPManaging Director
F Khouri B Bus, FCPA, FTIA
C Stone B Comm, LLB, LLM, CA, ACIS
SECRETARYI Singh CFP, BTech, MComm (Bus), ASIA, ASFA, Dip. FP
NOTICE OF ANNUAL GENERAL MEETING The annual general meeting of Fiducian Group Limited
Will be held at Level 4, 1 York Street, Sydney
Time 10:00am
Date Thursday 22 October 2015
PRINCIPAL REGISTERED OFFICE IN AUSTRALIALevel 41 York StreetSydney NSW 2000(02) 8298 4600
WHOLLY OWNED OPERATING ENTITIESFiducian Financial Services Pty LimitedFiducian Business Services Pty LimitedFiducian Portfolio Services LimitedFiducian Services Pty LimitedFiducian Investment Management Services Limited
SHARE REGISTER Computershare Investor Services Pty LimitedLevel 460 Carrington StreetSydney NSW 2000
AUDITOR PricewaterhouseCoopersChartered AccountantsDarling Park Tower 2201 Sussex StreetSydney NSW 2000
BANKERS Westpac Banking Corporation341 George Street Sydney NSW 2000
ANZ Banking Group 388 Collins Street Melbourne VIC 3000
STOCK EXCHANGE LISTING Fiducian Group Limited (ASX:FID) shares are listed on the Australian Securities Exchange.
WEBSITE ADDRESS www.fiducian.com.au
CORPORATE D I RECTORY
For
per
sona
l use
onl
y

P A G E 1 0 F I D U C I A N G R O U P L I M I T E D A C N 6 0 2 4 2 3 6 1 0 A N N U A L R E P O R T 2 0 1 5
Your directors present their report on the Fiducian Group Limited (“the Company“) and its wholly owned operating entities (referred to hereafter as the Group ) for the year ended 30 June 2015. The Group was formed on 1 March 2015 following the restructure of Fiducian Portfolio Services Limited (“FPSL”) and all its existing activities, with the exception of the Registrable Superannuation Entity licence (“RSE”), have been transitioned to various entities within the new Group. Other than the incorporation of a new parent company for the Group there has been no change to the consolidated group reporting entity and therefore the comparatives presented throughout this report are those of the consolidated group when FPSL was the parent entity of the Group.
Directors
The following persons were directors of Fiducian Group Limited from 1 March 2015 up to the date of this report. Before that all of the following people were directors of the previous parent, FPSL, from the start of the financial year until 1 March 2015.
R Bucknell I Singh F Khouri C Stone
Principal activities
During the year the principal continuing activities of the Group consisted of:-
a) Operating an Investor Directed Portfolio Service and Managed Discretionary Account service through Fiducian Investment Service
(b) Acting as the Trustee of Fiducian Superannuation Service through its wholly owned subsidiary, Fiducian Portfolio Services Limited
(c) Acting as the Responsible Entity of Fiducian Funds through its wholly owned subsidiary Fiducian Investment Management Services Limited
(d) Providing specialist financial planning services through its wholly owned operating subsidiary, Fiducian Financial Services Pty Limited
(e) Providing accountancy resource services through its wholly owned operating subsidiary, Fiducian Business Services Pty Limited
(f) Providing administration and professional services to the Group through its wholly owned subsidiary, Fiducian Services Pty Limited.
Dividends – Fiducian Group Limited
Dividends paid to members during the financial year by FPSL while it was the parent entity of the Fiducian Group were as follows:
2015 2014 $’000 $’000
Final ordinary fully franked dividend for the year ended 30 June 2014 of 5.00 cents(2013: Fully franked 3.60 cents) per share paid on 19 September 2014 . 1,538 1,131
Interim ordinary fully franked dividend for the year ended 30 June 2015 of 4.50 cents
(2014: Fully franked 4.10 cents) per share paid on 26 March 2015. 1,390 1,265
Total dividends in respect of the year 2,928 2,396
In addition to the above, since the end of the financial year, the directors of the current parent entity, Fiducian Group Limited have declared a payment of a final fully franked dividend for the year ended 30 June 2015 of 5.50 cents per ordinary share held at 10 September 2015 and payable on 24 September 2015.
D IRECTORS ’ R E PORT
For
per
sona
l use
onl
y

A N N U A L R E P O R T 2 0 1 5 F I D U C I A N G R O U P L I M I T E D A C N 6 0 2 4 2 3 6 1 0 P A G E 1 1
Comments on operations and results
Comments on the operations, business strategies, prospects and financial position are contained in the Joint Report of the Chairman and Managing Director.
Shareholder returns
The valuation of investment funds has improved substantially during the year and favourably impacted the management fees received by the Fiducian Group, as more fully detailed in the Joint Report of the Chairman and Managing Director. This has enabled Fiducian to increase profit for the second half of the year and declare a dividend distribution of 5.50 cents per share, bringing the full year dividend to 10 cents per share.
Significant changes in the state of affairs
On 1 March 2015, the Fiducian Group restructured into a non-operating holding company structure following receipt of the requisite approvals from the shareholders and the Federal Court of Australia. This restructure resulted in Fiducian Group Limited being established as the non-operating parent for the Fiducian Group. As a consequence of the restructure the activities of Fiducian Portfolio Services Limited, with the exception of the Registrable Superannuation Entity licence, were transitioned across to various entities within the Group to align the businesses along legal and operating entity lines.
Following on from the restructure the Group adopted tax consolidation and GST grouping to ease the burden of its taxation obligations.
Other than these, there were no significant changes in the state of affairs of the Group.
Matters subsequent to the end of the financial year
Subsequent to the end of the financial year a subsidiary of the Group has acquired two portfolios of financial planning clients with the transition to Fiducian commencing from 1 July 2015 and 1 August 2015 respectively. Under the terms of the contracts of acquisition the Group will finance the acquisitions through a combination of cash payments and issue of shares over the payment period. Accordingly the Group has issued 133,552 fully paid ordinary shares at $1.83 on 14 August 2015 towards payment of the first instalment of one of the above mentioned acquisitions. Further shares will be issued during the year in accordance with the terms of each contract.
The Group has also commenced proceedings with ASIC to deregister its two dormant subsidiaries, details of which are provided in Note 12 of these financial statements.
To the date of this report, the Group has not bought back any shares off the market (2014: Nil)
Review of operations
A summary of consolidated revenues and results by significant industry segments is set out below:-
SEGMENT REVENUES SEGMENT RESULTS
2015 2014 2015 2014 $’000 $’000 $’000 $’000
Platform 15,673 18,584 2,576 4,022Financial planning 11,470 10,392 1,522 2,065Business services 1,142 1,114 (81) (12)Fund Management 2,011 - 1,280 -Administration 3,571 - 1,296 -Intersegment sales (7,615) (7,217) - -
26,253 22,873
Profit from ordinary activities before income tax expense 6,593 6,075Income tax expense (1,971) (2,092)
Net profit attributable to members of Fiducian Group Limited 4,622 3,983
D IRECTORS ’ R E PORT CONT INUED
For
per
sona
l use
onl
y

P A G E 1 2 F I D U C I A N G R O U P L I M I T E D A C N 6 0 2 4 2 3 6 1 0 A N N U A L R E P O R T 2 0 1 5
Other than this there has not arisen in the interval between the end of the financial year and the date of this report any item, transaction or event of a material and unusual nature likely in the opinion of the directors of the Group, to affect significantly the operations of the group, the results of those operations or the state of affairs of the Group in subsequent years.
Likely developments and expected results of operations
The Chairman and Managing Director have commented on expected results of operations in their Joint Report. Other than this, the directors have excluded further information on likely developments in the operations of the Group and the expected results of those operations in future financial years, since, in the opinion of the directors, it would prejudice the interests of the Group if this information was included.
Environmental regulation
The Group is not subject to significant environmental regulations under a Commonwealth, State or Territory law.
Employee Diversity
Fiducian is proud to be an equal opportunity employer. It endorses diversity and currently has a number of employees who bring different skill-sets from their country of origin. We recognise that diversity includes, but is not limited to gender, age, ethnicity and cultural backgrounds. Our diversity policy encourages persons of different sexes, ethnic backgrounds, ages and skills to participate and receive recognition, reward and authority commensurate with their performance. Employees are comprised of staff from over 19 countries of origin, 26 % over 55 years, and 44 % female with 31 % in senior roles.
KEY MANAGEMENT PERSONNEL DISCLOSURES(a) Directors
The following persons were directors of Fiducian Group Limited during the financial year:
Chairman (non-executive) R Bucknell
Executive director I Singh – Managing Director
Non-executive directors F Khouri C Stone
(b) Information on directors
R Bucknell FCA. Chairman – non executive.
Experience and expertise
Chairman since inception in 1996. Extensive experience in accounting and business management over the past 50 years as a Chartered Accountant.
Other current directorships
None
Former directorships in the last 3 years
None
Special responsibilities
Chairman of the Group, member of the Remuneration, Internal Compliance Committees and Board Audit Committee.Member of the Publications Committee.
Interest in shares and options
800,000 ordinary shares in Fiducian Group Limited.
D IRECTORS ’ R E PORT CONT INUED
For
per
sona
l use
onl
y

A N N U A L R E P O R T 2 0 1 5 F I D U C I A N G R O U P L I M I T E D A C N 6 0 2 4 2 3 6 1 0 P A G E 1 3
I Singh CFP, BTech, MComm (Bus), ASIA, ASFA, Dip. FP. Managing Director.
Experience and expertise
Founder and Managing Director since inception in 1996. General Management and hands-on experience in the investment of savings and superannuation funds over the past 26 years.
Other current directorships
None
Former directorships in the last 3 years
None
Special responsibilities
Managing Director, member of Investment and Publications Committees.
Interest in shares and options
10,373,764 ordinary shares in Fiducian Group Limited.100,000 options for ordinary shares in Fiducian Group Limited
F Khouri B Bus, FCPA, FTIA Independent non-executive director.
Experience and expertise
Appointed to the Board 6 July 2007. Public accountant, registered company auditor, financial planner and business adviser since 1976 to small-and medium-enterprises, currently as a partner in the firm HG Khouri & Associates.
Other current directorships
Director of Fiducian Portfolio Services Limited, the trustee company for the Fiducian Superannuation Service.
Former directorships in the last 3 years
None
Special responsibilities
Member of the Trustee Board, member of the Audit Risk and Compliance Committees for both Corporate and Super, and member of Group and Trustee Remuneration Committees.
Interest in shares and options
251,373 ordinary shares in Fiducian Group Limited.
C Stone B Comm/LLB, LLM, CA, ACIS Independent non-executive director.
Experience and expertise
Appointed to the Board 3 March 2010. Practicing lawyer, holding senior legal and/or legal compliance roles in local and global financial services organisations, with 25 years experience. Currently Head of Compliance of State Street Australia Limited, and has 10 years experience as a Chartered Accountant in taxation and superannuation matters.
Other current directorships
None
Former directorships in the last 3 years
None
Special responsibilities
Chairman of the Publications Committee, and member of the Group Remuneration Committee, and the Group Audit Risk and Compliance Committee.
Interest in shares and options
33,700 ordinary shares in Fiducian Group Limited.
D IRECTORS ’ R E PORT CONT INUED
For
per
sona
l use
onl
y
P A G E 1 4 F I D U C I A N G R O U P L I M I T E D A C N 6 0 2 4 2 3 6 1 0 A N N U A L R E P O R T 2 0 1 5
KEY MANAGEMENT PERSONNEL DISCLOSURES CONTINUED
(c) Company secretary
The company secretary is Mr I Singh CFP, M Comm. (Bus), ASIA, ASFA, Dip. FP. Mr Singh has been the company secretary since inception in 1996, and is supported by legal counsel employed by Fiducian.
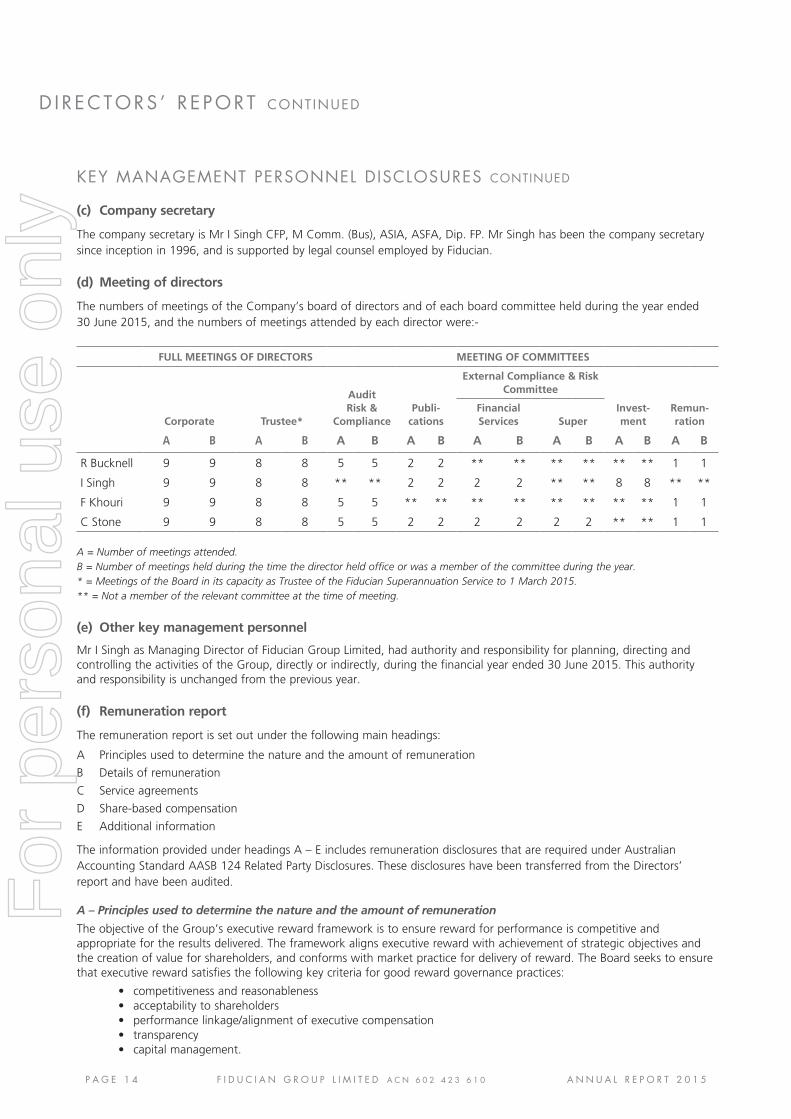
(d) Meeting of directors
The numbers of meetings of the Company’s board of directors and of each board committee held during the year ended 30 June 2015, and the numbers of meetings attended by each director were:-
FULL MEETINGS OF DIRECTORS MEETING OF COMMITTEES
Corporate Trustee*
Audit Risk &
CompliancePubli-
cations
External Compliance & Risk Committee
Invest-ment
Remun-ration
Financial Services Super
A B A B A B A B A B A B A B A B
R Bucknell 9 9 8 8 5 5 2 2 ** ** ** ** ** ** 1 1
I Singh 9 9 8 8 ** ** 2 2 2 2 ** ** 8 8 ** **
F Khouri 9 9 8 8 5 5 ** ** ** ** ** ** ** ** 1 1
C Stone 9 9 8 8 5 5 2 2 2 2 2 2 ** ** 1 1
A = Number of meetings attended. B = Number of meetings held during the time the director held office or was a member of the committee during the year. * = Meetings of the Board in its capacity as Trustee of the Fiducian Superannuation Service to 1 March 2015.** = Not a member of the relevant committee at the time of meeting.
(e) Other key management personnel
Mr I Singh as Managing Director of Fiducian Group Limited, had authority and responsibility for planning, directing and controlling the activities of the Group, directly or indirectly, during the financial year ended 30 June 2015. This authority and responsibility is unchanged from the previous year.
(f) Remuneration report
The remuneration report is set out under the following main headings:
A Principles used to determine the nature and the amount of remuneration
B Details of remuneration
C Service agreements
D Share-based compensation
E Additional information
The information provided under headings A – E includes remuneration disclosures that are required under Australian Accounting Standard AASB 124 Related Party Disclosures. These disclosures have been transferred from the Directors’ report and have been audited.
A – Principles used to determine the nature and the amount of remuneration
The objective of the Group’s executive reward framework is to ensure reward for performance is competitive and appropriate for the results delivered. The framework aligns executive reward with achievement of strategic objectives and the creation of value for shareholders, and conforms with market practice for delivery of reward. The Board seeks to ensure that executive reward satisfies the following key criteria for good reward governance practices:
• competitivenessandreasonableness • acceptabilitytoshareholders • performancelinkage/alignmentofexecutivecompensation • transparency • capitalmanagement.
D IRECTORS ’ R E PORT CONT INUED
For
per
sona
l use
onl
y

A N N U A L R E P O R T 2 0 1 5 F I D U C I A N G R O U P L I M I T E D A C N 6 0 2 4 2 3 6 1 0 P A G E 1 5
KEY MANAGEMENT PERSONNEL DISCLOSURES CONTINUED
A – Principles used to determine the nature and the amount of remuneration (continued)
(a) Non-executive directors
Fees and payments to non-executive directors reflect the demands which are made on, and the responsibilities of, the directors. Non-executive directors’ fees and payments are reviewed annually by the Board. Non-executive directors are no longer entitled to options under the Employee and Director Share Option Plan.
Directors’ fees
The current base remuneration was last reviewed in June 2014. The Chairman and other external directors are paid a fixed fee plus a fee based on time spent on committees and any other fee for additional time spent on matters as approved by the Board. Directors with earnings derived from business placed with the Group may also receive remuneration as financial planners. The Chairman’s fixed fee is higher than other non-executive directors based on comparative roles, time and fees in the external market.
Non-executive directors’ fees for the Company are determined within an aggregate directors’ fee pool limit, which is periodically recommended for approval by shareholders. The maximum pool currently stands at $350,000 per annum and was approved by shareholders at the Annual General Meeting on 24 October 2007. No increase is being sought at the next Annual General Meeting.
Retirement allowances for directors
There are no retirement allowances for non-executive directors other than superannuation accumulation arising from any contributions made for them.
(b) Executive Director
Remuneration and other terms of employment for the Managing Director are formalised in a service agreement. The Managing Director’s agreement provides for the provision of performance based cash bonuses and, where eligible, participation in the Employee and Director Share Option Plan. Other major provisions of the agreement are set out below:
I Singh, Managing Director
• Termofagreement–until30June2019
• Basesalary,inclusiveofsuperannuationandsalarysacrificebenefits.
• DeathandTPD/Traumacover.
• Short-termperformanceincentives.
• Long-termincentivesthroughtheFiducianPortfolioServicesLimitedEmployeeandDirectorShareOptionPlan,and
• Retirementbenefits.
The combination of these comprises the executive’s total remuneration package.
An external remuneration consultant advises the Remuneration Committee, at least every 3 years, to ensure that the Group has structured an executive remuneration package that is market-competitive and complimentary to the reward strategy of the organisation. Their most recent review was in June 2015.
Base salary
Mr Singh receives a base pay that comprises the fixed component of pay and the potential for rewards, which reflects the market value for his role. The base salary is reviewed annually by the Remuneration Committee at the commencement of each financial year.
There are no guaranteed base pay increases fixed in the executive’s contract.
Benefits
Executive benefits include death cover of $1 million and TPD/Trauma insurance cover of $0.2 million.
D IRECTORS ’ R E PORT CONT INUED
For
per
sona
l use
onl
y

P A G E 1 6 F I D U C I A N G R O U P L I M I T E D A C N 6 0 2 4 2 3 6 1 0 A N N U A L R E P O R T 2 0 1 5
KEY MANAGEMENT PERSONNEL DISCLOSURES CONTINUED
A – Principles used to determine the nature and the amount of remuneration (continued)
Short-term incentives
Mr Singh is entitled to a discretionary cash performance bonus of up to 20% of his total package as assessed by the Remuneration Committee against performance indicators and objectives set by the Board. It is limited to being met within the budget or out of over-budget financial performance. As in previous years Mr Singh has declined to accept the entitlement that was due for the financial year.
Long-term incentives
Mr Singh is entitled to a discretionary performance bonus of up to 100,000 options per year determined as at 30 June each year, based on the following measures:
• the Company’s pre-tax profit OR
• the 30-day average for June market value for ordinary shares in the Company increasing by at least 15% over the previous year.
The options are issued under the Company’s ESOP at the rate of 5,000 options for each 1% increase in annual profit in excess of 15% or 5000 options for each 1% increase in the 30 day average for June market value for ordinary shares in the Company whichever is higher and only after approval by shareholders in the Company.
Retirement benefits
Retirement benefits are delivered under the Fiducian Superannuation Service. This fund provides accumulation benefits based on the SGC contributions by the specified executive, on commercial terms and conditions. Other retirement benefits may be provided directly by the Group only if approved by the shareholders. Payment of a termination benefit on early termination by the Managing Director or by mutual consent is equal to 6 months of the gross annual remuneration.
B – Details of remuneration
The key management personnel of the Group were the following executive and non-executive directors during the year:
• RBucknell–Chairman
• ISingh–Managing Director & Company Secretary
• FKhouri–Non-executive Director
• CStone–Non-executive Director
Amounts of remuneration
Details of the remuneration of the key management personnel are set out in the following table :-
D IRECTORS ’ R E PORT CONT INUED
For
per
sona
l use
onl
y

A N N U A L R E P O R T 2 0 1 5 F I D U C I A N G R O U P L I M I T E D A C N 6 0 2 4 2 3 6 1 0 P A G E 1 7
KEY MANAGEMENT PERSONNEL DISCLOSURES CONTINUED
B – Details of remuneration (continued)
Key management personnel of Fiducian Group Limited and the Group
2015 SHORT-TERM EMPLOYEE BENEFITS POST-EMPLOYMENT SHARE-BASED BENEFITS PAYMENT CASH SALARY CASH NON-MONETARY SUPER- RETIREMENT NAME AND FEES (a) BONUS BENEFITS ANNUATION BENEFITS OPTIONS TOTAL
$ $ $ $ $ $ $
Non-executive directors
R Bucknell1,2 123,000 - - - - - 123,000 (Chairman)
F Khouri3,4 80,539 - - 7,651 - - 88,190
C Stone4 76,031 - - 8,132 - - 84,163
Executive director I Singh5 450,217 - 14,670 18,784 - - 483,671
Totals 729,787 - 14,670 34,567 - - 779,024
(1) Excludes GST if paid to another firm.
(2) Including amounts paid to the director’s company only in respect to director’s duties.
(3) This excludes fees of $ 211,179 for financial planning services paid to companies in which Mr Khouri has an interest in his capacity as a financial planner.
(4) Non-executive directors’ fees have increased due to the ongoing implementation of the new APRA prudential standards together with time costs related to the restructure of the Group during the current year.
(5) Mr I Singh is not entitled to any options in respect of the year ended 30 June 2015.
2014 SHORT-TERM EMPLOYEE BENEFITS POST-EMPLOYMENT SHARE-BASED BENEFITS PAYMENT CASH SALARY CASH NON-MONETARY SUPER- RETIREMENT NAME AND FEES (a) BONUS BENEFITS ANNUATION BENEFITS OPTIONS TOTAL
$ $ $ $ $ $ $
Non-executive directors1
R Bucknell2,3 164,850 - - - - - 164,850 (Chairman)
F Khouri4 61,760 - - 4,966 - - 66,726
C Stone 68,822 - - 8,002 - - 76,824
Executive director I Singh5 449,667 - 15,318 17,775 - 18,981 501,741
Totals 745,099 - 15,318 30,743 - 18,981 810,141
(1) Non-executive directors fees have increased during the current year due to new APRA prudential standards and other requirements introduced from 1 July 2013.
(2) Excludes GST if paid to another firm.
(3) Including amounts paid to the director’s company only in respect to director’s duties.
(4) This excludes fees of $209,142 for financial planning services paid to companies in which Mr Khouri has an interest in his capacity as a financial planner.
(5) Subject to shareholder approval 100,000 options will be issued to Mr I Singh in respect of 2014 financial year.
D IRECTORS ’ R E PORT CONT INUED
For
per
sona
l use
onl
y

P A G E 1 8 F I D U C I A N G R O U P L I M I T E D A C N 6 0 2 4 2 3 6 1 0 A N N U A L R E P O R T 2 0 1 5
KEY MANAGEMENT PERSONNEL DISCLOSURES CONTINUED
C – Service Agreements and Induction Process
The service agreement of the Executive Director is detailed in paragraph A(b) earlier. There are no service agreements with non-executive directors or employees.
In preparation for appointment to the Board, all non-executive directors undergo an induction program and receive an induction pack of documents necessary for them to understand Fiducian’s charters, policies, procedures, culture and ethical values to enable new directors to carry out their duties in an effective and efficient manner.
D – Share-based compensation
(i) Option compensation and holdings
Options over shares in Fiducian Group Limited are granted under the Employee and Director Share Option Plan, which was approved by shareholders on 28 July 2000. The Plan is described under Note 26.
The numbers of options for ordinary shares in the Company held directly by directors of Fiducian Group Limited and details of options for ordinary shares in the Company provided as remuneration to the key management personnel of the Group, are set out below:-
2015 BALANCE AT GRANTED DURING BALANCE AT THE START OF THE YEAR AS LAPSED DURING THE END OF VESTED AND NAME THE YEAR EXERCISED REMUNERATION1 THE YEAR THE YEAR EXERCISABLE
I Singh 140,000 140,000 100,000 - 100,000 -
1 Options granted during the year are in respect of the entitlement relating to the year ended 30 June 2014.
2014 BALANCE AT GRANTED DURING BALANCE AT THE START OF THE YEAR AS LAPSED DURING THE END OF VESTED AND NAME THE YEAR EXERCISED REMUNERATION THE YEAR THE YEAR EXERCISABLE
I Singh 55,000 - 100,000 (15,000) 140,000 40,000
Note: The assessed fair value at grant date of options granted to the individuals is detailed in Note 26.
D IRECTORS ’ R E PORT CONT INUED
For
per
sona
l use
onl
y

A N N U A L R E P O R T 2 0 1 5 F I D U C I A N G R O U P L I M I T E D A C N 6 0 2 4 2 3 6 1 0 P A G E 1 9
KEY MANAGEMENT PERSONNEL DISCLOSURES CONTINUED
D – Share-based compensation (continued)
(ii) Share holdings
The numbers of shares in the Company held by current directors of Fiducian Group Limited, including their personally related and associated entities, are set out below. No shares were granted during the period as compensation.
2015 RECEIVED DURING BALANCE AT THE THE YEAR ON THE OTHER CHANGES BALANCE AT THE END NAME START OF THE YEAR EXERCISE OF OPTIONS DURING THE YEAR OF THE YEAR
I Singh 10,162,512 140,000 71,252 10,373,764
R Bucknell 800,000 - - 800,000
F Khouri 251,373 - - 251,373
C Stone 23,700 - 10,000 33,700
2014 RECEIVED DURING BALANCE AT THE THE YEAR ON THE OTHER CHANGES BALANCE AT THE END NAME START OF THE YEAR EXERCISE OF OPTIONS DURING THE YEAR OF THE YEAR
I Singh 10,113,012 - 49,500 10,162,512
R Bucknell 900,000 - (100,000) 800,000
F Khouri 226,373 - 25,000 251,373
C Stone 20,000 - 3,700 23,700
Shares provided on exercise of options
140,000 ordinary shares in the Company were provided as a result of the exercise of remuneration options to a director of Fiducian Group Limited during the period (2014: Nil). No amounts are unpaid on any shares issued on the exercise of options.
E – Additional information
Principles used to determine the nature and amount of remuneration: relationship between remuneration and company performance
The overall level of executive reward takes into account the performance of the Group over a number of years, with greater emphasis given to the current and prior year. For the current year ended 30 June 2015 there has been a small increase in base salary of the Managing Director. Cash bonuses and entitlements have not been granted or paid in the past 5 financial years and the grant of options entitlements have been only in accordance with the incentive programs. The Managing Director is not entitled to any options in respect of the current year ended 30 June 2015 (2014: 100,000 options).
Directors’ superannuation
Directors have superannuation monies invested in Fiducian Superannuation Service. These monies are invested subject to the normal terms and conditions applying to this superannuation fund.
Loans to directors
No loans were made to directors during the financial year (2014: Nil).
Other transactions with key management personnel
A director, Mr R E Bucknell, is a director of Hunter Place Services Pty Ltd, a company which provides his services as a director to the Company.
A director, Mr F Khouri, is an authorised representative under the Fiducian Financial Services Pty Ltd Australian Financial Services Licence and is a director and shareholder of Hawkesbury Financial Services Pty Ltd, which is a franchisee of Fiducian
D IRECTORS ’ R E PORT CONT INUED
For
per
sona
l use
onl
y
P A G E 2 0 F I D U C I A N G R O U P L I M I T E D A C N 6 0 2 4 2 3 6 1 0 A N N U A L R E P O R T 2 0 1 5
D I R ECTORS ’ R E PORT CONT INUED
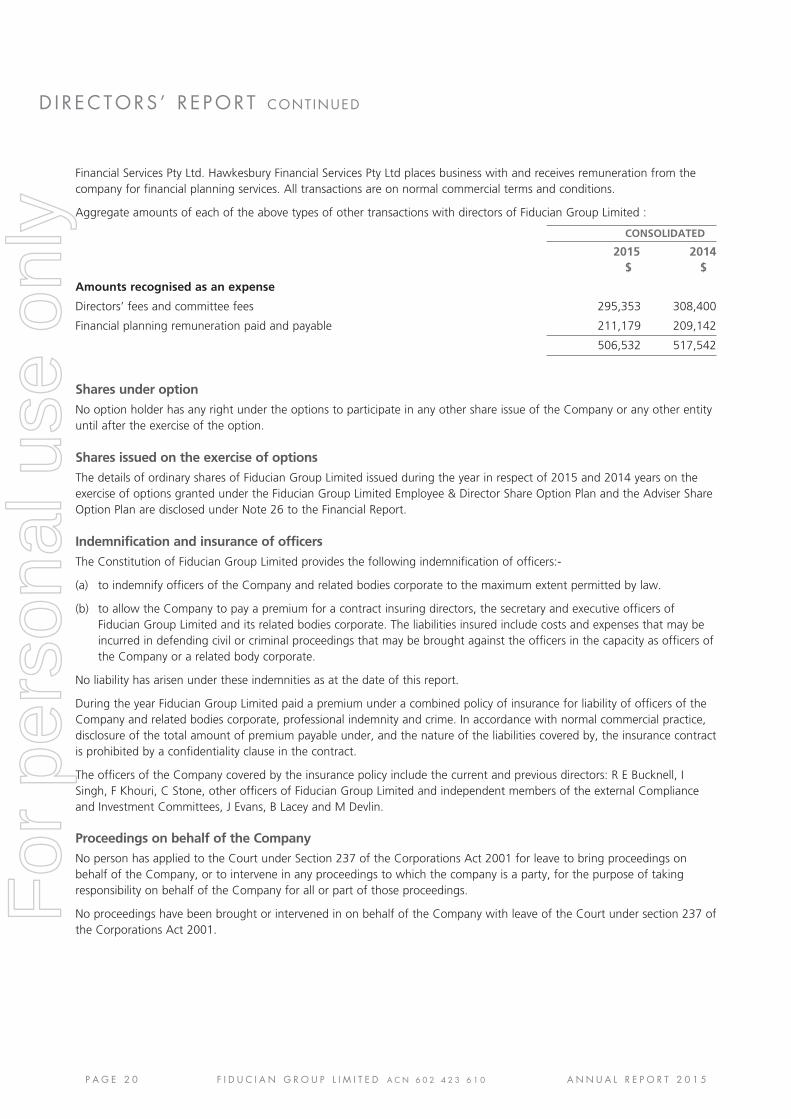
Financial Services Pty Ltd. Hawkesbury Financial Services Pty Ltd places business with and receives remuneration from the company for financial planning services. All transactions are on normal commercial terms and conditions.
Aggregate amounts of each of the above types of other transactions with directors of Fiducian Group Limited :
CONSOLIDATED
2015 2014 $ $
Amounts recognised as an expense
Directors’ fees and committee fees 295,353 308,400
Financial planning remuneration paid and payable 211,179 209,142
506,532 517,542
Shares under option
No option holder has any right under the options to participate in any other share issue of the Company or any other entity until after the exercise of the option.
Shares issued on the exercise of options
The details of ordinary shares of Fiducian Group Limited issued during the year in respect of 2015 and 2014 years on the exercise of options granted under the Fiducian Group Limited Employee & Director Share Option Plan and the Adviser Share Option Plan are disclosed under Note 26 to the Financial Report.
Indemnification and insurance of officers
The Constitution of Fiducian Group Limited provides the following indemnification of officers:-
(a) to indemnify officers of the Company and related bodies corporate to the maximum extent permitted by law.
(b) to allow the Company to pay a premium for a contract insuring directors, the secretary and executive officers of Fiducian Group Limited and its related bodies corporate. The liabilities insured include costs and expenses that may be incurred in defending civil or criminal proceedings that may be brought against the officers in the capacity as officers of the Company or a related body corporate.
No liability has arisen under these indemnities as at the date of this report.
During the year Fiducian Group Limited paid a premium under a combined policy of insurance for liability of officers of the Company and related bodies corporate, professional indemnity and crime. In accordance with normal commercial practice, disclosure of the total amount of premium payable under, and the nature of the liabilities covered by, the insurance contract is prohibited by a confidentiality clause in the contract.
The officers of the Company covered by the insurance policy include the current and previous directors: R E Bucknell, I Singh, F Khouri, C Stone, other officers of Fiducian Group Limited and independent members of the external Compliance and Investment Committees, J Evans, B Lacey and M Devlin.
Proceedings on behalf of the Company
No person has applied to the Court under Section 237 of the Corporations Act 2001 for leave to bring proceedings on behalf of the Company, or to intervene in any proceedings to which the company is a party, for the purpose of taking responsibility on behalf of the Company for all or part of those proceedings.
No proceedings have been brought or intervened in on behalf of the Company with leave of the Court under section 237 of the Corporations Act 2001.
For
per
sona
l use
onl
y

A N N U A L R E P O R T 2 0 1 5 F I D U C I A N G R O U P L I M I T E D A C N 6 0 2 4 2 3 6 1 0 P A G E 2 1
Non-audit services
The Company may decide to employ the auditor on assignments additional to their statutory audit duties where the auditor’s expertise and experience with the Company and/or Group are important.
The board of directors is satisfied that the provision of non-audit services by the auditor did not compromise the auditor independence requirements of the Corporations Act 2001 for the following reasons:-
• allnon-auditserviceshavebeenreviewedbytheauditcommitteetoensuretheydonotimpacttheimpartialityandobjectivity of the auditor.
• noneoftheservicesunderminethegeneralprinciplesrelatingtoauditorindependenceassetoutinAPES110CodeofEthics for Professional Accountants.
The fees paid or payable for services provided during the year by the auditor (PricewaterhouseCoopers) of the parent entity, its related practices and non-related audit firms, are shown in Note 27 to the consolidated financial report.
Auditor’s independence declaration
A copy of the auditors’ independence declaration as required under Section 307C of the Corporations Act 2001 is set out on page 22. .
Rounding of amounts
The Company is of a kind referred to in Class Order 98/0100, issued by the Australian Securities and Investments Commission, relating to the “rounding off” of amounts in the directors’ report. Amounts in the directors’ report have been rounded off in accordance with that Class Order to the nearest thousand dollars, or in certain cases, to the nearest dollar.
AuditorPricewaterhouseCoopers continues in office in accordance with section 327 of the Corporations Act 2001.
Corporate governanceA description of the group’s current corporate governance practices is available on the group’s website and can be viewed at http://www.fiducian.com.au/linkref/corporate_governance_statement.pdf.
This report is made in accordance with a resolution of the directors.
I SinghDirector
Sydney, 27 August 2015
D IRECTORS ’ R E PORT CONT INUED
For
per
sona
l use
onl
y

P A G E 2 2 F I D U C I A N G R O U P L I M I T E D A C N 6 0 2 4 2 3 6 1 0 A N N U A L R E P O R T 2 0 1 5
AUD I TOR ’S INDEPENDENCE DECLARAT ION
For
per
sona
l use
onl
y

A N N U A L R E P O R T 2 0 1 5 F I D U C I A N G R O U P L I M I T E D A C N 6 0 2 4 2 3 6 1 0 P A G E 2 3
SHAREHOLDER INFORMAT ION
A. DISTRIBUTION OF EQUITY SECURITY HOLDERS BY SIZE OF HOLDINGAnalysis of numbers of equity security holders by size of holding, as at 19 August 2015
DISTRIBUTION : OPTIONS ORDINARY SHARES
1 - 1,000 - 961,001 - 5,000 - 3675,001 - 10,000 - 12010,001 - 50,000 - 15350,001 - 100,000 1 22100,001 - and over - 26
Total holders 1 784
There were no holders of a less than marketable parcel of ordinary shares.
B. EQUITY SECURITY HOLDERSTwenty largest quoted equity security holders.
The names of the twenty largest registered shareholders of quoted equity securities as at 19 August 2015, are listed below.
NAME NUMBER HELD PERCENTAGE OF ISSUED SHARES
1 Indyshri Singh Pty Limited 8,795,933 28.36% 2 HSBC Custody Nominees (Australia) Limited 1,976,791 6.37% 3 National Nominees Limited 1,813,266 5.85% 4 JP Morgan Nominees Australia Limited 1,667,184 5.38% 5 Shrind Investments Pty Ltd (Indyshri Super Fund A/C) 1,571,831 5.07% 6 London City Equities Limited 1,293,618 4.17% 7 Norcad Investment Pty Ltd 906,600 2.92% 8 Hunter Place Services Pty Ltd 800,000 2.58% 9 Citicorp Nominees Pty Limited 696,595 2.25% 10 Citicorp Nominees Pty Limited (Colonial First State Inv A/C) 692,293 2.23% 11 D R Smith Holdings Pty Ltd 593,689 1.91% 12 Mr Victor John Plummer 500,000 1.61% 13 Garrett Smythe Limited 339,000 1.09% 14 BNP Paribas Noms (NZ) Ltd 333,000 1.07% 15 Mr Ivan Tanner + Mrs Felicity Tanner (The Supernatural S/F A/C) 326,795 1.05% 16 Bond Street Custodians Limited (Ganes Value Growth A/C 286,768 0.92% 17 London City Equities Limited 277,034 0.89% 18 H F R Pty Ltd (F & M Khouri S/Fund A/C) 199,187 0.64% 19 Dendrinos Nominees Pty Ltd (Bayside Taxi Staff S/F A/C) 150,000 0.48% 20 Mrs Jennifer Margaret Leeson 138,847 0.45%
23,358,431 75.29%
Unquoted equity securities
As at 19 August 2015:
TYPE OF SECURITY NUMBER ON ISSUE NUMBER OF HOLDERS
Options – Managing Director 100,000 1
100,000 1
For
per
sona
l use
onl
y

P A G E 2 4 F I D U C I A N G R O U P L I M I T E D A C N 6 0 2 4 2 3 6 1 0 A N N U A L R E P O R T 2 0 1 5
C. SUBSTANTIAL SHAREHOLDERSSubstantial shareholders and associates as at 19 August 2015 (more than 5% of a class of shares) in the Company are set out below:-
NAME NUMBER HELD PERCENTAGE
Indyshri Singh Pty Limited and associates 10,373,764 33.45%HSBC Custody Nominees (Australia) Limited 1,976,791 6.37% National Nominees Limited 1,813,266 5.85% J P Morgan Nominees Australia Limited 1,667,184 5.38%London City Equities Limited 1,570,652 5.06%
D. VOTING RIGHTSThe voting rights attaching to each class of equity securities are set out below:-
Ordinary shares
On a show of hands each holder of ordinary shares has one vote and upon a poll one vote for each share held.
Options
No voting rights.
SHAREHOLDER INFORMAT ION CONT INUED
For
per
sona
l use
onl
y

A N N U A L R E P O R T 2 0 1 5 F I D U C I A N G R O U P L I M I T E D A C N 6 0 2 4 2 3 6 1 0 P A G E 2 5
For
per
sona
l use
onl
y

P A G E 2 6 F I D U C I A N G R O U P L I M I T E D A C N 6 0 2 4 2 3 6 1 0 A N N U A L R E P O R T 2 0 1 5
F I N A N C I A L R E P O R T
C O N S O L I D A T E D S T A T E M E N T O F C O M P R E H E N S I V E I N C O M E 2 7
C O N S O L I D A T E D S T A T E M E N T O F F I N A N C I A L P O S I T I O N 2 8
C O N S O L I D A T E D S T A T E M E N T O F C H A N G E S I N E Q U I T Y 2 9
C O N S O L I D A T E D S T A T E M E N T O F C A S H F L O W S 3 0
N O T E S T O T H E F I N A N C I A L S T A T E M E N T S 3 1
D I R E C T O R S ’ D E C L A R A T I O N 7 0
I N D E P E N D E N T A U D I T O R ’ S R E P O R T T O T H E M E M B E R S 7 1
This financial report covers the consolidated Fiducian Group Limited and its controlled
entities. The financial report is presented in Australian currency.
Fiducian Group Limited is a company limited by shares, incorporated and domiciled in
Australia. Its registered office and principal place of business is:
Fiducian Group Limited
Level 4, 1 York Street
Sydney NSW 2000
A description of the nature of the consolidated entity’s operations and its principal activities
is included in the Joint Report of the Chairman and Managing Director, and in the director’s
report on pages 2 – 21, both of which are not part of this financial report.
The financial report was authorised for issue by the directors on 27 August 2015. The
Company has the power to amend and reissue the financial report.
Through the use of the internet, we have ensured that our corporate reporting is timely,
complete, and available globally at minimum cost to the Company. All press releases,
financial reports and other information are available on our website: www.fiducian.com.au.
FINANCIAL REPORT
For
per
sona
l use
onl
y

A N N U A L R E P O R T 2 0 1 5 F I D U C I A N G R O U P L I M I T E D A C N 6 0 2 4 2 3 6 1 0 P A G E 2 7
CONSOL IDATED S TATEMENT OF COMPREHENS IVE INCOMEFOR THE YEAR ENDED 30 JUNE 2015
NOTES CONSOLIDATED
2015 2014
$’000 $’000
Revenue from ordinary activities 4 25,918 22,537
Other Income 5 335 337
Payments to advisers and related costs (5,715) (4,908)
Employee benefits expense (10,740) (9,812)
Depreciation and amortisation expense 6(a) (860) (682)
Other expenses 6(b) (2,345) (1,396)
Profit before income tax expense 6,593 6,075
Income tax expense 7 (1,971) (2,092)
Profit for the year 24 4,622 3,983
Other comprehensive income for the full year, net of tax
- -
Total comprehensive income for the year 4,622 3,983
Profit is attributible to:
Owners of Fiducian Group Limited 4,622 3,983
4,622 3,983
Earnings per share 32
Earnings per share from profit from continuing operations attributable to the ordinary equity holders of the Company:
Basic earnings per share (in cents) 14.99 cents 12.81 cents
Diluted earnings per share (in cents) 14.93 cents 12.75 cents
The above statement of comprehensive income should be read in conjunction with the accompanying notes.
For
per
sona
l use
onl
y

P A G E 2 8 F I D U C I A N G R O U P L I M I T E D A C N 6 0 2 4 2 3 6 1 0 A N N U A L R E P O R T 2 0 1 5
CONSOL IDATED STATEMENT OF F INANCIAL POS IT IONAS AT 30 JUNE 2015
NOTES CONSOLIDATED
2015 2014
$’000 $’000
ASSETS
Current assets
Cash and cash equivalents 9 12,374 11,194
Trade and other receivables 10 3,747 2,855
Total Current Assets 16,121 14,049
Non-current assets
Receivables 11 3,491 2,084
Other financial assets
value through profit or loss 13 - 106
Property, plant and equipment 14 388 524
Intangible assets 16 8,770 9,600
Total Non-Current Assets 12,649 12,314
Total assets 28,770 26,363
LIABILITIES
Current liabilities
Trade and other payables 17 5,073 4,118
Current tax liabilities 18 1,462 1,173
Total Current Liabilities 6,535 5,291
Non-current liabilities
Payables non current 19 - 276
Net deferred tax liabilities 20 123 497
Provisions 21 921 947
Total Non-Current Liabilities 1,044 1,720
Total liabilities 7,579 7,012
Net assets 21,191 19,351
EQUITY
Contributed equity 22 6,366 6,236
Reserves 23 42 26
Retained profits 24 14,783 13,089
Total equity 21,191 19,351
The above statement of financial position should be read in conjunction with the accompanying notes.For
per
sona
l use
onl
y

A N N U A L R E P O R T 2 0 1 5 F I D U C I A N G R O U P L I M I T E D A C N 6 0 2 4 2 3 6 1 0 P A G E 2 9
CONSOL IDATED STATEMENT OF CHANGES IN EQU I TYAS AT 30 JUNE 2015
NOTES CONTRIBUTED EQUITY $’000
RESERVES $’000
RETAINED EARNINGS
$’000
TOTAL $’000
Balance as at 30 June 2013 7,145 75 11,502 18,722
Profit for the year - - 3,983 3,983
Other comprehensive income - - - -
Total comprehensive income for the year - - 3,983 3,983
Transactions with equity holders in their capacity as equity holders
Contributions of equity, net of transaction costs 22 (909) - - (909)
Buy-back of shares 22 - - - -
Dividends provided for or paid 8 - - (2,396) (2,396)
Share options lapsed 23 - (49) - (49)
Total transactions with equity holders (909) (49) (2,396) (3,354)
Balance as at 30 June 2014 6,236 26 13,089 19,351
Profit for the year - - 4,622 4,622
Other comprehensive income - - - -
Total comprehensive income for the year - - 4,622 4,622
Transactions with equity holders in their capacity as equity holders
Buy-back of shares 22 (26) - - (26)
Dividends provided for or paid 8 - - (2,928) (2,928)
Share issued on exercise of options 156 - - 156
Options issued during the year 23 - 16 - 16
Total transactions with equity holders 130 16 (2,928) (2,782)
Balance as at 30 June 2015 6,366 42 14,783 21,191
The above statement of changes in equity should be read in conjunction with the accompanying notes.
For
per
sona
l use
onl
y

P A G E 3 0 F I D U C I A N G R O U P L I M I T E D A C N 6 0 2 4 2 3 6 1 0 A N N U A L R E P O R T 2 0 1 5
CONSOL IDATED STATEMENT OF CASH F LOWSFOR THE YEAR ENDED 30 JUNE 2015
NOTES 2015 2014
$’000 $’000
Cash flows from operating activities
Receipts from customers 27,908 24,575
(inclusive of goods and services tax)
Payments to suppliers and employees (19,708) (17,814)
(inclusive of goods and services tax)
8,200 6,761
Interest received 313 322
Income taxes (paid) / refunded (2,006) (1,219)
Net cash inflow from operating activities 31 6,507 5,864
Cash flows from investing activities
Loans to related parties (associates, planners and staff) (1,719) -
Investment in subsidiary / Trusts 112 64
Payments in relation to acquisitions (987) (874)
Repayment of loans by associates & planners 94 95
Payments for property, plant and equipment (29) (89)
Net cash (outflow)/inflow from investing activities (2,529) (804)
Cash flows from financing activities
Payments for shares bought back (26) (909)
Shares issued on exercise of options 156 -
Dividends paid (2,928) (2,396)
Net cash (outflow) from financing activities (2,798) (3,305)
Net increase in cash held 1,180 1,754
Cash and cash equivalents at the beginning of the year 11,194 9,440
Cash and cash equivalents at the end of year 9 12,374 11,194
The above statement of cash flow should be read in conjunction with the accompanying notes.
For
per
sona
l use
onl
y

A N N U A L R E P O R T 2 0 1 5 F I D U C I A N G R O U P L I M I T E D A C N 6 0 2 4 2 3 6 1 0 P A G E 3 1
1 SUMMARY OF SIGNIFICANT ACCOUNTING POLICIESThe principal accounting policies adopted for the preparation of the financial report are set out below. These policies have been consistently applied to all the years presented, unless otherwise stated. The financial report includes Fiducian Group Limited and its subsidiaries.
(a) Basis of preparation
This general purpose financial report has been prepared in accordance with Australian Accounting Standards, Australian Accounting Interpretations, other authoritative pronouncements of the Australian Accounting Standards Board and the Corporations Act 2001. Fiducian Group Limited is a for-profit entity for the purpose of preparing the financial statements.
Compliance with IFRS
The financial report of Fiducian Group Limited also complies with International Financial Reporting Standards (IFRS) as issued by the International Accounting Standards Board (IASB).
Historical cost convention
The financial report has been prepared under the historical cost convention, as modified by the revaluation of financial assets and liabilities at fair value through profit or loss.
Restructure and comparatives
On 1 March 2015, the Fiducian Group restructured into a non-operating holding company structure following receipt of the requisite approvals from the shareholders and the Federal Court of Australia. This restructure resulted in Fiducian Group Limited being established as the non-operating parent for the Fiducian Group. As a consequence of the restructure the activities of Fiducian Portfolio Services Limited , with the exception of the Registrable Superannuation Entity licence, were transitioned across to various entities within the Group to align the businesses along legal and operating entity lines. Other than the incorporation of a new parent company for the Group there has been no change to the consolidated group reporting entity and therefore the comparatives presented throughout this report are those of the consolidated group when Fiducian Portfolio Services Ltd was the parent entity of the Group.
Critical accounting estimates
The preparation of financial reports requires the use of certain critical accounting estimates. It also requires management to exercise its judgement in the process of applying the Group’s accounting policies. The areas involving a higher degree of judgement or complexity, or areas where assumptions and estimates are significant to the financial statements, are disclosed in Note 2.
(b) Principles of consolidation
The consolidated financial report incorporates the assets and liabilities of all entities controlled by Fiducian Group Limited (company or parent entity) as at 30 June 2015 and the results of all controlled entities for the year then ended. Fiducian Group Limited and its subsidiaries together are referred to in this financial report as the Group.
Subsidiaries are all entities (including structured entities) over which the Group has control. The group controls an entity when the group is exposed, to or has rights to, variable returns from its involvement with the entity and has the ability to affect those returns through its power to direct the activities of the entity. Subsidiaries are fully consolidated from the date on which control is transferred to the Group. They are de-consolidated from the date that control ceases. Investments in subsidiaries are accounted for at cost in the parent company’s financial report.
The acquisition method of accounting is used to account for the business combinations by the Group.
Intercompany transactions and balances on transactions between Group companies are eliminated. Unrealised losses are also eliminated unless the transaction provides evidence of the impairment of the asset transferred. Accounting policies of subsidiaries have been changed where necessary to ensure consistency with the policies adopted by the Group.
Non-controlling interests in the results and equity of subsidiaries are shown separately in the statement of comprehensive income.
NOTES TO THE F INANCIAL STATEMENTSFOR THE YEAR ENDED 30 JUNE 2015
For
per
sona
l use
onl
y

P A G E 3 2 F I D U C I A N G R O U P L I M I T E D A C N 6 0 2 4 2 3 6 1 0 A N N U A L R E P O R T 2 0 1 5
1 SUMMARY OF SIGNIFICANT ACCOUNTING POLICIES cont inued
(c) Revenue recognition
Revenue is measured at the fair value of the consideration received or receivable. Amounts disclosed as revenue are net of returns and amounts collected on behalf of third parties.
Revenue is recognised for the major business activities as follows:-
(i) Management fees and Fees, payments to advisers and related costs
Revenues comprising trustee and management fees are recognised on an accruals basis. Fees, payments to advisers and costs related to this revenue are recognised at the same time and on the same basis.
(ii) Interest income
Interest income is recognised on a time proportion basis using the effective interest method. When a receivable is impaired, the Group reduces the carrying amount to its recoverable amount, being the estimated future cash flow discounted at the original effective interest rate of the instrument, and continues unwinding the discount as interest income. Interest income on impaired loans is recognised using the original effective interest rate.
(iii) Dividends
Dividends are recognised as revenue when the right to receive payment is established.
(iv) Distributions from related trusts
Distributions from related trusts are recognised as revenue when the right to receive payment is established.
(v) Foreign currency translation
(i) Functional and presentation currency
Items included in the financial statements of each of the group’s entities are measured using the currency of the primary economic environment in which the entity operates (‘the functional currency’). The consolidated financial statements are presented in Australian dollars, which is Fiducian Group Limited’s functional and presentation currency.
(ii) Transactions and balances
Foreign currency transactions are translated into the functional currency using the exchange rates prevailing at the dates of the transactions. Foreign exchange gains and losses resulting from the settlement of such transactions and from the translation at year end exchange rates of monetary assets and liabilities denominated in foreign currencies are recognised in profit or loss.
(iii) Group companies
The results and financial position of foreign operations (none of which has the currency of a hyperinflationary economy) that have a functional currency different from the presentation currency are translated into the presentation currency as follows:
• assets and liabilities for each balance sheet presented are translated at the closing rate at the date of that balance sheet
• income and expenses for each statement of comprehensive income are translated at the closing rate at the end of the month, and
• all resulting exchange differences are recognised in other comprehensive income.
(d) Income taxThe income tax expense or benefit for the period is the tax payable on the current period’s taxable income based on the national income tax rate for Australia adjusted by changes in deferred tax assets and liabilities attributable to temporary differences and unused tax losses.
Deferred income tax is provided in full, using the liability method, on temporary differences arising between the tax bases of assets and liabilities and their carrying amounts in the consolidated financial reports. However, the deferred income tax is not accounted for if it arises from initial recognition of an asset or liability in a transaction other than a business combination that at the time of the transaction affects neither accounting or taxable profit or loss. Deferred income tax is determined using tax rates (and laws) that have been enacted or substantially enacted by the statement of financial position date and are expected to apply when the related deferred income tax asset is realised or the deferred income tax liability is settled.
NOTES TO THE F INANCIAL STATEMENTS CONT INUEDFOR THE YEAR ENDED 30 JUNE 2015
For
per
sona
l use
onl
y

A N N U A L R E P O R T 2 0 1 5 F I D U C I A N G R O U P L I M I T E D A C N 6 0 2 4 2 3 6 1 0 P A G E 3 3
1 SUMMARY OF SIGNIFICANT ACCOUNTING POLICIES cont inued
(d) Income tax continue (continued)
Deferred tax assets are recognised for deductible temporary differences and unused tax losses only if it is probable that future taxable amounts will be available to utilise those temporary differences and losses.
Deferred tax liabilities and assets are not recognised for temporary differences between the carrying amount and tax bases of investments in controlled entities where the parent entity is able to control the timing of the reversal of the temporary differences and it is probable that the differences will not reverse in the foreseeable future.
Deferred tax assets and liabilities are offset when there is a legally enforceable right to offset current tax assets and liabilities and when the deferred tax balances relate to the same taxation authority. Current tax assets and tax liabilities are offset where the entity has a legally enforceable right to offset and intends either to settle on a net basis, or to realise the asset and settle the liability simultaneously.
Current and deferred tax balances attributable to amounts recognised directly in equity are also recognised directly in equity.
Tax consolidation
With effect from 1 March 2015 Fiducian Group Limited and its wholly owned subsidiaries have implemented the tax consolidation legislation with Fiducian Group Limited as the head entity in the newly formed tax consolidated group. As a consequence these entities are taxed as a single entity and the deferred tax assets and liabilities of these entities are set off in the consolidated financial statements. The head entity has entered into a tax sharing agreement and a tax funding agreement with the members of the tax consolidated group. Under the tax funding agreement the members of the Group are required to contribute to the head entity for their current tax liabilities. The assets and liabilities arising under the tax funding agreement are recognised as intercompany assets and liabilities at call. Members of the tax consolidated group via the tax sharing agreement may be called to provide for the income tax liabilities between the entities should the head entity default on its tax payment obligations. No amount has been recognised in respect of this component of the agreement as the outcome is considered remote.
(e) Operating leases
Leases in which a significant portion of the risks and rewards of ownership are retained by the lessor are classified as operating leases (Note 29). Payments made under operating leases (net of any incentives received from the lessor) are charged to the statement of comprehensive income on a straight-line basis over the period of the lease.
(f) Trustee company and Responsible Entity
The Group acts as a Trustee of Fiducian Superannuation Service through a subsidiary , Fiducian Portfolio Services Ltd, and acts as the Responsible Entity of Fiducian Funds (“the trusts”) through another subsidiary , Fiducian Investment Management Services Ltd. The accounting policies adopted by these Companies in the preparation of their financial reports and that of the Group for the year ended 30 June 2015 reflect the fiduciary nature of these company’s responsibilities and that of the Group for the assets and liabilities of the trusts. The financial reports do not include the trusts’ assets and liabilities as future economic benefits and obligations derived from the trusts’ assets and liabilities do not accrue to these companies or the Group. In accordance with AASB 137 Provisions, Contingent Liabilities and Contingent Assets, the trust assets and liabilities have not been disclosed as the directors consider the probability of these companies or the Group having to meet the liabilities of the trusts as remote.
(g) Impairment of assets
Goodwill and intangible assets that have an indefinite useful life are not subject to amortisation and are tested annually for impairment, or more frequently if events or changes in circumstances indicate that they might be impaired. Other assets are tested for impairment whenever events or changes in circumstances indicate that the carrying amount may not be recoverable. An impairment loss is recognised for the amount by which the asset’s carrying amount exceeds its recoverable amount. The recoverable amount is the higher of an asset’s fair value less costs to sell and value in use. For the purposes of assessing impairment, assets are grouped at the lowest level for which there are separately identifiable cash flows which are largely independent of the cash flows from other assets or groups of assets (cash-generating units). Non-financial assets other than goodwill that suffered an impairment are reviewed for possible reversal of the impairment at each reporting date.
NOTES TO THE F INANCIAL STATEMENTS CONT INUEDFOR THE YEAR ENDED 30 JUNE 2015
For
per
sona
l use
onl
y
P A G E 3 4 F I D U C I A N G R O U P L I M I T E D A C N 6 0 2 4 2 3 6 1 0 A N N U A L R E P O R T 2 0 1 5
1 SUMMARY OF SIGNIFICANT ACCOUNTING POLICIES cont inued
(h) Cash and cash equivalents
For cash flow statement presentation purposes, cash and cash equivalents includes cash on hand, deposits held at call with financial institutions, other short-term, highly liquid investments with original maturities of three months or less that are readily convertible to known amounts of cash and which are subject to an insignificant risk of changes in value.
(i) Trade receivables
Trade receivables are recognised at fair value and subsequently measured at amortised cost, less provision for impairment. Trade receivables are due for settlement no more than 120 days from the date of recognition for trade receivables and financial planning fees, and no more than 30 days for other receivables.
Collectability of trade receivables is reviewed on an ongoing basis. Receivables, which are known to be uncollectible, are written off. An allowance account (provision for impairment of trade receivables) is used when there is objective evidence that the Group will not be able to collect all amounts due according to the original terms of the receivables. Significant financial difficulties of the debtor, probability that the debtor will enter bankruptcy or financial reorganisation, and default or delinquency in payments (outside settlement terms) are considered indicators that the trade receivable is impaired. The amount of the impairment allowance is the difference between the asset’s carrying amount and the present value of estimated future cash flows, discounted at the original effective interest rate. Cash flows relating to short-term receivables are not discounted if the effect of discounting is immaterial.
The amount of the impairment loss is recognised in the statement of comprehensive income within other expenses. When a trade receivable for which an impairment allowance had been recognised becomes uncollectible in a subsequent period, it is written off against the allowance account. Subsequent recoveries of amounts previously written off are credited against other expenses in the statement of comprehensive income.
(j) Business combinations
The acquisition method of accounting is used to account for all business combinations, regardless of whether equity instruments or other assets are acquired. The purchase consideration transferred for the acquisition of a subsidiary comprises the fair values of the assets transferred, the liabilities incurred and the equity interests issued by the acquirer. The purchase consideration transferred also includes the fair value of any asset or liability resulting from a contingent consideration arrangement and the fair value of any pre-existing equity interest in the subsidiary.
Acquisition-related costs are expensed as incurred. Identifiable assets acquired and liabilities and contingent liabilities assumed in a business combination are measured initially at their fair values at the acquisition date.
The excess of the purchase consideration and the acquisition-date fair value over the share of the net identifiable assets acquired is recorded as goodwill. If those amounts are less than the fair value of the net identifiable assets of the subsidiary acquired and the measurement of all amounts has been reviewed, the difference is recognised directly in profit or loss as a bargain purchase.
Where settlement of any part of cash consideration is deferred, the amounts payable in the future are discounted to their present value as at the date of exchange. The discount rate used is the entity’s incremental borrowing rate, being the rate at which a similar borrowing could be obtained from an independent financier under comparable terms and conditions.
Contingent consideration is classified either as equity or a financial liability. Amounts classified as a financial liability are subsequently remeasured to fair value with changes in fair value recognised in profit or loss.
(k) Investments and other financial assets
The Group classifies its investments in the following categories: financial assets at fair value through profit or loss, loans and receivables, and other financial assets. The classification depends on the purposes for which the investments were acquired. Management determines the classification of its investments at initial recognition and, in the case of assets classified as held-to-maturity, re-evaluates this designation at each reporting date.
(i) Financial assets at fair value through profit or loss
Financial assets are classified as held for trading if acquired principally for the purpose of selling in the short term with the intention of making a profit.
NOTES TO THE F INANCIAL STATEMENTS CONT INUEDFOR THE YEAR ENDED 30 JUNE 2015
For
per
sona
l use
onl
y

A N N U A L R E P O R T 2 0 1 5 F I D U C I A N G R O U P L I M I T E D A C N 6 0 2 4 2 3 6 1 0 P A G E 3 5
1 SUMMARY OF SIGNIFICANT ACCOUNTING POLICIES cont inued
(k) Investments and other financial assets (continued)
(ii) Loans and receivables
Loans and receivables are non-derivative financial assets with fixed or determinable payments that are not quoted in an active market. They arise when the Group provides money directly to a debtor with no intention of selling the receivable. They are included in current assets, except for those with maturities greater than 12 months after the statement of financial position date which are classified as non-current assets. Loans and receivables are included in receivables in the statement of financial position in Notes 10 and 11.
(I) Fair value estimation
The carrying value less impairment provision of trade receivables and payables are assumed to approximate their fair values due to their short-term nature. The fair value of financial liabilities for disclosure purposes is estimated by discounting the future contractual cash flows at the current market interest rate that is available to the Group for similar financial instruments.
(m) Property, plant and equipment
Property, plant and equipment is stated at historical cost less depreciation. Historical cost includes expenditure that is directly attributable to the acquisition of the items.
Subsequent costs are included in the asset’s carrying amount or recognised as a separate asset, as appropriate, only when it is probable that future economic benefits associated with the item will flow to the Group and the cost of the item can be measured reliably. All other repairs and maintenance are charged to the statement of comprehensive income during the financial period in which they were incurred.
Depreciation on assets is calculated using the straight-line method to allocate their cost or revalued amounts, net of their residual values, over their estimated useful lives, as follows:-
Furniture, office equipment and computers 2 – 8 years
Leasehold improvements term of the lease
The asset’s residual values and useful lives are reviewed, and adjusted if appropriate, at each reporting date.
An asset’s carrying amount is written down immediately to its recoverable amount if the asset’s carrying amount is greater than its estimated recoverable amount in Note 1(g).
Gains and losses on disposals are determined by comparing proceeds with carrying amount. These are included in the statement of comprehensive income. When revalued assets are sold, it is Group policy to transfer the amounts included in other reserves in respect of those assets to retained earnings.
(n) Intangible assets
Goodwill
Goodwill represents the excess of the cost of an acquisition over the fair value of the Group’s share of the net identifiable assets of the acquired subsidiary at the date of acquisition. Goodwill on acquisitions of subsidiaries is included in intangible assets. Goodwill is not amortised. Instead, goodwill is tested for impairment annually or more frequently if events or changes in circumstances indicate that it might be impaired, and is carried at cost less accumulated impairment losses. Gains or losses on the disposal of an entity include the carrying amount of goodwill relating to the entity sold.
Goodwill is allocated to cash-generating units for the purpose of impairment testing. These units are all within the financial planning segment.
Client portfolios
Consideration payable for the acquisition of client portfolios is deferred and amortised on a straight line basis over a period of 10 years. Client portfolios are also tested for events or changes in circumstances that indicate that they may be impaired, and are carried at cost less accumulated amortisation and impairment losses.
NOTES TO THE F INANCIAL STATEMENTS CONT INUEDFOR THE YEAR ENDED 30 JUNE 2015
For
per
sona
l use
onl
y

P A G E 3 6 F I D U C I A N G R O U P L I M I T E D A C N 6 0 2 4 2 3 6 1 0 A N N U A L R E P O R T 2 0 1 5
1 SUMMARY OF SIGNIFICANT ACCOUNTING POLICIES cont inued
(n) Intangible assets (continued)
IT development and software
Costs incurred in developing products or systems and costs incurred in acquiring software and licences that will contribute to future period financial benefits through revenue generation and/or cost reduction are capitalised to software and systems where deemed appropriate. Costs capitalised include direct costs of materials and service and direct payroll and payroll related costs of employees’ time spent on the project. Amortisation is calculated on a straight-line basis over periods generally ranging from 3 to 5 years.
Capitalised expenditures are tested for events or changes in circumstances that indicate that they may be impaired and whether they exceed their recoverable amount.
(o) Trade and other payables
These amounts represent liabilities for goods and services provided to the Group prior to the end of the financial year and which are unpaid. The amounts are unsecured and are usually paid within 30 days of recognition.
(p) Provisions
Provisions for legal claims are recognised when the Group has a present legal or constructive obligation as a result of past events; it is probable that an outflow of resources will be required to settle the obligation; and the amount has been reliably estimated. Provisions are not recognised for future operating losses.
Where there are a number of similar obligations, the likelihood that an outflow will be required in settlement is determined by considering the class of obligations as a whole. A provision is recognised even if the likelihood of an outflow with respect to any one item included in the same class of obligations may be small.
Provisions are measured at the present value of management’s best estimate of the expenditure required to settle the present obligation at reporting date. The discount rate used to determine the present value reflects current market assessments of the time value of money and the risks specific to the liability.
(q) Employee benefits
(i) Wages and salaries, annual leave and sick leave
Liabilities for wages and salaries, and annual leave expected to be settled within 12 months of the reporting date are recognised in other payables in respect of employee services up to the reporting date and are measured at the amount expected to be paid when the liabilities are settled. Personal/carers and sick leave is brought to account as incurred.
(ii) Long service leave
The liability for long service leave is recognised in the provision for employee benefits and measured as the present value of expected future payments to be made in respect of services provided by employees up to the reporting date using the projected unit cost method. Consideration is given to expected future wage and salary levels, experience of employee departures and periods of service. Expected future payments are discounted using market yields at the reporting date on national government bonds with terms of maturity and currency that match, as closely as possible, the estimated future cash outflows.
(iii) Share-based paymentsShare-based compensation benefits are provided to employees via the share option plans. Information relating to this scheme is set out in Note 26.
Subsequent options issued to employees for no consideration have the fair value of options granted under the Fiducian Employee & Director Share Option Plan recognised as an employee benefit expense with a corresponding increase in equity. The fair value is measured at grant date and recognised over the period during which the employees become unconditionally entitled to the options.
The fair value at grant date is independently determined using a Binomial option pricing model that takes into account the exercise price, the term of the option, the impact of dilution, the share price at grant date, the expected price volatility of the underlying share, the expected dividend yield and the risk-free interest rate for the term of the option.
NOTES TO THE F INANCIAL STATEMENTS CONT INUEDFOR THE YEAR ENDED 30 JUNE 2015
For
per
sona
l use
onl
y

A N N U A L R E P O R T 2 0 1 5 F I D U C I A N G R O U P L I M I T E D A C N 6 0 2 4 2 3 6 1 0 P A G E 3 7
NOTES TO THE F INANCIAL STATEMENTS CONT INUEDFOR THE YEAR ENDED 30 JUNE 2015
1 SUMMARY OF SIGNIFICANT ACCOUNTING POLICIES cont inued
(r) Contributed equity
Ordinary shares are classified as equity.
Incremental costs directly attributable to the issue of new shares or options are shown in equity as a deduction, net of tax, from the proceeds.
If the entity reacquires its own equity instruments, for example as the result of a share buy-back, those instruments along with the consideration paid are deducted from equity and the shares are regarded as treasury shares until they are cancelled. No gain or loss is recognised in the profit or loss and the consideration paid including any directly incremental costs (net of income taxes) is recognised directly in equity. Treasury shares are bought with the intention of cancellation and are not reissued.
(s) Dividends
Provision is made only for the amount of any dividend declared, being appropriately authorised and no longer at the discretion of the entity, on or before the end of the financial year but not distributed at balance date.
(t) Earnings per share
(i) Basic earnings per share
Basic earnings per share is determined by dividing the net profit after income tax attributable to equity holders of the Company, excluding any costs of servicing equity other than ordinary shares, by the weighted average number of ordinary shares outstanding during the financial year.
(ii) Diluted earnings per share
Diluted earnings per share adjusts the figures used in the determination of basic earnings per share to take into account the after income tax effect of interest and other financing costs associated with dilutive potential ordinary shares and the weighted average number of shares assumed to have been issued for no consideration in relation to dilutive potential ordinary shares.
(u) Goods and services tax
Revenues, expenses and assets are recognised net of the amount of associated GST, unless the GST incurred is not recoverable from the Australian Taxation Office (ATO). In this case it is recognised as part of the cost of acquisition of the asset or as part of the expense.
Receivables and payables are stated inclusive of the amount of GST receivable or payable. The net amount of GST recoverable from, or payable to the ATO is included with other payables in the statement of financial position.
Cash flows are presented on a gross basis. The GST components of cash flows arising from investing or financing activities which are recoverable from, or payable to the ATO, are presented as operating cash flow.
(v) Rounding of amounts
The Company is of a kind referred to in Class Order 98/100 issued by the Australian Securities and Investments Commission, relating to the “rounding off” of amounts in the financial report. Amounts in the financial report have been rounded off in accordance with that Class Order to the nearest thousand dollars, or in certain cases, to the nearest dollar.
(w) New accounting standards and interpretations
Certain new accounting standards and interpretations have been published that are not mandatory for 30 June 2015 reporting periods. The Group’s and the parent entity’s assessment of the impact of these new standards and interpretations is set out below.-
AASB 9 Financial Instruments (effective from 1 January 2018)This standard addresses the classification, measurement and derecognition of financial assets and financial liabilities. The standard is not applicable until 1 January 2018 but is available for early adoption. When adopted the standard will affect the accounting for available-for-sale financial assets, since AASB 9 only permits the recognition of fair value gains and losses in other comprehensive income if they relate to equity investments that are not held for trading. Fair value gains and losses on available-for-sale debt investments, for example, will therefore have to be recognised directly
For
per
sona
l use
onl
y

P A G E 3 8 F I D U C I A N G R O U P L I M I T E D A C N 6 0 2 4 2 3 6 1 0 A N N U A L R E P O R T 2 0 1 5
NOTES TO THE F INANCIAL STATEMENTS CONT INUEDFOR THE YEAR ENDED 30 JUNE 2015
1 SUMMARY OF SIGNIFICANT ACCOUNTING POLICIES cont inued
(w) New accounting standards and interpretations (continued)
in profit or loss. In the current reporting period, the Group did not hold any available-for-sale financial assets or available-for-sale debt investments.
There will be no impact on Fiducian’s accounting for financial liabilities, as the new requirements only affect the accounting for financial liabilities that are designated at fair value through profit or loss and Fiducian does not have any such liabilities. Fiducian does not have any hedging arrangements and hence there is no impact from the new hedging rules.
AASB 15 Revenue from Contracts with Customers (effective from 1 January 2018) The new standard is based on the principle that revenue is recognised when control of a good or service is transferred to a customer so the notion of control replaces the notion of risks and rewards. It applies to all contracts with customers except leases, financial instruments and insurance contracts. It requires reporting entities to provide users of financial statements with more informative and relevant disclosures. Fiducian is in the process of assessing the implications for revenue recognition for the segments of its business.
2 CRITICAL ACCOUNTING ESTIMATES AND ASSUMPTIONS
The Group makes estimates and assumptions concerning the future. The resulting accounting estimates will, by definition, seldom equal the related actual results. The estimates and assumptions that have a significant risk of causing a material adjustment to the carrying amounts of assets and liabilities within the next financial year are discussed below.
(i) Estimated impairment of goodwill
The Group tests annually whether goodwill has suffered any impairment, by comparing its current amount with its recoverable amount in accordance with the accounting policy stated in Note 1(n). The recoverable amounts of the cash-generating units have been determined based on earnings multiples requiring the use of sustainable revenue estimates and comparable market transactions.
(ii) Estimated impairment of client portfolios
The Group assesses at the end of each reporting period whether there is any indication that the investment or accounting portfolios may be impaired in accordance with the accounting policy stated in Note 1(n). If any such indication exists, the Group shall estimate the recoverable amount of the asset. The recoverable amounts of cash-generating units have been determined based on discounted cash flow models which require the use of assumptions on discount rates, recurring revenues and cash flow projections.
3 SEGMENT INFORMATION
(a) Description of segments
Business segments
Following the restructure of the Group the business activities of the Group have been segmented into business segments based on legal entities and reviewed by management accordingly. The business segments are as follows:-
Platform Administration
The Group through its subsidiary, Fiducian Portfolio Services Ltd, operates in a segment as the RSE for a public offer superannuation fund, Fiducian Superannuation Service. Until 1 March 2015 and for the comparative year the Funds management and administration activities formed part of Fiducian Portfolio Services Ltd and were reviewed as such. Following the restructure these segments have been transferred to separate legal entities as discussed below.
For
per
sona
l use
onl
y
A N N U A L R E P O R T 2 0 1 5 F I D U C I A N G R O U P L I M I T E D A C N 6 0 2 4 2 3 6 1 0 P A G E 3 9
NOTES TO THE F INANCIAL STATEMENTS CONT INUEDFOR THE YEAR ENDED 30 JUNE 2015
3 SEGMENT INFORMATION CONTINUED
Financial Planning
The Group continued its specialist financial planning operations through its subsidiary, Fiducian Financial Services Pty Ltd.
Business Services
The Group provides accountancy resource services through its subsidiary, Fiducian Business Services Pty Ltd. Although this segment does not meet the quantitative thresholds required by AASB 8, management has concluded that this segment should be reported as it is closely monitored by management for its potential growth opportunities.
Funds Management
The Group through its newly established subsidiary, Fiducian Investment Management Services Ltd, acts as an operator of an Investor Directed Portfolio Service, Fiducian Investment Service and as Responsible Entity for managed investment schemes. Before 1 March 2015 and for the comparative year these activities formed part of the subsidiary Fiducian Portfolio Services Ltd.
Administration
The administration and professional services are provided to the Group by a newly established subsidiary, Fiducian Services Pty Ltd. Management views this as an operating segment since 1 March 2015. Before that date and for the comparative year these activities were conducted by Fiducian Portfolio Services Ltd.
Geographical segments
The Group operates in the following geographical segments – in Australia and in India. The Indian operations are not considered material for a separate geographical segment disclosure during the financial year 2015.
For
per
sona
l use
onl
y
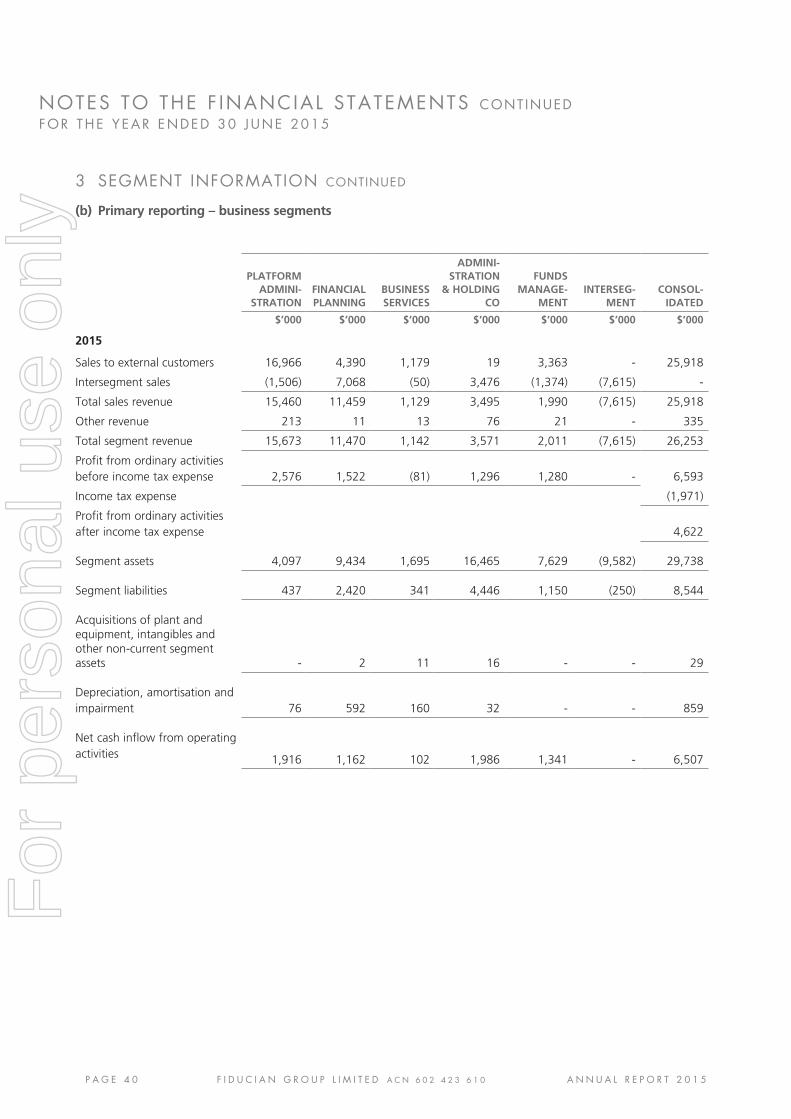
P A G E 4 0 F I D U C I A N G R O U P L I M I T E D A C N 6 0 2 4 2 3 6 1 0 A N N U A L R E P O R T 2 0 1 5
NOTES TO THE F INANCIAL STATEMENTS CONT INUEDFOR THE YEAR ENDED 30 JUNE 2015
3 SEGMENT INFORMATION CONTINUED
(b) Primary reporting – business segments
PLATFORMADMINI-
STRATIONFINANCIAL PLANNING
BUSINESS SERVICES
ADMINI-STRATION
& HOLDING CO
FUNDS MANAGE-
MENTINTERSEG-
MENT CONSOL-
IDATED
$’000 $’000 $’000 $’000 $’000 $’000 $’000
2015
Sales to external customers 16,966 4,390 1,179 19 3,363 - 25,918
Intersegment sales (1,506) 7,068 (50) 3,476 (1,374) (7,615) -
Total sales revenue 15,460 11,459 1,129 3,495 1,990 (7,615) 25,918
Other revenue 213 11 13 76 21 - 335
Total segment revenue 15,673 11,470 1,142 3,571 2,011 (7,615) 26,253
Profit from ordinary activities before income tax expense 2,576 1,522 (81) 1,296 1,280 - 6,593
Income tax expense (1,971)
Profit from ordinary activities after income tax expense 4,622
Segment assets 4,097 9,434 1,695 16,465 7,629 (9,582) 29,738
Segment liabilities 437 2,420 341 4,446 1,150 (250) 8,544
Acquisitions of plant and equipment, intangibles and other non-current segment assets - 2 11 16 - - 29
Depreciation, amortisation and impairment 76 592 160 32 - - 859
Net cash inflow from operating activities 1,916 1,162 102 1,986 1,341 - 6,507
For
per
sona
l use
onl
y

A N N U A L R E P O R T 2 0 1 5 F I D U C I A N G R O U P L I M I T E D A C N 6 0 2 4 2 3 6 1 0 P A G E 4 1
NOTES TO THE F INANCIAL STATEMENTS CONT INUEDFOR THE YEAR ENDED 30 JUNE 2015
3 SEGMENT INFORMATION CONTINUED
(b) Primary reporting – business segments
FUNDS MANAGEMENT AND
ADMINISTRATIONFINANCIAL PLANNING
BUSINESS SERVICES
INTERSEGMENT ELIMINATIONS CONSOLIDATED
$’000 $’000 $’000 $’000 $’000
2014
Sales to external customers 18,283 3,247 1,006 - 22,537
Intersegment sales - 7,121 96 (7,217) -
Total sales revenue 18,283 10,368 1,102 (7,217) 22,537
Other revenue 301 24 12 - 337
Total segment revenue 18,584 10,392 1,114 (7,217) 22,873
Profit from ordinary activities before income tax expense 4,022 2,065 (12) - 6,075
Income tax expense (2,092)
Profit from ordinary activities after income tax expense 3,983
Segment assets 21,000 11,300 2,801 (7,922) 27,179
Segment liabilities 3,843 5,208 2,815 (4,039) 7,827
Acquisitions of plant and equipment, intangibles and other non-current segment assets 63 2,212 221 - 2,496
Depreciation, amortisation and impairment 141 425 116 - 682
Net cash inflow from operating activities 3,719 1,340 805 - 5,864
For
per
sona
l use
onl
y

P A G E 4 2 F I D U C I A N G R O U P L I M I T E D A C N 6 0 2 4 2 3 6 1 0 A N N U A L R E P O R T 2 0 1 5
3 SEGMENT INFORMATION CONTINUED
(c) Other segment information
(i) Segment revenue
Sales between segments are carried out at arm’s length and are eliminated on consolidation. The revenue from external parties reported to the board is measured in a manner consistent with that in the statements of comprehensive income.
Segment revenue reconciles to total revenue from continuing operations as follows:
CONSOLIDATED
2015 2014 $’000 $’000
Total segment revenue 33,533 29,753
Intersegment eliminations (7,615) (7,217)
Total revenue from continuing operations (Note 4) 25,918 22,537
The entity is domiciled in Australia. The amount of its revenue from external customers in Australia is $25,918,000 (2014: $22,537,000).
(ii) EBITDA
The board assesses the performance of the operating segments based on the measures of profit contribution and EBITDA.
A reconciliation of EBITDA to operating profit before income tax is provided as follows:
CONSOLIDATED
2015 2014 $’000 $’000
EBITDA 7,453 6,758
Finance costs - (2)
Depreciation (165) (164)
Amortisation (695) (518)
Profit before income tax from continuing operations 6,593 6,075
(iii) Segment assets
The amounts provided to the board with respect to total assets are measured in a manner consistent with that of the financial report. These assets are allocated based on the operations of the segment and the physical location of the asset.
All assets are located in Australia and in India (which are not material).
(iv) Segment liabilities
The amounts provided to the board with respect to total liabilities are measured in a manner consistent with that of the financial report. These liabilities are allocated based on the operations of the segment.
NOTES TO THE F INANCIAL STATEMENTS CONT INUEDFOR THE YEAR ENDED 30 JUNE 2015
For
per
sona
l use
onl
y

A N N U A L R E P O R T 2 0 1 5 F I D U C I A N G R O U P L I M I T E D A C N 6 0 2 4 2 3 6 1 0 P A G E 4 3
NOTES TO THE F INANCIAL STATEMENTS CONT INUEDFOR THE YEAR ENDED 30 JUNE 2015
4 REVENUE FROM ORDINARY ACTIVIT IES
CONSOLIDATED
2015 2014
$’000 $’000
From continuing operations
Sales revenue
Fees received * 25,665 22,078
Other 253 458
Revenue from ordinary activities 25,918 22,537
* Includes fees received by FIMS as responsible entity of the managed investment schemes which includes underlying fund manager fees from 1 March 2015 which were previously netted off. This is as a result of an amendment to the product disclosure statement whereby fees due to underlying fund managers are paid by the responsible entity and are not separately charged to unitholders.
5 OTHER INCOME CONSOLIDATED
2015 2014
$’000 $’000
Interest received/receivable 335 346
Fair value (losses)/ gains on financial assets at
fair value through profit or loss (Note 13) - (9)
335 337
6 EXPENSES
CONSOLIDATED
2015 2014
$’000 $’000
Profit before income tax includes the
following specific expenses:
a) Depreciation and amortisation expense
Depreciation
Furniture office equipment and computers 111 112
Leasehold improvements 54 52
Total depreciation 165 164
Amortisation
Capitalised computer software 14 13
Client portfolio acquisition costs 631 505
Total amortisation 645 518
For
per
sona
l use
onl
y

P A G E 4 4 F I D U C I A N G R O U P L I M I T E D A C N 6 0 2 4 2 3 6 1 0 A N N U A L R E P O R T 2 0 1 5
6 EXPENSES CONTINUED
Impairment
Goodwill 50 -
Total depreciation and amortisation expense 860 682
b) Other expenses1
Professional services 901 464
Sales marketing and travel 1,042 807
Rental expense relating to operating leases 1,160 909
Premises and equipment 177 192
Communication and computing 557 480
Printing and stationery 191 116
Auditors (Note 27) 495 442
Doubtful debts - 6
Administration and other 1,343 1,173
Expense Recovery2 (3,521) (3,196)
2,345 1,396
1Other expenses include $ 616,000 incurred along various expense lines relating to the implementation of the restructure of the Fiducian Group.2Fiducian Group Limited through its subsidiary, Fiducian Portfolios Services Limited, as trustee for the Fiducian Superannuation Service, is entitled to the reimbursement of expenses incurred by it in the operation of the service. Effective from 1 July 2012 Fiducian has, for the three year period ending 30 June 2015, recovered an amount up to 75% of the balance of any unrecovered operational expenses incurred by it subject to available reserves. A new adminstration agreement between Fiducian Portfolio Services Limited and Fiducian Services Pty Limited is expected to be put in place in the first quarter of 2015-2016 and until then the existing arrangements continue.
7 INCOME TAX EXPENSE
CONSOLIDATED
2015 2014
$’000 $’000
a) Income tax expense
Current tax 2,041 1,991
Deferred tax (70) (9)
Adjustments for current tax of prior periods - 110
Income tax expense 1,971 2,092
Deferred income tax (revenue) expense included in income tax expense comprises:
Decrease (increase) in deferred tax assets (Note 15) 152 134
(Decrease) increase in deferred tax liabilities (Note 20) (222) 416
Deferred tax (70) 550
NOTES TO THE F INANCIAL STATEMENTS CONT INUEDFOR THE YEAR ENDED 30 JUNE 2015
For
per
sona
l use
onl
y

A N N U A L R E P O R T 2 0 1 5 F I D U C I A N G R O U P L I M I T E D A C N 6 0 2 4 2 3 6 1 0 P A G E 4 5
7 INCOME TAX EXPENSE CONTINUED
(b) Numerical reconciliation of income tax expense to prima facie tax payable
Profit from continuing operations before income tax expense 6,593 6,075
Tax at the Australian tax rate of 30% 1,978 1,823
Tax effect of amounts which are not deductible (taxable) in calculating taxable income:
Entertainment 26 18
Tax offset for amortisation - (142)
Sundry items (33) 283
1,971 1,982
Over provision in prior years - 110
Income tax expense 1,971 2,092
(c) Tax consolidation legislation
Fiducian Group Limited and its wholly owned subsidiaries have formed a tax consolidated group with effect from 1 March 2015. As a consequence these financial statements have been prepared on a tax consolidated basis where the head entity has assumed the tax liabilites initially recognised by the standalone taxpayers.
8 DIVIDENDS CONSOLIDATED
2015 2014 $’000 $’000
Ordinary shares
Final ordinary fully franked dividend for the year ended 30 June 2014 of 5.00 cents (2013: Fully franked 3.60 cents) per share paid on 19 September 2014. 1,538 1,131
Interim ordinary fully franked dividend for the year ended 30 June 2015 of 4.50 cents(2014: Fully franked 4.10 cents) per share paid on 26 March 2015. 1,390 1,265
Total dividends paid in cash 2,928 2,396
The Directors have declared the payment of a final fully franked dividend for the year ended 30 June 2015 in the amount of 5.5 cents per ordinary share to be paid on shares registered on 10 September 2015 and payable on 24 September 2015.
Franked dividends
The franked portions of the final dividends recommended after 30 June 2015 will be franked out of existing franking credits.
CONSOLIDATED
2015 2014
$’000 $’000
Franking credits available for subsequent financial years based on a tax rate of 30% 7,093 7,632
The above amounts represent the balances of the franking account as at the end of the financial year, adjusted for:
(a) franking credits that will arise from the payment of the amount of the provision for income tax.
(b) franking debits that will arise from the payment of dividends recognised as a liability at the reporting date.
NOTES TO THE F INANCIAL STATEMENTS CONT INUEDFOR THE YEAR ENDED 30 JUNE 2015
For
per
sona
l use
onl
y

P A G E 4 6 F I D U C I A N G R O U P L I M I T E D A C N 6 0 2 4 2 3 6 1 0 A N N U A L R E P O R T 2 0 1 5
NOTES TO THE F INANCIAL STATEMENTS CONT INUEDFOR THE YEAR ENDED 30 JUNE 2015
8 DIVIDENDS CONTINUED
c) franking credits that will arise from the receipt of dividends recognised as receivables at the reporting date.
The consolidated amounts include franking credits that would be available to the parent entity if distributable profits from subsidiaries were paid as dividends.
The impact on the franking account of the dividend recommended by the directors since year end, but not recognised as a liability at year end, will be a reduction in the franking account of approximately $728,000 (2014: $659,000).
9 CURRENT ASSETS – CASH AND CASH EQUIVALENTS
CONSOLIDATED
2015 2014
$’000 $’000
Cash at bank and in hand 12,340 6,161
Deposits securing bank guarantees 34 34
Deposits – other - 5,000
12,374 11,195
The Group’s exposure to interest rate risk is discussed in Note 34.
10 CURRENT ASSETS – TRADE AND OTHER RECEIVABLES
CONSOLIDATED
2015 2014
$’000 $’000
Amounts receivable from related entities:
Related trusts 2,197 1,710
Business development loans * 522 181
Staff loans * 3 3
Other receivables 804 721
Prepayments 251 270
3,777 2,885
Less: Provision for impairment of receivables (30) (30)
3,747 2,855
* Refer to Note 11 for the non-current portion of these receivables.
Movements in provision for impairment of receivables
Balance at beginning of the year (30) (30)
Written off against provision - -
Balance at end of the year (30) (30)
At 30 June 2015, a provision for impairment exists for trade receivables outstanding greater than 120 days where management considers that the receivable is impaired. There has been no history of default and no material losses are expected.
Information about the Group’s exposure to interest rate risk in relation to trade and other receivables is provided in Note 34.
For
per
sona
l use
onl
y

A N N U A L R E P O R T 2 0 1 5 F I D U C I A N G R O U P L I M I T E D A C N 6 0 2 4 2 3 6 1 0 P A G E 4 7
11 NON-CURRENT ASSETS – RECEIVABLES
CONSOLIDATED
2015 2014
$’000 $’000
Business development loans * 3,464 2,055
Loans to staff * 27 29
3,491 2,084
Less: Provision for impairment of receivables - -
3,491 2,084
* Refer to Note 10 for the current portion of these receivables.
(a) Impaired receivables and receivables past due
No amount has been provided against non-current receivables in the current year (2014: Nil).
NOTES TO THE F INANCIAL STATEMENTS CONT INUEDFOR THE YEAR ENDED 30 JUNE 2015
(b) Fair valuesThe fair values and carrying values of non-current receivables of the Group are as follows:
2015 2014
CARRYING CARRYING AMOUNT FAIR VALUE AMOUNT FAIR VALUE
$’000 $’000 $’000 $’000
Business development loans 3,464 3,464 2,055 2,055
Loans to staff 27 27 29 29
3,491 3,491 2,084 2,084
(c) Risk exposureInformation about the Group’s exposure to credit and interest rate risk is provided in Note 34. The maximum exposure to credit risk at the reporting date is the carrying amount of each class of receivables mentioned above.
12 NON-CURRENT ASSETS – OTHER FINANCIAL ASSETS
The Group’s principal subsidiaries as at 30 June 2015 are set out below.
NAME OF ENTITY COUNTRY OF INCORPORATION
CLASS OF SHARES EQUITY HOLDING %
$’000 $’000
Fiducian Investment Management Services Ltd (“FIM”)1 Australia Ordinary 100
Fiducian Portfolio Services Ltd (“FPSL) 2 Australia Ordinary 100
Fiducian Services Pty Ltd 3 Australia Ordinary 100
Fiducian Financial Services Pty Ltd 4 Australia Ordinary 100
Fiducian Business Services Pty Ltd 5 Australia Ordinary 100
Harold Bodinnar & Associates Pty Ltd 6 Australia Ordinary 100
Money & Advice Pty Ltd 6 Australia Ordinary 100
Total investment by parent entity
For
per
sona
l use
onl
y

P A G E 4 8 F I D U C I A N G R O U P L I M I T E D A C N 6 0 2 4 2 3 6 1 0 A N N U A L R E P O R T 2 0 1 5
NOTES TO THE F INANCIAL STATEMENTS CONT INUEDFOR THE YEAR ENDED 30 JUNE 2015
12 NON-CURRENT ASSETS – OTHER FINANCIAL ASSETS continued
1 The Company acts as the Responsible Entity of the Fiducian Funds and the operator of the Fiducian Investment Service2 The Company acts as the Trustee for the Fiducian Superannuation Service3 The Company provides the administration and professional services to the other entities within the Group.4 The principal activity of the Company is the development of a specialist financial planning services network .5 The principal activity of the Company is to provide bookkeeping, accounting and tax processing services.6 These companies are currently dormant as their operations have been transferred to Fiducian Financial Services Pty Limited and are in the process of being deregistered.
In addition to the above subsidiaries, Fiducian Business Services has a 90% equity investment in Fiducian Resourcing Services Pvt Ltd, a company incorporated in India, providing accounting and tax processing services to the group.The operations of the Company are in its initial stages and are not considered material to the Group in 2015.
13 NON-CURRENT ASSETS – OTHER FINANCIAL ASSETS AT FAIR VALUE THROUGH PROFIT OR LOSS
CONSOLIDATED
2015 2014
$’000 $’000
Investment in unlisted unit trusts
At beginning of the year 106 155
Capital distribution (106) (40)
Revaluation – fair value (losses) - (9)
At end of the year - 106
Investment in related trust - 106
Financial assets held at fair value through profit and loss comprise investments into a related Fiducian trust. The fund was wound up during the year and the entire amount of capital was returned to the unitholders.
14 NON-CURRENT ASSETS – PROPERTY, PLANT AND EQUIPMENT
CONSOLIDATED
2015 2014
$’000 $’000
Plant and equipment
Furniture, office equipment and computers 1,579 1,550
Less: Accumulated depreciation (1,191) (1,026)
388 524
Movements
Reconciliation of the carrying amounts of each class of property, plant and equipment are set out on the next page.
For
per
sona
l use
onl
y

A N N U A L R E P O R T 2 0 1 5 F I D U C I A N G R O U P L I M I T E D A C N 6 0 2 4 2 3 6 1 0 P A G E 4 9
14 NON-CURRENT ASSETS – PROPERTY, PLANT AND EQUIPMENT continued
FURNITURE AND OFFICE LEASEHOLD EQUIPMENT COMPUTERS IMPROVEMENTS TOTAL
$’000 $’000 $’000 $’000
Consolidated
At 1 July 2013
Cost 226 427 808 1,461
Accumulated depreciation (153) (227) (483) (863)
Net book amount 73 200 325 598
Year ended 30 June 2014
Opening net book amount 73 200 325 598
Additions 51 9 28 88
Disposals - - - -
Depreciation/amortisation charge (22) (92) (48) (162)
Closing net book amount 102 117 305 524
At 30 June 2014
Cost 277 436 837 1,550
Accumulated depreciation (175) (319) (532) (1,026)
Net book amount 102 117 305 524
Year ended 30 June 2015
Opening net book amount 102 117 305 524
Additions 11 18 - 29
Disposals - - (2) (2)
Depreciation/amortisation charge (20) (89) (54) (163)
Closing net book amount 93 46 249 388
At 30 June 2015
Cost 288 454 836 1,579
Accumulated depreciation (195) (408) (587) (1,191)
Net book amount 93 46 249 388
NOTES TO THE F INANCIAL STATEMENTS CONT INUEDFOR THE YEAR ENDED 30 JUNE 2015
For
per
sona
l use
onl
y

P A G E 5 0 F I D U C I A N G R O U P L I M I T E D A C N 6 0 2 4 2 3 6 1 0 A N N U A L R E P O R T 2 0 1 5
NOTES TO THE F INANCIAL STATEMENTS CONT INUEDFOR THE YEAR ENDED 30 JUNE 2015
15 NON-CURRENT ASSETS – DEFERRED TAX ASSETS
CONSOLIDATED
2015 2014
$’000 $’000
The balance comprises temporary
differences attributable to:
Doubtful debts 9 10
Employee benefits 446 496
Accrued expenditure 127 24
Provision for audit and taxation services 164 152
Provision for depreciation 17 109
Unrealised gains (losses) - 25
Restructure expenses 205 -
Deferred tax assets before set off 968 816
Set off against deferred tax liabilities (968) (816)
- -
Movements:
Opening balance at 1 July 816 950
Taken to the statement of comprehensive income 152 (134)
Deferred assets before set off 968 816
Set off against deferred tax liabilites (968) (816)
- -
16 NON-CURRENT ASSETS – INTANGIBLE ASSETS
CONSOLIDATED
2015 2014
$’000 $’000
Deferred expenditure
Capitalised expenditure – computer software 5,001 4,999
Less: Accumulated amortisation ( 4,989) ( 4,973)
12 26
Client portfolios
Cost of acquisition of client portfolios 5,851 6,436
Less: Accumulated amortisation ( 2,101) ( 1,918)
3,750 4,518
Client portfolios
Goodwill on acquisition 5,471 5,521
Less: Accumulated amortisation ( 464) ( 464)
5,007 5,057
8,770 9,601
For
per
sona
l use
onl
y

A N N U A L R E P O R T 2 0 1 5 F I D U C I A N G R O U P L I M I T E D A C N 6 0 2 4 2 3 6 1 0 P A G E 5 1
16 NON-CURRENT ASSETS – INTANGIBLE ASSETS CONTINUED
(a) Movements
Movements in each category are set out below:-
CONSOLIDATED
ACQUISITION GOODWILL CAPITALISED OF CLIENT ON COMPUTER PORTFOLIOS ACQUISITION SOFTWARE* TOTAL
$’000 $’000 $’000 $’000
At 1 July 2013
Cost 4,588 4,962 4,999 14,549
Accumulated amortisation and impairment (1,413) (464) (4,960) (6,837)
Net book amount 3,175 4,498 39 7,712
Year ended 30 June 2014
Opening net book amount 3,175 4,498 39 7,712
Additions* 1,848 559 - 2,407
Disposals/write off - - - -
Impairment charge - - - -
Amortisation charge** (505) - (13) (518)
Closing net book amount 4,518 5,057 26 9,600
At 30 June 2014
Cost 6,436 5,521 4,999 16,956
Accumulated amortisation and impairment (1,918) (464) (4,973) (7,355)
Net book amount 4,518 5,057 26 9,600
Year ended 30 June 2015
Opening net book amount 4,518 5,057 26 9,601
Additions* - - - -
Disposals/write off (137) - - (137)
Impairment charge - (50) - (50)
Amortisation charge** (631) - (14) (645)
Closing net book amount 3,750 5,007 14 8,770
At 30 June 2015
Cost 6,299 5,471 4,999 16,769
Accumulated amortisation and impairment (2,549) (464) (4,987) (7,999)
Net book amount 3,750 5,007 12 8,770
* Capitalised computer software costs includes an internally generated intangible asset. The assets in this category have been amortised on the basis of a 5 year useful life.** Amortisation of $645,000 (2014: $518,000) is included in depreciation, amortisation and impairment expense in the statement of comprehensive income.
NOTES TO THE F INANCIAL STATEMENTS CONT INUEDFOR THE YEAR ENDED 30 JUNE 2015
For
per
sona
l use
onl
y

P A G E 5 2 F I D U C I A N G R O U P L I M I T E D A C N 6 0 2 4 2 3 6 1 0 A N N U A L R E P O R T 2 0 1 5
NOTES TO THE F INANCIAL STATEMENTS CONT INUEDFOR THE YEAR ENDED 30 JUNE 2015
16 NON-CURRENT ASSETS – INTANGIBLE ASSETS CONTINUED
(b) Impairment tests for goodwill and client portfolios
Goodwill and client portfolios are allocated to the Group’s Cash Generating Units (CGUs) identified according to business segment. The recoverable amount of a CGU is determined based on market value calculations. These calculations use recurring income measures consistent with market valuations of similar financial services businesses.
(c) Impact of possible changes in key assumptions
Changes in assumptions made in the assessment of impairment of goodwill relate to updating the earnings multiple used to estimate sustainable revenues. These assumptions are compared to market each year and adjusted appropriately.
(d) Impairment charge
During the year an impairment charge amounting to $ 50,000 was recorded against goodwill to reflect the lower payment on final settlement for the acquisition of a portfolio of client assets relating to financial planning and business services respectively (2014: Nil).
(e) Business acquisitions
The estimates and judgements included in the fair value calculations are based on historical experience and other factors, including management’s and the Directors’ expectations of future events that are believed to be reasonable under the current circumstances. Other than (c) above there have been no impairment recognised for the Fiducian Group CGUs in the impairment assessment performed at 30 June 2015. Based on management’s current assessment, the recoverable amount of Fiducian’s CGU exceeds the carrying amount by $ 5.79 million. The Fiducian Group’s CGU recoverable amount is sensitive to reasonably possible movements in key assumptions including changes to the earnings multiple of 3.1 used to determine the fair value of the CGU. Management has modelled below the impact of changes in these key assumptions with the following result :-
• if earning multiple were to decrease to 2.7, the CGU’s recoverable amount would exceed carrying amount by $ 4.69 million.
• if earning multiple were to decrease to 2.9, the CGU’s recoverable amount would exceed carrying amount by $5.24 million.
17 CURRENT L IABIL IT IES – TRADE AND OTHER PAYABLES
CONSOLIDATED
2015 2014
$’000 $’000
Trade payables 1,694 980
Other payables* 2,505 1,597
Amounts due to related entities - -
Client portfolio deferred settlement 308 897
Annual leave entitlements accrued 566 645
5,073 4,119
Information about the Group’s exposure to credit and interest rate risk is shown in Note 34.
* Other payables include retirement benefits payable to planners covered under salary agreements with Fiducian Financial Services Pty Limited. Under the terms of the agreement with certain long-serving salaried financial planners, those planners are entitled to a service fee subsequent to their retirement from the Company, under conditions designed to protect the Company’s client base. Eligibility to this service fee is based on service period and payment is subject to further ongoing conditions, including client retention, provision of support services to the entity to achieve this aim. The benefit is personal to the planner, is not transferable, can be stopped by or repaid to Fiducian Financial Services Pty Ltd should there be a breach of conditions, and will be reduced if the planner purchases some or all of their client base at or after retirement. This arrangement has been accounted for in accordance with AASB 119 Employee Benefits.
For
per
sona
l use
onl
y

A N N U A L R E P O R T 2 0 1 5 F I D U C I A N G R O U P L I M I T E D A C N 6 0 2 4 2 3 6 1 0 P A G E 5 3
18 CURRENT L IABIL IT IES – CURRENT TAX L IABIL IT IES
CONSOLIDATED
2015 2014
$’000 $’000
Income tax 1,462 1,173
19 NON CURRENT L IABIL IT IES – TRADE AND OTHER PAYABLES
CONSOLIDATED
2015 2014
$’000 $’000
Client portfolio deferred settlement - 276
20 NON-CURRENT L IABIL IT IES – DEFERRED TAX L IABIL IT IES
CONSOLIDATED
2015 2014
$’000 $’000
The balance comprises temporary
differences attributable to:
Amounts recognised in profit and loss
Depreciation and amortisation 1,091 1,313
Deferred tax liabilities before set off 1,091 1,313
Set off against deferred tax assets (968) (816)
Net deferred tax liabilities 123 497
Movements:
Opening balance at 1 July 1,313 897
Taken to the statement of comprehensive income (222) 416
Arising on Business combination - 559
Deferred tax liabilities at 30 June before set off 1,091 1,313
Set off against deferred tax liabilities (968) (816)
123 497
Expiration of net deferred tax liabilities
Expiration of net deferred tax liabilities
within 12 months 123 132
after 12 months - 365
123 497
NOTES TO THE F INANCIAL STATEMENTS CONT INUEDFOR THE YEAR ENDED 30 JUNE 2015
For
per
sona
l use
onl
y

P A G E 5 4 F I D U C I A N G R O U P L I M I T E D A C N 6 0 2 4 2 3 6 1 0 A N N U A L R E P O R T 2 0 1 5
NOTES TO THE F INANCIAL STATEMENTS CONT INUEDFOR THE YEAR ENDED 30 JUNE 2015
21 NON-CURRENT L IABIL IT IES – PROVISIONS
CONSOLIDATED
2015 2014
$’000 $’000
Employee benefits – long service leave 921 947
The provision for long service leave includes all pro-rata entitlements where employees have not yet completed the required period of service and also those where employees are entitled to pro-rata payments. The entire amount is presented as non-current as no material amounts are expected to be settled within the next 12 months.
22 CONTRIBUTED EQUITY
(a) Share capital
CONSOLIDATED
2015 2014
$’000 $’000
Ordinary shares – fully paid 6,366 6,086
Treasury shares - 150
6,366 6,236
(b) Movements in ordinary share capital and treasury shares
DATE DETAILS NUMBER OF SHARES AVERAGE PRICE $’000
1 July 2013 Opening balance 31,532,429 - 7,145
Shares bought back on-market and cancelled (679,961) $1.11 (755)
Treasury Shares (94,571) $1.58 (150)
Buy-back transaction costs (4)
30 June 2014 Balance 30,757,897 - 6,236
Shares bought back on-market and cancelled (14,500) $1.82 (26)
Shares issued on exercise of options 140,000 - 156
Shares issued 1 $1.00 -
30 June 2015 Balance 30,883,398 6,366
(c) Ordinary sharesOrdinary shares entitle the holder to participate in dividends and the proceeds on winding-up of the Company in proportion to the number of and amounts paid on the shares held.
On a show of hands every holder of ordinary shares present at a meeting in person or by proxy, is entitled to one vote, and upon a poll each share is entitled to one vote.
(d) Share buy-backBetween July 2014 and June 2015 the Company purchased and cancelled ordinary shares on-market in order to reduce the Company’s capital and surplus liquidity, as originally announced in 2005 and last extended on 3 March 2015. During the financial year the shares were acquired at an average price of $1.82 per share, with prices ranging from $1.70 to $1.89. The net cost of $26,394 of transaction costs, was deducted from equity.
At 30 June 2015, 500,000 shares remained available to be repurchased under the most recently announced buy back notice to the ASX.
For
per
sona
l use
onl
y

A N N U A L R E P O R T 2 0 1 5 F I D U C I A N G R O U P L I M I T E D A C N 6 0 2 4 2 3 6 1 0 P A G E 5 5
22 CONTRIBUTED EQUITY cont inued
(e) OptionsInformation relating to Fiducian Group Employee & Director Option Plans and options issued, exercised and lapsed during the year is set out in Note 26.
(f) Capital risk managementThe Group’s objectives when managing capital of the wholly owned subsidiaries within the Group is to safeguard their ability to continue as a going concerns, to individually continue to meet externally imposed capital requirements of APRA and ASIC under their Registrable Superannuation Entity (RSE) Licence, Responsible Entity (RE) licence and their Australian Financial Services (AFS) Licence respectively, and to continue to provide returns to shareholders and benefits for other stakeholders.
In order to maintain or adjust the capital structure, the Group may adjust the amount of dividends paid to shareholders, return capital to shareholders via an on-market share buy back, or issue new shares upon exercise of outstanding options. There has been no borrowing to maintain capital adequacy.
The externally imposed requirements are:
a. Under its ASIC RE licence, the RE, Fiducian Investment Management Services Limited, must maintain $ 5,000,000 net tangible assets at all times.
b. Under its APRA RSE licence, the RSE, Fiducian Portfolio Services Limited must maintain $100,000 cash at all times since all superannuation assets are custodially held.
The requirement under the RSE licence and RE licences are maintained by placing cash on deposit with an ADI. The requirement under the AFS licence is monitored monthly when management accounts are prepared, and is reported to the Board monthly at each meeting.
23 RESERVES
CONSOLIDATED
2015 2014$’000 $’000
Movements
Share based payments reserve
Balance 1 July 26 75
Option expense 16 19
Option lapses - (68)
Balance 30 June 42 26
24 RETAINED PROFITS
CONSOLIDATED
2015 2014$’000 $’000
Movements in retained profits were as follows:
Balance 1 July 13,089 11,503
Net profit for the year 4,622 3,982
Dividends paid (Note 8) (2,928) (2,396)
Balance 30 June 14,783 13,089
NOTES TO THE F INANCIAL STATEMENTS CONT INUEDFOR THE YEAR ENDED 30 JUNE 2015
For
per
sona
l use
onl
y

P A G E 5 6 F I D U C I A N G R O U P L I M I T E D A C N 6 0 2 4 2 3 6 1 0 A N N U A L R E P O R T 2 0 1 5
NOTES TO THE F INANCIAL STATEMENTS CONT INUEDFOR THE YEAR ENDED 30 JUNE 2015
25 KEY MANAGEMENT PERSONNEL DISCLOSURES
(a) Key management personnel compensation
CONSOLIDATED
2015 2014$’000 $’000
Short-term employee benefits 744,457 760,417
Post-employment benefits 34,567 30,743
Share-based payments - 18,981
779,024 810,141
Detailed remuneration disclosures are provided in sections A-E of the Remuneration Report contained in the Directors’ Report.
(a) Equity instrument disclosures relating to key management personnel
(i) Options provided as remuneration and shares issued on exercise of such options
Details of options provided as remuneration and shares issued on the exercise of such options, together with terms and conditions of the options, can be found in section D of the Remuneration Report.
(ii) Option holdings
The numbers of options over ordinary shares in the Company held during the financial year by each director of Fiducian Group Limited, including their personally related and associated entities, are set out below. At the AGM on 23 October 2014, 100,000 options were granted to Mr I Singh as compensation in respect of the year ending 30 June 2014. Under the scheme of the restructure the options issued on 23 October 2014 were cancelled and an equivalent number of options were issued in the Company on substantially the same terms and conditions as the cancelled options.
2015 BALANCE AT GRANTED DURING BALANCE AT THE START OF THE YEAR AS LAPSED DURING THE END OF VESTED AND NAME THE YEAR EXERCISED REMUNERATION THE YEAR THE YEAR EXERCISABLE
I Singh 140,000 140,000 100,000 - 100,000 -
2014 BALANCE AT GRANTED DURING BALANCE AT THE START OF THE YEAR AS LAPSED DURING THE END OF VESTED AND NAME THE YEAR EXERCISED REMUNERATION THE YEAR THE YEAR EXERCISABLE
I Singh 55,000 - 100,000 (15,000) 140,000 40,000
(iii) Shareholdings
The numbers of shares in the Company held during the financial year by each director of Fiducian Group Limited, including their personally related and associated entities, are set out below. There were no shares granted during the period as compensation.
2015 RECEIVED DURING BALANCE AT THE THE YEAR ON THE OTHER CHANGES BALANCE AT THE END NAME START OF THE YEAR EXERCISE OF DURING THE YEAR OF THE YEAR DIRECTOR OPTIONS
I Singh 10,162,512 140,000 71,252 10,373,764 R Bucknell 800,000 - - 800,000
F Khouri 251,373 - - 251,373
C Stone 23,700 - 10,000 33,700
For
per
sona
l use
onl
y

A N N U A L R E P O R T 2 0 1 5 F I D U C I A N G R O U P L I M I T E D A C N 6 0 2 4 2 3 6 1 0 P A G E 5 7
25 KEY MANAGEMENT PERSONNEL DISCLOSURES cont inued
2014 RECEIVED DURING BALANCE AT THE THE YEAR ON THE OTHER CHANGES BALANCE AT THE END NAME START OF THE YEAR EXERCISE OF DURING THE YEAR OF THE YEAR DIRECTOR OPTIONS
I Singh 10,113,012 - 49,500 10,162,512 R Bucknell 900,000 - (100,000) 800,000
F Khouri 226,373 - 25,000 251,373
C Stone 20,000 - 3,700 23,700
Shares provided on exercise of options140,000 ordinary shares in the Company were provided as a result of the exercise of remuneration options to the Managing Director of Fiducian Group Limited, as key management person of the Group, during the period (2014: Nil). No entities with which directors have interests have exercised any Adviser options during the year (2014: Nil). No amounts are unpaid on any shares issued on the exercise of options.
(c) Loans to directors
No loans were made to directors during the financial year (2014: Nil).
(d) Other transactions with key management personnelA director, Mr R E Bucknell, is a director of Hunter Place Services Pty Ltd, a company which provides his services as a director to the Group.
A director, Mr F Khouri, is an authorised representative under the Fiducian Financial Services Pty Ltd Australian Financial Services Licence and is a director and shareholder of Hawkesbury Financial Services Pty Ltd, which is a franchisee of Fiducian Financial Services Pty Ltd. Hawkesbury Financial Services Pty Ltd places business with and receives financial planning remuneration from the Group. All transactions are on normal commercial terms and conditions.
A director, Mr C Stone, was paid director’s fees for his personal contribution to the Board.
Aggregate amounts of each of the above types of other transactions with directors of Fiducian Group Limited:-
CONSOLIDATED
2015 2014$ $
Amounts recognised as an expense
Directors’ fees and committee fees* 295,353 308,400
Financial planning fees paid or payable 211,179 209,142
506,532 517,542
* Details of these fees and explanations for the increase have been provided in the Remuneration report in the Directors’ report.
Shares under option
Unissued ordinary shares of Fiducian Group Limited under option at the date of this report are disclosed in Note 26 of the financial report.
No option holder has any right under the options to participate in any other share issue of the Company or any other entity until after the exercise of the option.
Shares issued on the exercise of options
The details of ordinary shares of Fiducian Group Limited issued during the year ended 30 June 2015 on the exercise of options granted under the Fiducian Group Limited Employee & Director Share Option Plan is disclosed under Note 26 to the financial report.
NOTES TO THE F INANCIAL STATEMENTS CONT INUEDFOR THE YEAR ENDED 30 JUNE 2015
For
per
sona
l use
onl
y

P A G E 5 8 F I D U C I A N G R O U P L I M I T E D A C N 6 0 2 4 2 3 6 1 0 A N N U A L R E P O R T 2 0 1 5
25 KEY MANAGEMENT PERSONNEL DISCLOSURES cont inued
(e) Other transactions with key management personnel
Balance at 1 July 2014 ($)
Interest paid / payable for the year ($)
Balance at 30 June 2014 ($)
Number of KMP in this aggregation
Aggregate details of business development and staff loans made to Key management personnel of the Group, including their close family members and entities related to them 77,902 3,946 77,927 2
Business development and staff loans have been made at arm’s length and at the same terms and conditions provided to other franchisees and staff.
26 SHARE BASED PAYMENTS
(a) Employee and director share option plan (ESOP)
The establishment of the Fiducian Group Limited ESOP was approved by shareholders at the 2000 annual general meeting. The ESOP is designed to provide long-term incentives for senior managers and directors to deliver long-term shareholder returns. Under the plan, participants are granted options which only vest if certain performance standards are met. Participation in the plan is at the Board’s discretion and no individual has a contractual right to participate in the plan or receive any guaranteed benefits.
Fiducian Group Limited (‘FGL’) has established the ESOP, which is designed to provide incentives to employees and directors. All grants of options under the ESOP are subject to compliance with the Corporations Act 2001 and ASX Listing Rules.
The directors may, from time to time, determine which employees and directors may participate in the ESOP, and the number of options that may be issued to them. The directors have an absolute discretion to determine who will participate and the number of options that may be issued. The ESOP provides for an upper limit on the number of options that may be outstanding, the exercise price, exercise period and expiry, and adjustments in the event of capital restructuring. The directors have resolved that the ESOP no longer applies to non-executive directors.
Options are granted under the plan for no consideration. Employee options are granted for a five-year period where 35% vest after one year, a further 45% vest after two years and the balance vest after three years. Director options vest after one year. Options granted under the plan carry no dividend or voting rights. When exercisable, each option is converted into one ordinary share on payment of the exercise price.
The exercise price of options is based on the volume weighted average price at which the Company’s shares are traded on the Australian Securities Exchange during the month preceding the date the options are granted. During the year the directors determined not to issue any options (2014: Nil) to staff and no employee options expired (2014: 155.000).
Subject to prior approval by shareholders, the Company may issue each year a maximum of 100,000 options to the executive director for each year of service, subject to performance criteria. The Directors have resolved not to issue any options (2014: 100,000 options at $1.63) to the executive director in respect of the year ended 30 June 2015.
Set out on the next page are summaries of options granted under various option plans:-
NOTES TO THE F INANCIAL STATEMENTS CONT INUEDFOR THE YEAR ENDED 30 JUNE 2015
For
per
sona
l use
onl
y

A N N U A L R E P O R T 2 0 1 5 F I D U C I A N G R O U P L I M I T E D A C N 6 0 2 4 2 3 6 1 0 P A G E 5 9
NOTES TO THE F INANCIAL STATEMENTS CONT INUEDFOR THE YEAR ENDED 30 JUNE 2015
BALANCE AT GRANTED EXERCISED LAPSED BALANCE AT VESTED AND GRANT EXPIRY EXERCISE START OF THE DURING THE DURING THE DURING THE END OF THE EXERCISABLE DATE DATE PRICE YEAR YEAR YEAR YEAR YEAR AT END OF THE YEAR NUMBER NUMBER NUMBER NUMBER NUMBER NUMBER
Consolidated 2015
ESOP – Managing Director
27 Oct 2010 29 Oct 2015 $1.28 40,000 - (40,000) - - -
23 Oct 2013 23 Oct 2018 $1.05 100,000 - (100,000) - - -
23 Oct 2014 23 Oct 2019 $1.63 - 100,000 - - 100,000 -
140,000 100,000 (140,000) - 100,000 -
Weighted average exercise price $1.12 $1.63 $1.12 - $1.63 -
The volume weighted average remaining contractual life of share options outstanding at the end of the period was 4.32 years (2014 : 3.46 years).
BALANCE AT GRANTED EXERCISED FORFEITED BALANCE AT VESTED AND GRANT EXPIRY EXERCISE START OF THE DURING THE DURING THE DURING THE END OF THE EXERCISABLE DATE DATE PRICE YEAR YEAR YEAR YEAR YEAR AT END OF THE YEAR NUMBER NUMBER NUMBER NUMBER NUMBER NUMBER
Consolidated – 2014
ESOP – Managing Director – Note 26(a)
29 Oct 2008 29 Oct 2013 $2.30 15,000 - - (15,000) - -
27 Oct 2010 29 Oct 2015 $1.28 40,000 - - - 40,000 40,000
23 Oct 2013 23 Oct 2018 $1.05 - 100,000 - - 100,000 -
55,000 100,000 - (15,000) 140,000 40,000
ESOP – Staff
27 Aug 2008 27 Aug 2013 $2.30 155,000 - - (155,000) - -
155,000 - - (155,000) - -
ASOP – Advisers
30 Sept 2008 30 Sept 2013 $2.70 20,270 - - (20,270 - -
20,270 - - (20,270) - -
Total 230,270 100,000 - (190,270) 140,000 40,000
Weighted average exercise price $2.16 $ 1.05 - $2.34 $1.12 $1.28
(b) Expenses arising from share-based payment transactions
Total expenses arising from share-based payment transactions recognised during the period as part of employee benefit expense were as follows:
CONSOLIDATED
2015 2014$ $
Options issued, net of lapses - (48,235)
For
per
sona
l use
onl
y

P A G E 6 0 F I D U C I A N G R O U P L I M I T E D A C N 6 0 2 4 2 3 6 1 0 A N N U A L R E P O R T 2 0 1 5
NOTES TO THE F INANCIAL STATEMENTS CONT INUEDFOR THE YEAR ENDED 30 JUNE 2015
27 REMUNERATION OF AUDITORSDuring the year the following fees were paid or payable for services provided by the auditor, its related practices and non-related audit firms:
CONSOLIDATED
2015 2014$’000 $’000
Audit services
PricewaterhouseCoopers Australian firm:
Audit and review of financial reports 120,600 104,206
Other audit related work, including audit of entities for which a group entity is trustee, manager or responsible entity (gross of any amounts reimbursed) 374,760 337,590
Total remuneration 495,360 441,796
It is the Group’s policy to employ PricewaterhouseCoopers on assignments additional to their statutory audit duties where PricewaterhouseCoopers’ expertise and experience with the Group are important.
28 CONTINGENT L IABIL IT IESThe Group had contingent liabilities at 30 June 2015 in respect of bank guarantees for property leases group entities amounting to $438,000 (2014: $438,000).
29 COMMITMENTS FOR EXPENDITURE
(a) Capital expenditure
CONSOLIDATED
2015 2014$’000 $’000
Commitments payable within one year - -
(b) Operating leases
The Group leases various offices under non-cancellable operating leases expiring within 12 months to four years. The leases have varying terms, escalation clauses and renewal rights. On renewal, the terms of the leases are renegotiated.
CONSOLIDATED
2015 2014$’000 $’000
Within one year 1,026 1,030
Later than one year but not later than 5 years 3,642 4,670
4,668 5,700
For
per
sona
l use
onl
y

A N N U A L R E P O R T 2 0 1 5 F I D U C I A N G R O U P L I M I T E D A C N 6 0 2 4 2 3 6 1 0 P A G E 6 1
NOTES TO THE F INANCIAL STATEMENTS CONT INUEDFOR THE YEAR ENDED 30 JUNE 2015
30 RELATED PARTY TRANSACTIONS
(a) Parent entity
The parent entity within the Group is Fiducian Group Limited at year end.
(b) Subsidiaries
Interests in subsidiaries are set out in Note 12.
The consolidated financial report incorporate the assets, liabilities and results of the subsidiaries set out in Note 12 in accordance with the accounting policy described in Note 1(b).
(c) Key management personnel
Disclosures relating to key management personnel are set out in Note 25.
(d) Transactions with related parties
i) Transactions between the Group and other related entitiesa. Operator fee income received from related trustsb. Trustee fee income received from related trustsc. Recovery of group costs, such as insurance from related trustsd. Collection of fees by Responsible Entities from the related funds.
The above transactions were on normal commercial terms and conditions and at market rates. All transactions between Group entities are eliminated on consolidation.
(ii) Transactions with related parties of directorsa. Financial planning fees paid by Fiducian Financial Services Pty Limited to entities associated with the directorsb. Financial planning fees paid by Fiducian Financial Services Pty Limited to entities associated with relatives of the directors
The above transactions were on normal commercial terms and conditions and at market rates.
The following transactions occurred with related parties:-
CONSOLIDATED
Ownership interest1
2015
$
2014
$
Related trusts
Fiducian Investment Service Nil
Operator fees income 3,779,488 2,746,796
Expense recovery 376,566 355,911
Fiducian Superannuation Service Nil 9,121,465 8,373,323
Trustee fees income 3,348,012 2,923,670
Expense recovery
Fiducian Funds Nil
Responsible entity fees income 5,872,640 3,566,835
Expense recovery 248,645 270,000
Entities associated with directors or their relatives
Hawkesbury Financial Services Pty Ltd2
Financial planning fees paid 211,179 209,142
Fiducian Financial Services Bondi Junction Pty Ltd3
Financial planning fees paid 162,275 130,354
For
per
sona
l use
onl
y

P A G E 6 2 F I D U C I A N G R O U P L I M I T E D A C N 6 0 2 4 2 3 6 1 0 A N N U A L R E P O R T 2 0 1 5
30 RELATED PARTY TRANSACTIONS cont inued
1 “Ownership Interest” means the percentage of capital of the Company held directly and/or indirectly through another entity by Fiducian Group Limited2 Payments to Franchisee associated with a director, F Khouri in the normal course of business in arms length transactions.3 Payments to Franchisee associated with James Bucknell, relative of RE Bucknell, in the normal course of business in arms length transactions.
e) Outstanding balances arising from sales/purchases of services provided
The following balances are outstanding at the reporting date in relation to transactions with related parties:-
2015 2014$ $
Current receivables (income from related trusts) 2,389,381 1,800,338
2,389,381 1,800,338
No provisions for doubtful receivables have been raised in relation to any outstanding balances, and no expense has been recognised in respect of bad and doubtful receivables due from related parties.
31 RECONCILIATION OF PROFIT OR LOSS AFTER INCOME TAX TO NET CASH INFLOW FROM OPERATING ACTIVIT IES
CONSOLIDATED
2015 2014$’000 $’000
Profit for the year 4,622 3,983
Non-cash employee (expense)/ benefit ( 89) 45
Depreciation,amortisation and impairment 910 682
Net (gain) loss on sale of non-current assets 79 (24)
Changes in operating assets and liabilities:
Change in accounts receivable ( 551) (149)
Change in income tax payable 289 881
Change in other assets at fair value - 9
Change in trade creditors 713 290
Change in other creditors 908 154
Change in deferred income tax asset - 134
Change in deferred income tax liability (374) (142)
Net cash inflow from operating activities 6,507 5,864
NOTES TO THE F INANCIAL STATEMENTS CONT INUEDFOR THE YEAR ENDED 30 JUNE 2015
- - -
For
per
sona
l use
onl
y

A N N U A L R E P O R T 2 0 1 5 F I D U C I A N G R O U P L I M I T E D A C N 6 0 2 4 2 3 6 1 0 P A G E 6 3
NOTES TO THE F INANCIAL STATEMENTS CONT INUEDFOR THE YEAR ENDED 30 JUNE 2015
32 EARNINGS PER SHARE CONSOLIDATED
2015 2014 Earnings per share using weighted average number of ordinary sharesoutstanding during the period:-
(a) Basic earnings per share (in cents)
Profit from continuing operations attributable to the ordinary equity of the Company 14.99 12.81
(b) Diluted earnings per share (in cents)
Profit from continuing operations attributable to the ordinary equity
and potential ordinary equity of the Company 14.93 12.75
(c) Weighted average number of shares used as the denominator CONSOLIDATED
2015 2014 NUMBER NUMBER
Weighted average number of shares used as the denominator:-
Weighted average number of ordinary shares used as the denominator in calculating basic earnings per share 30,835,861 31,015,853
Adjustments for calculation of diluted earnings per share: Options 119,782 142,958
Weighted average number of ordinary shares and potential ordinary shares used as the denominator in calculating diluted earnings per share 30,955,643 31,158,811
(d) Reconciliation of earnings used in calculating basic and diluted earnings per share
CONSOLIDATED
2014 2013 $’000 $’000
Net profit and earnings used calculating basic and diluted earnings per share 4,622 3,983
(e) Information concerning the classification of securities
Options granted to employees under the Fiducian Group Limited Employee Share Option Plan (ESOP) are considered to be potential ordinary shares and have been included in the determination of diluted earnings per share to the extent that they are dilutive. The options have not been included in the determination of basic earnings per share. Details relating to the options are set out in Note 26.
For
per
sona
l use
onl
y

P A G E 6 4 F I D U C I A N G R O U P L I M I T E D A C N 6 0 2 4 2 3 6 1 0 A N N U A L R E P O R T 2 0 1 5
33 EVENTS OCCURRING AFTER BALANCE DATE/REPORTING DATE Subsequent to the end of the financial year, a subsidiary of the Group has acquired two portfolios of financial planning clients with the transition to Fiducian commencing from 1 July 2015 and 1 August 2015 respectively. Under the terms of the contracts of acquisition the Group will finance the acquisitions through a combination of cash payments and issue of shares over the payment period. Accordingly the Group has issued 133,552 fully paid ordinary shares at $1.83 on 14 August 2015 towards payment of the first instalment of one of the above mentioned acquisitions. Further shares will be issued during the year in accordance with the terms of each contract.
The Group has also commenced proceedings with ASIC to deregister its two dormant subsidiaries details of which are provided in Note 12 of these financial statements.
To the date of this report, the Group has not bought back any shares off the market ( 2014: Nil).
Other than this there has not arisen in the interval between the end of the financial year and the date of this report any item, transaction or event of a material and unusual nature likely in the opinion of the directors of the Group, to affect significantly the operations of the Group, the results of those operations or the state of affairs of the Group in subsequent years.
34 FINANCIAL RISK MANAGEMENTThe Group’s activities expose it to a variety of financial risks: market risk (including interest rate risk), credit risk and liquidity risk. The Group’s overall risk management program focuses on the unpredictability of financial markets and seeks to minimise potential adverse effects on the financial performance of the Group.
The Group holds the following financial instruments:-
CONSOLIDATED
2015 2014$’000 $’000
Financial assets
Cash and cash equivalents 12,374 11,194
Trade and other receivables 7,238 4,939
Financial assets at fair value through profit or loss - 106
19,612 16,239
Financial liabilities
Trade and other payables 5,073 4,395
(a) Market risk
(i) Foreign exchange risk
The Group has limited operations outside Australia and is not exposed to any material foreign exchange risk.
(ii) Interest rate risk
The Group’s main interest rate risk arises from deposits in Australian Dollars, and short-term loans to staff and planners. The group has no borrowings.
30 JUNE 2015 30 JUNE 2014
Weighted average
interest rate Balance
Weighted average
interest rate Balance% $’000 % $’000
Cash at bank and on deposit 1.7% 12,374 2.1% 11,194
Staff & financial planner loans 5.1% 4,016 5.3% 2,268
16,390 13,462
NOTES TO THE F INANCIAL STATEMENTS CONT INUEDFOR THE YEAR ENDED 30 JUNE 2015
For
per
sona
l use
onl
y

A N N U A L R E P O R T 2 0 1 5 F I D U C I A N G R O U P L I M I T E D A C N 6 0 2 4 2 3 6 1 0 P A G E 6 5
NOTES TO THE F INANCIAL STATEMENTS CONT INUEDFOR THE YEAR ENDED 30 JUNE 2015
34 FINANCIAL RISK MANAGEMENT CONTINUED
Bank deposits are at call and staff and planner loans have terms extending between 1 and 7 years, and may be repayable sooner in certain circumstances. Interest rates are reviewed and adjusted at least quarterly.
The Group’s main interest rate risk arises from cash and cash equivalents with variable interest rates. At 30 June 2015 if interest rates change by +/- 100 basis points (2014: +/- 100 basis points) from the year end rates with all other variables held constant, post-tax profit would have been $115,000 higher or lower (2014: $ 94,000).
(b) Credit risk
The Group has negligible credit risk from receivables, as management fee and financial planning income is received within one month of it falling due, and financial planning fees are only paid following the receipt of this income.
The credit quality of other financial assets can be assessed against external credit ratings as follows:
CONSOLIDATED
2015 2014$’000 $’000
Cash and cash equivalents
AA- 12,374 11,194
12,374 11,194
Investment in related trust
Unrated - 106
Loans to staff and financial planners
Unrated 4,016 2,268
The maximum exposure to credit risk at the reporting date is the carrying amount of the financial assets as summarised on this page.
(c) Liquidity risk
The Group maintains sufficient liquid reserves to meet all foreseeable working capital, investment and regulatory licensing requirements. The Group has no undrawn credit or other borrowing facilities in place.
CONSOLIDATED
2015 2014$’000 $’000
Due in less than 1 year 5,073 4,119
Due between 1 and 2 years - 276
5,073 4,395
(d) Fair value estimation
The fair value of financial assets and financial liabilities must be estimated for recognition and measurements or for disclosure purposes.
(a) quoted prices (unadjusted) in active markets for identical assets or liabilities ( level1 )
(b) inputs other than quoted prices included within level 1 that are observable for the asset or liability, either directly (as prices) or indirectly (derived from prices) (level 2), and
(c) inputs for the asset or liability that are not based on observable market data (unobservable inputs) (level 3)
For
per
sona
l use
onl
y

P A G E 6 6 F I D U C I A N G R O U P L I M I T E D A C N 6 0 2 4 2 3 6 1 0 A N N U A L R E P O R T 2 0 1 5
NOTES TO THE F INANCIAL STATEMENTS CONT INUEDFOR THE YEAR ENDED 30 JUNE 2015
34 FINANCIAL RISK MANAGEMENT CONTINUED
(d) Fair value estimation (continued)
The following table presents the Group’s assets and liabilities measured and recognised at fair value according to the fair value hierarchy at 30 June 2015. The Group did not have any assets or liabilities recognised at fair value as at that date.
At 30 June 2015 Level 1$’000
Level 2$’000
Level 3$’000
Level 4$’000
Recurring Fair Value measurements
Assets
Other financial assets at fair value through
profit or loss
Investment in related trust - - - -
Total assets - - - -
At 30 June 2014 Level 1$’000
Level 2$’000
Level 3$’000
Level 4$’000
Recurring Fair Value measurements
Assets
Other financial assets at fair value through
profit or loss
Investment in related trust - - 106 106
Total assets - - 106 106
The fair value of financial instruments traded in active markets (such as publicly traded derivatives, and trading and available-for-sale securities) is based on quoted market prices at the end of the reporting period. The quoted market price used for financial assets held by the Group is the current bid price. These instruments are included in level 1. The Group holds none of these investments.
The fair value of financial instruments that are not traded in an active market (for example, debt investments and derivative financial instruments) is determined using valuation techniques. These instruments are included in level 2. The Group held none of these investments during the year.
In the circumstances where a valuation technique for these instruments is based on significant unobservable inputs, such instruments are included in level 3. The Group’s accounting policy is to value the investment in related trust at fair value through profit or loss, this was difficult as a result of a redemption freeze. As at 30 June 2015 the Group did not hold any Level 3 investments.
The following table presents the changes in level 3 instruments for the year ended 30 June 2015:
CONSOLIDATED
2015 2014$’000 $’000
Investment in related trust -
Opening balance 106 155
Transfers in to level 3 - -
Capital distribution (106) (40)
Fair value (Loss) recognised in Statement of Comprehensive Income - 276
- 106
For
per
sona
l use
onl
y

A N N U A L R E P O R T 2 0 1 5 F I D U C I A N G R O U P L I M I T E D A C N 6 0 2 4 2 3 6 1 0 P A G E 6 7
NOTES TO THE F INANCIAL STATEMENTS CONT INUEDFOR THE YEAR ENDED 30 JUNE 2015
34 FINANCIAL RISK MANAGEMENT CONTINUED
(d) Fair value estimation (continued)
The carrying amounts of trade receivables and payables are assumed to approximate their fair values due to their short-term financial liabilities for disclosure purposes is estimated by nature.
(e) Assets and liabilities not carried at fair value but for which fair value is disclosed
The following table analyses within the fair value hierachy the Group’s assets and liabilities not measured at fair value at 30 June 2015 but for which fair value is disclosed:-
At 30 June 2015 Level 1$’000
Level 2$’000
Level 3$’000
Level 4$’000
Assets
Cash and cash equivalents 12,374 - - 12,374
Trade and other receivables (excluding loans) - - 3,222 3,222
Business development and staff loans - - 4,016 4,016
Total assets 12,374 - 7,238 19,612
Liabilities
Trade and other payables 5,073 - - 5,073
Total Liabilites 5,073 - - 5,073
At 30 June 2014 Level 1$’000
Level 2$’000
Level 3$’000
Level 4$’000
Assets
Cash and cash equivalents 11,194 - - 11,194
Trade and other receivables (excluding loans) - - 2,671 2,671
Business development and staff loans - - 1,672 1,672
Total assets 11,194 - 4,343 15,537
Liabilities
Trade and other payables - - 4,553 4,553
Total Liabilites - - 4,553 4,553
Assets and liabilities included in this table are carried at amortised cost; their carrying value is a reasonable approximation of fair value.
Cash and cash equivalents include cash in hand, deposits held with bank and other short-term investments in an active market.
Trade receivables include the contractual amount for settlement of the trade debts due to the Group. The carrying amount of the trade receivables are assumed to approximate their fair values due to their short term nature.
Trade and other payables inlcude amounts due to creditors and accruals and represent the contractual amounts and obligations due by the Group for expenses. The carrying amount of the trade and other payables are assumed to approximate the fair value due to their short-term nature.
Business development and staff loans represents contractual payments by advisers and staff over the period of loan. Loans classified as current have not been discounted as the carrying values are a reasonable approximation of fair value due to the short-term nature. Non-current loans have been valued at the present value of estimated future cash flows discounted at the original effective interest rates of the loans.
For
per
sona
l use
onl
y

P A G E 6 8 F I D U C I A N G R O U P L I M I T E D A C N 6 0 2 4 2 3 6 1 0 A N N U A L R E P O R T 2 0 1 5
35 UNCONSOLIDATED STRUCTURED ENTITIES
A structured entity is an entity that has been designed so that the voting or similar rights are not the dominant factor in deciding who controls the entity and the relevant activities are directed by means of contractual arrangements.
A subsidiary of the Group, Fiducian Investment Management, acts as Responsible Entity (“RE”) for the Fiducian Funds and has significant influence over the funds due to its power to participate in financial and operating policies of the investee through the powers vested in it by the various contractual agreements.The Group considers all these funds to be structured entities. The RE receives management fees and netting fees from the funds. Except as indicated in Note 13, the Group does not invest in any of the funds it manages nor have any other forms of involvement such as the provision of funding, liquidity support or providing guarantees. Despite this, the Group has determined that it has an interest in the funds based on the variability of returns from management fees it receives linked to the net asset valuation of the respective funds.
The funds’ objectives range from acheiving medium-to long-term capital growth and their investment strategy does not include the use of leverage. The funds finance their operations by issuing redeemable units which are puttable at the holder’s option and entitle the holder to a proportional stake in the respective fund’s net assets.
The nature and extent of the Group’s interest in the funds has been aggregated and is summarised below :-
Type of FundAccrued Income*
$’000
Financial Assets**
$’000
Maximum Exposure
to Loss$’000
Fund Net Asset Value
$’000
Fund’s Investment
Portfolio$’000
Australian Equity Funds 275 - 275 365,469 363,886
Global Equity Funds 331 - 331 270,644 272,212
Property Fund 54 - 54 74,845 75,459
Diversified Funds 106 - 106 539,848 539,234
Technology Fund 66 - 66 30,691 30,639
Fixed Interest Fund 4 - 4 88,665 88,412
*shown as Other receivables in Current Assets under trade and other receivables subheading in the Statement of Financial Position.
**shown as Non current assets – Other financial assets at fair value though profit and loss (refer to Note 13 for details).
Unless specified otherwise, the Group’s maximum exposure to loss is the total of its on-balance sheet position as at the reporting date. There are no additional off balance sheet arrangements which would expose the Group to potential loss.
During the year the Group earned management fees and netting fees from the structured entities.
A subsidiary of the Group, Fiducian Portfolio Services Ltd, acts as the trustee of the Fiducian Superannuation Service under the provisions of the Trust deed for the fund. Due to its fiduciary and statutory obligations to manage the assets of the trust on behalf of the beneficiaries, the Group exercises significant influence over the superannuation fund and therefore the superannuation fund is considered a structured entity as defined above. For its service the subsidiary receives a management fee for managing the investment from the members of the fund. In addition to this the subsidiary is entitled to reimbursement of expenses incurred by it in the operation of the service (for details refer to note 6).
The nature and extent of the subsidiary’s interest in the fund is summarised below :-
Type of Fund Accrued Income
Financial Assets**
Maximum Exposure
Fund Net Asset Value
Fund’s Investment
Portfolio$’000s $’000s $’000s $’000s $’000s
Fiducian Superannuation Service 1,248 - 1,248 889,522 889,427
NOTES TO THE F INANCIAL STATEMENTS CONT INUEDFOR THE YEAR ENDED 30 JUNE 2015
For
per
sona
l use
onl
y

A N N U A L R E P O R T 2 0 1 5 F I D U C I A N G R O U P L I M I T E D A C N 6 0 2 4 2 3 6 1 0 P A G E 6 9
36 PARENT ENTITY FINANCIAL INFORMATION
The stand alone summarised financial statements of the Company from the date it commenced operations following the restructure of the Fiducian Group are as follows:-
30 JUNE 2015
$’000
(a) Balance sheet
Current Assets 7,459
Non Current Assets 10,419
Total Assets 17,878
Current Liabilities 2,470
Non Current Liabilites -
Total Liabilities 2,470
Net Assets 15,408
Equity
Share capital 6,366
Reserves 42
Retained Earnings 9,000
Equity 15,408
(b) Profit for the period (1 March to 30 June)
Dividend from subsidiary* 9,000
*Dividend from Fiducian Portfolio Services Limited, the previous holding company and operating group entity,on 1 March 2015 following the restructure and establishment of the Company as the parent entity of the Fiducian Group.
(c) Total comprehensive income
(d) Contingent liability of the parent entity
The Company did not have any contingent liabilities as at 30 June 2015.
(e) Contractual commitments for the acquistion of property, plant or equipment.
As at 30 June 2015 the Company did not have any contractual commitments for the acquistion of property, plant or equipment.
(f) The Company commenced operations on 1 March 2015 and hence there are no comparatives for the previous year.
-
37 DEED OF CROSS-GUARANTEE
Following the scheme of restructure, the Company entered into a deed of cross-guarantee, substantially in the form of ASIC Pro Forma 24 with each wholly owned member of the Fiducian Group. The effect of the deed of cross-guarantee is that each member that has entered into the deed, guarantees to each creditor of any member of the Fiducian Group that has entered into the deed payment in full of any debt owed to that creditor in the event of a winding up of that relevant member of the Fiducian Group.
NOTES TO THE F INANCIAL STATEMENTS CONT INUEDFOR THE YEAR ENDED 30 JUNE 2015
For
per
sona
l use
onl
y

P A G E 7 0 F I D U C I A N G R O U P L I M I T E D A C N 6 0 2 4 2 3 6 1 0 A N N U A L R E P O R T 2 0 1 5
In the directors’ opinion:
(a) the financial statements and notes set out on pages 27 to 69 are in accordance with the Corporations Act 2001, including
(i) complying with Accounting Standards, the Corporations Regulations 2001 and other mandatory professional reporting requirements; and
(ii) giving a true and fair view of the Company’s and consolidated entity’s financial position as at 30 June 2015 and of their performance for the financial year ended on that date; and
(b) there are reasonable grounds to believe that the Company will be able to pay its debts as and when they become due and payable.
(c) the date of this declaration, there are reasonable grounds to believe that the members of the wholly owned group identified in note 12 will be able to meet any obligations or liabilites to which they are, or may become subject by virtue of the deed of cross guarantee described in note 37.
Note 1(a) confirms that the financial statements also comply with International Financial Reporting Standards as issued by the International Accounting Standards Board.
The directors have been given the declarations by the Managing Director and Chief Financial Officer required by section 295A of the Corporations Act 2001.
This declaration is made in accordance with a resolution of the directors.
I SinghDirector
Sydney, 27 August 2015
D IRECTORS ’ DEC LARAT ION
For
per
sona
l use
onl
y

A N N U A L R E P O R T 2 0 1 5 F I D U C I A N G R O U P L I M I T E D A C N 6 0 2 4 2 3 6 1 0 P A G E 7 1
For
per
sona
l use
onl
y

P A G E 7 2 F I D U C I A N G R O U P L I M I T E D A C N 6 0 2 4 2 3 6 1 0 A N N U A L R E P O R T 2 0 1 5
For
per
sona
l use
onl
y

A N N U A L R E P O R T 2 0 1 5 F I D U C I A N G R O U P L I M I T E D A C N 6 0 2 4 2 3 6 1 0 P A G E 7 3
This page has been left blank intentionally
For
per
sona
l use
onl
y