annualreport abvariableproducts … · investment products offered ‰ are not fdic insured ‰ may...
TRANSCRIPT

DEC 12.31.17
ANNUAL REPORT
AB VARIABLE PRODUCTSSERIES FUND, INC.
+GROWTH PORTFOLIO

Investment Products Offered
‰ Are Not FDIC Insured‰ May Lose Value‰ Are Not Bank Guaranteed
AllianceBernstein Investments, Inc. (ABI) is the distributor of the AB family of mutual funds.ABI is a member of FINRA and is an affiliate of AllianceBernstein L.P., the Adviser of the funds.
You may obtain a description of the Fund’s proxy voting policies and procedures, andinformation regarding how the Fund voted proxies relating to portfolio securities during themost recent 12-month period ended June 30, without charge. Simply visit AB’s website atwww.abfunds.com or go to the Securities and Exchange Commission’s (the “Commission”)website at www.sec.gov, or call AB at (800) 227 4618.
The Fund files its complete schedule of portfolio holdings with the Commission for the first andthird quarters of each fiscal year on Form N-Q. The Fund’s Forms N-Q are available on theCommission’s website at www.sec.gov. The Fund’s Forms N-Q may also be reviewed andcopied at the Commission’s Public Reference Room in Washington, DC; information on theoperation of the Public Reference Room may be obtained by calling (800) SEC 0330.
The [A/B] logo is a registered service mark of AllianceBernstein and AllianceBernstein® is aregistered service mark used by permission of the owner, AllianceBernstein L.P.

GROWTH PORTFOLIO AB Variable Products Series Fund
LETTER TO INVESTORS
February 14, 2018
The following is an update of AB Variable Products SeriesFund—Growth Portfolio (the “Portfolio”) for the annualreporting period ended December 31, 2017.
INVESTMENT OBJECTIVE AND POLICIESThe Portfolio’s investment objective is long-term growthof capital. The Portfolio invests primarily in a domesticportfolio of equity securities of companies selected by theAdviser for their growth potential within various marketsectors. The Adviser looks for companies that haveexperienced management teams, strong market positionsand the potential to deliver greater-than-expected earningsgrowth rates.
In managing the Portfolio, the Adviser allocates invest-ments among broad sector groups and selects specificinvestments based on the fundamental company researchconducted by the Adviser’s internal research staff, assess-ing the current and forecasted investment opportunities andconditions, as well as diversification and risk consid-erations. The Adviser’s research focus is on companieswith high sustainable growth prospects, high or improvingreturn on invested capital, transparent business models andclear competitive advantages.
The Portfolio has the flexibility to invest across the capital-ization spectrum. The Portfolio is designed for those seek-ing exposure to companies of various sizes, and typicallyhas substantial investments in both large-capitalizationcompanies and mid-capitalization companies, and mayalso invest in small-capitalization companies.
The Portfolio may enter into derivatives transactions, suchas options, futures contracts, forwards and swaps. ThePortfolio may use options strategies involving the purchaseand/or writing of various combinations of call and/or putoptions, including on individual securities and stockindices, futures contracts (including futures contracts onindividual securities and stock indices) or shares ofexchange-traded funds. These transactions may be used,for example, in an effort to earn extra income, to adjustexposure to individual securities or markets, or to protectall or a portion of the Portfolio’s portfolio from a decline invalue.
INVESTMENT RESULTSThe table on page 3 shows the Portfolio’s performancecompared to its benchmark, the Russell 3000 GrowthIndex, for the one-, five- and 10-year periods endedDecember 31, 2017.
All share classes of the Portfolio outperformed the bench-mark for the annual period. Stock selection in theconsumer staples, technology, health care and industrialssectors, as well as an overweight position in technologyand underweight positions in real estate and tele-communications, were the primary contributors toperformance relative to the benchmark. Stock selection inthe consumer discretionary and materials sectors as well asan overweight position in health care detracted.
The Portfolio did not utilize derivatives during the annualperiod.
MARKET REVIEW AND INVESTMENT STRATEGYThe annual period ended December 31, 2017 marked oneof the strongest years for global stock market performancesince the 2008 financial crisis. Emerging-market equitiesoutperformed, followed by non-US stocks. Large-capstocks outperformed their small-cap peers, and growthoutperformed value, in terms of style.
Equity performance was driven by strong economic data,synchronized global growth and robust corporate earnings.Investor enthusiasm was tempered early in the period byquestions around the timeliness of the Trump admin-istration’s pro-growth agenda and concerns regarding theelection cycle in Europe. Geopolitical tensions and a sig-nificant decline in the price of oil weighed on the marketmidperiod. However, global growth trends proved strongand oil rallied back to two-and-a-half-year highs, pushingstocks higher, especially in emerging markets. InDecember, tax reform was passed in the US Congress,buoying market sentiment globally.
The Portfolio’s Senior Investment Management Team (the“Team”) continues to select companies that are likely to berewarded for offering high profitability, attractivereinvestment opportunities and sustainable competitiveadvantages. The Team believes that this strategy can bebeneficial in an environment which offers lower growthand that still appears favorable for stock pickers, asinvestors increasingly reward companies for their funda-mental strengths.
1

GROWTH PORTFOLIODISCLOSURES AND RISKS AB Variable Products Series Fund
Benchmark DisclosureThe Russell 3000® Growth Index is unmanaged and does not reflect fees and expenses associated with the activemanagement of a mutual fund portfolio. The Russell 3000 Growth Index represents the performance of 3,000 growthcompanies within the US. An investor cannot invest directly in an index, and its results are not indicative of the performancefor any specific investment, including the Portfolio.
A Word About RiskMarket Risk: The value of the Portfolio’s assets will fluctuate as the stock or bond market fluctuates. The value of itsinvestments may decline, sometimes rapidly and unpredictably, simply because of economic changes or other events thataffect large portions of the market. It includes the risk that a particular style of investing, such as growth, may underperformthe market generally.
Capitalization Risk: Investments in small- and mid-capitalization companies may be more volatile than investments inlarge-capitalization companies. Investments in small-capitalization companies may have additional risks because thesecompanies have limited product lines, markets or financial resources.
Derivatives Risk: Derivatives may be illiquid, difficult to price, and leveraged so that small changes may producedisproportionate losses for the Portfolio, and may be subject to counterparty risk to a greater degree than more traditionalinvestments.
Focused Portfolio Risk: Investments in a limited number of companies may have more risk because changes in the value ofa single security may have a more significant effect, either negative or positive, on the Portfolio’s net asset value (“NAV”).
Management Risk: The Portfolio is subject to management risk because it is an actively managed investment fund. TheAdviser will apply its investment techniques and risk analyses in making investment decisions for the Portfolio, but there isno guarantee that its techniques will produce the intended results.
These risks are fully discussed in the Variable Products prospectus. As with all investments, you may lose money by inves-ting in the Portfolio.
An Important Note About Historical PerformanceThe investment return and principal value of an investment in the Portfolio will fluctuate, so that shares, whenredeemed, may be worth more or less than their original cost. Performance shown in this report represents pastperformance and does not guarantee future results. Current performance may be lower or higher than theperformance information shown. Please contact your Financial Advisor or Insurance Agent Representative at yourfinancial institution to obtain portfolio performance information current to the most recent month end.
Investors should consider the investment objectives, risks, charges and expenses of the Portfolio carefully beforeinvesting. For additional copies of the Portfolio’s prospectus or summary prospectus, which contains this and otherinformation, call your financial advisor or (800) 227 4618. Please read the prospectus and/or summary prospectuscarefully before investing.
All fees and expenses related to the operation of the Portfolio have been deducted, but no adjustment has been madefor insurance company separate account or annuity contract charges, which would reduce total return to a contractowner. Performance assumes reinvestment of distributions and does not account for taxes.
There are additional fees and expenses associated with all Variable Products. These fees can include mortality andexpense risk charges, administrative charges, and other charges that can significantly reduce investment returns.Those fees and expenses are not reflected in this annual report. You should consult your Variable Products pro-spectus for a description of those fees and expenses and speak to your insurance agent or financial representative ifyou have any questions. You should read the prospectus before investing or sending money.
2

GROWTH PORTFOLIOHISTORICAL PERFORMANCE AB Variable Products Series Fund
THE PORTFOLIO VS. ITS BENCHMARK Net Asset Value Returns
PERIODS ENDED DECEMBER 31, 2017 (unaudited) 1 Year 5 Years1 10 Years1
Growth Portfolio Class A2 34.51% 17.63% 8.64%
Growth Portfolio Class B2 34.15% 17.33% 8.36%
Russell 3000 Growth Index 29.59% 17.16% 9.93%1 Average annual returns.
2 Includes the impact of proceeds received and credited to the Portfolio resulting from class action settlements, which enhancedthe performance of all share classes of the Portfolio for the annual period ended December 31, 2017, by 0.11%. Also includesthe impact of proceeds received and credited to the Portfolio in connection with a regulatory settlement, which enhanced per-formance for the annual period ended December 31, 2017, by 0.14%.
Please keep in mind that high, double-digit returns are highly unusual and cannot be sustained. Investors should also beaware that these returns were primarily achieved during favorable market conditions.
The Portfolio’s current prospectus fee table shows the Portfolio’s total annual expense ratios as 1.15% and 1.40% forClass A and Class B shares, respectively. The Financial Highlights section of this report sets forth expense ratio datafor the current reporting period; the expense ratios shown above may differ from the expense ratios in the FinancialHighlights section since they are based on different time periods.
GROWTH PORTFOLIO CLASS AGROWTH OF A $10,000 INVESTMENT12/31/2007 TO 12/31/2017 (unaudited)
$4,000
$10,000
$12,000
$14,000
$16,000
$22,000
$20,000
$18,000
$26,000
Russell 3000 Growth Index
Growth Portfolio Class A
12/31/1612/31/1512/31/1412/31/1312/31/1212/31/1112/31/10 12/31/1712/31/0912/31/0812/31/07
Russell 3000Growth Index:$25,781
Growth PortfolioClass A: $22,896
$24,000
$8,000
$6,000
This chart illustrates the total value of an assumed $10,000 investment in the Growth Portfolio Class A shares (from12/31/2007 to 12/31/2017) as compared to the performance of the Portfolio’s benchmark. The chart assumes the reinvest-ment of dividends and capital gains distributions.
See Disclosures, Risks and Note about Historical Performance on page 2.
3

GROWTH PORTFOLIOEXPENSE EXAMPLE (unaudited) AB Variable Products Series Fund
As a shareholder of the Fund, you incur two types of costs: (1) transaction costs, including sales charges (loads) on purchasepayments, contingent deferred sales charges on redemptions and (2) ongoing costs, including management fees; distribution(12b-1) fees; and other Fund expenses. This example is intended to help you understand your ongoing costs (in dollars) ofinvesting in the Fund and to compare these costs with the ongoing costs of investing in other mutual funds.
The Example is based on an investment of $1,000 invested at the beginning of the period and held for the entire period asindicated below.
Actual ExpensesThe table below provides information about actual account values and actual expenses. You may use the information in thisline, together with the amount you invested, to estimate the expenses that you paid over the period. Simply divide youraccount value by $1,000 (for example, an $8,600 account value divided by $1,000 = 8.6), then multiply the result by thenumber in the first line under the heading entitled “Expenses Paid During Period” to estimate the expenses you paid on youraccount during this period. The estimate of expenses does not include fees or other expenses of any variable insurance prod-uct. If such expenses were included, the estimate of expenses you paid during the period would be higher and your endingaccount value would be lower.
Hypothetical Example for Comparison PurposesThe table below provides information about hypothetical account values and hypothetical expenses based on the Fund’sactual expense ratio and an assumed annual rate of return of 5% before expenses, which is not the Fund’s actual return. Thehypothetical account values and expenses may not be used to estimate the actual ending account balance or expenses youpaid for the period. You may use this information to compare the ongoing costs of investing in the Fund and other funds bycomparing this 5% hypothetical example with the 5% hypothetical examples that appear in the shareholder reports of otherfunds. The estimate of expenses does not include fees or other expenses of any variable insurance product. If such expenseswere included, the estimate of expenses you paid during the period would be higher and your ending account value would belower.
Please note that the expenses shown in the table are meant to highlight your ongoing costs only and do not reflect any transac-tional costs, such as sales charges (loads), or contingent deferred sales charges on redemptions. Therefore, the second line ofeach class’ table is useful in comparing ongoing costs only, and will not help you determine the relative total costs of owningdifferent funds. In addition, if these transactional costs were included, your costs would have been higher.
BeginningAccount Value
July 1, 2017
EndingAccount Value
December 31, 2017Expenses PaidDuring Period*
AnnualizedExpense Ratio*
Class AActual . . . . . . . . . . . . . . . . . . . . . . . . . . . . . . . . . . . . . . . . . . . . . . . . . . . . . $ 1,000 $ 1,136.80 $ 5.87 1.09%Hypothetical (5% annual return before expenses) . . . . . . . $ 1,000 $ 1,019.71 $ 5.55 1.09%
Class BActual . . . . . . . . . . . . . . . . . . . . . . . . . . . . . . . . . . . . . . . . . . . . . . . . . . . . . $ 1,000 $ 1,135.00 $ 7.26 1.35%Hypothetical (5% annual return before expenses) . . . . . . . $ 1,000 $ 1,018.40 $ 6.87 1.35%
* Expenses are equal to each classes’ annualized expense ratios, multiplied by the average account value over the period, multiplied by184/365 (to reflect the one-half year period).
4

GROWTH PORTFOLIOTEN LARGEST HOLDINGS1
December 31, 2017 (unaudited) AB Variable Products Series Fund
COMPANY U.S. $ VALUE PERCENT OF NET ASSETSAlphabet, Inc.—Class C $ 5,352,336 7.6%Facebook, Inc.—Class A 4,058,051 5.8Visa, Inc.—Class A 3,302,019 4.7UnitedHealth Group, Inc. 3,008,838 4.3Biogen, Inc. 2,690,005 3.8Costco Wholesale Corp. 2,601,027 3.7Edwards Lifesciences Corp. 2,444,680 3.5Home Depot, Inc. (The) 2,344,297 3.3Constellation Brands, Inc.—Class A 2,310,843 3.3Adobe Systems, Inc. 2,297,397 3.3
$30,409,493 43.3%
SECTOR BREAKDOWN2
December 31, 2017 (unaudited)
SECTOR U.S. $ VALUE PERCENT OF TOTAL INVESTMENTSInformation Technology $24,657,941 35.1%Health Care 14,365,500 20.5Consumer Discretionary 12,042,640 17.1Consumer Staples 7,792,287 11.1Industrials 6,797,555 9.7Financials 2,120,849 3.0Materials 2,047,491 2.9Short-Term Investments 431,503 0.6Total Investments $70,255,766 100.0%
1 Long-term investments.
2 The Portfolio’s sector breakdown is expressed as a percentage of total investments (excluding security lending collateral) and mayvary over time.
Please note: The sector classifications presented herein are based on the Global Industry Classification Standard (GICS) which wasdeveloped by Morgan Stanley Capital International and Standard & Poor’s. The components are divided into sector, industry group,and industry sub-indices as classified by the GICS for each of the market capitalization indices in the broad market. These sectorclassifications are broadly defined. The “Portfolio of Investments” section of the report reflects more specific industry informationand is consistent with the investment restrictions discussed in the Portfolio’s prospectus.
5

GROWTH PORTFOLIOPORTFOLIO OF INVESTMENTSDecember 31, 2017 AB Variable Products Series Fund
Company Shares U.S. $ Value
COMMON STOCKS–99.5%INFORMATION
TECHNOLOGY–35.1%COMMUNICATIONS
EQUIPMENT–0.7%Arista Networks, Inc.(a) . . . . . . . . . . 2,150 $ 506,497
INTERNET SOFTWARE &SERVICES–14.5%
Alphabet, Inc.–Class C(a) . . . . . . . . 5,115 5,352,336Facebook, Inc.–Class A(a) . . . . . . . 22,997 4,058,051Trade Desk, Inc. (The)–
Class A(a)(b) . . . . . . . . . . . . . . . . . . 16,130 737,625
10,148,012
IT SERVICES–6.9%Fiserv, Inc.(a) . . . . . . . . . . . . . . . . . . . . . 4,930 646,471PayPal Holdings, Inc.(a) . . . . . . . . . 12,520 921,722Visa, Inc.–Class A . . . . . . . . . . . . . . . . 28,960 3,302,019
4,870,212
SEMICONDUCTORS &SEMICONDUCTOREQUIPMENT–3.6%
NVIDIA Corp. . . . . . . . . . . . . . . . . . . . 3,120 603,720Xilinx, Inc. . . . . . . . . . . . . . . . . . . . . . . . . 27,970 1,885,737
2,489,457
SOFTWARE–6.8%Adobe Systems, Inc.(a) . . . . . . . . . . . 13,110 2,297,397Electronic Arts, Inc.(a) . . . . . . . . . . . 9,890 1,039,043HubSpot, Inc.(a) . . . . . . . . . . . . . . . . . . 7,980 705,432ServiceNow, Inc.(a) . . . . . . . . . . . . . . 2,567 334,711Splunk, Inc.(a) . . . . . . . . . . . . . . . . . . . . 5,050 418,342
4,794,925
TECHNOLOGY HARDWARE,STORAGE &PERIPHERALS–2.6%
Apple, Inc. . . . . . . . . . . . . . . . . . . . . . . . . 10,925 1,848,838
24,657,941
HEALTH CARE–20.5%BIOTECHNOLOGY–3.8%Biogen, Inc.(a) . . . . . . . . . . . . . . . . . . . . 8,444 2,690,005
HEALTH CARE EQUIPMENT& SUPPLIES–7.3%
Align Technology, Inc.(a) . . . . . . . . 1,623 360,614Edwards Lifesciences Corp.(a) . . 21,690 2,444,680Intuitive Surgical, Inc.(a) . . . . . . . . . 4,232 1,544,426Nevro Corp.(a) . . . . . . . . . . . . . . . . . . . 10,580 730,443
5,080,163
HEALTH CAREPROVIDERS &SERVICES–5.2%
Teladoc, Inc.(a)(b) . . . . . . . . . . . . . . . . 18,329 638,766UnitedHealth Group, Inc. . . . . . . . . 13,648 3,008,838
3,647,604
Company Shares U.S. $ Value
HEALTH CARETECHNOLOGY–1.4%
Cerner Corp.(a) . . . . . . . . . . . . . . . . . . . 14,440 $ 973,112
PHARMACEUTICALS–2.8%Zoetis, Inc. . . . . . . . . . . . . . . . . . . . . . . . . 27,410 1,974,616
14,365,500
CONSUMERDISCRETIONARY–17.2%
DIVERSIFIED CONSUMERSERVICES–3.0%
Bright Horizons FamilySolutions, Inc.(a) . . . . . . . . . . . . . . 12,250 1,151,500
Grand Canyon Education,Inc.(a) . . . . . . . . . . . . . . . . . . . . . . . . . . 10,310 923,054
2,074,554
HOTELS, RESTAURANTS &LEISURE–4.1%
Planet Fitness, Inc.(a) . . . . . . . . . . . . 60,070 2,080,224Starbucks Corp. . . . . . . . . . . . . . . . . . . . 13,380 768,413
2,848,637
INTERNET & DIRECTMARKETINGRETAIL–1.1%
Priceline Group, Inc. (The)(a) . . . . 457 794,147
MULTILINE RETAIL–2.3%Dollar Tree, Inc.(a) . . . . . . . . . . . . . . . 15,150 1,625,747
SPECIALTY RETAIL–5.0%Home Depot, Inc. (The) . . . . . . . . . . 12,369 2,344,297Ulta Salon Cosmetics &
Fragrance, Inc.(a) . . . . . . . . . . . . . . 5,152 1,152,296
3,496,593
TEXTILES, APPAREL &LUXURY GOODS–1.7%
NIKE, Inc.–Class B . . . . . . . . . . . . . . 19,232 1,202,962
12,042,640
CONSUMERSTAPLES–11.1%
BEVERAGES–6.1%Constellation Brands, Inc.–
Class A . . . . . . . . . . . . . . . . . . . . . . . . . 10,110 2,310,843Monster Beverage Corp.(a) . . . . . . 31,238 1,977,053
4,287,896
FOOD & STAPLESRETAILING–3.7%
Costco Wholesale Corp. . . . . . . . . . . 13,975 2,601,027
FOOD PRODUCTS–1.3%Blue Buffalo Pet Products,
Inc.(a) . . . . . . . . . . . . . . . . . . . . . . . . . . 27,550 903,364
7,792,287
INDUSTRIALS–9.7%BUILDING PRODUCTS–2.9%Allegion PLC . . . . . . . . . . . . . . . . . . . . . 9,030 718,427
6

AB Variable Products Series Fund
Company Shares U.S. $ Value
AO Smith Corp. . . . . . . . . . . . . . . . . . . 13,920 $ 853,018Lennox International, Inc. . . . . . . . . 2,220 462,337
2,033,782
COMMERCIAL SERVICES &SUPPLIES–1.9%
Copart, Inc.(a) . . . . . . . . . . . . . . . . . . . . 30,680 1,325,069
INDUSTRIALCONGLOMERATES–1.8%
Roper Technologies, Inc. . . . . . . . . . 4,860 1,258,740
MACHINERY–2.4%IDEX Corp. . . . . . . . . . . . . . . . . . . . . . . . 6,230 822,173WABCO Holdings, Inc.(a) . . . . . . . 5,990 859,565
1,681,738
TRADING COMPANIES &DISTRIBUTORS–0.7%
Fastenal Co. . . . . . . . . . . . . . . . . . . . . . . 9,110 498,226
6,797,555
FINANCIALS–3.0%CAPITAL MARKETS–3.0%MarketAxess Holdings, Inc. . . . . . 5,340 1,077,345S&P Global, Inc. . . . . . . . . . . . . . . . . . 6,160 1,043,504
2,120,849
MATERIALS–2.9%CHEMICALS–2.9%Ecolab, Inc. . . . . . . . . . . . . . . . . . . . . . . . 5,020 673,584PolyOne Corp. . . . . . . . . . . . . . . . . . . . . 19,330 840,855Sherwin-Williams Co. (The) . . . . . 1,300 533,052
2,047,491
Total Common Stocks(cost $44,292,331) . . . . . . . . . . . . . 69,824,263
PrincipalAmount
(000)
SHORT-TERMINVESTMENTS–0.6%
TIME DEPOSIT–0.6%State Street Bank & Trust Co.
0.12%, 1/02/18(cost $431,503) . . . . . . . . . . . . . . . . $ 432 431,503
Total Investments BeforeSecurity Lending Collateralfor Securities Loaned–100.1%(cost $44,723,834) . . . . . . . . . . . . 70,255,766
Company Shares U.S. $ Value
INVESTMENTS OF CASHCOLLATERAL FORSECURITIESLOANED–1.6%
INVESTMENTCOMPANIES–1.6%
AB Fixed Income Shares, Inc.–Government Money MarketPortfolio–Class AB,1.12%(c)(d)(e)(cost $1,100,714) . . . . . . . . . . . . . . 1,100,714 $ 1,100,714
TOTALINVESTMENTS–101.7%(cost $45,824,548) . . . . . . . . . . . . 71,356,480
Other assets lessliabilities–(1.7)% . . . . . . . . . . . . . . (1,180,190)
NET ASSETS–100.0% . . . . . . . . . $ 70,176,290
(a) Non-income producing security.
(b) Represents entire or partial securities out on loan. See Note Efor securities lending information.
(c) Affiliated investments.
(d) The rate shown represents the 7-day yield as of period end.
(e) To obtain a copy of the fund’s shareholder report, please goto the Securities and Exchange Commission’s website atwww.sec.gov, or call AB at (800) 227-4618.
See notes to financial statements.
7

GROWTH PORTFOLIOSTATEMENT OF ASSETS & LIABILITIESDecember 31, 2017 AB Variable Products Series Fund
ASSETSInvestments in securities, at value
Unaffiliated issuers (cost $44,723,834) . . . . . . . . . . . . . . . . . . . . . . . . . . . . . . . . . . . . . . . . . . . . . . . . . . . . . . . . . . . . . . . . . . . . . $70,255,766(a)Affiliated issuers (cost $1,100,714—investment of cash collateral for securities loaned) . . . . . . . . . . . . . . . . . . 1,100,714
Receivable for investment securities sold . . . . . . . . . . . . . . . . . . . . . . . . . . . . . . . . . . . . . . . . . . . . . . . . . . . . . . . . . . . . . . . . . . . . . . 235,824Receivable from regulatory settlement . . . . . . . . . . . . . . . . . . . . . . . . . . . . . . . . . . . . . . . . . . . . . . . . . . . . . . . . . . . . . . . . . . . . . . . . . 102,075Receivable for capital stock sold . . . . . . . . . . . . . . . . . . . . . . . . . . . . . . . . . . . . . . . . . . . . . . . . . . . . . . . . . . . . . . . . . . . . . . . . . . . . . . . 13,706Dividends and interest receivable . . . . . . . . . . . . . . . . . . . . . . . . . . . . . . . . . . . . . . . . . . . . . . . . . . . . . . . . . . . . . . . . . . . . . . . . . . . . . . 11,337
Total assets . . . . . . . . . . . . . . . . . . . . . . . . . . . . . . . . . . . . . . . . . . . . . . . . . . . . . . . . . . . . . . . . . . . . . . . . . . . . . . . . . . . . . . . . . . . . . . . . . . . . . . 71,719,422
LIABILITIESPayable for collateral received on securities loaned . . . . . . . . . . . . . . . . . . . . . . . . . . . . . . . . . . . . . . . . . . . . . . . . . . . . . . . . . . . . 1,100,714Payable for investment securities purchased . . . . . . . . . . . . . . . . . . . . . . . . . . . . . . . . . . . . . . . . . . . . . . . . . . . . . . . . . . . . . . . . . . . 206,954Payable for capital stock redeemed . . . . . . . . . . . . . . . . . . . . . . . . . . . . . . . . . . . . . . . . . . . . . . . . . . . . . . . . . . . . . . . . . . . . . . . . . . . . . 85,021Advisory fee payable . . . . . . . . . . . . . . . . . . . . . . . . . . . . . . . . . . . . . . . . . . . . . . . . . . . . . . . . . . . . . . . . . . . . . . . . . . . . . . . . . . . . . . . . . . . 45,583Administrative fee payable . . . . . . . . . . . . . . . . . . . . . . . . . . . . . . . . . . . . . . . . . . . . . . . . . . . . . . . . . . . . . . . . . . . . . . . . . . . . . . . . . . . . . 13,263Distribution fee payable . . . . . . . . . . . . . . . . . . . . . . . . . . . . . . . . . . . . . . . . . . . . . . . . . . . . . . . . . . . . . . . . . . . . . . . . . . . . . . . . . . . . . . . . 8,786Transfer Agent fee payable . . . . . . . . . . . . . . . . . . . . . . . . . . . . . . . . . . . . . . . . . . . . . . . . . . . . . . . . . . . . . . . . . . . . . . . . . . . . . . . . . . . . . 97Accrued expenses . . . . . . . . . . . . . . . . . . . . . . . . . . . . . . . . . . . . . . . . . . . . . . . . . . . . . . . . . . . . . . . . . . . . . . . . . . . . . . . . . . . . . . . . . . . . . . . 82,714
Total liabilities . . . . . . . . . . . . . . . . . . . . . . . . . . . . . . . . . . . . . . . . . . . . . . . . . . . . . . . . . . . . . . . . . . . . . . . . . . . . . . . . . . . . . . . . . . . . . . . . . . 1,543,132
NET ASSETS . . . . . . . . . . . . . . . . . . . . . . . . . . . . . . . . . . . . . . . . . . . . . . . . . . . . . . . . . . . . . . . . . . . . . . . . . . . . . . . . . . . . . . . . . . . . . . . . . . . . . $70,176,290
COMPOSITION OF NET ASSETSCapital stock, at par . . . . . . . . . . . . . . . . . . . . . . . . . . . . . . . . . . . . . . . . . . . . . . . . . . . . . . . . . . . . . . . . . . . . . . . . . . . . . . . . . . . . . . . . . . . . . $ 2,031Additional paid-in capital . . . . . . . . . . . . . . . . . . . . . . . . . . . . . . . . . . . . . . . . . . . . . . . . . . . . . . . . . . . . . . . . . . . . . . . . . . . . . . . . . . . . . . . 35,484,837Accumulated net realized gain on investment transactions . . . . . . . . . . . . . . . . . . . . . . . . . . . . . . . . . . . . . . . . . . . . . . . . . . . . 9,157,490Net unrealized appreciation on investments . . . . . . . . . . . . . . . . . . . . . . . . . . . . . . . . . . . . . . . . . . . . . . . . . . . . . . . . . . . . . . . . . . . . 25,531,932
$70,176,290
Net Asset Value Per Share—1 billion shares of capital stock authorized, $.001 par value
Class Net AssetsShares
OutstandingNet Asset
Value
A $ 30,230,297 846,183 $ 35.73
B $ 39,945,993 1,185,207 $ 33.70
(a) Includes securities on loan with a value of $1,059,067 (see Note E).
See notes to financial statements.
8

GROWTH PORTFOLIOSTATEMENT OF OPERATIONSYear Ended December 31, 2017 AB Variable Products Series Fund
INVESTMENT INCOMEDividends
Unaffiliated issuers . . . . . . . . . . . . . . . . . . . . . . . . . . . . . . . . . . . . . . . . . . . . . . . . . . . . . . . . . . . . . . . . . . . . . . . . . . . . . . . . . . . . . . . . . . $ 361,745Affiliated issuers . . . . . . . . . . . . . . . . . . . . . . . . . . . . . . . . . . . . . . . . . . . . . . . . . . . . . . . . . . . . . . . . . . . . . . . . . . . . . . . . . . . . . . . . . . . . . 3,458
Interest . . . . . . . . . . . . . . . . . . . . . . . . . . . . . . . . . . . . . . . . . . . . . . . . . . . . . . . . . . . . . . . . . . . . . . . . . . . . . . . . . . . . . . . . . . . . . . . . . . . . . . . . . . 2,850Other income . . . . . . . . . . . . . . . . . . . . . . . . . . . . . . . . . . . . . . . . . . . . . . . . . . . . . . . . . . . . . . . . . . . . . . . . . . . . . . . . . . . . . . . . . . . . . . . . . . . 1,661
369,714
EXPENSESAdvisory fee (see Note B) . . . . . . . . . . . . . . . . . . . . . . . . . . . . . . . . . . . . . . . . . . . . . . . . . . . . . . . . . . . . . . . . . . . . . . . . . . . . . . . . . . . . . . 505,249Distribution fee—Class B . . . . . . . . . . . . . . . . . . . . . . . . . . . . . . . . . . . . . . . . . . . . . . . . . . . . . . . . . . . . . . . . . . . . . . . . . . . . . . . . . . . . . . 100,162Transfer agency—Class A. . . . . . . . . . . . . . . . . . . . . . . . . . . . . . . . . . . . . . . . . . . . . . . . . . . . . . . . . . . . . . . . . . . . . . . . . . . . . . . . . . . . . . 2,492Transfer agency—Class B . . . . . . . . . . . . . . . . . . . . . . . . . . . . . . . . . . . . . . . . . . . . . . . . . . . . . . . . . . . . . . . . . . . . . . . . . . . . . . . . . . . . . . 3,624Custodian . . . . . . . . . . . . . . . . . . . . . . . . . . . . . . . . . . . . . . . . . . . . . . . . . . . . . . . . . . . . . . . . . . . . . . . . . . . . . . . . . . . . . . . . . . . . . . . . . . . . . . . 65,622Administrative . . . . . . . . . . . . . . . . . . . . . . . . . . . . . . . . . . . . . . . . . . . . . . . . . . . . . . . . . . . . . . . . . . . . . . . . . . . . . . . . . . . . . . . . . . . . . . . . . . 52,814Audit and tax. . . . . . . . . . . . . . . . . . . . . . . . . . . . . . . . . . . . . . . . . . . . . . . . . . . . . . . . . . . . . . . . . . . . . . . . . . . . . . . . . . . . . . . . . . . . . . . . . . . . 40,524Directors’ fees . . . . . . . . . . . . . . . . . . . . . . . . . . . . . . . . . . . . . . . . . . . . . . . . . . . . . . . . . . . . . . . . . . . . . . . . . . . . . . . . . . . . . . . . . . . . . . . . . . 28,559Legal . . . . . . . . . . . . . . . . . . . . . . . . . . . . . . . . . . . . . . . . . . . . . . . . . . . . . . . . . . . . . . . . . . . . . . . . . . . . . . . . . . . . . . . . . . . . . . . . . . . . . . . . . . . . 28,117Printing . . . . . . . . . . . . . . . . . . . . . . . . . . . . . . . . . . . . . . . . . . . . . . . . . . . . . . . . . . . . . . . . . . . . . . . . . . . . . . . . . . . . . . . . . . . . . . . . . . . . . . . . . 20,438Miscellaneous . . . . . . . . . . . . . . . . . . . . . . . . . . . . . . . . . . . . . . . . . . . . . . . . . . . . . . . . . . . . . . . . . . . . . . . . . . . . . . . . . . . . . . . . . . . . . . . . . . . 5,299
Total expenses . . . . . . . . . . . . . . . . . . . . . . . . . . . . . . . . . . . . . . . . . . . . . . . . . . . . . . . . . . . . . . . . . . . . . . . . . . . . . . . . . . . . . . . . . . . . . . . . . . 852,900Less: expenses waived and reimbursed by the Adviser (see Note E) . . . . . . . . . . . . . . . . . . . . . . . . . . . . . . . . . . . . . . . . . . (623)
Net expenses . . . . . . . . . . . . . . . . . . . . . . . . . . . . . . . . . . . . . . . . . . . . . . . . . . . . . . . . . . . . . . . . . . . . . . . . . . . . . . . . . . . . . . . . . . . . . . . . . . . . 852,277
Net investment loss . . . . . . . . . . . . . . . . . . . . . . . . . . . . . . . . . . . . . . . . . . . . . . . . . . . . . . . . . . . . . . . . . . . . . . . . . . . . . . . . . . . . . . . . . . . . . (482,563)
REALIZED AND UNREALIZED GAIN ON INVESTMENT TRANSACTIONSNet realized gain on investment transactions . . . . . . . . . . . . . . . . . . . . . . . . . . . . . . . . . . . . . . . . . . . . . . . . . . . . . . . . . . . . . . . . . . . 9,474,239Net change in unrealized appreciation/depreciation of investments . . . . . . . . . . . . . . . . . . . . . . . . . . . . . . . . . . . . . . . . . . . 10,610,044
Net gain on investment transactions . . . . . . . . . . . . . . . . . . . . . . . . . . . . . . . . . . . . . . . . . . . . . . . . . . . . . . . . . . . . . . . . . . . . . . . . . . . . 20,084,283
NET INCREASE IN NET ASSETS FROM OPERATIONS . . . . . . . . . . . . . . . . . . . . . . . . . . . . . . . . . . . . . . . . . . . . . . . . $19,601,720
See notes to financial statements.
9
GROWTH PORTFOLIOSTATEMENT OF CHANGES IN NET ASSETS AB Variable Products Series Fund
Year EndedDecember 31,
2017
Year EndedDecember 31,
2016
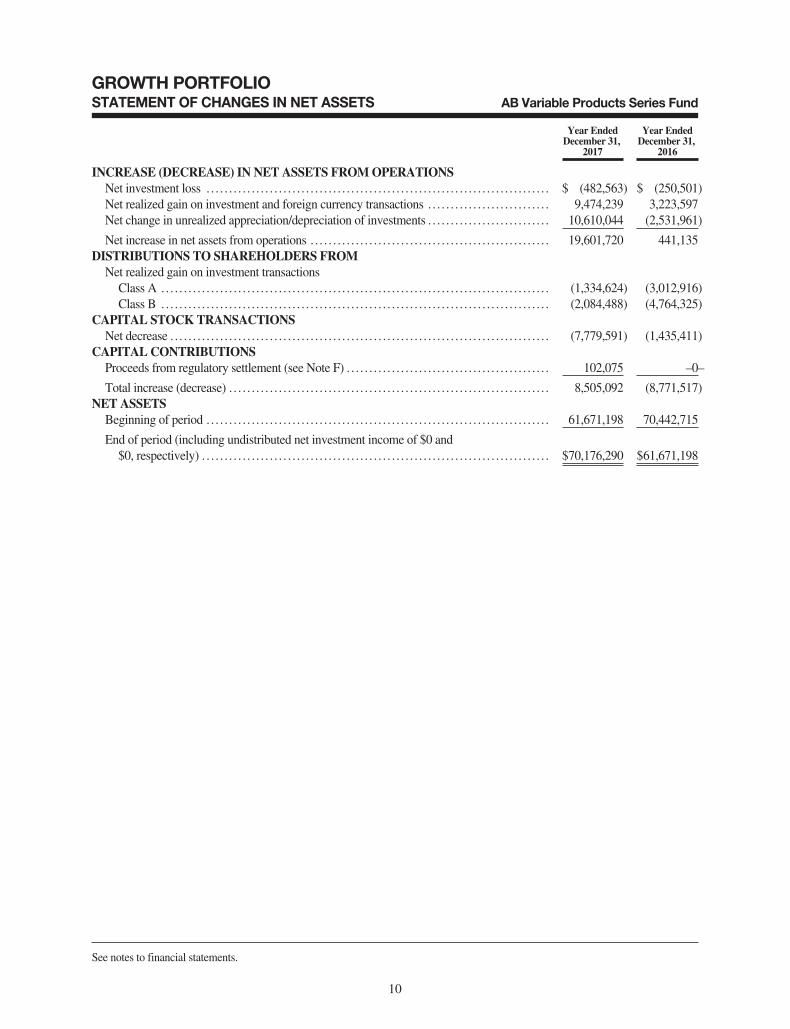
INCREASE (DECREASE) IN NET ASSETS FROM OPERATIONSNet investment loss . . . . . . . . . . . . . . . . . . . . . . . . . . . . . . . . . . . . . . . . . . . . . . . . . . . . . . . . . . . . . . . . . . . . . . . . . . . . $ (482,563) $ (250,501)Net realized gain on investment and foreign currency transactions . . . . . . . . . . . . . . . . . . . . . . . . . . . 9,474,239 3,223,597Net change in unrealized appreciation/depreciation of investments . . . . . . . . . . . . . . . . . . . . . . . . . . . 10,610,044 (2,531,961)
Net increase in net assets from operations . . . . . . . . . . . . . . . . . . . . . . . . . . . . . . . . . . . . . . . . . . . . . . . . . . . . . 19,601,720 441,135DISTRIBUTIONS TO SHAREHOLDERS FROM
Net realized gain on investment transactionsClass A . . . . . . . . . . . . . . . . . . . . . . . . . . . . . . . . . . . . . . . . . . . . . . . . . . . . . . . . . . . . . . . . . . . . . . . . . . . . . . . . . . . . . . (1,334,624) (3,012,916)Class B . . . . . . . . . . . . . . . . . . . . . . . . . . . . . . . . . . . . . . . . . . . . . . . . . . . . . . . . . . . . . . . . . . . . . . . . . . . . . . . . . . . . . . (2,084,488) (4,764,325)
CAPITAL STOCK TRANSACTIONSNet decrease . . . . . . . . . . . . . . . . . . . . . . . . . . . . . . . . . . . . . . . . . . . . . . . . . . . . . . . . . . . . . . . . . . . . . . . . . . . . . . . . . . . . (7,779,591) (1,435,411)
CAPITAL CONTRIBUTIONSProceeds from regulatory settlement (see Note F) . . . . . . . . . . . . . . . . . . . . . . . . . . . . . . . . . . . . . . . . . . . . . 102,075 –0–
Total increase (decrease) . . . . . . . . . . . . . . . . . . . . . . . . . . . . . . . . . . . . . . . . . . . . . . . . . . . . . . . . . . . . . . . . . . . . . . . 8,505,092 (8,771,517)NET ASSETS
Beginning of period . . . . . . . . . . . . . . . . . . . . . . . . . . . . . . . . . . . . . . . . . . . . . . . . . . . . . . . . . . . . . . . . . . . . . . . . . . . . 61,671,198 70,442,715
End of period (including undistributed net investment income of $0 and$0, respectively) . . . . . . . . . . . . . . . . . . . . . . . . . . . . . . . . . . . . . . . . . . . . . . . . . . . . . . . . . . . . . . . . . . . . . . . . . . . . . $70,176,290 $61,671,198
See notes to financial statements.
10

GROWTH PORTFOLIONOTES TO FINANCIAL STATEMENTSDecember 31, 2017 AB Variable Products Series Fund
NOTE A: Significant Accounting PoliciesThe AB Growth Portfolio (the “Portfolio”) is a series of AB Variable Products Series Fund, Inc. (the “Fund”). The Portfo-lio’s investment objective is long-term growth of capital. The Portfolio is diversified as defined under the Investment Com-pany Act of 1940. The Fund was incorporated in the State of Maryland on November 17, 1987, as an open-end seriesinvestment company. The Fund offers fifteen separately managed pools of assets which have differing investment objectivesand policies. The Portfolio offers Class A and Class B shares. Both classes of shares have identical voting, dividend,liquidating and other rights, except that Class B shares bear a distribution expense and have exclusive voting rights withrespect to the Class B distribution plan.
The Portfolio offers and sells its shares only to separate accounts of certain life insurance companies for the purpose of fund-ing variable annuity contracts and variable life insurance policies. Sales are made without a sales charge at the Portfolio’s netasset value per share.
The financial statements have been prepared in conformity with U.S. generally accepted accounting principles (“U.S.GAAP”) which require management to make certain estimates and assumptions that affect the reported amounts of assetsand liabilities in the financial statements and amounts of income and expenses during the reporting period. Actual resultscould differ from those estimates. Each Portfolio is an investment company under U.S. GAAP and follows the accountingand reporting guidance applicable to investment companies. The following is a summary of significant accounting policiesfollowed by the Portfolio.
1. Security ValuationPortfolio securities are valued at their current market value determined on the basis of market quotations or, if market quota-tions are not readily available or are deemed unreliable, at “fair value” as determined in accordance with procedures estab-lished by and under the general supervision of the Fund’s Board of Directors (the “Board”).
In general, the market values of securities which are readily available and deemed reliable are determined as follows: secu-rities listed on a national securities exchange (other than securities listed on the NASDAQ Stock Market, Inc.(“NASDAQ”)) or on a foreign securities exchange are valued at the last sale price at the close of the exchange or foreignsecurities exchange. If there has been no sale on such day, the securities are valued at the last traded price from the previousday. Securities listed on more than one exchange are valued by reference to the principal exchange on which the securitiesare traded; securities listed only on NASDAQ are valued in accordance with the NASDAQ Official Closing Price; listed orover the counter (“OTC”) market put or call options are valued at the mid level between the current bid and ask prices. Ifeither a current bid or current ask price is unavailable, AllianceBernstein L.P. (the “Adviser”) will have discretion todetermine the best valuation (e.g., last trade price in the case of listed options); open futures are valued using the closing set-tlement price or, in the absence of such a price, the most recent quoted bid price. If there are no quotations available for theday of valuation, the last available closing settlement price is used; U.S. Government securities and any other debt instru-ments having 60 days or less remaining until maturity are generally valued at market by an independent pricing vendor, if amarket price is available. If a market price is not available, the securities are valued at amortized cost. This methodology iscommonly used for short term securities that have an original maturity of 60 days or less, as well as short term securities thathad an original term to maturity that exceeded 60 days. In instances when amortized cost is utilized, the Valuation Commit-tee (the “Committee”) must reasonably conclude that the utilization of amortized cost is approximately the same as the fairvalue of the security. Such factors the Committee will consider include, but are not limited to, an impairment of the cred-itworthiness of the issuer or material changes in interest rates. Fixed-income securities, including mortgage-backed andasset-backed securities, may be valued on the basis of prices provided by a pricing service or at a price obtained from one ormore of the major broker-dealers. In cases where broker-dealer quotes are obtained, the Adviser may establish procedureswhereby changes in market yields or spreads are used to adjust, on a daily basis, a recently obtained quoted price on a secu-rity. Swaps and other derivatives are valued daily, primarily using independent pricing services, independent pricing modelsusing market inputs, as well as third party broker-dealers or counterparties. Open end mutual funds are valued at the closingnet asset value per share, while exchange traded funds are valued at the closing market price per share.
Securities for which market quotations are not readily available (including restricted securities) or are deemed unreliable arevalued at fair value as deemed appropriate by the Adviser. Factors considered in making this determination may include, butare not limited to, information obtained by contacting the issuer, analysts, analysis of the issuer’s financial statements orother available documents. In addition, the Portfolio may use fair value pricing for securities primarily traded in non-U.S.markets because most foreign markets close well before the Portfolio values its securities at 4:00 p.m., Eastern Time. The
11

GROWTH PORTFOLIONOTES TO FINANCIAL STATEMENTS(continued) AB Variable Products Series Fund
earlier close of these foreign markets gives rise to the possibility that significant events, including broad market moves, mayhave occurred in the interim and may materially affect the value of those securities. To account for this, the Portfolio gen-erally values many of its foreign equity securities using fair value prices based on third party vendor modeling tools to theextent available.
2. Fair Value MeasurementsIn accordance with U.S. GAAP regarding fair value measurements, fair value is defined as the price that the Portfolio wouldreceive to sell an asset or pay to transfer a liability in an orderly transaction between market participants at the measurementdate. U.S. GAAP establishes a framework for measuring fair value, and a three-level hierarchy for fair value measurementsbased upon the transparency of inputs to the valuation of an asset or liability (including those valued based on their marketvalues as described in Note A.1 above). Inputs may be observable or unobservable and refer broadly to the assumptions thatmarket participants would use in pricing the asset or liability. Observable inputs reflect the assumptions market participantswould use in pricing the asset or liability based on market data obtained from sources independent of the Portfolio.Unobservable inputs reflect the Portfolio’s own assumptions about the assumptions that market participants would use inpricing the asset or liability based on the best information available in the circumstances. Each investment is assigned a levelbased upon the observability of the inputs which are significant to the overall valuation. The three-tier hierarchy of inputs issummarized below.
• Level 1—quoted prices in active markets for identical investments• Level 2—other significant observable inputs (including quoted prices for similar investments, interest rates,
prepayment speeds, credit risk, etc.)• Level 3—significant unobservable inputs (including the Portfolio’s own assumptions in determining the fair value of
investments)
Where readily available market prices or relevant bid prices are not available for certain equity investments, such invest-ments may be valued based on similar publicly traded investments, movements in relevant indices since last available pricesor based upon underlying company fundamentals and comparable company data (such as multiples to earnings or othermultiples to equity). Where an investment is valued using an observable input, such as another publicly traded security, theinvestment will be classified as Level 2. If management determines that an adjustment is appropriate based on restrictions onresale, illiquidity or uncertainty, and such adjustment is a significant component of the valuation, the investment will beclassified as Level 3. An investment will also be classified as Level 3 where management uses company fundamentals andother significant inputs to determine the valuation.
The following table summarizes the valuation of the Portfolio’s investments by the above fair value hierarchy levels as ofDecember 31, 2017:
Level 1 Level 2 Level 3 Total
Investments in Securities:Assets:Common Stocks(a) . . . . . . . . . . . . . . . . . . . . . . . . . . . . . . . . . . . . . . . $69,824,263 $ –0– $ –0– $69,824,263Short-Term Investments . . . . . . . . . . . . . . . . . . . . . . . . . . . . . . . . . –0– 431,503 –0– 431,503Investments of Cash Collateral for Securities Loaned in
Affiliated Money Market Fund . . . . . . . . . . . . . . . . . . . . . . . 1,100,714 –0– –0– 1,100,714
Total Investments in Securities . . . . . . . . . . . . . . . . . . . . . . . . 70,924,977 431,503 –0– 71,356,480Other Financial Instruments(b) . . . . . . . . . . . . . . . . . . . . . . . –0– –0– –0– –0–
Total(c) . . . . . . . . . . . . . . . . . . . . . . . . . . . . . . . . . . . . . . . . . . . . . . . . . . . $70,924,977 $431,503 $ –0– $71,356,480
(a) See Portfolio of Investments for sector classifications.
(b) Other financial instruments are derivative instruments, such as futures, forwards and swaps, which are valued at the unrealizedappreciation/(depreciation) on the instrument. Other financial instruments may also include swaps with upfront premiums, optionswritten and swaptions written which are valued at market value.
(c) There were no transfers between any levels during the reporting period.
The Portfolio recognizes all transfers between levels of the fair value hierarchy assuming the financial instruments were trans-ferred at the beginning of the reporting period.
12

AB Variable Products Series Fund
The Adviser established the Committee to oversee the pricing and valuation of all securities held in the Portfolio. TheCommittee operates under pricing and valuation policies and procedures established by the Adviser and approved by theBoard, including pricing policies which set forth the mechanisms and processes to be employed on a daily basis to imple-ment these policies and procedures. In particular, the pricing policies describe how to determine market quotations for secu-rities and other instruments. The Committee’s responsibilities include: 1) fair value and liquidity determinations (andoversight of any third parties to whom any responsibility for fair value and liquidity determinations is delegated), and 2)regular monitoring of the Adviser’s pricing and valuation policies and procedures and modification or enhancement of thesepolicies and procedures (or recommendation of the modification of these policies and procedures) as the Committee believesappropriate.
The Committee is also responsible for monitoring the implementation of the pricing policies by the Adviser’s Pricing Group(the “Pricing Group”) and any third party which performs certain pricing functions in accordance with the pricing policies.The Pricing Group is responsible for the oversight of the third party on a day-to-day basis. The Committee and the PricingGroup perform a series of activities to provide reasonable assurance of the accuracy of prices including: 1) periodic vendordue diligence meetings, review of methodologies, new developments and processes at vendors, 2) daily comparison of secu-rity valuation versus prior day for all securities that exceeded established thresholds, and 3) daily review of unpriced, stale,and variance reports with exceptions reviewed by senior management and the Committee.
In addition, several processes outside of the pricing process are used to monitor valuation issues including: 1) performanceand performance attribution reports are monitored for anomalous impacts based upon benchmark performance, and 2)portfolio managers review all portfolios for performance and analytics (which are generated using the Adviser’s prices).
3. Currency TranslationAssets and liabilities denominated in foreign currencies and commitments under forward currency exchange contracts aretranslated into U.S. dollars at the mean of the quoted bid and ask prices of such currencies against the U.S. dollar. Purchasesand sales of portfolio securities are translated into U.S. dollars at the rates of exchange prevailing when such securities wereacquired or sold. Income and expenses are translated into U.S. dollars at rates of exchange prevailing when accrued.
Net realized gain or loss on foreign currency transactions represents foreign exchange gains and losses from sales and matur-ities of foreign fixed income investments, holding of foreign currencies, currency gains or losses realized between the tradeand settlement dates on foreign investment transactions, and the difference between the amounts of dividends, interest andforeign withholding taxes recorded on the Portfolio’s books and the U.S. dollar equivalent amounts actually received or paid.Net unrealized currency gains and losses from valuing foreign currency denominated assets and liabilities at period endexchange rates are reflected as a component of net unrealized appreciation or depreciation of foreign currency denominatedassets and liabilities.
4. TaxesIt is the Portfolio’s policy to meet the requirements of the Internal Revenue Code applicable to regulated investment compa-nies and to distribute all of its investment company taxable income and net realized gains, if any, to shareholders. Therefore,no provisions for federal income or excise taxes are required. The Portfolio may be subject to taxes imposed by countries inwhich it invests. Such taxes are generally based on income and/or capital gains earned or repatriated. Taxes are accrued andapplied to net investment income, net realized gains and net unrealized appreciation/depreciation as such income and/orgains are earned.
In accordance with U.S. GAAP requirements regarding accounting for uncertainties in income taxes, management has ana-lyzed the Portfolio’s tax positions taken or expected to be taken on federal and state income tax returns for all open tax years(the current and the prior three tax years) and has concluded that no provision for income tax is required in the Portfolio’sfinancial statements.
5. Investment Income and Investment TransactionsDividend income is recorded on the ex-dividend date or as soon as the Portfolio is informed of the dividend. Interest incomeis accrued daily. Investment transactions are accounted for on the date the securities are purchased or sold. Investment gainsor losses are determined on the identified cost basis. The Portfolio amortizes premiums and accretes discounts as adjust-ments to interest income.
13

GROWTH PORTFOLIONOTES TO FINANCIAL STATEMENTS(continued) AB Variable Products Series Fund
6. Class AllocationsAll income earned and expenses incurred by the Portfolio are borne on a pro-rata basis by each outstanding class of shares,based on the proportionate interest in the Portfolio represented by the net assets of such class, except for class specificexpenses which are allocated to the respective class. Expenses of the Fund are charged proportionately to each portfolio orbased on other appropriate methods. Realized and unrealized gains and losses are allocated among the various share classesbased on respective net assets.
7. Dividends and DistributionsDividends and distributions to shareholders, if any, are recorded on the ex-dividend date. Income dividends and capital gainsdistributions are determined in accordance with federal tax regulations and may differ from those determined in accordancewith U.S. GAAP. To the extent these differences are permanent, such amounts are reclassified within the capital accountsbased on their federal tax basis treatment; temporary differences do not require such reclassification.
NOTE B: Advisory Fee and Other Transactions with AffiliatesUnder the terms of the investment advisory agreement, the Portfolio pays the Adviser an advisory fee at an annual rate of.75% of the first $2.5 billion, .65% of the next $2.5 billion and .60% in excess of $5 billion, of the Portfolio’s average dailynet assets. The fee is accrued daily and paid monthly.
Pursuant to the investment advisory agreement, the Portfolio may reimburse the Adviser for certain legal and accountingservices provided to the Portfolio by the Adviser. For the year ended December 31, 2017, the reimbursement for such serv-ices amounted to $52,814.
The Portfolio compensates AllianceBernstein Investor Services, Inc. (“ABIS”), a wholly-owned subsidiary of the Adviser,under a Transfer Agency Agreement for providing personnel and facilities to perform transfer agency services for thePortfolio. Such compensation retained by ABIS amounted to $1,163 for the year ended December 31, 2017.
Brokerage commissions paid on investment transactions for the year ended December 31, 2017 amounted to $11,336, ofwhich $13 and $0, respectively, was paid to Sanford C. Bernstein & Co. LLC and Sanford C. Bernstein Limited, affiliates ofthe Adviser.
NOTE C: Distribution PlanThe Portfolio has adopted a Distribution Plan (the “Plan”) for Class B shares pursuant to Rule 12b-1 under the InvestmentCompany Act of 1940. Under the Plan, the Portfolio pays distribution and servicing fees to AllianceBernstein Investments,Inc. (the “Distributor”), a wholly-owned subsidiary of the Adviser, at an annual rate of up to .50% of the Portfolio’s averagedaily net assets attributable to Class B shares. The fees are accrued daily and paid monthly. The Board currently limitspayments under the Plan to .25% of the Portfolio’s average daily net assets attributable to Class B shares. The Plan providesthat the Distributor will use such payments in their entirety for distribution assistance and promotional activities.
The Portfolio is not obligated under the Plan to pay any distribution and servicing fees in excess of the amounts set forthabove. The purpose of the payments to the Distributor under the Plan is to compensate the Distributor for its distributionservices with respect to the sale of the Portfolio’s Class B shares. Since the Distributor’s compensation is not directly tied toits expenses, the amount of compensation received by it under the Plan during any year may be more or less than its actualexpenses. For this reason, the Plan is characterized by the staff of the Securities and Exchange Commission as being of the“compensation” variety.
In the event that the Plan is terminated or not continued, no distribution or servicing fees (other than current amounts accruedbut not yet paid) would be owed by the Portfolio to the Distributor.
The Plan also provides that the Adviser may use its own resources to finance the distribution of the Portfolio’s shares.
NOTE D: Investment TransactionsPurchases and sales of investment securities (excluding short-term investments) for the year ended December 31, 2017 wereas follows:
Purchases Sales
Investment securities (excluding U.S. government securities) . . . . . . . . . . . . . . . . . . . . . . . . . . . . . . . . $27,288,819 $38,723,387U.S. government securities . . . . . . . . . . . . . . . . . . . . . . . . . . . . . . . . . . . . . . . . . . . . . . . . . . . . . . . . . . . . . . . . . . . . . –0– –0–
14

AB Variable Products Series Fund
The cost of investments for federal income tax purposes, gross unrealized appreciation and unrealized depreciation are asfollows:
Cost . . . . . . . . . . . . . . . . . . . . . . . . . . . . . . . . . . . . . . . . . . . . . . . . . . . . . . . . . . . . . . . . . . . . . . . . . . . . . . . . . . . . . . . . . . . . . . . . . . . . . . . . . . . . . . . . $45,897,573
Gross unrealized appreciation . . . . . . . . . . . . . . . . . . . . . . . . . . . . . . . . . . . . . . . . . . . . . . . . . . . . . . . . . . . . . . . . . . . . . . . . . . . . . . . . . . . . . $25,726,915Gross unrealized depreciation . . . . . . . . . . . . . . . . . . . . . . . . . . . . . . . . . . . . . . . . . . . . . . . . . . . . . . . . . . . . . . . . . . . . . . . . . . . . . . . . . . . . . (268,008)
Net unrealized appreciation . . . . . . . . . . . . . . . . . . . . . . . . . . . . . . . . . . . . . . . . . . . . . . . . . . . . . . . . . . . . . . . . . . . . . . . . . . . . . . . . . . . . . . . . $25,458,907
1. Derivative Financial InstrumentsThe Portfolio may use derivatives in an effort to earn income and enhance returns, to replace more traditional direct invest-ments, to obtain exposure to otherwise inaccessible markets (collectively, “investment purposes”), or to hedge or adjust therisk profile of its portfolio.
The Portfolio did not engage in derivatives transactions for the year ended December 31, 2017.
2. Currency TransactionsThe Portfolio may invest in non-U.S. Dollar-denominated securities on a currency hedged or unhedged basis. The Portfoliomay seek investment opportunities by taking long or short positions in currencies through the use of currency-relatedderivatives, including forward currency exchange contracts, futures and options on futures, swaps, and other options. ThePortfolio may enter into transactions for investment opportunities when it anticipates that a foreign currency will appreciateor depreciate in value but securities denominated in that currency are not held by the Portfolio and do not present attractiveinvestment opportunities. Such transactions may also be used when the Adviser believes that it may be more efficient than adirect investment in a foreign currency-denominated security. The Portfolio may also conduct currency exchange contractson a spot basis (i.e., for cash at the spot rate prevailing in the currency exchange market for buying or selling currencies).
NOTE E: Securities LendingThe Portfolio may enter into securities lending transactions. Under the Portfolio’s securities lending program, all loans ofsecurities will be collateralized continually by cash. The Portfolio will be compensated for the loan from a portion of the netreturn from the income earned on cash collateral after a rebate is paid to the borrower (in some cases, this rebate may be a“negative rebate” or fee paid by the borrower to the Portfolio in connection with the loan), and payments are made for feesof the securities lending agent and for certain other administrative expenses. It is the policy of the Portfolio to receivecollateral consisting of cash in an amount exceeding the value of the securities loaned. The Portfolio will have the right tocall a loan and obtain the securities loaned at any time on notice to the borrower within the normal and customary settlementtime for the securities. While the securities are on loan, the borrower is obligated to pay the Portfolio amounts equal to anyincome or other distributions from the securities. The Portfolio will not be able to exercise voting rights with respect to anysecurities during the existence of a loan, but will have the right to regain ownership of loaned securities in order to exercisevoting or other ownership rights. The lending agent has agreed to indemnify the Portfolio in the case of default of any secu-rities borrower. Collateral received and securities loaned are marked to market daily to ensure that the securities loaned aresecured by collateral. The lending agent currently invests the cash collateral received in AB Government Money MarketPortfolio, an eligible money market vehicle, in accordance with the investment restrictions of the Portfolio, and as approvedby the Board. The collateral received on securities loaned is recorded as an asset as well as a corresponding liability in thestatement of assets and liabilities. When the Portfolio lends securities, its investment performance will continue to reflectchanges in the value of the securities loaned. At December 31, 2017, the Portfolio had securities on loan with a value of$1,059,067 and had received cash collateral which has been invested into AB Government Money Market Portfolio of$1,100,714. The cash collateral will be adjusted on the next business day to maintain the required collateral amount. ThePortfolio earned securities lending income of $0 and $3,458 from the borrowers and AB Government Money MarketPortfolio, respectively, for the year ended December 31, 2017; these amounts are reflected in the statement of operations. Inconnection with the cash collateral investment by the Portfolio in the AB Government Money Market Portfolio, the Adviserhas agreed to waive a portion of the Portfolio’s share of the advisory fees of AB Government Money Market Portfolio, asborne indirectly by the Portfolio as an acquired fund fee and expense. For the year ended December 31, 2017, such waiveramounted to $623. A principal risk of lending portfolio securities is that the borrower may fail to return the loaned securitiesupon termination of the loan and that the collateral will not be sufficient to replace the loaned securities.
15

GROWTH PORTFOLIONOTES TO FINANCIAL STATEMENTS(continued) AB Variable Products Series Fund
A summary of the Portfolio transactions in shares of AB Government Money Market Portfolio for the year endedDecember 31, 2017 is as follows:
Market Value12/31/16
(000)
Purchasesat Cost(000)
SalesProceeds
(000)
Market Value12/31/17
(000)
$684 $7,544 $7,127 $1,101
NOTE F: Capital StockEach class consists of 500,000,000 authorized shares. Transactions in capital shares for each class were as follows:
SHARES AMOUNTYear Ended
December 31,2017
Year EndedDecember 31,
2016
Year EndedDecember 31,
2017
Year EndedDecember 31,
2016
Class AShares sold . . . . . . . . . . . . . . . . . . . . . . . . . . . . . . . . . . . . . . . . . . . . . . . . . . . . . . . . 85,190 232,533 $ 2,782,413 $ 6,654,909Shares issued in reinvestment of distributions . . . . . . . . . . . . . . . . . . . 42,142 104,073 1,334,624 3,012,916Shares redeemed . . . . . . . . . . . . . . . . . . . . . . . . . . . . . . . . . . . . . . . . . . . . . . . . . . (162,782) (326,387) (5,200,532) (9,201,540)
Net increase (decrease) . . . . . . . . . . . . . . . . . . . . . . . . . . . . . . . . . . . . . . . . . . . (35,450) 10,219 $(1,083,495) $ 466,285
Class BShares sold . . . . . . . . . . . . . . . . . . . . . . . . . . . . . . . . . . . . . . . . . . . . . . . . . . . . . . . . 30,476 46,733 $ 942,367 $ 1,326,261Shares issued in reinvestment of distributions . . . . . . . . . . . . . . . . . . . 69,692 173,311 2,084,488 4,764,325Shares redeemed . . . . . . . . . . . . . . . . . . . . . . . . . . . . . . . . . . . . . . . . . . . . . . . . . . (311,402) (284,346) (9,722,951) (7,992,282)
Net decrease . . . . . . . . . . . . . . . . . . . . . . . . . . . . . . . . . . . . . . . . . . . . . . . . . . . . . . (211,234) (64,302) $(6,696,096) $(1,901,696)
For the year ended December 31, 2017, the Portfolio recorded $102,075 related to a settlement of regulatory proceedings.This amount is presented in the Portfolio’s statement of changes in net assets. Neither the Portfolio nor its affiliates wereinvolved in the proceedings or the calculation of the payment.
At December 31, 2017, certain shareholders of the Portfolio owned 76% in aggregate of the Portfolio’s outstanding shares.Significant transactions by such shareholders, if any, may impact the Portfolio’s performance.
NOTE G: Risks Involved in Investing in the PortfolioCapitalization Risk—Investments in small- and mid-capitalization companies may be more volatile than investments inlarge-capitalization companies. Investments in small-capitalization companies may have additional risks because thesecompanies have limited product lines, markets or financial resources.
Derivatives Risk—The Portfolio may enter into derivative transactions such as forwards, options, futures and swaps.Derivatives may be illiquid, difficult to price, and leveraged so that small changes may produce disproportionate losses forthe Portfolio, and subject to counterparty risk to a greater degree than more traditional investments. Derivatives may result insignificant losses, including losses that are far greater than the value of the derivatives reflected on the statement of assetsand liabilities.
Focused Portfolio Risk—Investments in a limited number of companies may have more risk because changes in the value ofa single security may have a more significant effect, either negative or positive, on the Portfolio’s NAV.
Indemnification Risk—In the ordinary course of business, the Portfolio enters into contracts that contain a variety ofindemnifications. The Portfolio’s maximum exposure under these arrangements is unknown. However, the Portfolio has nothad prior claims or losses pursuant to these indemnification provisions and expects the risk of loss thereunder to be remote.Therefore, the Portfolio has not accrued any liability in connection with these indemnification provisions.
NOTE H: Joint Credit FacilityA number of open-end mutual funds managed by the Adviser, including the Portfolio, participate in a $280 million revolvingcredit facility (the “Facility”) intended to provide short-term financing, if necessary, subject to certain restrictions in con-nection with abnormal redemption activity. Commitment fees related to the Facility are paid by the participating funds andare included in miscellaneous expenses in the statement of operations. The Portfolio did not utilize the Facility during theyear ended December 31, 2017.
16

AB Variable Products Series Fund
NOTE I: Distributions to ShareholdersThe tax character of distributions paid during the fiscal years ended December 31, 2017 and December 31, 2016 were asfollows:
2017 2016
Distributions paid from:Net long-term capital gains . . . . . . . . . . . . . . . . . . . . . . . . . . . . . . . . . . . . . . . . . . . . . . . . . . . . . . . . . . . . . . . . . . . . . . . $3,419,112 7,777,241
Total taxable distributions paid . . . . . . . . . . . . . . . . . . . . . . . . . . . . . . . . . . . . . . . . . . . . . . . . . . . . . . . . . . . . . . . . . . . . . . $3,419,112 $7,777,241
As of December 31, 2017, the components of accumulated earnings/(deficit) on a tax basis were as follows:
Undistributed capital gains . . . . . . . . . . . . . . . . . . . . . . . . . . . . . . . . . . . . . . . . . . . . . . . . . . . . . . . . . . . . . . . . . . . . . . . . . . . . . . . . . . . . . . . . $ 9,230,516Unrealized appreciation/(depreciation) . . . . . . . . . . . . . . . . . . . . . . . . . . . . . . . . . . . . . . . . . . . . . . . . . . . . . . . . . . . . . . . . . . . . . . . . . . . . 25,458,907(a)
Total accumulated earnings/(deficit) . . . . . . . . . . . . . . . . . . . . . . . . . . . . . . . . . . . . . . . . . . . . . . . . . . . . . . . . . . . . . . . . . . . . . . . . . . . . . . $34,689,423
(a) The difference between book-basis and tax-basis unrealized appreciation/(depreciation) is attributable primarily to the tax deferral oflosses on wash sales.
For tax purposes, net realized capital losses may be carried over to offset future capital gains, if any. Funds are permitted tocarry forward capital losses for an indefinite period, and such losses will retain their character as either short-term or long-term capital losses. As of December 31, 2017, the Portfolio did not have any capital loss carryforwards.
During the current fiscal year, permanent differences primarily due to proceeds from a regulatory settlement and the dis-allowance of a net operating loss resulted in a net decrease in distributions in excess of net investment income, a net decreasein accumulated net realized gain on investment transactions, and a net decrease in additional paid-in capital. Thesereclassifications had no effect on net assets.
NOTE J: Subsequent EventManagement has evaluated subsequent events for possible recognition or disclosure in the financial statements through thedate the financial statements are issued. Management has determined that there are no material events that would requiredisclosure in the Portfolio’s financial statements through this date.
17

GROWTH PORTFOLIOFINANCIAL HIGHLIGHTS AB Variable Products Series Fund
Selected Data For A Share Of Capital Stock Outstanding Throughout Each Period
CLASS AYear Ended December 31,
2017 2016 2015 2014 2013
Net asset value, beginning of period . . . . . . . . . . . . . . . . $27.95 $31.05 $34.47 $31.03 $23.22
Income From Investment Operations
Net investment loss (a) . . . . . . . . . . . . . . . . . . . . . . . . . . . . . . (.18)(b) (.07)(b)† (.08) (.09) (.03)Net realized and unrealized gain on investment and
foreign currency transactions . . . . . . . . . . . . . . . . . . . . . 9.61 .54 3.18 4.15 7.92Capital contributions . . . . . . . . . . . . . . . . . . . . . . . . . . . . . . . . .00(c) –0– –0– –0– –0–
Net increase in net asset value from operations . . . . . 9.43 .47 3.10 4.06 7.89
Less: Dividends and Distributions
Dividends from net investment income . . . . . . . . . . . . . –0– –0– –0– –0– (.08)Distributions from net realized gain on investment
transactions . . . . . . . . . . . . . . . . . . . . . . . . . . . . . . . . . . . . . . . (1.65) (3.57) (6.52) (.62) –0–
Total dividends and distributions . . . . . . . . . . . . . . . . . . . (1.65) (3.57) (6.52) (.62) (.08)
Net asset value, end of period . . . . . . . . . . . . . . . . . . . . . . . $35.73 $27.95 $31.05 $34.47 $31.03
Total Return
Total investment return based on netasset value (d)* . . . . . . . . . . . . . . . . . . . . . . . . . . . . . . . . . . . 34.51% 1.12%† 9.06% 13.28% 34.01%
Ratios/Supplemental Data
Net assets, end of period (000’s omitted) . . . . . . . . . . . $30,230 $24,645 $27,060 $28,141 $28,650Ratio to average net assets of:
Expenses, net of waivers/reimbursements . . . . . . . 1.12% 1.15% 1.09% 1.08% 1.06%Expenses, before waivers/reimbursements . . . . . . . 1.12% 1.15% 1.09% 1.08% 1.06%Net investment loss . . . . . . . . . . . . . . . . . . . . . . . . . . . . . . . (.57)%(b) (.23)%(b)† (.24)% (.28)% (.10)%
Portfolio turnover rate . . . . . . . . . . . . . . . . . . . . . . . . . . . . . . . 42% 57% 51% 66% 63%
See footnote summary on page 19.
18

AB Variable Products Series Fund
Selected Data For A Share Of Capital Stock Outstanding Throughout Each Period
CLASS BYear Ended December 31,
2017 2016 2015 2014 2013
Net asset value, beginning of period . . . . . . . . . . . . . . . . $26.51 $29.70 $33.30 $30.08 $22.50
Income From Investment Operations
Net investment loss (a) . . . . . . . . . . . . . . . . . . . . . . . . . . . . . . (.25)(b) (.13)(b)† (.16) (.16) (.09)Net realized and unrealized gain on investment and
foreign currency transactions . . . . . . . . . . . . . . . . . . . . . 9.09 .51 3.08 4.00 7.68Capital contributions . . . . . . . . . . . . . . . . . . . . . . . . . . . . . . . . .00(c) –0– –0– –0– –0–
Net increase in net asset value from operations . . . . . 8.84 .38 2.92 3.84 7.59
Less: Dividends and Distributions
Dividends from net investment income . . . . . . . . . . . . . –0– –0– –0– –0– (.01)Distributions from net realized gain on investment
transactions . . . . . . . . . . . . . . . . . . . . . . . . . . . . . . . . . . . . . . . (1.65) (3.57) (6.52) (.62) –0–
Total dividends and distributions . . . . . . . . . . . . . . . . . . . (1.65) (3.57) (6.52) (.62) (.01)
Net asset value, end of period . . . . . . . . . . . . . . . . . . . . . . . $33.70 $26.51 $29.70 $33.30 $30.08
Total Return
Total investment return based on netasset value (d)* . . . . . . . . . . . . . . . . . . . . . . . . . . . . . . . . . . . 34.15% .85%† 8.82% 12.96% 33.72%
Ratios/Supplemental Data
Net assets, end of period (000’s omitted) . . . . . . . . . . . $39,946 $37,026 $43,383 $46,330 $51,993Ratio to average net assets of:
Expenses, net of waivers/reimbursements . . . . . . . 1.37% 1.40% 1.34% 1.33% 1.31%Expenses, before waivers/reimbursements . . . . . . . 1.37% 1.40% 1.34% 1.33% 1.31%Net investment loss . . . . . . . . . . . . . . . . . . . . . . . . . . . . . . . (.82)%(b) (.48)%(b)† (.49)% (.52)% (.35)%
Portfolio turnover rate . . . . . . . . . . . . . . . . . . . . . . . . . . . . . . . 42% 57% 51% 66% 63%
(a) Based on average shares outstanding.
(b) Net of expenses waived and reimbursed by the Adviser.
(c) Amount is less than $.0005.
(d) Total investment return is calculated assuming an initial investment made at the net asset value at the beginning of the period,reinvestment of all dividends and distributions at net asset value during the period, and redemption on the last day of the period. Totalreturn does not reflect (i) insurance company’s separate account related expense charges and (ii) the deductions of taxes that a share-holder would pay on Portfolio distributions or the redemption of Portfolio shares. Total investment return calculated for a period ofless than one year is not annualized.
† For the year ended December 31, 2016, the amount includes a refund for overbilling of prior years’ custody out of pocket fees as follows:Net Investment
Income Per ShareNet InvestmentIncome Ratio
TotalReturn
$.015 .05% .05%
* Includes the impact of proceeds received and credited to the Portfolio resulting from class action settlements, which enhanced thePortfolio’s performance for the years ended December 31, 2017, December 31, 2016, December 31, 2015, December 31, 2014 andDecember 31, 2013 by 0.11%, 0.01%, 0.06%, 0.03% and 0.06%, respectively.
Includes the impact of proceeds received and credited to the Portfolio resulting from a regulatory settlement, which enhanced thePortfolio’s performance for the year ended December 31, 2017 by 0.14%.
19
REPORT OF INDEPENDENT REGISTEREDPUBLIC ACCOUNTING FIRM AB Variable Products Series Fund
To the Shareholders and the Board of Directors of AB Growth Portfolio:
Opinion on the Financial Statements
We have audited the accompanying statement of assets and liabilities of AB Growth Portfolio (the “Portfolio”) (one of theportfolios constituting AB Variable Products Series Fund, Inc. (the “Fund”)), including the portfolio of investments, as ofDecember 31, 2017, and the related statement of operations for the year then ended, the statements of changes in net assetsfor each of the two years in the period then ended, the financial highlights for each of the five years in the period then endedand the related notes (collectively referred to as the “financial statements”). In our opinion, the financial statements presentfairly, in all material respects, the financial position of AB Growth Portfolio (one of the portfolios constituting AB VariableProducts Series Fund, Inc.) at December 31, 2017, the results of its operations for the year then ended, the changes in its netassets for each of the two years in the period then ended and its financial highlights for each of the five years in the periodthen ended, in conformity with U.S. generally accepted accounting principles.
Basis for Opinion
These financial statements are the responsibility of the Fund’s management. Our responsibility is to express an opinion onthe Portfolio’s financial statements based on our audits. We are a public accounting firm registered with the Public CompanyAccounting Oversight Board (United States) (“PCAOB”) and are required to be independent with respect to the Fund inaccordance with the U.S. federal securities laws and the applicable rules and regulations of the Securities and ExchangeCommission and the PCAOB.
We conducted our audits in accordance with the standards of the PCAOB. Those standards require that we plan and performthe audit to obtain reasonable assurance about whether the financial statements are free of material misstatement, whetherdue to error or fraud. The Fund is not required to have, nor were we engaged to perform, an audit of the Fund’s internal con-trol over financial reporting. As part of our audits, we are required to obtain an understanding of internal control over finan-cial reporting, but not for the purpose of expressing an opinion on the effectiveness of the Fund’s internal control overfinancial reporting. Accordingly, we express no such opinion.
Our audits included performing procedures to assess the risks of material misstatement of the financial statements, whetherdue to error or fraud, and performing procedures that respond to those risks. Such procedures included examining, on a testbasis, evidence regarding the amounts and disclosures in the financial statements. Our procedures included confirmation ofsecurities owned as of December 31, 2017, by correspondence with the custodian and others or by other appropriate auditingprocedures where replies from others were not received. Our audits also included evaluating the accounting principles usedand significant estimates made by management, as well as evaluating the overall presentation of the financial statements. Webelieve that our audits provide a reasonable basis for our opinion.
We have served as the auditor of one or more of the AB investment companies since 1968.
New York, New YorkFebruary 14, 2018
20

GROWTH PORTFOLIO AB Variable Products Series Fund
BOARD OF DIRECTORSMarshall C. Turner, Jr.(1), ChairmanMichael J. Downey(1)
William H. Foulk, Jr.(1)
Nancy P. Jacklin(1)
Robert M. Keith, President andChief Executive OfficerCarol C. McMullen(1)
Garry L. Moody(1)
Earl D. Weiner(1)
OFFICERSBruce K. Aronow(2), Vice PresidentFrank V. Caruso(2), Vice PresidentJohn H. Fogarty(2), Vice President
Joseph J. Mantineo, Treasurer andChief Financial Officer
Emilie D. Wrapp, SecretaryPhyllis J. Clarke, ControllerVincent S. Noto, Chief Compliance Officer
CUSTODIAN AND ACCOUNTING AGENTState Street Bank and Trust CompanyState Street Corporation CCB/51 Iron StreetBoston, MA 02210
INDEPENDENT REGISTERED PUBLICACCOUNTING FIRMErnst & Young LLP5 Times SquareNew York, NY 10036
DISTRIBUTORAllianceBernstein Investments, Inc.1345 Avenue of the AmericasNew York, NY 10105
LEGAL COUNSELSeward & Kissel LLPOne Battery Park PlazaNew York, NY 10004
TRANSFER AGENTAllianceBernstein Investor Services, Inc.P.O. Box 786003San Antonio, TX 78278-6003Toll-Free (800) 221-5672
(1) Member of the Audit Committee, the Governance and Nominating Committee and the Independent Directors Committee.
(2) The day-to-day management of, and investment decisions for, the Fund are made by its senior management team. Messrs. Aronow,Caruso and Fogarty are the investment professionals with the most significant responsibility for the day-to-day management of theFund’s portfolio.
21

GROWTH PORTFOLIOMANAGEMENT OF THE FUND AB Variable Products Series Fund
Board of Directors InformationThe business and affairs of the Fund are managed under the direction of the Board of Directors. Certain information concern-ing the Fund’s Directors is set forth below.
NAME, ADDRESS*,AGE,
(YEAR FIRST ELECTED**)
PRINCIPALOCCUPATION(S)
DURING PAST FIVE YEARSAND OTHER INFORMATION***
PORTFOLIOSIN AB FUNDCOMPLEX
OVERSEEN BYDIRECTOR
OTHERPUBLIC COMPANYDIRECTORSHIPS
CURRENTLYHELD BY
DIRECTOR
INTERESTED DIRECTOR
Robert M. Keith,#1345 Avenue of the AmericasNew York, NY 1010557(2010)
Senior Vice President of AllianceBernstein L.P. (the“Adviser”) and the head of AllianceBernsteinInvestments, Inc. (“ABI”) since July 2008; Directorof ABI and President of the AB Mutual Funds.Previously, he served as Executive Managing Director ofABI from December 2006 to June 2008. Prior to joiningABI in 2006, Executive Managing Director of BernsteinGlobal Wealth Management, and prior thereto, SeniorManaging Director and Global Head of Client Serviceand Sales of the Adviser’s institutional investmentmanagement business since 2004. Prior thereto, he wasManaging Director and Head of North American ClientService and Sales in the Adviser’s institutionalinvestment management business, with which he hadbeen associated since prior to 2004.
96 None
DISINTERESTED DIRECTORS
Marshall C. Turner, Jr.,##
Chairman of the Board76(2005)
Private Investor since prior to 2013. Former Chairmanand CEO of Dupont Photomasks, Inc. (components ofsemi-conductor manufacturing). He has extensiveoperating leadership experience and venture capitalinvesting experience, including five interim or full-timeCEO roles, and prior service as general partner ofinstitutional venture capital partnerships. He also hasextensive non-profit board leadership experience, andcurrently serves on the boards of two education andscience-related non-profit organizations. He has served asa director of one AB Fund since 1992, and director ortrustee of multiple AB Funds since 2005. He has beenChairman of the AB Funds since January 2014, and theChairman of the Independent Directors Committees ofsuch AB Funds since February 2014.
96 Xilinx, Inc.(programmable logicsemi-conductors)since 2007
Michael J. Downey,##
74(2005)
Private Investor since prior to 2013. Formerly, managingpartner of Lexington Capital, LLC (investment advisoryfirm) from December 1997 until December 2003. Heserved as a Director of Prospect Acquisition Corp.(financial services) from 2007 until 2009. From 1987until 1993, Chairman and CEO of Prudential MutualFund Management, director of the Prudential mutualfunds, and member of the Executive Committee ofPrudential Securities Inc. He has served as a director ortrustee of the AB Funds since 2005 and is a director andChairman of one other registered investment company.
96 The Asia Pacific Fund,Inc. (registeredinvestment company)since prior to 2013
22

AB Variable Products Series Fund
NAME, ADDRESS*,AGE,
(YEAR FIRST ELECTED**)
PRINCIPALOCCUPATION(S)
DURING PAST FIVE YEARSAND OTHER INFORMATION***
PORTFOLIOSIN AB FUNDCOMPLEX
OVERSEEN BYDIRECTOR
OTHERPUBLIC COMPANYDIRECTORSHIPS
CURRENTLYHELD BY
DIRECTOR
DISINTERESTED DIRECTORS(continued)
William H. Foulk, Jr.,##
85(1990)
Investment Adviser and an Independent Consultant sinceprior to 2013. Previously, he was Senior Manager ofBarrett Associates, Inc., a registered investment adviser.He was formerly Deputy Comptroller and ChiefInvestment Officer of the State of New York and, priorthereto, Chief Investment Officer of the New York Bankfor Savings. He has served as a director or trustee ofvarious AB Funds since 1983, and was Chairman of theIndependent Directors Committees of the AB Funds from2003 until early February 2014. He served as Chairmanof such AB Funds from 2003 through December 2013.He is also active in a number of mutual fund relatedorganizations and committees.
96 None
Nancy P. Jacklin,##
69(2006)
Private Investor since prior to 2013. Professorial Lecturerat the Johns Hopkins School of Advanced InternationalStudies (2008–2015). U.S. Executive Director of theInternational Monetary Fund (which is responsible forensuring the stability of the international monetary system),(December 2002–May 2006); Partner, Clifford Chance(1992–2002); Sector Counsel, International Banking andFinance, and Associate General Counsel, Citicorp (1985–1992); Assistant General Counsel (International), FederalReserve Board of Governors (1982–1985); and AttorneyAdvisor, U.S. Department of the Treasury (1973–1982).Member of the Bar of the District of Columbia and of NewYork; and member of the Council on Foreign Relations.She has served as a director or trustee of the AB Fundssince 2006 and has been Chairman of the Governance andNominating Committees of the AB Funds since August2014.
96 None
Carol C. McMullen,##
62(2016)
Managing Director of Slalom Consulting (consulting)since 2014, private investor and member of the PartnersHealthcare Investment Committee. Formerly, Director ofNorfolk & Dedham Group (mutual property and casualtyinsurance) from 2011 until November 2016; Director ofPartners Community Physicians Organization(healthcare) from 2014 until December 2016; andManaging Director of The Crossland Group (consulting)from 2012 until 2013. She has held a number of seniorpositions in the asset and wealth management industries,including at Eastern Bank (where her roles includedPresident of Eastern Wealth Management), ThomsonFinancial (Global Head of Sales for InvestmentManagement), and Putnam Investments (where her rolesincluded Head of Global Investment Research). She hasserved on a number of private company and non-profitboards, and as a director or trustee of the AB Funds sinceJune 2016.
96 None
23

GROWTH PORTFOLIOMANAGEMENT OF THE FUND(continued) AB Variable Products Series Fund
NAME, ADDRESS*,AGE,
(YEAR FIRST ELECTED**)
PRINCIPALOCCUPATION(S)
DURING PAST FIVE YEARSAND OTHER INFORMATION***
PORTFOLIOSIN AB FUNDCOMPLEX
OVERSEEN BYDIRECTOR
OTHERPUBLIC COMPANYDIRECTORSHIPS
CURRENTLYHELD BY
DIRECTOR
DISINTERESTED DIRECTORS(continued)
Garry L. Moody,##
65(2008)
Independent Consultant. Formerly, Partner, Deloitte &Touche LLP (1995–2008) where he held a number ofsenior positions, including Vice Chairman, and U.S. andGlobal Investment Management Practice ManagingPartner; President, Fidelity Accounting and CustodyServices Company (1993–1995), where he wasresponsible for accounting, pricing, custody and reportingfor the Fidelity mutual funds; and Partner, Ernst & YoungLLP (1975–1993), where he served as the NationalDirector of Mutual Fund Tax Services and ManagingPartner of its Chicago Office Tax department. He is amember of the Trustee Advisory Board of BoardIQ, abiweekly publication focused on issues and newsaffecting directors of mutual funds. He has served as adirector or trustee, and as Chairman of the AuditCommittees, of the AB Funds since 2008.
96 None
Earl D. Weiner,##
78(2007)
Of Counsel, and Partner prior to January 2007, of the lawfirm Sullivan & Cromwell LLP and is a former member ofthe ABA Federal Regulation of Securities Committee TaskForce to draft editions of the Fund Director’s Guidebook.He also serves as a director or trustee of various non-profitorganizations and has served as Chairman or ViceChairman of a number of them. He has served as a directoror trustee of the AB Funds since 2007 and served asChairman of the Governance and Nominating Committeesof the AB Funds from 2007 until August 2014.
96 None
* The address for each of the Fund’s disinterested Directors is c/o AllianceBernstein L.P., Attention: Legal & ComplianceDepartment—Mutual Fund Legal, 1345 Avenue of the Americas, New York, NY 10105.
** There is no stated term of office for the Fund’s Directors.
*** The information above includes each Director’s principal occupation during the last five years and other information relating tothe experience, attributes, and skills relevant to each Director’s qualifications to serve as a Director, which led to the conclusionthat each Director should serve as a Director for the Fund.
# Mr. Keith is an “interested person” of the Fund, as defined in Section 2(a)(19) of the Investment Company Act of 1940, due to hisposition as a Senior Vice President of the Adviser.
## Member of the Audit Committee, the Governance and Nominating Committee and the Independent Directors Committee.
24

AB Variable Products Series Fund
Officer Information
Certain information concerning the Portfolio’s Officers is listed below.
NAME, ADDRESS*AND AGE
PRINCIPAL POSITION(S)HELD WITH FUND
PRINCIPAL OCCUPATIONDURING PAST FIVE YEARS
Robert M. Keith57
President and ChiefExecutive Officer
See biography above.
Bruce K. Aronow51
Vice President Senior Vice President of the Adviser**, with which hehas been associated since prior to 2013. He is also ChiefInvestment Officer of Small and SMID Cap GrowthEquities.
Frank V. Caruso61
Vice President Senior Vice President of the Adviser**, with which hehas been associated since prior to 2013. He is also ChiefInvestment Officer of Growth Equities.
John H. Fogarty48
Vice President Senior Vice President of the Adviser**, with which hehas been associated since prior to 2013.
Emilie D. Wrapp62
Secretary Senior Vice President, Assistant General Counsel andAssistant Secretary of ABI**, with which she has beenassociated since prior to 2013.
Joseph J. Mantineo58
Treasurer and ChiefFinancial Officer
Senior Vice President of AllianceBernstein InvestorServices, Inc. (“ABIS”)**, with which he has beenassociated since prior to 2013.
Phyllis J. Clarke57
Controller Vice President of ABIS**, with which she has beenassociated since prior to 2013.
Vincent S. Noto53
Chief Compliance Officer Senior Vice President since 2015 and Mutual Fund ChiefCompliance Officer of the Adviser** since 2014. Priorthereto, he was Vice President and Director of MutualFund Compliance of the Adviser** since prior to 2013.
* The address for each of the Portfolio’s Officers is 1345 Avenue of the Americas, New York, NY 10105.
** The Adviser, ABI and ABIS are affiliates of the Fund.
The Fund’s Statement of Additional Information (“SAI”) has additional information about the Fund’s Directors and Officers andis available without charge upon request. Contact your financial representative or the Adviser at (800) 227-4618, or visitwww.abfunds.com, for a free prospectus or SAI.
25
GROWTH PORTFOLIOCONTINUANCE DISCLOSURE AB Variable Products Series Fund
INFORMATION REGARDING THE REVIEW AND APPROVAL OF THE FUND’S ADVISORY AGREEMENTThe disinterested directors (the “directors”) of AB Variable Products Series Fund, Inc. (the “Company”) unanimouslyapproved the continuance of the Company’s Advisory Agreement with the Adviser in respect of AB Growth Portfolio (the“Fund”) at a meeting held on May 2-4, 2017 (the “Meeting”).
Prior to approval of the continuance of the Advisory Agreement, the directors had requested from the Adviser, and receivedand evaluated, extensive materials. They reviewed the proposed continuance of the Advisory Agreement with the Adviserand with experienced counsel who are independent of the Adviser, who advised on the relevant legal standards. The direc-tors also reviewed an independent evaluation prepared by the Company’s Senior Officer (who is also the Company’sIndependent Compliance Officer), who acted as their independent fee consultant, of the reasonableness of the advisory fee,in which the Senior Officer concluded that the contractual fee for the Fund was reasonable. The directors also discussed theproposed continuance in private sessions with counsel and the Company’s Senior Officer.
The directors considered their knowledge of the nature and quality of the services provided by the Adviser to the Fundgained from their experience as directors or trustees of most of the registered investment companies advised by the Adviser,their overall confidence in the Adviser’s integrity and competence they have gained from that experience, the Adviser’s ini-tiative in identifying and raising potential issues with the directors and its responsiveness, frankness and attention to concernsraised by the directors in the past, including the Adviser’s willingness to consider and implement organizational and opera-tional changes designed to improve investment results and the services provided to the AB Funds. The directors noted thatthey have four regular meetings each year, at each of which they review extensive materials and information from theAdviser, including information on the investment performance of the Fund.
The directors also considered all factors they believed relevant, including the specific matters discussed below. During thecourse of their deliberations, the directors evaluated, among other things, the reasonableness of the advisory fee. The direc-tors did not identify any particular information that was all-important or controlling, and different directors may have attrib-uted different weights to the various factors. The directors determined that the selection of the Adviser to manage the Fundand the overall arrangements between the Fund and the Adviser, as provided in the Advisory Agreement, including theadvisory fee, were fair and reasonable in light of the services performed, expenses incurred and such other matters as thedirectors considered relevant in the exercise of their business judgment. The material factors and conclusions that formed thebasis for the directors’ determinations included the following:
Nature, Extent and Quality of Services ProvidedThe directors considered the scope and quality of services provided by the Adviser under the Advisory Agreement, includingthe quality of the investment research capabilities of the Adviser and the other resources it has dedicated to performing serv-ices for the Fund. They also noted the professional experience and qualifications of the Fund’s portfolio management teamand other senior personnel of the Adviser. The directors also considered that the Advisory Agreement provides that the Fundwill reimburse the Adviser for the cost to it of providing certain clerical, accounting, administrative and other services to theFund by employees of the Adviser or its affiliates. Requests for these reimbursements are made on a quarterly basis andsubject to approval by the directors. Reimbursements, to the extent requested and paid, result in a higher rate of totalcompensation from the Fund to the Adviser than the fee rate stated in the Advisory Agreement. The directors noted that themethodology used to determine the reimbursement amounts had been reviewed by an independent consultant retained by theCompany’s Senior Officer. The quality of administrative and other services, including the Adviser’s role in coordinating theactivities of the Fund’s other service providers, also was considered. The directors concluded that, overall, they were sat-isfied with the nature, extent and quality of services provided to the Fund under the Advisory Agreement.
Costs of Services Provided and ProfitabilityThe directors reviewed a schedule of the revenues and expenses and related notes indicating the profitability of the Fund tothe Adviser for calendar years 2015 and 2016 that had been prepared with an expense allocation methodology arrived at inconsultation with an independent consultant retained by the Company’s Senior Officer. The directors noted the assumptionsand methods of allocation used by the Adviser in preparing fund-specific profitability data and understood that there are anumber of potentially acceptable allocation methodologies for information of this type. The directors noted that the profit-ability information reflected all revenues and expenses of the Adviser’s relationship with the Fund, including those relatingto its subsidiaries that provide transfer agency, distribution and brokerage services to the Fund. The directors recognized thatit is difficult to make comparisons of the profitability of the Advisory Agreement with the profitability of advisory contractsfor unaffiliated funds because comparative information is not generally publicly available and is affected by numerous
26

AB Variable Products Series Fund
factors. The directors focused on the profitability of the Adviser’s relationship with the Fund before taxes and distributionexpenses. The directors concluded that the Adviser’s level of profitability from its relationship with the Fund was notunreasonable.
Fall-Out BenefitsThe directors considered the other benefits to the Adviser and its affiliates from their relationships with the Fund, including,but not limited to, benefits relating to soft dollar arrangements (whereby investment advisers receive brokerage and researchservices from brokers that execute agency transactions for their clients); 12b-1 fees and sales charges received by the Fund’sprincipal underwriter (which is a wholly owned subsidiary of the Adviser) in respect of the Fund’s Class B shares; brokeragecommissions paid by the Fund to brokers affiliated with the Adviser; and transfer agency fees paid by the Fund to a whollyowned subsidiary of the Adviser. The directors recognized that the Adviser’s profitability would be somewhat lower withoutthese benefits. The directors understood that the Adviser also might derive reputational and other benefits from its associa-tion with the Fund.
Investment ResultsIn addition to the information reviewed by the directors in connection with the Meeting, the directors receive detailed per-formance information for the Fund at each regular Board meeting during the year.
At the Meeting, the directors reviewed information prepared by an analytical service that is not affiliated with the Adviser(the “15(c) service provider”), showing the performance of the Class A Shares of the Fund against a peer group and a peeruniverse, and information prepared by the Adviser showing performance of the Class A Shares against a broad-based secu-rities market index, in each case for the 1-, 3-, 5- and 10-year periods ended February 28, 2017 and (in the case of compar-isons with the broad-based securities market index) for the period from inception. Based on their review, the directorsconcluded that the Fund’s investment performance was acceptable.
Advisory Fees and Other ExpensesThe directors considered the advisory fee rate paid by the Fund to the Adviser and information prepared by the 15(c) serviceprovider concerning advisory fee rates paid by other funds in the same category as the Fund at a common asset level. Thedirectors recognized that it is difficult to make comparisons of advisory fees because there are variations in the services thatare included in the fees paid by other funds. The directors compared the Fund’s contractual effective advisory fee with a peergroup median and took into account the impact on the advisory fee rate of the administrative expense reimbursement paid tothe Adviser in the latest fiscal year.
The directors also considered the Adviser’s fee schedule for institutional clients pursuing a similar investment style. For thispurpose, they reviewed the relevant advisory fee information from the Adviser’s Form ADV and the evaluation from theCompany’s Senior Officer and noted the differences between the Fund’s fee schedule, on the one hand, and the institutionalfee schedule and the schedule of fees charged to any offshore funds and any sub-advised funds, on the other. The directorsnoted that the Adviser may, in some cases, agree to fee rates with large institutional clients that are lower than thosereviewed by the directors and that they had previously discussed with the Adviser its policies in respect of such arrange-ments. The directors also compared the advisory fee rate for the Fund with that for another AB Fund with a similar invest-ment style.
The Adviser reviewed with the directors the significantly greater scope of the services it provides to the Fund relative toinstitutional, offshore fund and sub-advised fund clients. In light of the substantial differences in services rendered by theAdviser to institutional, offshore fund and sub-advised fund clients as compared to funds such as the Fund, the directorsconsidered these fee comparisons inapt and did not place significant weight on them in their deliberations.
The directors also considered the total expense ratio of the Class A shares of the Fund in comparison to a peer group and apeer universe selected by the 15(c) service provider. The Class A expense ratio of the Fund was based on the Fund’s latestfiscal year. The directors noted that it was likely that the expense ratios of some of the other funds in the Fund’s categorywere lowered by waivers or reimbursements by those funds’ investment advisers, which in some cases might be voluntary ortemporary. The directors view expense ratio information as relevant to their evaluation of the Adviser’s services because theAdviser is responsible for coordinating services provided to the Fund by others. The directors noted that the Fund’s expenseratio was above the medians. After reviewing and discussing the Adviser’s explanations of the reasons for this, the directorsconcluded that the Fund’s expense ratio was acceptable.
27
GROWTH PORTFOLIOCONTINUANCE DISCLOSURE(continued) AB Variable Products Series Fund
Economies of ScaleThe directors noted that the advisory fee schedule for the Fund contains breakpoints that reduce the fee rates on assets abovespecified levels. The directors took into consideration prior presentations by an independent consultant on economies ofscale in the mutual fund industry and for the AB Funds, and by the Adviser concerning certain of its views on economies ofscale. The directors also had requested and received from the Adviser certain updates on economies of scale in advance ofthe Meeting. The directors believe that economies of scale may be realized (if at all) by the Adviser across a variety of prod-ucts and services, and not only in respect of a single fund. The directors noted that there is no established methodology forsetting breakpoints that give effect to the fund-specific services provided by a fund’s adviser and to the economies of scalethat an adviser may realize in its overall mutual fund business or those components of it which directly or indirectly affect afund’s operations. The directors observed that in the mutual fund industry as a whole, as well as among funds similar to theFund, there is no uniformity or pattern in the fees and asset levels at which breakpoints (if any) apply. The directors alsonoted that the advisory agreements for many funds do not have breakpoints at all. Having taken these factors into account,the directors concluded that the Fund’s shareholders would benefit from a sharing of economies of scale in the event theFund’s net assets exceed a breakpoint in the future.
28

(This page left intentionally blank.)

VPS-GTH-0151-1217