annual workforce report - saintjohn.ca
TRANSCRIPT

Annual Workforce Report
2019
CITY OF SAINT JOHN │HUMAN RESOURCES

P a g e | 1
Human Resources │ Annual Workforce Report 2019
Contents Section 1: Introduction .................................................................................................................... 2
Section 2: Human Resources Administration .................................................................................. 3
The Organizational Establishment ............................................................................................... 3
Group Health Benefits ................................................................................................................. 4
Section 3: Workforce Planning ........................................................................................................ 5
Demographics by Employee Groups (December 31, 2019) ........................................................ 6
Workforce Retirement Eligibility Next Five Years........................................................................ 6
Turnover Trends........................................................................................................................... 7
Strategic Recruitment and Career Development ........................................................................ 8
Employee Training and Development ......................................................................................... 9
Workforce Utilization Rate ........................................................................................................ 10
Employee Engagement Survey .................................................................................................. 10
Section 4: Employee Health, Safety and Wellness ........................................................................ 12
Corporate Safety Scorecard ....................................................................................................... 12
Attendance and Absenteeism ................................................................................................... 13
Injury on Duty ............................................................................................................................ 13
Employee Wellness .................................................................................................................... 14
Section 5: Labour Relations ........................................................................................................... 15
Grievances ................................................................................................................................. 15
Section 6: Salary & Benefits .......................................................................................................... 16
2019 City Operating Budget: By Expense .................................................................................. 16
2019 Salary & Benefits: Summary by Employee Group ............................................................ 17
2019 Operating Budget: Total Salary & Benefits ....................................................................... 17
2019 Base Salary by Employee Group and Pay Band ................................................................ 18
City of Saint John ....................................................................................................................... 18
Saint John Transit Commission .................................................................................................. 22
Saint John Police Force .............................................................................................................. 22
Section 7: Observations & Recommendations.............................................................................. 26
Section 8: Message from the City Manager .................................................................................. 29

P a g e | 2
Human Resources │ Annual Workforce Report 2019
Section 1: Introduction This is the first edition of the Annual Workforce Report for the City of Saint John. The Report profiles the labour/employment contribution to municipal services along with associated costs, congruent with our goal to be a citizen-focused, accountable and transparent municipal government. City services are delivered by a number of work groups, namely: inside workers, outside workers, firefighters, and management/professional/non-union staff, totalling 628 employees. In addition, there are a number of agencies, boards and commissions that are closely tied to the City. Available and applicable data and information related to the Saint John Police Commission, Saint John Transit Commission and Saint John Parking Commission has been included in this report. The City of Saint John workforce provides a wide range of services to more than 67,000 residents on a daily basis, as well as a large number of visitors and work commuters. As Canada’s oldest incorporated city, our boundaries cover approximately 315 square kilometers of urban, suburban, and rural neighbourhoods. Residents of the City enjoy rich and diverse neighbourhoods and lifestyle choices that suit most cultural or personal preferences. We are known as a city on the water, with more coastline than any other New Brunswick municipality. Our central business district (known as “uptown Saint John”), as well as many of our residential neighbourhoods, are uniquely situated along the world famous Bay of Fundy and enjoy some of the most picturesque views Eastern Canada has to offer. Our residents enjoy over 110 kms of coastline along the Bay of Fundy and over 70 kms of waterfront along the St. John River. Saint John was founded as a port city, and remains very active in this industry today, with the third-largest tonnage of any port in Canada. We also have a well-developed base of primary extraction and secondary manufacturing industries, all of which employ thousands of people across the Greater Saint John region. Table 1 presents a summary of metrics examined in more detail within the body of the report. Generally, the City’s workforce can be characterized as stable in 2019, although a reduction of the number of permanent positions is notable. Over the past ten years, the overall establishment has been reduced by 55 positions, not including Saint John Police Force or Saint John Transit. The City expects further reductions going forward arising from normal attrition and the implementation of workforce realignment and optimization initiatives in 2020 and beyond.

P a g e | 3
Human Resources │ Annual Workforce Report 2019
Table 1 Workforce Indicators 2018 2019
Number of Permanent Employees 641 628
Average Employee Age 46 46
Average Employee Years of Service 13 15.9
Number of Grievances Filed 7 3
Number of External Hires 34 30
Number of Internal Moves 40 32
Employee Turnover Rate 6.1% 4.6%
Employee Retirements 29 20
Average Sick Days per Employee (based on 7 hour day) 9.0 10.6
Total Employee Accidents 60 51
Lost Time Accidents 33 24
Training Cost per Employee $830 $770
Workforce Utilization Rate* 83% 82.6%
*Workforce Utilization Rate explained in Section 3
Section 2: Human Resources Administration This section addresses the processes that build structure around employment including permanent approved full-time equivalents (FTEs), and employee benefits.
The Organizational Establishment The Establishment (Table 2) is the approved number of full-time permanent positions in each employee group. The Establishment is approved annually by Common Council. The actual number of employees at any time varies according to factors such as vacancies, leaves and temporary positions. Casual, temporary, contract and other forms of non-permanent complement are not included in the Establishment.

P a g e | 4
Human Resources │ Annual Workforce Report 2019
Table 2 PERMANENT EMPLOYEE ESTABLISHMENT
Employee Group 2018 2019
Inside Workers (CUPE Local 486) 118 112
Outside Workers (CUPE Local 18) 283 278
Firefighters (IAFF 771) 145 144
Non-Union Administration 6 6
Management 58 58
Professional 31 30
TOTAL CITY 641 628
Saint John Transit* 86 86
Saint John Police Force* 203 203
TOTAL 930 917
*The Saint John Police Force and Saint John Transit totals include management, civilian and unionized staff.
Note that Saint John Transit and the Saint John Police Force are included to allow for comparison to other municipalities. Each region varies in the delivery of services, for example, municipal police vs. RCMP and/or other external agencies. The City of Saint John establishment includes Saint John Water employees.
Group Health Benefits The City of Saint John has an Administrative Services Only (ASO) Group Benefits Plan. The Plan is governed by a joint Management/Union committee and has been in an excellent financial position for the past number of years with a surplus of approximately $1 million dollars as of January 1, 2019. However, increasing health costs, primarily for prescription drugs, have exceeded the total contributions in the past two years (Table 3). The Benefits Steering Committee will address these shortfalls to ensure the Plan remains stable. Plan members are the cardholder for the Group Benefits. Plan members have the option to select a single or family plan, and total numbers below do not include dependants. The full monthly cost for the single rate is $163.28 and $271.30 for family. These premiums are cost-shared 75/25% by the employer and employee; retirees are responsible for 100% of the premium. Retirees have the option upon retirement to remain a member of the plan. Plan premiums have remained unchanged since December 2010. Membership in the plan is mandatory for all permanent employees.

P a g e | 5
Human Resources │ Annual Workforce Report 2019
Table 3 Benefit* 2018 2019
Total Cost $4,601,217 $4,760,241
Total Contributions $4,267,138 $4,298,314
Total Active Members 993 1003
Total Pension Members 629 627
Total Cardholder Members 1622 1630
Average Cost/ Member $2,836 $2,920
*Saint John Police Force members are included in the City of Saint John Group Benefits, and are, therefore, represented in these figures.
Section 3: Workforce Planning This section profiles the City’s dynamics of workforce demographics, turnover, and utilization, which influence the effectiveness of the “human dimension” of the workforce. Table 4 depicts the ratio of residents served by a single municipal employee for the three largest municipalities in New Brunswick. The total FTE for Saint John includes all City employees, Saint John Police Force and Saint John Transit combined. Moncton has policing services through the RCMP and, therefore, does not include numbers for police in their FTE. For comparison purposes, the Codiac RCMP Division that serves Moncton would add approximately 225 personnel to the Moncton establishment and would adjust their employee ratio to 1:82. Saint John’s ratio (1:74) is reflective of the large land area serviced, an area larger than both Fredericton and Moncton combined. The population density is a significant stress on Saint John’s resource requirements as basic services such as snow clearing, street maintenance and repair, water infrastructure requirements, and transit services must reflect the spread of population across the entire city.
Table 4 2016 CENSUS DATA: STATS CANADA
Municipality Saint John Fredericton Moncton
Population 67,575 58,220 71,889 Land Area (sq. Km) 315.96 132.57 141.92
Population Density (per sq. Km) 213.9 439.2 506.5
2019 FTE 917 699.54 655 Employee
Ratio/population 74 83 110
P a g e | 6
Human Resources │ Annual Workforce Report 2019
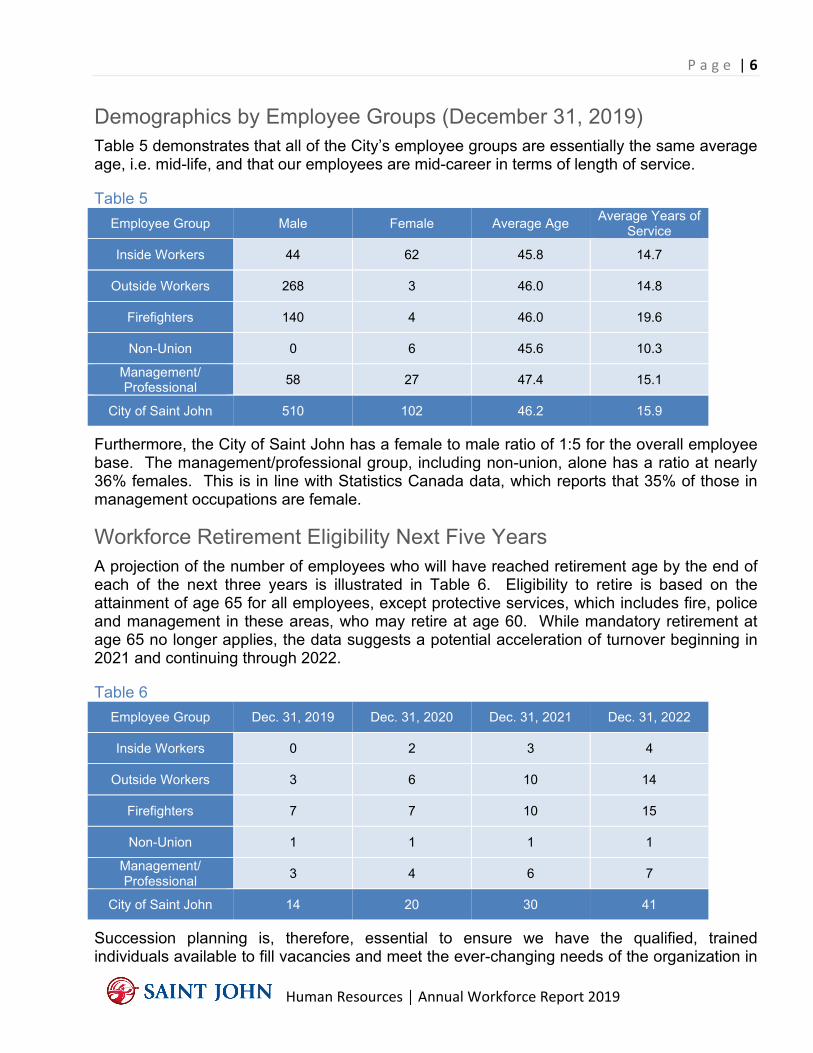
Demographics by Employee Groups (December 31, 2019) Table 5 demonstrates that all of the City’s employee groups are essentially the same average age, i.e. mid-life, and that our employees are mid-career in terms of length of service.
Table 5 Employee Group Male Female Average Age Average Years of
Service
Inside Workers 44 62 45.8 14.7
Outside Workers 268 3 46.0 14.8
Firefighters 140 4 46.0 19.6
Non-Union 0 6 45.6 10.3
Management/ Professional 58 27 47.4 15.1
City of Saint John 510 102 46.2 15.9
Furthermore, the City of Saint John has a female to male ratio of 1:5 for the overall employee base. The management/professional group, including non-union, alone has a ratio at nearly 36% females. This is in line with Statistics Canada data, which reports that 35% of those in management occupations are female.
Workforce Retirement Eligibility Next Five Years A projection of the number of employees who will have reached retirement age by the end of each of the next three years is illustrated in Table 6. Eligibility to retire is based on the attainment of age 65 for all employees, except protective services, which includes fire, police and management in these areas, who may retire at age 60. While mandatory retirement at age 65 no longer applies, the data suggests a potential acceleration of turnover beginning in 2021 and continuing through 2022.
Table 6 Employee Group Dec. 31, 2019 Dec. 31, 2020 Dec. 31, 2021 Dec. 31, 2022
Inside Workers 0 2 3 4
Outside Workers 3 6 10 14
Firefighters 7 7 10 15
Non-Union 1 1 1 1
Management/ Professional 3 4 6 7
City of Saint John 14 20 30 41
Succession planning is, therefore, essential to ensure we have the qualified, trained individuals available to fill vacancies and meet the ever-changing needs of the organization in

P a g e | 7
Human Resources │ Annual Workforce Report 2019
the next three to five years. Resignations in specialized, technical roles accounted for over 2% of the turnover in 2018. This highlights the need for focused and strategic staffing and development to ensure we are able to attract and retain the people needed.
Turnover Trends While we are suggesting that future turnover rates will likely increase, the following table illustrates that turnover within the organization is currently well controlled and clearly within established industry averages. The voluntary permanent employee turnover rate is calculated using the total number of permanent individuals that retired or resigned divided by the average permanent employee headcount. The Municipal Benchmark Network Canada (MBNC) reported the average voluntary turnover rate at 5.68% for 2017.
Table 7 TURNOVER 2018 2019
Retirements 29 20
Inside Workers 7 7
Outside Workers 14 5
Firefighters 6 7
Management/Professional 2 1
Non Union 0 0
Total Resignations 10 9
Inside Workers 4 1
Outside Workers 3 3
Management/Professional 3 5
Non Union 0 0
Total Voluntary Separation 39 29
Total Permanent Employees 641 628
Voluntary Turnover Rate 6.1% 4.6%
Turnover reduced slightly in 2019 over 2018; however, it is expected that the number of retirements will continue to remain over twenty (20) per year. This combined with multiple resignations creates a constant need for recruitment and selection, training new employees, temporarily filling positions while recruitment efforts are ongoing and adding increased workload to remaining employees. While efficiencies have been made in the recruitment process, reducing turnover and retaining our existing employees remains important as we strike the correct balance between experience and fresh faces within the organization.

P a g e | 8
Human Resources │ Annual Workforce Report 2019
Strategic Recruitment and Career Development With over 50% of our staffing done through internal progression, we recognize the importance of growth opportunities and transfer of knowledge amongst service areas to continue to move the organization towards our goals and objectives. Our workforce career development systems link job advancement to the acquisition of knowledge and skills, preparing our employees for the service demands of tomorrow. At the same time, these systems also help identify competency gaps, which we address through strategic recruitment.
Table 8 Hiring Activity 2018 2019
Internal Hires/Movement 40 32
External Hires 34 30
Total Permanent Hires/Movements 74 62
% filled Internally 54% 52%
% filled Externally 46% 48%
Total Hires by Employee Group A summary of our staffing activity for 2019, including internal and external recruitment in both casual and permanent roles, is provided in Table 9. The need for casual staff to augment our permanent workforce is significant. In 2019 alone, the City conducted 180 hiring processes for casual or temporary positions.
Table 9 Hiring Activity 2018 2019
Inside Workers 43 48
Outside Workers 109 109
Firefighters 20 13
Non-Union 32 45
Management/Professional 16 27
Total 220 242
In general, we have a good response to our job postings with an average of 96 applicants per posting in 2019. The City of Saint John is a “sought-after-employer” in many roles, in particular labourer and skilled trades positions. We had an average of 137 applicants per posting for our permanent outside worker postings in 2019, and often received over 200 applicants for casual roles in this workgroup. Our primary recruitment challenges are for more specialized management roles such as planning, IT, and finance. Candidates for these roles expect a total compensation package comparable to their private sector colleagues and for most of the specialized managerial positions, we simply cannot achieve this. Promoting and highlighting the City of Saint John total compensation package and evaluating our positions in the overall market are necessary

P a g e | 9
Human Resources │ Annual Workforce Report 2019
to remain competitive. The City is committed to offering services in both official languages; however, securing qualified bilingual staff is often a challenge. These positions are typically in front-facing roles such as customer service and administrative assistants. We often have temporary positions to fill in for those on leave, acting in another role within the organization or for special projects to be completed. Filling these temporary positions often takes significant resources and time. The only exception is with our casual outside workforce, typically during the summer months, where we often have a large pool to select from and a well-established routine for hiring. Although we have an adequate response to our casual or temporary postings, these represent the majority of our staffing requisitions, each taking, on average, 45 days to fill.
Employee Training and Development Employees are provided with various training opportunities ranging from specialized safety courses and programs to French language training and supervisory and leadership courses. In 2018, the City of Saint John partnered with settlement agencies to provide Cultural Competency Training to nearly 90% of the workforce as part of the City’s Population Growth Action Plan. The launch of an online training platform has provided an excellent alternative to classroom learning, allowing employees to receive the necessary training on their own schedule. This is reflected in the significant decrease in costs from 2018 to 2019, primarily due to fewer travel-related costs. We will be implementing a new Travel Policy for City employees and a Training and Development Policy in 2020.
Table 10 2018 2019
Total Cost of Training* $531,175 $482,643
Corporate Training Completions 834 1464
External Training Completions 829 1162
Total Permanent Employees 641 628
Cost of Training per Employee $830 $769
*The total cost includes all related travel, conference fees, membership association fees and training costs.
The City of Saint John is on the low end for investment in learning and development spending with $769 per employee in 2019, which includes related travel costs not typically included in the metric. When travel costs are removed, the average per employee drops to $579. The Conference Board of Canada reports the average learning and development cost per employee was $889 in 2017. Notably, the number of training completions for City employees increased significantly in 2019 due to new internal course offerings and required training for all employees through the online platform. In addition to an ongoing emphasis on supporting career development systems as previously discussed, our training and development efforts will be centered upon leveraging staff expertise through mentoring, coaching and guided experiential learning programs. Expanded

P a g e | 10
Human Resources │ Annual Workforce Report 2019
use of existing online training software to develop and deliver internal training will result in greater relevance, flexibility and reach in program delivery. An employee engagement survey conducted in September 2019 highlighted employee training and development as an area in need of improvement from our employees’ perspective. Generally, employees do not feel they have opportunities for training and development or the ability to achieve their career aspirations with only six in 10 responding favourably. A focus for 2020 will be to integrate individual development plans, particularly for employees requiring training to maintain professional designations and leverage opportunities for personal growth and increased partnerships internally.
Workforce Utilization Rate At a strategic level, the impact of health, safety and wellness programming on overall workforce efficiency and effectiveness is represented by the Workforce Utilization Rate (WUR). The WUR is calculated by dividing the total amount of the various types of non-productive time, such as vacation time, paid sick leave, training, etc. to the total hours paid. The WUR provides the true amount of time employees are on the job, performing the duties of their respective roles, as compared to the total time paid. While every industry is different, and measurement within the service sector can be challenging, a WUR of 85% is considered optimal in many cases. Since this is the first use of this measure at the City, we will initially benchmark internally, and expand to external benchmarks once comparators within the municipal public sector in the Maritimes become available.
Table 11 WORKFORCE UTILIZATION RATE
Employee Group 2018 2019
Inside Workers 81.2% 82.3%
Outside Workers 82.4% 82.1%
Firefighters 84.9% 83.8%
Non-Union 86.6% 85.9%
Management/Professional 83.6% 82.0%
City of Saint John 83.0% 82.6%
Employee Engagement Survey Our most important workforce planning initiative of 2019 was the employee engagement survey. This project created a variety of key leading indicators of workforce performance around morale, culture, and attitude as well as benchmarking against public and private sector organizations. The information yielded will serve as the basis of future program development and primary actions detailed in the 2020 work plan. The results of this initiative are reflected in the recommendations section of this report. The City of Saint John conducted the employee engagement survey through Narrative

P a g e | 11
Human Resources │ Annual Workforce Report 2019
Research in the fall of 2019. Over a period of approximately one month, 56% of eligible employees responded. The results of the survey have been analyzed and benchmarked to assess which areas we should focus on for improvement. Narrative Research summarized the results in nine major categories for the organization as a whole, and each service area separately. Overall, Narrative Research determines an “Employee Engagement Index” as shown in Chart 1. The City of Saint John had results higher than the database average with an employee engagement score of 77 over the average of 74. While we are pleased with these results, we will aim to increase this metric for future surveys. Over eight in 10 of the respondents said they have a high level of commitment to the City. Employees also reported being passionate about working for the City of Saint John and looking forward to coming to work each day. This high level of commitment and pride are shown in the level of service provided by our dedicated employees each day. As previously discussed, employee training and development are areas in need of attention in the coming year. Although there was a significant increase in the availability of training in 2019, the majority of respondents felt that they do not have access to opportunities to develop their careers. This combined with less than 70% feel that they have an opportunity daily to do what they do best demonstrates the need to improve our succession planning and development opportunities organization-wide. Another key focus in 2020 will be on communication, feedback and recognition. The majority responded that they do not feel they are recognized for their achievements nor have the opportunity to provide input to decisions that will affect their job. While the organization is going through some significant changes including ensuring a path of sustainability for the future, it is essential that our employees are kept informed and have multiple avenues for communication and feedback through the process.
Chart 1

P a g e | 12
Human Resources │ Annual Workforce Report 2019
Section 4: Employee Health, Safety and Wellness Section 4 focuses on people rather than structure, on the employees who deliver service to the community, and on the overall health and well-being of the workforce. Properly considered, the metrics related to absenteeism in all of its forms, including sick leave and injury of duty (workplace accidents), are lagging indicators of workforce performance, essentially demonstrating that something is wrong, but of limited use in the development of solutions. Nevertheless, these measures help illustrate the problem and provide opportunities for benchmarking. Going forward, our intent is to build a suite of leading indicators in the area of health, safety and wellness to strengthen programming and prevention. The Corporate Safety Scorecard in Charts 2 & 3 is one such example. Some 2019 initiatives included conducting a workplace violence risk assessment; strengthening our safety standards through policy and procedure development; and enhancing our efforts in employee safety awareness.
Corporate Safety Scorecard Key leading indicators of safety performance, derived from the City’s 5*22 Safety Management System, are summarized in the Corporate Scorecard (Chart 2 & 3). WorkSafe NB advises that organizations that consistently carry out these safe work activities generally experience fewer accidents and lower costs over time. Examples include activities such as management and supervisor job site visits, safety talks, workplace inspections, and incident investigations. The effectiveness rating (Chart 3) reflects the number of activities completed as compared to the established standards in the safety management system. Further, the City’s due diligence posture is protected by the system since each of the indicated activities is now legislatively required given amendments to the New Brunswick Occupational Health and Safety Act (NBOHSA) in 2014.
Chart 2
Man. JobSite Visits
SafetyMeetings
Sup. JobSite Visits
WeeklySafetyTalks
Inspections Hazard ID Corporate
Wide
5*22 Activities 97% 90% 96% 77% 101% 98% 95%
0%
20%
40%
60%
80%
100%
120%2019 Summary by Safety Activity

P a g e | 13
Human Resources │ Annual Workforce Report 2019
Chart 3
Attendance and Absenteeism The Average Number of Sick Days table includes each employee group and is based on the typical daily working hours for the group, as indicated in brackets. The average number of sick days per employee includes both permanent and casual employees. Our corporate average days lost due to sick leave is consistent with benchmarking from sources such as Statistics Canada that reported an average of 10 days lost due to illness per employee for the Atlantic Canada region in 2019. When compared against Public Administration, Statistics Canada reported an average of 14.5 sick days in 2019. While our recent experience is below this average, it is undesirable. Given the severe effects of sick time on productivity, customer service, employee morale, and safety, health, wellness and attendance management is among our key areas of focus for 2020.
Table 12 AVERAGE NUMBER OF SICK DAYS
Employee Group 2018 2019
Inside Workers (7) 10.4 9.6
Outside Workers (8) 9.3 10.5
Firefighters (12) 5.0 7.4
Non-Union (7) 1.6 3.6
Management/Professional (7) 2.7 4.4
City of Saint John (7) 9.0 10.6
Injury on Duty Tables 13 and 14 profile the impact of Injury on Duty (workplace accidents). While our employees have historically suffered fewer lost-time accidents than those of other New
Transportation
Growth &Dev
Engineering SJ Water Finance
& Admin
Corporate
ServicesFire Corporat
e Wide
Effectiveness Rate 104% 86% 92% 86% 97% 104% 95% 95%
0%20%40%60%80%
100%120%
2019 Effectiveness Rating: Service Area

P a g e | 14
Human Resources │ Annual Workforce Report 2019
Brunswick municipalities, the costs of the City’s lost time accidents have increased dramatically over the last three years, resulting in an unfavourable premium rate for each of those years. The increasing costs are primarily related to extended recovery periods and related wage replacement costs. Prevention efforts and remediation (case management) are critical to reversing the recent trend of cost escalation in this area.
Table 13 Incident Type 2018 2019
Lost time: absence from the workplace following a work-related injury or illness 33 24
No lost time: a Workers Compensation claim was filed but did not result in lost time at work 27 27
Total 60 51
WorkSafe NB Cost of Claims
Table 14 Workers Compensation 2018 2019
Annual Cost of Claims $260,291 $298,960
Frequency 2.39 1.77
Days Lost 1066.07 1146.35
WorkSafe NB Rate $2.24 $3.77
All information was provided by WorkSafe NB. The Saint John Police Force is included in the data. The City of Saint John is in the Municipal Government industry and, as such, we are 4% higher than the net rate for the group in 2019. While our number of incidents has reduced by 16%, the length of time employees are out has increased by 7%.
Employee Wellness All permanent employees for the City of Saint John and the Saint John Police Force have access to an Employee and Family Assistance Program (EFAP) through Manulife. This benefit offers short-term counselling and assistance for a variety of issues ranging from stress and marital and family problems to referrals for financial and legal advice. The full cost for EFAP is employer-paid based on a monthly premium per active employee. The tables below illustrate the annual cost and the utilization rates for the reported periods.

P a g e | 15
Human Resources │ Annual Workforce Report 2019
Table 15A EFAP August 2017 – July 2018 August 2018 – July 2019
Utilization Rate 25.6% 24.01%
Number of New Cases 223 209
Table 15B 2018 2019
EFAP Annual Expense $41,901 $54,219
The City recognizes the importance and impact that overall health and wellness has on employees both at work and at home and, therefore, supports a range of related programs. As examples, all City employees can take advantage of the variety of programs and facilities available at the Canada Games Aquatic Centre at a corporate rate; flu shot clinics are organized annually at various locations for all employees; and the City played a key role in promoting Bell Let’s Talk in 2019 with a flag raising and a number of activities and resources provided to employees.
Section 5: Labour Relations The City has long recognized the importance of forging respectful, mutually beneficial relationships with its employees, including its unionized workforces and the representatives: CUPE Local 18, Outside Workers; CUPE Local 486, Inside Workers; and Saint John Firefighters Local 771. In collaboration with the unions, we have implemented progressive methods of communication and dispute resolution, including the adoption of mutual interest processes, where appropriate. We have collaborated on a number of innovative workforce initiatives to increase the efficiency and effectiveness of service delivery, and continue to evolve to allow more flexible and responsive services. Through mutual interest processes, we address issues and concerns as they arise, as demonstrated by our success at resolving all disputes internally in the last two years.
Grievances Table 16
Employee Group 2018 2019 Inside Workers (CUPE Local 486) 0 0 Outside Workers (CUPE Local 18) 6 3
Firefighters (IAFF 771) 1 0 Resolved Internally 7 3
Resolved by Third Party 0 0
Collective agreements for CUPE Local 18, and IAFF 771 expired in December 2019 and negotiations are underway. All grievances filed in the past two years have been resolved internally, many of which at the first or second stage of the process. It is notable that grievances filed decreased by 57% in 2019.

P a g e | 16
Human Resources │ Annual Workforce Report 2019
Section 6: Salary & Benefits The City’s salary and benefits programs are among our most important tools for successfully competing in local, regional and national labour markets, to attract and retain top talent, and to provide first-rate service to our community. The City’s total compensation package provides a strategic advantage that we can and should leverage more effectively. Data in Table 17 includes the Saint John Police Force. Table 17
2018 2019
Base Salary Budget $61,238,565 $62,224,866
Total Salary with Benefits Budget* $89,992,427 $91,509,934
Saint John Operating Expense $156,090,793 $160,257,783
Base Salary/Operating 39.23% 38.83%
Total Salary/Operating 57.65% 57.10%
*Total Salary includes overtime, retro-active pay, early retirement benefits, entitled payouts upon retirement or termination, employer contributions for group benefits, EI, CPP, pension and special pension payments equal to 17% of eligible wages in addition to base salary. It is notable from Table 17 (and shown in Chart 4) that 57% of the City’s operating budget is committed to the workforce in salary and benefits. It is also notable that indirect costs of employment, including investment in employee training and development programs, are excluded. The overall amount of wages and benefits funded from the City operating budget is actually much higher when considering our subsidies to many of the agencies, boards and commissions predominately fund wages.
2019 City Operating Budget: By Expense Chart 4
2

P a g e | 17
Human Resources │ Annual Workforce Report 2019
2019 Salary & Benefits: Summary by Employee Group The following table (Table 18) provides the distribution of salary and benefits payments among the City’s workgroups. The effect of special pension payments of 17% of base salary is notable. Protective services (Fire and Police) account for just over 38% of the establishment; however, approximately 50% of available wages and benefits resources from the budget are committed to these workgroups.
Table 18
2019 Base Salary Total Salary Benefits and
Required Deductions
Special Pension Payment (17%)
% of Salary Budget
Inside Workers (CUPE Local 486) $8,467,795 $12,354,749 $2,159,288 $1,417,951 13%
Outside Workers (CUPE Local 18) $11,683,499 $17,368,484 $2,979,292 $1,956,428 19%
Firefighters (IAFF 771) $15,801,433 $23,351,338 $4,730,420 $2,645,985 26%
Management/ Professional/Non
Union $9,846,324 $14,047,426 $2,510,813 $1,648,789 15%
Police (SJ Police Association) $14,378,489 $21,773,696 $4,212,897 $2,407,710 24%
Casuals $2,047,325 $2,614,239 $184,260 $342,829* 3%
Overall $62,224,866 $91,509,934 $16,776,969 $10,419,692 100%
*Casuals only qualify for a pension under specific circumstances.
2019 Operating Budget: Total Salary & Benefits Chart 5
Local 771/Holiday
Relief26%
Police Association
24%Local 18
19%
Management/Non Union
15%
Local 48613%
Casuals3%

P a g e | 18
Human Resources │ Annual Workforce Report 2019
2019 Base Salary by Employee Group and Pay Band Tables 19-29 provide a more granular view of salary data, illustrating the distribution of employees within pay bands and the associated salary implications for each level. All information reported as of December 31, 2019. Average salary and maximum total salary includes base salary in addition to overtime and/or other entitlements for the year. The # in band represents everyone paid in that pay band during 2019. Note that some are partial years due to termination or new hires during the year.
City of Saint John CUPE Local 486: Inside Workers The Inside Workers employee group includes a range of professions from building inspectors and engineering technologists, chemical technologists, administrative assistants and finance clerks working in all service areas of the City. This employee group are members of CUPE Local 486: Inside Workers and have a current collective agreement effective from January 1, 2015, to December 31, 2021.
Table 19
Pay Band Min Max # in
Band Average
Total Salary Fringe
(25.5%)
Special Pension (17%)
Total Cost Max Salary Earned
Group 1 $33,614 $36,802 0 Only Casuals in these groups
Group 2 $37,656 $41,303 0
Group 3 $41,697 $45,793 8 $38,649 $9,856 $6,570 $55,075 $61,234
Group 4 $45,738 $50,284 17 $44,077 $11,240 $7,493 $62,810 $72,031
Group 5 $49,786 $54,775 11 $51,579 $13,153 $8,768 $73,500 $61,616
Group 6 $54,277 $59,771 11 $55,164 $14,067 $9,378 $78,608 $71,865
Group 7 $58,770 $64,766 24 $64,852 $16,537 $11,025 $92,414 $86,604
Group 8 $63,264 $69,755 26 $72,293 $18,435 $12,290 $103,018 $98,143
Group 9 $67,753 $74,744 20 $68,728 $17,526 $11,684 $97,937 $85,404

P a g e | 19
Human Resources │ Annual Workforce Report 2019
CUPE Local 18: Outside Workers The Outside Worker employee group includes skilled labour roles in a variety of service areas ranging from Parks and Recreations, Public Works, Materials and Fleet Management and Saint John Water. Employees in this group provide essential services such as snow removal, sanitation, water and wastewater treatment and maintenance of our parks and recreation facilities. Employees in this group are members of CUPE Local 18 and are covered by a collective agreement that was effective from July 1, 2014, to December 31, 2019.
Table 20
Pay Band Hourly Rate
Annual Salary
# in Band
Average Total Salary
Fringe (25.5%)
Special Pension (17%)
Total Cost Max Salary Earned
Level 1 $24.51 $50,981 18 $33,371 $8,510 $5,673 $47,553 $57,655
Level 2 $25.18 $52,374 9 $57,147 $14,573 $9,715 $81,435 $60,248
Level 3 $25.87 $53,810 18 $57,918 $14,769 $9,846 $82,533 $64,107
Level 4 $26.54 $55,203 13 $61,745 $15,745 $10,497 $87,987 $71,067
Level 5 $27.21 $56,597 30 $58,724 $14,975 $9,983 $83,681 $64,678
Level 6 $27.88 $57,990 60 $62,487 $15,934 $10,623 $89,044 $81,768
Level 7 $28.55 $59,384 27 $62,454 $15,926 $10,617 $88,997 $84,572
Level 8 $29.24 $60,819 46 $69,349 $17,684 $11,789 $98,823 $104,384
Level 9* $29.9 $66,079 7 $73,033 $18,623 $12,416 $104,072 $85,198
Level 10* $30.59 $67,604 22 $63,759 $16,258 $10,839 $90,856 $70,190
Level 11* $31.25 $69,063 5 $68,424 $17,448 $11,632 $97,505 $71,251
Level 12* $32.61 $72,068 29 $79,442 $20,258 $13,505 $113,205 $110,773
Level 15* $33.27 $73,527 4 $92,688 $23,635 $15,757 $132,080 $107,978
*Foreman and Operators in Level 9-15 work an additional 30 minutes per day.

P a g e | 20
Human Resources │ Annual Workforce Report 2019
Saint John Firefighters IAFF 771 The Saint John Fire Service has been operating since 1786. Services provided by the Firefighters include fire rescue and suppression, technical rescue, hazardous materials emergency response, fire prevention, fire investigation and medical first responder. Employees in this group are members of the Firefighters’ Association Local 771 and are covered by a collective agreement that was effective from January 1, 2015, to December 31, 2019.
Table 21
Pay Band Annual Salary
# in Band
Average Total Salary
Fringe (29.3%)*
Special Pension (17%) Total Cost Max Total
Salary
Captain $106,116 14 $96,039 $28,139 $16,327 $140,505 $124,638
Qual. Captain $103,809 9 $105,186 $30,820 $17,882 $153,888 $106,839
Lieutenant $101,503 25 $101,347 $29,695 $17,229 $148,270 $149,959
Qual. Lieutenant $96,889 29 $99,458 $29,141 $16,908 $145,507 $137,592
1st Class FF $92,275 60 $91,544 $26,822 $15,562 $133,929 $108,272
2nd Class FF $87,661 5 $86,464 $25,334 $14,699 $126,496 $87,306
3rd Class FF $83,048 5 $79,485 $23,289 $13,512 $116,286 $81,366
4th Class FF $78,434 4 $70,875 $20,766 $12,049 $103,690 $75,462
HRFF 4th year $64,593 4 $61,199 $17,931 $10,404 $89,535 $65,451
HRFF 3rd year $59,979 9 $55,947 $16,392 $9,511 $81,850 $56,885
HRFF 2nd year $55,365 11 $49,434 $14,484 $8,404 $72,321 $49,897
*The fringe rate for protective services is higher to reflect the increase pension contributions.
Management/Professional The Management/Professional group are all employees who are not covered by a collective agreement. The Management/Professional Terms and Conditions of Employment, last updated and approved by Common Council on April 8, 2019, cover these employees. Employees in this group include senior positions such as the city manager, commissioners, fire chief, city solicitor, and common clerk. Other management roles vary from operations managers, planners, financial managers and technical engineering managers. Roles classified as “Professional” include those that do not have direct supervisory responsibility and have been determined classified as non-union due to the nature of work.

P a g e | 21
Human Resources │ Annual Workforce Report 2019
Table 22 Pay Band Min Max # in
Band
Average Total
Salary
Fringe (25.5%)
Special Pension (17%) Total Cost Max Total
Salary
Group A $178,257 $196,738 1 $207,576 $52,932 $35,288 $295,796 $207,576
Group A1 $151,724 $167,475 1 $164,884 $42,045 $28,030 $234,960 $164,884
Group B $137,642 $151,933 6 $153,298 $39,091 $26,061 $218,449 $160,782
Group C $110,565 $122,062 16 $121,520 $30,988 $20,658 $173,166 $140,430
Group D $96,166 $111,961 12 $108,392 $27,640 $18,427 $154,458 $144,559
Group E $89,075 $98,315 13 $95,184 $24,272 $16,181 $135,637 $101,014
Group F $82,842 $91,438 28 $89,449 $22,809 $15,206 $127,464 $100,960
Group G $76,396 $84,347 11 $81,482 $20,778 $13,852 $116,111 $84,671
Group H $71,024 $78,438 5 $52,023 $13,266 $8,844 $74,132 $74,964
Non-Union Administrative Non-Union Administrative Staff includes roles such as executive assistant, human resource administrator and administrative assistant in the city solicitor’s office. These roles perform duties similar in nature to inside workers, however, are excluded from the union based on confidentiality and the nature of their work. Non-union follows the pay scale of CUPE Local 486; however, are covered by Terms and Conditions of Employment that were last approved by Council in April 2018.
Table 23
Pay Band Min Max # in
Band Average
Total Salary Fringe
(25.5%)
Special Pension (17%)
Total Cost Max Salary Earned
Group 5 $49,786 $54,775 2 $41,803 $10,660 $7,107 $59,569 $54,985
Group 6 $54,277 $59,771 2 $60,001 $15,300 $10,200 $85,502 $60,001
Group 7 $58,770 $64,766 1 $63,952 $16,308 $10,872 $91,131 $63,952
Group 8 $63,264 $69,755 1 $70,023 $17,856 $11,904 $99,783 $70,023

P a g e | 22
Human Resources │ Annual Workforce Report 2019
Saint John Transit Commission Table 24
Pay Band Hourly Rate
Annual Salary
# in Band
Average Total Salary Fringe (22%) Total Cost Max Salary
Earned Service
Manager $26.95 $50,056 1 $56,218 $12,368 $68,586 $56,218
Driver $29.45 $61,256 61 $57,450 $12,639 $70,088 $76,144
Cleaner $19.33 $40,206 3 $32,144 $7,072 $39,215 $39,374
Mechanic $32.80 $68,224 13 $62,994 $13,859 $76,853 $76,988
Body Main. $32.80 $68,224 2 $59,862 $13,170 $73,032 $65,951
Building $29.45 $61,256 2 $62,743 $13,804 $76,547 $64,178
Table 25 Pay Band Min Salary Max
Salary # in
Band Average
Total Salary Fringe (22%) Total Cost Max Salary Earned
Management* $87,095 $145,339 4 $91,264 $20,078 $111,341 $108,488
Dispatch $58,945 $63,153 5 $60,032 $13,207 $73,239 $65,071
Admin. Assistant & Sales $39,403 $63,496 3 $47,587 $10,469 $58,056 $63,047
*CEO included in Management, position funded 50% by Saint John Transit and 50% Saint John Parking Commission
Saint John Police Force Saint John Police Association
Table 26 Pay Band Max # in Band Average Total
Salary Fringe
(29.3%*) Special Pension (17%)
Total Cost Max Salary Earned
Sergeant $102,126 26 $108,935 $31,918 $18,519 $159,372 $144,025 1st Class Const. $94,627 110 $104,990 $30,762 $17,848 $153,600 $137,671
2nd Class Const. $88,647 1 $106,815 $31,297 $18,159 $156,270 $106,815
4th Class Const. $78,203 2 $73,556 $21,552 $12,505 $107,612 $77,477
*The fringe rate for Protective Services is higher to reflect the increase pension contributions

P a g e | 23
Human Resources │ Annual Workforce Report 2019
Saint John Police Force Management
Table 26 Pay Band Min Max # in
Band Average
Total Salary Fringe
(25.5%) Special
Pension (17%) Total Cost Max Total Salary
Group A $178,257 $196,738 1 $180,693 $46,077 $30,718 $257,487 $180,693
Group B $137,642 $151,933 1 $134,037 $34,182 $22,788 $191,017 $134,037
Group C $110,565 $122,062 2 $122, 626 $31,270 $20,846 $174,742 $125,342
Group D $96,166 $111,961 6 $100,849 $25,717 $17,144 $143,710 $117,516
Group E $89,075 $98,315 0
Group F $82,842 $91,438 4 $62,911 $16,064 $10,709 $89,769 $79,527
Group G $76,396 $84,347 1 $66,911 $17,062 $11,375 $95,348 $66,911
Saint John Police Force: Inside Workers CUPE Local 486 Members of CUPE Local 486 with the Saint John Police Force include positions in the administrative support and specialized positions in criminal areas such as Victim Services and Exhibits and Property Control.
Table 27 Pay
Band Min Max # in Band
Average Total Salary
Fringe (25.5%)
Special Pension (17%) Total Cost Max Salary
Earned
Group 1 $33,614 $36,802 0 Only Casuals in these groups
Group 2 $37,656 $41,303 0
Group 3 $41,697 $45,793 7 $35,862 $9,145 $6,097 $51,103 $52,720
Group 4 $45,738 $50,284 6 $48,691 $12,416 $8,277 $69,385 $51,985
Group 5 $49,786 $54,775 1 $52,779 $13,459 $8,972 $75,210 $52,779
Group 6 $54,277 $59,771 1 $23,112 $5,894 $3,929 $32,935 $23,112
Group 7 $58,770 $64,766 0 - - - - -
Group 8 $63,264 $69,755 3 $52,926 $13,496 $8,997 $75,420 $70,024
Group 9 $67,753 $74,744 2 $77,580 $19,783 $13,189 $110,552 $78,032

P a g e | 24
Human Resources │ Annual Workforce Report 2019
Management: Public Safety Communications Centre (911)
Table 28 Pay Band Min Max # in
Band Average
Total Salary Fringe
(25.5%) Special
Pension (17%) Total Cost Max Total Salary
Group D $96,166 $111,961 1 $107,804 $27,490 $18,327 $153,620 $107,804
Group F $82,842 $91,438 1 $79,527 $20,279 $13,520 $113,520 $79,527
CUPE Local 486: Public Safety Communications Centre (911)
Table 29 Pay
Band Min Max # in Band
Average Total Salary
Fringe (25.5%)
Special Pension (17%) Total Cost
Max Salary Earned
Group 4A $49,170 $54,055 15 $76,334 $19,465 $12,977 $108,776 $113,084
Group 8A $68,008 $74,987 4 $97,437 $24,846 $16,564 $138,848 $116,702

P a g e | 25
Human Resources │ Annual Workforce Report 2019
Wage Increases: 15 Year Summary The resulting wage increases over a fifteen-year period demonstrate the overall impact that rising salary escalation, as compared to consumer price index (CPI), has had on the City’s operating budget.
Table 30
Year CPI Management CUPE Local 486 FIRE CUPE Local
18 SJPA Transit
2004 2.90% 3.00% 4.00% 2.75% 3.50% 4.14%
2005 2.90% 3.00% 4.00% 2.75% 4.00%
2006 3.0% 3.00% 4.00% 2.75% 4.00%
2007 3.25% 3.00% 6.00% 3.25% 4.50%
2008 2.50% 3.50% 5.75% 3.25% 5.75%
2009 0% 3.25% 4.50% 3.50% 4.50%
2010 0% 3.25% 4.50% 3.25% 5.25%
2011 2.90% 3.00% 2.00% 0% 0%
2012 0% 0% 2.00% 0% 0%
2013 2.500% 0% 4.00% 3.00% 6.45%*
2014 2.50% 2.90% 4.00% 3.50% 3.75%
2015 1.00% 2.00% 2.97% 2.50% 3.75%
2016 1.75% 2.25% 2.97% 2.50% 2.75%
2017 2.00% 2.25% 2.97% 2.50% 2.50%
2018 2.00% 2.25% 2.97% 2.50% 2.50%
2019 1.50% 2.25% 2.96% 2.50% 2.50%
Sum of Increases
30.70% 38.90% 59.59% 40.50% 55.70%
Average Increase
1.92% 2.43% 3.72% 2.53% 3.48%
Compounded
Total Increase 35.5% 46.7% 80.0% 49.1% 73.2%
*Included a flat-rate increase of $1,500 and a wage increase of 4.5%

P a g e | 26
Human Resources │ Annual Workforce Report 2019
CPI and Wage Trends (compounded): 2004 – 2019
Chart 6
To put a dollar figure on the above charts, if the City of Saint John would have had pay increases that matched inflation (CPI) over the past 15 years, instead of the significantly higher awards shown above, the municipality would have saved approximately $100 million in total wages. If the City’s current wage escalation policy had been in effect for the same 15 years, since the policy does recognise that there are circumstances where pay raises could be higher than inflation, the savings would have been approximately $50 million in total wages.
Section 7: Observations & Recommendations The Annual Workforce Report 2019 has given the Human Resources Department an opportunity to reflect on all aspects of the range of services we provide to our workforce. Collecting and analyzing the data is only the first step in ensuring our focus and direction is aligned with those of the organization and Council priorities. We have summarized key points from the data and provide the following recommendations. These recommendations will provide direction in 2020 for HR specifically, with support and implementation through all service areas.
Health, Safety and Wellness The health, safety and wellness of employees are of utmost importance. Key observations on this area include:
0.0%
10.0%
20.0%
30.0%
40.0%
50.0%
60.0%
70.0%
80.0%
90.0%
04 05 06 07 08 09 10 11 12 13 14 15 16 17 18 19
771 (Fire) SJPA (Police) 486 (Inside) 18 (Outside)
Management 1182 (Transit) CPI Impact

P a g e | 27
Human Resources │ Annual Workforce Report 2019
• The number of “Lost-time incidents” is high at 24
• Average number of sick days is high at 10.6
• Group benefit costs exceeded contributions by $300,000 in 2019
Recommendations 1. A focus on employee health, safety and wellness including accident prevention through
innovation, collaboration and training should reduce impacts of lost time incidents and sick days.
2. The Workforce Utilization Rate will provide insight on the success of initiatives aimed at improving productivity and finding better ways to measure and track progress. Improvements in Employee health, safety and wellness, including accident prevention and attendance management, are key.
3. Maintaining a sustainable group benefits plan that meets the current and future needs of our workforce and retirees, is essential. Regular review of our contribution rates, providers and benefit levels by the Benefits Steering Committee will ensure sustainability of the plan and planning towards potential future impacts.
Employee Engagement Over 56 percent of the workforce responded to the 2019 Employee Engagement Survey. Major findings are:
• A high level of commitment to the City from employees (8 in 10 respondents)
• Scored higher (77 %) on the “Engagement Index” than the database average (74 %) • Seven in ten employees agree they are compensated fairly • Employees seek additional professional development and training opportunities
Recommendations While we are pleased with these results, we will certainly aim to increase employee engagement and satisfaction through three initiatives in 2020.
1. An Employee Recognition Program will promote and encourage regular and consistent feedback and celebrate success in achieving results.
2. An improved employee digital communications interface will provide us with the ability to quickly and effectively communicate with all employees, give us a medium to showcase our successes, provide instant, consistent messaging, and allow employees to contribute.
Training and Development The 21st century workforce must be equipped to adapt to changing technology and service demands. Key findings in this area include:
• Employees responding the employee engagement survey do not feel they have training or development to support their career goals (6 in 10 respondents)
P a g e | 28
Human Resources │ Annual Workforce Report 2019
• Cost of training and development per City employee is significantly lower than the average provided by the Conference Board of Canada ($579 vs. $889)
• The number of training completions increased significantly in 2019 due to the use of “Safety Hub” the City’s online training platform.
Recommendations The City’s financial challenges dictate restraint in all areas of spending. Therefore, a strategic approach that leverages the knowledge within the workforce will help us further develop employees. Many key positions at the City of Saint John require professional designations (e.g. engineers, water treatment operators, planners, accountants, lawyers, technologists) which dictate training requirements for maintenance and certification.
1. Involve supervisors and other employees in the creation of divisional and sectional work plans that include individual goals and development opportunities.
2. Provide employees various opportunities for training and development through job rotation and participation on special projects where possible.
3. Continue to expand on the offerings provided through the online training platform.
Attraction and Retention Total compensation, work environment and organizational reputation are among the most important tools for successfully competing in local and regional labour markets. To attract and retain talent necessary to provide first-rate service to our community we must ensure we remain competitive given our available resources. Key observations include:
• Number internal promotions to external hires were almost equal.
• We hired almost 250 employees, including casuals, in 2019. The response rate per position was 96 on average.
• Recruitment challenges were primarily in specialized management roles. The challenges most often related to compensation and retirement benefits, primarily in more senior, executive roles.
• Overall, our turnover rates are low. Positive factors contributing to this include salary and benefits, commitment to the organization and job satisfaction as noted in the Employee Engagement Survey.
Recommendations 1. Increase promotion and awareness of the total compensation package offered by the
City of Saint John within our employees groups. Salary and benefits offered are competitive, particularly in entry to mid-level roles. Explore possible a
2. Review recruitment strategy and total compensation package for senior roles to attract and retain candidates for executive level positions. Explore the possibility of additional incentives for specialized managers.

P a g e | 29
Human Resources │ Annual Workforce Report 2019
Section 8: City Manager’s Concluding Remarks I am pleased to present our first Workforce Annual Report. This Report, combined with many other documents and publically-shared information, reaffirms our commitment to transparency and accountability. It is a best-practise amongst large corporations to produce annual reports on the health of their workforce. We are now doing the same and we are doing so based on facts and empirical data. It is essential that we take care of our employees; that we ensure they are given the tools and training necessary to accomplish their work; and that they are well led and well managed. This Report helps inform all of us on our progress and on our challenges in moving further forward. Our employees are the keys to our success. We are, after all, in the service delivery business and there is no excellence in service without excellent employees. As City Manager, I am convinced that we have excellent employees! Our aim, of course, is to keep the workforce healthy (or excellent) in all regards. Not only is it the right thing to do, it also maintains and ideally improves productivity, effectiveness and efficiency. There are many necessary criteria for a successful and healthy workforce. Amongst the most important are: motivation, compensation, discipline, work ethic, overall morale, safety, personal and professional growth, and a work environment where everyone is treated with dignity and respect. This report shows that we are in good shape but have areas that must be addressed. As I have often mentioned, the day we believe that we no longer need to improve is the beginning of our end. Ensuring the best for our workforce does not come with an endless budget. The City of Saint John has significant financial challenges. Our overall costs are increasing at a rate three times faster than our overall revenues. We must increase our revenues but we must also control our costs. The budget of a city is no different than the budget of a family. We must live within our means. If we can’t make more money, then we need to cut back. The City of Saint John has documented all of its ongoing efforts to increase revenues through local initiatives and, more importantly, through transformational reforms such as comprehensive tax reform and regional cost-sharing. Increasing our revenue is a large part of the solution but costs must also be curtailed. To control expenses, the City is exploring all possible ways to reduce operating costs. As part of this, the City must recognise that 57% of its operating budget is spent on wages and benefits and that our average yearly wage increases hover around 3%, while our revenue growth is significantly lower. This is not sustainable. We are spending more than we make. We must collectively work to get these costs under control so that we can ensure the future of all services to our taxpayers. We must also complete an exhaustive review (over a period of time) of our current collective agreements to address any restrictive clauses that are limiting our ability to be flexible, agile and innovative. We must be as effective and efficient as possible while continuing to care for the needs of our workforce. While a reduction in employee costs is key to our financial sustainability, we are fully committed to furthering our health and safety programs and the training and development of

P a g e | 30
Human Resources │ Annual Workforce Report 2019
our employees. Some of the recommendations put forth in this report, such as the implementation of an employee recognition program will begin in the short term. Others, such as creating a culture of learning and development, will unfold over a number of years. However, the work must begin now. Our Employee Engagement Survey has solidified something I suspected about our workforce. Our employees are passionate about delivering services to the residents of our City. We will continue to find ways to do so in our resource-constrained environment and we will do so in a manner that is appropriate to our employees. The Survey also highlighted several smaller ideas to pursue. Although they are not part of this Report, they will form part of our work plan for 2020 and 2021.
My special thanks to our Human Resources Department for preparing this document. I fully support their observations, findings and recommendations. More importantly, we now have all of the relevant data on our workforce in a singular document. Since this is our first year preparing this Report, we will seek feedback for possible improvements in the out years. We are in the middle of great change and we have a lot of hard work ahead of us. I am confident that the same passion and professionalism our employees apply to their work every day will help us achieve our mission. “Grow the City. Serve the City. Become the community of choice.” John C Collin City Manager