annual shareholders meeting 13 september 2007
DESCRIPTION
Annual Shareholders Meeting 13 September 2007. Chairman’s Review Rob Challinor. Overview of Investing Activities. Listed 26 October 2006 - $100m subscribed - $ 97m after issue costs To 30 June 2007: Total surplus of $21.3 million after tax - PowerPoint PPT PresentationTRANSCRIPT
Annual Shareholders
Meeting
13 September 2007

Chairman’s Review
Rob Challinor

Overview of Investing Activities• Listed 26 October 2006 - $100m subscribed - $ 97m after issue
costs
• To 30 June 2007:
– Total surplus of $21.3 million after tax
– Total net assets $120m
– Net Asset Value up 23% to $1.20 compared with 10% benchmark
– Market value of shares up 13% and warrants up 32%
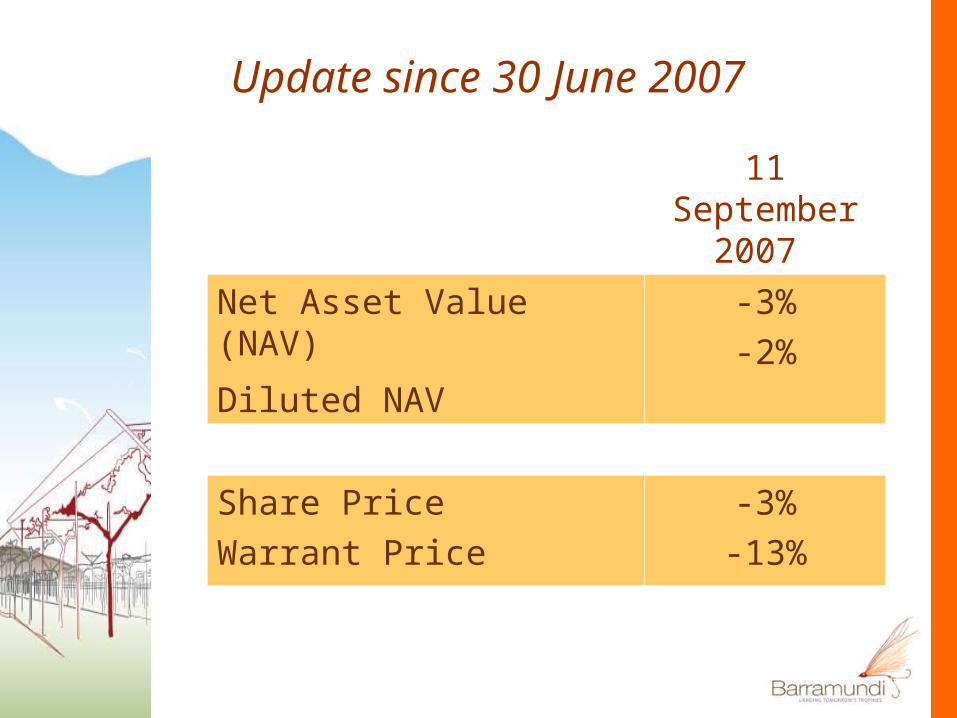
Update since 30 June 2007
11 September
2007
Net Asset Value (NAV)
Diluted NAV
-3%-2%
Share PriceWarrant Price
-3%-13%
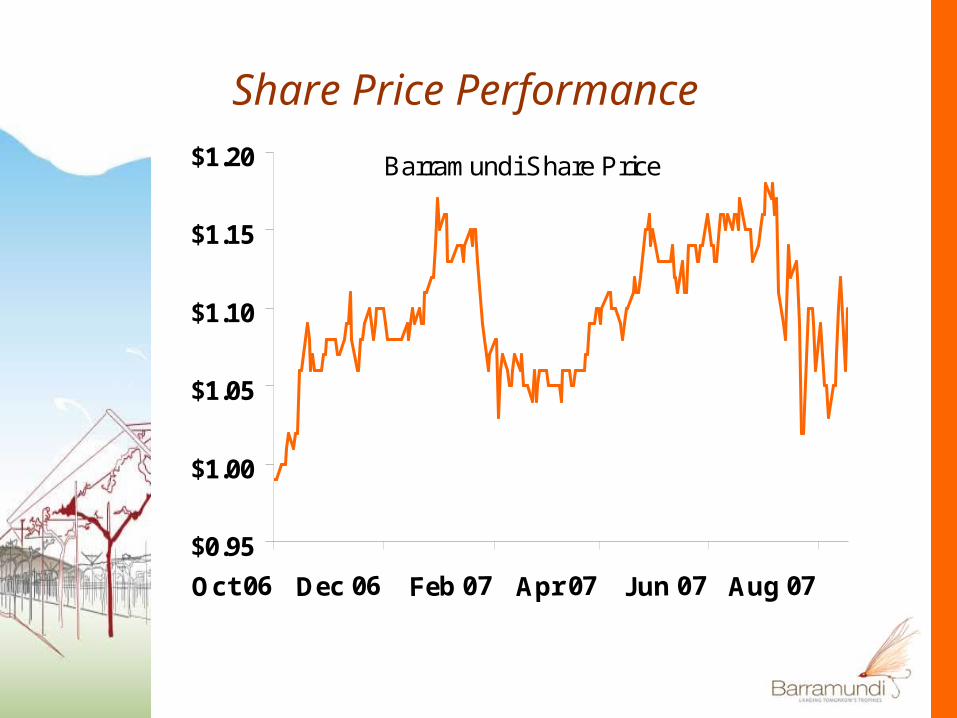
Share Price Performance
Barramundi Share Price
$0.95
$1.00
$1.05
$1.10
$1.15
$1.20
Oct 06 Dec 06 Feb 07 Apr 07 Jun 07 Aug 07
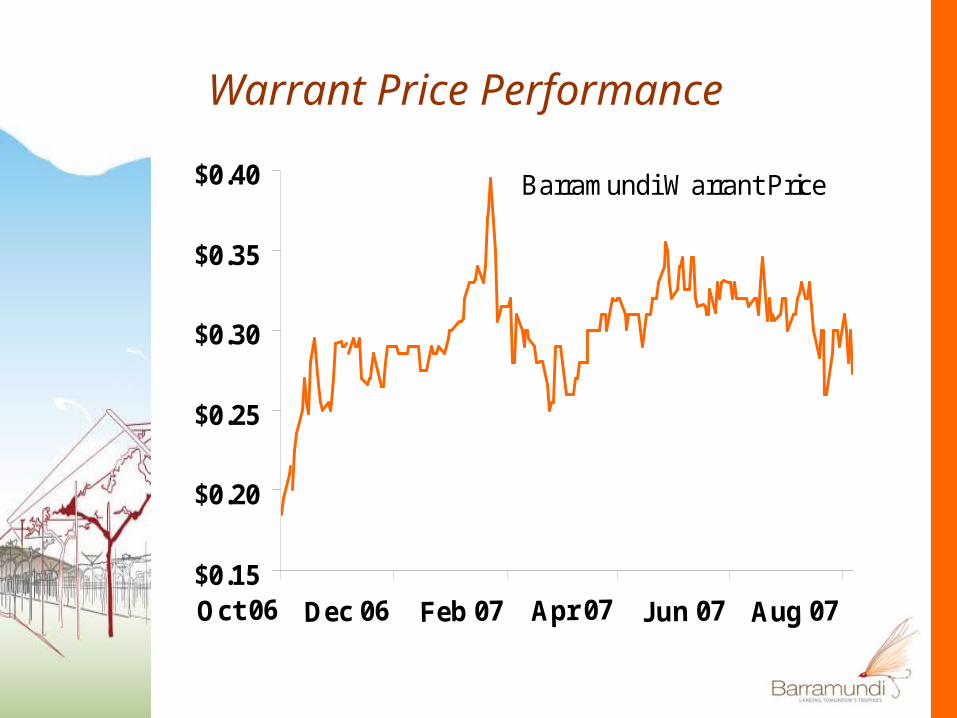
Warrant Price Performance
Barramundi Warrant Price
$0.15
$0.20
$0.25
$0.30
$0.35
$0.40

Share Price Premium/(Discount) to Diluted NAV
-10%
-5%
0%
5%
10%
15%
20%
Oct06
Dec06
Feb07
Apr07
Jun07
Aug07

NAV $m
No. Shares (m)
NAV per share
NAV 30 June 2007 120 100 $1.20
Warrants exercisable: 26 Oct 07 to 25 Oct 09
50 50 -
Diluted NAV 170 150 $1.1
3
Share Price 30 June 2007
$1.1
3
Discount to Diluted NAV
nil
Diluted Net Asset Value Calculation
– PIE Regime means not necessary to separate long and short term investments
– Short form amalgamation effected 31 August 2007
– Assets and liabilities of Barra Holdings and Barra Nursery transferred to Barramundi Limited
– Barra Holdings and Barra Nursery no longer exist
Amalgamation under Companies Act 1993
Manager’s ReportCarmel Fisher
Fisher FundsSeptember 2007

Agenda
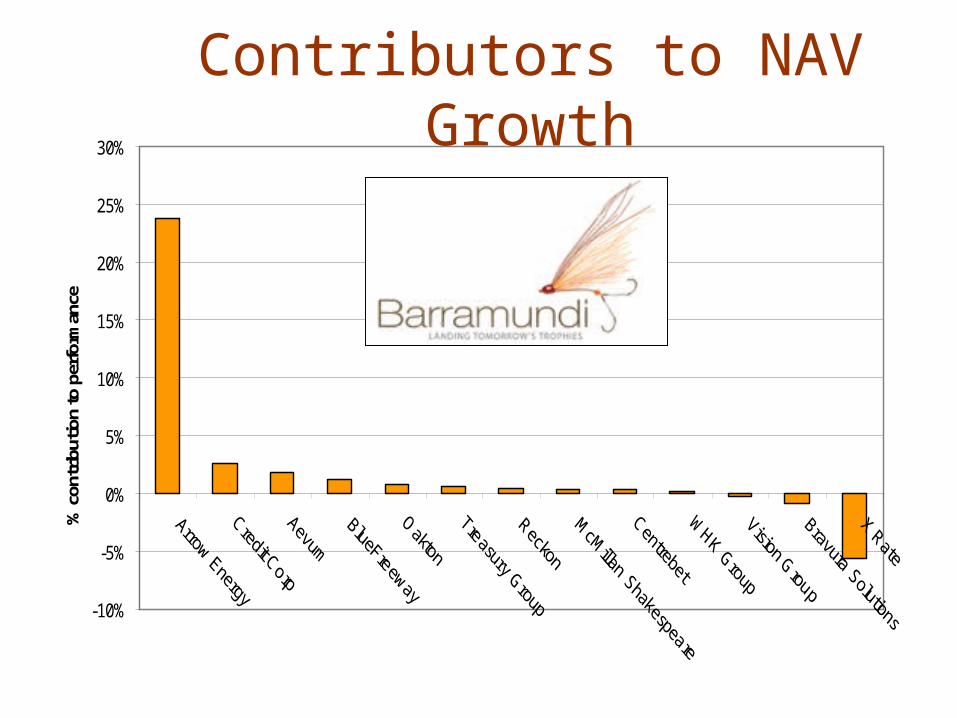
• Review of June 2007 year – major contributors
• Review since balance date• Exam results – the fiscal year
2007 results season• Outlook
The Year to June 2007Highlights
• Built Barramundi portfolio – 16 of Australia’s best growth companies
• Enjoyed strong share price performance from a number of portfolio companies
• Placements and capital raisings allowed discounted volume access to several stocks
Lowlights
• Strong kiwi dollar took lustre off early returns
-10%
-5%
0%
5%
10%
15%
20%
25%
30%
% c
ontr
ibut
ion
to p
erfo
rman
ceContributors to NAV
Growth
-50%
0%
50%
100%
150%
200%
250%
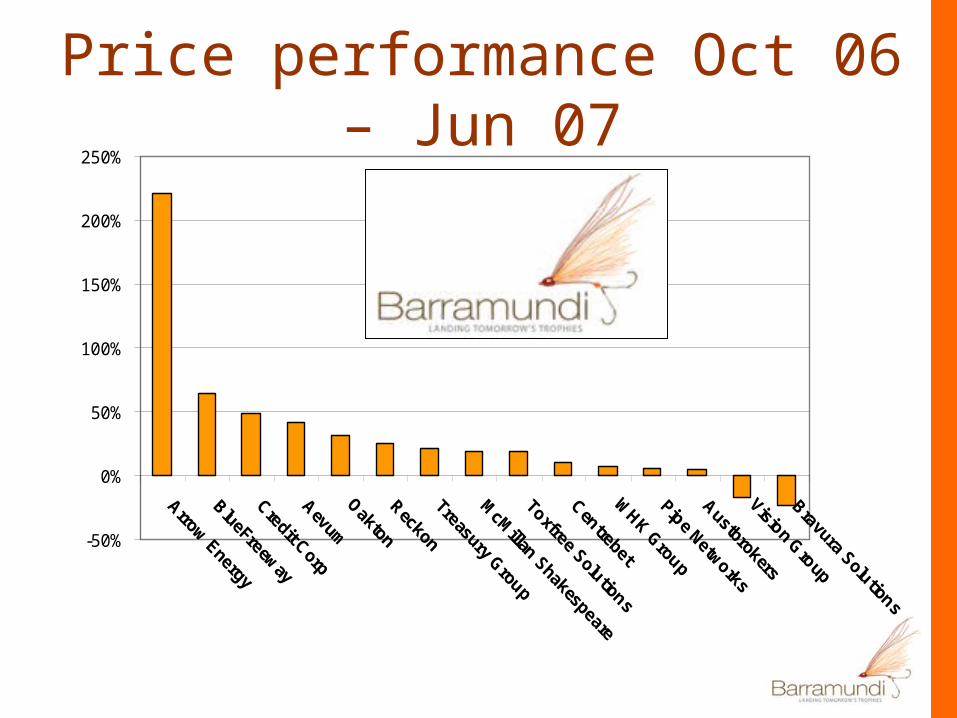
Price performance Oct 06 – Jun 07
-50%
-25%
0%
25%
50%
75%
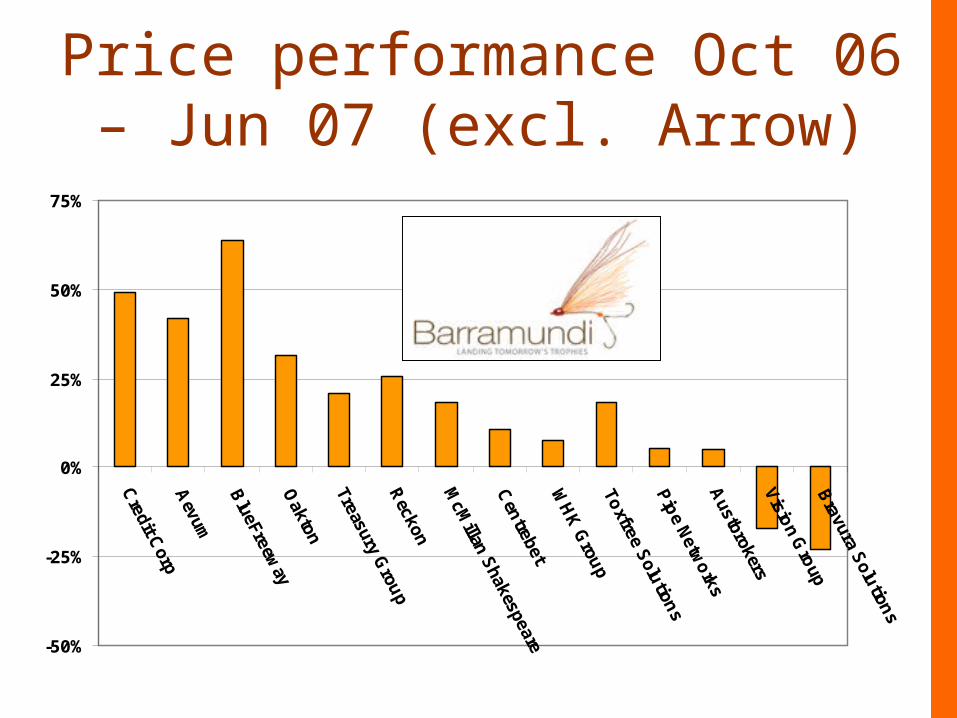
Price performance Oct 06 – Jun 07 (excl. Arrow)

-50%
0%
50%
100%
150%
200%
250%
Arrow Energy
BlueFreeway
Credit Corp
Aevum
Oakton
Reckon
Treasury Group
McM
illan Shakespeare
Toxfree Solutions
Centrebet
WHK Group
Pipe Networks
Austbrokers
Vision Group
Bravura Solutions
Arrow Energy’s contribution
Share Price up 221% on average
purchase price
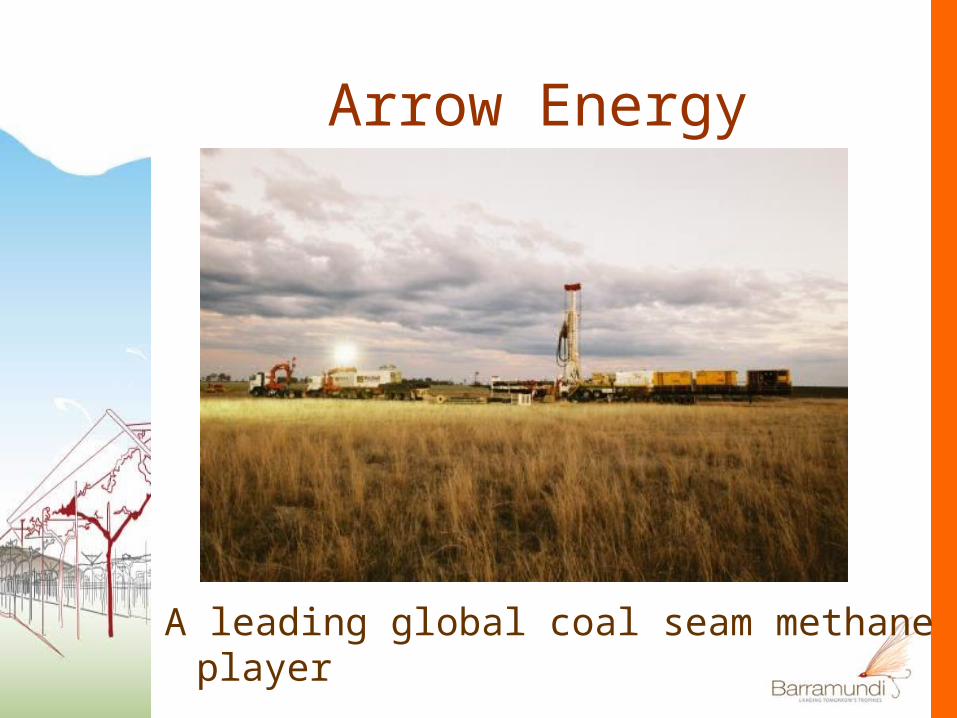
Arrow Energy
A leading global coal seam methane player

-50%
0%
50%
100%
150%
200%
250%
Credit Corp’s contribution
Share Price up 49% on average
purchase price

Credit Corp
Australia’s premier debt collector
-50%
0%
50%
100%
150%
200%
250%
Arrow Energy
BlueFreeway
Credit Corp
Aevum
Oakton
Reckon
Treasury Group
McM
illan Shakespeare
Toxfree Solutions
Centrebet
WHK Group
Pipe Networks
Austbrokers
Vision Group
Bravura Solutions
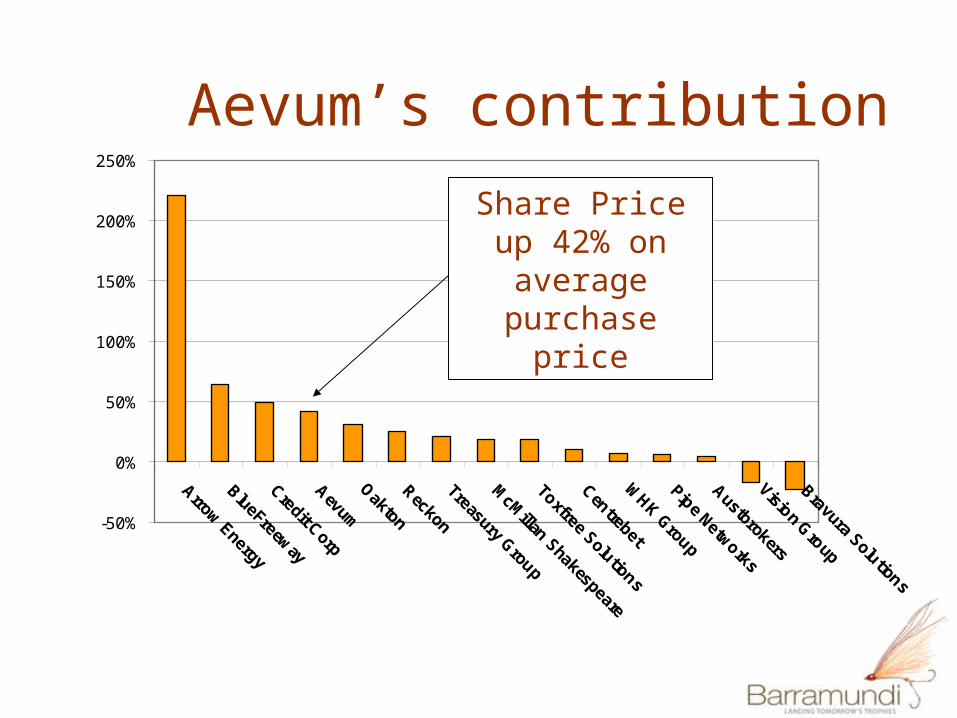
Aevum’s contribution
Share Price up 42% on average
purchase price

Aevum
Retirement living – great locations
Golden Ponds – Forster – Northern NSW Coast
-1.50%
-1.00%
-0.50%
0.00%
0.50%
1.00%
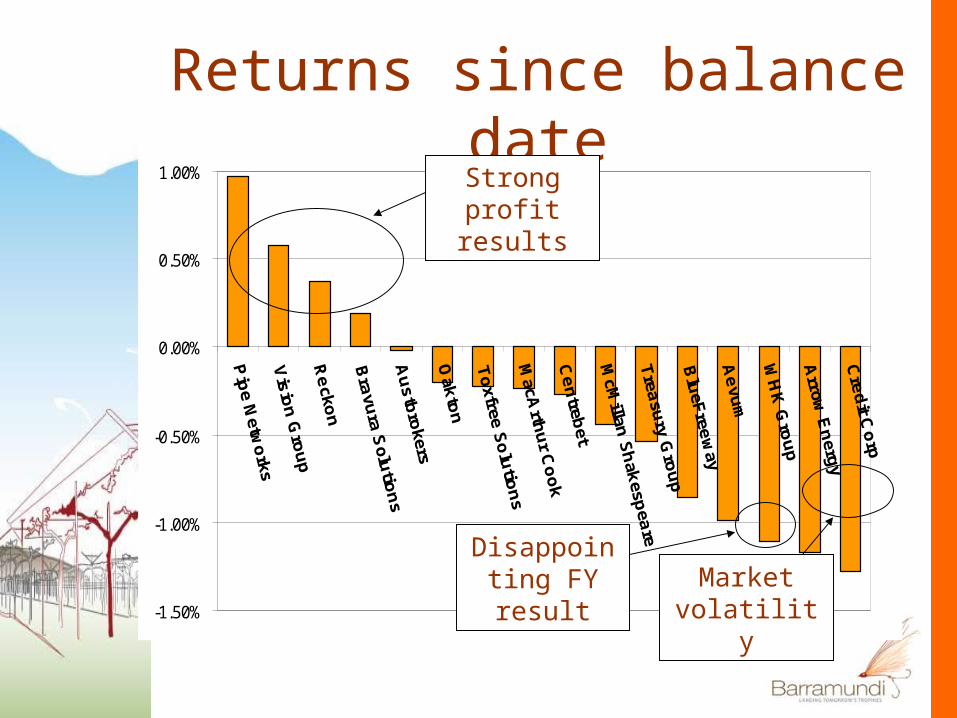
Returns since balance dateStrong profit
results
Market volatility
Disappointing FY result

2007 results – earnings growth
Arrow Energy na
Austbrokers 22.1%
Aevum 42.0%
BlueFreeway na
Bravura Solutions 32.0%
Credit Corp 26.0%
Centrebet 214.4%
Macarthur Cook 36.9%
McMillan Shakespeare 16.8%
Oakton 38.6%
Pipe Networks 47.0%
Reckon 18.8%
Treasury Group 16.8%
Toxfree Solutions 35.0%
WHK Group 9.7%
Vision Group Limited 11.8%
Average 40.5%
First full year of profits
Disappointing – margin
pressure in accounting business
6th consecutive year of 25%+ EPS growth
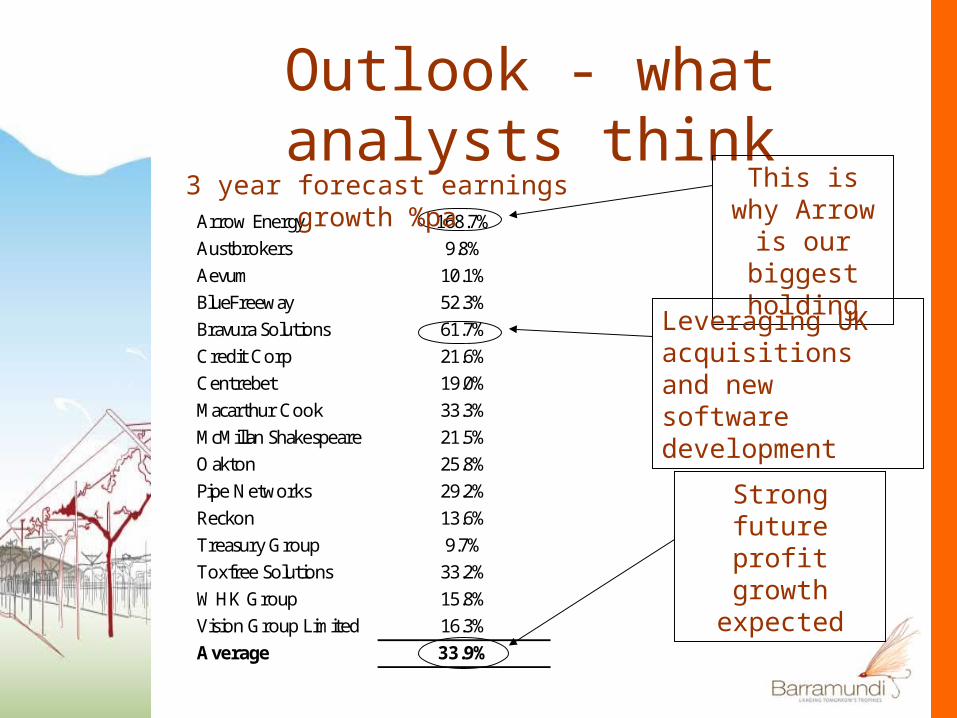
Arrow Energy 168.7%
Austbrokers 9.8%
Aevum 10.1%
BlueFreeway 52.3%
Bravura Solutions 61.7%
Credit Corp 21.6%
Centrebet 19.0%
Macarthur Cook 33.3%
McMillan Shakespeare 21.5%
Oakton 25.8%
Pipe Networks 29.2%
Reckon 13.6%
Treasury Group 9.7%
Toxfree Solutions 33.2%
WHK Group 15.8%
Vision Group Limited 16.3%
Average 33.9%
Outlook - what analysts think
This is why Arrow is our
biggest holding
Strong future profit growth
expected
Leveraging UK acquisitions and new software development
3 year forecast earnings growth %pa

Our thoughts• We firmly believe we own some of
Australia’s best listed growth stocks• We are confident that the executives
of our companies will make the right “macro” decisions
• We believe it important to focus on our companies’ achievements rather than on the mood of the market
• Our best “value-add” is our extensive company visit schedule and networks

Our thoughts• The two main components of our
investments success are the stock selection and portfolio composition
• The PIE regime will be beneficial as we can more actively manage portfolio composition
• Our stock selection processes have not and will not change
• We continue to see plenty of interesting opportunities

Questions

• What is it?– Legislation, commencing 1 October
2007, changes the way managed funds (including Listed Investment Companies) are taxed
– Removes tax disadvantages to those investing in managed funds and leaves the investor in the same (or better) position whether they invest in equities directly or via a managed fund
Portfolio Investment Entity Regime

• Key Benefits to Barramundi:– Barramundi no longer taxed on capital gains
on sale of investments held on revenue account (previously held by Barra Nursery Limited)
– Distributions to shareholders will be excluded from their income tax returns
– As a PIE, there will no longer be a restriction on the distribution of capital gains to shareholders
– The ability to simplify the legal and reporting structure of the Group (through amalgamation) which will result in lower costs
Portfolio Investment Entity Regime
– Certain Australian equities will attract tax on a flat 5% of opening market values (primarily those stocks not listed on the ASX/S&P All Ordinaries Index – top 500 listed stocks)
– Dividends and any capital gains on these stocks will no longer be taxable
– Where gains on these stocks are > 5%, the fixed tax payable will represent a tax saving
– Where gains are <5%, the fixed tax payable will represent additional tax
– At 31 August 2007 Barramundi had 16% of the portfolio invested in ‘caught’ Australian equities
Foreign Investment Fund Regime