annual results: year to 26 th april 2012 - rns submit · annual results: year to 26 th april 2012...
TRANSCRIPT

Center Parcs
Annual Results: Year to 26th April 2012
16th October 2012Investor Presentation

2
Agenda
Overview1
2 Key Financial Highlights
3 Financial Covenants
4
5
Capital Investment
Woburn:- 5th Site Update
Appendices
Appendix I: Financial Calendar & Contacts
FY13 Quarter 1 Update6
Summary7
3
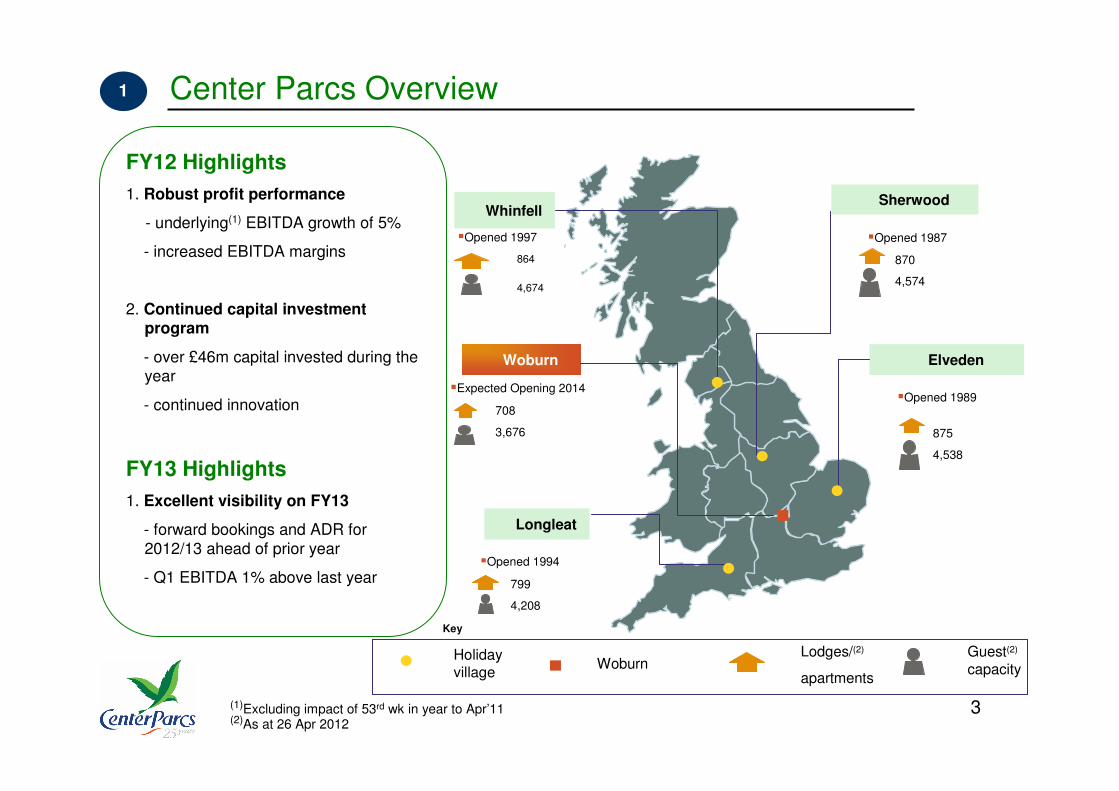
Center Parcs Overview
Holidayvillage
Sherwood
�Opened 1987
870
4,574
Elveden
�Opened 1989
Longleat
�Opened 1994
Woburn
�Expected Opening 2014
Whinfell
�Opened 1997
799
4,208
864
4,674
WoburnLodges/(2)
apartments
Guest(2)
capacity
Key
708
3,676
(1)Excluding impact of 53rd wk in year to Apr’11(2)As at 26 Apr 2012
1
FY12 Highlights
1. Robust profit performance
- underlying(1) EBITDA growth of 5%
- increased EBITDA margins
2. Continued capital investment program
- over £46m capital invested during the year
- continued innovation
FY13 Highlights
1. Excellent visibility on FY13
- forward bookings and ADR for
2012/13 ahead of prior year
- Q1 EBITDA 1% above last year
875
4,538

4
Key Financial Highlights
3.9%£136.62RevPAV
3.1%£140.73ADR
0.8%97.1%Occupancy
0.9%45.8%Operating Margin(1)
2.5%£133.6mEBITDA(1)
0.4%£291.7mRevenue
Financial year 2012 % change v 2011
Resilient performance in challenging trading environment
(1)before owners costs and exceptional items
2

5
Revenue Performance
£m£mRevenue
(2.3)%122.5125.4On-site
+0.4%291.7290.5Total
+2.5%169.2165.1Accommodation
(1) Increase in ADR (1) Extra week’s trading in FY11
(2) Higher occupancy (2) Increase in VAT to 20% from Jan 2011
(3) Increased underlying on site spend (3) Transfer of 16 units to Concessions in FY12
2.1
FY11 FY12
53 wks 52 wks % changeApr ‘11 Apr ‘12
+ ve’s - ve’s
Key Drivers of Revenue Change FY12 vs FY11

6
290.5
(5.8)
(5.6)
(4.0)275.1
5.9
10.7
291.7
270.0
275.0
280.0
285.0
290.0
295.0£
m
VAT
Week
53
Conce
ssion
chan
gesRev
ised
base
On-
site sp
end
Accom
mod
atio
n
Revenue Bridge: FY11 to FY12
Revenue Performance2.2
Underlying growth of 6.0%
FY11
FY12
+5.1%
+6.8%
Underlying Growth +6%

7
Financing Structure
Secured Financing Development Facility
£1,020m Debt: £740m Class A
£280m Class B
£165m Debt
Supported by strong and predictable cashflows
3
CPUK Finance Ltd CP Woburn (Operating Company) Ltd
8
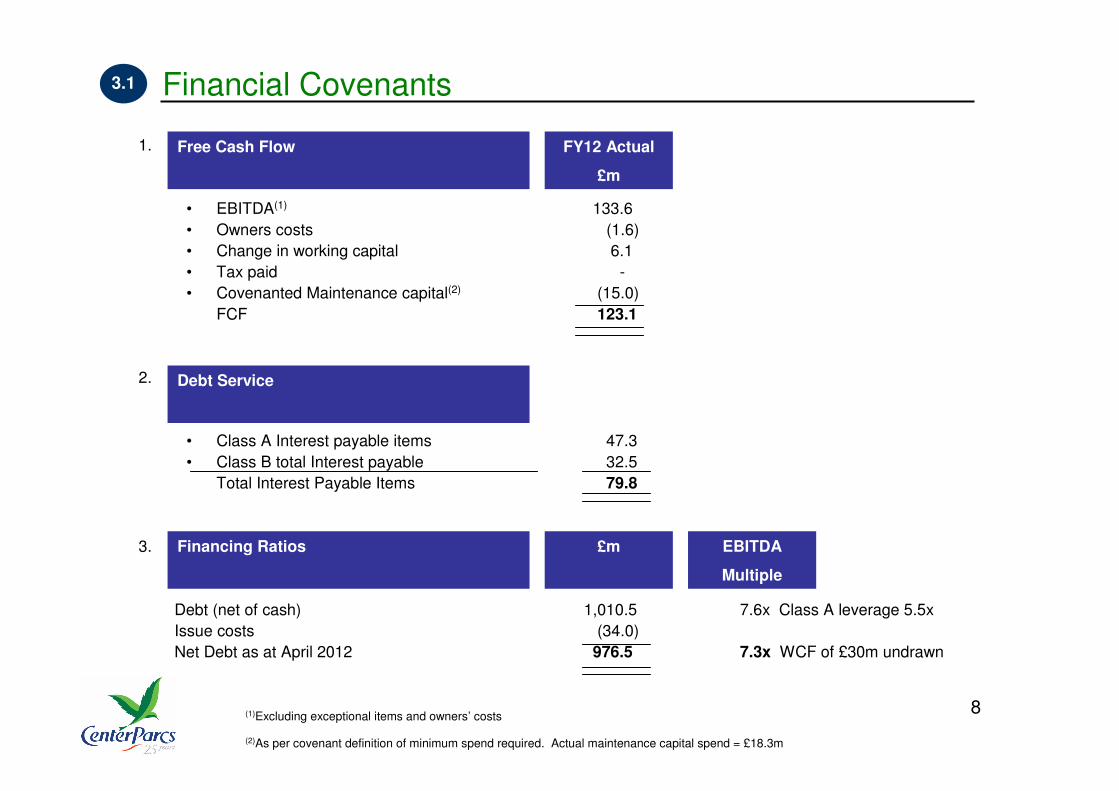
Financial Covenants
1.
• EBITDA(1) 133.6
• Owners costs (1.6)
• Change in working capital 6.1
• Tax paid -
• Covenanted Maintenance capital(2) (15.0)
FCF 123.1
2.
• Class A Interest payable items 47.3
• Class B total Interest payable 32.5
Total Interest Payable Items 79.8
3.
Debt (net of cash) 1,010.5 7.6x Class A leverage 5.5x
Issue costs (34.0)
Net Debt as at April 2012 976.5 7.3x WCF of £30m undrawn
3.1
FY12 Actual
£m
Free Cash Flow
Debt Service
Financing Ratios £m EBITDA
Multiple
(1)Excluding exceptional items and owners’ costs
(2)As per covenant definition of minimum spend required. Actual maintenance capital spend = £18.3m
9
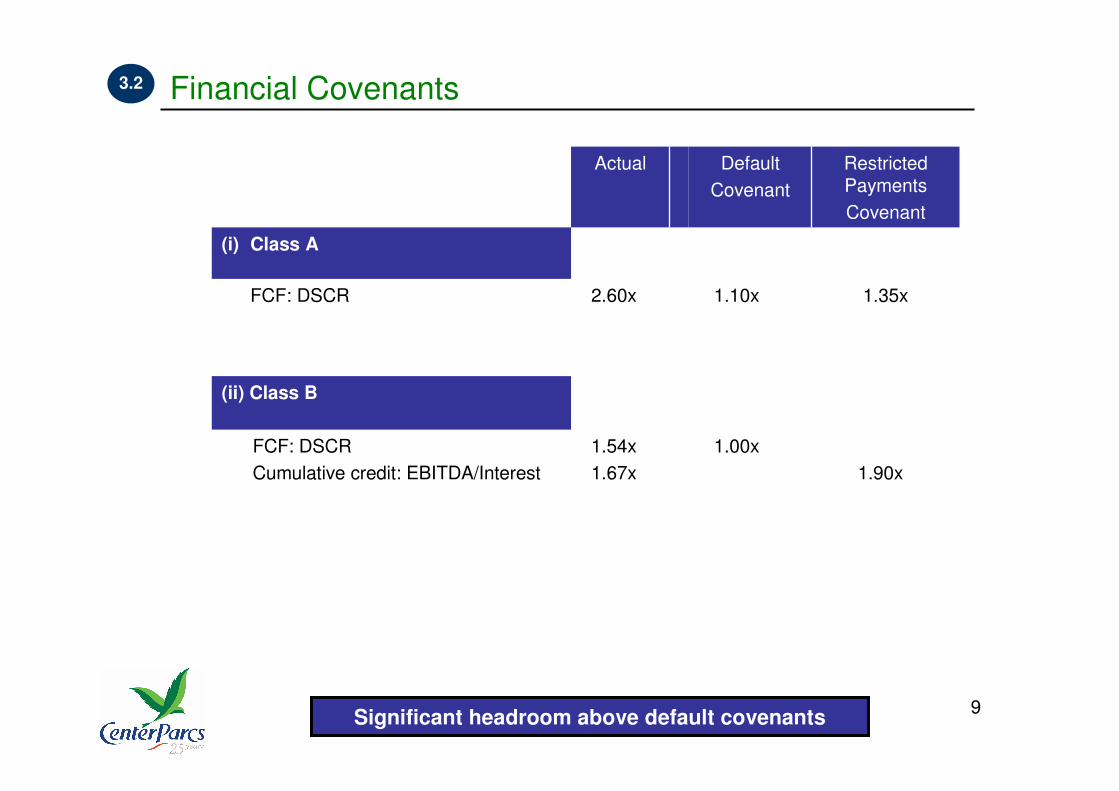
Financial Covenants
1.00x
1.10x
Default
Covenant
(ii) Class B
1.35x2.60xFCF: DSCR
1.90x
1.54x
1.67x
FCF: DSCR
Cumulative credit: EBITDA/Interest
(i) Class A
Restricted Payments
Covenant
Actual
3.2
Significant headroom above default covenants
10
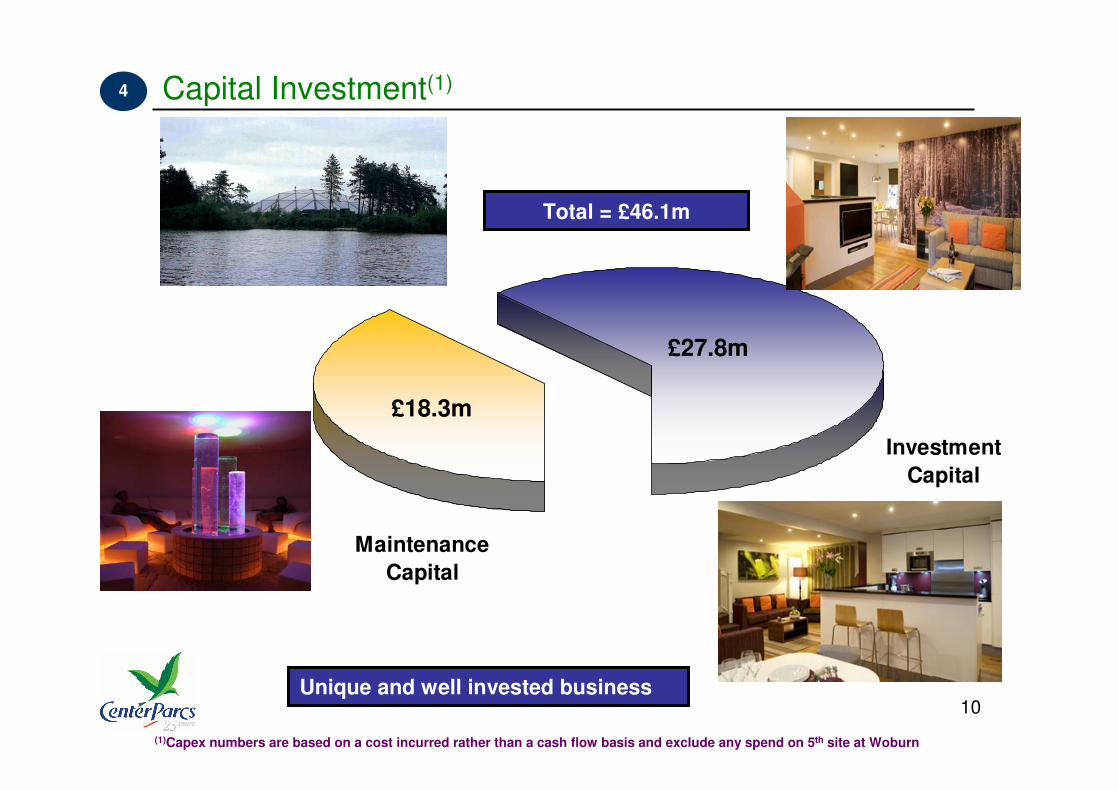
Capital Investment(1)
Maintenance
Capital
Investment
Capital
£18.3m
£27.8m
4
Unique and well invested business
(1)Capex numbers are based on a cost incurred rather than a cash flow basis and exclude any spend on 5th site at Woburn
Total = £46.1m

11
Investment Capital
Major Lodge
Refurbishments
Project Atlantis
Investment Projects
£8.4m
£3.0m
£16.4m
4.1
Total = £27.8m

12
Capital Investment: Major Villa Refurbishments
1. No. of Refurbishments in FY12 No.
Sherwood 98
Elveden 108
Whinfell 101
307
2. Major Refurbishments since FY08
No. %
Refurbished units to Apr ‘12 1,940 57%
New builds 105 3%
2,045
To be refurbished 1,363 40%
Total units of accommodation 3,408 100%
60% of units either new or refurbished -
around 300 units to be refurbished in FY13
4.2
60%

13
Capital Investment: FY12 New Builds
5 x Woburn prototypes at Sherwood 3 x Longleat Treehouses
4 x Elveden Spa Suites4 x Woburn prototypes at Elveden
4.3
New builds continue to generate strong returns
14
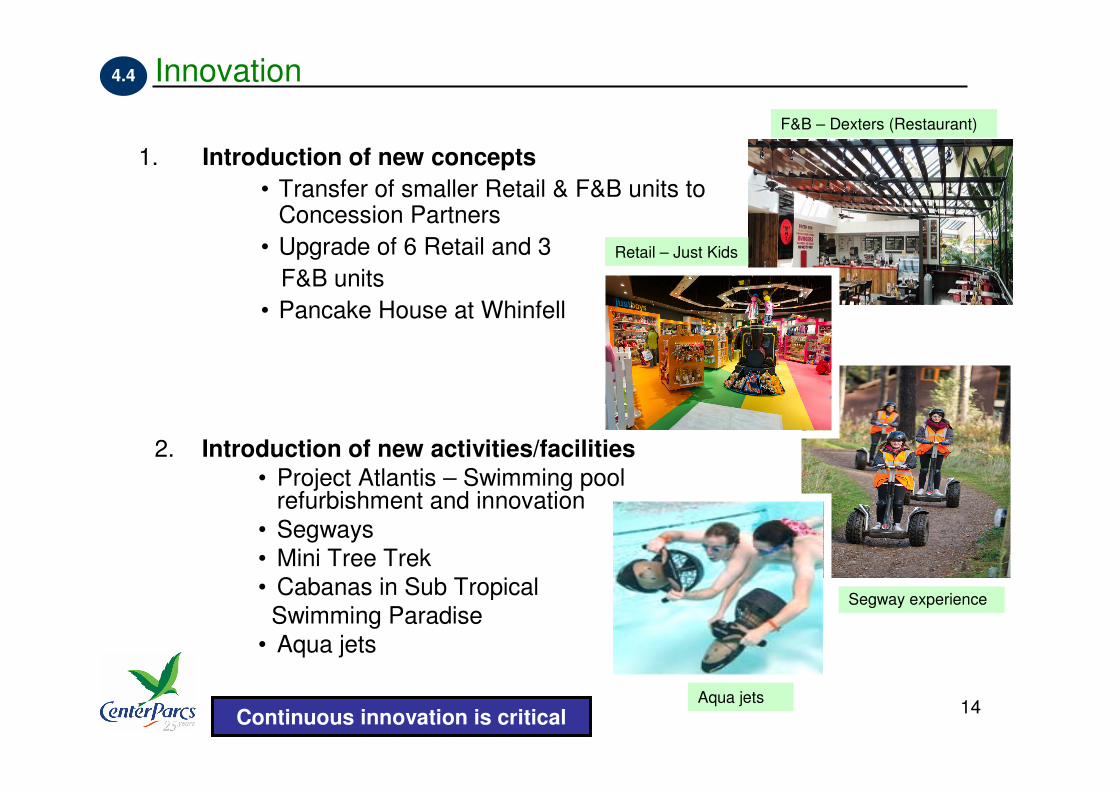
Innovation
1. Introduction of new concepts
• Transfer of smaller Retail & F&B units to Concession Partners
• Upgrade of 6 Retail and 3
F&B units
• Pancake House at Whinfell
2. Introduction of new activities/facilities
• Project Atlantis – Swimming pool refurbishment and innovation
• Segways
• Mini Tree Trek
• Cabanas in Sub Tropical
Swimming Paradise
• Aqua jets
Retail – Just Kids
F&B – Dexters (Restaurant)
Segway experience
Aqua jets
4.4
Continuous innovation is critical

15
Woburn Overview: 5th Site Development
Overall Programme
• On schedule for Spring 2014 Opening
• c.85% of project contracted & within original cost plan
Infrastructure
• Birse on site from 14th May – slightly ahead of original
programme
Central Buildings
• Contract signed with Bowmer & Kirkland
• B&K started on site 15th October 2012
Lodges
• Contract signed with ISG
• Due to start on site 26th November 2012
Development on schedule and budget
Lake
Centre 1
Centre 2
5

16
FY13 Quarter 1 Update
Overview of 12 weeks to 19th July 2012
1. Record levels of occupancy: 98.7% for Q1 (FY12 Q1:97.8%)
2. ADR and RevPAV ahead of prior year
3. Adjusted EBITDA 1% ahead of prior year
4. Strong forward bookings: 75.5% of FY13 capacity booked as at 12th October 2012 (FY12: 70.2%)
5. Q2 EBITDA growth expected to be stronger than Q1 growth
6
Strong performance in current financial year

17
Summary
1. Strong underlying performance in challenging trading environment
2. Business continues to significantly invest and generate strong returns - continuous innovation remains key
3. Good cash generation, with net debt reducing and significant levels of headroom on covenants
4. 5th site at Woburn on timetable and budget
5. Good start to new financial year, with strong forward bookings
7
Continuing excellent long term track record
18
Questions

19
Financial Calendar & Contacts
Contacts
• Paul Mann
Group Financial Accountant
Tel: 01623 821 649
Email: [email protected]
• Paul Inglett
Finance Director
Tel: 01623 821 621
Financial Calendar
• 16th October 2012
Annual results FY12
Quarter 1 results FY13
• Late November 2012
Quarter 2 results FY13 for period to 11th October 2012
• Mid February 2013
Quarter 3 results FY13 for period to 3rd January 2013