annual results presentation november 2013
TRANSCRIPT

www.tigerbrands.co.za
TIGER BRANDS LIMITEDRESULTS PRESENTATION TO INVESTORS
for the Year ended September 2013

Group Grains Nigeria Exports and InternationalConsumer Brands2
Agenda
Strategic Review Financial AnalysisBusiness
PerformanceGrains
Business Performance
Consumer Brands
Business PerformanceInternational
Outlook

www.tigerbrands.co.za
Strategic ReviewPeter Matlare
Chief Executive Officer

Group Grains Nigeria Exports and InternationalConsumer Brands
Overview
• Trading conditions in South Africa remain challenging
– On-going financial pressures on Consumers
– Intensely competitive landscape with manufacturers and retailers vying for volume growth
– Higher input costs and inability to fully recover costs through price increases
• Disappointing Groceries and Milling performance
– Volume and margin pressures in an intensely competitive environment
– Rising cost inflation exacerbated by Rand weakness
– Corrective action being taken to address areas of underperformance in the group
• Dangote Flour Mills
– Good assets and strong market position
– However, trading performance has been disappointing
4

Group Grains Nigeria Exports and InternationalConsumer Brands
Overview
• Positive strides made in strategic journey towards building a sustainable platform
– Strategic initiatives outlined in prior year aimed at regaining volume share in the domestic market starting to bear fruit, albeit with some margin erosion
– Core brands have retained their market leading positions
• Excellent performance achieved by the rest of the group’s exports andinternational businesses
5
Group Grains Nigeria Exports and InternationalConsumer Brands
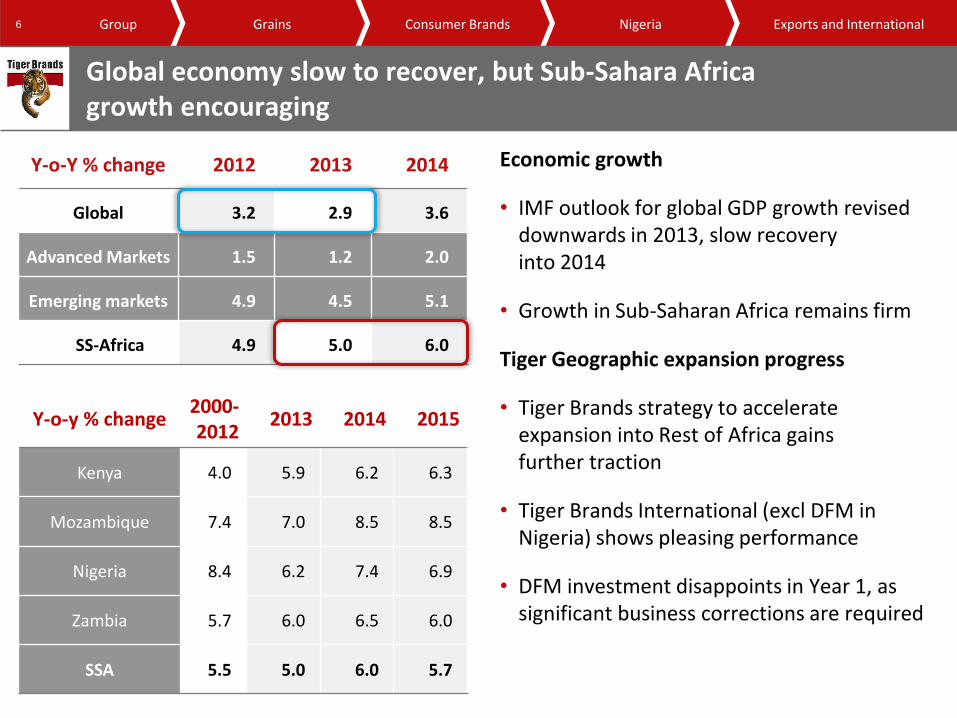
Global economy slow to recover, but Sub-Sahara Africagrowth encouraging
Y-o-Y % change 2012 2013 2014
Global 3.2 2.9 3.6
Advanced Markets 1.5 1.2 2.0
Emerging markets 4.9 4.5 5.1
SS-Africa 4.9 5.0 6.0
Economic growth
• IMF outlook for global GDP growth revised downwards in 2013, slow recoveryinto 2014
• Growth in Sub-Saharan Africa remains firm
Tiger Geographic expansion progress
• Tiger Brands strategy to accelerate expansion into Rest of Africa gainsfurther traction
• Tiger Brands International (excl DFM in Nigeria) shows pleasing performance
• DFM investment disappoints in Year 1, as significant business corrections are required
Y-o-y % change2000-2012
2013 2014 2015
Kenya 4.0 5.9 6.2 6.3
Mozambique 7.4 7.0 8.5 8.5
Nigeria 8.4 6.2 7.4 6.9
Zambia 5.7 6.0 6.5 6.0
SSA 5.5 5.0 6.0 5.7
6

Group Grains Nigeria Exports and InternationalConsumer Brands
Context for Performance
-4
-2
0
2
4
6
8
2001-Q1 2003-Q2 2005-Q3 2007-Q4 2010-Q1 2012-Q2 2014-Q3
Yo
Y%
ch
ange
Real GDP growth • Slowdown in domestic GDP growth expected in 2013 due to weak global demand and adverse effect ofindustrial unrest
• Negative impact of unemployment, high debt levels and above inflationary increases on consumer expenditure
• Non-durable goods consumer spend slows to +2.1% in 2013 with limited recovery expected in 2014
• Competitive environment intensifies
Y-o-Y % change 2010 2011 2012 2013 2014
Durable goods 18.8 15.8 11.0 6.2 6.1
Semi-durable goods
3.6 5.9 6.2 5.9 5.2
Non-durable goods 1.8 3.1 2.5 2.1 2.5
Services 4.0 3.5 1.8 0.9 3.0
Total FCE –
Volume growth4.4 4.8 3.5 2.5 3.5
7

Group Grains Nigeria Exports and InternationalConsumer Brands
Market trends show slow recovery(categories in which Tiger participates )
0,00
1,00
2,00
3,00
4,00
5,00
6,00
7,00
8,00
9,00
10,00
Mat LY vsMat TY
H1 Curr vs H1YA
H2 Curr vs H2YA
6mm Curr vsPrev
Total South AfricaCategory Volume and Value Growth Trends
Category Value Growth Category Volume Growth
Market recovery slow
• Volumes show small positive recovery over the last 12 months compared tothe same period last year
• H2 2013 reported slightly stronger volume growth of 2%
Leading brands
• Market shares now stable as we focuson price management and shopper activation
• Tiger Brands continues to maintain the No.1 or 2 position across most of the categories in which it participates
8
Source: Nielsen September 2013
7,26,9
7,6
1,4
0,7
2,0
0,4 0,6

Group Grains Nigeria Exports and InternationalConsumer Brands
Progress on business strategy - Domestic
Domestic performance disappointing
• However, cost saving programme deliversgood returns
– Common ERP platform
– Shared F & A service
– Centralised procurement
– Competitive Supply Chain
• Savings invested into price point management and shopper activation
• Market shares stabilised
9
Volume
&
Sales
Growth
Supported by single-enabling IT platform
Operating
LeverageR500m
annualised
Cost
savings
within 4
years
Sustained
profitable
growth
& cash flow
Brand
investment
&
Innovation

Group Grains Nigeria Exports and InternationalConsumer Brands
Solid top-line organic growth boosted by contributionfrom acquisitions
10
R22,7bn 22,7 22,7 22,7 22,7
5,8%
0,6% 1,9%
10,7% R27,0bn
20,0
21,0
22,0
23,0
24,0
25,0
26,0
27,0
28,0
2012 Turnover Pricing inflation Volume Forex Acquisitions 2013 Turnover
R'b
illio
ns
+8,4% Organic Growth

Group Grains Nigeria Exports and InternationalConsumer Brands
Tough trading performance in Milling, Groceries and DFM
11
R3,5bn
-5,2%
-5,1%
-0,8%
+10,7%
R3,1bn
-11,2%
2 800,0
2 900,0
3 000,0
3 100,0
3 200,0
3 300,0
3 400,0
3 500,0
2012 EBIT Milling Groceries Rice Rest of Group(ex DFM)
DFM 2013 EBIT
R3,1bn
Movement reflected as percentage of 2012 operating income before abnormal items
Group Grains Nigeria Exports and InternationalConsumer Brands
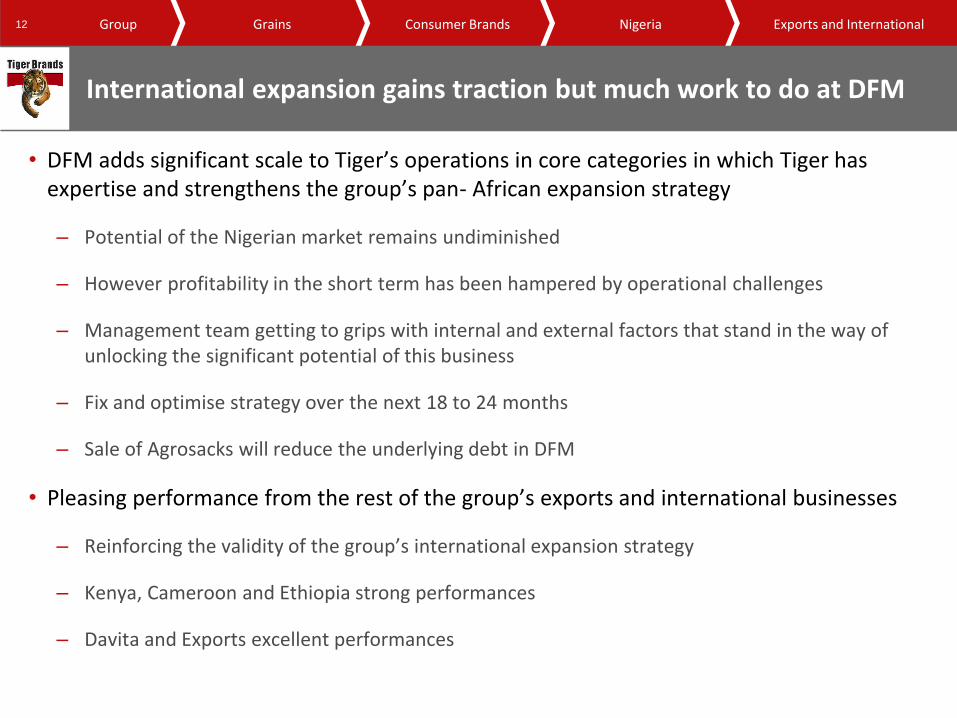
International expansion gains traction but much work to do at DFM
• DFM adds significant scale to Tiger’s operations in core categories in which Tiger has expertise and strengthens the group’s pan- African expansion strategy
– Potential of the Nigerian market remains undiminished
– However profitability in the short term has been hampered by operational challenges
– Management team getting to grips with internal and external factors that stand in the way of unlocking the significant potential of this business
– Fix and optimise strategy over the next 18 to 24 months
– Sale of Agrosacks will reduce the underlying debt in DFM
• Pleasing performance from the rest of the group’s exports and international businesses
– Reinforcing the validity of the group’s international expansion strategy
– Kenya, Cameroon and Ethiopia strong performances
– Davita and Exports excellent performances
12

Group Grains Nigeria Exports and InternationalConsumer Brands
HEPS (Cents) Year-ended 30 September
13
1 624
1 689
1 781
1 500
1 550
1 600
1 650
1 700
1 750
1 800
2 013
(Incl DFM)
(Excl DFM)
(3,8%)
5,4%
2012 2013
*2013 includes earnings from discontinued operations - Dangote Agrosacks

Group Grains Nigeria Exports and InternationalConsumer Brands
Total Distributions – Cents per share
850
865
700
720
740
760
780
800
820
840
860
880
2012 2013
14
+1,8%

www.tigerbrands.co.za
Financial AnalysisFunke Ighodaro
Chief Financial Officer

Group Grains Nigeria Exports and InternationalConsumer Brands
Trading Results
Revenue EBIT Operating margin
Rm2013 2012
% Change 2013 2012
% Change 2013 2012
Domestic businesses 20 250 19 043 6.3 2 881 3 023 (4.7) 14.2 15.9
Exports and International (excluding DFM)
4 424 3 634 21.7 580 451 28.6 13.2 12.4
Group Excluding DFM 24 674 22 677 8.8 3 461 3 474 (0.4) 14.0 15.3
DFM 2 329 - - (389) - - (16.8) -
Continuing Operations 27 003 22 677 19.1 3 072 3 474 (11.6) 11.4 15.3
Discontinued Operations 1 088 - - 197 - - 18.1 -
Total Group 28 091 22 677 23.9 3 269 3 474 (5.9) 11.6 15.3
• Significant dilution effect of DFM. Operating profits exclude contribution from DangoteAgrosacks, which is reflected as a discontinued operation
• Domestic businesses impacted by weak Groceries and Milling performance
• Strong earnings and margins in balance of exports and international businesses
16

Group Grains Nigeria Exports and InternationalConsumer Brands
Income statement for the year ended September
Rm 2013 2012%
Change
Turnover 27 003 22 677 19.1
Operating income 3 072 3 474 (11.6)
Income from investments 17 20 (15.0)
Net financing charges (379) (138) -
Income from Associates 515 416 23.8
Profit before taxation and abnormal items 3 225 3 772 (14.5)
Income tax expense (831) (1 023) 18.8
Profit after taxation before abnormal items 2 394 2 749 (12.9)
17

Group Grains Nigeria Exports and InternationalConsumer Brands
Income statement for the year ended September
Rm 2013 2012%
Change
Profit after taxation before abnormal items 2 394 2 749 (12.9)
Abnormal items after tax (5) (1) -
Non controlling interest 119 (30) -
Profit from Continuing Operations 2 508 2 718 (7.7)
Discontinued Operations – Dangote Agrosacks 61 - -
Profit from Total Operations 2 569 2 718 (5.5)
Including DFM
HEPS (cents) 1 624 1 689 (3.8)
EPS (cents) 1 608 1 707 (5.8)
Excluding DFM
HEPS (cents) 1 781 1 689 5.4
EPS (cents) 1 785 1 707 4.6
18

Group Grains Nigeria Exports and InternationalConsumer Brands
Turnover by operating segment
Rm 2013 2012 % Change
TOTAL REVENUE - Continuing Operations 27 003 22 677 19.1
DOMESTIC OPERATIONS 20 250 19 043 6.3
Grains 9 735 8 853 10.0
Milling and Baking 7 243 6 682 8.4
Other Grains 2 492 2 171 14.8
Consumer Brands 10 515 10 190 3.2
Groceries 3 707 3 772 (1.7)
Snacks & Treats 1 924 1 762 9.2
Beverages 1 020 990 3.0
Value Added Meat Products 1 584 1 450 9.2
Out of Home 403 351 14.8
Home, Personal care and Baby 1 877 1 865 0.6
EXPORTS AND INTERNATIONAL OPERATIONS 6 753 3 634
Exports and International 3 944 3 244 21.6
Nigerian Operations 2 809 390 -
Discontinued operation – Dangote Agrosacks 1 088 - -
19

Group Grains Nigeria Exports and InternationalConsumer Brands
Milling and Baking27%
Other Grains8%
Groceries14%
Snacks & Treats7%
Beverages4%
VAMP6%
OOH2%
HPCB7%
Exports and International 15%
Nigeria10%
2013
Milling and Baking29%
Other Grains10%
Groceries17%
Snacks & Treats8%
Beverages4%
VAMP6%
OOH2%
HPCB8%
Exports and International 14%
Nigeria2%
2012
Contribution to turnover
2013 Group turnover: R27.0 billion 2012 Group turnover: R22.7 billion
20
*Excluding discontinued operations

Group Grains Nigeria Exports and InternationalConsumer Brands
Operating income before abnormal items
RmOperating Income % % Operating margins
2013 2012 Change 2013 2012
Operating Income - Continuing Operations 3 072 3 474 (11.6) 11.4 15.3
DOMESTIC OPERATIONS 3 015 3 201 (5.8) 14.9 16.8
Grains 1 633 1 732 (5.7) 16.8 19.6
Milling and Baking 1 396 1 473 (5.2) 19.3 22.0
Other Grains 237 259 (8.5) 9.5 11.9
Consumer Brands 1 394 1522 (8.4) 13.3 14.9
Groceries 361 539 (33.0) 9.7 14.3
Snacks & Treats 304 267 13.9 15.8 15.2
Beverages 107 101 5.9 10.5 10.2
Value Added Meat Products 103 93 10.8 6.5 6.4
Out of Home 80 68 17.6 19.9 19.4
Home, Personal care and Baby 439 454 (3.3) 23.4 24.3
Other Operating items (12) (53) 77.4
FOREIGN OPERATIONS 191 451 (57.6) 2.8 12.4
Exports and International 575 459 25.3 14.6 14.1
Nigerian Operations (384) (8) - (13.7) (2.1)
IFRS 2 Charges (134) (178) 24.7
Operating Income – Discontinued Operations 197 - - 18.1 -
21
Group Grains Nigeria Exports and InternationalConsumer Brands
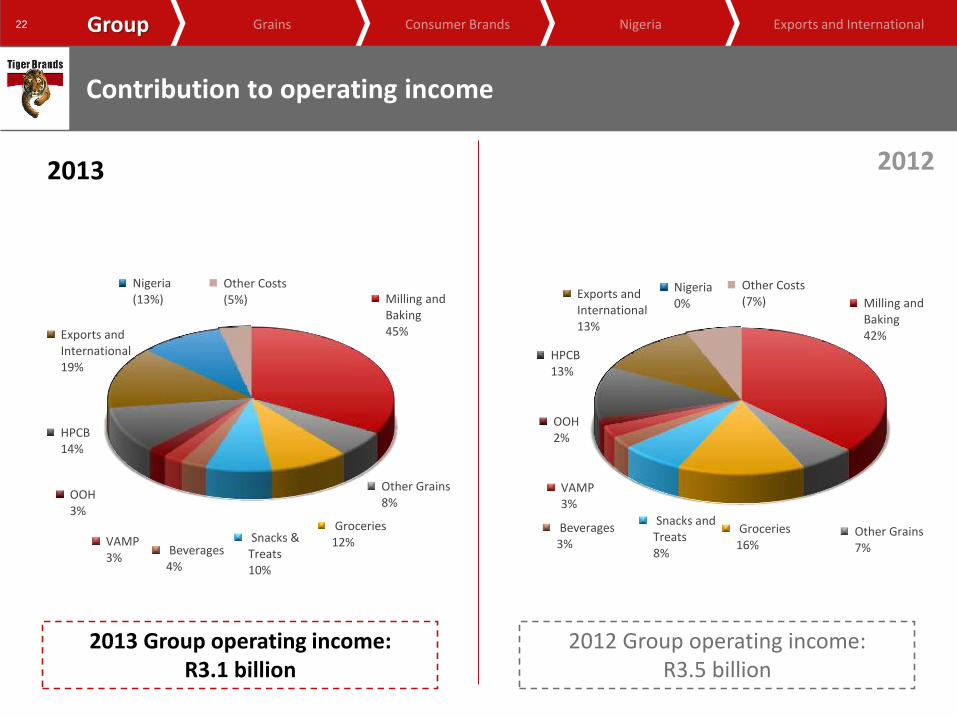
Contribution to operating income
Milling and Baking42%
Other Grains7%
Groceries16%
Snacks and Treats8%
Beverages3%
VAMP3%
OOH2%
HPCB13%
Exports and International13%
Nigeria0%
Other Costs(7%)
2012
2013 Group operating income:R3.1 billion
2012 Group operating income: R3.5 billion
Milling and Baking45%
Other Grains8%
Groceries12%Snacks &
Treats10%
Beverages4%
VAMP3%
OOH3%
HPCB14%
Exports and International19%
Nigeria(13%)
Other Costs(5%)
2013
22

Group Grains Nigeria Exports and InternationalConsumer Brands
Abnormal items for the year ended September
Rm 2013 2012
Profit on disposal of Intangible Asset - 36
Acquisition costs (15) (25)
Profit on disposal of property, plant and equipment 11 -
Write-off of intangible assets (3) -
Other 4 (6)
Abnormal items before tax (3) 5
Taxation on abnormal items (2) (6)
Abnormal items after tax (5) (1)
23

Group Grains Nigeria Exports and InternationalConsumer Brands
Reconciliation between profit for the year and headline earnings
Rm 2013 2012
Profit attributable to ordinary shareholders 2 508 2 718
Associates - Headline earnings adjustments (1) 6
Profit on sale of property, plant and equipment and intangibles (3) (34)
Write-off of intangible assets 3 -
Headline earnings – Continuing Operations 2 507 2 690
Discontinued operation
Earnings / profit attributable to shareholders of the parent 61 -
Loss on sale of property, plant and equipment 10 -
Loss on re-measurement to fair value of net assets to held-for-sale 16 -
Headline earnings - Discontinued Operations 87 -
Total Headline earnings for the year 2 594 2 690
24

Group Grains Nigeria Exports and InternationalConsumer Brands
Acquisitions
Rm
Acquisition Date of acquisition Nature of asset acquiredPurchase
consideration
DFM 4 Oct 2012 63,35% shareholding 1 513
Oceana Group Limited 1 Mar 2013 4,5% shareholding 314
Mrs Ball's Trademark 1 April 2013 Trademark 475
Empresas Carozzi 26 Sept 2013 Pro-rata capital injection 242
Other 1 Nov 2012 Trademark 10
Total 2 554
25
Group Grains Nigeria Exports and InternationalConsumer Brands
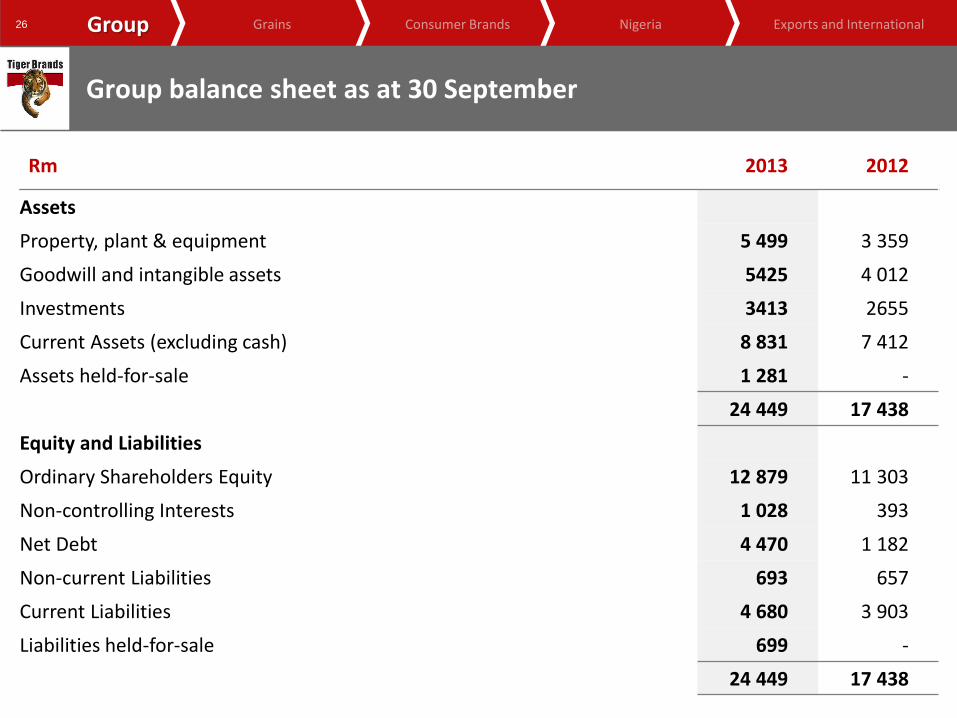
Group balance sheet as at 30 September
Rm 2013 2012
Assets
Property, plant & equipment 5 499 3 359
Goodwill and intangible assets 5425 4 012
Investments 3413 2655
Current Assets (excluding cash) 8 831 7 412
Assets held-for-sale 1 281 -
24 449 17 438
Equity and Liabilities
Ordinary Shareholders Equity 12 879 11 303
Non-controlling Interests 1 028 393
Net Debt 4 470 1 182
Non-current Liabilities 693 657
Current Liabilities 4 680 3 903
Liabilities held-for-sale 699 -
24 449 17 438
26

Group Grains Nigeria Exports and InternationalConsumer Brands
Key statistics
2013 2012
Net Debt (Rm) (4 470) (1 182)
Net Debt/Equity % 32.1 10.1
Working capital per R1 turnover (cents) 23.2 22.2
Net interest cover (times) 8.2 25.3
Effective tax rate (before abnormal items and associates income %) 30.7 30.4
RONA % 24.2 33.8
Net working capital days 91 76
Debtors days 44 42
Stock days 76 72
Creditors days 29 38
27

Group Grains Nigeria Exports and InternationalConsumer Brands
Cash flow statement for the year ended 30 September
Rm 2013 2012
Cash operating profit 4 311 4 224
Working Capital (337) (592)
Cash generated from operations 3 974 3 632
Net Financing cost/Investment income (109) 58
Tax paid (986) (1 058)
Cash available from operations 2 879 2 632
Dividends paid (1 426) (1 318)
Net cash inflow from operating activities 1 453 1 314
Capital Expenditure (728) (480)
Acquisitions (2 554) (408)
Underlying debt in DFM at acquisition (1 499) -
Other 50 78
Cash (outflow)/inflow after investing activities (3 278) 504
Foreign Exchange Translation (189) (15)
Transfer to held-for-sale (Agrosacks) 179 -
Opening Balance – Net debt (1 182) (1 671)
Closing Balance – Net debt (4 470) (1 182)
28

Group Grains Nigeria Exports and InternationalConsumer Brands
Capital Expenditure and Commitments
Rm 2013 2012
Capital expenditure 727 480
- Replacement 540 303
- Expansion 187 177
Capital commitment* 780 421
- Contracted 372 105
- Approved 408 316
29
*Excludes proposed capital expenditure of R922 million not yet approved

Group Grains Nigeria Exports and InternationalConsumer Brands
Subsequent events
• Sale of Agrosacks to reduce DFM debt
• Refinancing of DFM debt will ease interest burden
• Mandatory offer to DFM minorities expected to be completed by December 2013
• Acquisition, subject to regulatory approval, of milling and bakery operation in Kenya(Rafiki Mills and Magic Oven) for total purchase consideration of USD25 million
30

www.tigerbrands.co.za
GrainsNoel Doyle
Business Executive

Group Grains Nigeria Exports and InternationalConsumer Brands
Grains Overview
The year under review was characterised by:
• Significant cost push and volatility in most soft commodities exacerbated by the depreciating rand
• Continued pressure on disposable income intensifying a consumer search for value with downtrading a feature
• An intensification of pricing competition between customers
• Despite a slow start in H1, volumes grew for the full year
Volume growth reverses long term trends. Ongoing margin pressures reflected inEBIT performance
32
H1 H2 FY
∆ % % %
Volume (tons) (2,3) 3,2 0,4
Net sales 6,9 13,1 10.0
EBIT (8,7) (3,2) (5,7)
EBIT Margins (2,7) (3,1) (2,8)

Group Grains Nigeria Exports and InternationalConsumer Brands
Market share recoveries in a tough trading environment
Volume
Market Growth Tiger Growth Market Share Performance
Bread
Buns & Rolls
Rice
Maize
Flour
Consumer Premixes
Breakfast
- Oats (Jungle)
- Maize (Ace Instant)
- Sorghum
33

Group Grains Nigeria Exports and InternationalConsumer Brands
Milling & Baking- Wheat
-12,00%
-10,00%
-8,00%
-6,00%
-4,00%
-2,00%
0,00%
2,00%
4,00%
6,00%
8,00%
10,00%
Oct-12 Nov-12 Dec-12 Jan-13 Feb-13 Mar-13 Apr-13 May-13 Jun-13 Jul-13 Aug-13 Sep-13
Wheat Milling ∆ month on month vs. prior
Market continues to show volume declines
34
Source: SAGIS

Group Grains Nigeria Exports and InternationalConsumer Brands
Milling & Baking - Wheat
• Pleasing volume growth in a contracting market
• 26% raw material cost increase year-on-year
• Non availability of procurement opportunity below importparity exacerbates year-on-year cost growth
• Market dynamics restrict cost push recovery
• New Consumer Premix pack formats launched in Q1 2014
• Hennenman Mill meeting efficiency targets
Raw material cost push compresses margin
35

Group Grains Nigeria Exports and InternationalConsumer Brands
Milling & Baking- Maize
-12,00%
-8,00%
-4,00%
0,00%
4,00%
8,00%
12,00%
16,00%
Oct-12 Nov-12 Dec-12 Jan-13 Feb-13 Mar-13 Apr-13 May-13 Jun-13 Jul-13 Aug-13 Sep-13
Maize Milling ∆ month on month vs. prior
Market continues to show volume declines
36
Source: SAGIS

Group Grains Nigeria Exports and InternationalConsumer Brands
Milling and Baking - Maize
• First half impacted by an unfavourable procurement position in Q1
• Second half reflects continuing market share losses but rate of volume decline halvedin H2
• Consumer search for value saw downtrading to Regional and Dealer Owned brands
• Major Capex Project planned for Q2 F14 to enhance Ace Maize intrinsics
• Quick Cooking Maize launched but consumer adoption slower than anticipated
A tough year
37

Group Grains Nigeria Exports and InternationalConsumer Brands
Milling and Baking - Bakeries
• Albany regained market leadership
• Operating income growth was very pleasing despite significant cost push
• 30% growth in buns and rolls propels Albany into market leadership in this segment
Good volume performance drives strong profit growth and increased market share
38
Group Grains Nigeria Exports and InternationalConsumer Brands
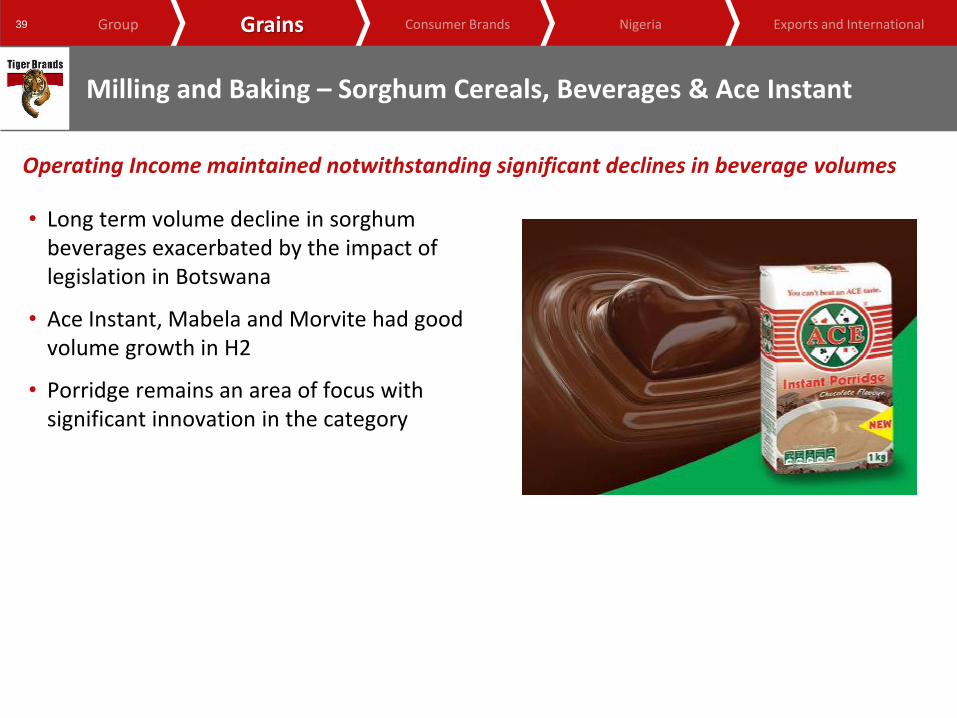
Milling and Baking – Sorghum Cereals, Beverages & Ace Instant
• Long term volume decline in sorghum beverages exacerbated by the impact of legislation in Botswana
• Ace Instant, Mabela and Morvite had good volume growth in H2
• Porridge remains an area of focus with significant innovation in the category
Operating Income maintained notwithstanding significant declines in beverage volumes
39

Group Grains Nigeria Exports and InternationalConsumer Brands
Other Grains - Rice
• Volumes recovered to F2011 levels. Relative price premium was adjusted tosustainable levels
• Tastic and Aunt Caroline retain market leadership
• Thai Rice price falling
– New entrants intensify competitive set
– Category margins remain under pressure
F2013 Volume recovery objective achieved
40
No 1 Essential food in Top Brands award

Group Grains Nigeria Exports and InternationalConsumer Brands
Other Grains - Jungle
• Very strong performance driven by successful innovation & precision in price point management
• Innovation a key driver of strongvolume growth
• Market shares enhanced
Good operating results reflect successful execution of strategy
41

Group Grains Nigeria Exports and InternationalConsumer Brands
Grains Summary
• A strong second half performance has improved underlying business health metrics
• The business carries good momentum into F2014. Maize and Wheat categories face continuedcost push
• Focus remains on innovation, brand investment and cost management
42

www.tigerbrands.co.za
Consumer BrandsGrattan Kirk
Business Executive

Group Grains Nigeria Exports and InternationalConsumer Brands
Groceries
• Poor Q1 F13 volume performance on the back ofprice increase
• Decision not to recover cost push in H2 F13 tomaintain market share
• Labour environment at Boksburg impacted production
• Continued shopper search for value
• Once off costs amounting to R45m
• Gradual market share recovery in H2 F13
• Seamless Integration of Mrs Ball’s acquisition
• Manufacturing facility optimisation (Tomato Pasteand Mayo)
• Continue to invest in our Brands
Tough Trading Conditions and Supply Chain inefficiencies lead to significant decline in profitability
Sales R 3 707m - 1.7%EBIT R 361m - 33.1%
44

Group Grains Nigeria Exports and InternationalConsumer Brands
Groceries – Consumer value propositions
Significant step up in innovation
45
2L Tomato Sauce Flavoured Mayonnaise Hot Sauces Range
Black Cat Tubs
Flavoured Beans
Vegetable Mixes KOO 1KG Value Packs Pasta value pack

Group Grains Nigeria Exports and InternationalConsumer Brands
Groceries
Back to basics approach and focus on execution
46
• Strengthening management capability
• Supply Chain optimisation projects on track
• Go to market strategy with customer
• Continued innovation
• Investment in our brands

Group Grains Nigeria Exports and InternationalConsumer Brands
Snacks & Treats
• Strong Brands
• Good market share growth in chocolate slabs
driven by enhanced value proposition
• Excellent Easter performance
• Continued focus on judicious price management
• Enhanced capacity & capability capex in execution phase
• Continued focus on innovation
• Relentless focus on “in store” execution
Strong volume growth in chocolate & efficiency focus generates pleasing profit growth
Sales R 1 924m + 9.2%EBIT R 304m + 13.9%
47

Group Grains Nigeria Exports and InternationalConsumer Brands
Snacks & Treats
Brand Innovation and renovation
48

Group Grains Nigeria Exports and InternationalConsumer Brands
Beverages
• Pleasing volume growth
• Projects delivering real savings to help mitigate market pricing pressures
– Factory consolidation into Roodekop
– Packaging consolidation project
– Logistics efficiencies
• Continued pressure from low price Dairy Fruit Blends and entry level Carbonated Soft Drinks
• Relentless focus on innovation
Volume and cost savings/efficiency projects drive growth
Sales R 1 020m + 3.0%EBIT R 107m + 5.8%
49

Group Grains Nigeria Exports and InternationalConsumer Brands
Beverages - Innovation
Exciting new products recently launched
50

Group Grains Nigeria Exports and InternationalConsumer Brands
Beverages – Point of purchase activations
Summer 2013 In-store Volume Drive
51

Group Grains Nigeria Exports and InternationalConsumer Brands
Value Added Meat Products
• Pricing pressure in the face of significant input costs increases
• Market share gains despite category beingex growth
• Extremely well managed costs
• Move to Clover distribution to extend footprint
• Retail collaboration driving volume growth
Continued progress in executing strategy, results in pleasing market share gains
Sales R 1 584m + 9.3%EBIT R 103m + 11.2%
52

Group Grains Nigeria Exports and InternationalConsumer Brands
Value Added Meat Products
Enterprise Chef’s Cut – driving premiumisation
53

Group Grains Nigeria Exports and InternationalConsumer Brands
Value Added Meat Products – Innovation drives growth
Innovation – Value proposition
54

Group Grains Nigeria Exports and InternationalConsumer Brands
Value Added Meat Products – Collaboration and in-store support
Retailer collaboration and in-store POP
55

Group Grains Nigeria Exports and InternationalConsumer Brands
Out of Home
• Strong performance with positive leverage
• Excellent cost control
• New customer acquisition strategypaying dividends
• Good product and channel mix
Leveraging Tiger basket into new customers and channels
Sales R 403m + 14.9%EBIT R 80m + 17.9%
56

Group Grains Nigeria Exports and InternationalConsumer Brands
In summary
• We will continue to
– Invest in our Brands
– Invest in our People
– Invest in Technology and Supply Chain Optimisation
• Relentless focus on Innovation
• Fixation on cost control
57

www.tigerbrands.co.za
Consumer Brands (HPCB)Neil Brimacombe
Business Executive

Group Grains Nigeria Exports and InternationalConsumer Brands
Home, Personal Care and Baby
• Strong Baby performance
• Headwinds in Home and Personal Caredriven by:
– Market contraction in most categories
– Major competitive entry in Detergents and Surface cleaner categories
– Rationalisation of range and associated activity to refocus business
• H2 share improvement in 10 out of 13 categories
Tough trading conditions
Net Sales R 1 877m + 0.6%
EBIT R 439m - 3.2%
59

Group Grains Nigeria Exports and InternationalConsumer Brands
Home, Personal Care and Baby
• H2 business recovery in Air Care, Sanitaryand Insecticides
• Offset by pressure in Surface and especially Laundry Care
– Highly aggressive MNC activity
– Bio Classic relaunch and liquid entry
• Positive consumer response to relaunches of DOOM and Airoma
Home Care: Aggressive Competition
Net Sales R 577m - 0,7%
EBIT R 92m - 20,0%
60
Group Grains Nigeria Exports and InternationalConsumer Brands
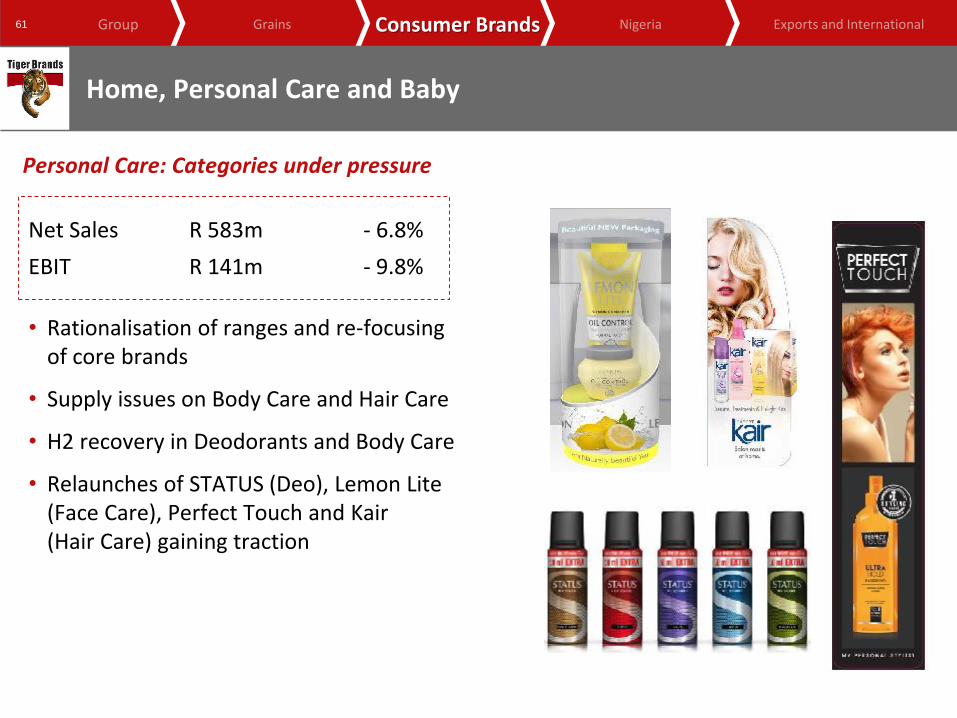
Home, Personal Care and Baby
• Rationalisation of ranges and re-focusingof core brands
• Supply issues on Body Care and Hair Care
• H2 recovery in Deodorants and Body Care
• Relaunches of STATUS (Deo), Lemon Lite(Face Care), Perfect Touch and Kair(Hair Care) gaining traction
Personal Care: Categories under pressure
Net Sales R 583m - 6.8%
EBIT R 141m - 9.8%
61

Group Grains Nigeria Exports and InternationalConsumer Brands
Home, Personal Care and Baby
• Baby performance well balanced with good growth in both nutrition and well-being
• Successful defence of Jars segment
• No. 1 Brand in Baby Cereals
• Underpinned by meaningful innovationand Brand investment
Baby Category: Excellent Performance
Net Sales R 717m + 8.9%
EBIT R 207m + 12.9%
62
Group Grains Nigeria Exports and InternationalConsumer Brands
Home, Personal Care and Baby
• Tough trading conditions and highly competitive environment to persist
• Significant c. R100m upgrade Capex of Personal Care facility
• Rationalisation, simplification, and consequent focus
• Upping the Innovation rate
• HPCB remains a strong investment vector for Tiger Brands
In Summary
63
www.tigerbrands.co.za
Tiger Brands International(excluding Nigeria)
Neil Brimacombe
Business Executive

Group Grains Nigeria Exports and InternationalConsumer Brands
International Expansion
11% 12%14%
24% 25% 24%
10%
15%
20%
25%
30%
35%
-
50 000
100 000
150 000
200 000
250 000
300 000
350 000
400 000
2008 2009 2010 2011 2012 2013
R'000 Exports & Davita
EBIT EBIT%
Davita acquisition:2011
7%
11% 12%
0%
5%
10%
15%
20%
-
20 000
40 000
60 000
80 000
100 000
2011 2012 2013
ETB'000EATBI (Ethiopia)
EBIT EBIT%
EATBI acquisition: 2011
8% 8%
12%13% 13%
14%
5%
10%
15%
20%
-
500 000
1 000 000
1 500 000
2 000 000
2 500 000
3 000 000
3 500 000
4 000 000
2008 2009 2010 2011 2012 2013
CFA'000 Chococam (Cameroon)
Chococamacquisition: 2008
65
3%
10% 12% 11%14% 15%
0%
5%
10%
15%
20%
25%
30%
- 50 000
100 000 150 000 200 000 250 000 300 000 350 000 400 000 450 000
2008 2009 2010 2011 2012 2013
KES'000 HACO Tiger Brands (Kenya)
HACO acquisition: 2008
CAGR : + 26%CAGR : + 26%

Group Grains Nigeria Exports and InternationalConsumer Brands
Tiger Brands International (excl. Nigeria)
• Exports– Rest of Africa: Continued good growth
– Davita: Good progress and on track
– L&AF: Improved performance
• East Africa– Kenya: Excellent performance
– Ethiopia: Excellent progress
• Central Africa– Cameroon: Excellent performance
Key Themes
1. Distribution gains
2. Investment in Facilities, People and Brands
3. Continued strong partner relationships
Tiger Brands International (excl. Nigeria)
66
Net Sales R 3 944m + 21.6%
EBIT R 575m + 25.3%
On shore manufacturing Export territories
Mali
Gh
ana
Niger
Nigeria
Gabon
Sudan
Ethiopia
Kenya
DRC
Tanzania
ZambiaAngola
Zimbabwe
NamibiaBotswana
SouthAfrica
Chad
EQ

Group Grains Nigeria Exports and InternationalConsumer Brands
Tiger Brands International: Exports (including Davita)
Rest of Africa Exports : Growth drivers
• Continued excellent growth in Southern African countries
• Excellent volume performance from C&I, pasta, baby nutrition and confectionery
• New territory initiatives now contributing
• Continued Brand Investment
Challenges
• Price competitiveness outside of SADC region
Tiger Brands Exports: Sustained Growth
Net Sales R 2 704m + 19.3%
EBIT R 409m + 20.3%
67
Harare, Zimbabwe

Group Grains Nigeria Exports and InternationalConsumer Brands
Tiger Brands International: Exports
Continued investment in core brands
68
Lusaka, ZambiaMaputo,Mozambique
Maputo,Mozambique Harare, Zimbabwe

Group Grains Nigeria Exports and InternationalConsumer Brands
Tiger Brands International: Davita
Davita Growth drivers
• Successful leveraging of Tiger Brands distributor base with Davita products
• Excellent growth in West, East and South East Africa
• Continued progress on efficiencies and consequent factory throughputs
• Availability and visibility are key thrusts
• SA new growth vector
Challenges• Counterfeits / Passing off remain sporadic
• Q1 F13 labour dispute
Good Performance: On Track
69

Group Grains Nigeria Exports and InternationalConsumer Brands
Tiger Brands International: Davita
Investing in core brands
70
Kinshasa, DRCMozambique and Nigeria

Group Grains Nigeria Exports and InternationalConsumer Brands
Tiger Brands International: Langeberg & Ashton Foods
Key points
• Soft demand in Key markets
• Flat market pricing vs. past year
• Exchange rate benefits
• Cost focus
• Growth in new geographies
Improved Performance
Net Sales R 1 192m + 18.3%
EBIT R 42m + 59.5%
71

Group Grains Nigeria Exports and InternationalConsumer Brands
Tiger Brands International: East Africa (Haco TB & EATBI)
Kenya growth drivers
• Regional export growth continues
• Good performance on core HPC and Stationery categories
• Market penetration initiatives gaining traction
• Margin expansion initiatives deliver
• Exciting consumer innovations launched
Good Performance: On Track
Net Sales R 724m + 23.5%
EBIT R 92m + 33.5%
72

Group Grains Nigeria Exports and InternationalConsumer Brands
Brand development: Innovation in 2013
73

Group Grains Nigeria Exports and InternationalConsumer Brands
Investing in Market Penetration: Haco (TB)
74

Group Grains Nigeria Exports and InternationalConsumer Brands
Tiger Brands International: EATBI, Ethiopia
Ethiopia Growth drivers
• Strong volume growth
– New distributors
– Consumer demand
• Excellent growth in core categories
• Progress on regional export initiatives
• Continued investments in facilitiesand people
Ethiopia trading challenges
• Shorter term Forex shortages
• Djibouti port corruption clampdown
Excellent progress
75

Group Grains Nigeria Exports and InternationalConsumer Brands
Tiger Brands International: EATBI, Ethiopia
Investments in Facilities and People
76

Group Grains Nigeria Exports and InternationalConsumer Brands
Tiger Brands International: Central Africa
Growth drivers
• Excellent volume and share growth incore categories
• Continuous improvement programexpands margins
• Regional Exports: new territories
• Sustained Brand Investment
• Market penetration initiatives
Challenges
• Low cost imports
Cameroon: Excellent Performance
Net Sales R 516m + 32.0%
EBIT R 74m + 47.7%
77

Group Grains Nigeria Exports and InternationalConsumer Brands
Driving Brand Growth
Driving Market Penetration
78

Group Grains Nigeria Exports and InternationalConsumer Brands
Tiger Brands International: Central Africa
Engaging our Consumers
79

Group Grains Nigeria Exports and InternationalConsumer Brands
Tiger Brands International
• International expansion remains key growth vector
• Continue to drive growth on core: availability and visibility
• Continued investment in Facilities, People, Brands
• Acquisitions remain a key theme
Very pleasing results
80

www.tigerbrands.co.za
Tiger Brands NigeriaThabi Segoale
Business Executive

Group Grains Nigeria Exports and InternationalConsumer Brands
Tiger Brands in Nigeria
Our Plan
• Stabilise the delivery platform
• Leverage inter-company synergies to save costs and enablerevenue growth
• Leverage Tiger Brands group’s capabilities toaccelerate improvements
• Establish a new corporate culture – the “Tiger Way”
• Strong commitment to Nigeria
Gaps remaining
• Re-energise current brand portfolio
• Roll-out investment to upgrade systems and infrastructure
• Entrench the new corporate culture
• Enable new revenue streams – current and newcustomer/product portfolio
• Externalise our corporate agenda
Steady Progress, more work to be done
82

Group Grains Nigeria Exports and InternationalConsumer Brands
DFM
Key performance inhibitors
• Poor sales volumes
• Internal operational inefficiencies
• Rising input costs
• Provisions for once-off costs
• Limited pricing power
But, notwithstanding
• Sales volumes have stabilised
• Excess expenditure was curbed
• Internal control environment is improving
• Staff morale is improving
• Good progress in driving supply chain efficiencies
Disappointing trading performance worsened by once-off costs
Turnover R 2 329mEBIT - R 389m
83

Group Grains Nigeria Exports and InternationalConsumer Brands
DFM
• Core categories remain in positive growth
• Inter-group sales to improve wheat milling capacity utilisation
• Investment in supply chain infrastructure will enable further cost savings and alternative revenue streams
Other initiatives in progress
• Sale of Agrosacks
• Mandatory offer to minorities
Prospects remain positive
84

Group Grains Nigeria Exports and InternationalConsumer Brands
UAC Foods
Salient points
• Capacity upgrade projects to deliver future growth
• Competition intensified
• Significant focus on innovation
• Internal re-organisation of customer management team to expand reach
Next milestones
• Drive organic growth – Improve product availability and visibility
– Accelerate growth in numerical distribution points
• Step-change the growth trajectory for dairies and beverages
• Product/brand renovation and innovation – drive “mini” Gala!
Consolidating for future growth
TBL Attributable Inc + 17%
85
Gala launches “mini” for kids!

Group Grains Nigeria Exports and InternationalConsumer Brands
Deli Foods
Salient points
• Strong category growth
• Freeing up manufacturing bottle-necks releasesadditional sales volumes
• Benefits of collaboration with DFM containcost inflation
Next milestones
• Investment in new capacity underway
• Activate innovation
• Leverage joint in-market collaboration with DFM
Stable platform, steady recovery
Turnover R 480m + 23,1%EBIT R 5m + 169,2%
86

Group Grains Nigeria Exports and InternationalConsumer Brands
Tiger Brands in Nigeria
• Nigeria investments are core to strategy
• Fix, Optimise, Grow strategy is well under way
• Drive organic growth through:
– Re-vitalisation of current brands
– Adjacent segment opportunities
– Expansion of market universe/acceleration of numerical distribution points
• Strategic intent to grow into new categories (eg. bread) remains
In summary
87

Group Grains Nigeria Exports and InternationalConsumer Brands
Outlook
• Remain confident in Group strategy to deliver sustainable growth
• Trading conditions in South Africa expected to remain challenging
• Current trading conditions in Nigeria likely to persist
• Continued good growth anticipated from Exports and International businesses
• We are confident that we have the right people, brands and capabilities to deliver successfully on strategy
88

www.tigerbrands.co.za
TIGER BRANDS LIMITEDRESULTS PRESENTATION TO INVESTORS
for the Year ended September 2013

Group Grains Nigeria Exports and InternationalConsumer Brands
Disclaimer
Certain statements in this presentation may be defined as forward looking within the meaning of the United States Securitieslegislation.
Forward-looking statements involve known and unknown risks, uncertainties and other important factors that could cause theactual results, performance or achievements of the company to be materially different from the future results, performance orachievements expressed or implied by such forward-looking statements. These forward-looking statements may be identifiedby words such as “expect”, “believe”, “anticipate”, “plan”, “estimate”, “intend”, “project”, “target”, “predict”, “outlook” andwords of similar meaning.
Forward looking statements are not statements of fact but statements by the management of Tiger Brands Group based on itscurrent estimates, projections, beliefs, assumptions and expectations regarding the group’s future performance.No assurance can be given that forward-looking statements will prove to be correct and undue reliance should not be placedon such statements.
The risks and uncertainties inherent in the forward-looking statements contained in this presentation include, but are notlimited to: domestic and international business and market conditions; changes in the domestic or international regulatory andlegislative environment in the countries in which the Group operates or intends to operate; changes to domestic andinternational operational, economic, political and social risks; changes to IFRS and the interpretations, applications andpractices subject thereto as they apply to past, present and future periods; and the effects of both current and future litigation.
The company undertakes no obligation to update or release any revisions to these forward-looking statements contained inthis presentation and does not assume responsibility for any loss or damage whatsoever and however arising as a result of thereliance of any party thereon, including, but not limited to, loss of earnings, profits, or consequential loss or damage.
90