annual results 2001 - philips · 1997 1998 1999 2000 2001 1) 1) ... annual results 2001 28...
TRANSCRIPT

February 7, 2002February 7, 2002
Annual Results 2001Annual Results 2001

Annual Results 20011
“Safe Harbor” Statement under the Private Securities Litigation Reform Act of October 1995
These presentations and discussions/document contain certain forward-looking statements with respect to the financial condition, results of operations and business of Philips and certain of the plans and objectives of Philips with respect to these items. By their nature, forward-looking statements involve risk and uncertainty because they relate to events and depend on circumstances that will occur in the future. There are a number of factors that could cause actual results and developments to differ materially from those expressed or implied by these forward-looking statements. These factors include, but are not limited to, levels of consumer and business spending in major economies, changes in consumer tastes and preferences, the levels of marketing and promotional expenditures by Philips and its competitors, raw materials and employee costs, changes in future exchange and interest rates, changes in tax rates and future business combinations, acquisitions or dispositions and the rate of technical changes. Market share estimates contained in this report are based on outside sources such as specialized research institutes, industry and dealer panels, etc. in combination with management estimates.

February 7, 2002February 7, 2002
Annual Results 2001Annual Results 2001

Annual Results 2001
Performance of the Philips GroupEUR million
3
SalesSales•• % nominal growth% nominal growth
Income (loss) from operationsIncome (loss) from operations•• as a % of salesas a % of sales•• as a % of net operating capital as a % of net operating capital
(RONA)(RONA)
Net (loss) incomeNet (loss) income
Excluding special items:Excluding special items:Income (loss) from operationsIncome (loss) from operations
Net (loss) incomeNet (loss) income
32,33932,339--1515
--1,3711,371--4.24.2--9.19.1
--2,6042,604
--136136
--908908
20012001 20002000
37,86237,8622020
4,2814,28111.311.335.735.7
9,6029,602
3,2113,211
2,8312,831
19991999
31,45931,45933
1,7511,7515.65.6
17.517.5
1,7991,799
1,7361,736
1,6141,614

Jan Jan HommenHommen
Gerard KleisterleeGerard Kleisterlee

Annual Results 20015
Highlights
•• Net loss of EUR 1,141m for the quarter after special items Net loss of EUR 1,141m for the quarter after special items
•• Net loss of EUR 2,604m for the year after special itemsNet loss of EUR 2,604m for the year after special items
•• Actions taken to deal with poor market situationActions taken to deal with poor market situation
•• Maintained a strong balance sheetMaintained a strong balance sheet
•• Focused M&A activityFocused M&A activity
•• Total Return to shareholdersTotal Return to shareholders
•• Maintained dividend paymentMaintained dividend payment
•• Prepared for the futurePrepared for the future
Annual Results 20016
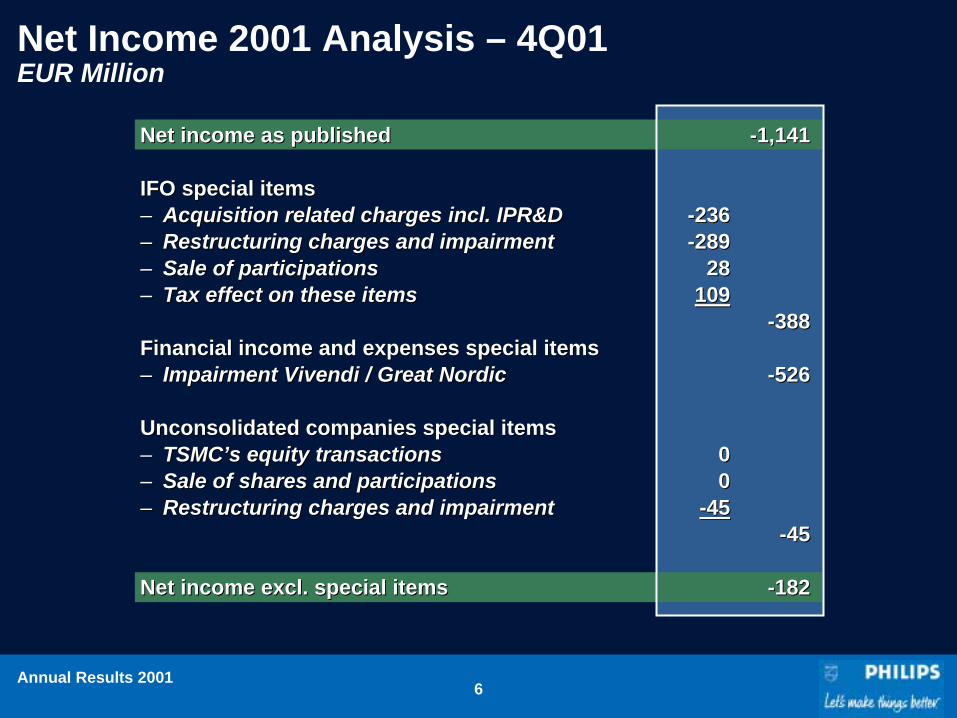
Net Income 2001 Analysis – 4Q01EUR Million
Net income as publishedNet income as published
IFO special itemsIFO special items–– Acquisition related charges incl. IPR&DAcquisition related charges incl. IPR&D–– Restructuring charges and impairmentRestructuring charges and impairment–– Sale of participationsSale of participations–– Tax effect on these itemsTax effect on these items
Financial income and expenses special itemsFinancial income and expenses special items–– Impairment Impairment Vivendi Vivendi / Great Nordic/ Great Nordic
Unconsolidated companies special itemsUnconsolidated companies special items–– TSMC’sTSMC’s equity transactionsequity transactions–– Sale of shares and participationsSale of shares and participations–– Restructuring charges and impairmentRestructuring charges and impairment
Net income excl. special itemsNet income excl. special items
--236236--289289
2828109109
0000
--4545
--1,1411,141
--388388
--526526
--4545
--182182

Annual Results 20017
IFO per PD – 4Q01EUR million
LightingLighting
CECE
DAPDAP
ComponentsComponents
SemiconductorsSemiconductors
Medical SystemsMedical Systems
MiscellaneousMiscellaneous
UnallocatedUnallocated
IFO as IFO as publishedpublished
Acquisition Acquisition related related chargescharges
RestructuRestructu--ring and ring and impairmentimpairment
IFO without IFO without special special itemsitems
5555TOTALTOTAL
183183
--77
143143
--139139
--292292
--154154
--138138
--3838
--1414
--222222
11
--3939
--22
--2222
--6565
--7070
--6161
--3131
182182
3232
145145
--144144
--227227
138138
--6464
--77
--236236 --289289--442442
GainsGains
2828
4141
--1313
Annual Results 20018
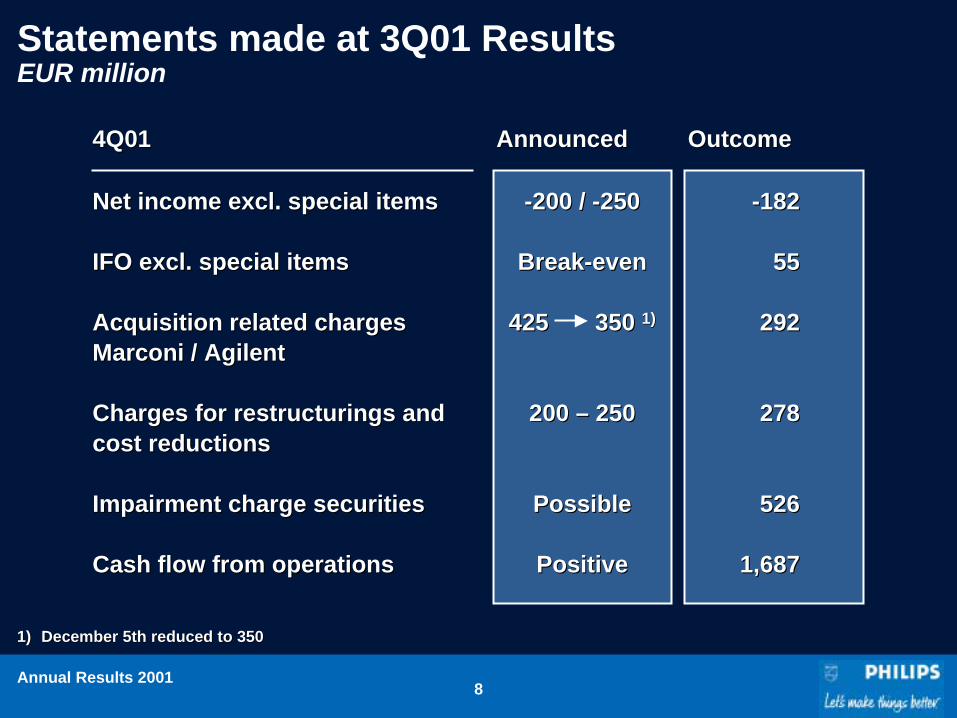
Statements made at 3Q01 ResultsEUR million
1)1) December 5th reduced to 350December 5th reduced to 350
Net income excl. special itemsNet income excl. special items
IFO excl. special itemsIFO excl. special items
Acquisition related charges Acquisition related charges MarconiMarconi / / AgilentAgilent
Charges for restructurings and Charges for restructurings and cost reductionscost reductions
Impairment charge securitiesImpairment charge securities
Cash flow from operationsCash flow from operations
4Q014Q01 OutcomeOutcome
--200 / 200 / --250250
BreakBreak--eveneven
425 350 425 350 1)1)
200 200 –– 250250
PossiblePossible
PositivePositive
AnnouncedAnnounced
--182182
5555
292292
278278
526526
1,6871,687
Annual Results 20019
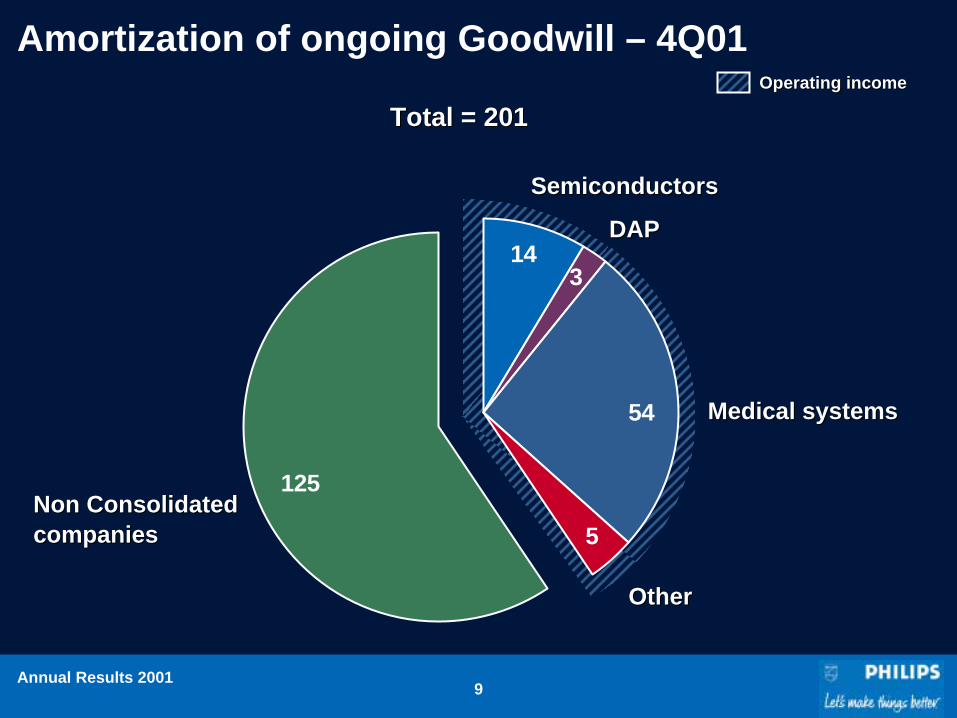
125
5
54
314
Amortization of ongoing Goodwill – 4Q01
DAPDAPSemiconductorsSemiconductors
Medical systemsMedical systems
Non Consolidated Non Consolidated companiescompanies
OtherOther
Operating incomeOperating income
Total = 201Total = 201

Annual Results 200110
Highlights
•• Net loss of EUR 1,141m for the quarter after special items Net loss of EUR 1,141m for the quarter after special items
•• Net loss of EUR 2,604m for the year after special itemsNet loss of EUR 2,604m for the year after special items
•• Actions taken to deal with poor market situationActions taken to deal with poor market situation
•• Maintained a strong balance sheetMaintained a strong balance sheet
•• Focused M&A activityFocused M&A activity
•• Total Return to shareholdersTotal Return to shareholders
•• Maintained dividend paymentMaintained dividend payment
•• Prepared for the futurePrepared for the future

Annual Results 200111
Net income as publishedNet income as published
IFO special itemsIFO special items–– Acquisition related charges incl. IPR&DAcquisition related charges incl. IPR&D–– Restructuring charges and impairmentRestructuring charges and impairment–– Sale of participationsSale of participations–– Tax effect on these itemsTax effect on these items
Financial income and expenses special itemsFinancial income and expenses special items–– Impairment Impairment Vivendi Vivendi / Great Nordic/ Great Nordic
Unconsolidated companies special itemsUnconsolidated companies special items–– TSMC’sTSMC’s equity transactionsequity transactions–– Sale of shares and participationsSale of shares and participations–– Restructuring charges and impairmentRestructuring charges and impairment
Net income excl. special itemsNet income excl. special items
Net Income 2001 Analysis – 2001EUR million
--437437--1,0931,093
295295313313
--60602020
--208208
--2,6042,604
--922922
--526526
--248248
--908908
Annual Results 200112
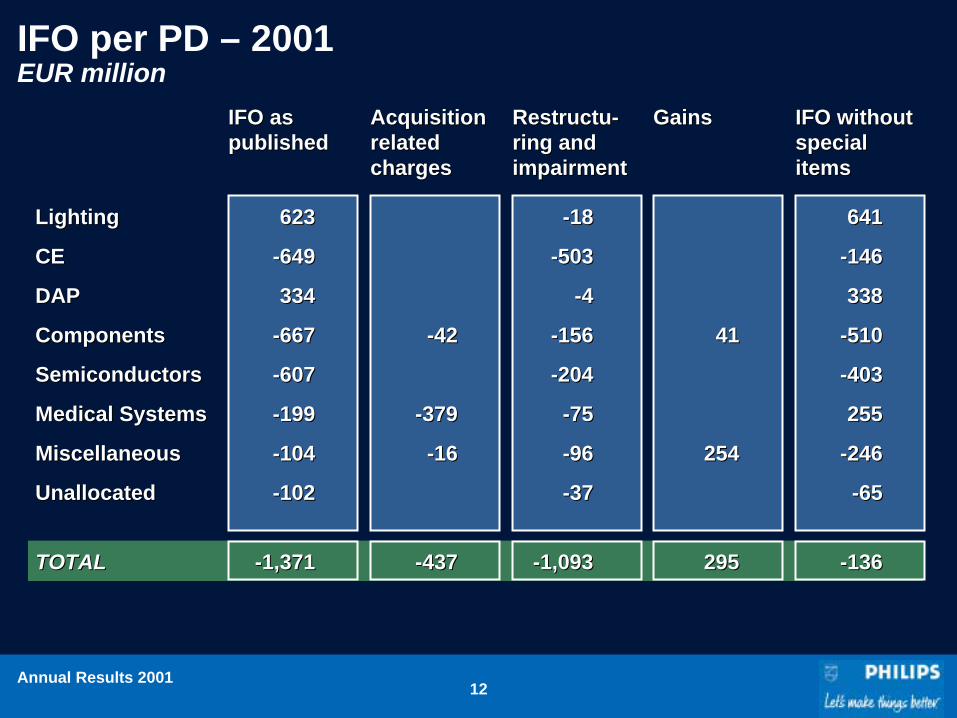
IFO per PD – 2001EUR million
LightingLighting
CECE
DAPDAP
ComponentsComponents
SemiconductorsSemiconductors
Medical SystemsMedical Systems
MiscellaneousMiscellaneous
UnallocatedUnallocated
IFO as IFO as publishedpublished
Acquisition Acquisition related related chargescharges
RestructuRestructu--ring and ring and impairmentimpairment
IFO without IFO without special special itemsitems
--136136TOTALTOTAL
623623
--649649
334334
--667667
--607607
--199199
--104104
--102102
--4242
--379379
--1616
--1818
--503503
--44
--156156
--204204
--7575
--9696
--3737
641641
--146146
338338
--510510
--403403
255255
--246246
--6565
--437437 --1,0931,093--1,3711,371
GainsGains
295295
4141
254254

Annual Results 200113
135 168 17794
-73-155
-225-176
Non-consolidated companiesEUR million
2Q00 2Q00 -- EUR 2595m gain on sale of ASML shares, Euro 189m re. EUR 2595m gain on sale of ASML shares, Euro 189m re. TSMC and EUR 121m on the sale ofTSMC and EUR 121m on the sale of BeltoneBeltone shares shares
3Q00 3Q00 -- EUR 491m re. TSMCEUR 491m re. TSMCExcluding charges: 3Q01 Excluding charges: 3Q01 -- EUR 60m re. TSMC and EUR 65m re. LG Philips DisplayEUR 60m re. TSMC and EUR 65m re. LG Philips Display
3Q013Q01 4Q014Q011Q011Q01 2Q012Q01
4Q004Q003Q003Q002Q002Q001Q001Q00
TOTALTOTAL 574574 --629629

Annual Results 200114
Non-consolidated companies EUR million Incl. amortization of Incl. amortization of
goodwillgoodwillExcl. amortization of Excl. amortization of goodwillgoodwill
2Q00 2Q00 -- EUR 2595m gain on sale of ASML shares, Euro 189m re. EUR 2595m gain on sale of ASML shares, Euro 189m re. TSMC and EUR 121m on the sale ofTSMC and EUR 121m on the sale of BeltoneBeltone shares shares
3Q00 3Q00 -- EUR 491m re. TSMCEUR 491m re. TSMCExcluding charges: 3Q01 Excluding charges: 3Q01 -- EUR 60m re. TSMC and EUR 65m re. LG Philips DisplayEUR 60m re. TSMC and EUR 65m re. LG Philips Display
153 190 221134
-92 -109-51
-10
3Q013Q01 4Q014Q011Q011Q01 2Q012Q01
4Q004Q003Q003Q002Q002Q001Q001Q00
TOTALTOTAL 698698 --262262

Annual Results 200115
Amortization of goodwillEUR million
33 35 44 61 45 41 54 7618 2244
40 63 63
116125
51 57
88101 108 104
170
201
1Q001Q00 2Q002Q00 3Q003Q00 4Q004Q00 1Q011Q01 2Q012Q01 3Q013Q01 4Q014Q01
20002000 20012001
TOTALTOTAL 297297 583583
Amortization in IFOAmortization in IFOAmortization in Unconsolidated Amortization in Unconsolidated companiescompanies

Annual Results 200116
Highlights
•• Net loss of EUR 1,141m for the quarter after special items Net loss of EUR 1,141m for the quarter after special items
•• Net loss of EUR 2,604m for the year after special itemsNet loss of EUR 2,604m for the year after special items
•• Actions taken to deal with poor market situationActions taken to deal with poor market situation
•• Maintained a strong balance sheetMaintained a strong balance sheet
•• Focused M&A activityFocused M&A activity
•• Total Return to shareholdersTotal Return to shareholders
•• Maintained dividend paymentMaintained dividend payment
•• Prepared for the futurePrepared for the future

Annual Results 200117
Capital InvestmentsEUR million
456599
829
1,248
757 745
360294
1Q001Q00 2Q002Q00 3Q003Q00 4Q004Q00 1Q011Q01 2Q012Q01 3Q013Q01 4Q014Q01
20002000 20012001
TOTALTOTAL 3,1323,132 2,1562,156

Annual Results 200118
Cash flow
Cash flow from Operating Cash flow from Operating activitiesactivities
Cash flow investing activitiesCash flow investing activities
SubtotalSubtotal
AcquisitionsAcquisitions
4Q014Q01 20012001
1,6871,687
--270270
1,4171,417
--1,3121,312
105105
1,2481,248
--928928
320320
--3,6363,636
--3,3163,316TOTALTOTAL

Annual Results 200119
15.6
18.1
19.218.9
14.9
16.917.1
17.5
14.0
16.4 16.4
14.4 14.5
14.7
15.8
13.9
15.6
16.0
15.1
12.512
13
14
15
16
17
18
19
20
1Q 2Q 3Q 4Q 1Q 2Q 3Q 4Q 1Q 2Q 3Q 4Q 1Q 2Q 3Q 4Q 1Q 2Q 3Q 4Q
Inventoriesas % of MAT sales
19971997 19981998 19991999 20002000 20012001
1)1)
1)1) Corrected for acquisitions and disposalsCorrected for acquisitions and disposals
1)1)

Annual Results 200120
Identification of Low Growth / Low Margin businesses
ReviewReviewin AOPin AOP
Monitoring Monitoring of key of key parameters parameters in monthly in monthly meetingsmeetings
Under performance in two Under performance in two consecutive quarters consecutive quarters
Meets Meets objectives objectives
1.1. Develop plan Develop plan for for improvementimprovement
2.2. Agree Agree milestonesmilestones
3. 18 months to 3. 18 months to implementimplement
•• Sell / mergeSell / merge•• RedesignRedesign•• Exit / closeExit / close
PerformancePerformance
Executes agreed Executes agreed business planbusiness plan
RequiresRequiresimprovement improvement
Unacceptable / Unacceptable / no strategic fit no strategic fit
AssessAssessBusiBusi--nessnessunitsunits
18 month process18 month processSepSep--Oct 01Oct 01 Nov 01Nov 01
Under Under performance in performance in two consecutive two consecutive quarters quarters
Successful Successful improvement or improvement or corrective actioncorrective action
Approval of Approval of plan by Boardplan by Board
Feb 02 Feb 02 -- Sep 03Sep 03
MonitorMonitor

Annual Results 200121
Employment ReductionPersonnel
At the beginning of the periodAt the beginning of the period
ConsolidationConsolidation
DeconsolidationDeconsolidation
Net reductionsNet reductions
4Q014Q01 20012001
191,500191,500
6,5006,500
--900900
--8,5008,500
188,600188,600AS AT DECEMBER 31, 2001AS AT DECEMBER 31, 2001
219,400219,400
15,50015,500
--27,70027,700
--18,60018,600
188,600188,600

Annual Results 200122
Employment Reduction - 2001Divisional
LightingLighting
Consumer ElectronicsConsumer Electronics
DAPDAP
ComponentsComponents
SemiconductorsSemiconductors
Medical SystemsMedical Systems
MiscellaneousMiscellaneous
UnallocatedUnallocated
Net Net consolidationconsolidation
Real changeReal change Total changeTotal change
1,8001,800
--900900
--23,30023,300
1,4001,400
11,00011,000
--2,1002,100
--100100
--1,0001,000
--6,2006,200
--700700
--5,2005,200
--4,1004,100
700700
--1,3001,300
--800800
12,20012,200 --18,60018,600 --30,80030,800
800800
--7,1007,100
--700700
--28,50028,500
--2,7002,700
11,70011,700
--3,4003,400
--900900
TOTALTOTAL

Annual Results 200123
Employment Reduction - 2001Geographical
EuropeEurope
USA and CanadaUSA and Canada
Latin AmericaLatin America
Asia PacificAsia Pacific
AfricaAfrica
Net Net consolidationconsolidation
Real changeReal change Total changeTotal change
--10,00010,000
5,9005,900
--1,8001,800
--6,1006,100
--200200
--6,9006,900
--2,7002,700
--1,9001,900
--7,0007,000
--100100
12,20012,200 --18,60018,600 --30,80030,800
--16,90016,900
3,2003,200
--3,7003,700
--13,10013,100
--300300
WORLDWORLD

Annual Results 200124
Cost Reduction ProgramEUR million
Overhead reduction programOverhead reduction program
Medical systems integration Medical systems integration cost savings cost savings 1)1)
Other savings programsOther savings programs
300300
350+350+
300 300 -- 400400
1)1) Announced on December 5Announced on December 5thth, 2001, 2001

Annual Results 200125
Highlights
•• Net loss of EUR 1,141m for the quarter after special items Net loss of EUR 1,141m for the quarter after special items
•• Net loss of EUR 2,604m for the year after special itemsNet loss of EUR 2,604m for the year after special items
•• Actions taken to deal with poor market situationActions taken to deal with poor market situation
•• Maintained a strong balance sheetMaintained a strong balance sheet
•• Focused M&A activityFocused M&A activity
•• Total Return to shareholdersTotal Return to shareholders
•• Maintained dividend paymentMaintained dividend payment
•• Prepared for the futurePrepared for the future

Annual Results 200126
Debt/Equity ratioEUR billion
2.97.06.9
9.7
14.8 15.1
22.218.6
5.12.6
-3.0
1.0Net Net debtdebt
Group Group equityequity
42:5842:58
31.12.9631.12.96
21:7921:79
31.12.9731.12.97
:100:100
31.12.9831.12.98
6:946:94
31.12.9931.12.99
12:8812:88
31.12.0031.12.00
27:7327:73
31.12.0131.12.01

Annual Results 200127
Financial assetsEUR million, as per end 2001
Unconsolidated Unconsolidated interestsinterests–– FEIFEI–– TSMC TSMC 1)1)
–– AtosAtos OriginOrigin
SecuritiesSecurities–– JDS JDS UniphaseUniphase–– ASM LithographyASM Lithography
Other nonOther non--currcurr. Fin. . Fin. AssetsAssets–– GN Great NordicGN Great Nordic–– VivendiVivendi
Market Market valuevalue
Book ValueBook Value Unrealized Unrealized book gainsbook gains
28728710,40110,401
1,5681,568
102102586586
46462,3532,353
86862,0192,0191,3881,388
77775050
46462,3532,353
15,34315,343 6,0196,019 9,3249,324
2012018,3828,382
180180
2525536536
––––
TOTALTOTAL
1)1) Excluding preference sharesExcluding preference shares

Annual Results 200128
Debt/Equity ratioEUR billion
2.97.06.9
9.7
14.8 15.1
22.2
27.9
5.12.6
-3.0
1.0Net Net debtdebt
Group Group equityequity
42:5842:58
31.12.9631.12.96
21:7921:79
31.12.9731.12.97
:100:100
31.12.9831.12.98
6:946:94
31.12.9931.12.99
12:8812:88
31.12.0031.12.00
20:8020:80
31.12.0131.12.01
Unrealized Unrealized book book gainsgains
9.39.3
18.618.6

Annual Results 200129
Highlights
•• Net loss of EUR 1,141m for the quarter after special items Net loss of EUR 1,141m for the quarter after special items
•• Net loss of EUR 2,604m for the year after special itemsNet loss of EUR 2,604m for the year after special items
•• Actions taken to deal with poor market situationActions taken to deal with poor market situation
•• Maintained a strong balance sheetMaintained a strong balance sheet
•• Focused M&A activityFocused M&A activity
•• Total Return to shareholdersTotal Return to shareholders
•• Maintained dividend paymentMaintained dividend payment
•• Prepared for the futurePrepared for the future

Annual Results 200130
Focused M&A Activity
•• Building the worlds # 2 Medical CompanyBuilding the worlds # 2 Medical Company–– Agilents Agilents Healthcare Services Group (USD 1.7b)Healthcare Services Group (USD 1.7b)–– Marconis Marconis Medical Business (USD 1.1b)Medical Business (USD 1.1b)
•• Mature businessesMature businesses–– Placing CRT activity into J/V with LGPlacing CRT activity into J/V with LG
•• Problem solvingProblem solving–– Transferring mobile handset manufacturing to China Transferring mobile handset manufacturing to China
Electric CorporationElectric Corporation
•• Cleaning the portfolioCleaning the portfolio–– Corporate Investments Corporate Investments –– low growth / low returnlow growth / low return–– DivestmentsDivestments

Annual Results 200131
Highlights
•• Net loss of EUR 1,141m for the quarter after special items Net loss of EUR 1,141m for the quarter after special items
•• Net loss of EUR 2,604m for the year after special itemsNet loss of EUR 2,604m for the year after special items
•• Actions taken to deal with poor market situationActions taken to deal with poor market situation
•• Maintained a strong balance sheetMaintained a strong balance sheet
•• Focused M&A activityFocused M&A activity
•• Total Return to shareholdersTotal Return to shareholders
•• Maintained dividend paymentMaintained dividend payment
•• Prepared for the futurePrepared for the future

Annual Results 200132
3331
30
2827
24212120
191817
1515
1210
66
0-1-1
-46-55
29
Total Return to Shareholders – 3 YearCAGR Jan 99’ – Dec ’01 - %
ROYAL PHILIPS ELECTRONICSROYAL PHILIPS ELECTRONICSLGLGNOKIA NOKIA SIEMENS SIEMENS SANYOSANYOTYCOTYCOWHIRLPOOLWHIRLPOOLSHARPSHARPIBMIBMTEXAS INSTRUMENTSTEXAS INSTRUMENTSSONYSONYHITACHIHITACHIGENERAL ELECTRICGENERAL ELECTRICNECNECSAMSUNGSAMSUNGINTELINTELEMERSON ELECTRICEMERSON ELECTRICELECTROLUXELECTROLUX
MOTOROLAERICSSON
GILETTEMATSUSHITALUCENTMARCONI

Annual Results 200133
12266
51
241211
3
-10-10
-14-18
-21-21
-31-37-39-39-40
-43-50-51
-94
48
Total Return to Shareholders – 1 YearCAGR Jan 01’ – Dec ’01 - %
LGLGWHIRLPOOLWHIRLPOOLIBMIBMSAMSUNGSAMSUNGELECTROLUXELECTROLUXTYCOTYCOINTELINTELSHARPSHARPGILETTEGILETTE
HITACHIHITACHIGENERAL ELECTRICGENERAL ELECTRICROYAL PHILIPS ELECTRONICSROYAL PHILIPS ELECTRONICSSIEMENSSIEMENSMOTOROLAMOTOROLAEMERSONEMERSONSONYSONYTEXAS INSTRUMENTSTEXAS INSTRUMENTSSANYOSANYONECNECNOKIANOKIAMATSUSHITAMATSUSHITAERICSSONERICSSONLUCENTLUCENTMARCONIMARCONI
00
Annual Results 200134
Highlights
•• Net loss of EUR 1,141m for the quarter after special items Net loss of EUR 1,141m for the quarter after special items
•• Net loss of EUR 2,604m for the year after special itemsNet loss of EUR 2,604m for the year after special items
•• Actions taken to deal with poor market situationActions taken to deal with poor market situation
•• Maintained a strong balance sheetMaintained a strong balance sheet
•• Focused M&A activityFocused M&A activity
•• Total Return to shareholdersTotal Return to shareholders
•• Maintained dividend paymentMaintained dividend payment
•• Prepared for the futurePrepared for the future

Annual Results 200135
Dividends per shareEUR
0.06
0.140.18 0.18
0.230.25
0.30
0.36 0.36
19931993 19941994 20012001200020001999199919981998199719971996199619951995
1)1)
1)1) ProposedProposed

Annual Results 200136
Highlights
•• Net loss of EUR 1,141m for the quarter after special items Net loss of EUR 1,141m for the quarter after special items
•• Net loss of EUR 2,604m for the year after special itemsNet loss of EUR 2,604m for the year after special items
•• Actions taken to deal with poor market situationActions taken to deal with poor market situation
•• Maintained a strong balance sheetMaintained a strong balance sheet
•• Focused M&A activityFocused M&A activity
•• Total Return to shareholdersTotal Return to shareholders
•• Maintained dividend paymentMaintained dividend payment
•• Prepared for the futurePrepared for the future

Annual Results 200137
Prepared for the future
•• Fundamentally changing the way we workFundamentally changing the way we work
•• Lower cost structureLower cost structure
•• Cash conversion cycleCash conversion cycle
•• Resolving problem areasResolving problem areas
•• Strong balance sheet and financial flexibilityStrong balance sheet and financial flexibility

Jan Jan HommenHommen
Gerard KleisterleeGerard Kleisterlee

Annual Results 200139
•• Overall CE profitability and focusOverall CE profitability and focus–– USAUSA–– PCCPCC–– Digital NetworksDigital Networks–– SpeechSpeech–– Specialty ProductsSpecialty Products
2001 Actions
In progressIn progress!!
In progressIn progress!!
!!
Consumer ElectronicsConsumer Electronics
•• Focused portfolio on digital productsFocused portfolio on digital products
•• Deverticalization Deverticalization
•• Personnel reduction 6,200Personnel reduction 6,200

Annual Results 200140
2001 Actions
Consumer ElectronicsConsumer Electronics
SemiconductorsSemiconductors
•• Closure of lines in Albuquerque and Closure of lines in Albuquerque and CaenCaen
•• Maintained investment levels in R&DMaintained investment levels in R&D
•• Focused portfolio on digital productsFocused portfolio on digital products
•• Personnel reductionPersonnel reduction 4,100 4,100

Annual Results 200141
2001 Actions
Consumer ElectronicsConsumer Electronics
SemiconductorsSemiconductors
ComponentsComponents
•• Finalized the CRT JV with LGFinalized the CRT JV with LG
•• Focused portfolio on digital productsFocused portfolio on digital products
•• Personnel reductionPersonnel reduction 5,2005,200
Annual Results 200142
•• Record year before extraordinary Record year before extraordinary itemsitems
•• Finalized acquisitionsFinalized acquisitions
•• Begun integration processBegun integration process
•• Identified at least EUR 350m in Identified at least EUR 350m in savingssavings
2001 Actions
MedicalMedical

Annual Results 200143
2001 Actions
MedicalMedical
DAPDAP
•• Record earningsRecord earnings
•• Successful integration of Successful integration of OPTIVA / SONICAREOPTIVA / SONICARE–– #1 position in US#1 position in US
•• Focused product portfolioFocused product portfolio

Annual Results 200144
2001 Actions
•• Increased market share across the Increased market share across the portfolioportfolio
•• Completed several “addCompleted several “add--on” on” acquisitionsacquisitions
•• Margins under pressureMargins under pressure
MedicalMedical
DAPDAP
LightingLighting

Annual Results 200145
Our Direction, focus on growth in digital markets
Technology pillarsTechnology pillars•• DisplayDisplay•• ConnectivityConnectivity•• StorageStorage•• Digital VideoDigital Video
Annual Results 200146
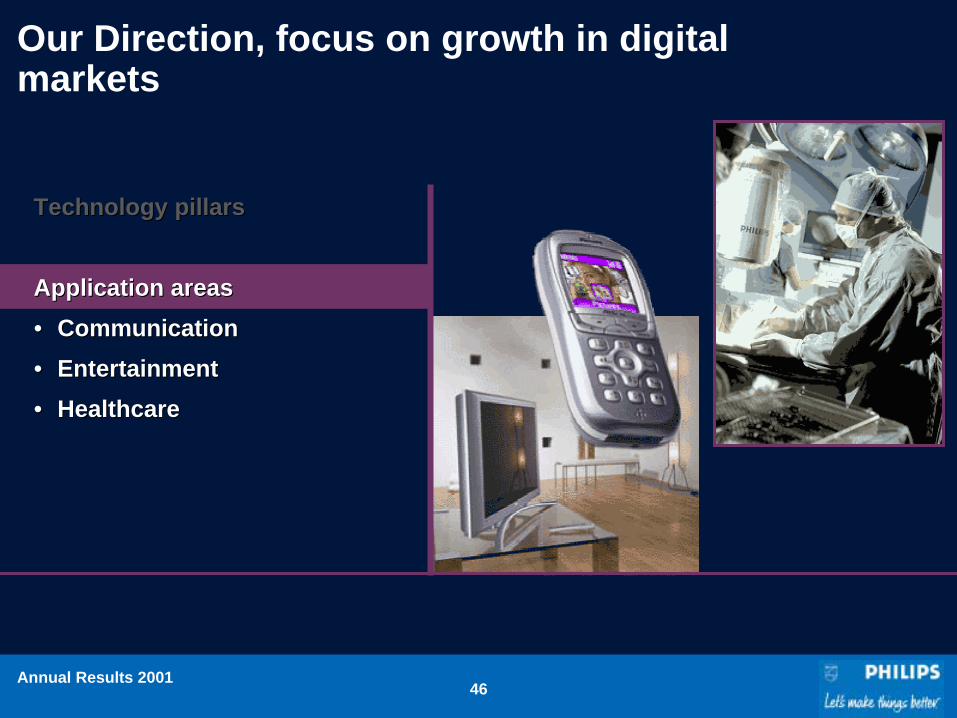
Technology pillarsTechnology pillars
Application areasApplication areas•• CommunicationCommunication•• EntertainmentEntertainment•• HealthcareHealthcare
Our Direction, focus on growth in digital markets

Annual Results 200147
Framework
•• Strong balance sheetStrong balance sheet
•• Building a more effective organizationBuilding a more effective organization
•• Portfolio managementPortfolio management
•• Product and technology momentumProduct and technology momentum

Annual Results 200148
15.6
18.1
19.218.9
14.9
16.9
17.1
17.5
14.0
16.4 16.4
14.4 14.5
14.7
15.8
13.9
15.6
16.0
15.1
12.5121314151617181920
1Q 2Q 3Q 4Q 1Q 2Q 3Q 4Q 1Q 2Q 3Q 4Q 1Q 2Q 3Q 4Q 1Q 2Q 3Q 4Q
Strong balance sheet
19971997 19981998 19991999 20002000 20012001
InventoriesInventories
1)1) Corrected for acquisitions and disposalsCorrected for acquisitions and disposals
1)1)
1)1)

Annual Results 200149
Strong balance sheet
42:5842:5831.12.9631.12.96
21:7921:7931.12.9731.12.97
:100:10031.12.9831.12.98
6:946:9431.12.9931.12.99
12:8812:8831.12.0031.12.00
20:8020:8031.12.0131.12.01
2.97.06.9
9.714.8 15.1
22.2
27.9
5.12.6
-3.0
1.0
UnreaUnrea--lizedlizedbook book gainsgains
9.39.3
18.618.6
Group EquityGroup EquityNet debtNet debt
InventoriesInventories
Debt / equity ratioDebt / equity ratio

Annual Results 200150
Philips wayPhilips way
Building a more effective organization
•• One cultureOne culture
•• One brandOne brand
•• One companyOne company

Annual Results 200151
Building a more effective organization
•• Transaction processesTransaction processes–– HR, Finance, IT, Purchasing, SalesHR, Finance, IT, Purchasing, Sales
•• Overhead reduction programOverhead reduction program–– Projected savings of EUR 300mProjected savings of EUR 300m
Philips wayPhilips way
Shared servicesShared services

Annual Results 200152
Building a more effective organization
160
203226
269
19981998 19991999 20002000 20012001
Philips wayPhilips way
Shared servicesShared services
Reducing complexityReducing complexity
REDUCTION IN FACTORIESREDUCTION IN FACTORIES

Annual Results 200153
Building a more effective organization
120137
164 157
Philips wayPhilips way
Shared servicesShared services
Reducing complexityReducing complexity
Improving productivityImproving productivity
SALES PER EMPLOYEESALES PER EMPLOYEE
CAGRCAGR9.4%9.4%
19981998 19991999 20002000 20012001

Annual Results 200154
Portfolio Management
•• List of businesses identified, List of businesses identified, expected value EUR 1bexpected value EUR 1b
•• Created Corporate Investments groupCreated Corporate Investments group
•• Developed and implemented Developed and implemented onon--going review processgoing review process
Exiting low growth low return Exiting low growth low return businessesbusinesses

Annual Results 200155
Portfolio Management
•• Driven from a corporate perspective Driven from a corporate perspective to meet the ambition of the High to meet the ambition of the High Growth Technology CompanyGrowth Technology Company
•• Focussed on digital technologiesFocussed on digital technologies
•• Criteria: good fit, good management, Criteria: good fit, good management, good track recordgood track record
Exiting low growth low return Exiting low growth low return businessesbusinesses
AcquisitionsAcquisitions

Annual Results 200156
15
15
68 12
13
31%
Misc
Portfolio Management1999 Sales1999 Salesto thirdsto thirds
Proforma Proforma 2001 Sales 2001 Sales to thirdsto thirds
Lighting
DAP
Consumer Electronics
ComponentsMedical
Semiconductors
Misc
Lighting
DAP
Consumer Electronics
ComponentsMedical
Semiconductors
Exiting low growth low return Exiting low growth low return businessesbusinesses
AcquisitionsAcquisitions
Continuing to reshapeContinuing to reshape the the portfolio for growthportfolio for growth 7
15
7
21 137
30%

Annual Results 200157
755 795 822 955 957
157 152 219 308 486
1,167 359 1,1622,364
-1,923
Portfolio Management
1)1) EBITA excluding special itemsEBITA excluding special items
Semi, Comp. and CESemi, Comp. and CE
Lighting + DAPLighting + DAP
Medical Medical 1)1)
Strong Strong growth by growth by integraintegra--ting M&Ating M&A
Resume Resume growth growth after after downturndownturn
Stable Stable growth growth
INCOME FROM OPERATIONS (Euro million)
19971997 19981998 19991999 20002000 20012001
Exiting low growth low return Exiting low growth low return businessesbusinesses
AcquisitionsAcquisitions
Continuing to reshapeContinuing to reshape the the portfolio for growthportfolio for growth
Positioned for growth and solid Positioned for growth and solid returnsreturns

Annual Results 200158
Innovative productsInnovative products
New TechnologiesNew Technologies
Design WinsDesign Wins
Product and technology momentum

Annual Results 200159
Innovative productsInnovative products
New TechnologiesNew Technologies
Design WinsDesign Wins
Product and technology momentum
Senseo CremaSenseo Crema
Annual Results 200160
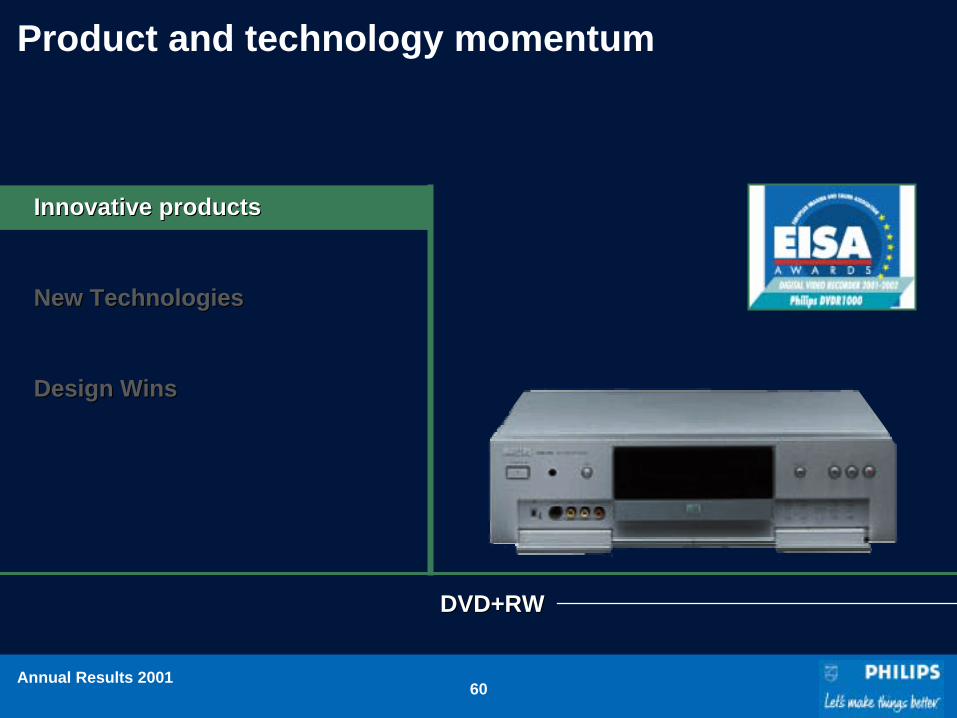
Product and technology momentum
Innovative productsInnovative products
New TechnologiesNew Technologies
Design WinsDesign Wins
DVD+RWDVD+RW

Annual Results 200161
Product and technology momentum
Innovative productsInnovative products
New TechnologiesNew Technologies
Design WinsDesign Wins
Solar EnergySolar Energy
InverterInverter
Control Control modulemodule
Solar panelSolar panel

Annual Results 200162
Product and technology momentum
Innovative productsInnovative products
New TechnologiesNew Technologies
Design WinsDesign Wins
Open MRIOpen MRI

Annual Results 200163
Product and technology momentum
Innovative productsInnovative products
New TechnologiesNew Technologies
Design WinsDesign Wins
Nexperia Nexperia –– Digital VideoDigital Video

Annual Results 200164
Product and technology momentum
Innovative productsInnovative products
New TechnologiesNew Technologies
Design WinsDesign Wins
ProntoPronto

Annual Results 200165
Product and technology momentum
1.17 1.85 2.30 2.50 2.80
19971997 20012001200020001999199919981998
R&D expenditures
New patents
10001000
1300130015001500
21002100
30003000
1)1)
1)1) Adjusted for acquisitionsAdjusted for acquisitions
Innovative productsInnovative products
New TechnologiesNew Technologies
Design WinsDesign Wins
RESEARCH & DEVELOPMENT SPENDINGRESEARCH & DEVELOPMENT SPENDINGEUR billionEUR billion

Annual Results 200166
6 million 802.11 and 3 million 6 million 802.11 and 3 million bluetoothbluetoothchipsets chipsets
Product and technology momentum
Innovative productsInnovative products
New TechnologiesNew Technologies
Design WinsDesign Wins

Annual Results 200167
Product and technology momentum
Innovative productsInnovative products
New TechnologiesNew Technologies
Design WinsDesign Wins
Portable defibrillatorPortable defibrillator

Annual Results 200168
Product and technology momentum
Innovative productsInnovative products
New TechnologiesNew Technologies
Design WinsDesign Wins
Nokia Nokia –– displaydisplay

Annual Results 200169
Product and technology momentum
Innovative productsInnovative products
New TechnologiesNew Technologies
Design WinsDesign Wins
iPAQiPAQ –– bluetooth bluetooth modulemodule

Annual Results 200170
Product and technology momentum
Innovative productsInnovative products
New TechnologiesNew Technologies
Design WinsDesign Wins
Dell Dell –– DVD+RWDVD+RW

Annual Results 200171
Strong balance sheetStrong balance sheet
High Growth Technology Company
Product and technology momentumProduct and technology momentum
Building a Building a more effective more effective organizationorganization
Portfolio Portfolio managementmanagement

Annual Results 200172
•• Sales growth above 10% on averageSales growth above 10% on averageper annumper annum
•• Income from operations 10% of salesIncome from operations 10% of sales
•• 15% growth in earnings per share on average15% growth in earnings per share on averageper annumper annum
•• RONA above 30%RONA above 30%
•• Positive cash flowPositive cash flow
Targets

Annual Results 200173
•• We have a clear vision of our future and how We have a clear vision of our future and how we are going to get therewe are going to get there
•• We are resolving nearWe are resolving near--term issuesterm issues
•• Established the frameworkEstablished the framework
•• 2002; continuing to reshape the business to 2002; continuing to reshape the business to become a High Growth Technology Companybecome a High Growth Technology Company
•• We are committed to our midWe are committed to our mid--term targetsterm targets
•• We have the financial strength and flexibility We have the financial strength and flexibility to achieve our ambitionto achieve our ambition
Moving forward

February 7, 2002February 7, 2002
Annual Results 2001Annual Results 2001