annual reports 07.07.2014 final - fdc limitedfdcindia.com/admin/images/annual_report_2013_14.pdf ·...
TRANSCRIPT


CIN: L24239MH1940PLC003176
Regd. Office: B-8, M.I.D.C. Industrial Estate, Waluj Dist., Aurangabad 431 136
R&D, Training Centre and Corp. Office: 142-48, Swami Vivekananda Road, Jogeshwari (West), Mumbai 400 102
Anand L. Chandavarkar (1905-1959)
Founder
Ramdas A. Chandavarkar (1933-2001)
Chairman Emeritus
DIRECTORS
Mr. Mohan A. Chandavarkar
(Chairman and Managing Director)
Mr. Ashok A. Chandavarkar
Mr. Nandan M. Chandavarkar
(Joint Managing Director)
Mr. Ameya A. Chandavarkar
CA Girish C. Sharedalal
Dr. Satish S. Ugrankar
Dr. Rahim H. Muljiani
Dr. Nagam H. Atthreya
CA Vinod G. Yennemadi
COMPANY SECRETARY
Ms. Varsharani Katre
AUDITORS
S.R. Batliboi & Co. LLP, Mumbai
REGISTRAR & SHARE TRANSFER AGENTS *
Sharex Dynamic (India) Pvt. Ltd.
Unit-1, Luthra Industrial Premises, Andheri Kurla Road
Safed Pool, Andheri (East), Mumbai 400 072
Tel.: (022) 2851 5606, 2851 5644
Fax.: (022) 2851 2885
E-mail ID.: [email protected]
* Kindly correspond directly with the registrar & share transfer
agents regarding share transfers and share related matters.
FDC Limited
PLANTS
Roha, Raigad, Maharashtra
Waluj, Aurangabad, Maharashtra
Sinnar, Nashik, Maharashtra
Goa (Plants I, II & III)
Baddi, Himachal Pradesh
Ÿ
Ÿ
Ÿ
Ÿ
Ÿ
01
FDC LIMITED
IN HOUSE R & D CENTRES APPROVED BY
DEPARTMENT OF SCIENTIFIC & INDUSTRIAL
RESEARCH
Jogeshwari R & D Centre at 142-48, S.V. Road,
Jogeshwari (W), Mumbai - 400 102
Roha R & D Centre at Plot No. 19 & 20/2,
MIDC Area Road, Roha, Dist. Raigad
Goa Unit III R & D Centre at Plant Phase III/A,
Plot No. L-121/B, Salcette, Verna Industrial Estate,
Verna, Goa
Ÿ
Ÿ
Ÿ
CONTENTS
Ÿ Directors' Report (Including Management Discussion and Analysis Report) 3-9
Ÿ Corporate Governance Report 10-14
Ÿ Auditors' Report on Standalone Financial Statements 15-19
Ÿ Standalone Financial Statements 20-52
Ÿ Consolidated Auditors' Report 53
Ÿ Consolidated Financial Statements 54-84
02
ANNUAL REPORT 2013-2014
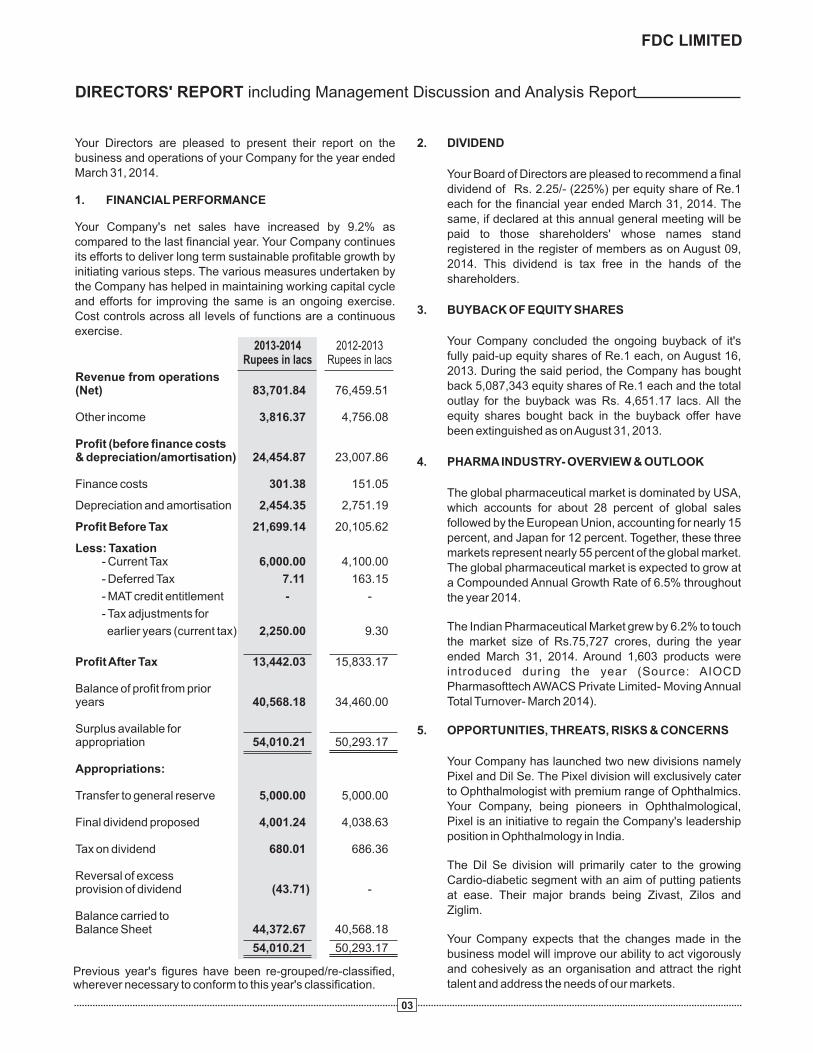
Your Directors are pleased to present their report on the business and operations of your Company for the year ended March 31, 2014.
1. FINANCIAL PERFORMANCE
Your Company's net sales have increased by 9.2% as compared to the last financial year. Your Company continues its efforts to deliver long term sustainable profitable growth by initiating various steps. The various measures undertaken by the Company has helped in maintaining working capital cycle and efforts for improving the same is an ongoing exercise. Cost controls across all levels of functions are a continuous exercise.
DIRECTORS' REPORT including Management Discussion and Analysis Report
2013-2014Rupees in lacs
2012-2013Rupees in lacs
2. DIVIDEND
dividend of Rs. 2.25/- (225%) per equity share of Re.1
each for the financial year ended March 31, 2014. The
same, if declared at this annual general meeting will be
paid to those shareholders' whose names stand
registered in the register of members as on August 09,
2014. This dividend is tax free in the hands of the
shareholders.
3. BUYBACK OF EQUITY SHARES
Your Company concluded the ongoing buyback of it's
fully paid-up equity shares of Re.1 each, on August 16,
2013. During the said period, the Company has bought
back 5,087,343 equity shares of Re.1 each and the total
outlay for the buyback was Rs. 4,651.17 lacs. All the
equity shares bought back in the buyback offer have
been extinguished as on August 31, 2013.
PHARMA INDUSTRY- OVERVIEW & OUTLOOK
The global pharmaceutical market is dominated by USA,
which accounts for about 28 percent of global sales
followed by the European Union, accounting for nearly 15
percent, and Japan for 12 percent. Together, these three
markets represent nearly 55 percent of the global market.
The global pharmaceutical market is expected to grow at
a Compounded Annual Growth Rate of 6.5% throughout
the year 2014.
The Indian Pharmaceutical Market grew by 6.2% to touch
the market size of Rs.75,727 crores, during the year
ended March 31, 2014. Around 1,603 products were
introduced during the year (Source: AIOCD
Pharmasofttech AWACS Private Limited- Moving Annual
Total Turnover- March 2014).
5. OPPORTUNITIES, THREATS, RISKS & CONCERNS
Your Company has launched two new divisions namely
Pixel and Dil Se. The Pixel division will exclusively cater
to Ophthalmologist with premium range of Ophthalmics.
Your Company, being pioneers in Ophthalmological,
Pixel is an initiative to regain the Company's leadership
position in Ophthalmology in India.
The Dil Se division will primarily cater to the growing
Cardio-diabetic segment with an aim of putting patients
at ease. Their major brands being Zivast, Zilos and
Ziglim.
Your Company expects that the changes made in the
business model will improve our ability to act vigorously
and cohesively as an organisation and attract the right
talent and address the needs of our markets.
Your Board of Directors are pleased to recommend a final
4.
03
FDC LIMITED
Revenue from operations (Net) 76,459.51
Other income 3,816.37 4,756.08
Profit (before finance costs & depreciation/amortisation) 24,454.87 23,007.86
Finance costs 301.38 151.05
Depreciation and amortisation 2,454.35 2,751.19
Profit Before Tax 21,699.14 20,105.62
Less: Taxation- Current Tax 6,000.00 4,100.00
- Deferred Tax 7.11 163.15
- MAT credit entitlement - -
- Tax adjustments for
earlier years (current tax) 2,250.00 9.30
Profit After Tax 13,442.03 15,833.17
Balance of profit from prior years 40,568.18 34,460.00
Surplus available for appropriation 54,010.21 50,293.17
Appropriations:
Transfer to general reserve 5,000.00 5,000.00
Final dividend proposed 4,001.24 4,038.63
Tax on dividend 680.01 686.36
Reversal of excess provision of dividend (43.71) -
Balance carried toBalance Sheet 44,372.67 40,568.18
54,010.21 50,293.17
83,701.84
Previous year's figures have been re-grouped/re-classified, wherever necessary to conform to this year's classification.
creation of value added dosage forms to improve the patient convenience, compliance and therapy. FDC is committed to further strengthen its R & D base to develop niche products for both domestic and global markets and augment the organization's business goals. We have created a state of the art research facility for development and validation of pellatization technique based products. Two products based on pelletization techniques were developed.
Two generics products got approval from European regulatory agencies. A number of products were developed for registration in CIS, African countries and ROW.
ii. SYNTHETICS
Your Company's 'Research & Development – Synthetics' centre, set up in the year 1972, is a state-of-the-art facility with a well equipped Organic Chemistry and Analytical Chemistry Laboratory. The Organic Chemistry Laboratory has an aggressive and ambitious Active Pharmaceutical Ingredient (API) development program. Through the API development program, the Company has developed 3 APIs for commercial scale, severa l APIs are in advanced s tages o f commercialization and a research and development program for new APIs is also underway.
R&D Centers at Jogeshwari and Roha (Dist. Raigad), duly recognized by the Department of Science & Technology, carry out research and development in reducing the lead time of processes, making the processes more efficient and cost effective. In addition, constant evaluation of cheaper alternative raw materials meeting regulatory requirements for improving productivity and cost effectiveness is also studied.
Apart from sustaining the current APIs, the Company plans to continue to develop new and cost effective APIs, study the feasibility of new manufacturing processes, for existing APIs and optimization of process parameters with respect to quality and cost control.
iii. NUTRACEUTICALS
Your Company's reputed energy drink “Enerzal” has grown by 14% viz-a-viz market growth of 1% (Source: AIOCD Pharmasofttech AWACS Private Limited- Moving Annual Total Turnover- March 2014).
Your Company is also in the process of launching “Enerzal” in PET bottles (Orange and Apple Flavour).
After the successful launch of its infant milk substitute MUM MUM 1, your Company is in the process of launching MUM MUM 2, a specially developed infant milk substitute for infants between six months to one year taking into account the nutritional needs of the infants.
The Indian Pharmaceutical Industry has witnessed a lot of turmoil in the past year in terms of pricing regulations, cloud on irrational combinations, trade related issues & other regulatory issues. The rate at which, new introductions were being launched a couple of years back has also slowed down. Inspite of all these hurdles, the Indian Pharmaceutical Industry is still growing at a Compounded Annual Growth Rate of 12%.
The new drug price control regime enacted vide Drug Price Control Order (DPCO), 2013 has become law from May' 2013. The new DPCO is based on average market pricing of top 99% formulators as against cost based pricing under old DPCO 1995. The number of formulations of our Company covered under price control has doubled under new DPCO whereas percentage of formulations covered under price control has increased over six fold under new DPCO 2013. The impact of new DPCO on pricing of various companies in the industry would differ from company to company depending upon their basket of formulations.
6. SEGMENT-WISE / PRODUCT-WISE PERFORMANCE
a. MARKETING
thYour Company is ranked at 25 position, recording a growth of 3.1% and attaining a market share of 1.07% (Source: AIOCD Pharmasofttech AWACS Private Limited- Moving Annual Total Turnover- March 2014).
The various steps initiated by the Company have resulted in improving the performance of the Company. The Company continues its efforts to improve the performance through operational efficiencies by way of enlarging geographical coverage.
Your Company's Pioneer Oral Rehydration Salts (ORS)-Electral is the No.1 ORS Brand in the market. Newly introduced Calcium-Phosphorus Supplement, Calyumm-P suspension was launched at Paediatricians with much aplomb. Calyumm-P with its unique name & yummy flavour was well accepted and appreciated and was able to garner a good prescriber base at Paediatricians in the very first year of it’s launch.
Your Company's premium brand Zocon 150 grew by 47% and has become the fastest growing brand among top ten Fluconazole brands (Source: AIOCD Pharmasofttech AWACS Private Limited-Moving Annual Total Turnover- March 2014).
b. RESEARCH & DEVELOPMENT
i. FORMULATIONS
FDC's capabilities of research and innovation are an important component of its strategy for sustainable growth. Focus of Pharmaceutical Research is on
04
ANNUAL REPORT 2013-2014
January 2014, in recognition and appreciation of its best granted patents for innovative research in India and globally, during the year 2012-13.
7. INTERNAL CONTROL SYSTEMS AND THEIR
ADEQUACY
Your Company has clearly laid down policies, guidelines and procedures that form part of internal control system, which provide for checks and balances. Your Company has maintained a proper and adequate system of internal controls. This is to ensure that all assets are safeguarded and protected against loss from unauthorized use or disposition, and that transactions are authorized, recorded and reported diligently. Your Company's internal control systems are commensurate with the nature and size of its business operations.
8. HUMAN RESOURCES
The overall industrial and employee relations remained healthy. Information as per Section 217(2A) of the Companies Act, 1956, read with Companies (Statement of Particulars of Employees) Rules, 1975, forms a part of this report. However, as per the provisions of Section 219(1)(b)(iv) of the said Act, this report and the accounts are being sent to all shareholders excluding the particulars of employees under Section 217(2A). Any shareholder interested in obtaining a copy of the statement may write to the secretarial department at the corporate office of the Company.
9. CAUTIONARY NOTE
Certain statements in respect to Management Discussion and Analysis Report may be forward looking and are stated as required by the applicable laws and regulations. The future results of the Company may beaffected by many factors, which could be different from what the Directors envisage in terms of future performance and outlook.
10. SOCIAL RESPONSIBILITIES
Your Company has always been a socially responsible corporate citizen who is well aware and sensitive to the needs of the underprivileged people around it.
Your Company has been contributing towards the development of society through various charitable trusts helping the needy people for their education, medical, healthcare etc. Your Company's Education initiatives include scholarships for deserving and needy students, and allowing greater access to quality education.
11. DIRECTORS
Mr. Mohan A. Chandavarkar has been re-appointed as the Managing Director of the Company for a period of
4,The Company has successfully completed HACCP Recertification Audit and ISO22000:2005 Surveillance audit for Roha plant.
iv. BIOTECHNOLOGY
As reported to you earlier, with regard to the license technology agreement signed by your Company with an Israel based Company, for production and purification of recombinant protein licensed to FDC, we have received permit letter from department of Biotechnology to approach Drug Controller General of India (DCGI) for approval to conduct appropriate phase of Human Clinical Trials. Your Company is in the process of finalizing cGMP approved external facility to conduct manufacturing of our clinical grade recombinant protein that can then be used for Human Clinical trials.
Your Company has also been granted a patent entitled “Method for Determining the Potency of G-CSF” by Indian patent office.
c. EXPORTS
Developed markets such as UK, US & Australia are driving growth in the generics segment. We continue to rely upon our strengths viz. wide portfolio of Ophthalmic products, Anti-diarrheal, Anti-bacterial, dermatological prescription products and product promotion skills to execute our international plans, while we slowly gain expertise in handling tender/government business in each of the countries we are present in. We have registered an Export Sales turnover of Rs. 11,382.20 Lacs for the year ended March 31, 2014 with a growth of 19.30% over last year's turnover of Rs. 9,541.05 Lacs.
Apart from the developed markets, we have established a good presence in other fast growing markets like Ukraine, Africa, South East Asia and Latin America.
Going forward, we will strongly focus on USA, Canada, Australia, Latin America, South-East Asia, South Africa and the CIS region to register growth in the international markets.
d. INTELLECTUAL PROPERTY
Your Company has been honored by the Pharmaceut icals Export Promotion Counci l (PHARMEXCIL) with “NEW CHEMICAL ENTITIES (NCEs) – SILVER AWARD” on May 21, 2014, for its outstanding contribution in the field of pharmaceutical research by patenting innovations, both in India and abroad, during the year 2012-13. Your Company has received this prestigious PHARMEXCIL award for the third consecutive year. Similarly, your Company has also shown its presence in Indian Drug Manufacturers' Associations (IDMA) by achieving the “BEST NEW CHEMICAL ENTITY PATENT AWARD 2012-13” on
05
FDC LIMITED
13. CORPORATE GOVERNANCE
As required by the existing clause 49 of the listing agreements entered into with the stock exchanges, a separate report on corporate governance is given as a part of the annual report alongwith the auditors' statement on its compliance.
14. AUDITORS REPORT
With reference to Point no. (vii) in the Annexure of the Companies (Auditors Report) Order, 2003, the Company is taking effective steps for enlarging the scope and coverage of internal audit activities to make it commensurate with the size and nature of the business of the Company.
15. STATUTORY AUDITORS
The existing statutory auditors of the Company, M/s.S.R. Batliboi & Co. LLP, Chartered Accountants, Mumbai have communicated to the Company their unwillingness to be re-appointed as the statutory auditors of the Company and hence are not offering themselves for re-appointment at the ensuing Annual General Meeting.
The Board of Directors recommend the appointment of M/s. S R B C & Co. LLP, Chartered Accountants, as the statutory auditors of the Company in place of the retiring auditors, from the conclusion of the ensuing Annual General Meeting.
The Company has also received a certificate pursuant to provisions of Section 139 and 141 of the Companies Act,
2013 read with Companies (Audit and Auditors) Rules 2014, from M/s. S R B C & Co. LLP, certifying their eligibility for appointment as statutory auditors of the Company.
Both, M/s. S R B C & Co. LLP and M/s. S.R.Batliboi & Co. LLP are part of the same network of firms.
16. COST AUDITORS
The Audit Committee has recommended and the Board of Directors have appointed Shri. Prakash A. Sevekari, Cost Auditor, to conduct the Cost Audit for any of the Products covered under Cost Audit for the financial year ending March 31, 2015, subject to the approval of Central Government. The requisite applications for approval of his appointment will be submitted to the Central Government.
17. PUBLIC DEPOSITS
During the year under review, the Company has not accepted any fixed deposits.
five years with effect from April 01, 2014 and Mr. Nandan M. Chandavarkar has been re-appointed as the Joint Managing Director of the Company for a period of five years with effect from March 01, 2014, subject to the approval of the shareholders at the ensuing Annual General Meeting.
At the Board meeting held on May 29, 2014, Ms. Nomita R. Chandavarkar is appointed as an Additional Director of the Company with effect from June 02, 2014, to hold office upto the ensuing annual general meeting, at which she shall be eligible for appointment as a Director, liable to retire by rotation.
In terms of the Articles of Association of the Company and the relevant provisions of the Companies Act, 2013, Mr. Ameya A. Chandavarkar, Director will retire by rotation in the ensuing Annual General Meeting and being eligible, offers himself for re-appointment.
Pursuant to Sections 149 and 152 of the Companies Act, 2013 and the Rules made thereunder, your Board of Directors seek appointment of CA Girish C. Sharedalal, Dr. Rahim H. Muljiani, Dr. Nagam H. Atthreya, Dr. Satish S. Ugrankar and CA Vinod G. Yennemadi, as Independent and Non Executive Directors, at the ensuing Annual General Meeting for a term of five consecutive years. Details of the proposal for their appointment are mentioned in the Explanatory statement of the Notice of the 74th Annual General Meeting. Further, these Independent Directors will not be liable to retire by rotation.
12. DIRECTORS' RESPONSIBILITY STATEMENT
Pursuant to Section 217(2AA) of the Companies Act, 1956, your Directors based on the information anddocuments made available to them, confirm that:
a. in the preparation of the annual accounts, the applicable accounting standards have been followed;
b. they have selected such accounting policies and applied them consistently and made judgments and estimates that are reasonable and prudent so as to give a true and fair view of the state of affairs of the Company for the financial year ended March 31, 2014 and of the Statement of Profit and Loss for that period;
c. they have taken proper and sufficient care for the maintenance of adequate accounting records in accordance with the provisions of the Companies Act 1956, for safeguarding the assets of the Company and for preventing and detecting fraud and other irregularities;
d. they have prepared the annual accounts on a going concern basis.
06
ANNUAL REPORT 2013-2014
For and on behalf of the Board
MOHAN A. CHANDAVARKARChairman and Managing Director
registered office of the Company, between 10.00 a.m. to 12.00 noon on all days except Friday and holidays, till this Annual General Meeting and will also be placed before the said meeting.
Any shareholder interested in obtaining a copy of the annual accounts of the subsidiary companies may write to the secretarial department at the corporate office of the Company. The annual accounts of the individual subsidiary companies are also available on the Company's website-www.fdcindia.com.
19. CONSERVATION OF ENERGY, TECHNOLOGY ABSORPTION, FOREIGN EXCHANGE EARNING AND OUTGO
The information pursuant to Section 217(1)(e) of the Companies Act, 1956, read with the Companies (Disclosure of Particulars in the Report of Board of Directors) Rules, 1988, is annexed as Annexure A to this report.
20. ACKNOWLEDGEMENTS
Your Directors take this opportunity to place on record their gratitude for the continued support and co-operation extended to the Company by the medical fraternity, trade, Government agencies, financial institutions, investors, bankers, consumers and employees.
18. SUBSIDIARIES AND ITS OPERATIONS
Your Company's wholly owned subsidiary Anand Synthochem Limited has reported a loss of Rs.4.66 lacs.
Your Company's wholly owned subsidiary at USA, namely FDC Inc., reported a loss of USD 1,510 (i.e. profit of Rs. 4.28 lacs on account of exchange gain on currency translation).
Your Company's wholly owned subsidiary at UK, namely FDC International Ltd., has reported a profit of £ 171,828 (Rs. 219.25 lacs).
Your Company's joint venture business at South Africa namely Fair Deal Corporation Pharmaceutical SA (Pty) Ltd., has reported a loss of ZAR 22,81,820 (i.e. loss of Rs. 140.02 lacs on account of difference in rates takenfor Stock & Deferred tax).
As per the directions of the Central Government vide its general notification dated February 08, 2011, the financial data of the subsidiaries have been furnished under “Notes to the Consolidated Financial Statements”.
Also, as directed by the Central Government, annual accounts of the subsidiaries and the related detailed information will be made available to the holding and subsidiary company investors, on request and the same is available for inspection by the members at the
Place: MumbaiDate : May 29, 2014
07
FDC LIMITED
ANNEXURE A
of Particulars in the Report of the Board of Directors) Rules, 1988, forming part of the report of the directors for the year ended March 31, 2014.
A. CONSERVATION OF ENERGY
a. Energy conservation measures undertaken at various plants
Ÿ Replaced old window/split air conditioners with energy efficient inverter based technology air conditioners.
Ÿ Old window / split lower capacity air conditioners replaced with new energy efficient star rating air conditioners.
Ÿ Variable frequency drives are installed for HVAC applications.
Ÿ New energy efficient Trane chiller procured for centralized air conditioning.
Ÿ New energy efficient air compressor procured with HOC type dryer.
Ÿ Evaporative cooling introduced for comfort air conditioning.
Ÿ New energy efficient fluidized bed boiler procured with auto firing mechanism.
b. Proposals for energy conservation
Ÿ Energy efficient centralized air conditioners will be used in place of normal split or window air conditioners for upcoming projects.
Ÿ Old air conditioner used for comfort air conditioning will be changed to energy efficient inverter air conditioners.
Ÿ Installation of solar photovoltaic modules in phases at plants in Maharashtra.
Ÿ Old steam boiler with external furnace to be replaced with auto feed briquette fired boiler.
c. Impact of the measures of (a) and (b)
The adoption of energy conservation measures of the type indicated above has resulted in significant savings.
d. Total energy consumption and energy
consumption per unit of production as per
Form A
Since pharmaceutical production comprises of wide
variety of products, each requiring different
compositions and mix, the compilation of
consumption per unit of production is not feasible.
Information pursuant to the Companies (Disclosure
Form A
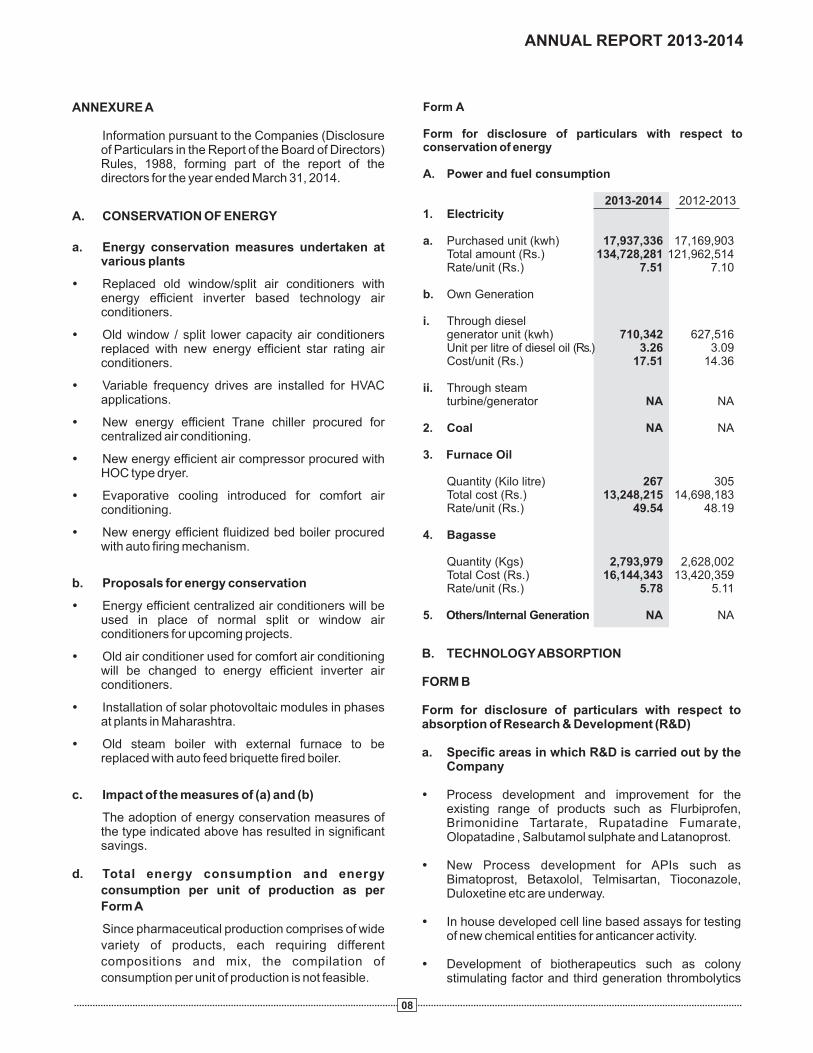
Form for disclosure of particulars with respect to conservation of energy
A. Power and fuel consumption
2012-20131. Electricity
a. Purchased unit (kwh) 17,937,336 17,169,903 Total amount (Rs.) 134,728,281 121,962,514 Rate/unit (Rs.) 7.51 7.10
b. Own Generation
i. Through diesel generator unit (kwh) 710,342 627,516
Unit per litre of diesel oil (Rs.) 3.26 3.09Cost/unit (Rs.) 17.51 14.36
ii. Through steam turbine/generator NA NA
2. Coal NA NA
3. Furnace Oil
Quantity (Kilo litre) 267 305Total cost (Rs.) 13,248,215 14,698,183Rate/unit (Rs.) 49.54 48.19
4. Bagasse
Quantity (Kgs) 2,793,979 2,628,002 Total Cost (Rs.) 16,144,343 13,420,359
Rate/unit (Rs.) 5.78 5.11
5. Others/Internal Generation NA NA
2013-2014
B. TECHNOLOGY ABSORPTION
FORM B
Form for disclosure of particulars with respect to absorption of Research & Development (R&D)
a. Specific areas in which R&D is carried out by the Company
Ÿexisting range of products such as Flurbiprofen, Brimonidine Tartarate, Rupatadine Fumarate, Olopatadine , Salbutamol sulphate and Latanoprost.
Ÿ New Process development for APIs such as Bimatoprost, Betaxolol, Telmisartan, Tioconazole, Duloxetine etc are underway.
Ÿ In house developed cell line based assays for testing of new chemical entities for anticancer activity.
Ÿ Development of biotherapeutics such as colony stimulating factor and third generation thrombolytics
Process development and improvement for the
08
ANNUAL REPORT 2013-2014
using recombinant DNA based technology.
Ÿ Development of Generic APIs and their intermediates.
Ÿ Development of processes to synthesize enantio pure drugs.
Ÿ Synthesis of new chemical entities and lead compounds.
Ÿ Development of Analytical methods for APIs which have not been listed in Pharmacopeia
b. Benefits derived as a result of the R&D activities
Ÿ Designed cost effective process. Reduction in time cycles of conversion and raw material consumption.
Ÿ Improvement in quality and yields of the product.
Ÿ Substitute for Import.
Ÿ Patent granted by Indian patent office for Novel use of human cell line for biological assay of our recombinant product.
Ÿ Environmental friendly coating system for products.
c. Future plan of action
Ÿ To continue to design economically viable sequences
to manufacture Active Pharmaceutical Ingredients
(APIs) with local as well as export potential.
Ÿ Development of APIS based on patent expiry.
Ÿ To file process and product patents.
Ÿ Cell culture related projects such as testing of new
chemical entities for anticancer activity.
Ÿ To develop and launch Novel Drug Delivery Systems
for different molecules.
TECHNOLOGY ABSORPTION, ADAPTATION AND INNOVATION
a. Effort in brief, made towards technology absorption, adaptation and innovation
Ÿ Bioavailability enhancement of poorly soluble drugs by using technologies like solid dispersion, colloidal dispersion.
Ÿ Nanotechnology for better Opthalmic suspension.
Ÿ Innovative and value added immediate release formulation with enhanced stability, safety and efficacy.
b. Benefits derived as a result of the above efforts
Ÿ Product development and cost competitiveness.
c. Information regarding imported technology (imported during the last 5 years reckoned from the beginning of the financial year) - None
C. FOREIGN EXCHANGE EARNINGS AND OUTGO
a. Activities relating to exports, initiative taken to increase exports, development of new export markets for products and services, and export plans
FDC's foreign exchange earnings, stood at Rs. 11,461.13 lacs for the year 2013-2014 against Rs.9,590.18 lacs in 2012-2013. The Company is continuously exploring possibilities of exporting more of its products to different markets.
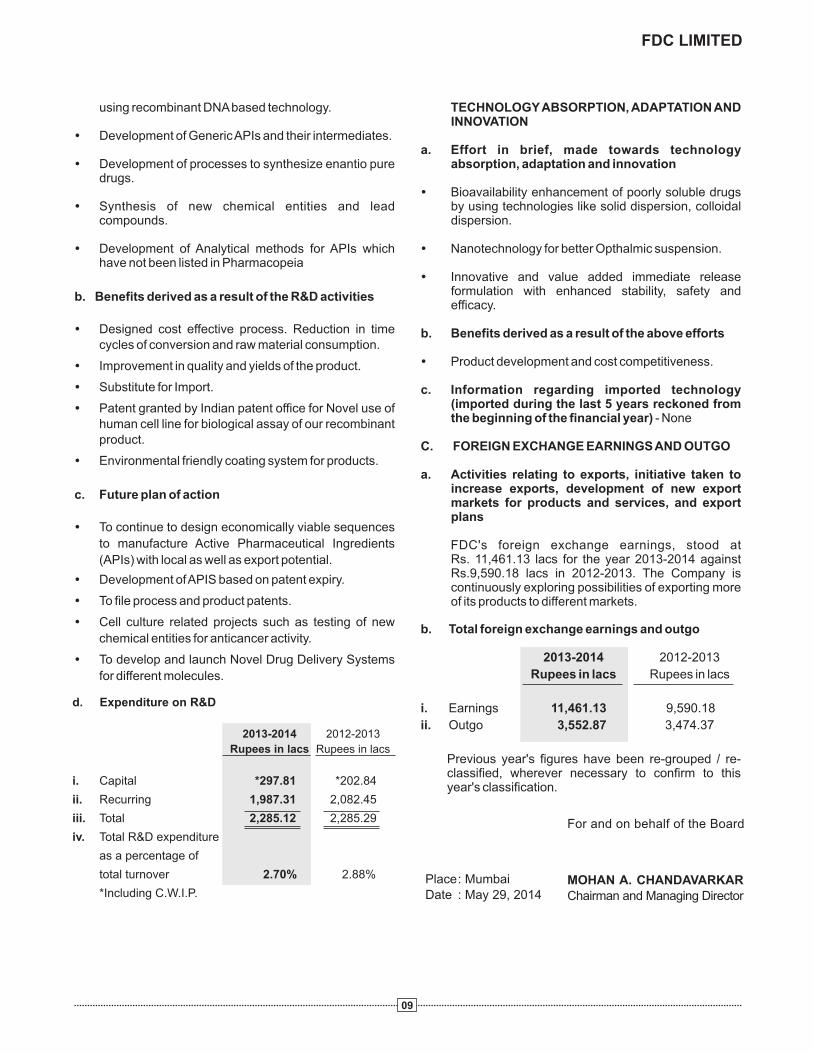
b. Total foreign exchange earnings and outgo
2012-2013
Rupees in lacs Rupees in lacs
i. Earnings 11,461.13 9,590.18
ii. Outgo 3,552.87 3,474.37
Previous year's figures have been re-grouped / re-classified, wherever necessary to confirm to this year's classification.
2013-2014
Place: MumbaiDate : May 29, 2014
For and on behalf of the Board
MOHAN A. CHANDAVARKARChairman and Managing Director
09
FDC LIMITED
d. Expenditure on R&D
Rupees in lacs
i. Capital *297.81 *202.84
ii. Recurring 1,987.31 2,082.45
iii. Total 2,285.12 2,285.29
iv. Total R&D expenditure
as a percentage of
total turnover 2.70% 2.88%
*Including C.W.I.P.
2013-2014 2012-2013
Rupees in lacs

CORPORATE GOVERNANCE
1. COMPANY'S PHILOSOPHY ON CODE OF CORPORATE GOVERNANCE
Your Company's philosophy on corporate governance is to carry out its activities and operations in a true and fair manner to achieve transparency, accountability and business prosperity. The Board of Directors of the Company are committed towards discharging their fiduciary responsibility towards enhancing shareholder's value and interest of all other stake-holders.
2. BOARD OF DIRECTORS
a. Composition of board of directors and category of individual directors
Name of the director *Number of directorships held in other companies
Other committees
Member Chairman
Name of the director No. of board meetings attended
Attendance at the last AGM
Mr. Mohan A. Chandavarkar 5 Present
Mr. Ashok A. Chandavarkar 3 Present
Mr. Nandan M. Chandavarkar 5 Present
Mr. Ameya A. Chandavarkar 4 Absent
CA Girish C. Sharedalal 5 Present
Dr. Satish S. Ugrankar 5 Present
Dr. Rahim H. Muljiani 5 Present
Dr. Nagam H. Atthreya 4 Absent
CA Vinod G.Yennemadi 5 Absent
Name of the director Category
Mr. Mohan A. Chandavarkar Promoters and
Mr. Ashok A. Chandavarkar Executive Directors
Mr. Nandan M. Chandavarkar
Mr. Ameya A. Chandavarkar
CA Girish C. Sharedalal
Dr. Satish S. Ugrankar Independent and Non
Dr. Rahim H. Muljiani Executive Directors
Dr. Nagam H. Atthreya
CA Vinod G. Yennemadi
b. Attendance at the board meetings and last Annual General Meeting ('AGM')
During the year under review, five Board Meetings were held on May 24, 2013, August 03, 2013, September 25, 2013, November 1, 2013 and January 30, 2014. The last AGM of the Company was held on August 31, 2013.
The gap between any two meetings did not exceed four months.
Attendance of each director at Board Meetings and last AGM
c. Membership/Chairmanship of other boards and committees thereof
Mr. Mohan A. Chandavarkar Nil Nil Nil
Mr. Ashok A. Chandavarkar Nil Nil Nil
Mr. Nandan M. Chandavarkar Nil Nil Nil
Mr. Ameya A. Chandavarkar Nil Nil Nil
CA Girish C. Sharedalal 1 2 Nil
Dr. Satish S. Ugrankar Nil Nil Nil
Dr. Rahim H. Muljiani Nil Nil Nil
Dr. Nagam H. Atthreya 1 1 Nil
CA Vinod G.Yennemadi Nil Nil Nil
10
ANNUAL REPORT 2013-2014
Place: MumbaiDate : May 29, 2014
*The listing above excludes private & foreign companies.
d. Code of Conduct
Declaration as required under Clause 49 of the Listing Agreement
All board members and the senior management personnel of the Company have affirmed compliance with the code of conduct for the year ended March 31, 2014. The said code is posted on the website of the Company- www.fdcindia.com.
MOHAN A. CHANDAVARKARChairman and Managing Director
e. Notes on directors seeking appointment/ re-appointment
The details of directors seeking appointed / re-appointment has been aptly covered in the notice of the Annual General Meeting and the same may be treated as a disclosure under Clause 49 of the Listing Agreement.
3. AUDIT COMMITTEE
a. Brief description of terms of reference
The terms of reference of this committee covers the matters specified under Section 292A of the Companies Act, 1956 and also the matters listed under the listing agreement with the stock exchanges. The committee, comprising of financially literate members, is responsible for effective supervision of the financial operations and ensuring that financial, accounting activities and operating controls are exercised as per the laid down policies and procedures. The financial results of every quarter
are reviewed by the committee before being placed before the Board of Directors for its approval. The Company has set up an internal audit team, which reviews the functions and operations of the Company and submits its report to the audit committee. The statutory auditors are regular invitees to the audit committee meetings.
b. Constitution of the Committee
The committee comprises of four Independent Non-Executive Directors and one Executive Director. The said committee functions under the chairmanship of CA Girish C. Sharedalal. Dr. Rahim H. Muljiani, Dr. Nagam H. Atthreya, CA Vinod G. Yennemadi and Mr. Mohan A. Chandavarkar are the other members of the committee.
CA Girish C. Sharedalal and CA Vinod G. Yennemadi are Chartered Accountants by profession and have considerable accounting and financial management expertise.
Dr. Rahim H. Muljiani, Dr. Nagam H. Atthreya and Mr. Mohan A. Chandavarkar are financially literate.
The Company Secretary of the Company acted as the Secretary to the committee. During the year under review, four audit committee meetings were held on May 24, 2013, August 03, 2013, November 01, 2013 and January 30, 2014.
The attendance of members at the meetings was as follows:
CA Girish C. Sharedalal Chairman 4
Dr. Rahim H. Muljiani Member 4
Dr. Nagam H. Atthreya Member 4
CA Vinod G.Yennemadi Member 4
Mr. Mohan A. Chandavarkar Member 4
Name of the member attended
Status No. of meetings
11
FDC LIMITED
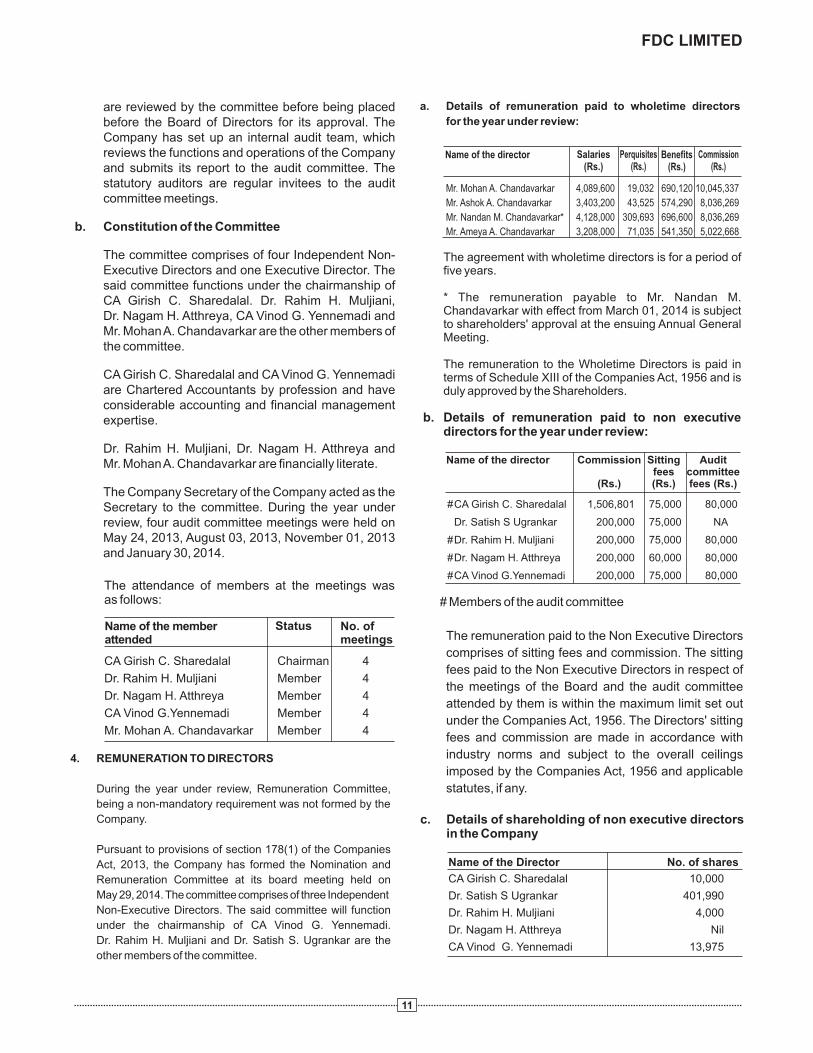
The agreement with wholetime directors is for a period of five years.
* The remuneration payable to Mr. Nandan M. Chandavarkar with effect from March 01, 2014 is subject to shareholders' approval at the ensuing Annual General Meeting.
The remuneration to the Wholetime Directors is paid in terms of Schedule XIII of the Companies Act, 1956 and is duly approved by the Shareholders.
#CA Girish C. Sharedalal 1,506,801 75,000 80,000
Dr. Satish S Ugrankar 200,000 75,000 NA
#Dr. Rahim H. Muljiani 200,000 75,000 80,000
#Dr. Nagam H. Atthreya 200,000 60,000 80,000
#CA Vinod G.Yennemadi 200,000 75,000 80,000
Sitting fees(Rs.)
Audit committee fees (Rs.)
Commission
(Rs.)
Name of the director
# Members of the audit committee
The remuneration paid to the Non Executive Directors
comprises of sitting fees and commission. The sitting
fees paid to the Non Executive Directors in respect of
the meetings of the Board and the audit committee
attended by them is within the maximum limit set out
under the Companies Act, 1956. The Directors' sitting
fees and commission are made in accordance with
industry norms and subject to the overall ceilings
imposed by the Companies Act, 1956 and applicable
statutes, if any.
Mr. Mohan A. Chandavarkar 4,089,600 19,032 690,120 10,045,337
Mr. Ashok A. Chandavarkar 3,403,200 43,525 574,290 8,036,269
Mr. Nandan M. Chandavarkar* 4,128,000 309,693 696,600 8,036,269
Mr. Ameya A. Chandavarkar 3,208,000 71,035 541,350 5,022,668
Name of the director Salaries (Rs.)
Perquisites(Rs.)
Benefits (Rs.)
Commission(Rs.)
4. REMUNERATION TO DIRECTORS
During the year under review, Remuneration Committee,
being a non-mandatory requirement was not formed by the
Company.
Pursuant to provisions of section 178(1) of the Companies
Act, 2013, the Company has formed the Nomination and
Remuneration Committee at its board meeting held on
May 29, 2014. The committee comprises of three Independent
Non-Executive Directors. The said committee will function
under the chairmanship of CA Vinod G. Yennemadi.
Dr. Rahim H. Muljiani and Dr. Satish S. Ugrankar are the
other members of the committee.
a. Details of remuneration paid to wholetime directors
for the year under review:
b. Details of remuneration paid to non executive directors for the year under review:
Name of the Director No. of shares
CA Girish C. Sharedalal 10,000
Dr. Satish S Ugrankar 401,990
Dr. Rahim H. Muljiani 4,000
Dr. Nagam H. Atthreya Nil
CA Vinod G. Yennemadi 13,975
c. Details of shareholding of non executive directors in the Company

5. SHAREHOLDERS'/ INVESTORS' GRIEVANCE COMMITTEE
a. Composition of the Committee
The Committee functions under the chairmanship of Dr. Rahim H. Muljiani, a non executive independent director. Mr. Mohan A. Chandavarkar and Mr. Ashok A. Chandavarkar are the other members of the committee. During the year, the committee met once on March 29, 2014. All the members of the committee attended the above meeting.
b. Name and designation of the compliance officer
Mrs. Shalini Kamath, Company Secretary, resigned from the services of the Company on 15th March 2014 and in her place Ms. Varsharani Katre, has been appointed as the Company Secretary and the Compliance Officer of the Company.
c. Number of complaints received and resolved
During the year under review, the Company received Twenty Five complaints from shareholders/investors. All the complaints have been resolved to the satisfaction of the shareholders. There were no applications for transfers pending as on March 31, 2014. In order to expedite the process of transfers of shares, the Board has delegated the power to approve share transfers to the share transfer committee set up by the Board of Directors.
12
ANNUAL REPORT 2013-2014
7. ADOPTION OF WHISTLE BLOWER POLICY
Whistle Blower Policy, being a non-mandatory requirement was not adopted by the Company.
a.
b.
c.
a.
b.
8. DISCLOSURES
The Company has not entered into any transaction of material nature with any related party as described under the listing agreement entered into with the stock exchanges that may have potential conflict with the interests of the Company at large.
During the past three years there have been no instances of non compliance by the Company with the requirements of the stock exchanges, Securities and Exchange Board of India ('SEBI') or any other statutory authority on any matter related to capital markets.
Non-mandatory requirements of corporate governance have not been adopted.
9. MEANS OF COMMUNICATION
The Company publishes its annual, half yearly and quarterly financial results in the following newspapers:
i. Business Standard (English)
ii. Sakal (Marathi)
iii. Free Press Journal (English)
iv. Navshakti (Marathi)
The above mentioned results are also displayed on
the Company's website-www.fdcindia.com. In
addition, information like the shareholding pattern,
details of persons holding more than 1% of the fully
paid up capital, etc. is also displayed on the
Company's website.
The information required under the Management Discussion and Analysis Report has been aptly covered under the Directors' Report.
10. GENERAL SHAREHOLDER INFORMATION
a. Annual General Meeting
Date : August 09, 2014
Time : 10 a.m.
Venue : WelcomHotel
Rama International
R-3, Chikalthana
Aurangabad 431 210
Maharashtra
Financial Location Date Time No. of special
year resolutions passed2010-11 WelcomHotel Rama September 10.00 a.m. One
International 24, 2011
R-3, Chikalthana
Aurangabad 431 210
Maharashtra2011-12 WelcomHotel Rama August 10.00 a.m. Three
International 17, 2012
R-3, Chikalthana
Aurangabad 431 210
Maharashtra
2012-13 WelcomHotel Rama August 10.00 a.m. None
International 31, 2013
R-3, Chikalthana
Aurangabad 431 210
Maharashtra
6. GENERAL BODY MEETINGS
a. Location and time of the last three AGMs:
b. During the year, there were no resolutions passed by postal ballot.
c. None of the resolutions proposed for the ensuing Annual General Meeting needs to be passed by postal ballot.

FDC LIMITED
c. Dates of book closure
July 31, 2014 to August 09, 2014
(both days inclusive)
d. Dividend payment date
Latest by August 31 , 2014
e. Stock Exchanges where listed
BSE Limited (BSE) National Stock Exchange of India Limited (NSE)
b. Financial Calendar (tentative)
Particulars Date
Unaudited results of the first quarter First week ofending June 30, 2014 August 2014
Unaudited results of the second quarter First week ofand half year ending September 30, 2014 November 2014
Unaudited results of the third quarter and First week ofnine months ending December 31, 2014 February 2015
Audited results for the year ending Last week ofMarch 31, 2015 May, 2015
Note: Based on monthly closing price of FDC and monthly closing index point of BSE 500.
i. Registrars & Share Transfer Agents
Sharex Dynamic (India) Pvt. Ltd.
Unit-1, Luthra Industrial Premises, Andheri Kurla Road
Safed Pool, Andheri (East), Mumbai – 400 072
Tel.: (022) 2851 5606, 2851 5644, Fax. : (022) 2851 2885
E-mail ID.: [email protected]
h. Performance of the Company's stock in comparison to BSE 500
Stock Price Performance- FDC Vs BSE 500
0
20
40
60
80
100
120
140
April-13
May
-13
June
-13
July-1
3
Augus
t-13
Septe
mbe
r-13
Octob
er-1
3
Nov
embe
r-13
Dec
3
embe
r-1
Janu
ary-
14
Febru
ary-
14
Mar
ch-1
4
FD
C
Sh
are
Pri
ce
2000
4000
6000
8000
10000
12000
BS
E0
50
FDC S e P ichar r e BSE 500
f. Stock Code: BSE - 531599, NSE – FDC EQ
g. Market Price Data
Month High Low High Low
BSE NSE
April, 2013 92.80 87.50 92.90 87.20
May, 2013 95.00 85.00 95.25 84.00
June, 2013 93.45 87.05 93.95 87.40
July, 2013 92.00 85.20 91.95 85.50
August, 2013 90.50 79.00 90.75 79.85
September, 2013 93.00 81.60 86.35 81.55
October, 2013 89.75 82.55 89.90 81.00
November, 2013 109.50 88.00 109.80 88.00
December, 2013 143.45 102.40 143.65 102.25
January, 2014 140.55 112.10 140.50 111.80
February, 2014 129.50 115.00 129.65 115.00
March, 2014 135.80 120.90 135.70 120.35
(Source: BSE website/NSE trade statistics)
13
k. Shareholding Pattern as on March 31, 2014
Category No. of Shares % holding
Promoters & Promoters Group 122,504,656 68.89
Mutual Funds, Banks, Insurance
Companies, Venture Capital
Funds and Central/ State Govt.
Institutions 8,824,722 4.96
Foreign Institutional Investors 12,905,436 7.26
Private Corporate Bodies 4,470,252 2.51
Indian Public 27,108,233 15.24
Others 2,019,785 1.14
Total 177,833,084 100.00
j. Share Transfer System
The Company has set up a committee of the Board of
Directors known as the Share Transfer Committee, which
meets generally once in fifteen days inter-alia for approving
the transfer of shares. The formalities for transfer of shares in
the physical form are completed and the share certificates
are dispatched to the transferee within fifteen days of receipt
of transfer documents, provided the documents are complete
and the shares under transfer are not under dispute.
Distribution of Shareholding as on March 31, 2014
Equity shares offace value of Re. 1 each
Shareholders
Number
Upto 5,000 23,231 97.59 10,659,570 5.99
5,001 to 10,000 320 1.34 2,391,538 1.34
10,001 to 20,000 100 0.42 1,490,706 0.84
20,001 to 30,000 38 0.16 940,809 0.53
30,001 to 40,000 19 0.08 697,993 0.39
40,001 to 50,000 13 0.05 595,231 0.34
50,001 to 1,00,000 19 0.08 1,351,229 0.76
Above 1,00,001 66 0.28 159,706,008 89.81
Total 23,806 100.00 177,833,084 100.00
Equity shares
% of total Number
% to total

14
ANNUAL REPORT 2013-2014
Place : MumbaiDate : May 29, 2014
For and on behalf of the Board
MOHAN A. CHANDAVARKARChairman and Managing Director
l. Dematerialisation of shares and liquidity
The shares of the Company are in the compulsory demat segment and are available in the depository system both in National Security Depository Limited ('NSDL') and Central Depository Services (India) Limited ('CDSL'). As on March 31, 2014, 173,314,369 equity shares aggregating to 97.46% of the total number of fully paid equity shares having face value of Re.1 each are held by the shareholders in the dematerialised form.
The Company has not issued any GDRs / ADRs /
Warrants or any convertible instruments.
n. Plant locations
As mentioned on the cover page.
o. Address for correspondence
Shareholders holding shares in the physical form
should address their correspondence to the
Company's Registrar and Share Transfer Agents
at the address as given under (i) above.
Shareholders holding shares in the demat form
should address their correspondence to their
respective depository participants with whom they
have their accounts.
m. Outstanding GDRs/ ADRs/ Warrants or any
convertible instruments, conversion date and
likely impact on equity
AUDITORS' CERTIFICATE
To
The Members of FDC Limited
We have examined the compliance of conditions of corporate governance by FDC Limited (‘the Company’) for the year ended on March 31, 2014, as stipulated in clause 49 of the Listing Agreement of the said Company with the stock exchanges.
The compliance of conditions of corporate governance is the responsibility of the management. Our examination was limited to procedures and implementation thereof, adopted by the Company for ensuring the compliance of the conditions of Corporate Governance. It is neither an audit nor an expression of opinion on the financial statements of the Company.
In our opinion and to the best of our information and according to the explanations given to us, we certify that the Company has complied with the conditions of Corporate Governance as stipulated in the above mentioned Listing Agreement.
We further state that such compliance is neither an assurance as to future viability of the Company nor the efficiency or effectiveness with which the management has conducted the affairs of the Company.
per VIJAY MANIAR Partner
Membership No.: 36738Place: Mumbai Date : May 29, 2014
For S.R.BATLIBOI & CO. LLPChartered Accountants
Firm Registration No. 301003E
INDEPENDENT AUDITOR'S REPORT
To the Members of FDC Limited
Report on the Financial Statements
We have audited the accompanying financial statements of FDC Limited (“the Company”), which comprise the Balance Sheet as at 31st March 2014, and the Statement of Profit and Loss and Cash Flow Statement for the year then ended, and a summary of significant accounting policies and other explanatory information.
Management's Responsibility for the Financial Statements
Management is responsible for the preparation of these financial statements that give a true and fair view of the financial position, financial performance and cash flows of the Company in accordance with accounting principles generally accepted in India, including the Accounting Standards notified under the Companies Act, 1956, read with General Circular 8/2014 dated 4th April 2014 issued by the Ministry of Corporate Affairs. This responsibility includes the design, implementation and maintenance of internal control relevant to the preparation and presentation of the financial statements that give a true and fair view and are free from material misstatement, whether due to fraud or error.
Auditor's Responsibility
Our responsibility is to express an opinion on these financial statements based on our audit. We conducted our audit in accordance with the Standards on Auditing issued by the Institute of Chartered Accountants of India. Those Standards require that we comply with ethical requirements and plan and perform the audit to obtain reasonable assurance about whether the financial statements are free from material misstatement.
An audit involves performing procedures to obtain audit evidence about the amounts and disclosures in the financial statements. The procedures selected depend on the auditor's judgment, including the assessment of the risks of material misstatement of the financial statements, whether due to fraud or error. In making those risk assessments, the auditor considers internal control relevant to the Company's preparation and fair presentation of the financial statements in order to design audit procedures that are appropriate in the circumstances but not for the purpose of expressing an opinion on the effectiveness of the entity’s internal control. An audit also includes evaluating the appropriateness of accounting policies used and the reasonableness of the accounting estimates made by management, as well as evaluating the overall presentation of the financial statements. We believe that the audit evidence we have obtained is sufficient and appropriate to provide a basis for our audit opinion.
Opinion
In our opinion and to the best of our information and according to the explanations given to us, the financial statements give the information required by the Companies Act, 1956 (”the Act”) in the manner so required and give a true and fair view in conformity with the accounting principles generally accepted in India:
(a) in the case of the Balance Sheet, of the state of affairs of the Company as at 31st March 2014;
(b) in the case of the Statement of Profit and Loss, of the profit for the year ended on that date; and
(c) in the case of the Cash Flow Statement, of the cash flows for the year ended on that date.
Report on Other Legal and Regulatory Requirements
1. As required by the Companies (Auditor's Report) Order, 2003 (“the Order”) issued by the Central Government of India in terms of sub-section (4A) of section 227 of the Act, we give in the Annexure a statement on the matters specified in paragraphs 4 and 5 of the Order.
2. As required by section 227(3) of the Act, we report that:
(a) We have obtained all the information and explanations which to the best of our knowledge and belief were necessary for the purpose of our audit;
(b) In our opinion proper books of account as required by law have been kept by the Company so far as appears from our examination of those books;
15
FDC LIMITED
181916
(c) The Balance Sheet, Statement of Profit and Loss, and Cash Flow Statement dealt with by this Report are in agreement with the books of account;
(d) In our opinion, the Balance Sheet, the Statement of Profit and Loss, and the Cash Flow Statement comply with the Accounting Standards notified under the Act, read with General Circular 8/2014 dated 4th April 2014 issued by the Ministry of Corporate Affairs;
(e) On the basis of written representations received from the directors as on 31st March 2014, and taken on record by the Board of Directors, none of the directors is disqualified as on 31st March 2014, from being appointed as a director in terms of clause (g) of sub-section (1) of section 274 of the Act.
For S.R. BATLIBOI & CO. LLPChartered AccountantsFirm Registration No. 301003E
per Vijay ManiarPartnerMembership No. 36738
Place : MumbaiDate : May 29, 2014
ANNUAL REPORT 2013-2014

17
Annexure referred to in our report of even dateRe: FDC Limited (“the Company”)
(i) (a) The Company has maintained proper records showing full particulars, including quantitative details and situation of fixed assets.
(b) Fixed assets have been physically verified by the management in a phased periodical manner as per regular programme of verification which, in our opinion, is reasonable having regard to the size of the Company and the nature of its assets. As informed, no material discrepancies were noticed on such verification.
(c) There was no disposal of a substantial part of fixed assets during the year. (ii) (a) The management has conducted physical verification of inventory at reasonable intervals during the year.
(b) The procedures of physical verification of inventories followed by the management are reasonable and adequate in relation to the size of the Company and the nature of its business.
(c) The Company is maintaining proper records of inventory and no material discrepancies were noticed on physical verification.
(iii) According to the information and explanations given to us, the Company has not taken/ granted any loans, secured or
unsecured from/ to companies, firms or other parties covered in the register maintained under section 301 of the Act.
Accordingly, the provisions of clause 4(iii) (a) to (g) of the Order are not applicable to the Company and hence not
commented upon.
(iv) In our opinion and according to the information and read with the explanations given to us, having regard to the
explanation that certain items of inventory are purchased from strategic vendors and accordingly, Company does not
obtain comparable quotations, there is an adequate internal control system commensurate with the size of the
Company and the nature of its business, for the purchase of inventory and fixed assets and for the sale of goods and
services. During the course of our audit, we have not observed any major weakness or continuing failure to correct
any major weakness in the internal control system of the Company in respect of these areas.
(v) (a) According to the information and explanations provided by the management, we are of the opinion that the
particulars of contracts or arrangements referred to in section 301 of the Act that need to be entered into the
register maintained under section 301 have been so entered.
(b) In our opinion and according to the information and explanations given to us, the transactions made in pursuance
of such contracts or arrangements exceeding the value of Rupees five lakhs have been entered into during the
financial year at prices which are reasonable having regard to the prevailing market prices at the relevant time.
(vi) The Company has not accepted any deposits from the public.
(vii) The Company has an internal audit system, the scope and coverage of which, in our opinion, requires to be enlarged to
be commensurate with the size and nature of its business.
(viii) We have broadly reviewed the books of account maintained by the Company pursuant to the rules made by the Central
Government for the maintenance of cost records under section 209(1)(d) of the Act, related to the manufacture of
Formulation and Bulk drugs and are of the opinion that prima facie, the prescribed accounts and records have been
made and maintained. We have not, however, made a detailed examination of the same.
(ix) (a) Undisputed statutory dues including provident fund, investor education and protection fund, employees' state
insurance, income-tax, sales-tax, wealth-tax, service tax, customs duty, excise duty, cess and other material
statutory dues have generally been regularly deposited with the appropriate authorities.
(b) According to the information and explanations given to us, no undisputed amounts payable in respect of provident
fund, investor education and protection fund, employees' state insurance, income-tax, wealth-tax, service tax,
sales-tax, customs duty, excise duty, cess and other material statutory dues were outstanding, at the year end, for
a period of more than six months from the date they became payable.
FDC LIMITED

(c) According to the information and explanation given to us, there are no dues of wealth tax, customs duty and cess
which have not been deposited on account of any dispute. According to the records of the Company, the dues
outstanding of income-tax, sales-tax, service tax and excise duty on account of any dispute, are as follows:
18
Gujarat Sales Tax Act/ Uttar PradeshSales Tax Act/ WestBengal Sales TaxAct/ MaharashtraSales Tax Act (Tax /Penalty/ Interest)
Central Excise Act/ Service Tax (Duty/Penalty / Interest)
Name of Statute Period to which the Forum where dispute is pending(Nature of Dues) amount relates (Rs. in lacs)
* Amount
Apr 2002 - Mar 2003 Sales Tax Appellate Tribunal 46.84
Apr 2002 - Mar 2003 Revisional Board - Commercial Tax 14.30
Apr 2003 - Mar 2004 Sales Tax Appellate Tribunal 13.15
Apr 2005 - Mar 2006 Revisional Board - Commercial Tax 27.43
Apr 2006 - Mar 2007 Joint Commissioner (Appeals) 0.58
Apr 2006 - Mar 2007 Joint Commissioner (Appeals) 4.80
Apr 2007 - Mar 2008 Sales Tax Appellate Tribunal 2.00
Apr 2008 - Mar 2009 Sales Tax Appellate Tribunal 3.14
Apr 2008 - Mar 2009 Joint Commissioner (Appeals) 73.72
Apr 2008 - Mar 2009 Joint Commissioner (Appeals) 2.10
Apr 2009 - Mar 2010 Sales Tax Appellate Tribunal 3.37
Apr 2010 - Mar 2011 Sales Tax Appellate Tribunal 2.48
(I) Total 193.91
Apr 2000 – Dec 2001 Custom Excise & Service tax Appellate Tribunal 8.80
Oct 2000 – Nov 2001 Custom Excise & Service tax Appellate Tribunal 58.16
Nov 2002 – Jun 2003 Custom Excise & Service tax Appellate Tribunal 32.88
Dec 2003 - Oct 2004 Custom Excise & Service tax Appellate Tribunal 84.51
Apr 2004 - Mar 2005 Custom Excise & Service tax Appellate Tribunal 2.12
Apr 2005 - Sep 2006 Custom Excise & Service tax Appellate Tribunal 28.56
Apr 2007 - Mar 2008 Custom Excise & Service tax Appellate Tribunal 3.30
Sub-total (a) 218.33
Apr 2005 - Sep 2005 Assistant Commissioner of Service Tax 24.88
Jun 2011 - Oct 2011 Deputy Commissioner 0.67
Apr 2009 - Mar 2010 Additional Commissioner 17.05
Feb 2011 - Nov 2011 Deputy Commissioner 1.44
Sub-total (b) 44.04
(II) Total (a+b) 262.37
AY 2010 -2011 Commissioner of Income Tax - Appeals 494.26
(III) Total 494.26
Total (I + II + III) 950.54
* disclosed as contingent liability in the financial statements.
Income tax
(x) The Company has no accumulated losses at the end of the financial year and it has not incurred cash losses in the current and immediately preceding financial year.
(xi) Based on our audit procedures and as per the information and explanations given by the management, the Company
did not have any outstanding dues in respect of a financial institution, bank or debenture holders during the year.
ANNUAL REPORT 2013-2014
19
(xii) Based on our examination of documents and records, we are of the opinion that the Company has maintained
adequate records where the Company has granted loans and advances on the basis of security by way of pledge of
shares, debentures and other securities.
(xiii) In our opinion, the Company is not a chit fund or a nidhi/ mutual benefit fund/ society. Therefore, the provisions of
clause 4(xiii) of the Order are not applicable to the Company.
(xiv) In our opinion, the Company is not dealing in or trading in shares, securities, debentures and other investments.
Accordingly, the provisions of clause 4(xiv) of the Order are not applicable to the Company.
(xv) According to the information and explanations given to us, the Company has not given any guarantee for loans taken
by others from bank or financial institutions.
(xvi) The Company did not have any term loans outstanding during the year.
(xvii) According to the information and explanations given to us and on an overall examination of the balance sheet of the
Company, we report that no funds raised on short-term basis have been used for long-term investment.
(xviii) The Company has not made any preferential allotment of shares to parties or companies covered in the register
maintained under section 301 of Act.
(xix) The Company did not have any outstanding debentures during the year.
(xx) The Company has not raised money through public issues during the year.
(xxi) Based upon the audit procedures performed for the purpose of reporting the true and fair view of the financial
statements and as per the information and explanations given by the management, we report that no fraud on or by
the Company has been noticed or reported during the year.
For S.R. BATLIBOI & CO. LLPChartered AccountantsFirm Registration No. 301003E
per Vijay Maniar Partner Membership No.36738
Place: Mumbai Date : May 29, 2014
FDC LIMITED

PARTICULARS Note 31st March 2014 31st March 2013No. Rupees in lacs Rupees in lacs
I. EQUITY AND LIABILITIES1 Shareholders' funds (a) Share capital 2 1,786.19 1,816.19 (b) Reserves and surplus 3 82,263.09 76,154.37 84,049.28 77,970.56 2 Non-current liabilities (a) Long-term borrowings 4 107.07 124.47 (b) Deferred tax liabilities (net) 5 3,009.50 3,002.39 3,116.57 3,126.86 3 Current liabilities (a) Trade payables 7 7,814.41 5,975.55 (b) Other current liabilities 7 4,199.53 3,542.22 (c) Short-term provisions 6 5,596.38 5,243.74 17,610.32 14,761.51
TOTAL 104,776.17 95,858.93
II. ASSETS1 Non-current assets (a) Fixed assets 8 (i) Tangible assets 27,012.70 27,341.03 (ii) Intangible assets 200.51 314.45 (iii) Capital work-in-progress Tangible assets 1,779.96 722.43 Intangible assets 30.52 - (b) Non-current investments 9 19,331.78 25,154.51 (c) Long-term loans and advances 10 12,985.27 1,662.31 (d) Other non-current assets 15 65.74 51.65 61,406.48 55,246.38 2 Current assets (a) Current investments 11 22,990.45 17,090.96 (b) Inventories 12 10,059.21 9,744.55 (c) Trade receivables 13 5,862.45 4,476.49 (d) Cash and bank balances 14 2,001.53 3,490.27 (e) Short-term loans and advances 10 2,013.08 4,907.93 (f ) Other current assets 15 442.97 902.35 43,369.69 40,612.55 TOTAL 104,776.17 95,858.93
BALANCE SHEET AS AT 31ST MARCH 2014
20
ANNUAL REPORT 2013-2014
Significant accounting policies 1The accompanying notes are an integral part of the financial statements. 2 to 40
As per our report of even date
For S.R. BATLIBOI & CO. LLPChartered AccountantsFirm Registration No. 301003E
per VIJAY MANIARPartner Membership No. 36738
For and on behalf of the Board of Directors
MOHAN A. CHANDAVARKAR Chairman and Managing Director
ASHOK A. CHANDAVARKARDirector
VARSHARANI KATRECompany Secretary
Place : Mumbai Date : May 29, 2014
Place : Mumbai Date : May 29, 2014
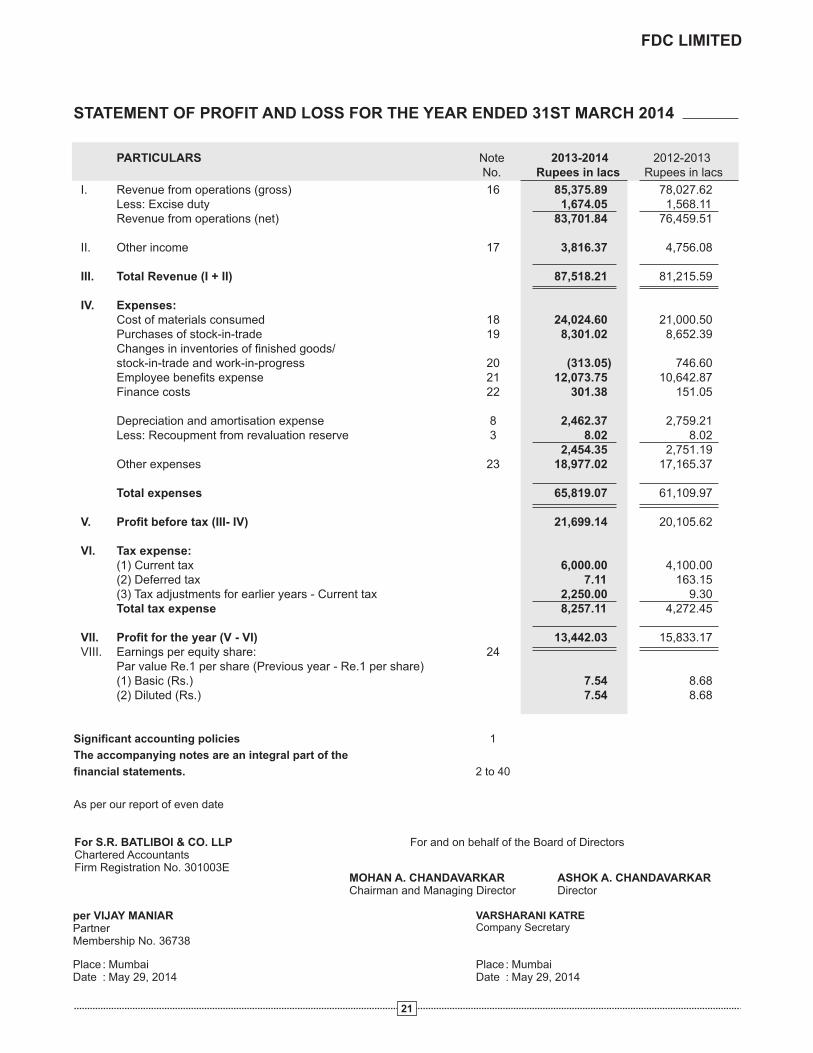
PARTICULARS Note 2013-2014 2012-2013No. Rupees in lacs Rupees in lacs
I. Revenue from operations (gross) Less: Excise duty Revenue from operations (net)
II. Other income III. Total Revenue (I + II) IV. Expenses: Cost of materials consumed Purchases of stock-in-trade Changes in inventories of finished goods/
stock-in-trade and work-in-progress Employee benefits expense Finance costs
Depreciation and amortisation expense Less: Recoupment from revaluation reserve Other expenses Total expenses V. Profit before tax (III- IV) VI. Tax expense: (1) Current tax (2) Deferred tax (3) Tax adjustments for earlier years - Current tax Total tax expense VII. Profit for the year (V - VI) VIII. Earnings per equity share: 24 Par value Re.1 per share (Previous year - Re.1 per share) (1) Basic (Rs.) (2) Diluted (Rs.)
16 85,375.89 78,027.62 1,674.05 1,568.11
83,701.84 76,459.51
17 3,816.37 4,756.08
87,518.21 81,215.59
18 24,024.60 21,000.50 19 8,301.02 8,652.39
20 (313.05) 746.6021 12,073.75 10,642.8722 301.38 151.05
8 2,462.37 2,759.213 8.02 8.02
2,454.35 2,751.1923 18,977.02 17,165.37
65,819.07 61,109.97
21,699.14 20,105.62
6,000.00 4,100.007.11 163.15
2,250.00 9.308,257.11 4,272.45
13,442.03 15,833.17
7.54 8.68 7.54 8.68
STATEMENT OF PROFIT AND LOSS FOR THE YEAR ENDED 31ST MARCH 2014
Significant accounting policies 1
The accompanying notes are an integral part of the
financial statements. 2 to 40
As per our report of even date
21
FDC LIMITED
For S.R. BATLIBOI & CO. LLPChartered AccountantsFirm Registration No. 301003E
per VIJAY MANIARPartner Membership No. 36738
For and on behalf of the Board of Directors
MOHAN A. CHANDAVARKAR Chairman and Managing Director
ASHOK A. CHANDAVARKARDirector
VARSHARANI KATRECompany Secretary
Place : Mumbai Date : May 29, 2014
Place : Mumbai Date : May 29, 2014
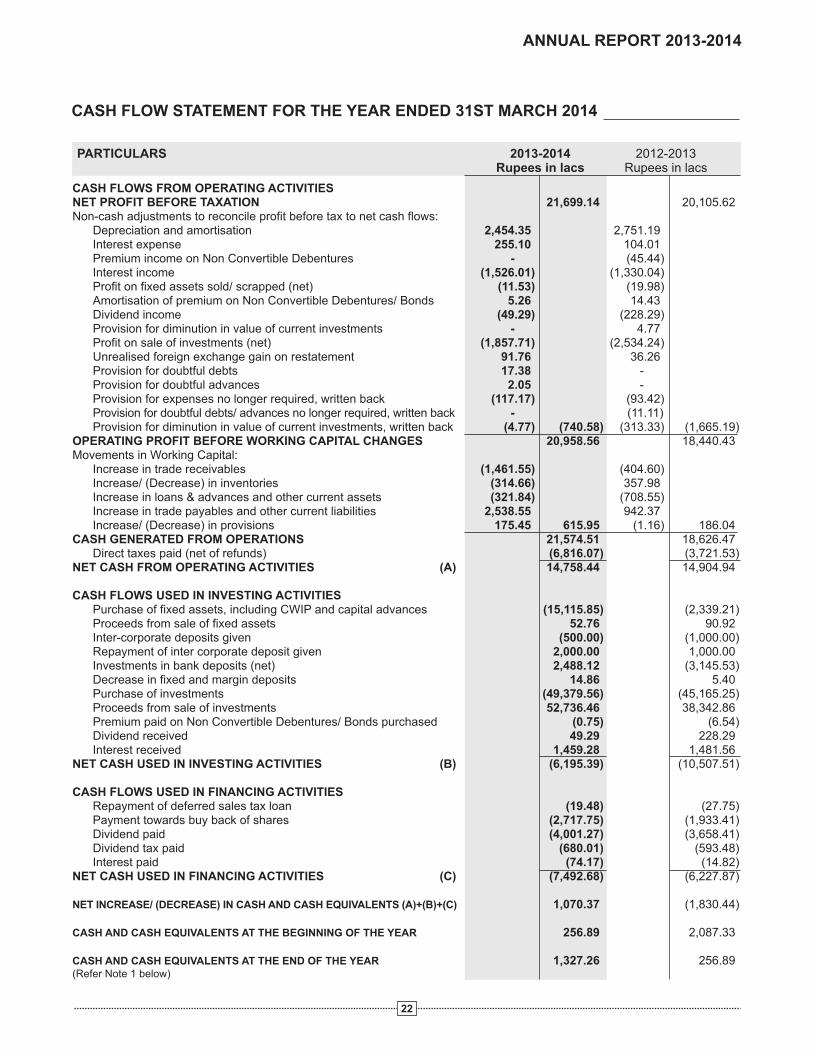
PARTICULARS 2013-2014Rupees in lacs
2012-2013Rupees in lacs
CASH FLOW STATEMENT FOR THE YEAR ENDED 31ST MARCH 2014
22
CASH FLOWS FROM OPERATING ACTIVITIES NET PROFIT BEFORE TAXATION Non-cash adjustments to reconcile profit before tax to net cash flows: Depreciation and amortisation Interest expense Premium income on Non Convertible Debentures Interest income Profit on fixed assets sold/ scrapped (net) Amortisation of premium on Non Convertible Debentures/ Bonds Dividend income Provision for diminution in value of current investments Profit on sale of investments (net) Unrealised foreign exchange gain on restatement Provision for doubtful debts Provision for doubtful advances Provision for expenses no longer required, written back Provision for doubtful debts/ advances no longer required, written back Provision for diminution in value of current investments, written backOPERATING PROFIT BEFORE WORKING CAPITAL CHANGES Movements in Working Capital: Increase in trade receivables Increase in inventories Increase in loans & advances and other current assets Increase in trade payables and other current liabilities Increase/ (Decrease) in provisions CASH GENERATED FROM OPERATIONS Direct taxes paid (net of refunds)NET CASH FROM OPERATING ACTIVITIES (A) CASH FLOWS USED IN INVESTING ACTIVITIES Purchase of fixed assets, including CWIP and capital advances Proceeds from sale of fixed assets Inter-corporate deposits given Repayment of inter corporate deposit given
Decrease in fixed and margin deposits Purchase of investments Proceeds from sale of investments Premium paid on Non Convertible Debentures/ Bonds Dividend received Interest receivedNET CASH USED IN INVESTING ACTIVITIES (B) CASH FLOWS USED IN FINANCING ACTIVITIES Repayment of deferred sales tax loan Payment towards buy back of shares Dividend paid Dividend tax paid Interest paidNET CASH USED IN FINANCING ACTIVITIES (C) NET INCREASE IN CASH AND CASH EQUIVALENTS (A)+(B)+(C)
CASH AND CASH EQUIVALENTS AT THE BEGINNING OF THE YEAR
CASH AND CASH EQUIVALENTS AT THE END OF THE YEAR (Refer Note 1 below)
21,699.14 20,105.62
2,454.35 2,751.19 255.10 104.01
- (45.44) (1,526.01) (1,330.04)
(11.53) (19.98)5.26 14.43
(49.29) (228.29) - 4.77
(1,857.71) (2,534.24) 91.76 36.2617.38 - 2.05 -
(117.17) (93.42) - (11.11)
(4.77) (740.58) (313.33) (1,665.19)20,958.56 18,440.43
(1,461.55) (404.60)/ (Decrease) (314.66) 357.98
(321.84) (708.55) 2,538.55 942.37
175.45 615.95 (1.16) 186.04 21,574.51 18,626.47 (6,816.07) (3,721.53)14,758.44 14,904.94
(15,115.85) (2,339.21)52.76 90.92
(500.00) (1,000.00)2,000.00 1,000.00
Investments in bank deposits (net) 2,488.12 (3,145.53)14.86 5.40
(49,379.56) (45,165.25)52,736.46 38,342.86
purchased (0.75) (6.54)49.29 228.29
1,459.28 1,481.56 (6,195.39) (10,507.51)
(19.48) (27.75)(2,717.75) (1,933.41)(4,001.27) (3,658.41)
(680.01) (593.48)(74.17) (14.82)
(7,492.68) (6,227.87)
/ (DECREASE) 1,070.37 (1,830.44)
256.89 2,087.33
1,327.26 256.89
ANNUAL REPORT 2013-2014

PARTICULARS 31st March 2014 31st March 2013
Rupees in lacs Rupees in lacs
Cash on hand
Balance with scheduled banks:
In current accounts
In unpaid dividend accounts (Refer Note 2 below)
Unrealised foreign exchange gain on restatement of cash and
cash equivalents
13.18 15.66
1,228.45 192.07
91.14 93.13
(5.51) (43.97)
1,327.26 256.89
2. Rs.91.14 lacs (Previous year Rs. 93.13 lacs) in unclaimed dividend accounts are not available for use by the Company as they represent corresponding dividend liabilities.
As per our report of even date
Notes to the Cash Flow Statement
1. Cash and cash equivalents consist of cash on hand and balances with banks. Cash and cash equivalents included in
the cash flow statement comprise of the following Balance Sheet items:
For S.R. BATLIBOI & CO. LLPChartered AccountantsFirm Registration No. 301003E
For and on behalf of the Board of Directors
MOHAN A. CHANDAVARKAR Chairman and Managing Director
ASHOK A. CHANDAVARKARDirector
VARSHARANI KATRECompany Secretary
per VIJAY MANIARPartnerMembership No. 36738
Place: MumbaiDate : May 29, 2014
Place: MumbaiDate : May 29, 2014
CASH FLOW STATEMENT FOR THE YEAR ENDED 31ST MARCH 2014
23
FDC LIMITED
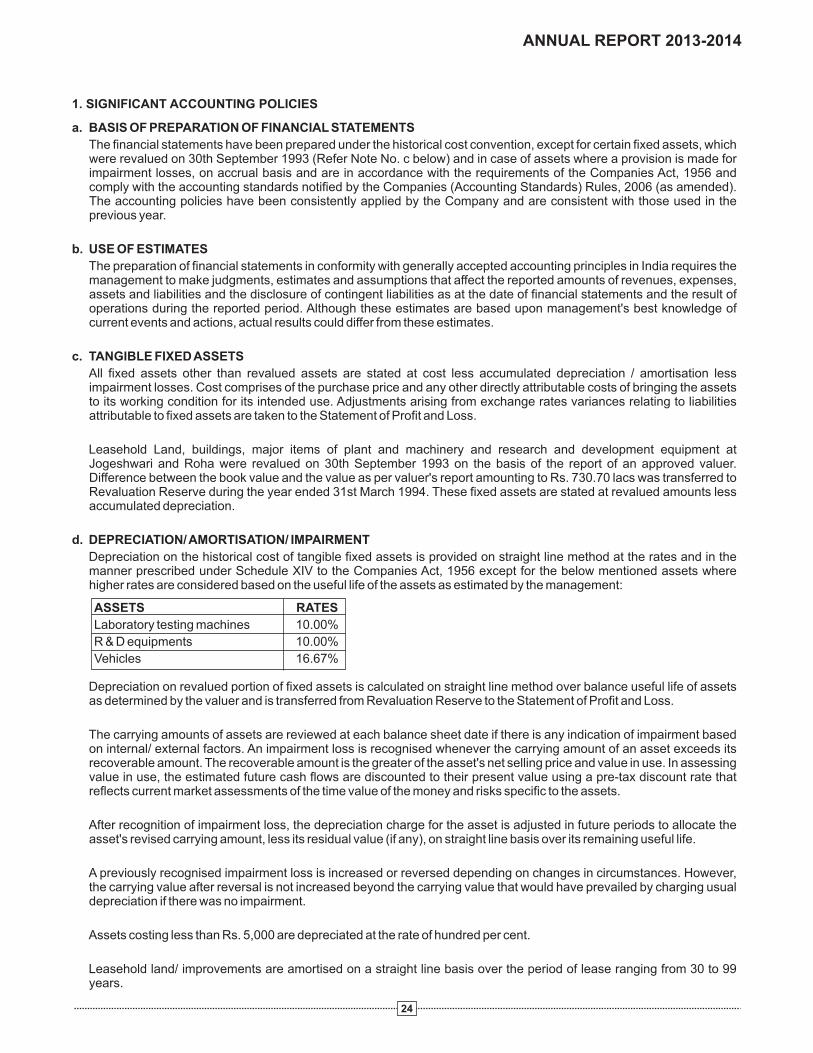
a. BASIS OF PREPARATION OF FINANCIAL STATEMENTS
The financial statements have been prepared under the historical cost convention, except for certain fixed assets, which were revalued on 30th September 1993 (Refer Note No. c below) and in case of assets where a provision is made for impairment losses, on accrual basis and are in accordance with the requirements of the Companies Act, 1956 and comply with the accounting standards notified by the Companies (Accounting Standards) Rules, 2006 (as amended). The accounting policies have been consistently applied by the Company and are consistent with those used in the previous year.
b. USE OF ESTIMATES
The preparation of financial statements in conformity with generally accepted accounting principles in India requires the management to make judgments, estimates and assumptions that affect the reported amounts of revenues, expenses, assets and liabilities and the disclosure of contingent liabilities as at the date of financial statements and the result of operations during the reported period. Although these estimates are based upon management's best knowledge of current events and actions, actual results could differ from these estimates.
c. TANGIBLE FIXED ASSETS
All fixed assets other than revalued assets are stated at cost less accumulated depreciation / amortisation less impairment losses. Cost comprises of the purchase price and any other directly attributable costs of bringing the assets to its working condition for its intended use. Adjustments arising from exchange rates variances relating to liabilities attributable to fixed assets are taken to the Statement of Profit and Loss.
Leasehold Land, buildings, major items of plant and machinery and research and development equipment at Jogeshwari and Roha were revalued on 30th September 1993 on the basis of the report of an approved valuer. Difference between the book value and the value as per valuer's report amounting to Rs. 730.70 lacs was transferred to Revaluation Reserve during the year ended 31st March 1994. These fixed assets are stated at revalued amounts less accumulated depreciation.
d. DEPRECIATION/ AMORTISATION/ IMPAIRMENT
Depreciation on the historical cost of tangible fixed assets is provided on straight line method at the rates and in the manner prescribed under Schedule XIV to the Companies Act, 1956 except for the below mentioned assets where higher rates are considered based on the useful life of the assets as estimated by the management:
Depreciation on revalued portion of fixed assets is calculated on straight line method over balance useful life of assets as determined by the valuer and is transferred from Revaluation Reserve to the Statement of Profit and Loss.
The carrying amounts of assets are reviewed at each balance sheet date if there is any indication of impairment based on internal/ external factors. An impairment loss is recognised whenever the carrying amount of an asset exceeds its recoverable amount. The recoverable amount is the greater of the asset's net selling price and value in use. In assessing value in use, the estimated future cash flows are discounted to their present value using a pre-tax discount rate that reflects current market assessments of the time value of the money and risks specific to the assets.
After recognition of impairment loss, the depreciation charge for the asset is adjusted in future periods to allocate the asset's revised carrying amount, less its residual value (if any), on straight line basis over its remaining useful life.
A previously recognised impairment loss is increased or reversed depending on changes in circumstances. However, the carrying value after reversal is not increased beyond the carrying value that would have prevailed by charging usual depreciation if there was no impairment.
Assets costing less than Rs. 5,000 are depreciated at the rate of hundred per cent.
Leasehold land/ improvements are amortised on a straight line basis over the period of lease ranging from 30 to 99 years.
1. SIGNIFICANT ACCOUNTING POLICIES
24
ASSETS RATES
Laboratory testing machines 10.00%
R & D equipments 10.00%
Vehicles 16.67%
ANNUAL REPORT 2013-2014
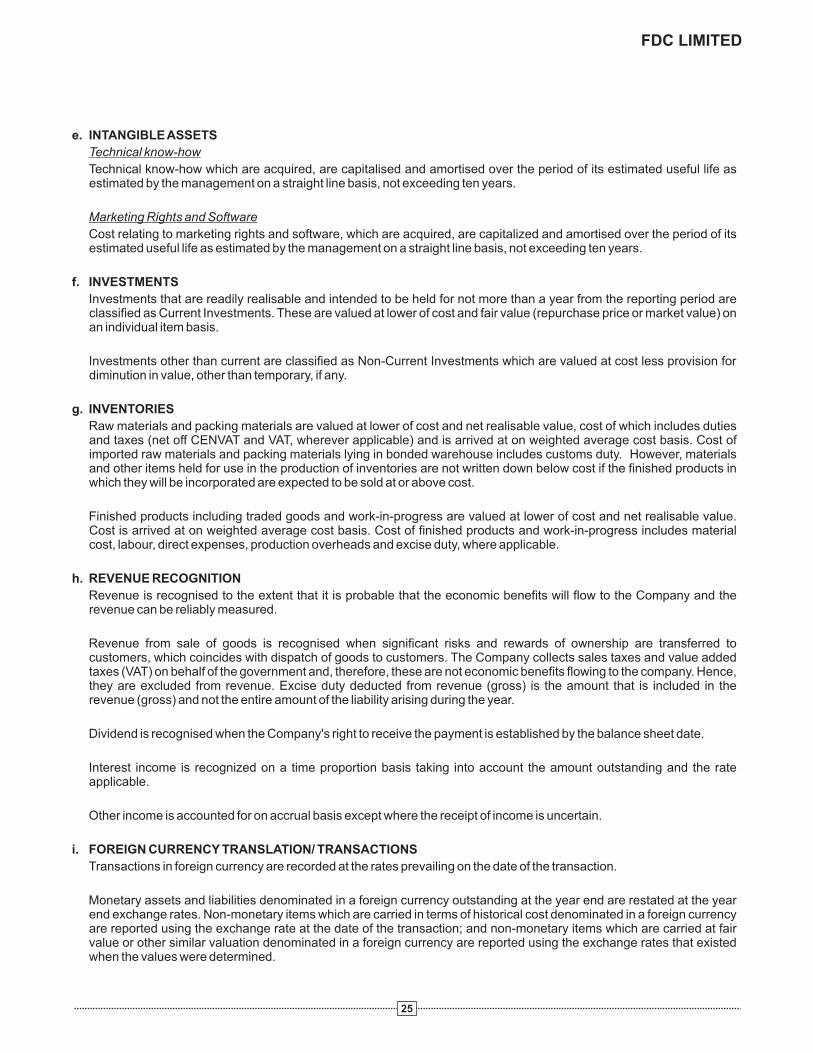
e. INTANGIBLE ASSETS
Technical know-how
Technical know-how which are acquired, are capitalised and amortised over the period of its estimated useful life as estimated by the management on a straight line basis, not exceeding ten years.
Marketing Rights and Software
Cost relating to marketing rights and software, which are acquired, are capitalized and amortised over the period of its estimated useful life as estimated by the management on a straight line basis, not exceeding ten years.
f. INVESTMENTS
Investments that are readily realisable and intended to be held for not more than a year from the reporting period are classified as Current Investments. These are valued at lower of cost and fair value (repurchase price or market value) on an individual item basis.
Investments other than current are classified as Non-Current Investments which are valued at cost less provision for diminution in value, other than temporary, if any.
g. INVENTORIES
Raw materials and packing materials are valued at lower of cost and net realisable value, cost of which includes duties and taxes (net off CENVAT and VAT, wherever applicable) and is arrived at on weighted average cost basis. Cost of imported raw materials and packing materials lying in bonded warehouse includes customs duty. However, materials and other items held for use in the production of inventories are not written down below cost if the finished products in which they will be incorporated are expected to be sold at or above cost.
Finished products including traded goods and work-in-progress are valued at lower of cost and net realisable value. Cost is arrived at on weighted average cost basis. Cost of finished products and work-in-progress includes material cost, labour, direct expenses, production overheads and excise duty, where applicable.
h. REVENUE RECOGNITION
Revenue is recognised to the extent that it is probable that the economic benefits will flow to the Company and the revenue can be reliably measured.
Revenue from sale of goods is recognised when significant risks and rewards of ownership are transferred to customers, which coincides with dispatch of goods to customers. The Company collects sales taxes and value added taxes (VAT) on behalf of the government and, therefore, these are not economic benefits flowing to the company. Hence, they are excluded from revenue. Excise duty deducted from revenue (gross) is the amount that is included in the revenue (gross) and not the entire amount of the liability arising during the year.
Dividend is recognised when the Company's right to receive the payment is established by the balance sheet date.
Interest income is recognized on a time proportion basis taking into account the amount outstanding and the rate applicable.
Other income is accounted for on accrual basis except where the receipt of income is uncertain.
i. FOREIGN CURRENCY TRANSLATION/ TRANSACTIONS
Transactions in foreign currency are recorded at the rates prevailing on the date of the transaction.
Monetary assets and liabilities denominated in a foreign currency outstanding at the year end are restated at the year end exchange rates. Non-monetary items which are carried in terms of historical cost denominated in a foreign currency are reported using the exchange rate at the date of the transaction; and non-monetary items which are carried at fair value or other similar valuation denominated in a foreign currency are reported using the exchange rates that existed when the values were determined.
25
FDC LIMITED

Exchange differences arising out of settlement and restatement of foreign exchange monetary items are taken to the Statement of Profit and Loss.
The premium or discount arising at the inception of forward exchange contracts is amortised as expense or income over the life of the contract. Exchange differences on such contracts are recognised in the Statement of Profit and Loss in the year in which the exchange rates change. Any profit or loss arising on cancellation or renewal of forward exchange contract is recognised as income or expense for the year.
j. GOVERNMENT GRANTS
Grants and subsidies from the government are recognised when there is reasonable assurance that the grant/ subsidy will be received and all attaching conditions will be complied with.
Government grants received as capital incentives/ subsidies are credited to Capital Reserve. Government grants related to revenue is recognised on a systematic basis in the Statement of Profit and Loss over the periods necessary to match them with the related costs which they are intended to compensate.
Government grants relating to specific fixed assets are disclosed as deduction from the gross value of the assets concerned.
k. EMPLOYEE BENEFITS
Company's contribution to recognised provident fund, family pension fund and superannuation fund is defined contribution plan and is charged to the Statement of Profit and Loss on accrual basis. The Company recognises contribution payable to the provident fund scheme as an expenditure, when an employee renders the related service. There are no other obligations other than the contribution payable to the respective trusts.
Contribution to gratuity fund is defined benefit obligation and is provided for on the basis of an actuarial valuation on projected unit credit method made at the end of each financial year.
Short term compensated absences are provided for based on estimates. Long term compensated absences are provided for based on actuarial valuation. The actuarial valuation is done as per projected unit credit method.
Actuarial gains/ losses are immediately recognised in the Statement of Profit and Loss.
l. RESEARCH AND DEVELOPMENT
Revenue expenditure is charged off to Statement of Profit and Loss in the year in which it is incurred.
m. LEASE ACCOUNTING
Leases where substantially all the risks and benefits of ownership are retained by the lessor, are classified as operating leases. Operating lease expenses/ income is recognised in the Statement of Profit and Loss on a straight line basis over the lease term.
n. EARNING PER SHARE
Basic earning per share is computed by dividing the net profit after tax attributable to equity shareholders for the year by the weighted average number of equity shares outstanding during the year.
Diluted earning per share is computed by dividing the net profit after tax attributable to equity shareholders for the year by the weighted average number of equity shares outstanding during the year as adjusted for the effects of all dilutive potential equity shares, if any.
o. ACCOUNTING FOR TAXES ON INCOME
Tax expense comprises of current and deferred tax. Provision for current tax is made, based on the tax payable under the Income-tax Act, 1961. Deferred tax assets and liabilities from timing differences between taxable income and accounting income is accounted for using the tax rates and the tax laws enacted or substantially enacted as on the balance sheet date.
26
ANNUAL REPORT 2013-2014

At each balance sheet date, the Company reassesses unrecognised deferred tax assets. Deferred tax assets are recognised only to the extent that there is a reasonable certainty of their realisation. In situations where the Company has unabsorbed depreciation or carry forward tax losses, all deferred tax assets are recognised only if there is virtual certainty supported by convincing evidence that they can be realised against future taxable profits.
MAT credit is recognised as an asset when there is convincing evidence that the Company will pay normal income tax during the specified period. The Company reviews the same at each balance sheet date and writes down the carrying amount of MAT Credit Entitlement to the extent there is no longer convincing evidence to the effect that Company will pay normal income tax during the specified period.
p. PROVISIONS AND CONTINGENCIES
The Company creates a provision when there exist a present obligation as a result of a past event that probably requires an outflow of resources and a reliable estimate can be made of the amount of the obligation. Provisions are not discounted to its present value and are determined based on best estimate required to settle the obligation at the balance sheet date. These are reviewed at each balance sheet date and adjusted to reflect the current best estimates.
A disclosure for a contingent liability is made when there is a possible obligation or a present obligation that may, but probably will not require an outflow of resources. When there is a possible obligation or a present obligation in respect of which the likelihood of outflow of resources is remote, no provision or disclosure is made.
q. CASH AND CASH EQUIVALENTS
Cash and cash equivalents for the purposes of cash flow statement comprise cash at bank and in hand and short-term investments with an original maturity of three months or less.
27
FDC LIMITED
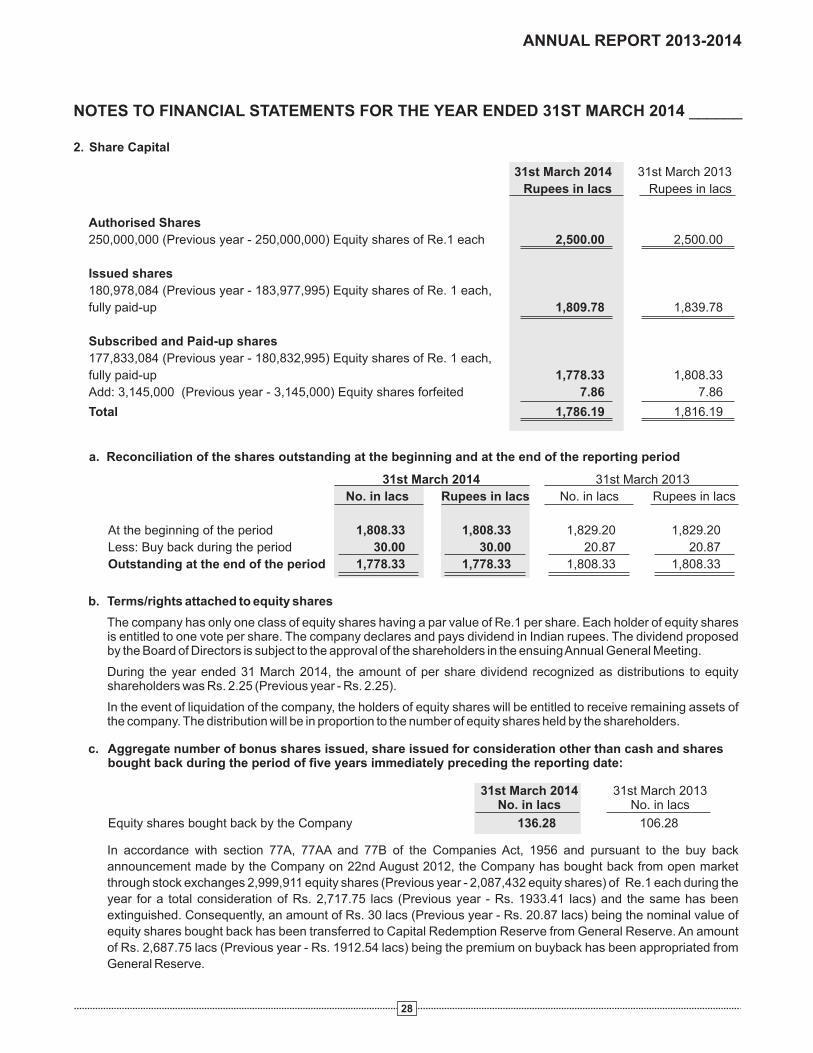
31st March 2014 31st March 2013
Rupees in lacs Rupees in lacs
Authorised Shares
250,000,000 (Previous year - 250,000,000) Equity shares of Re.1 each 2,500.00 2,500.00
Issued shares
Subscribed and Paid-up shares
Total
180,978,084 (Previous year - 183,977,995) Equity shares of Re. 1 each,
fully paid-up 1,809.78 1,839.78
177,833,084 (Previous year - 180,832,995) Equity shares of Re. 1 each,
fully paid-up 1,778.33 1,808.33
Add: 3,145,000 (Previous year - 3,145,000) Equity shares forfeited 7.86 7.86
1,786.19 1,816.19
NOTES TO FINANCIAL STATEMENTS FOR THE YEAR ENDED 31ST MARCH 2014 ______
2. Share Capital
a. Reconciliation of the shares outstanding at the beginning and at the end of the reporting period
31st March 2014 31st March 2013
No. in lacs Rupees in lacs No. in lacs Rupees in lacs
At the beginning of the period
Less: Buy back during the period
Outstanding at the end of the period
1,808.33 1,808.33 1,829.20 1,829.20
30.00 30.00 20.87 20.87
1,778.33 1,778.33 1,808.33 1,808.33
b. Terms/rights attached to equity shares
The company has only one class of equity shares having a par value of Re.1 per share. Each holder of equity shares is entitled to one vote per share. The company declares and pays dividend in Indian rupees. The dividend proposed by the Board of Directors is subject to the approval of the shareholders in the ensuing Annual General Meeting.
During the year ended 31 March 2014, the amount of per share dividend recognized as distributions to equity shareholders was Rs. 2.25 (Previous year - Rs. 2.25).
In the event of liquidation of the company, the holders of equity shares will be entitled to receive remaining assets of the company. The distribution will be in proportion to the number of equity shares held by the shareholders.
31st March 2014 31st March 2013No. in lacs No. in lacs
Equity shares bought back by the Company 136.28 106.28
In accordance with section 77A, 77AA and 77B of the Companies Act, 1956 and pursuant to the buy back
announcement made by the Company on 22nd August 2012, the Company has bought back from open market
through stock exchanges 2,999,911 equity shares (Previous year - 2,087,432 equity shares) of Re.1 each during the
year for a total consideration of Rs. 2,717.75 lacs (Previous year - Rs. 1933.41 lacs) and the same has been
extinguished. Consequently, an amount of Rs. 30 lacs (Previous year - Rs. 20.87 lacs) being the nominal value of
equity shares bought back has been transferred to Capital Redemption Reserve from General Reserve. An amount
of Rs. 2,687.75 lacs (Previous year - Rs. 1912.54 lacs) being the premium on buyback has been appropriated from
General Reserve.
28
c. Aggregate number of bonus shares issued, share issued for consideration other than cash and shares bought back during the period of five years immediately preceding the reporting date:
ANNUAL REPORT 2013-2014

d. Details of shareholders holding more than 5% shares in the Company
31st March 2014 31st March 2013
% holding in % holding in
Numbers the class Numbers the class
Equity shares of Re. 1 each fully paid
Meera Ramdas Chandavarkar
Transgene Trading and Investment Company Private Limited
Sudipta Trading and Investment Company Private Limited
Soven Trading and Investment Company Private Limited
Mohan Anand Chandavarkar
Ashok Anand Chandavarkar
Sandhya Mohan Chandavarkar
21,925,260 12.33 21,925,260 12.10
17,097,500 9.61 17,097,500 9.43
16,365,000 9.20 16,365,000 9.03
16,327,500 9.18 16,327,500 9.01
11,222,770 6.31 11,222,770 6.19
10,530,360 5.92 10,530,360 5.81
10,483,480 5.90 10,483,480 5.79
As per records of the Company, including its register of shareholders/members and other declarations received from shareholders regarding beneficial interest, the above shareholding represents both legal and beneficial ownerships of shares.
29
31st March 2014 31st March 2013
Rupees in lacs Rupees in lacs
Capital redemption reserve
Opening balance
Add: Transfer from general reserve on account of buy back
of equity shares (Refer Note No. 2c)
Closing balance (B)
Securities premium account (C) 72.90 72.90
Revaluation reserve
Opening balance
Less: Transfer to statement of profit and loss as reduction from depreciation
Closing balance (D)
General reserve
Opening balance
Less: Premium paid for buy back of equity shares (Refer Note No. 2c)
Less: Transfer to capital redemption reserve account (Refer Note No. 2c)
Add: Transfer from surplus balance in the statement of profit and loss
Surplus in the statement of profit and loss
Opening balance
Profit for the year
Add: Reversal of excess provision of dividend
Less: Appropriations
Proposed final equity dividend [Amount per share Rs. 2.25 (Previous year-Rs. 2.25)]
Tax on proposed equity dividend
Transfer to general reserve
Net surplus in the statement of profit and loss (F)
Total (A+B+C+D+E+F)
Capital Reserve (A) 75.01 75.01
123.09 102.22
30.00 20.87
153.09 123.09
57.37 65.39
8.02 8.02
49.35 57.37
35,257.82 32,191.23
2,687.75 1,912.54
30.00 20.87
5,000.00 5,000.00
Closing balance (E) 37,540.07 35,257.82
40,568.18 34,460.00
13,442.03 15,833.17
43.71 -
4,001.24 4,038.63
680.01 686.36
5,000.00 5,000.00
44,372.67 40,568.18
82,263.09 76,154.37
3. Reserves and surplus
FDC LIMITED
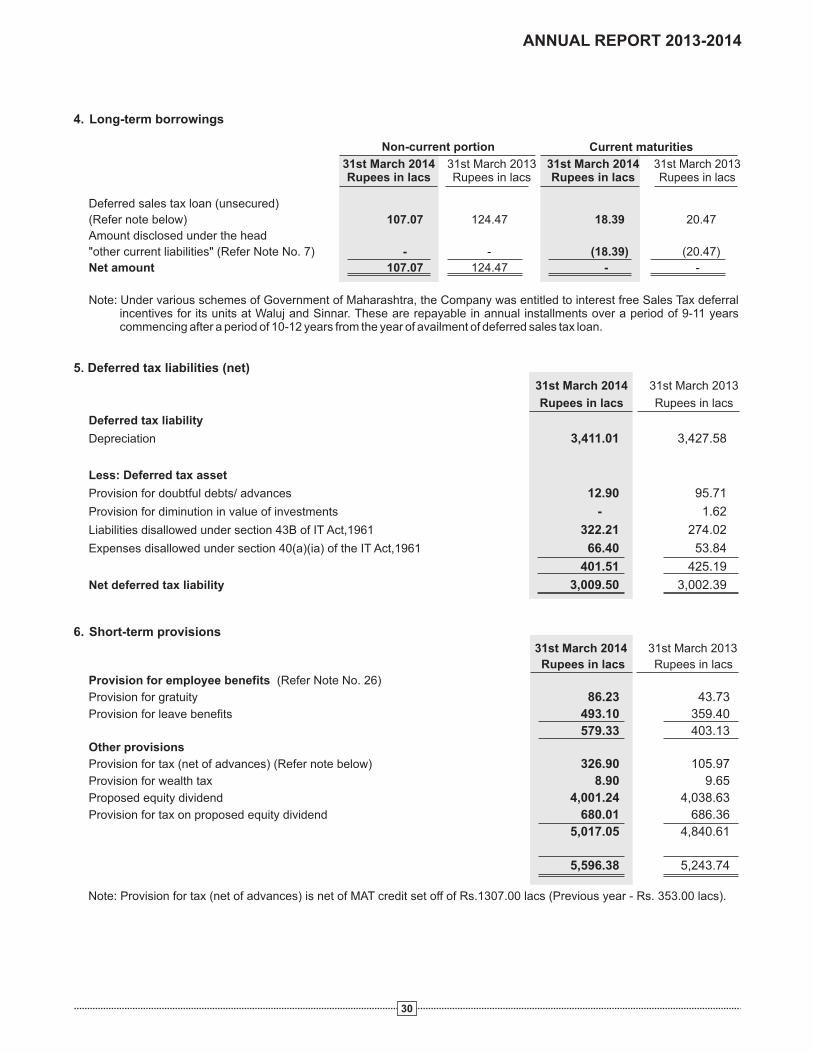
31st March 2013Rupees in lacs
Deferred sales tax loan (unsecured)
(Refer note below)
Amount disclosed under the head
"other current liabilities" (Refer Note No. 7) - -
Net amount - -
Note:
107.07 124.47 18.39 20.47
(18.39) (20.47)
107.07 124.47
Under various schemes of Government of Maharashtra, the Company was entitled to interest free Sales Tax deferral incentives for its units at Waluj and Sinnar. These are repayable in annual installments over a period of 9-11 years commencing after a period of 10-12 years from the year of availment of deferred sales tax loan.
4. Long-term borrowings
Non-current portion
31st March 2014Rupees in lacs
Current maturities
31st March 2013Rupees in lacs
31st March 2014Rupees in lacs
Note: Provision for tax (net of advances) is net of MAT credit set off of Rs.1307.00 lacs (Previous year - Rs. 353.00 lacs).
30
5. Deferred tax liabilities (net)
31st March 2014 31st March 2013
Rupees in lacs Rupees in lacs
Deferred tax liability
Depreciation
Less: Deferred tax asset
Provision for doubtful debts/ advances
Provision for diminution in value of investments
Liabilities disallowed under section 43B of IT Act,1961
Expenses disallowed under section 40(a)(ia) of the IT Act,1961
Net deferred tax liability
3,411.01 3,427.58
12.90 95.71
- 1.62
322.21 274.02
66.40 53.84
401.51 425.19
3,009.50 3,002.39
6.
31st March 2014 31st March 2013
Rupees in lacs Rupees in lacs
Provision for employee benefits
Provision for gratuity
Provision for leave benefits
Other provisions
Provision for tax (net of advances)
Provision for wealth tax
Proposed equity dividend
Provision for tax on proposed equity dividend
Short-term provisions
(Refer Note No. 26)
86.23 43.73
493.10 359.40
579.33 403.13
(Refer note below) 326.90 105.97
8.90 9.65
4,001.24 4,038.63
680.01 686.36
5,017.05 4,840.61
5,596.38 5,243.74
ANNUAL REPORT 2013-2014

a. As per the information available with the Company, there are no Micro, Small and Medium Enterprises, as defined in the
Micro, Small, Medium Enterprises Development Act 2006, to whom the Company owes dues on account of principal amount
together with interest and accordingly no additional disclosure have been made. The Micro, Small and Medium Enterprises
has been determined to the extent such parties have been identified on the basis of information available with the Company.
This has been relied upon by the Auditors.
b. There are no amounts due and outstanding to be credited to Investor Education and Protection Fund.
31
7. Trade payables and Other current liabilities
31st March 2014 31st March 2013
Rupees in lacs Rupees in lacs
Trade payables (Refer Note a below)
Other current liabilities
Current maturities of long-term borrowings (Refer Note No. 4)
Investor Education and Protection Fund (shall be credited as and
when due by the following amount)
Unpaid dividend (Refer Note b below)
Advance from customers
Sundry deposits
Employee related liabilities
Others (includes dues to directors, statutory dues, rent deposit, trade advances)
7,814.41 5,975.55
18.39 20.47
91.14 93.13
359.93 86.84
1,226.04 1,158.11
1,775.29 1,513.09
728.74 670.58
4,199.53 3,542.22
12,013.94 9,517.77
FDC LIMITED

32
8. F
ixe
d a
ss
ets
TA
NG
IBL
E A
SS
ET
S
Lease
hold
land *
Lease
hold
Im
pro
vem
ents
Fre
ehold
land *
*
Build
ings
***
Pla
nt and m
ach
inery
Labora
tory
test
ing m
ach
ines
Ele
ctrica
l inst
alla
tions
Furn
iture
, fix
ture
s and fitt
ings
Offic
e e
quip
ments
Vehic
les
R&
D a
ssets
Build
ings
Equip
ments
Furn
iture
and fix
ture
s
To
tal o
f Tan
gib
le a
ssets
(A
)
INTA
NG
IBL
E A
SS
ET
S
Mark
etin
g r
igh
ts
Softw
are
R&
D a
ssets
Tech
nic
al k
no
w h
ow
To
tal o
f In
tan
gib
le a
ssets
(B
)
Pre
vious
year
To
tal (A
+B
)
Pre
vious
year
Capita
l work
in p
rogre
ss -
Tangib
le #
Capita
l work
in p
rogre
ss -
Inta
ngib
le
497.6
5-
-497.6
5143.8
98.0
7 -
151.9
6345.6
9353.7
6
5.6
8-
-5.6
85.6
8-
-5.6
8-
-
1,4
81.6
00.2
05.1
91,4
76.6
1-
--
-1,4
76.6
11,4
81.6
0
13,7
15.0
7798.8
425.8
014,4
88.1
12,5
34.5
333
5.5
92.2
72,8
67.8
511,6
20.2
611
,180.5
4
14,7
66.3
3273.7
511
.18
15,0
28.9
0@
8,2
42.4
789
1.2
624.2
7@
9,1
09.4
65,9
19.4
46,5
23.8
6
2,7
47.8
811
1.0
50.6
02,8
58.3
31,1
53.9
2347.9
0(0
.02)
1,5
01.8
41,3
56.4
91,5
93.9
6
1,4
95.3
523.9
3-
1,5
19.2
8478.9
970.3
8-
549.3
7969.9
11,0
16.3
6
2,7
35.7
1108.1
83.1
32,8
40.7
61,0
88.0
3184.7
82.5
21,2
70.2
91,5
70.4
71,6
47.6
8
1,8
03.6
6367.1
62.2
02,1
68.6
2483.5
29
2.6
41.1
8574.9
81,5
93.6
41,3
20.1
4
465.0
959.7
743.1
8481.6
8251.1
857.5
441.5
3267.1
9214.4
9213.9
1
109.9
1-
-109.9
162.3
63.4
9-
65.8
544.0
647.5
5
3,1
34.5
4306.1
8223.4
33,2
17.2
91,3
08.2
6346.0
4201.7
31,4
52.5
71,7
64.7
21,8
26.2
8
200.5
812.2
76.6
9206.1
665.1
910.7
46.6
969.2
4136.9
2135.3
9
43,1
59.0
52,0
61.3
3321.4
044,8
98.9
815,8
18.0
22,3
48.4
3280.1
717,8
86.2
827,0
12.7
027,3
41.0
3
Pre
vious
year
40,9
04
.82
2,4
37.0
01,8
2.7
743,1
59.0
513,2
72.3
92,6
57.4
61,1
1.8
315,8
18.0
227,3
41.0
3
216.8
6-
-216.8
679.3
945.7
9-
125.1
891.6
8137.4
7
107.3
6-
-107.3
610.8
421.4
7-
32.3
175.0
596.5
2
233.3
8
-233.3
8152.9
24
6.6
8-
199.6
033.7
880.4
6
557.6
0-
-557.6
0243.1
5113.9
4 -
357.0
9200.5
1314.4
5
511
.13
46.4
7 -
557.6
0141.4
0101.7
5-
243.1
5314.4
5
43,7
16.6
52,0
61.3
3321.4
045,4
56.5
816,0
61.1
72,4
62.3
7280.1
718,2
43.3
727,2
13.2
127,6
55.4
8
41,4
15.9
52,4
83.4
7182.7
743,7
16.6
513,4
13.7
92,7
59.2
111
1.8
316,0
61.1
727,6
55.4
8
1,7
79.9
6722.4
3
30.5
2-
PA
RT
ICU
LA
RS
G
RO
SS
BL
OC
KD
EP
RE
CIA
TIO
N / A
MO
RT
ISA
TIO
N / IM
PA
IRM
EN
TN
ET
BL
OC
K
As
at31
st M
arch
201
3A
dd
itio
ns
De
letio
ns
As
at31
st M
arch
201
4A
s at
31st
Mar
ch 2
013
Fo
r th
eY
ear
De
letio
ns
As
at31
st M
arch
201
4A
s at
31st
Mar
ch 2
014
As
at31
st M
arch
201
3
Rup
ees
in la
cs
*In
cludes
lease
hold
land a
t D
elh
i whic
h is
In
th
e p
roce
ss o
f b
ein
g r
eg
iste
red
In
th
e n
am
e o
f th
e C
om
pany.
**F
reehold
land o
f R
s. 6
40.6
6 (
Pre
vious
yea
r -
Rs.
64
0.6
6 la
cs)
incl
ud
es
cost
of u
nq
uo
ted
fu
lly p
aid
sh
are
s in
various
co-o
pera
tive h
ousi
ng s
oci
etie
s.**
*B
uild
ing o
f R
s. 3
,151.0
5 la
cs (
Pre
vious
yea
r -
Rs
2,9
70
.05
lacs
) in
clu
de
s co
st o
f u
nq
uo
ted
fu
lly p
aid
sh
are
s in
various
co-o
pera
tive h
ousi
ng s
oci
etie
s.@
Incl
udes
imapirem
ent
of
Rs
49.8
0 la
cs.
#N
et of pro
visi
on f
or
impairm
ent
of
Rs.
144
.79
lacs
(Pre
vio
us
yea
r-R
s 1
44
.79
lacs
)
ANNUAL REPORT 2013-2014

34
9. Non-current investments (at cost)
33
31st March 2014 31st March 2013Rupees in lacs Rupees in lacs
Trade Investments (Unquoted)Investments in fully paid-up equity instrumentsIn Subsidiaries 374,085 (Previous year - 374,085) Equity Shares of FDC 0.00 0.00 500 (Previous year - 500) Equity Shares of FDC Inc., of USD 100 each 22.00 22.00 1,740,000 (Previous year
(A) In Joint Venture Entity159,250 (Previous year - 159,250) Equity Shares of Fair Deal Corporation PharmaceuticalSA (Pty) Ltd., of ZAR 1 each 11.30 11.30
(B) 11.30 11.30
Sub total (C) = (A+B)
Non Trade Investments (Unquoted unless otherwise stated)Investments in Government Securities (Refer note below)National Savings Certificates 0.07 0.07 35 (Previous year - 35) Govt. of India G.P. Notes - face value of Rs.2,000 0.02 0.02
(D) 0.09 0.09 Investments in fully paid-up equity instruments1,000 (Previous year - 1,000) Equity Shares of The Saraswat Co-op. Bank Ltd.of Rs.10 each 0.10 0.10
5,000 (Previous year - 5,000) Equity Shares of The North Kanara G.S.B. Co-op Bank Ltd.of Rs.10 each 0.50 0.50
100 (Previous year - 100) Shares of Roha Industries Association Sahakari Grahak Bhandar Ltd.of Rs.25 each 0.03 0.03
(E) 0.63 0.63
International, UK of GBP 0.01 each (Rs 75.24)
- 1,740,000) Equity Shares of Anand Synthochem Limited of Rs.10 each 606.16 606.16 628.16 628.16
639.46 639.46
Equity
Investments in fully paid -up preference instruments532,603 (Previous year - 304,376) Preference shares of L&T Finance Holdings Ltd. of Rs.100 each 532.60 304.38 100,000 (Previous year - Nil) Preference shares of Tata Capital Limited of Rs.1,000 each 1,000.00 -
(F) 1,532.60 304.38
Investments in mutual funds
Nil (Previous year - 3,000,000.000) units of Rs. 10 each in Birla Sunlife Fixed Term Plan Series - GR (399 Days) Regular Growth - 300.00 Nil (Previous year - 4,287,065.000) units of Rs. 10 each in Birla Sunlife Fixed Term Plan Series - HF (385 Days) Growth Direct - 428.71 Nil (Previous year - 2,000,000.000) units of Rs.10 each in Baroda Pioneer Fixed Maturity Plan - Series - C Plan A (372 Days) Growth - 200.00 Nil (Previous year - 6,000,000.000) units of Rs.10 each in BNP Paribas Fixed Term Fund - Series - 24A Growth - 600.00 Nil (Previous year - 2,692,500.000) units of Rs.10 each in DSP Black Rock Fixed Maturity Plan - Series - 89 - 12M - Growth - 269.25 Nil (Previous year - 5,509,400.000) units of Rs.10 each in DSP Black Rock Fixed Term Plan - Series - 22 - 14M - Growth - 550.94 Nil (Previous year - 4,000,000.000) units of Rs.10 each in DWS Fixed Maturity Plan - Series 26 - Regular Plan - Growth - 400.00 Nil(Previous year - 3,322,440.000 ) units of Rs.10 each in HDFC Fixed Maturity Plan 384D March 2013(1)Series 23 - Direct - Growth - 332.24 Nil (Previous year - 4,000,000.000) units of Rs.10 each in ICICI Prudential Fixed Maturity Plan Series - 66 - 420 Days Plan A Regular Plan Cumulative - 400.00 Nil (Previous year - 9,000,000.000) units of Rs.10 each in ICICI Prudential Fixed Maturity Plan Series - 66 - 412 Days Plan E Regular Plan Cumulative - 900.00 Nil (Previous year - 4,000,000.000) units of Rs.10 each in Kotak Fixed Maturity Plan Series 95 Direct Growth - 400.00 Nil (Previous year - 4,261,941.000) units of Rs.10 each in Kotak Fixed Maturity Plan Series 97 Direct Growth - 426.19 Nil (Previous year - 5,000,000.000) units of Rs.10 each in L&T Fixed Maturity Plan - VII (February 511D A ) Direct Plan Growth - 500.00 Nil (Previous year - 4,415,320.000) units of Rs.10 each in L&T Fixed Maturity Plan - VII (March 13M A) Direct Growth - 441.53 4,000,000.000 (Previous year - Nil) units of Rs.10 each in L&T Fixed Maturity Plan Series 10 - Plan R - Direct Growth 400.00 -Nil (Previous year - 2,000,000.000) units of Rs.10 each in Reliance Fixed Horizon Fund - XXII - Series 33 - Growth - 200.00 Nil (Previous year - 3,000,000.000) units of Rs.10 each in Reliance Fixed Horizon Fund XXIII Series - 5 - Direct Plan Growth - 300.00
FDC LIMITED
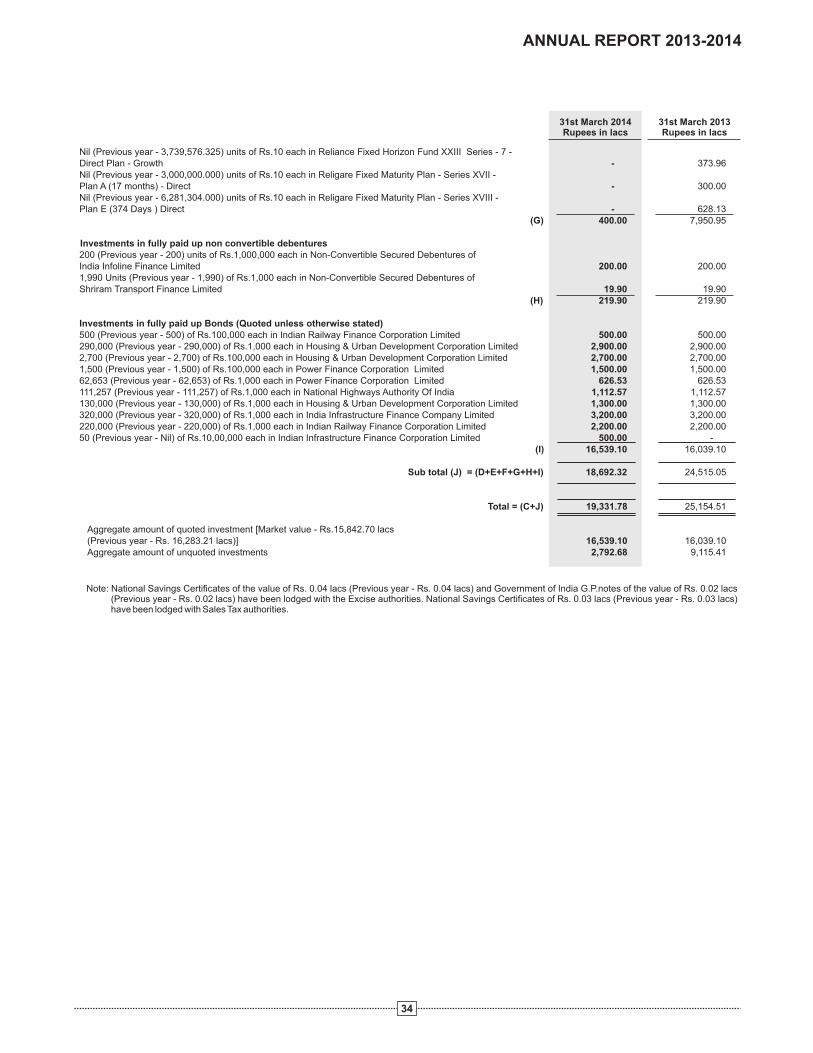
Note: National Savings Certificates of the value of Rs. 0.04 lacs (Previous year - Rs. 0.04 lacs) and Government of India G.P.notes of the value of Rs. 0.02 lacs (Previous year - Rs. 0.02 lacs) have been lodged with the Excise authorities. National Savings Certificates of Rs. 0.03 lacs (Previous year - Rs. 0.03 lacs) have been lodged with Sales Tax authorities.
34
Nil (Previous year - 3,739,576.325) units of Rs.10 each in Reliance Fixed Horizon Fund XXIII Series - 7 - Direct Plan - Growth - 373.96 Nil (Previous year - 3,000,000.000) units of Rs.10 each in Religare Fixed Maturity Plan - Series XVII - Plan A (17 months) - Direct - 300.00 Nil (Previous year - 6,281,304.000) units of Rs.10 each in Religare Fixed Maturity Plan - Series XVIII - Plan E (374 Days ) Direct - 628.13
(G) 400.00 7,950.95
Investments in fully paid up non convertible debentures200 (Previous year - 200) units of Rs.1,000,000 each in Non-Convertible Secured Debentures of India Infoline Finance Limited 200.00 200.00 1,990 Units (Previous year - 1,990) of Rs.1,000 each in Non-Convertible Secured Debentures of Shriram Transport Finance Limited 19.90 19.90
(H) 219.90 219.90
Investments in fully paid up Bonds (Quoted unless otherwise stated)500 (Previous year - 500) of Rs.100,000 each in Indian Railway Finance Corporation Limited 500.00 500.00 290,000 (Previous year - 290,000) of Rs.1,000 each in Housing & Urban Development Corporation Limited 2,900.00 2,900.00 2,700 (Previous year - 2,700) of Rs.100,000 each in Housing & Urban Development Corporation Limited 2,700.00 2,700.00 1,500 (Previous year - 1,500) of Rs.100,000 each in Power Finance Corporation Limited 1,500.00 1,500.00 62,653 (Previous year - 62,653) of Rs.1,000 each in Power Finance Corporation Limited 626.53 626.53 111,257 (Previous year - 111,257) of Rs.1,000 each in National Highways Authority Of India 1,112.57 1,112.57 130,000 (Previous year - 130,000) of Rs.1,000 each in Housing & Urban Development Corporation Limited 1,300.00 1,300.00 320,000 (Previous year - 320,000) of Rs.1,000 each in India Infrastructure Finance Company Limited 3,200.00 3,200.00 220,000 (Previous year - 220,000) of Rs.1,000 each in Indian Railway Finance Corporation Limited 2,200.00 2,200.00 50 (Previous year - Nil) of Rs.10,00,000 each in Indian Infrastructure Finance Corporation Limited 500.00 -
(I) 16,539.10 16,039.10
18,692.32 24,515.05
Total = (C+J) 19,331.78 25,154.51
Aggregate amount of quoted investment [Market value - Rs.15,842.70 lacs (Previous year - Rs. 16,283.21 lacs)] 16,539.10 16,039.10 Aggregate amount of unquoted investments 2,792.68 9,115.41
Sub total (J) = (D+E+F+G+H+I)
31st March 2014Rupees in lacs
31st March 2013Rupees in lacs
ANNUAL REPORT 2013-2014
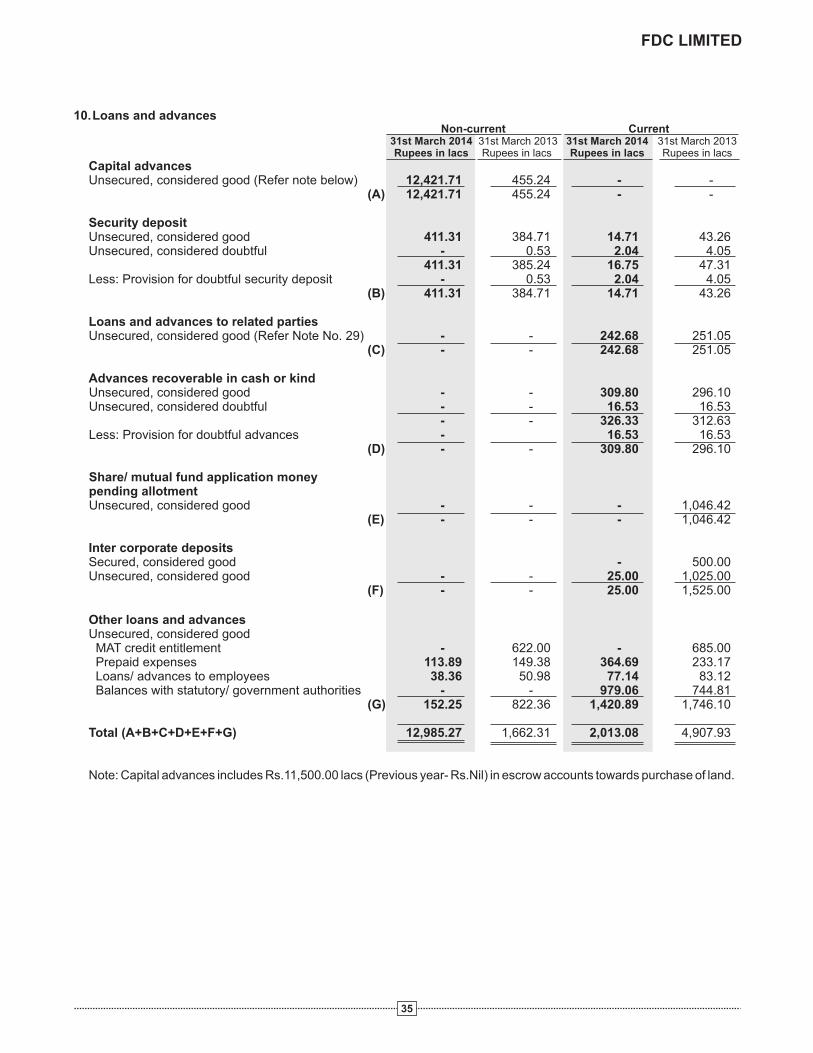
35
10.Loans and advancesNon-current Current
31st March 2014 31st March 2013 31st March 2014 31st March 2013Rupees in lacs Rupees in lacs Rupees in lacs Rupees in lacs
Capital advancesUnsecured, considered good
(A)
Security depositUnsecured, considered good Unsecured, considered doubtful
Less: Provision for doubtful security deposit
(B)
Loans and advances to related partiesUnsecured, considered good (Refer Note No. 29)
(C) - -
Advances recoverable in cash or kindUnsecured, considered good Unsecured, considered doubtful
Less: Provision for doubtful advances
(D)
Inter corporate depositsSecured, considered good Unsecured, considered good
(F)
Other loans and advancesUnsecured, considered good MAT credit entitlement Prepaid expenses Loans/ advances to employees Balances with statutory/ government authorities
(G)
Total (A+B+C+D+E+F+G)
Note:
(Refer note below) 12,421.71 455.24 - - 12,421.71 455.24 - -
411.31 384.71 14.71 43.26 - 0.53 2.04 4.05
411.31 385.24 16.75 47.31 - 0.53 2.04 4.05
411.31 384.71 14.71 43.26
- - 242.68 251.05 242.68 251.05
- - 309.80 296.10 - - 16.53 16.53 - - 326.33 312.63 - 16.53 16.53 - - 309.80 296.10
Share/ mutual fund application money pending allotmentUnsecured, considered good - - - 1,046.42
(E) - - - 1,046.42
- 500.00- - 25.00 1,025.00 - - 25.00 1,525.00
- 622.00 - 685.00 113.89 149.38 364.69 233.17 38.36 50.98 77.14 83.12
- - 979.06 744.81 152.25 822.36 1,420.89 1,746.10
12,985.27 1,662.31 2,013.08 4,907.93
Capital advances includes Rs.11,500.00 lacs (Previous year- Rs.Nil) in escrow accounts towards purchase of land.
FDC LIMITED

31st March 2014 31st March 2013
Rupees in lacs Rupees in lacs
Current Portion of Long Term Investments (at cost) (unquoted)
Investments in mutual funds
1,554,196.000 (Previous year - Nil) units of Rs. 10 each in Axis Fixed Term Plan - Series 56(370 Days) Direct Growth 155.42 -
3,000,000.000 (Previous year - Nil) units of Rs. 10 each in Birla Sunlife Fixed Term Plan Series - GR (399 Days) Regular Growth 300.00 -
4,287,065.000 (Previous year - Nil) units of Rs. 10 each in Birla Sunlife Fixed Term Plan Series - HF (385 Days) Growth Direct 428.71 -
4,500,000.000 (Previous year - Nil) units of Rs. 10 each in Birla Sunlife Fixed Term Plan Series - HL (366 Days) Growth Direct 450.00 -
2,000,000.000 (Previous year - Nil) units of Rs. 10 each in Birla Sunlife Fixed Term Plan Series - KF (368 Days) Growth Direct 200.00 -
2,000,000.000 (Previous year - Nil) units of Rs.10 each in Baroda Pioneer Fixed Maturity Plan - Series C Plan A (372 Days) Growth 200.00 -
2,000,000.000 (Previous year - Nil) units of Rs.10 each in Baroda Pioneer Fixed Maturity Plan - Series E Plan B (369 Days) Direct Growth 200.00 -
2,500,000.000 (Previous year - Nil) units of Rs.10 each in Baroda Pioneer Fixed Maturity Plan - Series J Plan B (366 Days) Direct Growth 250.00 -
1,000,000.000 (Previous year - Nil) units of Rs.10 each in Baroda Pioneer Fixed Maturity Plan - Series K Plan B (370 Days) Growth 100.00 -
1,040,595.826 (Previous year - Nil) units of Rs.10 each in Baroda Pioneer Fixed Maturity Plan - Series L Plan B (368 Days) Growth 104.06 -
6,000,000.000 (Previous year - Nil) units of Rs.10 each in BNP Paribas Fixed Term Fund - Series 24A Growth 600.00 -
5,000,000.000 (Previous year - Nil) units of Rs.10 each in BNP Paribas Fixed Term Fund - Series 29 B Direct Growth 500.00 -
Nil (Previous year - 3,000,000.000) units of Rs.10 each in BNP Paribas Fixed Term Fund - Series 23 E Growth - 300.00
Nil (Previous year - 2,000,000.000) units of Rs.10 each in DSP Black Rock Fixed Maturity Plan - Series - 81 - 12M - Growth - 200.00
5,509,400.000 (Previous year - Nil) units of Rs.10 each in DSP Black Rock Fixed Maturity Plan - Series - 22 - 14M - Direct Growth 550.94 -
2,692,500.000 (Previous year - Nil) units of Rs.10 each in DSP Black Rock Fixed Maturity Plan - Series - 89 - 12M - Growth 269.25 -
3,000,000.000 (Previous year - Nil) units of Rs.10 each in DSP Black Rock Fixed Maturity Plan - Series - 104 - 12M - Direct Growth 300.00 -
4,000,000.000 (Previous year - Nil) units of Rs.10 each in DWS Fixed Maturity Plan - Series 26 - Regular Plan - Growth 400.00 -
3,322,440.000 (Previous year - Nil) units of Rs.10 each in HDFC Fixed Maturity Plan 384D March 2013(1) Series 23 - Direct - Growth 332.24 -
Nil (Previous year - 2,500,000.000) units of Rs.10 each in HDFC Fixed Maturity Plan 370D May 2012(2) - Growth - Series 22 - 250.00
Nil (Previous year - 2,000,000.000) units of Rs.10 each in HDFC Fixed Maturity Plan 370D December 2012(1) - Growth - Series 23 - 200.00
4,000,000.000 (Previous year - Nil) units of Rs.10 each in ICICI Prudential Fixed Maturity Plan Series 66 - 420 Days Plan A Regular Plan Cumulative 400.00 -
9,000,000.000 (Previous year - Nil) units of Rs.10 each in ICICI Prudential Fixed Maturity Plan Series 66 - 412 Days Plan E Regular Plan Cumulative 900.00 -
1,500,000.000 (Previous year - Nil) units of Rs.10 each in ICICI Prudential Fixed Maturity Plan Series 73 - 366 Days Plan B Direct Growth 150.00 -
2,000,000.000 (Previous year - Nil) units of Rs.10 each in IDBI Fixed Maturity Plan Series - III - 366 Days (July 2013) A Growth Direct 200.00
Nil (Previous year - 3,302,490.000) units of Rs.10 each in IDBI Fixed Maturity Plan - 367 Days Series - III (February 2013) A Growth Direct - 330.25
Nil (Previous year - 2,500.000.000) units of Rs.10 each in IDBI Fixed Maturity Plan - 366 Days Series - II (May 2012) I Growth - 250.00
Nil (Previous year - 2,500,000.000) units of 10 each in IDFC Fixed Maturity Plan 366 Days Series - 73 - Growth - 250.00
1,500,000.000 (Previous year - Nil) units of 10 each in J P Morgan India Fixed Maturity Plan Series 32 - Direct - Growth 150.00 -
4,000,000.000 (Previous year - Nil) units of Rs.10 each in Kotak Fixed Maturity Plan Series 95 Direct Growth 400.00 -
4,261,941.000 (Previous year - Nil) units of Rs.10 each in Kotak Fixed Maturity Plan Series 97 Direct Growth 426.19 -
4,000,000.000 (Previous year - Nil) units of Rs.10 each in Kotak Fixed Maturity Plan Series 139 Direct Growth 400.00
Nil (Previous year - 1,999,990.000) units of Rs.10 each in Kotak Fixed Maturity Plan Series 80 - Growth - 200.00
5,000,000.000 (Previous year - Nil) units of Rs.10 each in L&T Fixed Maturity Plan - VII (February 511D A ) Direct Plan Growth 500.00 -
4,415,320.000 (Previous year - Nil) units of Rs.10 each in L&T Fixed Maturity Plan - VII (March 13M A) Direct Growth 441.53 -
4,000,000.000 (Previous year - Nil) units of Rs.10 each in L&T Fixed Maturity Plan - Series 8 Plan G - Direct Growth 400.00 -
2,000,000.000 (Previous year - Nil) units of Rs.10 each in Reliance Fixed Horizon Fund - XXII - Series 33 - Growth 200.00 -
3,000,000.000 (Previous year - Nil) units of Rs.10 each in Reliance Fixed Horizon Fund XXIII Series - 5 - Direct Plan Growth 300.00 -
3,739,576.330 (Previous year - Nil) units of Rs.10 each in Reliance Fixed Horizon Fund XXIII Series - 7 - Direct Plan - Growth 373.96 -
Nil (Previous year - 2,000,000.000) units of Rs.10 each in Reliance Fixed Horizon Fund - XXII - Series 9 - Growth - 200.00
Nil (Previous year - 3,000,000.000) units of Rs.10 each in Reliance Fixed Horizon Fund - XXII - Series 31 - Growth - 300.00
Nil (Previous year - 5,499,600.000) units of Rs.10 each in Reliance Yearly Interval Fund Series 2 - Growth Plan (Y2-GP) - 549.96
3,000,000.000 (Previous year - Nil) units of Rs.10 each in Religare Fixed Maturity Plan - Series XVII - Plan A (17 months) - Direct 300.00 -
6,281,304.000 (Previous year - Nil) units of Rs.10 each in Religare Fixed Maturity Plan - Series XVIII - Plan E (374 Days ) Direct 628.13 -
3,000,000.000 (Previous year - Nil) units of Rs.10 each in Religare Fixed Maturity Plan - Series XX - Plan C (369 Days ) Direct 300.00 -
2,500,000.000 (Previous year - Nil) units of Rs.10 each in Religare Fixed Maturity Plan - Series 23 - Plan D (370 Days ) Direct Plan Growth 250.00 -
2,500,000.000 (Previous year - Nil) units of Rs.10 each in Religare Fixed Maturity Plan - Series 22 - Plan K (367 Days ) Direct Plan Growth 250.00 -
(A) 12,310.43 3,030.21
Other Current investments (valued at lower of cost and fair value)
Investments in mutual funds (unquoted)
Nil (Previous year - 1,620,128.476) units of Rs.10 each in Axis Short Term Fund Institutional Growth (STGP) - 200.00
21,606.390 (Previous year - Nil) units of Rs.1000 each in Axis Banking Debt Fund - Direct Plan - Growth 250.00 -
2,000,000.000 (Previous year - Nil) units of Rs. 10 each in Axis Fixed Term Plan - Series 63(91 Days) Direct Growth 200.00 -
Nil (Previous year - 2,448,473.241) units of Rs.10 each in Birla Sunlife Dynamic Bond Fund Growth Regular - 450.00
Nil (Previous year - 491,971.033) units of Rs.10 each in Birla Sunlife Short Term Fund - Growth Regular - 199.00
5,21,840.776 (Previous year - Nil) units of Rs.100 each in Birla Sunlife Treasury Optimizer Plan Growth Direct Plan 750.00 -
2,35,139.202 (Previous year - Nil) units of Rs.100 each in Birla Sunlife Floating Rate Fund Short Term Plan Growth Direct Plan 400.00 -
Nil (Previous year - 24,721.647) units of Rs.1000 each in Baroda Pioneer Treasury Advantage Fund Plan A - Growth - 308.36
Nil (Previous year - 1,585,929.632) units of Rs.10 each in BNP Paribas Short Term Income Fund Growth - 198.30
Nil (Previous year - 1,603,969.289) units of Rs.10 each in BNP Paribas Flexi Debt Fund Growth - 300.00
11.Current investments
36
ANNUAL REPORT 2013-2014
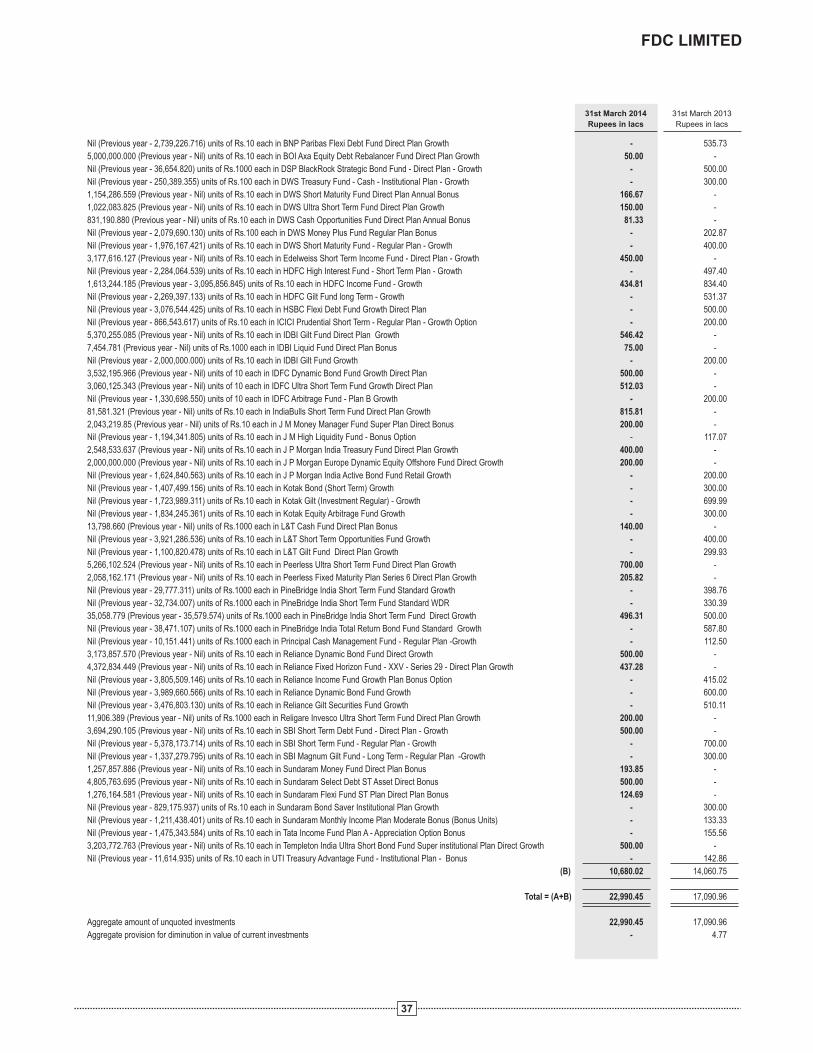
31st March 2014 31st March 2013
Rupees in lacs Rupees in lacs
37
Nil (Previous year - 2,739,226.716) units of Rs.10 each in BNP Paribas Flexi Debt Fund Direct Plan Growth - 535.73
5,000,000.000 (Previous year - Nil) units of Rs.10 each in BOI Axa Equity Debt Rebalancer Fund Direct Plan Growth 50.00 -
Nil (Previous year - 36,654.820) units of Rs.1000 each in DSP BlackRock Strategic Bond Fund - Direct Plan - Growth - 500.00
Nil (Previous year - 250,389.355) units of Rs.100 each in DWS Treasury Fund - Cash - Institutional Plan - Growth - 300.00
1,154,286.559 (Previous year - Nil) units of Rs.10 each in DWS Short Maturity Fund Direct Plan Annual Bonus 166.67 -
1,022,083.825 (Previous year - Nil) units of Rs.10 each in DWS Ultra Short Term Fund Direct Plan Growth 150.00 -
831,190.880 (Previous year - Nil) units of Rs.10 each in DWS Cash Opportunities Fund Direct Plan Annual Bonus 81.33 -
Nil (Previous year - 2,079,690.130) units of Rs.100 each in DWS Money Plus Fund Regular Plan Bonus - 202.87
Nil (Previous year - 1,976,167.421) units of Rs.10 each in DWS Short Maturity Fund - Regular Plan - Growth - 400.00
3,177,616.127 (Previous year - Nil) units of Rs.10 each in Edelweiss Short Term Income Fund - Direct Plan - Growth 450.00 -
Nil (Previous year - 2,284,064.539) units of Rs.10 each in HDFC High Interest Fund - Short Term Plan - Growth - 497.40
1,613,244.185 (Previous year - 3,095,856.845) units of Rs.10 each in HDFC Income Fund - Growth 434.81 834.40
Nil (Previous year - 2,269,397.133) units of Rs.10 each in HDFC Gilt Fund long Term - Growth - 531.37
Nil (Previous year - 3,076,544.425) units of Rs.10 each in HSBC Flexi Debt Fund Growth Direct Plan - 500.00
Nil (Previous year - 866,543.617) units of Rs.10 each in ICICI Prudential Short Term - Regular Plan - Growth Option - 200.00
5,370,255.085 (Previous year - Nil) units of Rs.10 each in IDBI Gilt Fund Direct Plan Growth 546.42 -
7,454.781 (Previous year - Nil) units of Rs.1000 each in IDBI Liquid Fund Direct Plan Bonus 75.00 -
Nil (Previous year - 2,000,000.000) units of Rs.10 each in IDBI Gilt Fund Growth - 200.00
3,532,195.966 (Previous year - Nil) units of 10 each in IDFC Dynamic Bond Fund Growth Direct Plan 500.00 -
3,060,125.343 (Previous year - Nil) units of 10 each in IDFC Ultra Short Term Fund Growth Direct Plan 512.03 -
Nil (Previous year - 1,330,698.550) units of 10 each in IDFC Arbitrage Fund - Plan B Growth - 200.00
81,581.321 (Previous year - Nil) units of Rs.10 each in IndiaBulls Short Term Fund Direct Plan Growth 815.81 -
2,043,219.85 (Previous year - Nil) units of Rs.10 each in J M Money Manager Fund Super Plan Direct Bonus 200.00 -
Nil (Previous year - 1,194,341.805) units of Rs.10 each in J M High Liquidity Fund - Bonus Option - 117.07
2,548,533.637 (Previous year - Nil) units of Rs.10 each in J P Morgan India Treasury Fund Direct Plan Growth 400.00 -
2,000,000.000 (Previous year - Nil) units of Rs.10 each in J P Morgan Europe Dynamic Equity Offshore Fund Direct Growth 200.00 -
Nil (Previous year - 1,624,840.563) units of Rs.10 each in J P Morgan India Active Bond Fund Retail Growth - 200.00
Nil (Previous year - 1,407,499.156) units of Rs.10 each in Kotak Bond (Short Term) Growth - 300.00
Nil (Previous year - 1,723,989.311) units of Rs.10 each in Kotak Gilt (Investment Regular) - Growth - 699.99
Nil (Previous year - 1,834,245.361) units of Rs.10 each in Kotak Equity Arbitrage Fund Growth - 300.00
13,798.660 (Previous year - Nil) units of Rs.1000 each in L&T Cash Fund Direct Plan Bonus 140.00 -
Nil (Previous year - 3,921,286.536) units of Rs.10 each in L&T Short Term Opportunities Fund Growth - 400.00
Nil (Previous year - 1,100,820.478) units of Rs.10 each in L&T Gilt Fund Direct Plan Growth - 299.93
5,266,102.524 (Previous year - Nil) units of Rs.10 each in Peerless Ultra Short Term Fund Direct Plan Growth 700.00 -
2,058,162.171 (Previous year - Nil) units of Rs.10 each in Peerless Fixed Maturity Plan Series 6 Direct Plan Growth 205.82 -
Nil (Previous year - 29,777.311) units of Rs.1000 each in PineBridge India Short Term Fund Standard Growth - 398.76
Nil (Previous year - 32,734.007) units of Rs.1000 each in PineBridge India Short Term Fund Standard WDR - 330.39
35,058.779 (Previous year - 35,579.574) units of Rs.1000 each in PineBridge India Short Term Fund Direct Growth 496.31 500.00
Nil (Previous year - 38,471.107) units of Rs.1000 each in PineBridge India Total Return Bond Fund Standard Growth - 587.80
Nil (Previous year - 10,151.441) units of Rs.1000 each in Principal Cash Management Fund - Regular Plan -Growth - 112.50
3,173,857.570 (Previous year - Nil) units of Rs.10 each in Reliance Dynamic Bond Fund Direct Growth 500.00 -
4,372,834.449 (Previous year - Nil) units of Rs.10 each in Reliance Fixed Horizon Fund - XXV - Series 29 - Direct Plan Growth 437.28 -
Nil (Previous year - 3,805,509.146) units of Rs.10 each in Reliance Income Fund Growth Plan Bonus Option - 415.02
Nil (Previous year - 3,989,660.566) units of Rs.10 each in Reliance Dynamic Bond Fund Growth - 600.00
Nil (Previous year - 3,476,803.130) units of Rs.10 each in Reliance Gilt Securities Fund Growth - 510.11
11,906.389 (Previous year - Nil) units of Rs.1000 each in Religare Invesco Ultra Short Term Fund Direct Plan Growth 200.00 -
3,694,290.105 (Previous year - Nil) units of Rs.10 each in SBI Short Term Debt Fund - Direct Plan - Growth 500.00 -
Nil (Previous year - 5,378,173.714) units of Rs.10 each in SBI Short Term Fund - Regular Plan - Growth - 700.00
Nil (Previous year - 1,337,279.795) units of Rs.10 each in SBI Magnum Gilt Fund - Long Term - Regular Plan -Growth - 300.00
1,257,857.886 (Previous year - Nil) units of Rs.10 each in Sundaram Money Fund Direct Plan Bonus 193.85 -
4,805,763.695 (Previous year - Nil) units of Rs.10 each in Sundaram Select Debt ST Asset Direct Bonus 500.00 -
1,276,164.581 (Previous year - Nil) units of Rs.10 each in Sundaram Flexi Fund ST Plan Direct Plan Bonus 124.69 -
Nil (Previous year - 829,175.937) units of Rs.10 each in Sundaram Bond Saver Institutional Plan Growth - 300.00
Nil (Previous year - 1,211,438.401) units of Rs.10 each in Sundaram Monthly Income Plan Moderate Bonus (Bonus Units) - 133.33
Nil (Previous year - 1,475,343.584) units of Rs.10 each in Tata Income Fund Plan A - Appreciation Option Bonus - 155.56
3,203,772.763 (Previous year - Nil) units of Rs.10 each in Templeton India Ultra Short Bond Fund Super institutional Plan Direct Growth 500.00 -
Nil (Previous year - 11,614.935) units of Rs.10 each in UTI Treasury Advantage Fund - Institutional Plan - Bonus - 142.86
(B) 10,680.02 14,060.75
Total = (A+B) 22,990.45 17,090.96
Aggregate amount of unquoted investments 22,990.45 17,090.96
Aggregate provision for diminution in value of current investments - 4.77
FDC LIMITED

12. Inventories (valued at lower of cost and net realisable value)
31st March 2014 31st March 2013Rupees in lacs Rupees in lacs
Raw materials [Including stock in transit
Packing materials [Including stock in transit
Work-in-progress
Finished goods/ stock-in-trade
Details of Work-in-progress
Formulations
Bulk drugs
Foods
Rs.59.55 lacs
(Previous year - Rs.79.88 lacs)] 2,204.16 2,211.42
Rs.100.35 lacs
(Previous year - Rs. 56.52 lacs)] 554.52 545.65
1,243.04 1,234.86
6,057.49 5,752.62
10,059.21 9,744.55
867.97 750.63
330.95 458.89
44.12 25.34
1,243.04 1,234.86
13. Trade receivables31st March 2014 31st March 2013Rupees in lacs Rupees in lacs
Unsecured, considered good unless stated otherwiseOutstanding for a period exceeding six months from the date they are due for payment Unsecured, considered good Doubtful
Less: Provision for doubtful receivables
(A) Other receivables Unsecured, considered good
(B)
Total (A + B)
5.56 22.79 17.38 259.60 22.94 282.39 17.38 259.60
5.56 22.79
5,856.89 4,453.70 5,856.89 4,453.70
5,862.45 4,476.49
38
14. Cash and bank balances
Non-current Current31st March 2014 31st March 2013 31st March 2014 31st March 2013
Rupees in lacs Rupees in lacs Rupees in lacs Rupees in lacs
Cash and cash equivalents
Balances with banks:
On current accounts
On unpaid dividend account
Cash on hand
Other bank balances:
Bank deposits with original maturity for more
than 12 months
Margin money deposits
Amount disclosed under “Other non-current assets”
(Refer Note No. 15)
- - 1,228.45 192.07
- - 91.14 93.13
- - 13.18 15.66
- - 1,332.77 300.86
- 0.24 - -
Bank Deposits with original maturity for less
than 12 months - - 657.41 3,145.53
18.89 0.98 11.35 43.88
18.89 1.22 668.76 3,189.41
(18.89) (1.22) - -
- - 2,001.53 3,490.27
ANNUAL REPORT 2013-2014

17. Other income2013-2014 2012-2013
Rupees in lacs Rupees in lacsInterest income on Long-term investments Others Dividend Income on
Current investments Long-term investments
Net gain on sale of investments Current investments Long-term investments
Premium on non convertible debentures Long-term investments Net exchange gain on foreign currency transactions Provision for diminution in value of current investments sold, written back Other non operating income
1,281.82 868.09 (Refer note below) 244.19 461.95
1.67 35.80 [Includes Rs. Nil (Previous year - Rs. 192.39 lacs)
from subsidiaries] 47.62 192.49
1,571.16 1,553.56 286.55 980.68
- 45.44 178.05 111.51
4.77 313.33 200.54 193.23
[(Net of expenses directly attributable to such income Rs. 71.94 lacs(Previous year - Rs.Nil)]
3,816.37 4,756.08
Note:Interest on others includes interest on inter corporate deposits, fixed deposits, interest on delayed payments from debtors etc.
39
15. Other assets
Non-current Current
31st March 2014 31st March 2013 31st March 2014 31st March 2013
Rupees in lacs Rupees in lacs Rupees in lacs Rupees in lacs
Unsecured, considered good
Bank deposits with original maturity for more
than 12 months (Refer Note No. 14)
Margin money deposits (Refer Note No. 14)
Interest/ premium accrued on investments -
Interest accrued on o - -
Unamortised premium on investments
- 0.24 - -
18.89 0.98 - -
Receivable towards mutual funds redemptions - - - 524.76
- 389.77 312.67
thers 48.90 59.69
46.85 50.43 4.30 5.23
65.74 51.65 442.97 902.35
16. Revenue from operations
2013-2014 2012-2013Rupees in lacs Rupees in lacs
Sale of products (Refer Note a below)
Other operating revenue (Refer Note b below)
Revenue from operations (gross)
Less: Excise duty
Revenue from operations (net)
a. Details of products sold
Formulations
Bulk drugs
Foods
84,759.32 77,653.79
616.57 373.83
85,375.89 78,027.62
1,674.05 1,568.11
83,701.84 76,459.51
75,197.67 69,156.24
5,203.06 4,692.11
4,358.59 3,805.44
84,759.32 77,653.79
b. Details of other operating revenue
Export Incentives 330.02 279.41
Other miscellaneous receipts 286.55 94.42 616.57 373.83
FDC LIMITED

18. Cost of materials consumed
2013-2014 2012-2013
Rupees in lacs Rupees in lacs
Inventory at the beginning of the year
Add: Purchases
Less: Inventory at the end of the year
Cost of materials consumed 24,024.60
Details of materials consumed
2013-2014 2012-2013
Rupees in lacs Rupees in lacs
Active Pharma Ingredients
Packing materials
2,757.07 2,368.45
24,026.21 21,389.12
26,783.28 23,757.57
2,758.68 2,757.07
21,000.50
18,145.86 15,820.94
5,878.74 5,179.56
24,024.60 21,000.50
19. Purchases of stock-in-trade
2013-2014 2012-2013
Rupees in lacs Rupees in lacs
Formulations
Bulk drugs
Foods
8,060.82 8,383.77
25.82 12.88
214.38 255.74
8,301.02 8,652.39
20. Changes in inventories Increase
Rupees in lacs Rupees in lacs Rupees in lacsInventory at the end of the year Finished goods/ stock-in-trade Work-in-progress
Inventory at the beginning of the year Finished goods/ stock-in-trade Work-in-progress
21. Employee benefits expense 2013-2014 2012-2013Rupees in lacs Rupees in lacs
Salaries, wages and bonusContribution to provident and other funds (Refer Note No. 26)Staff welfare expenses
2013-2014 2012-2013
6,057.49 5,752.62 (304.87)1,243.04 1,234.86 (8.18)7,300.53 6,987.48 (313.05)
5,752.62 6,494.29 1,234.86 1,239.79 6,987.48 7,734.08 (313.05) 746.60
10,703.08 9,343.78 949.65 920.93 421.02 378.16
12,073.75 10,642.87
22. Finance costs
2013-2014 2012-2013
Rupees in lacs Rupees in lacs
Interest (Refer note below)
Bank charges
255.10 104.01
46.28 47.04
301.38 151.05
Note: Interest expenses do not include any interest paid towards fixed loans.
40
ANNUAL REPORT 2013-2014

24. Earnings per share (EPS)
2013-2014 2012-2013
Profit after tax for the year (Rupees in lacs)
Weighted average number of shares *
Nominal value per share (Rupees)
Earnings per share - Basic (Rupees)
- Diluted (Rupees)
* Weighted average number of shares has been adjusted for the buy back of shares during the year.
13,442.03 15,833.17
178,296,713 182,408,576
1.00 1.00
7.54 8.68
7.54 8.68
41
23. Other expenses
2013-2014 2012-2013
Rupees in lacs Rupees in lacs
Processing charges 857.16 751.81
Power, fuel and water charges 1,842.44 1,683.26
Repairs and maintenance:
Building 484.47 357.83
Plant and machinery 533.01 442.04
Other assets 516.99 348.45
Stores and spares 587.33 384.15
Rent (Refer Note No. 30) 39.94 44.91
Rates and taxes 133.70 184.33
Insurance 135.79 126.02
Travelling and conveyance 3,102.32 2,885.63
Communication expenses 111.00 134.05
Carriage, freight and forwarding 1,974.34 1,612.05
Advertisement and sales promotion 255.70 245.00
Publicity expenses 2,403.93 2,805.61
Increase/ (Decrease) in excise duty on finished products (19.68) 55.81
Sales tax/ Value added tax 79.98 81.47
Commission and Incentives to distributors 1,129.36 870.86
Auditors' remuneration (Including service tax):
As Audit fee 23.27 21.19
For other services 12.62 6.01
Directors sitting fees 7.00 5.67
Bad debts written off 264.19 3.56
Less: Transfer from provision for doubtful debts & advances (264.19) - (3.56)
Provision for doubtful debts 17.38 -
Provision for doubtful advances 2.05 -
Provision for diminution in value of current investments - 4.77
Amortisation of premium on Non Convertible Debentures 5.26 14.43
Donation 34.32 34.65
Miscellaneous expenses 4,707.34 4,065.37
18,977.02 17,165.37
FDC LIMITED
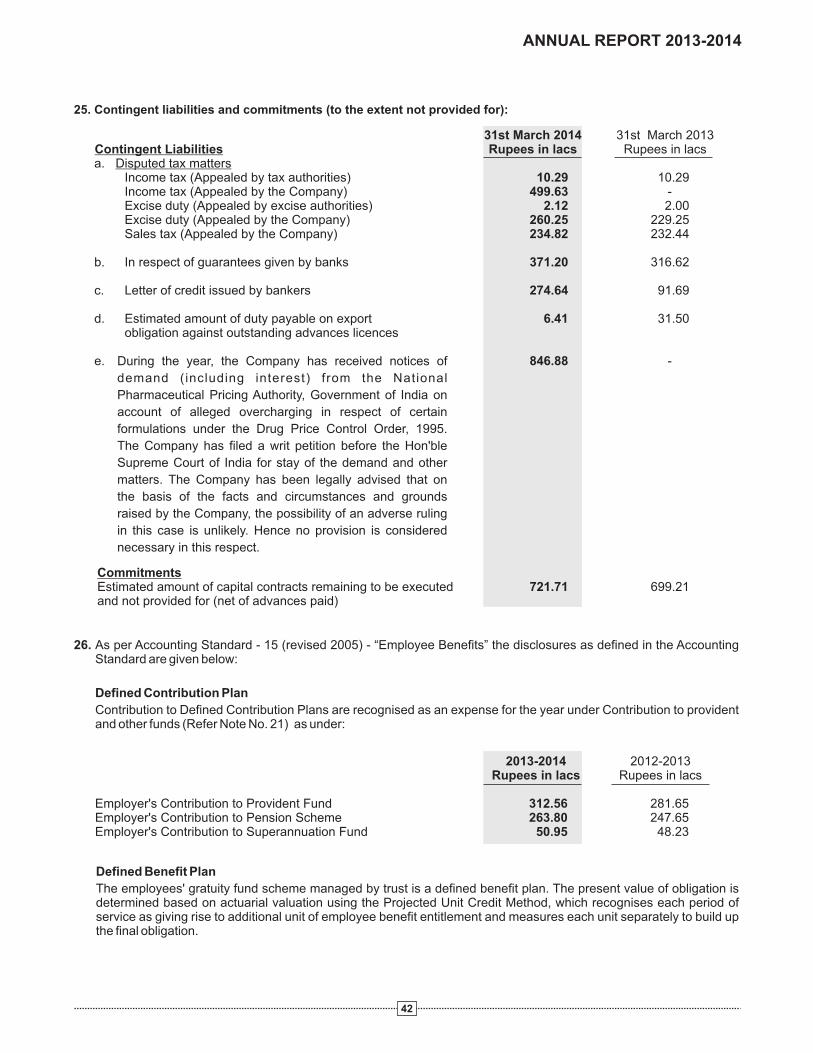
25. Contingent liabilities and commitments (to the extent not provided for):
26. As per Accounting Standard - 15 (revised 2005) - “Employee Benefits” the disclosures as defined in the Accounting Standard are given below:
Defined Contribution Plan
Contribution to Defined Contribution Plans are recognised as an expense for the year under Contribution to provident and other funds (Refer Note No. 21) as under:
2013-2014 2012-2013Rupees in lacs Rupees in lacs
Employer's Contribution to Provident FundEmployer's Contribution to Pension Scheme Employer's Contribution to Superannuation Fund
312.56 281.65263.80 247.65
50.95 48.23
Defined Benefit Plan
The employees' gratuity fund scheme managed by trust is a defined benefit plan. The present value of obligation is determined based on actuarial valuation using the Projected Unit Credit Method, which recognises each period of service as giving rise to additional unit of employee benefit entitlement and measures each unit separately to build up the final obligation.
42
31st March 2014 31st March 2013Contingent Liabilities Rupees in lacs Rupees in lacsa. Disputed tax matters
Income tax (Appealed by tax authorities) 10.29 10.29 Income tax (Appealed by the Company) 499.63 - Excise duty (Appealed by excise authorities) 2.12 2.00 Excise duty (Appealed by the Company) 260.25 229.25 Sales tax (Appealed by the Company) 234.82 232.44
b. In respect of guarantees given by banks 371.20 316.62
c. Letter of credit issued by bankers 274.64 91.69
d. Estimated amount of duty payable on export 6.41 31.50 obligation against outstanding advances licences
e. 846.88 -
Commitments Estimated amount of capital contracts remaining to be executed 721.71 699.21 and not provided for (net of advances paid)
During the year, the Company has received notices of
demand (including interest) from the National
Pharmaceutical Pricing Authority, Government of India on
account of alleged overcharging in respect of certain
formulations under the Drug Price Control Order, 1995.
The Company has filed a writ petition before the Hon'ble
Supreme Court of India for stay of the demand and other
matters. The Company has been legally advised that on
the basis of the facts and circumstances and grounds
raised by the Company, the possibility of an adverse ruling
in this case is unlikely. Hence no provision is considered
necessary in this respect.
ANNUAL REPORT 2013-2014
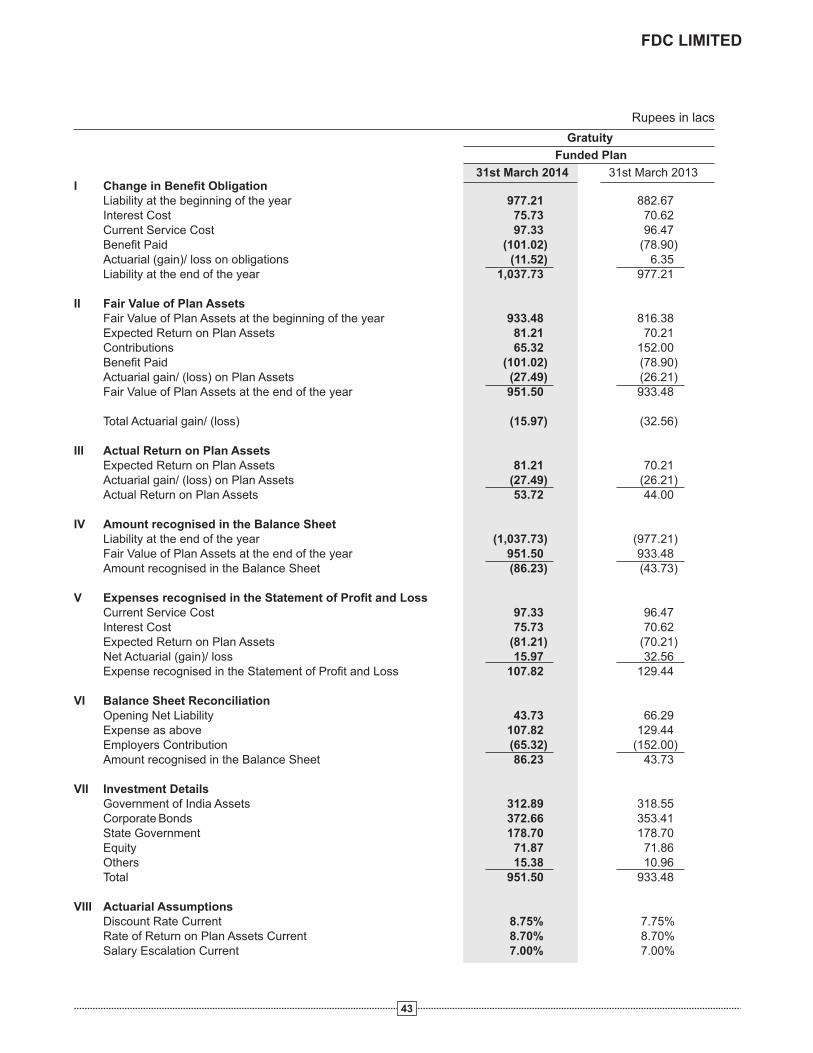
Gratuity
Funded Plan
31st March 2014 31st March 2013I Change in Benefit Obligation Liability at the beginning of the year Interest Cost Current Service Cost
Benefit Paid Actuarial (gain)/ loss on obligations Liability at the end of the year II Fair Value of Plan Assets Fair Value of Plan Assets at the beginning of the year Expected Return on Plan Assets Contributions Benefit Paid Actuarial gain/ (loss) on Plan Assets Fair Value of Plan Assets at the end of the year Total Actuarial gain/ (loss)
III Actual Return on Plan Assets Expected Return on Plan Assets Actuarial gain/ (loss) on Plan Assets Actual Return on Plan Assets IV Amount recognised in the Balance Sheet Liability at the end of the year Fair Value of Plan Assets at the end of the year Amount recognised in the Balance Sheet
V Expenses recognised in the Statement of Profit and LossCurrent Service Cost
Interest Cost Expected Return on Plan Assets Net Actuarial (gain)/ loss Expense recognised in the Statement of Profit and Loss
VI Balance Sheet Reconciliation Opening Net Liability Expense as above Employers Contribution Amount recognised in the Balance Sheet
VII Investment DetailsGovernment of India AssetsCorporate BondsState GovernmentEquity Others
Total
VIII Actuarial AssumptionsDiscount Rate CurrentRate of Return on Plan Assets Current
Salary Escalation Current
977.21 882.67 75.73 70.62 97.33 96.47
(101.02) (78.90) (11.52) 6.35
1,037.73 977.21
933.48 816.38 81.21 70.21 65.32 152.00
(101.02) (78.90)(27.49) (26.21)951.50 933.48
(15.97) (32.56)
81.21 70.21 (27.49) (26.21) 53.72 44.00
(1,037.73) (977.21) 951.50 933.48 (86.23) (43.73)
97.33 96.47 75.73 70.62
(81.21) (70.21)15.97 32.56
107.82 129.44
43.73 66.29 107.82 129.44 (65.32) (152.00) 86.23 43.73
312.89 318.55 372.66 353.41 178.70 178.70 71.87 71.86 15.38 10.96
951.50 933.48
8.75% 7.75%8.70% 8.70%7.00% 7.00%
Rupees in lacs
43
FDC LIMITED

IX. Experience Adjustments
31st March 31st March 31st March 31st March 31st March
2014 2013 2012 2011 2010
Defined benefit obligation
Plan assets
Deficit / (Surplus)
Net Actuarial (Gain)/ Loss due to
Experience adjustments on Plan Liabilities
Net Actuarial Gain/ (Loss) due to
Experience adjustments on Assets
1,037.73 977.21 882.67 730.88 607.25
951.50 933.48 816.38 703.06 396.41
86.23 43.73 66.29 27.82 210.84
24.06 (17.94) (103.18) 8.41 (63.99)
Plan (27.49) (26.21) (2.63) (9.28) (19.79)
X. Salary Escalation Rate
The estimates of future salary increases considered in actuarial valuation is taken on account of inflation, seniority, promotion and other relevant factors, such as supply and demand in the employment market.
XI. Basis used to determine Expected Rate of Return on Plan Assets
The expected rate of return on Plan Assets is based on expectation of the average long term rate of return expected on investments of the fund during the estimated term of the obligations.
XII. The Company expects to contribute Rs. 191.12 lacs to gratuity in next year (Previous year - Rs. 141.05 lacs).
The liability for Leave Encashment as at the year end is Rs. 433.13 lacs (Previous year - Rs. 322.17 lacs) and provision for sick leave as at the year end is Rs. 59.97 lacs (Previous year - Rs. 37.23 lacs).
The information related to secondary segment is as under:
Previous year's figures are shown in brackets.
27. Segment Information:
Primary segment information
The Company is engaged in pharmaceutical business which as per Accounting Standard 17 - "Segment Reporting" is considered the only business segment.
Secondary segment information
The Company's operating divisions are managed from India. The principal geographical areas in which the Company operates are India and others. The country-wise segmentation is not relevant as exports to individual countries are not more than 10% of enterprise revenue.
Rupees in lacs
Particulars India Others Total
Segment Revenue (Net)
Carrying amount of assets by location of assets
Additions to tangible and intangible assets
71,795.30 11,906.54 83,701.84 (66,620.24) (9,839.27) (76,459.51)
58,150.19 2,797.70 60,947.89*(43,514.02) (1,778.53) (45,292.55)
3,149.38 - 3,149.38
(2,489.05) (-) (2,489.05)
44
Rupees in lacs
ANNUAL REPORT 2013-2014
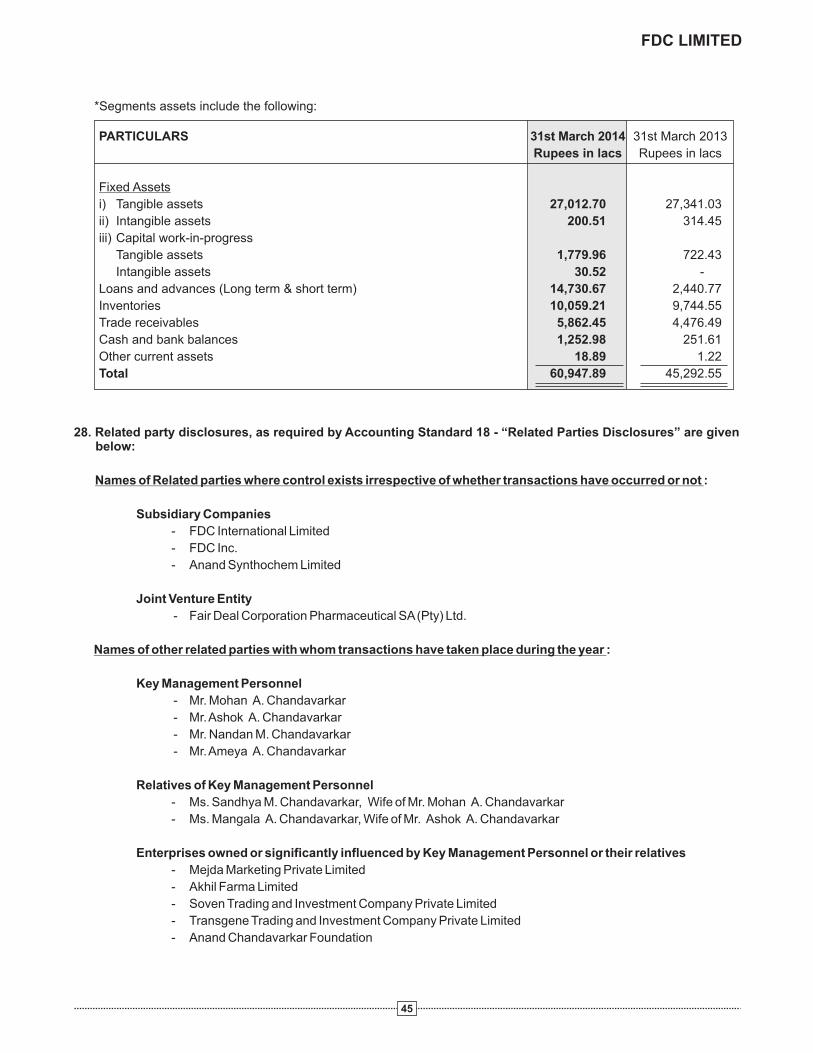
*Segments assets include the following:
PARTICULARS 31st March 2014 31st March 2013
Rupees in lacs Rupees in lacs
Fixed Assets
i) Tangible assets
ii) Intangible assets
iii) Capital work-in-progress
Tangible assets
Intangible assets
Loans and advances (Long term & short term)
Inventories
Trade receivables
Cash and bank balances
Other current assets
Total
27,012.70 27,341.03
200.51 314.45
1,779.96 722.43
30.52 -
14,730.67 2,440.77
10,059.21 9,744.55
5,862.45 4,476.49
1,252.98 251.61
18.89 1.22
60,947.89 45,292.55
28. Related party disclosures, as required by Accounting Standard 18 - “Related Parties Disclosures” are given below:
Names of Related parties where control exists irrespective of whether transactions have occurred or not :
Subsidiary Companies
- FDC International Limited
- FDC Inc.
- Anand Synthochem Limited
Joint Venture Entity
- Fair Deal Corporation Pharmaceutical SA (Pty) Ltd.
Names of other related parties with whom transactions have taken place during the year :
Key Management Personnel
- Mr. Mohan A. Chandavarkar
- Mr. Ashok A. Chandavarkar
- Mr. Nandan M. Chandavarkar
- Mr. Ameya A. Chandavarkar
Relatives of Key Management Personnel
- Ms. Sandhya M. Chandavarkar, Wife of Mr. Mohan A. Chandavarkar
- Ms. Mangala A. Chandavarkar, Wife of Mr. Ashok A. Chandavarkar
Enterprises owned or significantly influenced by Key Management Personnel or their relatives
- Mejda Marketing Private Limited
- Akhil Farma Limited
- Soven Trading and Investment Company Private Limited
- Transgene Trading and Investment Company Private Limited
- Anand Chandavarkar Foundation
45
FDC LIMITED
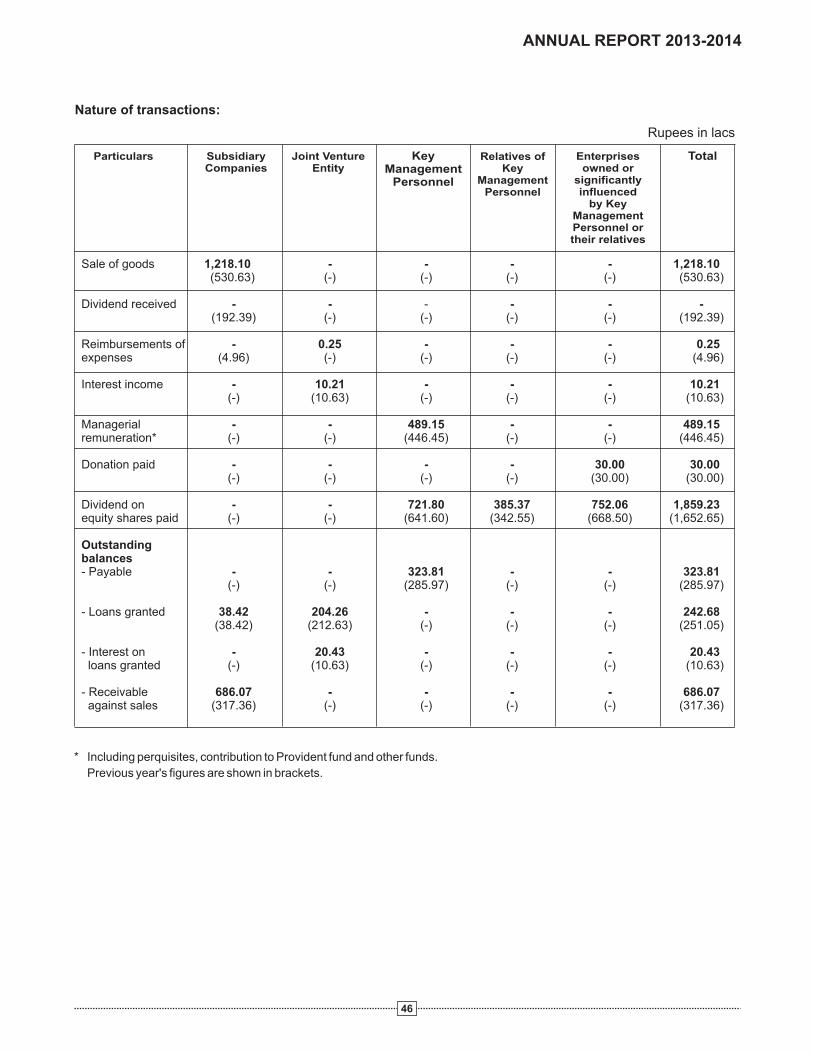
Nature of transactions:
Sale of goods
Dividend - - - - - -
Reimbursements expenses
Interest income - 10.21 - - - 10.21(-) (10.63) (-) (-) (-) (10.63)
Managerial - - 489.15 - -remuneration* (-) (-) (446.45) (-) (-)
Donation paid - - - - 30.00(-) (-) (-) (-) (30.00) (30.00)
Dividend on - - 721.80 385.37 752.06 1,859.23equity shares paid (-) (-) (641.60) (342.55) (668.50) (1,652.65)
Outstanding balances - Payable - - 323.81 - -
(-) (-) (285.97) (-) (-)
- Loans granted 38.42 204.26 - - - 242.68(38.42) (212.63) (-) (-) (-) (251.05)
- Interest on - 20.43 - - - loans granted (-) (10.63) (-) (-) (-)
- Receivable 686.07 - - - - against sales (317.36) (-) (-) (-) (-)
1,218.10 - - - - 1,218.10 (530.63) (-) (-) (-) (-) (530.63)
received(192.39) (-) (-) (-) (-) (192.39)
of - 0.25 - - - 0.25(4.96) (-) (-) (-) (-) (4.96)
489.15(446.45)
30.00
323.81(285.97)
20.43(10.63)
686.07(317.36)
TotalParticulars Joint VentureEntity
Key Management
Personnel
Relatives of Key
ManagementPersonnel
Enterprisesowned or
significantlyinfluenced
by KeyManagementPersonnel ortheir relatives
SubsidiaryCompanies
* Including perquisites, contribution to Provident fund and other funds.
Previous year's figures are shown in brackets.
46
ANNUAL REPORT 2013-2014
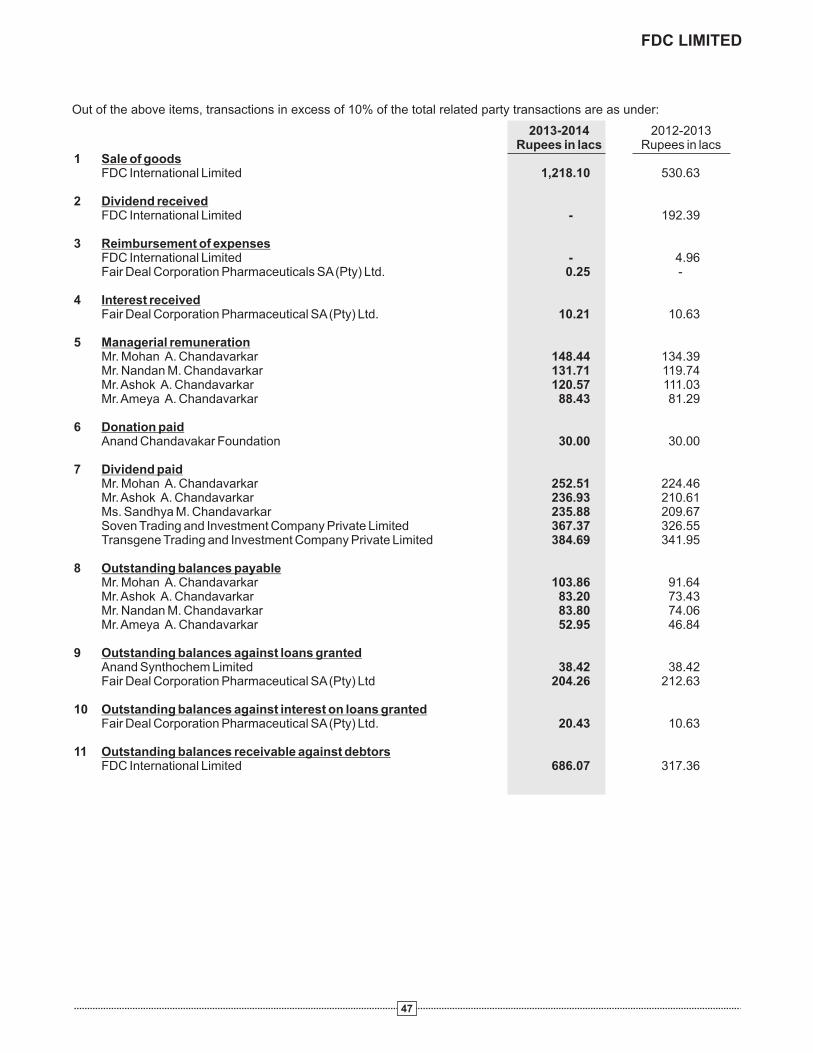
Out of the above items, transactions in excess of 10% of the total related party transactions are as under:
47
2013-2014 2012-2013Rupees in lacs Rupees in lacs
1 Sale of goods FDC International Limited 1,218.10 530.63
2 Dividend received
FDC International Limited - 192.39 3 Reimbursement of expenses
FDC International Limited - 4.96 Fair Deal Corporation Pharmaceuticals SA (Pty) Ltd. 0.25 -
4 Interest received
Fair Deal Corporation Pharmaceutical SA (Pty) Ltd. 10.21 10.63 5 Managerial remuneration
Mr. Mohan A. Chandavarkar 148.44 134.39 Mr. Nandan M. Chandavarkar 131.71 119.74 Mr. Ashok A. Chandavarkar 120.57 111.03 Mr. Ameya A. Chandavarkar 88.43 81.29
6 Donation paid
Anand Chandavakar Foundation 30.00 30.00 7 Dividend paid
Mr. Mohan A. Chandavarkar 252.51 224.46 Mr. Ashok A. Chandavarkar 236.93 210.61 Ms. Sandhya M. Chandavarkar 235.88 209.67 Soven Trading and Investment Company Private Limited 367.37 326.55 Transgene Trading and Investment Company Private Limited 384.69 341.95
8 Outstanding balances payable
Mr. Mohan A. Chandavarkar 103.86 91.64 Mr. Ashok A. Chandavarkar 83.20 73.43 Mr. Nandan M. Chandavarkar 83.80 74.06 Mr. Ameya A. Chandavarkar 52.95 46.84
9 Outstanding balances against loans granted
Anand Synthochem Limited 38.42 38.42 Fair Deal Corporation Pharmaceutical SA (Pty) Ltd 204.26 212.63
10 Outstanding balances against interest on loans granted
Fair Deal Corporation Pharmaceutical SA (Pty) Ltd. 20.43 10.63 11 Outstanding balances receivable against debtors
FDC International Limited 686.07 317.36
FDC LIMITED
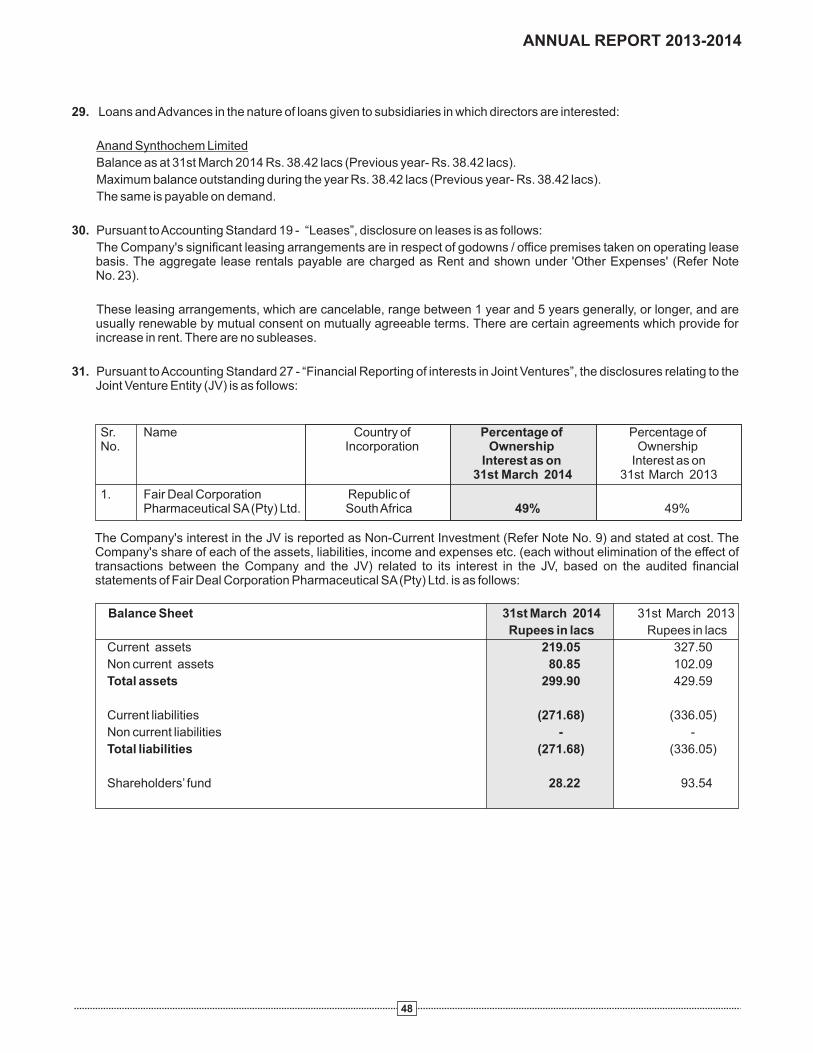
29. Loans and Advances in the nature of loans given to subsidiaries in which directors are interested:
Anand Synthochem Limited
Balance as at 31st March 2014 Rs. 38.42 lacs (Previous year- Rs. 38.42 lacs).
Maximum balance outstanding during the year Rs. 38.42 lacs (Previous year- Rs. 38.42 lacs).
The same is payable on demand.
30. Pursuant to Accounting Standard 19 - “Leases”, disclosure on leases is as follows:
The Company's significant leasing arrangements are in respect of godowns / office premises taken on operating lease basis. The aggregate lease rentals payable are charged as Rent and shown under 'Other Expenses' (Refer Note No. 23).
These leasing arrangements, which are cancelable, range between 1 year and 5 years generally, or longer, and are usually renewable by mutual consent on mutually agreeable terms. There are certain agreements which provide for increase in rent. There are no subleases.
31. Pursuant to Accounting Standard 27 - “Financial Reporting of interests in Joint Ventures”, the disclosures relating to the Joint Venture Entity (JV) is as follows:
Sr. Name Country of Percentage of Percentage of No. Incorporation Ownership Ownership
Interest as on Interest as on 31st March 2014 31st March 2013
1. Fair Deal Corporation Republic of Pharmaceutical SA (Pty) Ltd. South Africa 49% 49%
The Company's interest in the JV is reported as Non-Current Investment (Refer Note No. 9) and stated at cost. The Company's share of each of the assets, liabilities, income and expenses etc. (each without elimination of the effect of transactions between the Company and the JV) related to its interest in the JV, based on the audited financial statements of Fair Deal Corporation Pharmaceutical SA (Pty) Ltd. is as follows:
Balance Sheet 31st March 2014 31st March 2013
Rupees in lacs Rupees in lacs
Current assets
Non current assets
Total assets
Current liabilities
Non current liabilities - -
Total liabilities
Shareholders’ fund
219.05 327.50
80.85 102.09
299.90 429.59
(271.68) (336.05)
(271.68) (336.05)
28.22 93.54
48
ANNUAL REPORT 2013-2014
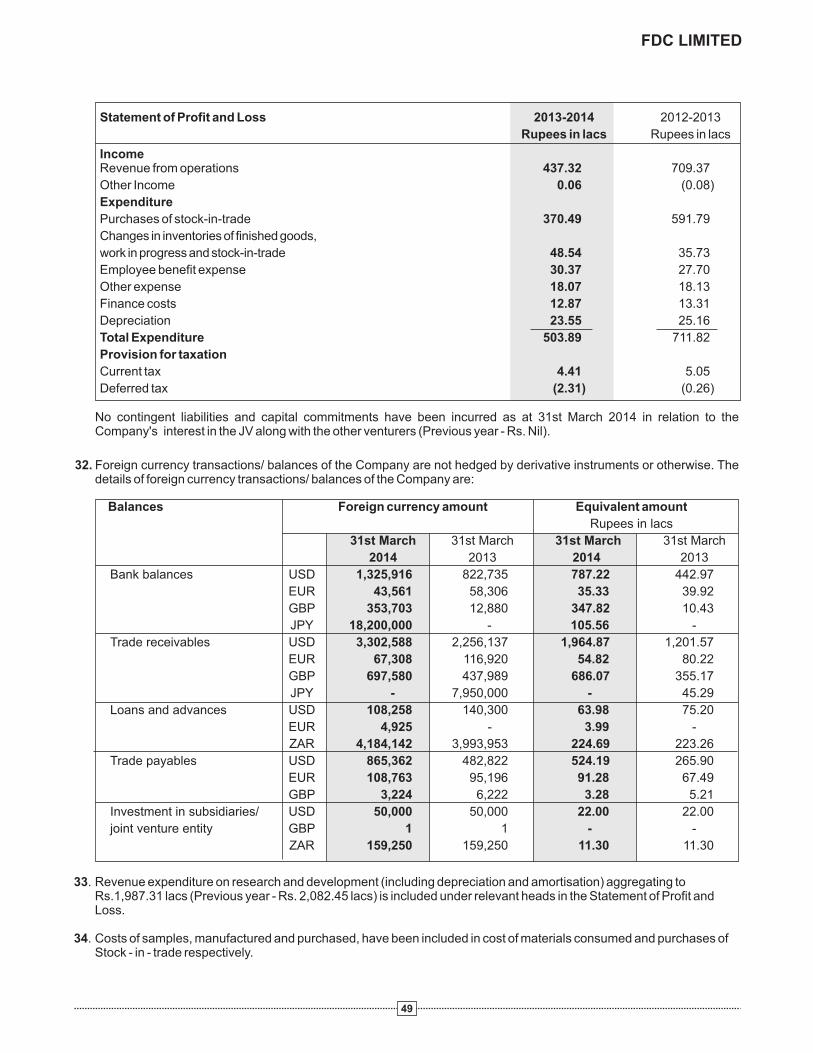
No contingent liabilities and capital commitments have been incurred as at 31st March 2014 in relation to the Company's interest in the JV along with the other venturers (Previous year - Rs. Nil).
32. Foreign currency transactions/ balances of the Company are not hedged by derivative instruments or otherwise. The details of foreign currency transactions/ balances of the Company are:
33. Revenue expenditure on research and development (including depreciation and amortisation) aggregating to Rs.1,987.31 lacs (Previous year - Rs. 2,082.45 lacs) is included under relevant heads in the Statement of Profit and Loss.
34. Costs of samples, manufactured and purchased, have been included in cost of materials consumed and purchases of Stock - in - trade respectively.
49
Statement of Profit and Loss 2013-2014 2012-2013
Rupees in lacs Rupees in lacs
IncomeRevenue from operations
Expenditure
Purchases of stock-in-trade
Changes in inventories of finished goods,
work in progress and stock-in-trade
Employee benefit expense
Other expense
Finance costs
Depreciation
Total Expenditure
Provision for taxation
Current tax
Deferred tax
437.32 709.37
Other Income 0.06 (0.08)
370.49 591.79
48.54 35.73
30.37 27.70
18.07 18.13
12.87 13.31
23.55 25.16
503.89 711.82
4.41 5.05
(2.31) (0.26)
Balances Foreign currency amount Equivalent amount
Rupees in lacs
31st March 31st March 31st March 31st March
2014 2013 2014 2013
Bank balances
Trade receivables
Loans and advances
Trade payables
Investment in subsidiaries/
joint venture entity
USD 1,325,916 822,735 787.22 442.97
EUR 43,561 58,306 35.33 39.92
GBP 353,703 12,880 347.82 10.43
JPY 18,200,000 - 105.56 -
USD 3,302,588 2,256,137 1,964.87 1,201.57
EUR 67,308 116,920 54.82 80.22
GBP 697,580 437,989 686.07 355.17
JPY - 7,950,000 - 45.29
USD 108,258 140,300 63.98 75.20
EUR 4,925 - 3.99 -
ZAR 4,184,142 3,993,953 224.69 223.26
USD 865,362 482,822 524.19 265.90
EUR 108,763 95,196 91.28 67.49
GBP 3,224 6,222 3.28 5.21
USD 50,000 50,000 22.00 22.00
GBP 1 1 - -
ZAR 159,250 159,250 11.30 11.30
FDC LIMITED

Rupees in lacs Percentage
Indigenous
Imported
Total
15,553.47 85.71
(13,728.10) (86.77)
2,592.39 14.29
(2,092.84) (13.23)
18,145.86 100.00
(15,820.94) (100.00)
35. Imported and indigenous raw materials consumed:
Previous year's figures are shown in brackets.
36. Imported and indigenous components, stores and spares consumed:
Rupees in lacs Percentage
Indigenous
Imported
Total
424.48 67.22
(347.66) (85.73)
207.01 32.78
(57.88) (14.27)
631.49 100.00
(405.54) (100.00)
Previous year's figures are shown in brackets.
37. CIF value of imports:
2013-2014 2012-2013
Rupees in lacs Rupees in lacs
Raw material
Packing material
Components, stores and spares
Capital goods
Intangible
Total
2,071.95 1,954.81
139.47 324.56
207.01 57.88
383.13 451.36
26.44 -
2,828.00 2,788.61
38. Earning in foreign currency: (accrual)
50
2013-2014 2012-2013
Rupees in lacs Rupees in lacs
FOB value of exports
Interest
Others
Total
11,256.60 9,364.94
10.21 10.63
Dividend from subsidiary - 192.39
194.32 22.22
11,461.13 9,590.18
ANNUAL REPORT 2013-2014

2013-2014 2012-2013
Rupees in lacs Rupees in lacs
Miscellaneous expenses (Export)
Commission to
Legal and professional fees
Travelling and conveyance
Others (gross)
Total
465.12 258.40
distributors 119.88 91.35
99.25 304.12
11.81 6.07
28.81 25.82
724.87 685.76
39. Expenditure in foreign currency: (accrual)
40. Previous year's figures have been regrouped/ reclassified, wherever necessary to conform to this year’s classification.
51
As per our report of even date
For S.R. BATLIBOI & CO. LLPChartered AccountantsFirm Registration No. 301003E
per VIJAY MANIARPartner Membership No. 36738
For and on behalf of the Board of Directors
MOHAN A. CHANDAVARKAR Chairman and Managing Director
ASHOK A. CHANDAVARKARDirector
VARSHARANI KATRECompany Secretary
Place : Mumbai Date : May 29, 2014
Place : Mumbai Date : May 29, 2014
FDC LIMITED

FDC International FDC Inc. Anand Synthochem
Limited Limited
1. The Financial Year of the Subsidiary
Companies ended on 31.03.2014 31.03.2014 31.03.2014
2. Date on which they became subsidiaries 09.10.1997 01.09.2004 17.10.2011
3. Number of shares held by FDC Limited 374,085 equity shares 500 equity shares of 1,740,000 equity shares
(Holding Company) in the Subsidiary of GBP 0.01 each USD 100 each of INR 10 each
Companies at the end of the financial
year of the Subsidiary Companies
4. Extent of interest of Holding Company 100% 100% 100%
as at the end of the financial year of the
Subsidiary Companies
5. The net aggregate amount of the
Subsidiary Companies' Profit/ (Loss)
so far as it concerns members of the
Holding Company and is not dealt with
in the Holding Company's Accounts
i. For the year ended 31st March 2014 GBP 171,828 (USD 1,510) (INR 466,316)
ii. For the financial years since they GBP 539,195 USD 38,244 (INR 1,123,302)
became subsidiaries
6. The net aggregate amount of the
Subsidiary Companies' Profit/ (Loss)
so far as it concerns members of the
Holding Company and dealt with in the
Holding Company's Accounts
i. For the year ended 31st March 2014 Nil Nil Nil
ii. For the financial years since they Nil Nil Nil
became subsidiaries
Place: Mumbai Date : May 29, 2014
STATEMENT PURSUANT TO SECTION 212 OF THE COMPANIES ACT, 1956 RELATING
TO HOLDING COMPANY'S INTEREST IN THE SUBSIDIARY COMPANIES______________
NAME OF THE SUBSIDIARIES
For and on behalf of the Board of Directors
MOHAN A. CHANDAVARKAR Chairman and Managing Director
ASHOK A. CHANDAVARKARDirector
VARSHARANI KATRECompany Secretary
SR.NO.
PARTICULARS
52
ANNUAL REPORT 2013-2014
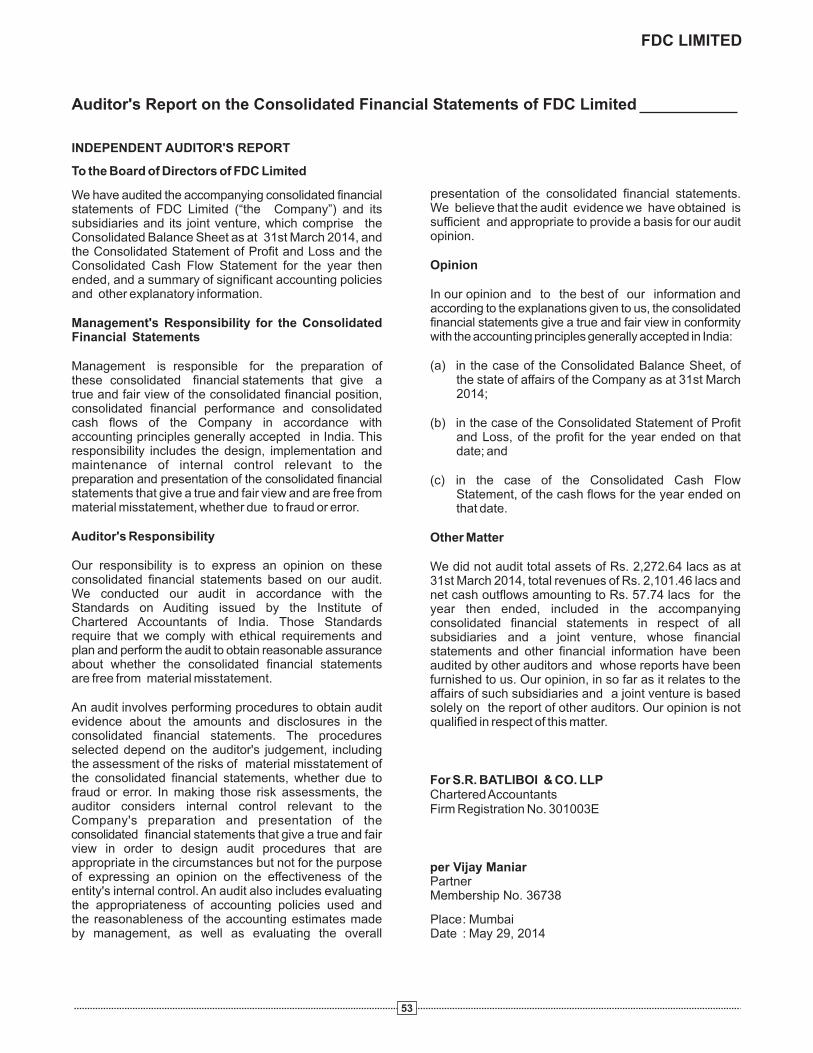
To the Board of Directors of FDC Limited
presentation of the consolidated financial statements. We have audited the accompanying consolidated financial We believe that the audit evidence we have obtained is statements of FDC Limited (“the Company”) and its sufficient and appropriate to provide a basis for our audit subsidiaries and its joint venture, which comprise the opinion.Consolidated Balance Sheet as at 31st March 2014, and
the Consolidated Statement of Profit and Loss and the OpinionConsolidated Cash Flow Statement for the year then
ended, and a summary of significant accounting policies and other explanatory information. In our opinion and to the best of our information and
according to the explanations given to us, the consolidated financial statements give a true and fair view in conformity Management's Responsibility for the Consolidated with the accounting principles generally accepted in India:Financial Statements
(a) in the case of the Consolidated Balance Sheet, of Management is responsible for the preparation of the state of affairs of the Company as at 31st March these consolidated financial statements that give a 2014;true and fair view of the consolidated financial position,
consolidated financial performance and consolidated cash flows of the Company in accordance with (b) in the case of the Consolidated Statement of Profit accounting principles generally accepted in India. This and Loss, of the profit for the year ended on that responsibility includes the design, implementation and date; andmaintenance of internal control relevant to the preparation and presentation of the consolidated financial (c) in the case of the Consolidated Cash Flow statements that give a true and fair view and are free from Statement, of the cash flows for the year ended on material misstatement, whether due to fraud or error. that date.
Auditor's Responsibility Other Matter
Our responsibility is to express an opinion on these We did not audit total assets of Rs. 2,272.64 lacs as at consolidated financial statements based on our audit. 31st March 2014, total revenues of Rs. 2,101.46 lacs and We conducted our audit in accordance with the net cash outflows amounting to Rs. 57.74 lacs for the Standards on Auditing issued by the Institute of year then ended, included in the accompanying Chartered Accountants of India. Those Standards consolidated financial statements in respect of all require that we comply with ethical requirements and subsidiaries and a joint venture, whose financial plan and perform the audit to obtain reasonable assurance statements and other financial information have been about whether the consolidated financial statements audited by other auditors and whose reports have been are free from material misstatement. furnished to us. Our opinion, in so far as it relates to the
affairs of such subsidiaries and a joint venture is based An audit involves performing procedures to obtain audit solely on the report of other auditors. Our opinion is not evidence about the amounts and disclosures in the qualified in respect of this matter.consolidated financial statements. The procedures selected depend on the auditor's judgement, including the assessment of the risks of material misstatement of the consolidated financial statements, whether due to For S.R. BATLIBOI & CO. LLPfraud or error. In making those risk assessments, the Chartered Accountantsauditor considers internal control relevant to the Firm Registration No. 301003ECompany's preparation and presentation of the consolidated financial statements that give a true and fair view in order to design audit procedures that are appropriate in the circumstances but not for the purpose per Vijay Maniarof expressing an opinion on the effectiveness of the Partnerentity's internal control. An audit also includes evaluating Membership No. 36738the appropriateness of accounting policies used and the reasonableness of the accounting estimates made by management, as well as evaluating the overall
Auditor's Report on the Consolidated Financial Statements of FDC Limited
Place: Mumbai Date : May 29, 2014
53
INDEPENDENT AUDITOR'S REPORT
FDC LIMITED
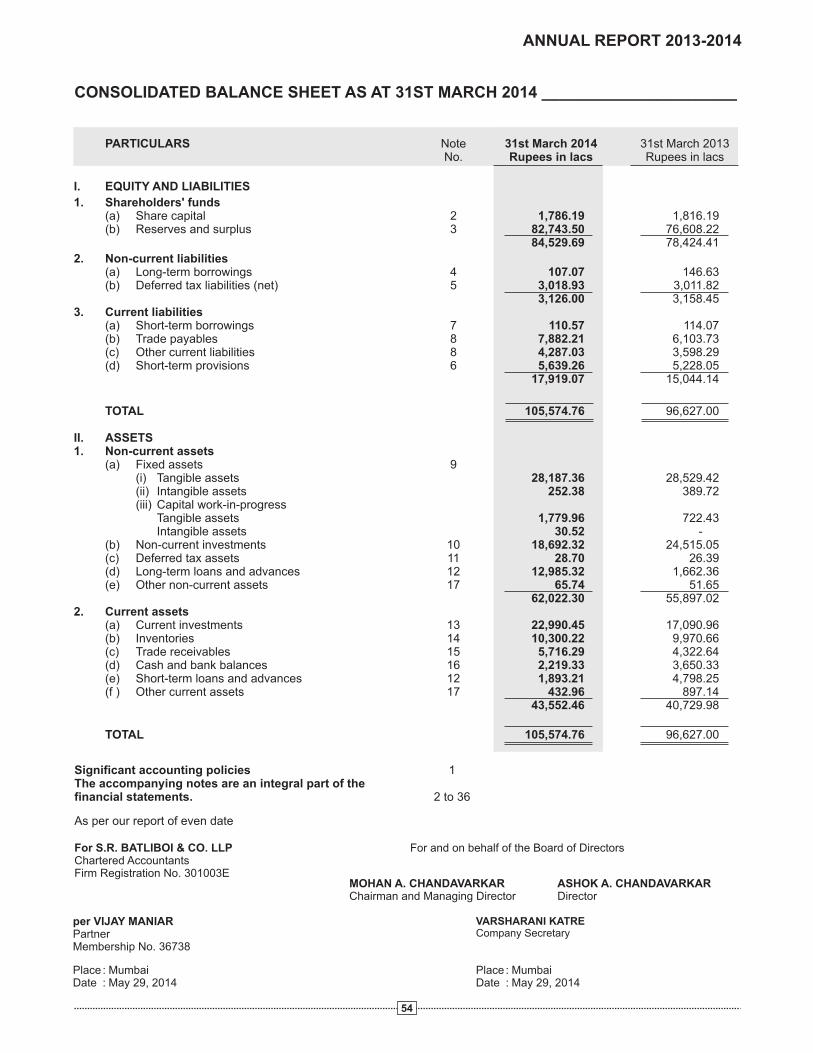
PARTICULARS Note 31st March 2014 31st March 2013No. Rupees in lacs Rupees in lacs
I. EQUITY AND LIABILITIES
1. Shareholders' funds (a) Share capital 2 1,786.19 1,816.19 (b) Reserves and surplus 3 82,743.50 76,608.22
84,529.69 78,424.41
2. Non-current liabilities (a) Long-term borrowings 4 107.07 146.63 (b) Deferred tax liabilities (net) 5 3,018.93 3,011.82 3,126.00 3,158.45 3. Current liabilities (a) Short-term borrowings 7 110.57 114.07 (b) Trade payables 8 7,882.21 6,103.73 (c) Other current liabilities 8 4,287.03 3,598.29 (d) Short-term provisions 6 5,639.26 5,228.05 17,919.07 15,044.14
TOTAL 105,574.76 96,627.00 II. ASSETS 1. Non-current assets (a) Fixed assets 9 (i) Tangible assets 28,187.36 28,529.42 (ii) Intangible assets 252.38 389.72 (iii) Capital work-in-progress Tangible assets 1,779.96 722.43 Intangible assets 30.52 - (b) Non-current investments 10 18,692.32 24,515.05 (c) Deferred tax assets 11 28.70 26.39 (d) Long-term loans and advances 12 12,985.32 1,662.36 (e) Other non-current assets 17 65.74 51.65 62,022.30 55,897.02 2. Current assets (a) Current investments 13 22,990.45 17,090.96 (b) Inventories 14 10,300.22 9,970.66 (c) Trade receivables 15 5,716.29 4,322.64 (d) Cash and bank balances 16 2,219.33 3,650.33 (e) Short-term loans and advances 12 1,893.21 4,798.25 (f ) Other current assets 17 432.96 897.14 43,552.46 40,729.98
TOTAL 105,574.76 96,627.00
CONSOLIDATED BALANCE SHEET AS AT 31ST MARCH 2014 ______________________
Significant accounting policies 1The accompanying notes are an integral part of the financial statements. 2 to 36
As per our report of even date
54
For S.R. BATLIBOI & CO. LLPChartered AccountantsFirm Registration No. 301003E
per VIJAY MANIARPartner Membership No. 36738
For and on behalf of the Board of Directors
MOHAN A. CHANDAVARKAR Chairman and Managing Director
ASHOK A. CHANDAVARKARDirector
VARSHARANI KATRECompany Secretary
Place : Mumbai Date : May 29, 2014
Place : Mumbai Date : May 29, 2014
ANNUAL REPORT 2013-2014
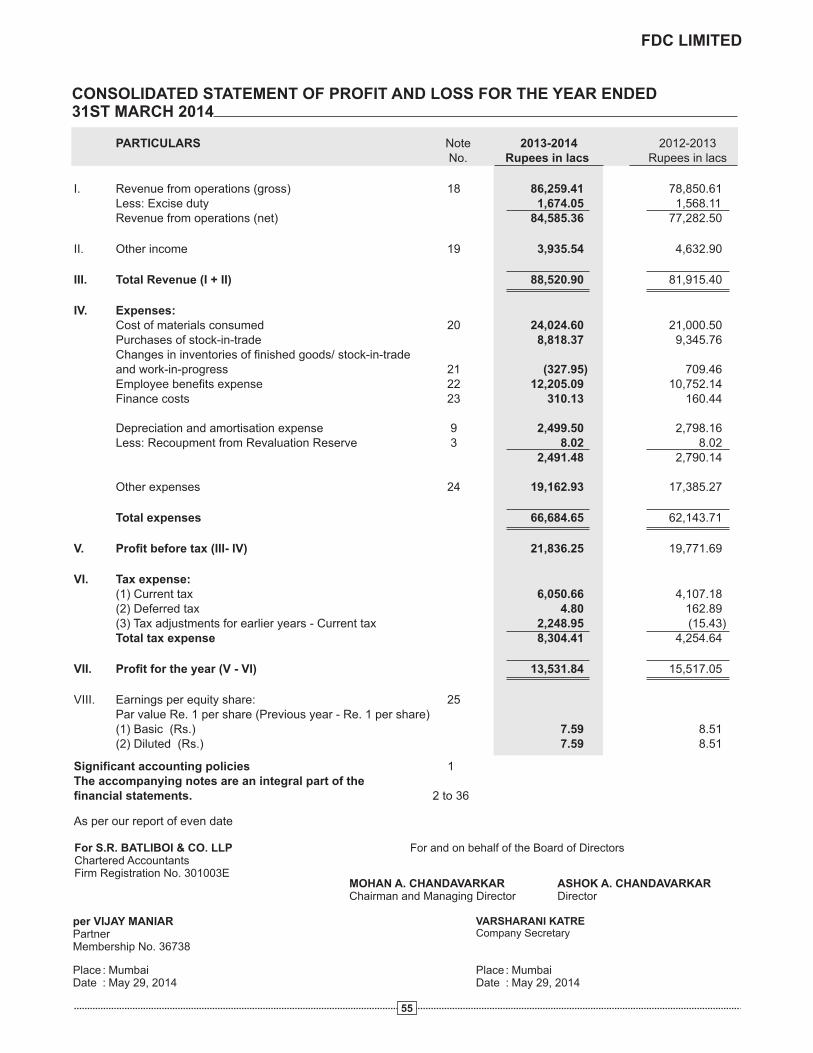
PARTICULARS Note 2013-2014 2012-2013No. Rupees in lacs Rupees in lacs
I. Revenue from operations (gross) 18 Less: Excise duty Revenue from operations (net)
II. Other income 19
III. Total Revenue (I + II)
IV. Expenses: Cost of materials consumed 20 Purchases of stock-in-trade Changes in inventories of finished goods/ stock-in-trade
and work-in-progress 21 Employee benefits expense 22 Finance costs 23
Depreciation and amortisation expense 9 Less: Recoupment from Revaluation Reserve 3
Other expenses 24
Total expenses
V. Profit before tax (III- IV)
VI. Tax expense: (1) Current tax (2) Deferred tax (3) Tax adjustments for earlier years - Current tax Total tax expense
VII. Profit for the year (V - VI)
VIII. Earnings per equity share: 25 Par value Re. 1 per share (Previous year - Re. 1 per share) (1) Basic (Rs.) (2) Diluted (Rs.)
86,259.41 78,850.61 1,674.05 1,568.11
84,585.36 77,282.50
3,935.54 4,632.90
88,520.90 81,915.40
24,024.60 21,000.50 8,818.37 9,345.76
(327.95) 709.46 12,205.09 10,752.14
310.13 160.44
2,499.50 2,798.16 8.02 8.02
2,491.48 2,790.14
19,162.93 17,385.27
66,684.65 62,143.71
21,836.25 19,771.69
6,050.66 4,107.184.80 162.89
2,248.95 (15.43)8,304.41 4,254.64
13,531.84 15,517.05
7.59 8.51 7.59 8.51
CONSOLIDATED STATEMENT OF PROFIT AND LOSS FOR THE YEAR ENDED 31ST MARCH 2014
Significant accounting policies 1The accompanying notes are an integral part of the financial statements. 2 to 36
As per our report of even date
55
For S.R. BATLIBOI & CO. LLPChartered AccountantsFirm Registration No. 301003E
per VIJAY MANIARPartner Membership No. 36738
For and on behalf of the Board of Directors
MOHAN A. CHANDAVARKAR Chairman and Managing Director
ASHOK A. CHANDAVARKARDirector
VARSHARANI KATRECompany Secretary
Place : Mumbai Date : May 29, 2014
Place : Mumbai Date : May 29, 2014
FDC LIMITED
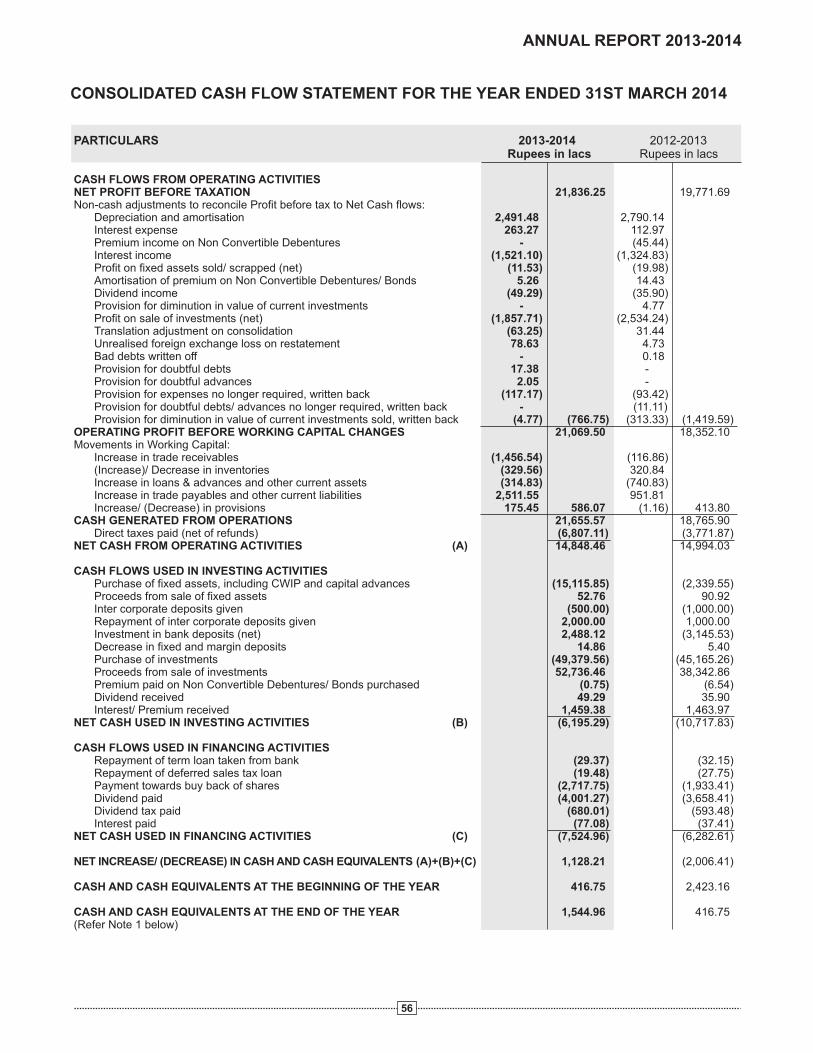
PARTICULARS 2013-2014 2012-2013 Rupees in lacs Rupees in lacs
CASH FLOWS FROM OPERATING ACTIVITIES NET PROFIT BEFORE TAXATION 21,836.25 19,771.69 Non-cash adjustments to reconcile Profit before tax to Net Cash flows: Depreciation and amortisation 2,491.48 2,790.14 Interest expense 263.27 112.97 Premium income on Non Convertible Debentures - (45.44) Interest income (1,521.10) (1,324.83) Profit on fixed assets sold/ scrapped (net) (11.53) (19.98) Amortisation of premium on Non Convertible Debentures/ Bonds 5.26 14.43 Dividend income (49.29) (35.90) Provision for diminution in value of current investments - 4.77 Profit on sale of investments (net) (1,857.71) (2,534.24) Translation adjustment on consolidation (63.25) 31.44 Unrealised foreign exchange loss on restatement 78.63 4.73 Bad debts written off - 0.18 Provision for doubtful debts 17.38 - Provision for doubtful advances 2.05 - Provision for expenses no longer required, written back (117.17) (93.42) Provision for doubtful debts/ advances no longer required, written back - (11.11) Provision for diminution in value of current investments sold, written back (4.77) (766.75) (313.33) (1,419.59)OPERATING PROFIT BEFORE WORKING CAPITAL CHANGES 21,069.50 18,352.10 Movements in Working Capital: Increase in trade receivables (1,456.54) (116.86) (Increase)/ Decrease in inventories (329.56) 320.84 Increase in loans & advances and other current assets (314.83) (740.83) Increase in trade payables and other current liabilities 2,511.55 951.81 Increase/ (Decrease) in provisions 175.45 586.07 (1.16) 413.80CASH GENERATED FROM OPERATIONS 21,655.57 18,765.90 Direct taxes paid (net of refunds) (6,807.11) (3,771.87)NET CASH FROM OPERATING ACTIVITIES (A) 14,848.46 14,994.03
CASH FLOWS USED IN INVESTING ACTIVITIES Purchase of fixed assets, including CWIP and capital advances (15,115.85) (2,339.55) Proceeds from sale of fixed assets 52.76 90.92 Inter corporate deposits given (500.00) (1,000.00) Repayment of inter corporate deposits given 2,000.00 1,000.00
Investment in bank deposits (net) 2,488.12 (3,145.53) Decrease in fixed and margin deposits 14.86 5.40 Purchase of investments (49,379.56) (45,165.26)
Proceeds from sale of investments 52,736.46 38,342.86 Premium paid on Non Convertible Debentures/ Bonds purchased (0.75) (6.54) Dividend received 49.29 35.90 Interest/ Premium received 1,459.38 1,463.97NET CASH USED IN INVESTING ACTIVITIES (B) (6,195.29) (10,717.83)
CASH FLOWS USED IN FINANCING ACTIVITIES Repayment of term loan taken from bank (29.37) (32.15) Repayment of deferred sales tax loan (19.48) (27.75) Payment towards buy back of shares (2,717.75) (1,933.41) Dividend paid (4,001.27) (3,658.41) Dividend tax paid (680.01) (593.48) Interest paid (77.08) (37.41)NET CASH USED IN FINANCING ACTIVITIES (C) (7,524.96) (6,282.61)
NET INCREASE/ (DECREASE) IN CASH AND CASH EQUIVALENTS (A)+(B)+(C) 1,128.21 (2,006.41)
CASH AND CASH EQUIVALENTS AT THE BEGINNING OF THE YEAR 416.75 2,423.16
CASH AND CASH EQUIVALENTS AT THE END OF THE YEAR 1,544.96 416.75 (Refer Note 1 below)
CONSOLIDATED CASH FLOW STATEMENT FOR THE YEAR ENDED 31ST MARCH 2014
56
ANNUAL REPORT 2013-2014

1. Cash and cash equivalents consist of cash on hand and balance with banks. Cash and cash equivalents included in the consolidated cash flow statement comprise of the following Balance Sheet items:
PARTICULARS 31st March 2014 31st March 2013
Rupees in lacs Rupees in lacs
Cash on hand 13.37 15.81
Balance with scheduled banks:
In current accounts 1,446.06 351.98
In unpaid dividend accounts (Refer Note 2 below) 91.14 93.13
Unrealised foreign exchange gain on restatement of cash and
cash equivalents (5.61) (44.17)
1,544.96 416.75
2. Rs. 91.14 lacs (Previous year - Rs. 93.13 lacs) in unclaimed dividend accounts are not available for use by the Company as they represent corresponding dividend liabilities.
Notes to the Consolidated Cash Flow Statement
CONSOLIDATED CASH FLOW STATEMENT FOR THE YEAR ENDED 31ST MARCH 2014
57
As per our report of even date
For S.R. BATLIBOI & CO. LLPChartered AccountantsFirm Registration No. 301003E
per VIJAY MANIARPartner Membership No. 36738
For and on behalf of the Board of Directors
MOHAN A. CHANDAVARKAR Chairman and Managing Director
ASHOK A. CHANDAVARKARDirector
VARSHARANI KATRECompany Secretary
Place : Mumbai Date : May 29, 2014
Place : Mumbai Date : May 29, 2014
FDC LIMITED
1. SIGNIFICANT ACCOUNTING POLICIES
a. BASIS OF PREPARATION OF FINANCIAL STATEMENTS
The consolidated financial statements have been prepared and presented under the historical cost convention,
except for certain fixed assets of FDC Limited which were revalued on 30th September 1993 (Refer Note d
below) and in case of assets where a provision is made for impairment losses, on accrual basis and are in
accordance with the requirements of the Companies Act, 1956 and comply with the accounting standards
notified by the Companies (Accounting Standards) Rules, 2006 (as amended) and to the extent possible in the
same format as that adopted by the parent company (FDC Limited) for its separate financial statements. The
accounting policies are generally uniform for the Group and are consistent with those used in the previous year.
b. USE OF ESTIMATES
The preparation of consolidated financial statements in conformity with generally accepted accounting
principles in India requires the management to make judgments, estimates and assumptions that affect the
reported amounts of revenue, expenses, assets and liabilities and the disclosure of contingent liabilities as at the
date of financial statements and the result of the operations during the reported period. Although these estimates
are based upon management's best knowledge of current events and actions, actual results could differ from
these estimates.
c. BASIS OF CONSOLIDATION
The consolidated financial statements include the financial statements of FDC Limited (“the Company”), the
parent company, all of its subsidiaries and its joint venture (collectively referred to as “the Group”). The
consolidated financial statements of the Group have been consolidated on a line-by-line basis by adding
together the book values of like items of assets, liabilities, income and expenses in accordance with Accounting
Standard 21 - “Consolidated Financial Statements”. The Group accounts for its proportionate share of interest in
the joint venture companies by proportionate consolidation method in accordance with Accounting Standard 27
– “Financial Reporting of Interests in Joint Ventures”. The accounting policies have been consistently applied by
the Group during the year. The financial statements of all subsidiaries and joint venture companies are drawn
upto the same date as the parent company.
In the preparation of consolidated financial statements, all significant intra-group transactions and accounts are
eliminated. Unrealised profits, if any, on items carried in inventories are also eliminated from the consolidated
financial statements. Unrealised losses resulting from intra-group transactions have also been eliminated
except to the extent that recoverable value of related assets is lower than their cost to the Group.
The excess of cost of investment in the subsidiaries/ joint venture companies over the share of equity in the
subsidiaries/ joint venture companies at the respective dates of investment is recognised in the financial
statements as Goodwill and the same is charged off during the year of acquisition. The excess of share of equity
in the subsidiaries/ joint venture companies over the cost of acquisition in the subsidiaries/ joint venture
companies at the respective dates of investment is recognised in the financial statements as Capital Reserve.
The share of equity in such subsidiaries/ joint venture companies is determined on the basis of the latest
financial statements of the subsidiaries/ joint venture companies prior to the date of investment.
d. TANGIBLE FIXED ASSETS
All fixed assets other than revalued assets are stated at cost less accumulated depreciation/ amortisation less
impairment losses. Cost comprises of the purchase price and any other directly attributable costs of bringing the
assets to its working condition for its intended use. Adjustments arising from exchange rates variances relating
to liabilities attributable to fixed assets are taken to the Statement of Profit and Loss.
Leasehold land, buildings, major items of plant and machinery and research and development equipments of
FDC Limited at Jogeshwari and Roha were revalued on 30th September 1993 on the basis of the report of an
approved valuer. Difference between the book value and the value as per valuer's report amounting to
Rs. 730.70 lacs was transferred to Revaluation Reserve during the year ended 31st March 1994. These fixed
assets are stated at revalued amounts less accumulated depreciation.
58
ANNUAL REPORT 2013-2014

e. DEPRECIATION/ AMORTISATION/ IMPAIRMENT
FDC LimitedDepreciation on the historical cost of tangible fixed assets is provided on straight line method at the rates and in
the manner prescribed under Schedule XIV to the Companies Act, 1956 except for the below mentioned assets
where higher rates are considered based on the useful life of the assets as estimated by the management:
Depreciation on revalued portion of fixed assets is calculated on straight line method over balance useful life of
assets as determined by the valuer and is transferred from Revaluation Reserve to the Statement of Profit and
Loss.
The carrying amounts of assets are reviewed at each balance sheet date if there is any indication of impairment
based on internal/ external factors. An impairment loss is recognised whenever the carrying amount of an asset
exceeds its recoverable amount. The recoverable amount is the greater of the asset's net selling price and value
in use. In assessing value in use, the estimated future cash flows are discounted to their present value using a
pre-tax discount rate that reflects current market assessments of the time value of the money and risks specific to
the assets.
After recognition of impairment loss, the depreciation charge for the asset is adjusted in future periods to allocate
the asset's revised carrying amount, less its residual value (if any), on straight line basis over its remaining useful
life.
A previously recognised impairment loss is increased or reversed depending on changes in circumstances.
However, the carrying value after reversal is not increased beyond the carrying value that would have prevailed
by charging usual depreciation if there was no impairment.
Assets costing less than Rs. 5,000 are depreciated at the rate of hundred per cent.
Leasehold land/ improvements are amortised on a straight line basis over the period of lease ranging from 30 to
99 years.
Subsidiaries/ Joint venture companiesDepreciation is provided on cost less estimated residual value of fixed assets over their expected useful lives
following reducing balance method/ straight line method.
f. INTANGIBLE ASSETS
FDC Limited Technical know-howTechnical know-how which are acquired, are capitalised and amortised over the period of its estimated useful life
as estimated by the management on a straight line basis, not exceeding ten years.
Marketing Rights and SoftwareCost relating to marketing rights and software, which are acquired, are capitalised and amortised over the period
of its estimated useful life as estimated by the management on a straight line basis, not exceeding ten years.
Subsidiaries/ Joint venture companiesDossiersDossiers are recorded at the consideration paid for acquisition and are amortised over the period of its estimated
useful life, not exceeding ten years.
59
ASSETS RATES
Laboratory testing machines 10.00%
R&D Equipments 10.00%
Vehicles 16.67%
FDC LIMITED
g. INVESTMENTS
Investments that are readily realisable and intended to be held for not more than a year from the reporting period
are classified as Current Investments. These are valued at lower of cost and fair value (repurchase price or
market value) on an individual item basis.
Investments other than current are classified as Non-Current Investments which are valued at cost less provision
for diminution in value, other than temporary, if any.
h. INVENTORIES
Raw materials and packing materials are valued at lower of cost and net realisable value, cost of which includes
duties and taxes (net off CENVAT and VAT, wherever applicable) and is arrived at on weighted average cost
basis. Cost of imported raw materials and packing materials lying in bonded warehouse includes customs duty.
However, materials and other items held for use in the production of inventories are not written down below cost if
the finished products in which they will be incorporated are expected to be sold at or above cost.
Finished products including stock-in-trade and work-in-progress are valued at lower of cost and net realisable
value and cost is arrived at on weighted average cost basis. Cost of finished products and work-in-progress
includes material cost, labour, direct expenses, production overheads and excise duty, where applicable.
i. REVENUE RECOGNITION
Revenue is recognised to the extent that it is probable that the economic benefits will flow to the Company and the
revenue can be reliably measured.
Revenue from sale of goods is recognised when significant risks and rewards of ownership are transferred to
customers, which coincides with dispatch of goods to customers. The Company collects sales taxes and value
added taxes (VAT) on behalf of the government and, therefore, these are not economic benefits flowing to the
Company, hence, they are excluded from revenue. Excise duty deducted from revenue (gross) is the amount that
is included in the revenue (gross) and not the entire amount of the liability arising during the year.
Dividend is recognised when the Company's right to receive the payment is established by the balance sheet
date.
Interest income is recognised on a time proportion basis taking into account the amount outstanding and the rate
applicable.
Other income is accounted for on accrual basis except where the receipt of income is uncertain.
j. FOREIGN CURRENCY TRANSLATION/ TRANSACTIONS
Transactions in foreign currency are recorded at the rates prevailing on the date of the transaction.
Monetary assets and liabilities denominated in a foreign currency outstanding at the year end are restated at the
year end exchange rates. Non-monetary items which are carried in terms of historical cost denominated in a
foreign currency are reported using the exchange rate at the date of the transaction; and non-monetary items
which are carried at fair value or other similar valuation denominated in a foreign currency are reported using the
exchange rates that existed when the values were determined.
Exchange differences arising out of settlement and restatement of foreign exchange monetary items are taken to
the Statement of Profit and Loss.
The premium or discount arising at the inception of forward exchange contracts is amortised as expense or
income over the life of the contract. Exchange differences on such contracts are recognised in the Statement of
Profit and Loss in the year in which the exchange rates change. Any profit or loss arising on cancellation or
renewal of forward exchange contract is recognised as income or expense for the year.
60
ANNUAL REPORT 2013-2014
The financial statements of the foreign subsidiaries and the joint venture companies are translated into Indian
Rupees as follows:
Non-integral foreign operations:Ÿ Income and expense items except opening and closing inventories are translated at the average exchange
rate for the year. Opening and closing inventories are translated at the rates prevalent at the commencement
and close respectively of the accounting period.
Ÿ All assets and liabilities are translated using the closing exchange rate.
Ÿ The differences on translation including those arising on elimination of non-monetary intra-group balances
and transactions are taken to Translation Reserve as a part of Reserves and Surplus.
Ÿ The differences arising on elimination of monetary intra-group balances and transactions are taken to the
Consolidated Statement of Profit and Loss.
Integral foreign operations:Ÿ Income and expense items except opening and closing inventories are translated at the average exchange
rate for the year.
Ÿ All monetary assets and liabilities are translated using the closing exchange rate.
Ÿ All non-monetary assets and liabilities, other than inventories, are translated using the exchange rate at the
date of their acquisition.
Ÿ The differences on translation including those arising on elimination of intra-group balances and transactions
are taken to Consolidated Statement of Profit and Loss.
k. GOVERNMENT GRANTS
Grants and subsidies from the government are recognised when there is reasonable assurance that the grant/
subsidy will be received and all attaching conditions will be complied with.
Government grants received as capital incentives/ subsidies are credited to Capital Reserve. Government grants
related to revenue is recognised on a systematic basis in the Statement of Profit and Loss over the periods
necessary to match them with the related costs which they are intended to compensate.
Government grants relating to specific fixed assets are disclosed as deduction from the gross value of the assets
concerned.
l. EMPLOYEE BENEFITS
Company's contribution to recognised provident fund, family pension fund and superannuation fund is defined
contribution plan and is charged to the Statement of Profit and Loss on accrual basis. There are no other
obligations other than the contribution payable to the respective trusts.
Contribution to gratuity fund is defined benefit obligation and is provided for on the basis of an actuarial valuation
on projected unit credit method made at the end of each financial year.
Short term compensated absences are provided for based on estimates. Long term compensated absences are
provided for based on actuarial valuation. The actuarial valuation is done as per projected unit credit method.
Actuarial gains/ losses are immediately recognised in the Statement of Profit and Loss.
m. RESEARCH AND DEVELOPMENT
Revenue expenditure is charged off to the Statement of Profit and Loss in the year in which it is incurred.
n. LEASE ACCOUNTING
Leases where substantially all the risks and benefits of ownership are retained by the lessor, are classified as
operating leases. Operating lease expenses/ income is recognised in the Statement of Profit and Loss on a
straight line basis over the lease term.
61
FDC LIMITED
o. EARNING PER SHARE
Basic earning per share is computed by dividing the net profit after tax attributable to equity shareholders for the
year by the weighted average number of equity shares outstanding during the year.
Diluted earning per share is computed by dividing the net profit after tax attributable to equity shareholders for the
year by the weighted average number of equity shares outstanding during the year as adjusted for the effects of
all dilutive potential equity shares, if any.
p. ACCOUNTING FOR TAXES ON INCOME
Tax expense comprises of current and deferred tax. Provision for current tax is made, based on the tax payable
under the Income-tax Act, 1961. Deferred tax assets and liabilities from timing differences between taxable
income and accounting income is accounted for using the tax rates and the tax laws enacted or substantially
enacted as on the balance sheet date.
At each balance sheet date, the Company reassesses unrecognised deferred tax assets. Deferred tax assets are
recognised only to the extent that there is a reasonable certainty of their realisation. In situations where the
Company has unabsorbed depreciation or carry forward tax losses, all deferred tax assets are recognised only if
there is virtual certainty supported by convincing evidence that they can be realised against future taxable profits.
MAT credit is recognised as an asset when there is convincing evidence that the Company will pay normal
income tax during the specified period. The Company reviews the same at each balance sheet date and writes
down the carrying amount of MAT Credit Entitlement to the extent there is no longer convincing evidence to the
effect that the Company will pay normal income tax during the specified period.
q. PROVISIONS AND CONTINGENCIES
The Company creates a provision when there exist a present obligation as a result of a past event that probably
requires an outflow of resources and a reliable estimate can be made of the amount of the obligation. Provisions
are not discounted to its present value and are determined based on best estimate required to settle the
obligation at the balance sheet date. These are reviewed at each balance sheet date and adjusted to reflect the
current best estimates.
A disclosure for a contingent liability is made when there is a possible obligation or a present obligation that may,
but probably will not require an outflow of resources. When there is a possible obligation or a present obligation in
respect of which the likelihood of outflow of resources is remote, no provision or disclosure is made.
r. CASH AND CASH EQUIVALENTS
Cash and cash equivalents for the purposes of Cash Flow Statement comprise cash at bank and in hand and
short-term investments with an original maturity of three months or less.
62
ANNUAL REPORT 2013-2014
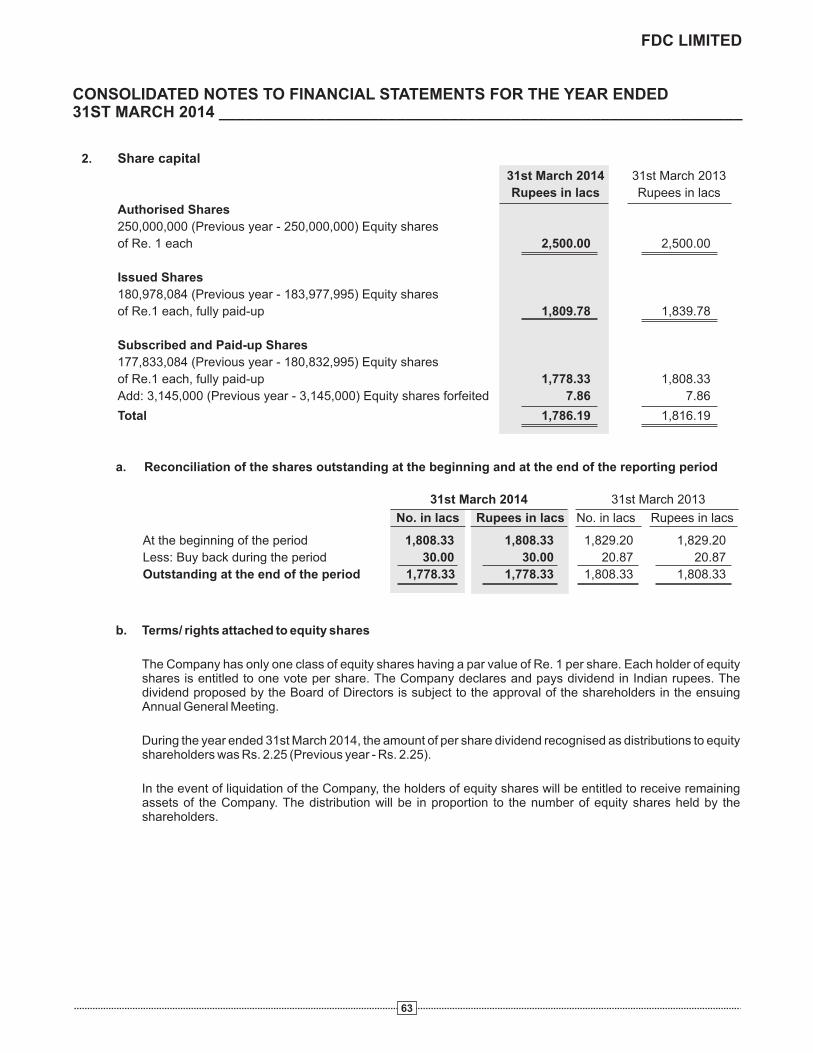
2. Share capital
31st March 2014 31st March 2013
Rupees in lacs Rupees in lacs
Authorised Shares
250,000,000 (Previous year - 250,000,000) Equity shares
of Re. 1 each 2,500.00 2,500.00
Issued Shares
180,978,084 (Previous year - 183,977,995) Equity shares
of Re.1 each, fully paid-up 1,809.78 1,839.78
Subscribed and Paid-up Shares
177,833,084 (Previous year - 180,832,995) Equity shares
of Re.1 each, fully paid-up 1,778.33 1,808.33
Add: 3,145,000 (Previous year - 3,145,000) Equity shares forfeited 7.86 7.86
Total 1,786.19 1,816.19
CONSOLIDATED NOTES TO FINANCIAL STATEMENTS FOR THE YEAR ENDED 31ST MARCH 2014 ___________________________________________________________
a. Reconciliation of the shares outstanding at the beginning and at the end of the reporting period
No. in lacs Rupees in lacs No. in lacs Rupees in lacs
At the beginning of the period 1,808.33 1,808.33 1,829.20 1,829.20
Less: Buy back during the period 30.00 30.00 20.87 20.87
Outstanding at the end of the period 1,778.33 1,778.33 1,808.33 1,808.33
b. Terms/ rights attached to equity shares
The Company has only one class of equity shares having a par value of Re. 1 per share. Each holder of equity shares is entitled to one vote per share. The Company declares and pays dividend in Indian rupees. The dividend proposed by the Board of Directors is subject to the approval of the shareholders in the ensuing Annual General Meeting.
During the year ended 31st March 2014, the amount of per share dividend recognised as distributions to equity shareholders was Rs. 2.25 (Previous year - Rs. 2.25).
In the event of liquidation of the Company, the holders of equity shares will be entitled to receive remaining assets of the Company. The distribution will be in proportion to the number of equity shares held by the shareholders.
31st March 2014 31st March 2013
63
FDC LIMITED
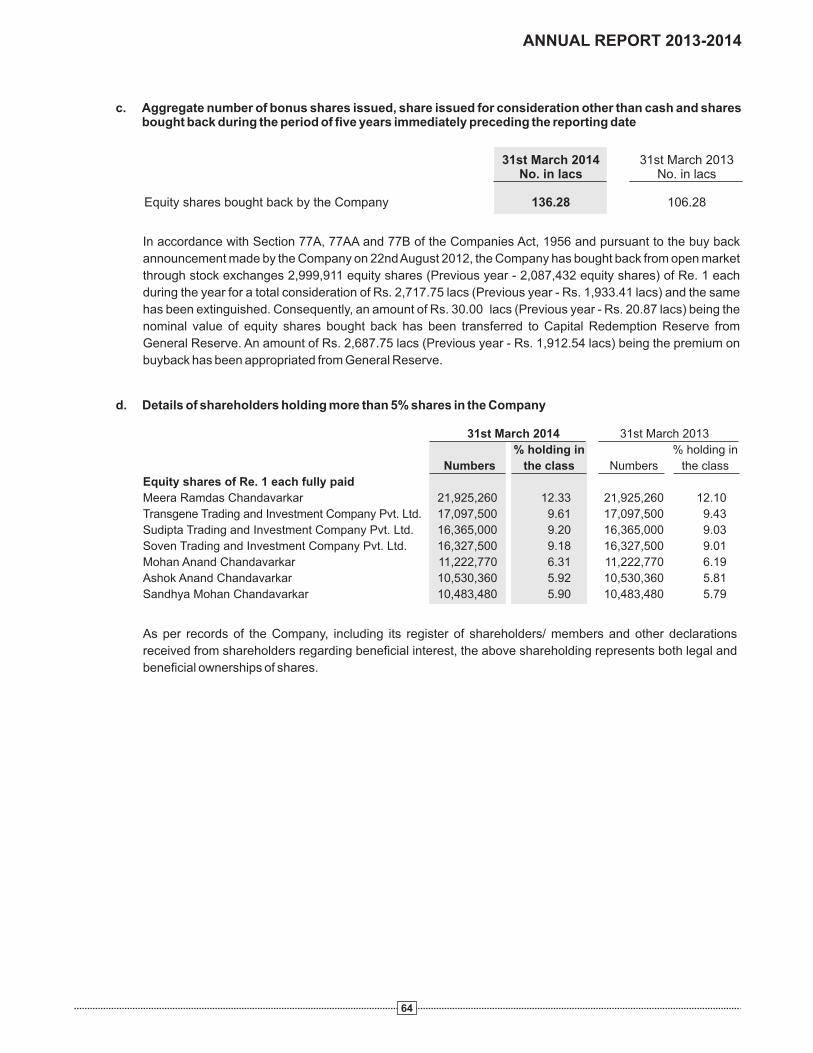
d. Details of shareholders holding more than 5% shares in the Company
31st March 2014 31st March 2013
% holding in % holding in
Numbers the class Numbers the class
Equity shares of Re. 1 each fully paid
Meera Ramdas Chandavarkar 21,925,260 12.33 21,925,260 12.10
Transgene Trading and Investment Company Pvt. Ltd. 17,097,500 9.61 17,097,500 9.43
Sudipta Trading and Investment Company Pvt. Ltd. 16,365,000 9.20 16,365,000 9.03
Soven Trading and Investment Company Pvt. Ltd. 16,327,500 9.18 16,327,500 9.01
Mohan Anand Chandavarkar 11,222,770 6.31 11,222,770 6.19
Ashok Anand Chandavarkar 10,530,360 5.92 10,530,360 5.81
Sandhya Mohan Chandavarkar 10,483,480 5.90 10,483,480 5.79
As per records of the Company, including its register of shareholders/ members and other declarations
received from shareholders regarding beneficial interest, the above shareholding represents both legal and
beneficial ownerships of shares.
31st March 2014 31st March 2013No. in lacs No. in lacs
Equity shares bought back by the Company 136.28 106.28
In accordance with Section 77A, 77AA and 77B of the Companies Act, 1956 and pursuant to the buy back
announcement made by the Company on 22nd August 2012, the Company has bought back from open market
through stock exchanges 2,999,911 equity shares (Previous year - 2,087,432 equity shares) of Re. 1 each
during the year for a total consideration of Rs. 2,717.75 lacs (Previous year - Rs. 1,933.41 lacs) and the same
has been extinguished. Consequently, an amount of Rs. 30.00 lacs (Previous year - Rs. 20.87 lacs) being the
nominal value of equity shares bought back has been transferred to Capital Redemption Reserve from
General Reserve. An amount of Rs. 2,687.75 lacs (Previous year - Rs. 1,912.54 lacs) being the premium on
buyback has been appropriated from General Reserve.
c. Aggregate number of bonus shares issued, share issued for consideration other than cash and shares bought back during the period of five years immediately preceding the reporting date
64
ANNUAL REPORT 2013-2014

31st March 2014 31st March 2013
Rupees in lacs Rupees in lacs
Capital Reserve (A) 268.27 268.27
Capital Redemption Reserve
Opening Balance 123.09 102.22
Add: Transfer from General Reserve on account of buy back of
equity shares (Refer Note No. 2c) 30.00 20.87
Closing Balance (B) 153.09 123.09
Securities Premium Account (C) 72.90 72.90
Revaluation Reserve
Opening Balance 57.37 65.39
Less: Transfer to Statement of Profit and Loss as reduction
from depreciation 8.02 8.02
Closing Balance (D) 49.35 57.37
General Reserve
Opening Balance 35,257.82 32,191.23
Less: Premium paid for buy back of equity shares (Refer Note No. 2c) 2,687.75 1,912.54
Less: Transfer to Capital Redemption Reserve Account
(Refer Note No. 2c) 30.00 20.87
Add: Transfer from surplus balance in the Statement of Profit and Loss 5,000.00 5,000.00
Closing Balance (E) 37,540.07 35,257.82
Surplus in the Statement of Profit and Loss
Opening Balance 40,855.43 35,063.37
Profit for the year 13,531.84 15,517.05
Add: Reversal of excess provision of dividend 43.71 -
Less: Appropriations
Proposed final equity dividend [Amount per share Rs. 2.25
(Previous year - Rs. 2.25)] 4,001.24 4,038.63
Tax on proposed equity dividend 680.01 686.36
Transfer to General Reserve 5,000.00 5,000.00
Net surplus in the Statement of Profit and Loss (F) 44,749.73 40,855.43
Translation Reserve
Opening Balance (26.66) (58.10)
Add/ (Less): Movement during the year (63.25) 31.44
Closing Balance (G) (89.91) (26.66)
Total (A+B+C+D+E+F+G) 82,743.50 76,608.22
3. Reserves and surplus
65
FDC LIMITED
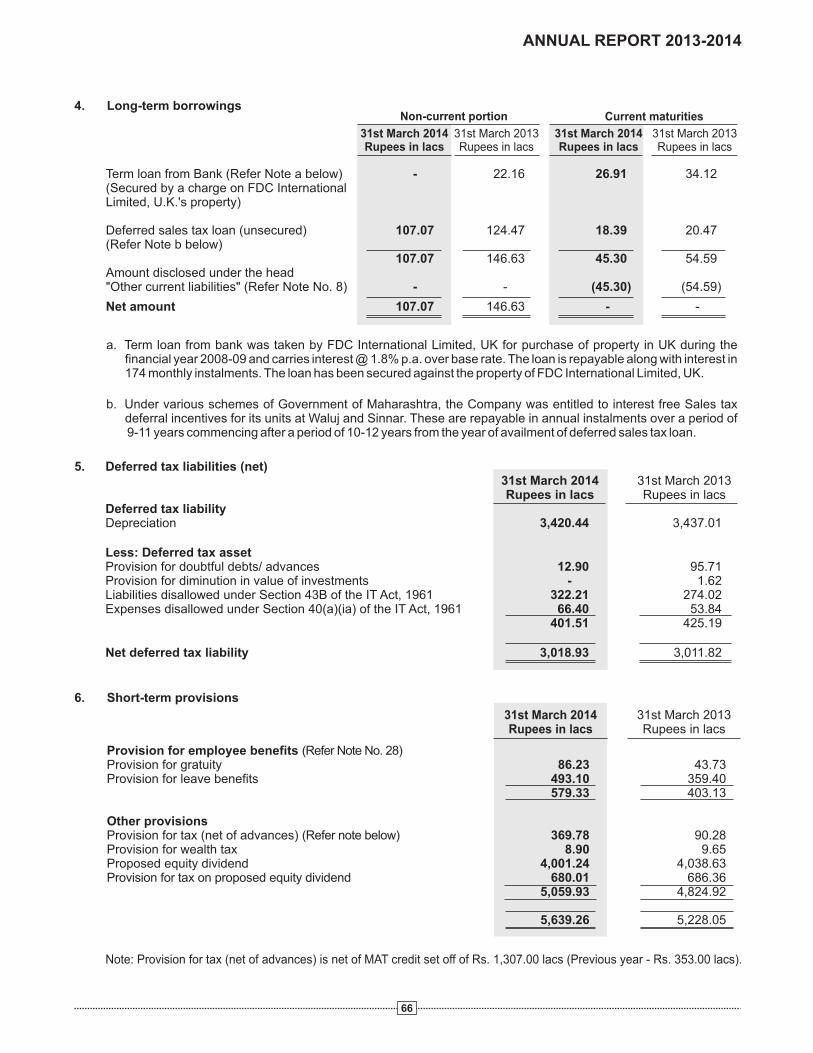
Term loan from Bank (Refer Note a below)(Secured by a charge on FDC International Limited, U.K.'s property)
Deferred sales tax loan (unsecured) 107.07 124.47 18.39 20.47 (Refer Note b below)
107.07 146.63 45.30 54.59 Amount disclosed under the head"Other current liabilities" (Refer Note No. 8) - - (45.30) (54.59)
Net amount 107.07 146.63 - -
- 22.16 26.91 34.12
31st March 2013Rupees in lacs
Non-current portion
31st March 2014Rupees in lacs
Current maturities
31st March 2013Rupees in lacs
31st March 2014Rupees in lacs
4. Long-term borrowings
a. Term loan from bank was taken by FDC International Limited, UK for purchase of property in UK during the financial year 2008-09 and carries interest @ 1.8% p.a. over base rate. The loan is repayable along with interest in 174 monthly instalments. The loan has been secured against the property of FDC International Limited, UK.
b. Under various schemes of Government of Maharashtra, the Company was entitled to interest free Sales tax deferral incentives for its units at Waluj and Sinnar. These are repayable in annual instalments over a period of 9-11 years commencing after a period of 10-12 years from the year of availment of deferred sales tax loan.
Provision for employee benefits (Refer Note No. 28)Provision for gratuity 86.23 43.73Provision for leave benefits 493.10 359.40
579.33 403.13
Other provisionsProvision for tax (net of advances) (Refer note below) 369.78 90.28 Provision for wealth tax 8.90 9.65 Proposed equity dividend 4,001.24 4,038.63 Provision for tax on proposed equity dividend 680.01 686.36
5,059.93 4,824.92
5,639.26 5,228.05
31st March 2013Rupees in lacs
31st March 2014Rupees in lacs
6. Short-term provisions
Note: Provision for tax (net of advances) is net of MAT credit set off of Rs. 1,307.00 lacs (Previous year - Rs. 353.00 lacs).
5. Deferred tax liabilities (net)31st March 2014 31st March 2013Rupees in lacs Rupees in lacs
Deferred tax liabilityDepreciation 3,420.44 3,437.01
Less: Deferred tax assetProvision for doubtful debts/ advances 12.90 95.71Provision for diminution in value of investments - 1.62 Liabilities disallowed under Section 43B of the IT Act, 1961 322.21 274.02 Expenses disallowed under Section 40(a)(ia) of the IT Act, 1961 66.40 53.84
401.51 425.19
Net deferred tax liability 3,018.93 3,011.82
66
ANNUAL REPORT 2013-2014

7. Short-term borrowings31st March 2014 31st March 2013Rupees in lacs Rupees in lacs
Loan from others (unsecured) (Refer note below) 110.57 114.07
110.57 114.07
Note: The loan is repayable on demand and carries interest @ 5% p.a.
8. Trade payables and Other current liabilities
31st March 2014 31st March 2013
Rupees in lacs Rupees in lacs
Trade payables (Refer Note a below) 7,882.21 6,103.73
Other current liabilities
Current maturities of long-term borrowings (Refer Note No. 4) 45.30 54.59
Interest accrued but not due on borrowings - 0.10
Interest accrued and due on borrowings 11.06 5.70
Investor Education and Protection Fund
(shall be credited as and when due by the following amount)
Unpaid dividend (Refer Note b below) 91.14 93.13
Advance from customers 359.93 86.84
Sundry deposits 1,226.04 1,158.11
Employee related liabilities 1,775.41 1,516.35
Others (includes dues to directors, statutory dues, rent deposit,
trade advances) 778.15 683.47
4,287.03 3,598.29
12,169.24 9,702.02
a. As per the information available with the Company, there are no Micro, Small and Medium Enterprises, as defined
in the Micro, Small, Medium Enterprises Development Act 2006, to whom the Company owes dues on account of
principal amount together with interest and accordingly no additional disclosure have been made. The Micro,
Small and Medium Enterprises has been determined to the extent such parties have been identified on the basis
of information available with the Company. This has been relied upon by the Auditors.
b. There are no amounts due and outstanding to be credited to Investor Education and Protection Fund.
67
FDC LIMITED
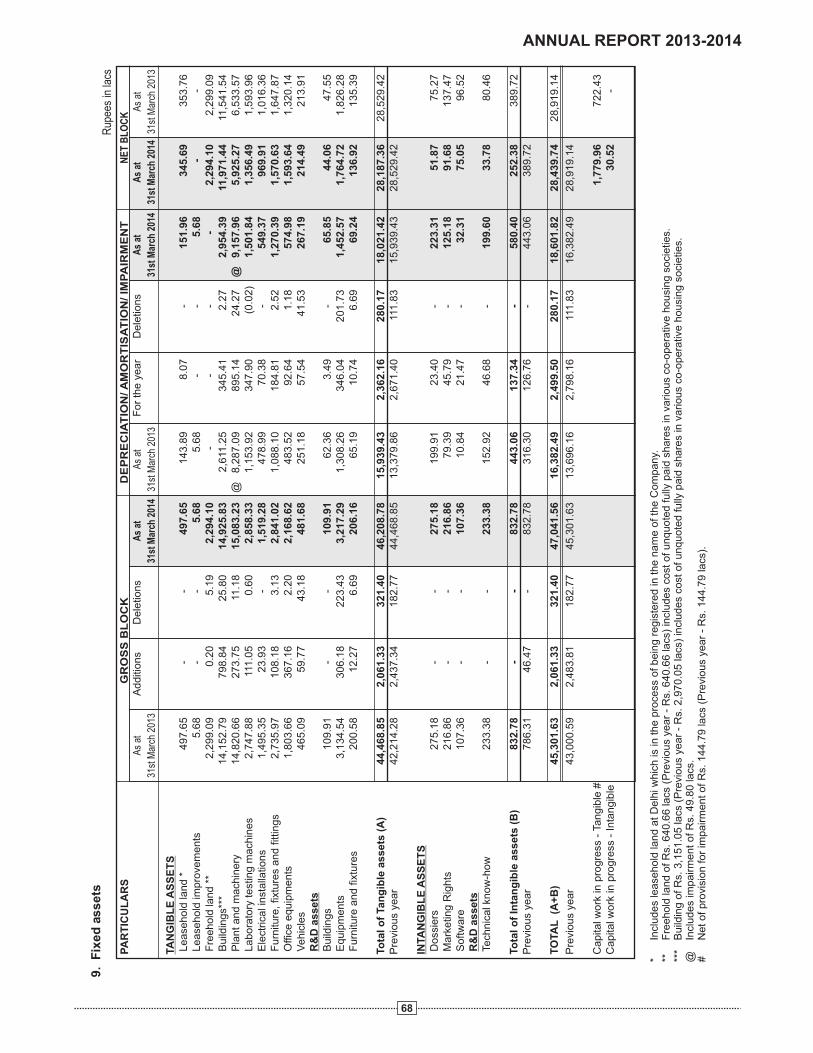
68
9. F
ixe
d a
ss
ets
Rup
ees
in la
cs
NE
T B
LO
CK
DE
PR
EC
IAT
ION
/ A
MO
RT
ISA
TIO
N/ IM
PA
IRM
EN
TP
AR
TIC
UL
AR
SA
s at
31st
Mar
ch 2
013
Additi
ons
Dele
tions
As
at
31st
Mar
ch 2
013
As
at
31st
Mar
ch 2
013
Fo
r th
e y
ea
rD
ele
tions
*In
cludes
lease
hold
land a
t D
elh
i whic
h is
in the p
roce
ss o
f bein
g r
egis
tere
d in
the n
am
e o
f th
e C
om
pany.
**F
reehold
land o
f R
s. 6
40.6
6 la
cs (
Pre
vious
year
- R
s. 6
40.6
6 la
cs)
incl
udes
cost
of unquote
d fully
paid
share
s in
various
co-o
pera
tive h
ousi
ng s
oci
etie
s.**
*B
uild
ing o
f R
s. 3
,151.0
5 la
cs (
Pre
vious
year
- R
s. 2
,970.0
5 la
cs)
incl
udes
cost
of unquote
d fully
paid
share
s in
various
co-o
pera
tive h
ousi
ng s
oci
etie
s.
@In
cludes
impairm
ent of R
s. 4
9.8
0 la
cs.
#N
et of pro
visi
on for
impairm
ent of R
s. 1
44.7
9 la
cs (
Pre
vious
year
- R
s. 1
44.7
9 la
cs).
As
at
31st
Mar
ch 2
014
As
at
31st
Mar
ch 2
014
As
at
31st
Mar
ch 2
014
TA
NG
IBL
E A
SS
ET
S
L
ease
hold
land *
497.6
5-
-497.6
5143.8
98.0
7-
151.9
6345.6
9353.7
6
Lease
hold
impro
vem
ents
5.6
8-
-5.6
85.6
8-
-5.6
8-
-
Fre
ehold
land *
*2,2
99.0
90.2
05.1
92,2
94.1
0-
--
-2,2
94.1
02,2
99.0
9
Build
ings*
**14,1
52.7
9798.8
425.8
014,9
25.8
32,6
11.2
5345.4
12.2
72,9
54.3
911,9
71.4
411
,541.5
4
Pla
nt and m
ach
inery
14,8
20.6
6273.7
511
.18
15,0
83.2
3@
8
,287.0
9895.1
424.2
7@
9
,157.9
65,9
25.2
76,5
33.5
7
Labora
tory
test
ing m
ach
ines
2,7
47.8
811
1.0
50.6
02,8
58.3
31,1
53.9
2347.9
0(0
.02)
1,5
01.8
41,3
56.4
91,5
93.9
6
Ele
ctrica
l inst
alla
tions
1,4
95.3
523.9
3-
1,5
19.2
8478.9
970.3
8-
549.3
7969.9
11,0
16.3
6
Furn
iture
, fix
ture
s and fitt
ings
2,7
35.9
7108.1
83.1
32,8
41.0
21,0
88.1
0184.8
12.5
21,2
70.3
91,5
70.6
31,6
47.8
7
Offic
e e
quip
me
nts
1,8
03.6
6367.1
62.2
02,1
68.6
2483.5
292.6
41.1
8574.9
81,5
93.6
41,3
20.1
4
Vehic
les
465.0
959.7
743.1
8481.6
8251.1
857.5
441.5
3267.1
9214.4
9213.9
1
R&
D a
ssets
Build
ings
109.9
1-
-109.9
162.3
63.4
9-
65.8
544.0
647.5
5
Equip
ments
3,1
34.5
4306.1
8223.4
33,2
17.2
91,3
08.2
6346.0
4201.7
31,4
52.5
71,7
64.7
21,8
26.2
8
Furn
iture
and fix
ture
s200.5
812.2
76.6
9206.1
665.1
910.7
46.6
969.2
4136.9
2135.3
9
To
tal o
f Tan
gib
le a
ssets
(A
)44,4
68.8
52,0
61.3
3321.4
046,2
08.7
815,9
39.4
32,3
62.1
6280.1
718,0
21.4
228,1
87.3
628,5
29.4
2
Pre
vious
year
42,2
14.2
82,4
37.3
4182.7
744,4
68.8
513,3
79.8
62,6
71.4
011
1.8
315,9
39.4
328,5
29.4
2
INTA
NG
IBL
E A
SS
ET
S
D
oss
iers
275.1
8-
-275.1
8199.9
123.4
0-
223.3
151.8
775.2
7
Mark
etin
g R
ights
216.8
6-
-216.8
679.3
945.7
9-
125.1
891.6
8137.4
7
Softw
are
107.3
6-
-107.3
610.8
421.4
7-
32.3
175.0
596.5
2
R&
D a
ssets
Tech
nic
al k
now
-how
233.3
8-
-233.3
8152.9
246.6
8-
199.6
033.7
880.4
6
To
tal o
f In
tan
gib
le a
ssets
(B
)832.7
8-
-832.7
8443.0
6137.3
4-
580.4
0252.3
8389.7
2
Pre
vious
year
786.3
146.4
7-
832.7
8316.3
0126.7
6-
443.0
6389.7
2
TO
TA
L (A
+B
)45,3
01.6
32,0
61.3
3321.4
047,0
41.5
616,3
82.4
92,4
99.5
0280.1
718,6
01.8
228,4
39.7
428,9
19.1
4
Pre
vious
year
43,0
00.5
92,4
83.8
1182.7
745,3
01.6
313,6
96.1
62,7
98.1
611
1.8
316,3
82.4
928,9
19.1
4
Capita
l work
in p
rogre
ss -
Tangib
le #
1,7
79.9
6722.4
3
Capita
l work
in p
rogre
ss -
Inta
ngib
le
30.5
2-
GR
OS
S B
LO
CK
ANNUAL REPORT 2013-2014
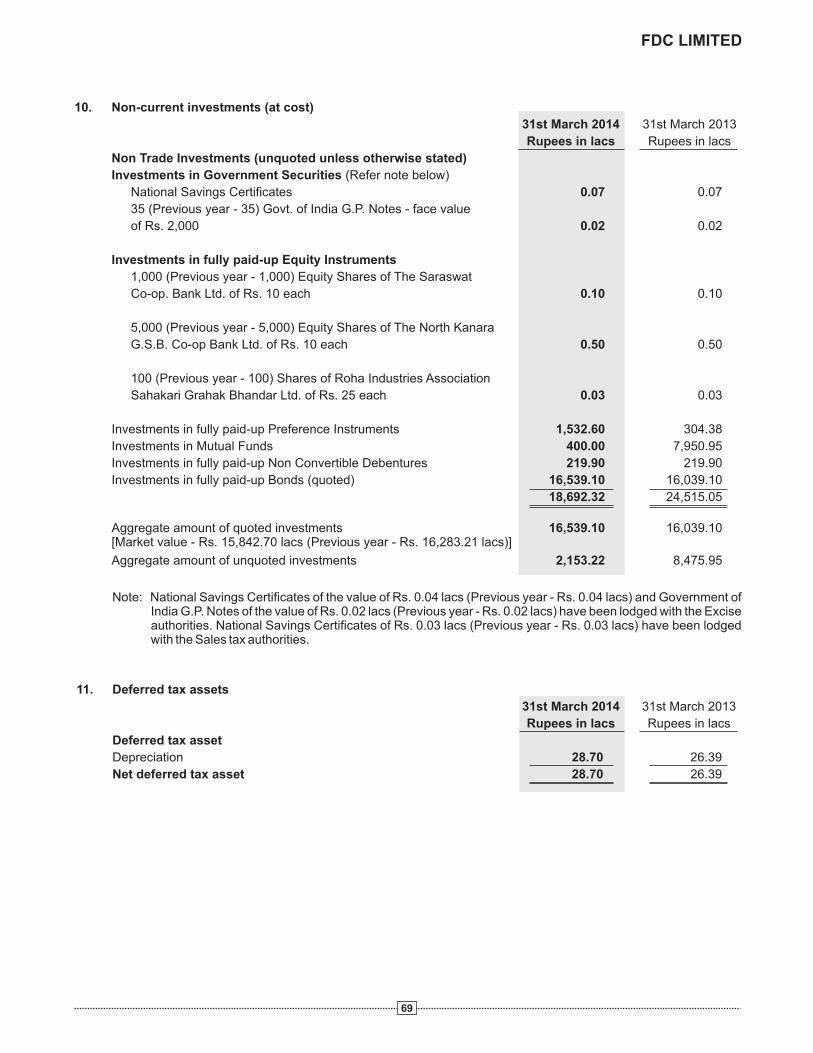
Note: National Savings Certificates of the value of Rs. 0.04 lacs (Previous year - Rs. 0.04 lacs) and Government of India G.P. Notes of the value of Rs. 0.02 lacs (Previous year - Rs. 0.02 lacs) have been lodged with the Excise authorities. National Savings Certificates of Rs. 0.03 lacs (Previous year - Rs. 0.03 lacs) have been lodged with the Sales tax authorities.
11. Deferred tax assets
31st March 2014 31st March 2013
Rupees in lacs Rupees in lacs
Deferred tax asset
Depreciation 28.70 26.39
Net deferred tax asset 28.70 26.39
10. Non-current investments (at cost)
31st March 2014 31st March 2013
Rupees in lacs Rupees in lacs
Non Trade Investments (unquoted unless otherwise stated)
Investments in Government Securities (Refer note below)
National Savings Certificates 0.07 0.07
35 (Previous year - 35) Govt. of India G.P. Notes - face value
of Rs. 2,000 0.02 0.02
Investments in fully paid-up Equity Instruments
1,000 (Previous year - 1,000) Equity Shares of The Saraswat
Co-op. Bank Ltd. of Rs. 10 each 0.10 0.10
5,000 (Previous year - 5,000) Equity Shares of The North Kanara
G.S.B. Co-op Bank Ltd. of Rs. 10 each 0.50 0.50
100 (Previous year - 100) Shares of Roha Industries Association
Sahakari Grahak Bhandar Ltd. of Rs. 25 each 0.03 0.03
Investments in fully paid-up Preference Instruments 1,532.60 304.38
Investments in Mutual Funds 400.00 7,950.95
Investments in fully paid-up Non Convertible Debentures 219.90 219.90
Investments in fully paid-up Bonds (quoted) 16,539.10 16,039.10
18,692.32 24,515.05
Aggregate amount of quoted investments 16,539.10 16,039.10 [Market value - Rs. 15,842.70 lacs (Previous year - Rs. 16,283.21 lacs)]
Aggregate amount of unquoted investments 2,153.22 8,475.95
69
FDC LIMITED

70
Non-current Current31st March 2014 31st March 2013 31st March 2014 31st March 2013Rupees in lacs Rupees in lacs Rupees in lacs Rupees in lacs
Capital advances
Unsecured, considered good (Refer note below) 12,421.71 455.24 - -
(A) 12,421.71 455.24 - -
Security depositsUnsecured, considered good 411.36 384.76 14.71 43.26 Unsecured, considered doubtful - 0.53 2.04 4.05
411.36 385.29 16.75 47.31 Less: Provision for doubtful security deposits - 0.53 2.04 4.05
(B) 411.36 384.76 14.71 43.26
Loans and advances to related partiesUnsecured, considered good (Refer Note No. 30) - - 104.17 108.44
(C) - - 104.17 108.44
Advances recoverable in cash or kindUnsecured, considered good - - 309.80 296.10Unsecured, considered doubtful - - 16.53 16.53
- - 326.33 312.63 Less: Provision for doubtful advances - - 16.53 16.53
(D) - - 309.80 296.10
Share/ Mutual Fund application money pending allotment
Unsecured, considered good - - - 1,046.42(E) - - - 1,046.42
Inter corporate depositsSecured, considered good - - - 500.00 Unsecured, considered good - - 25.00 1,025.00
(F) - - 25.00 1,525.00
Other loans and advancesUnsecured, considered good MAT credit entitlement - 622.00 - 685.00 Prepaid expenses 113.89 149.38 382.28 262.43 Loans/ advances to employees 38.36 50.98 78.19 86.79 Balances with statutory/ government authorities - - 979.06 744.81
(G) 152.25 822.36 1,439.53 1,779.03
Total (A+B+C+D+E+F+G) 12,985.32 1,662.36 1,893.21 4,798.25
Note: Capital advances include Rs. 11,500.00 lacs (Previous year - Rs. Nil) in Escrow Account towards purchase of land.
ANNUAL REPORT 2013-2014
12. Loans and advances
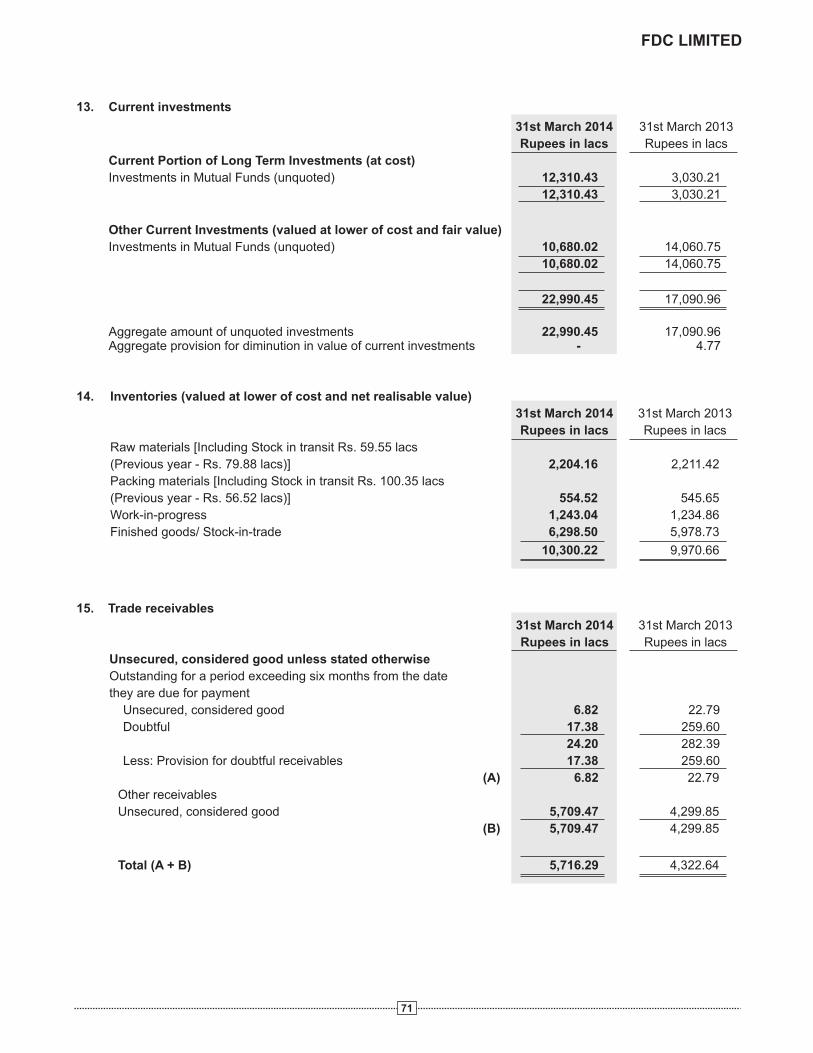
13. Current investments
31st March 2014 31st March 2013
Rupees in lacs Rupees in lacs
Current Portion of Long Term Investments (at cost)
Investments in Mutual Funds (unquoted) 12,310.43 3,030.21
12,310.43 3,030.21
Other Current Investments (valued at lower of cost and fair value)
Investments in Mutual Funds (unquoted) 10,680.02 14,060.75
10,680.02 14,060.75
22,990.45 17,090.96
Aggregate amount of unquoted investments 22,990.45 17,090.96 Aggregate provision for diminution in value of current investments - 4.77
14. Inventories (valued at lower of cost and net realisable value) 31st March 2014 31st March 2013
Rupees in lacs Rupees in lacs
Raw materials [Including Stock in transit Rs. 59.55 lacs
(Previous year - Rs. 79.88 lacs)] 2,204.16 2,211.42
Packing materials [Including Stock in transit Rs. 100.35 lacs
(Previous year - Rs. 56.52 lacs)] 554.52 545.65
Work-in-progress 1,243.04 1,234.86
Finished goods/ Stock-in-trade 6,298.50 5,978.73
10,300.22 9,970.66
15. Trade receivables
31st March 2014 31st March 2013
Rupees in lacs Rupees in lacs
Unsecured, considered good unless stated otherwise
Outstanding for a period exceeding six months from the date
they are due for payment
Unsecured, considered good 6.82 22.79
Doubtful 17.38 259.60
24.20 282.39
Less: Provision for doubtful receivables 17.38 259.60
(A) 6.82 22.79
Other receivables
Unsecured, considered good 5,709.47 4,299.85
(B) 5,709.47 4,299.85
Total (A + B) 5,716.29 4,322.64
71
FDC LIMITED

72
ANNUAL REPORT 2013-2014
16. Cash and bank balances
17. Other assets
Non-current Current
31st March 2014 31st March 2013 31st March 2014 31st March 2013
Rupees in lacs Rupees in lacs Rupees in lacs Rupees in lacs
Unsecured, considered good
Bank deposits with original maturity of more
than 12 months (Refer Note No. 16) - 0.24 - -
Margin money deposits (Refer Note No. 16) 18.89 0.98 - -
Receivable towards redemption of
mutual funds - - - 524.76
Interest/ premium accrued on investments - - 389.77 312.67
Interest accrued on others - - 38.89 54.48
Unamortised premium on investments 46.85 50.43 4.30 5.23
65.74 51.65 432.96 897.14
Non-current Current
31st March 2014 31st March 2013 31st March 2014 31st March 2013 Rupees in lacs Rupees in lacs Rupees in lacs Rupees in lacs Cash and cash equivalents
Balances with banks:
On current accounts - - 1,446.06 351.98
On unpaid dividend account - - 91.14 93.13
Cash on hand - - 13.37 15.81
- - 1,550.57 460.92
Other bank balances:
Bank deposits with original maturity of more
than 12 months - 0.24 - -
Bank deposits with original maturity of less
than 12 months - - 657.41 3,145.53
Margin money deposits 18.89 0.98 11.35 43.88
18.89 1.22 668.76 3,189.41
Amount disclosed under the head
“Other non-current assets” (18.89) (1.22) - -
(Refer Note No. 17)
- - 2,219.33 3,650.33
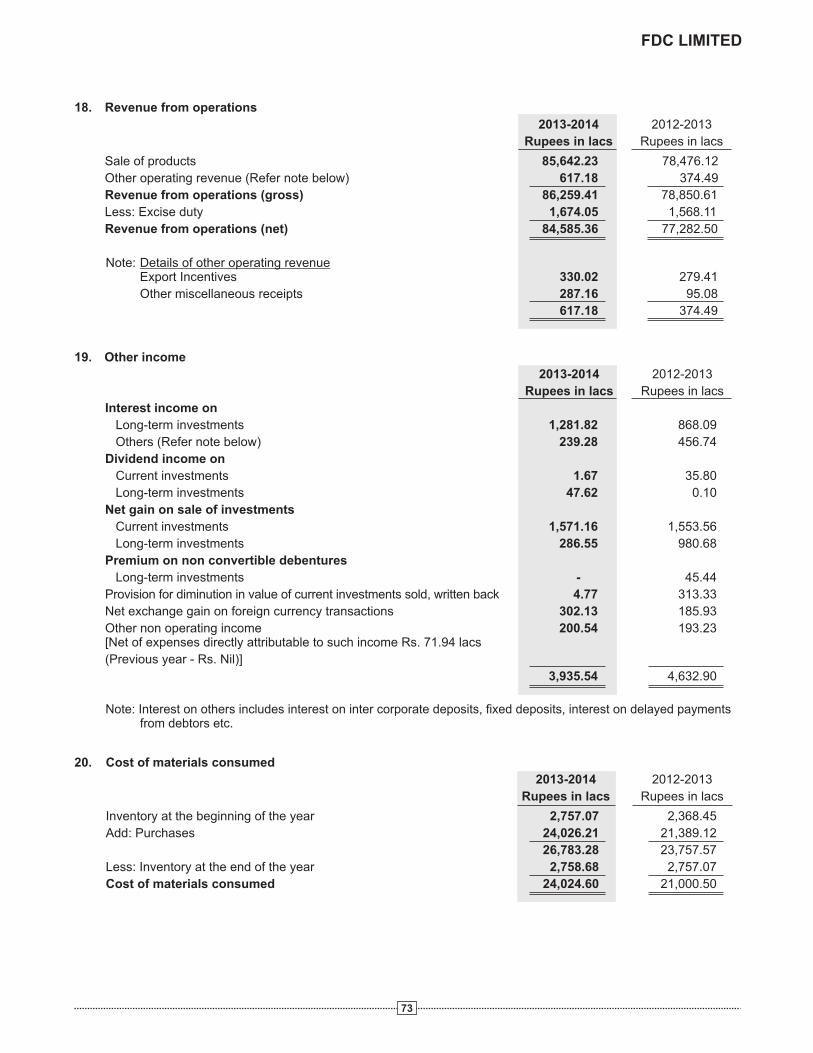
19. Other income
2013-2014 2012-2013
Rupees in lacs Rupees in lacs
Interest income on
Long-term investments 1,281.82 868.09
Others (Refer note below) 239.28 456.74
Dividend income on
Current investments 1.67 35.80
Long-term investments 47.62 0.10
Net gain on sale of investments
Current investments 1,571.16 1,553.56
Long-term investments 286.55 980.68
Premium on non convertible debentures
Long-term investments - 45.44
Provision for diminution in value of current investments sold, written back 4.77 313.33
Net exchange gain on foreign currency transactions 302.13 185.93
Other non operating income 200.54 193.23 [Net of expenses directly attributable to such income Rs. 71.94 lacs
(Previous year - Rs. Nil)]
3,935.54 4,632.90
Note: Interest on others includes interest on inter corporate deposits, fixed deposits, interest on delayed payments from debtors etc.
20. Cost of materials consumed 2013-2014 2012-2013
Rupees in lacs Rupees in lacs
Inventory at the beginning of the year 2,757.07 2,368.45
Add: Purchases 24,026.21 21,389.12
26,783.28 23,757.57
Less: Inventory at the end of the year 2,758.68 2,757.07
Cost of materials consumed 24,024.60 21,000.50
18. Revenue from operations
2013-2014 2012-2013
Rupees in lacs Rupees in lacs
Sale of products 85,642.23 78,476.12
Other operating revenue (Refer note below) 617.18 374.49
Revenue from operations (gross) 86,259.41 78,850.61
Less: Excise duty 1,674.05 1,568.11
Revenue from operations (net) 84,585.36 77,282.50
Note: Details of other operating revenueExport Incentives 330.02 279.41
Other miscellaneous receipts 287.16 95.08
617.18 374.49
73
FDC LIMITED
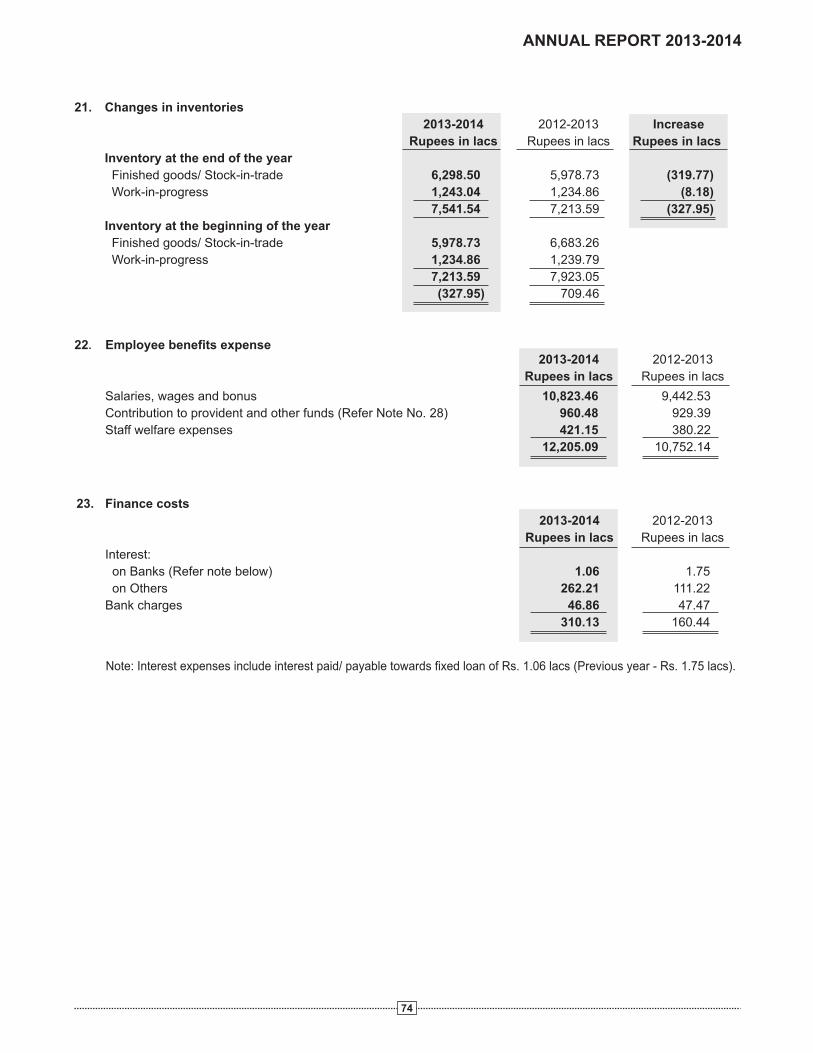
2013-2014 2012-2013
Rupees in lacs Rupees in lacs
Salaries, wages and bonus 10,823.46 9,442.53
Contribution to provident and other funds (Refer Note No. 28) 960.48 929.39
Staff welfare expenses 421.15 380.22
12,205.09 10,752.14
23. Finance costs 2013-2014 2012-2013
Rupees in lacs Rupees in lacs
Interest: on Banks (Refer note below) 1.06 1.75
on Others 262.21 111.22
Bank charges 46.86 47.47
310.13 160.44
Note: Interest expenses include interest paid/ payable towards fixed loan of Rs. 1.06 lacs (Previous year - Rs. 1.75 lacs).
21. Changes in inventories
2013-2014 2012-2013 Increase
Rupees in lacs Rupees in lacs Rupees in lacs
Inventory at the end of the year
Finished goods/ Stock-in-trade 6,298.50 5,978.73 (319.77)
Work-in-progress 1,243.04 1,234.86 (8.18)
7,541.54 7,213.59 (327.95)
Inventory at the beginning of the year
Finished goods/ Stock-in-trade 5,978.73 6,683.26
Work-in-progress 1,234.86 1,239.79
7,213.59 7,923.05
(327.95) 709.46
22. Employee benefits expense
74
ANNUAL REPORT 2013-2014
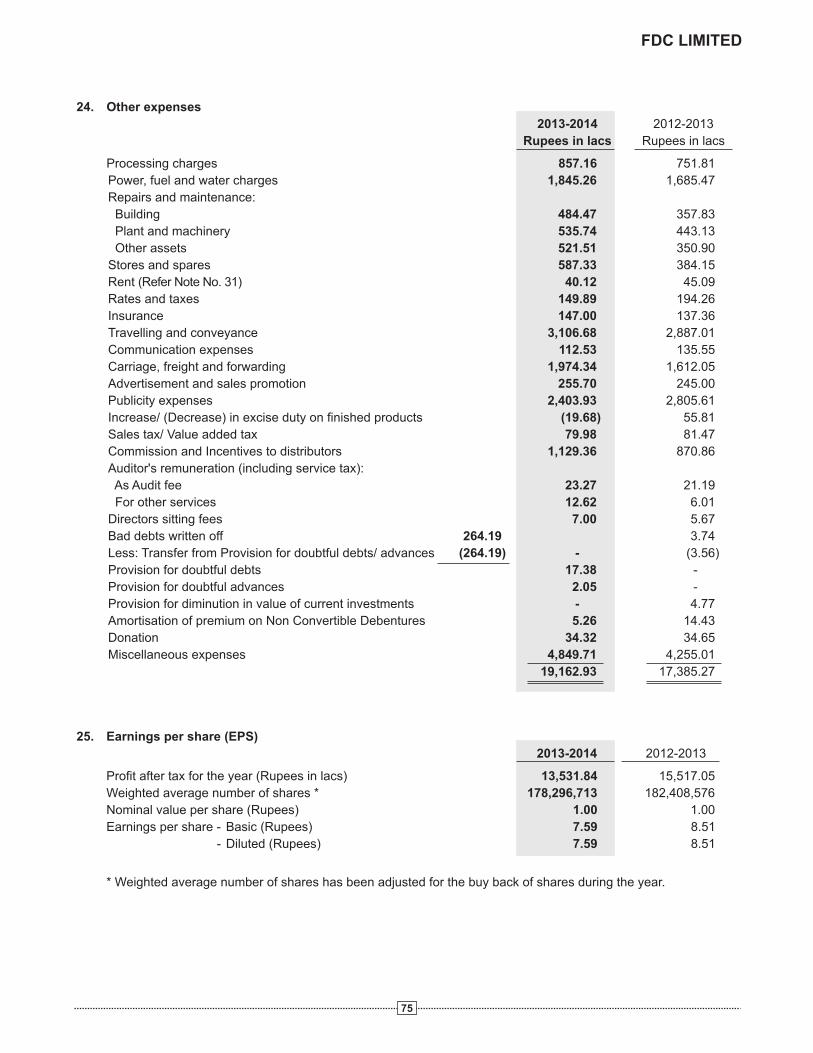
24. Other expenses
2013-2014 2012-2013
Rupees in lacs Rupees in lacs
Processing charges 857.16 751.81
Power, fuel and water charges 1,845.26 1,685.47
Repairs and maintenance:
Building 484.47 357.83
Plant and machinery 535.74 443.13
Other assets 521.51 350.90
Stores and spares 587.33 384.15
Rent (Refer Note No. 31) 40.12 45.09
Rates and taxes 149.89 194.26
Insurance 147.00 137.36
Travelling and conveyance 3,106.68 2,887.01
Communication expenses 112.53 135.55
Carriage, freight and forwarding 1,974.34 1,612.05
Advertisement and sales promotion 255.70 245.00
Publicity expenses 2,403.93 2,805.61
Increase/ (Decrease) in excise duty on finished products (19.68) 55.81
Sales tax/ Value added tax 79.98 81.47
Commission and Incentives to distributors 1,129.36 870.86
Auditor's remuneration (including service tax):
As Audit fee 23.27 21.19
For other services 12.62 6.01
Directors sitting fees 7.00 5.67
Bad debts written off 264.19 3.74
Less: Transfer from Provision for doubtful debts/ advances (264.19) - (3.56)
Provision for doubtful debts 17.38 -
Provision for doubtful advances 2.05 -
Provision for diminution in value of current investments - 4.77
Amortisation of premium on Non Convertible Debentures 5.26 14.43
Donation 34.32 34.65
Miscellaneous expenses 4,849.71 4,255.01
19,162.93 17,385.27
25. Earnings per share (EPS) 2013-2014 2012-2013
Profit after tax for the year (Rupees in lacs) 13,531.84 15,517.05
Weighted average number of shares * 178,296,713 182,408,576
Nominal value per share (Rupees) 1.00 1.00
Earnings per share - Basic (Rupees) 7.59 8.51
- Diluted (Rupees) 7.59 8.51
* Weighted average number of shares has been adjusted for the buy back of shares during the year.
75
FDC LIMITED
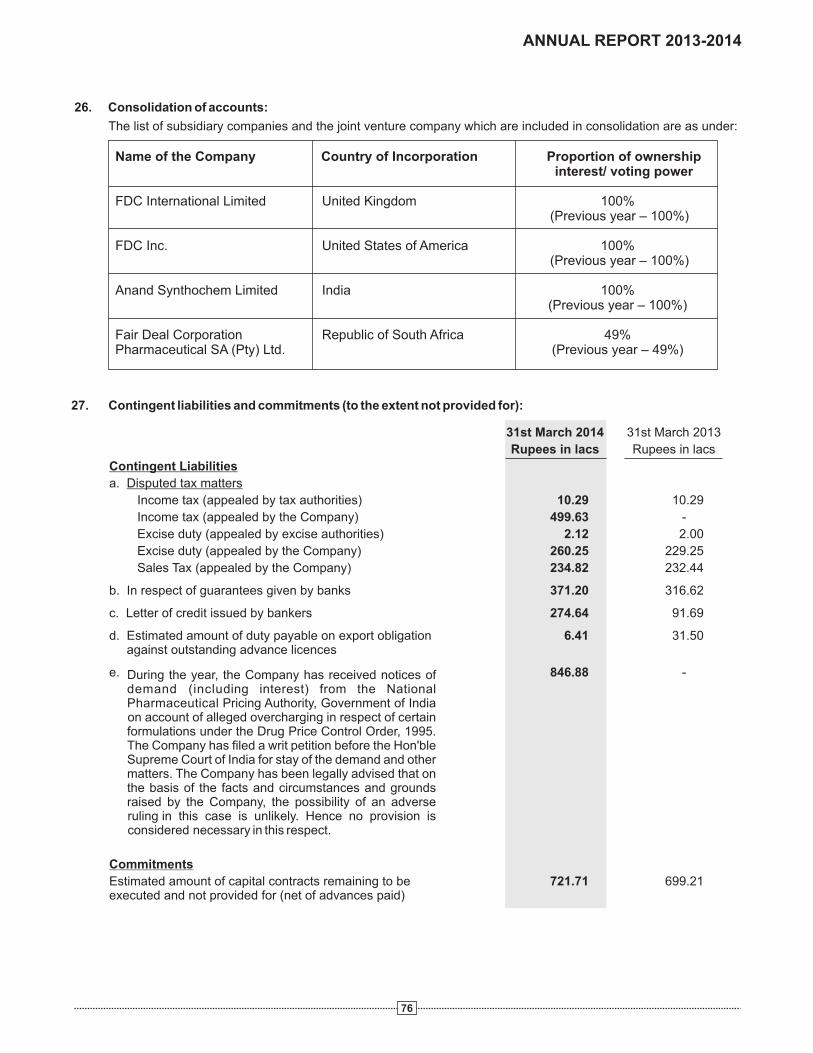
Name of the Company Country of Incorporation Proportion of ownership interest/ voting power
FDC International Limited United Kingdom 100% (Previous year – 100%)
FDC Inc. United States of America 100% (Previous year – 100%)
Anand Synthochem Limited India 100%(Previous year – 100%)
Fair Deal Corporation Republic of South Africa 49%Pharmaceutical SA (Pty) Ltd. (Previous year – 49%)
27. Contingent liabilities and commitments (to the extent not provided for):
31st March 2014 31st March 2013
Rupees in lacs Rupees in lacs
Contingent Liabilities
a. Disputed tax matters
Income tax (appealed by tax authorities) 10.29 10.29
Income tax (appealed by the Company) 499.63 -
Excise duty (appealed by excise authorities) 2.12 2.00
Excise duty (appealed by the Company) 260.25 229.25
Sales Tax (appealed by the Company) 234.82 232.44
b. In respect of guarantees given by banks 371.20 316.62
c. Letter of credit issued by bankers 274.64 91.69
d. Estimated amount of duty payable on export obligation 6.41 31.50 against outstanding advance licences
e. 846.88 -
Commitments
Estimated amount of capital contracts remaining to be 721.71 699.21executed and not provided for (net of advances paid)
26. Consolidation of accounts:
The list of subsidiary companies and the joint venture company which are included in consolidation are as under:
76
During the year, the Company has received notices ofdemand (including interest) from the NationalPharmaceutical Pricing Authority, Government of India on account of alleged overcharging in respect of certainformulations under the Drug Price Control Order, 1995.The Company has filed a writ petition before the Hon'bleSupreme Court of India for stay of the demand and othermatters. The Company has been legally advised that onthe basis of the facts and circumstances and groundsraised by the Company, the possibility of an adverse ruling in this case is unlikely. Hence no provision is considered necessary in this respect.
ANNUAL REPORT 2013-2014
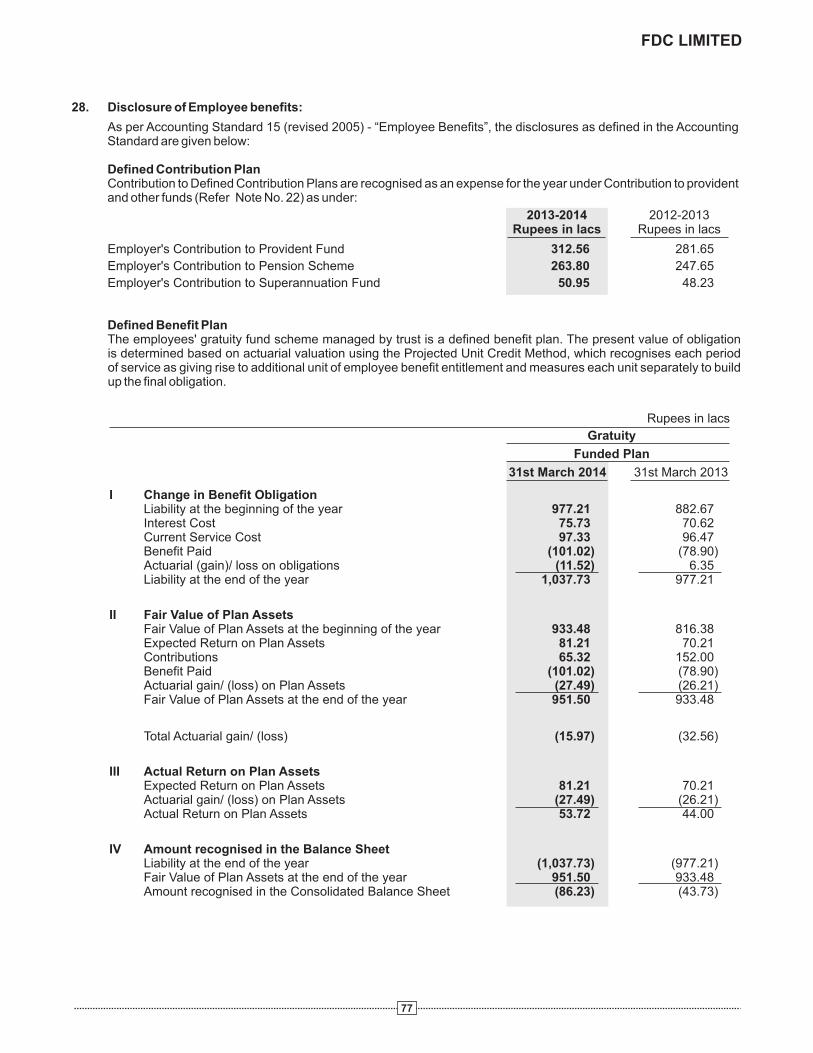
28. Disclosure of Employee benefits:
As per Accounting Standard 15 (revised 2005) - “Employee Benefits”, the disclosures as defined in the Accounting Standard are given below:
Defined Contribution Plan Contribution to Defined Contribution Plans are recognised as an expense for the year under Contribution to provident and other funds (Refer Note No. 22) as under:
2013-2014 2012-2013Rupees in lacs Rupees in lacs
Employer's Contribution to Provident Fund 312.56 281.65
Employer's Contribution to Pension Scheme 263.80 247.65
Employer's Contribution to Superannuation Fund 50.95 48.23
Defined Benefit PlanThe employees' gratuity fund scheme managed by trust is a defined benefit plan. The present value of obligation is determined based on actuarial valuation using the Projected Unit Credit Method, which recognises each period of service as giving rise to additional unit of employee benefit entitlement and measures each unit separately to build up the final obligation.
Rupees in lacs
Gratuity
Funded Plan
31st March 2014 31st March 2013
I Change in Benefit Obligation Liability at the beginning of the year 977.21 882.67 Interest Cost 75.73 70.62 Current Service Cost 97.33 96.47 Benefit Paid (101.02) (78.90) Actuarial (gain)/ loss on obligations (11.52) 6.35 Liability at the end of the year 1,037.73 977.21
II Fair Value of Plan Assets Fair Value of Plan Assets at the beginning of the year 933.48 816.38 Expected Return on Plan Assets 81.21 70.21 Contributions 65.32 152.00 Benefit Paid (101.02) (78.90) Actuarial gain/ (loss) on Plan Assets (27.49) (26.21) Fair Value of Plan Assets at the end of the year 951.50 933.48
Total Actuarial gain/ (loss) (15.97) (32.56)
III Actual Return on Plan Assets Expected Return on Plan Assets 81.21 70.21 Actuarial gain/ (loss) on Plan Assets (27.49) (26.21) Actual Return on Plan Assets 53.72 44.00
IV Amount recognised in the Balance Sheet Liability at the end of the year (1,037.73) (977.21) Fair Value of Plan Assets at the end of the year 951.50 933.48 Amount recognised in the Consolidated Balance Sheet (86.23) (43.73)
77
FDC LIMITED

Gratuity
Funded Plan
31st March 2014 31st March 2013
V Expenses recognised in the Statement of Profit and Loss
Current Service Cost 97.33 96.47
Interest Cost 75.73 70.62
Expected Return on Plan Assets (81.21) (70.21)
Net Actuarial (gain)/ loss 15.97 32.56
Expense recognised in the Consolidated Statement of
Profit and Loss 107.82 129.44
VI Balance Sheet Reconciliation
Opening Net Liability 43.73 66.29
Expense as above 107.82 129.44
Employer's Contribution (65.32) (152.00)
Amount recognised in the Consolidated Balance Sheet 86.23 43.73
VII Investment Details
Government of India Assets 312.89 318.55
Corporate Bonds 372.66 353.41
State Government 178.70 178.70
Equity 71.87 71.86
Others 15.38 10.96
Total 951.50 933.48
VIII Actuarial Assumptions
Discount Rate Current 8.75% 7.75%
Rate of Return on Plan Assets Current 8.70% 8.70%
Salary Escalation Current 7.00% 7.00%
Rupees in lacs
Defined Benefit Obligation 1,037.73 977.21 882.67 730.88 607.25
Plan Assets 951.50 933.48 816.38 703.06 396.41
Deficit/ (Surplus) 86.23 43.73 66.29 27.82 210.84
Net Actuarial (Gain)/ Loss due to Experience
adjustments on Plan Liabilities 24.06 (17.94) (103.18) 8.41 (63.99)
Net Actuarial Gain/ (Loss) due to Experience
adjustments on Plan Assets (27.49) (26.21) (2.63) (9.28) (19.79)
IX Experience Adjustments
31st March 2010
31st March 2014
31st March 2013
31st March 2012
31st March 2011
X Salary Escalation Rate The estimates of future salary increases considered in actuarial valuation is taken on account of inflation,
seniority, promotion and other relevant factors, such as supply and demand in the employment market.
XI Basis used to determine Expected Rate of Return on Plan AssetsThe expected rate of return on Plan Assets is based on expectation of the average long term rate of return expected on investments of the fund during the estimated term of the obligations.
XII The Company expects to contribute Rs. 191.12 lacs to gratuity in next year (Previous year - Rs. 141.05 lacs).
The liability for leave encashment as at the year end is Rs. 433.13 lacs (Previous year - Rs. 322.17 lacs) and provision for sick leave as at the year end is Rs. 59.97 lacs (Previous year - Rs. 37.23 lacs).
78
ANNUAL REPORT 2013-2014
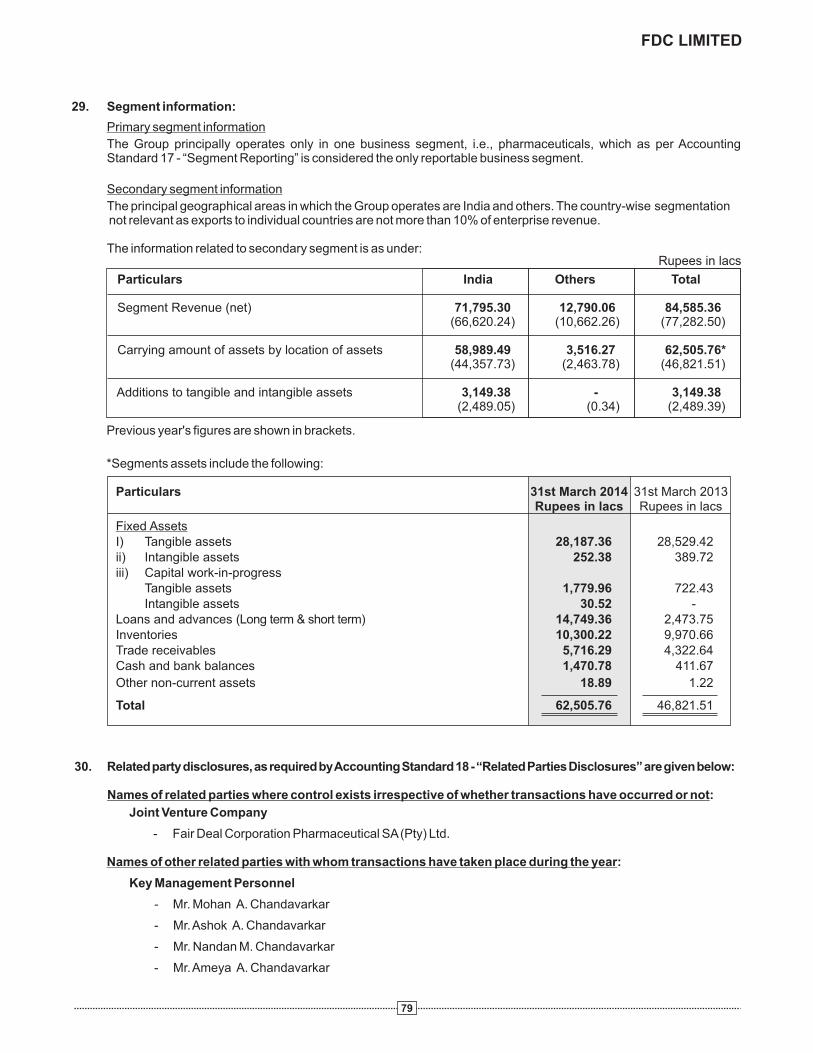
29. Segment information:
Primary segment information
The Group principally operates only in one business segment, i.e., pharmaceuticals, which as per Accounting Standard 17 - “Segment Reporting” is considered the only reportable business segment.
Secondary segment information
The principal geographical areas in which the Group operates are India and others. The country-wise segmentation not relevant as exports to individual countries are not more than 10% of enterprise revenue.
The information related to secondary segment is as under:
79
Rupees in lacs
Particulars India Others Total
Segment Revenue (net) 71,795.30 12,790.06 84,585.36(66,620.24) (10,662.26) (77,282.50)
Carrying amount of assets by location of assets 58,989.49 3,516.27 62,505.76*(44,357.73) (2,463.78) (46,821.51)
Additions to tangible and intangible assets 3,149.38 - 3,149.38 (2,489.05) (0.34) (2,489.39)
Previous year's figures are shown in brackets.
*Segments assets include the following:
Particulars 31st March 2014 31st March 2013 Rupees in lacs Rupees in lacs
Fixed Assets I) Tangible assets 28,187.36 28,529.42ii) Intangible assets 252.38 389.72iii) Capital work-in-progress Tangible assets 1,779.96 722.43 Intangible assets 30.52 -Loans and advances (Long term & short term) 14,749.36 2,473.75Inventories 10,300.22 9,970.66Trade receivables 5,716.29 4,322.64Cash and bank balances 1,470.78 411.67
Other non-current assets 18.89 1.22
Total 62,505.76 46,821.51
30. Related party disclosures, as required by Accounting Standard 18 - “Related Parties Disclosures” are given below:
Names of related parties where control exists irrespective of whether transactions have occurred or not:
Joint Venture Company
- Fair Deal Corporation Pharmaceutical SA (Pty) Ltd.
Names of other related parties with whom transactions have taken place during the year:
Key Management Personnel
- Mr. Mohan A. Chandavarkar
- Mr. Ashok A. Chandavarkar
- Mr. Nandan M. Chandavarkar
- Mr. Ameya A. Chandavarkar
FDC LIMITED
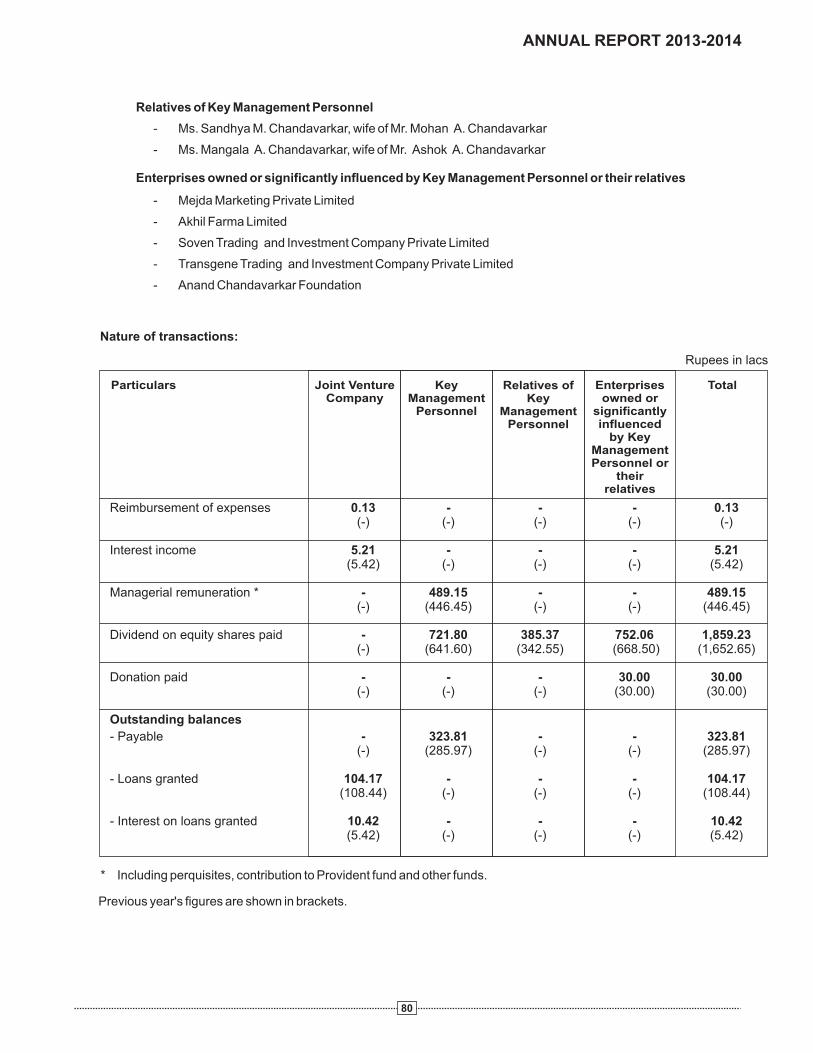
80
* Including perquisites, contribution to Provident fund and other funds.
Previous year's figures are shown in brackets.
Nature of transactions:
Total
Reimbursement of expenses 0.13 - - - 0.13(-) (-) (-) (-) (-)
Interest income 5.21 - - - 5.21(5.42) (-) (-) (-) (5.42)
Managerial remuneration * - 489.15 - - 489.15(-) (446.45) (-) (-) (446.45)
Dividend on equity shares paid - 721.80 385.37 752.06 1,859.23(-) (641.60) (342.55) (668.50) (1,652.65)
Donation paid - - - 30.00 30.00(-) (-) (-) (30.00) (30.00)
Outstanding balances
- Payable - 323.81 - - 323.81(-) (285.97) (-) (-) (285.97)
- Loans granted 104.17 - - - 104.17(108.44) (-) (-) (-) (108.44)
- Interest on loans granted 10.42 - - - 10.42 (5.42) (-) (-) (-) (5.42)
Particulars Joint VentureCompany
Key Management
Personnel
Relatives of Key
ManagementPersonnel
Enterprisesowned or
significantlyinfluenced
by KeyManagementPersonnel or
theirrelatives
Rupees in lacs
Relatives of Key Management Personnel
- Ms. Sandhya M. Chandavarkar, wife of Mr. Mohan A. Chandavarkar
- Ms. Mangala A. Chandavarkar, wife of Mr. Ashok A. Chandavarkar
Enterprises owned or significantly influenced by Key Management Personnel or their relatives
- Mejda Marketing Private Limited
- Akhil Farma Limited
- Soven Trading and Investment Company Private Limited
- Transgene Trading and Investment Company Private Limited
- Anand Chandavarkar Foundation
ANNUAL REPORT 2013-2014
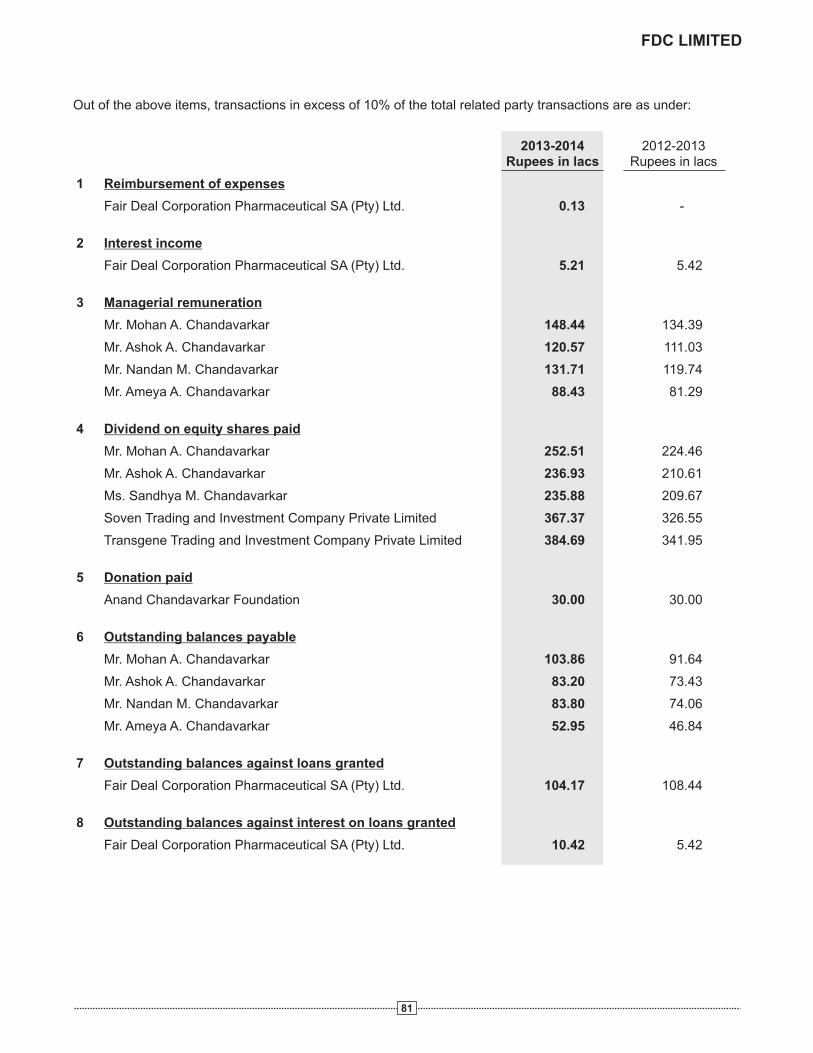
81
Out of the above items, transactions in excess of 10% of the total related party transactions are as under:
2013-2014 2012-2013 Rupees in lacs Rupees in lacs
1 Reimbursement of expenses
Fair Deal Corporation Pharmaceutical SA (Pty) Ltd. 0.13 -
2 Interest income
Fair Deal Corporation Pharmaceutical SA (Pty) Ltd. 5.21 5.42
3 Managerial remuneration
Mr. Mohan A. Chandavarkar 148.44 134.39
Mr. Ashok A. Chandavarkar 120.57 111.03
Mr. Nandan M. Chandavarkar 131.71 119.74
Mr. Ameya A. Chandavarkar 88.43 81.29
4 Dividend on equity shares paid
Mr. Mohan A. Chandavarkar 252.51 224.46
Mr. Ashok A. Chandavarkar 236.93 210.61
Ms. Sandhya M. Chandavarkar 235.88 209.67
Soven Trading and Investment Company Private Limited 367.37 326.55
Transgene Trading and Investment Company Private Limited 384.69 341.95
5 Donation paid
Anand Chandavarkar Foundation 30.00 30.00
6 Outstanding balances payable
Mr. Mohan A. Chandavarkar 103.86 91.64
Mr. Ashok A. Chandavarkar 83.20 73.43
Mr. Nandan M. Chandavarkar 83.80 74.06
Mr. Ameya A. Chandavarkar 52.95 46.84
7 Outstanding balances against loans granted
Fair Deal Corporation Pharmaceutical SA (Pty) Ltd. 104.17 108.44
8 Outstanding balances against interest on loans granted
Fair Deal Corporation Pharmaceutical SA (Pty) Ltd. 10.42 5.42
FDC LIMITED

82
1. Fair Deal Corporation Republic of South Africa 49% 49%Pharmaceutical SA (Pty) Ltd.
Sr.No.
Name Country of Incorporation Percentage of Ownership
Interest as on 31st March 2014
Percentage of Ownership
Interest as on 31st March 2013
The Group's Statement of Profit and Loss, Balance Sheet and Cash Flow Statement incorporate the Group's share of income, expenses, assets and liabilities of Fair Deal Corporation Pharmaceutical SA (Pty) Ltd. on line by line basis to the extent of 49% shareholding.
33. Foreign currency transactions/ balances of the Group are not hedged by derivative instruments or otherwise. The details of foreign currency transactions/ balances of the Group are:
Balances Foreign currency amount Equivalent amount Rupees in lacs
31st March2014
31st March2013
31st March2014
31st March2013
Bank balances USD 1,326,724 828,934 787.70 446.34 EUR 63,169 58,430 51.65 40.00 GBP 353,703 12,880 347.82 10.43 JPY 18,200,000 - 105.56 -
Trade receivables USD 3,302,588 2,256,137 1,964.87 1,201.57 EUR 67,308 116,920 54.82 80.22 GBP - 46,615 - 37.80 JPY - 7,950,000 - 45.29
Loans and advances USD 108,258 140,300 63.98 75.20 EUR 4,925 - 3.99 - ZAR 2,133,912 2,036,916 114.59 113.86
Trade payables USD 865,362 482,822 524.19 265.90 EUR 115,063 103,596 96.54 73.34
GBP 3,224 6,222 3.28 5.21
31. Pursuant to Accounting Standard 19 - “Leases”, disclosure on leases is as follows: The Group's significant leasing arrangements are in respect of godowns/ office premises taken on operating lease basis. The aggregate lease rentals payable are charged as Rent and shown under ‘Other Expenses’ (Refer Note No. 24).
These leasing arrangements, which are cancellable, range between 1 year and 5 years generally, or longer, and are usually renewable by mutual consent on mutually agreeable terms. There are certain agreements which provide for increase in rent. There are no sub-leases.
32. Pursuant to the Accounting Standard 27 - “Financial Reporting of interests in Joint Ventures”, the disclosures relating to the Joint Venture Company is as follows:
34. Revenue expenditure on research and development (including depreciation and amortisation) aggregating to Rs. 1,987.31 lacs (Previous year - Rs. 2,082.45 lacs) is included under relevant heads in the Consolidated Statement of Profit and Loss.
ANNUAL REPORT 2013-2014

83
35. Costs of samples, manufactured and purchased, have been included in Cost of materials consumed and Purchases of stock-in-trade respectively.
36. Previous year's figures have been regrouped/ reclassified, wherever necessary to conform to this year's classification.
As per our report of even date
For S.R. BATLIBOI & CO. LLPChartered AccountantsFirm Registration No. 301003E
per VIJAY MANIARPartner Membership No. 36738
For and on behalf of the Board of Directors
MOHAN A. CHANDAVARKAR Chairman and Managing Director
ASHOK A. CHANDAVARKARDirector
VARSHARANI KATRECompany Secretary
Place : Mumbai Date : May 29, 2014
Place : Mumbai Date : May 29, 2014
FDC LIMITED
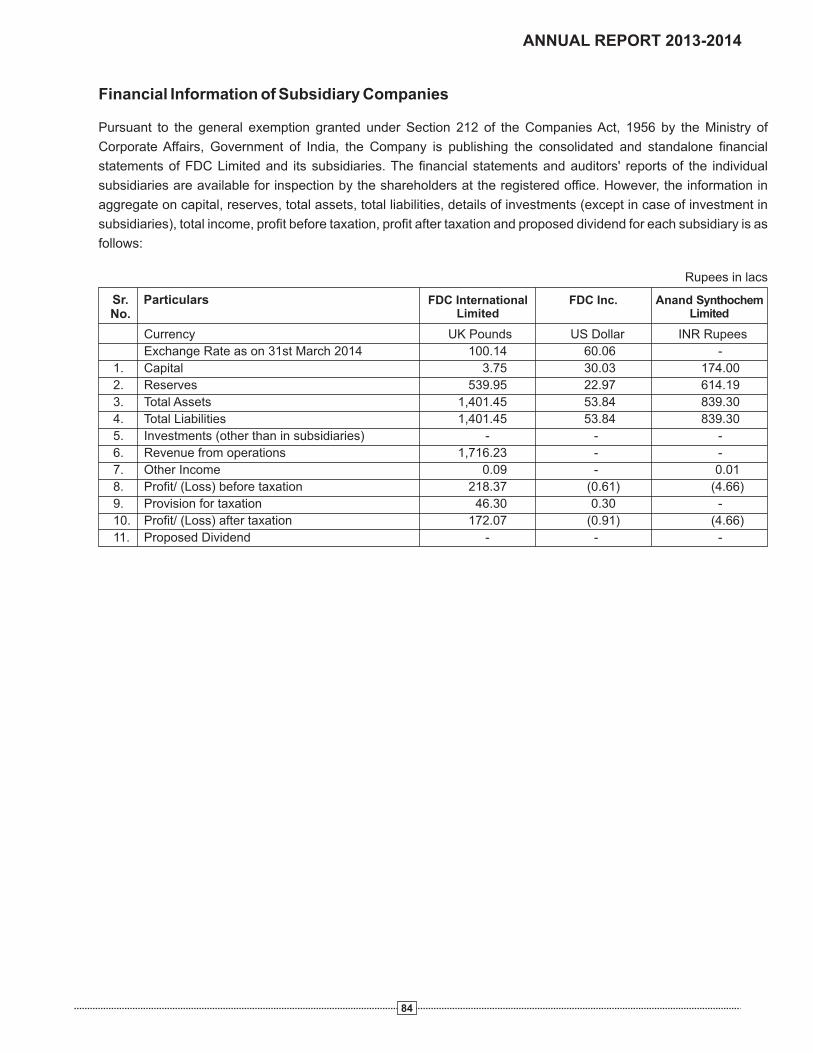
84
ANNUAL REPORT 2013-2014
Financial Information of Subsidiary Companies
Pursuant to the general exemption granted under Section 212 of the Companies Act, 1956 by the Ministry of
Corporate Affairs, Government of India, the Company is publishing the consolidated and standalone financial
statements of FDC Limited and its subsidiaries. The financial statements and auditors' reports of the individual
subsidiaries are available for inspection by the shareholders at the registered office. However, the information in
aggregate on capital, reserves, total assets, total liabilities, details of investments (except in case of investment in
subsidiaries), total income, profit before taxation, profit after taxation and proposed dividend for each subsidiary is as
follows:
FDC InternationalLimited
Sr. No.
Particulars FDC Inc. Anand Synthochem Limited
Currency UK Pounds US Dollar INR Rupees
Exchange Rate as on 31st March 2014 100.14 60.06 -
1. Capital 3.75 30.03 174.00
2. Reserves 539.95 22.97 614.19
3. Total Assets 1,401.45 53.84 839.30
4. Total Liabilities 1,401.45 53.84 839.30
5. Investments (other than in subsidiaries) - - -
6. Revenue from operations 1,716.23 - -
7. Other Income 0.09 - 0.01
8. Profit/ (Loss) before taxation 218.37 (0.61) (4.66)
9. Provision for taxation 46.30 0.30 -
10. Profit/ (Loss) after taxation 172.07 (0.91) (4.66)
11. Proposed Dividend - - -
Rupees in lacs