annual report - west end state school€¦ · 1 west end state school 2016 annual report queensland...
TRANSCRIPT

1
West End State School
2016 ANNUAL REPORT
Queensland State School Reporting
Inspiring minds. Creating opportunities. Shaping Queensland’s future. Every student succeeding. State Schools Strategy 2016-2020
Department of Education and Training

2
Contact Information
Postal address: 24 Vulture Street West End 4101
Phone: (07) 3010 8222
Fax: (07) 3010 8200
Email: principal@w estendss.eq.edu.au
Webpages: Additional reporting information pertaining to Queensland state schools is located on the My
School w ebsite and the Queensland Government data w ebsite.
Contact Person: Kim McNamara (Principal)

3
School Overview
SCHOOL PROFILE West End State School is a large, inner-city, primary school located just outside the Brisbane CBD. We
cater for students from prep to year 6. Established in 1875, w e take great pride in our history and boast
many multi-generational families in our school community.
West End State School is an Independent Public School, in recognition of its high quality educational
opportunities for students. Our goal is to develop clever, skilled and creative West End State School
students.
At West End State School, w e aim to provide a happy, safe and inclusive environment for all of our students. An environment
w here diversity is embraced and w here we all smile in the same language!
OUR VISION
Clever, skilled and creative West End students OUR PURPOSE AND VALUES
At West End State School w e embrace a multicultural approach to living and learning through valuing: Lifelong Learning; Productive Teaching and Learning Reflective and Active Citizenship Diversity and Difference
Social justice and Inclusion Sense of Community
As a community, w e have worked hard to provide our students w ith a holistic experience of school which integrates community and cultural experiences with academic rigour and purpose. The school underw ent a Quadrennial School Review during 2015. This process included a School Self - Determined Review
In 2016 the school community used the information gained in these tw o processes to develop the next iteration of its School Strategic Plan (SSP).
Principal’s Foreword
This School Annual Report provides a clear and concise summary of the achievements and activities of 2016 as w ell as aspirations for 2017 for West End State School. Information includes contextual information about w ho w e are; summative information about some of our achievements for the 2016 school year and an outline of our future expectations.
Whilst w e are proud of our academic performance, education at West End State School means so much more. Our
exceptional teachers are professionals who are always willing to go the extra mile to ensure that all students are offered the
opportunity to fulf il their potential both w ithin and beyond the classroom. We are acutely aw are of our obligation to prepare
young people to make their w ay in the w orld as confident, caring and responsible citizens.

4
Introduction
School Progress towards its goals in 2016
In 2016, WESS began a new cycle of its School Strategic Plan (SSP):

5
To support this new SSP, new Professional Learning Communities (PLCs) were formed ensuring representation of staff from every year level. New Action Plans, for implementation from 2016 - 2019 w ere developed by these teams.
Priority Area Key Strategies Implemented in 2016
1. STEAM Science, Technology and Engineering:
Began to unpack the Design Thinking Framew ork to refocus and reinvigorate the
Science, Technology and Engineering Curriculum to engage our students (4C’s
- collaboration, communication, creativity and critical thinking) Science Week Extravaganza – involving partnership schools
Developed a plan to increase teacher capabilities in ICT and student access to
ICT
The Arts:
WESS Art Show – showcasing The Arts
Began to explore community links to enhance The Arts experiences for WESS
students Began to investigate the 4C’s as framew ork for planning in The Arts
Mathematics:
Surveyed students about attitude tow ards maths
Collated data and presented f indings to staff and students
Investigated Grow th Mindset
Worked on F4L to develop pre/post formative/summative assessments
ICT:
Stocktake of school devices
Purchased laptops & trolleys for Year 6 classrooms
Purchase, set up and deployed teacher iPads
Purchased iPad trolley for future iPad purchase, storage and borrowing for class
use
Sourced reliable tech support
Developed an SSP ICT plan using the “8 Elements framew ork”
Developed a partnership w ith Apple and BSHS
2. Reading Comprehension and Writing
Reading:
Continued to support the embedding of Guided Reading in all classrooms through:
Classroom observations and feedback
Staff induction and professional development
Writing:
Trialed and review ed the w riting program “Quick w rites” with SSP team members
Constructed a document for consistent approach to w riting program using trial data
and feedback Film vignettes for PD to support introduction of ‘Quick Writes” across the school
3. Data Driven Accountability
Published and reviewed the 1st draft of DIG (Data Implementation Guide) w hich
aims to develop consistency across the school
Developed a framew ork for WESS’s School Data Plan and al its components
Future Outlook
In 2017 w e will sharpen and narrow
this focus on the f ive School Strategic Plan (SSP) focus areas.
In addit ion to these areas, Prep and Year 1 teachers will implement Age Appropriate Pedagogies.
6
Our School at a Glance
School Profile
Coeducational or single sex: Coeducational
Independent Public School: Yes
Year levels offered in 2016: Prep Year - Year 6
Student enrolments for this school:
Total Girls Boys Indigenous
Enrolment Continuity
(Feb – Nov)
2014 825 391 434 12 96%
2015* 783 354 429 7 94%
2016 854 379 475 11 95%
Student counts are based on the Census (August) enrolment collection.
*From 2015, data f or all state high schools include Year 7 students. Prior to 2015, only state high schools off ering Year 7 had these students
included in their counts.
In 2016, there w ere no students enrolled in a pre-Prep** program.
** pre-Prep is a kindergarten program f or Aboriginal and Torres Strait Islander children, liv ing across 35 Aboriginal and Torres Strait Islander
communities, in the y ear bef ore school (http://deta.qld.gov .au/early childhood/f amilies/pre-prep-indigenous.html).
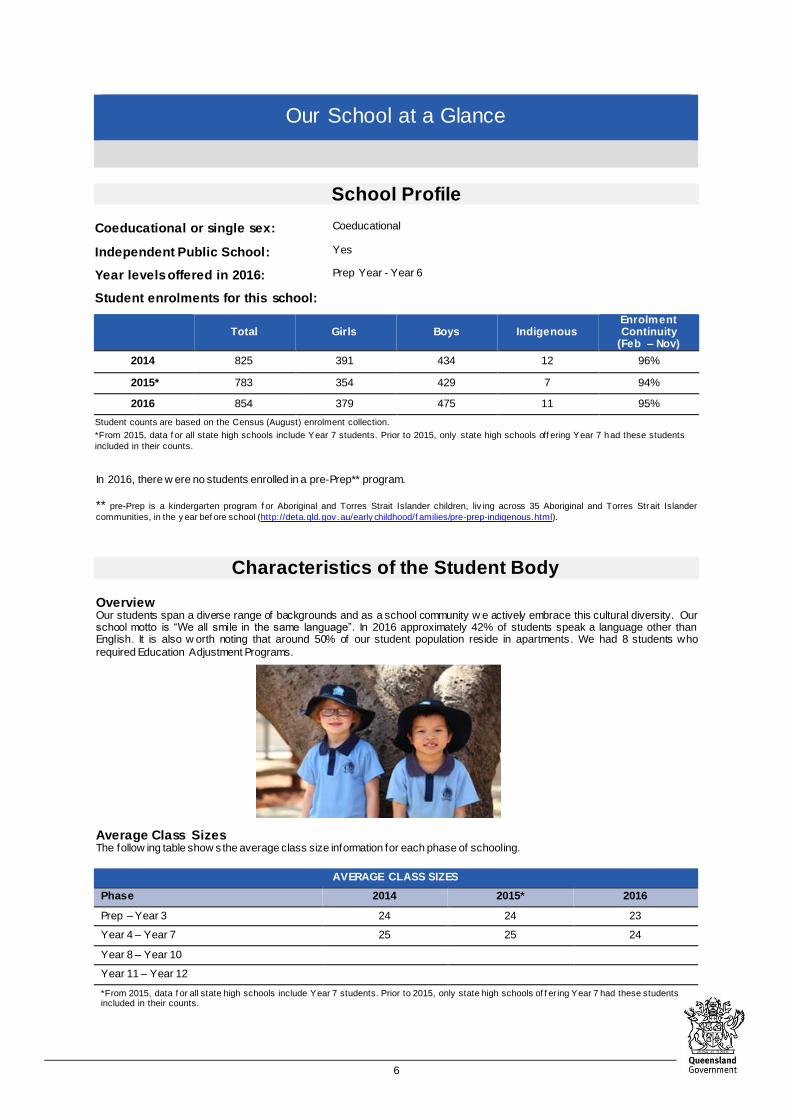
Characteristics of the Student Body
Overview Our students span a diverse range of backgrounds and as a school community w e actively embrace this cultural diversity. Our school motto is “We all smile in the same language”. In 2016 approximately 42% of students speak a language other than English. It is also w orth noting that around 50% of our student population reside in apartments. We had 8 students who
required Education Adjustment Programs.
Average Class Sizes The follow ing table show s the average class size information for each phase of schooling.
AVERAGE CLASS SIZES
Phase 2014 2015* 2016
Prep – Year 3 24 24 23
Year 4 – Year 7 25 25 24
Year 8 – Year 10
Year 11 – Year 12
*From 2015, data f or all state high schools include Year 7 students. Prior to 2015, only state high schools of f er ing Year 7 had these students included in their counts.

7
Curriculum Delivery
Our Approach to Curriculum Delivery Our w hole school curriculum plan (uploaded to the school w ebsite) is based upon ACARA - utilising C2C as a resource. It is a coherent sequenced plan ensuring consistent teaching, learning and
assessment practices with a clear reference for monitoring learning across year levels with decision making being guided by evidence.
In 2016 the school continued to implement The Feedback for
Learning (F4L), evidence based, action research project. This project is based on the w ork of William (2011) and Hattie (2008). It involves a coaching program for teachers focussing on planning for
effective feedback which closes the gap betw een where students are now in their learning and w here they need to be; alongside the development of improving teaching practices and facilitating pedagogical changes. It incorporates ways in w hich coaches can
build the capacity of teachers to improve student outcomes through coaching and the use of purposeful and timely feedback. When surveyed, teachers reported that this project has made a signif icant impact on the w ay they deliver the curriculum.
In addition to the core curriculum, West End State School offers the following diverse curriculum experiences:
Year 4 – 6 Languages offerings - French, Greek, Chinese,
Japanese, Spanish and Academic English Visual Art opportunities utilising our Art Studio and through the
inclusion of experiences w ith established artists using links w ith Queensland Art Gallery, Gallery of Modern Art, Brisbane Festival and our parent body
Inquiry Based Science using our specif ically built Science
Laboratory, staffed with a Laboratory Technician Large range of sporting opportunities – Inter and Intra school
Sport, cross country, athletics, swimming leading to District, Regional and State representation
Year 4 – 6 Camping Program – annual camps ranging from a 3
day social and emotional w ellbeing camp in Year 4, a w eek long
Leadership Camp in Year 5, to a w eek-long Civics and Citizenship trip to Canberra or South East Qld option, for our Year 6 students.
Co-curricular Activities Extra-Curricular Clubs Clubs have been accommodated in the playground duty roster and supported by teachers and teacher aides volunteering their
time to run programs during breaks. Garage Band
iMovie
Photography
Photoshop
STEAM Makerspace
Coding– Junior and Senior
Animation
Art
Environmental Club
Lunchtime Activities P-6 Games Central: Chess, Board Games, Jigsaw s, Construction
Library: Coding on the computers, Independent Research, Games,
Quiet Reading
Cultural Opportunities Greek Dancing Year 1--6 (ongoing involvement throughout the
entire year) Junior Choir Year 1-3
Senior Choir Year 4-6
Instrumental Music:
o Brass, Woodw ind, Percussion
o Strings o Junior Band Years 4-5 o Senior Band Years 5-6 o String Ensemble Years 2-6

8
Years 4 – 6 Friday Afternoon Sports Intra School Sports - all sports, gym, rock climbing, tennis
Inter School Sports - netball, rugby league, AFL, softball, basketball -
boys and girls, soccer – boys and girls, touch football - boys and girls
Academic Programs, Competitions, Extension UQ – STEM Project - Year 6
City Cluster Programs – City Cluster netw ork of 13 schools in the inner
city to provide additional programs for our high achievers from Year 3-6 in a range of programs across the school year
Mini scientists – Years 4 Mini w riters – Years 3 & 4 Mini thinkers – Years 4 High achievers - Years 5 & 6
WESS Science Fair – Years P-6
WESS Book Week Competition – Years P-6
ICAS Competitions (Digital Technologies, Science, Writing, Spelling, English,
Mathematics) – Years 2-6 Readers’ Cup Regional Interschool Competition – Year 6
Australian Business Community Netw ork (ABCN)
Spark Literacy – Year 2 Reading Mentoring Program w ith Fuji Xerox
GOMA and QAG – Trialling public programs before they are released
BSHS – Science and Maths Links
QLD Museum – World Science Festival Ambassador
QLD Academies Partnership School
Young Scholars Program
QPAC – QLD Opera
How Information and Communication Technologies are used to Assist Learning In 2016, the school has continued to explore the integration of digital technologies across the curriculum and including
differentiation practices to ensure academic rigour.
To support this integration, teachers utilise the tw o computer laboratories w hich support both Window s and Apple platforms. In addition w e have:
Ensured all classrooms have access to interactive whiteboards or projectors
Completed a stocktake of school devices to ensure they are all in w orking order
Purchased laptops & trolleys
Purchase, set up and deployed teacher iPads
Sourced reliable tech support
Developed an SSP ICT plan using the “8 Elements framew ork”
Developed a partnership w ith Apple and BSHS
Extra-curricular clubs also aim at building on students ICT skills in Garage Band, iMovie, Photography, Photoshop, STEAM Makerspace, Coding and Animation
Social Climate
Overview
West End State School prides itself on providing a safe and supportive environment for all students.
Our w hole school You Can Do It - Keys to Success program aims to foster the social and emotional development of children,
and assisting them to develop to their full potential Within a common theme of developing RESILIENCE, the program focuses on the f ive key foundations of CONFIDENCE, PERSISTENCE, ORGANISATION, GETTING ALONG and EMOTIONAL RESILIENCE. Class role models are recognised at school assemblies as well as through weekly ticket draws
w hich reinforce the current school focus area.
Student leadership is encouraged through the Student Council as well as voluntary leadership positions. In addition, Year 6 students are also rostered on as lunch time “Duty Rangers” to assist any students in need of a friendly link to the range of lunch time clubs, playground areas, training session and areas.

9
Parent, Student and Staff Satisfaction
Parent opinion survey
Performance measure
Percentage of parents/caregivers who agree# that: 2014 2015 2016
their child is getting a good education at school (S2016)
92% 92% 97%
this is a good school (S2035) 92% 94% 98%
their child likes being at this school* (S2001) 96% 98% 95%
their child feels safe at this school* (S2002) 98% 98% 98%
their child's learning needs are being met at this
school* (S2003) 88% 90% 91%
their child is making good progress at this school*
(S2004) 90% 91% 92%
teachers at this school expect their child to do his or her best* (S2005)
94% 99% 97%
teachers at this school provide their child w ith useful feedback about his or her school w ork* (S2006)
88% 91% 93%
teachers at this school motivate their child to learn* (S2007)
93% 92% 96%
teachers at this school treat students fairly* (S2008) 95% 88% 94%
they can talk to their child's teachers about their concerns* (S2009)
92% 95% 98%
this school w orks with them to support their child's learning* (S2010)
89% 87% 90%
this school takes parents' opinions seriously* (S2011) 81% 83% 91%
student behaviour is w ell managed at this school*
(S2012) 94% 92% 95%
this school looks for w ays to improve* (S2013) 94% 90% 98%
this school is w ell maintained* (S2014) 98% 96% 91%
Student opinion survey
Performance measure
Percentage of students who agree# that: 2014 2015 2016
they are getting a good education at school (S2048) 96% 94% 95%
they like being at their school* (S2036) 95% 97% 95%
they feel safe at their school* (S2037) 98% 93% 96%
their teachers motivate them to learn* (S2038) 99% 97% 95%
their teachers expect them to do their best* (S2039) 99% 99% 98%
their teachers provide them w ith useful feedback about their school w ork* (S2040)
97% 92% 94%
teachers treat students fairly at their school* (S2041) 92% 89% 86%
they can talk to their teachers about their concerns* (S2042)
86% 81% 83%
their school takes students' opinions seriously*
(S2043) 93% 88% 88%
student behaviour is w ell managed at their school* (S2044)
89% 87% 86%
their school looks for w ays to improve* (S2045) 97% 96% 96%
their school is w ell maintained* (S2046) 94% 93% 91%
their school gives them opportunities to do interesting
things* (S2047) 95% 92% 90%
Staff opinion survey

10
Performance measure
Percentage of school staff who agree# that: 2014 2015 2016
they enjoy w orking at their school (S2069) 100% 97% 97%
they feel that their school is a safe place in w hich to
w ork (S2070) 100% 97% 99%
they receive useful feedback about their w ork at their school (S2071)
95% 94% 95%
they feel confident embedding Aboriginal and Torres Strait Islander perspectives across the learning areas (S2114)
93% 90% 94%
students are encouraged to do their best at their school
(S2072) 100% 99% 97%
students are treated fairly at their school (S2073) 100% 99% 97%
student behaviour is w ell managed at their school (S2074)
100% 99% 96%
staff are well supported at their school (S2075) 98% 94% 96%
their school takes staff opinions seriously (S2076) 97% 95% 97%
their school looks for w ays to improve (S2077) 100% 97% 97%
their school is w ell maintained (S2078) 100% 96% 94%
their school gives them opportunities to do interesting
things (S2079) 98% 97% 97%
* Nationally agreed student and parent/caregiv er items # ‘Agree’ represents the percentage of respondents who Somewhat Agree, Agree or Strongly Agree with the statement.
DW = Data withheld to ensure conf identiality .
Parent and community engagement At West End State School, w e believe that fostering a partnership betw een parents/ carers and the school community is pivotal
to a successful education of our students. In 2016, WESS used the follow ing strategies to engage the parent and w ider community:
WESS School Council – school w ith strategic directional support
School Council’s Community Partnerships Officer – regular community communications to parents/carers, as well as
the broader West End business community to disseminate information on the activities and successes of West End
State School Active P&C:
o Meeting forums, fundraising and range of services – Outside School Hours Care, Tuckshop, Sw im Club, Uniform Shop, and Hall and Tennis Court Hire.
o P&C led events – Fiesta, movie nights, Mothers’ / Fathers’ / Carers’ Day stalls
o Fundraising and community grants to further improve the building and facilities to enhance the education of West End State School students.
Parent representation on school committees – Building, Grounds & Environment; Health, Safety & Wellbeing; Active
School Travel and Communication Working Groups. Parent information sessions
Parent-teacher interview s – tw ice per year
Classroom volunteers
Co-development of individual support plans for students with diverse learning needs
Respectful relationships programs The school has developed and implemented programs w hich focus on appropriate, respectful and healthy relationships.
These programs include:
Units based on the Australian curriculum classes which cover personal safety and strategies to keep themselves and
others safe
‘You Can Do It!” program w hich teaches students valuable relationship skills
Participation in aw areness raising events such as ‘Day for Daniel’ and ‘Say no to Bullying’ to help educate our
students about the importance of personal safety and respectful relationships
Mindfulness for staff, parents and students
Cyber Safety sessions for staff, parents and students

11
School Disciplinary Absences The follow ing table shows the count of incidents for students recommended for each type of school disciplinary absence
reported at the school.
SCHOOL DISCIPLINARY ABSENCES
Type 2014* 2015** 2016
Short Suspensions – 1 to 5 days 0 0 0
Long Suspensions – 6 to 20 days 0 0 0
Exclusions 0 0 0
Cancellations of Enrolment 0 0 0
* Caution should be used when comparing post 2013 SDA data as amendments to EGPA disciplinary prov isions and changes in methodology
created time series breaks in 2014 and 2015.
**From 2015, Exclusion represents principal decisions to exclude rather than recommendations f or exclusion. From 2015 where a principal
decided not to exclude, a small number of recommendations f or exclusions hav e been counted as a long suspension. Exclusions, Cancellations and Long & Charge Suspensions may be upheld or set aside through an appeals process .
Environmental Footprint
Reducing the school’s environmental footprint West End State School ‘s Building & Grounds Committee, consisting of staff, invited parents and an
elected P&C representative have continued to monitor utilities usage throughout 2016 to gauge and
capitalise on the effect of the school’s solar panels w hich have been ins talled for 5 years. They are
generating w ell above expectations.
In addition, the school continued to focus on reducing our environmental footprint through the
continued installation of LED fluorescent lights to replace standard f luorescent and reduction,
monitoring and use of timers on electrical goods including interactive projectors.
WESS continue to have an active Student Environment committee – made up of interested
students in years 4-6 w ho implement the w aste cycling program. Compost from this initiative is
used on the renew al of garden beds in our Indigenous gardens. Waste posters, developed by the
committee encourage composting and the school use of the w orm farms.
The school’s Active School Travel program encourages students and parents to travel to school by bike, scooter or foot. It is
w ell supported by the community as evidenced by the increasing need to purchase bike and scooter racks.
ENVIRONMENTAL FOOTPRINT INDICATORS
Years Electricity
kWh
Water
kL
2013-2014 238,795 1,875
2014-2015 236,207 2,127
2015-2016 246,176 2,496
The consumption data is compiled f rom sources including ERM, Ergon reports and utilities data entered into OneSchool by each school. The
data prov ides an indication of the consumption trend in each of the utility categories which impact on the school’s env ironmental f ootprint.
School Funding
School income broken down by funding source School income, reported by f inancial year accounting cycle using standardized national methodologies and broken down by funding source is available via the My School w ebsite at http://www.myschool.edu.au/.
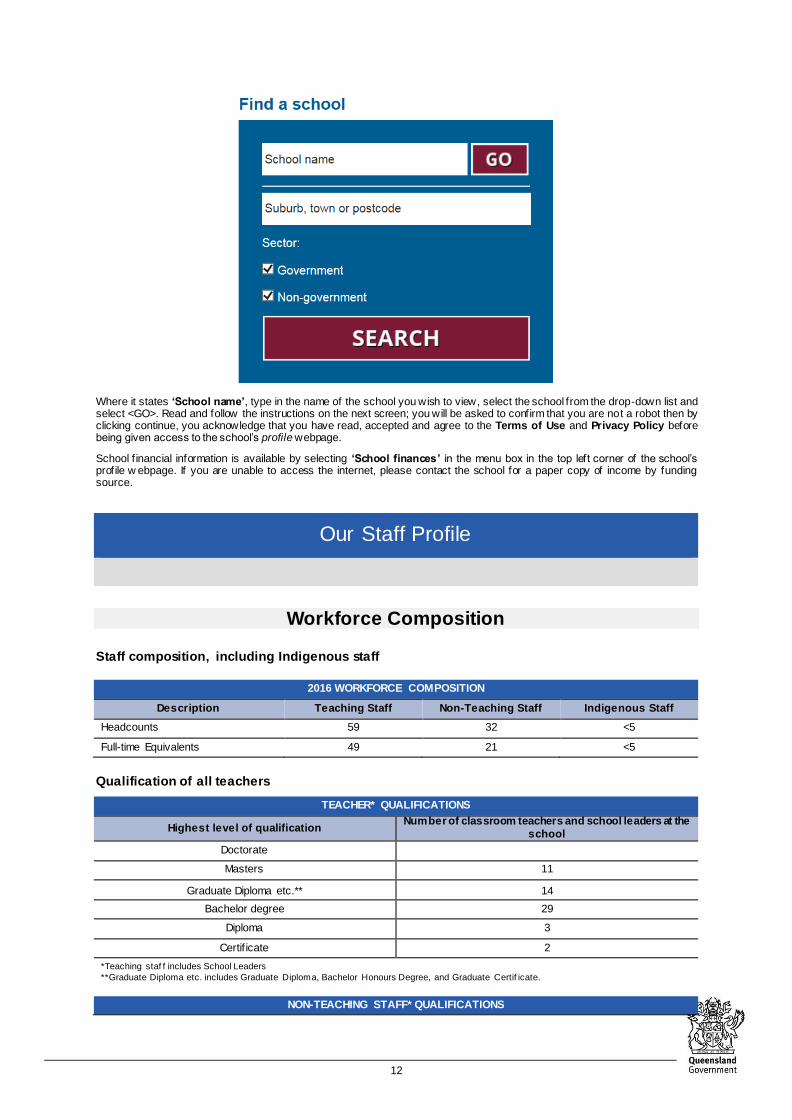
To access our income details, click on the My School link above. You w ill then be taken to the My School website w ith the follow ing ‘Find a school’ text box.
12
Where it states ‘School name’, type in the name of the school you wish to view, select the school from the drop-down list and select <GO>. Read and follow the instructions on the next screen; you will be asked to confirm that you are not a robot then by clicking continue, you acknowledge that you have read, accepted and agree to the Terms of Use and Privacy Policy before being given access to the school’s profile webpage.
School f inancial information is available by selecting ‘School finances’ in the menu box in the top left corner of the school’s profile w ebpage. If you are unable to access the internet, please contact the school for a paper copy of income by funding source.
Our Staff Profile
Workforce Composition
Staff composition, including Indigenous staff
2016 WORKFORCE COMPOSITION
Description Teaching Staff Non-Teaching Staff Indigenous Staff
Headcounts 59 32 <5
Full-time Equivalents 49 21 <5
Qualification of all teachers
TEACHER* QUALIFICATIONS
Highest level of qualification Number of classroom teachers and school leaders at the
school
Doctorate
Masters 11
Graduate Diploma etc.** 14
Bachelor degree 29
Diploma 3
Certif icate 2
*Teaching staf f includes School Leaders
**Graduate Diploma etc. includes Graduate Diploma, Bachelor Honours Degree, and Graduate Certif icate.
NON-TEACHING STAFF* QUALIFICATIONS

13
Highest level of qualification Number of classroom teachers and school leaders at the
school
Doctorate
Masters 2
Graduate Diploma etc.** 2
Bachelor degree 4
Diploma 4
Certif icate 11
*Non-Teaching staf f includes Teacher’s Aides, Ancillary and Auxiliary staf f
**Graduate Diploma etc. includes Graduate Diploma, Bachelor Honours Degree, and Graduate Certif icate.
Professional Development Expenditure On and Teacher Participation in Professional Development
The total funds expended on teacher professional development in 2016 w ere $93,505
The major professional development initiatives are as follow s:
Feedback for Differentiated Learning Project
Peer coaching and mentoring programs
Induction and probation program
Beginning teachers mentoring
Teacher Aide professional development
Annual Performance Review cycle
Collaborative planning sessions
Gifted Education Mentors
City Cluster external moderation
Professional development sessions including:
o ICT capabilities
o Digital technology
o Reading
o Maths
The proportion of the teaching staff involved in professional development activities during 2016 w as 100%.
Staff Attendance and Retention Staff attendance
AVERAGE STAFF ATTENDANCE (%)
Description 2014 2015 2016
Staff attendance for permanent and temporary staff and school leaders. 96% 96% 96%
Proportion of Staff Retained from the Previous School Year From the end of the previous school year, 94% of staff was retained by the school for the entire 2016.
Performance of Our Students

14
Key Student Outcomes
Student Attendance
Student attendance
The table below shows the attendance information for all students at this school:
STUDENT ATTENDANCE 2016
Description 2014 2015 2016
The overall attendance rate* for the students at this school (shown as a percentage). 95% 95% 95%
The attendance rate for Indigenous students at this school (shown as a percentage). 87% 88% 89%
*The student attendance rate is generated by div iding the total of f ull-day s and part-day s that students attended, and comparing this to the total
of all possible day s f or students to attend, expressed as a percentage.
The overall student attendance rate in 2016 for all Queensland Primary schools w as 93%.
AVERAGE STUDENT ATTENDANCE RATE* (%) FOR EACH YEAR LEVEL
Year
Level Prep
Year
1
Year
2
Year
3
Year
4
Year
5
Year
6
Year
7
Year
8
Year
9
Year
10
Year
11
Year
12
2014 95% 95% 96% 95% 95% 95% 96% 96%
2015 95% 93% 94% 96% 95% 95% 94%
2016 95% 96% 95% 95% 96% 95% 95% DW
*Attendance rates ef f ectively count attendance f or ev ery student f or ev ery day of attendance in Semester 1. The student attendance rate is generated by div iding the total of f ull-day s and part-day s that students attended, and comparing this to the total of all possible day s f or students
to attend, expressed as a percentage.
DW = Data withheld to ensure conf identiality .
Student Attendance Distribution The proportions of students by attendance range:
5
8
6
8
8
7
24
25
21
63
59
66
0% 20% 40% 60% 80% 100%
2016
2015
2014
Proportion of Students
Attendance Rate: 0% to <85% 85% to <90% 90% to <95% 95% to 100%
Description of how non-attendance is managed by the school Non-attendance is managed in state schools in line w ith the DET procedures, Managing Student Absences and Enforcing Enrolment and Attendance at State Schools and Roll Marking in State Schools, which outline processes for managing and recording student attendance and absenteeism.

15
The school operates an electronic roll marking system. Rolls are marked at both the beginning of the day and at the beginning of the f inal session of the day.
The school day starts off icially at 8.45am and any child arriving after this time w ill to be marked as ABSENT.
All late students to report to the off ice where the off ice staff override the “absent” entry made at 8.45am by the classroom teacher. They will replace it w ith a LATE entry showing time of arrival. Students then proceed to their classrooms and report to the class teachers and show their late slip printout.
Parents needing to take their children out of the school grounds, pick up leave forms at the off ice before proceeding to their children’s classroom for collection. The teachers monitor their rolls for trends and unexplained absences and contact the parents to reinforce the school/home partnership.
An answering machine is available 24 hours a day for messages advising of student absences. Parents are also able to
email advising of their child’s absences to admin@w estendss.eq.edu.au.
This information is clearly outlined in eth Parent Handbook, w hich is available in the school w ebsite.
In the case where no explanation is received concerning a child's absence from school, the off icial school roll w ill show an unexplained absence. However, a letter is generated periodically, giving parents the opportunity to explain these absences.
Classroom teachers and members of the school’s leadership team also follow up on any absences of which they become concerned.
All absences are recorded on a student’s semester report card.
A large number of absences at West End State School are due to parents taking their children for overseas visits. Whilst this is discouraged, it is a challenge due to the fact that many students are going back to visit their home countries or family. All absences due to holiday/family visits over 10 days are processed via the DET’s Exemption Process.
NAPLAN
Our reading, writing, spelling, grammar and punctuation, and numeracy results for the Years 3, 5, 7 and 9 are available via the My School w ebsite at http://www.myschool.edu.au/.
To access our NAPLAN results, click on the My School link above. You w ill then be taken to the My School website with the
follow ing ‘Find a school’ text box.
Where it states ‘School name’, type in the name of the school you wish to view, select the school from the drop-down list and select <GO>. Read and follow the instructions on the next screen; you will be asked to confirm that you are not a robot then by clicking continue, you acknowledge that you have read, accepted and agree to the Terms of Use and Privacy Policy before
being given access to the school’s profile webpage.
School NAPLAN information is available by selecting ‘NAPLAN’ in the menu box in the top left corner of the school’s profile webpage. If you are unable to access the internet, please contact the school for a paper copy of our school’s NAPLAN results.